Embed Size (px)
Citation preview
Chapter 4 Determination and Characterization of Polymer Blend Host
52
CHAPTER 4
DETERMINATION AND CHARACTERIZATION OF POLYMER BLEND
HOST
4.1 Introduction
The amorphousness of a polymer host is a crucial factor for ionic conduction
since ions are preferably mobile in the amorphous region (Agrawal, Sahu, Mahipal, &
Ashrafi, 2013; Gadjourova, Andreev, Tunstall, & Bruce, 2001; Johan & Ting, 2011).
For a polymer blend, the crystallinity and amorphousness of the blend are affected by
the ratio of the polymer components (Kadir et al., 2010; Kadir, Teo, Majid, & Arof,
2009; Shibayama, Uenoyama, Oura, Nomura, & Iwamoto, 1995). This is because the
presence of an amorphous component affects the crystallization process of the other
polymer component (Pereira, Paulino, Rubira, & Muniz, 2010). Report by Sasaki, Bala,
Yoshida, and Ito (1995) shows that the increasing PMMA concentration causes the rate
of PVdF crystallization to decrease. Kadir et al. (2009) reported that the crystallinity of
PEO decreases as chitosan content increases to 60 wt.% in the chitosan-PEO blend.
Ramly et al. (2011) reported that starch-PEO blend with a ratio of 7:3 exhibits the least
amount of crystallinity and was chosen in the preparation of polymer electrolyte.
Studies on the structure of starch-chitosan blend revealed that starch and
chitosan are miscible to each other (Bourtoom & Chinnan, 2008). Liu, Adhikari, Guo,
and Adhikari (2013) reported that the addition of chitosan to starch decreases the
crystallinity of the starch film. Report by Xu et al. (2005) showed that the crystalline
Chapter 4 Determination and Characterization of Polymer Blend Host
53
peaks of chitosan were suppressed when the starch ratio in the blend film was increased.
Based on information obtained from the literature, it is important to determine the
appropriate amount of starch and chitosan to serve as the polymer host.
4.2 XRD Analysis
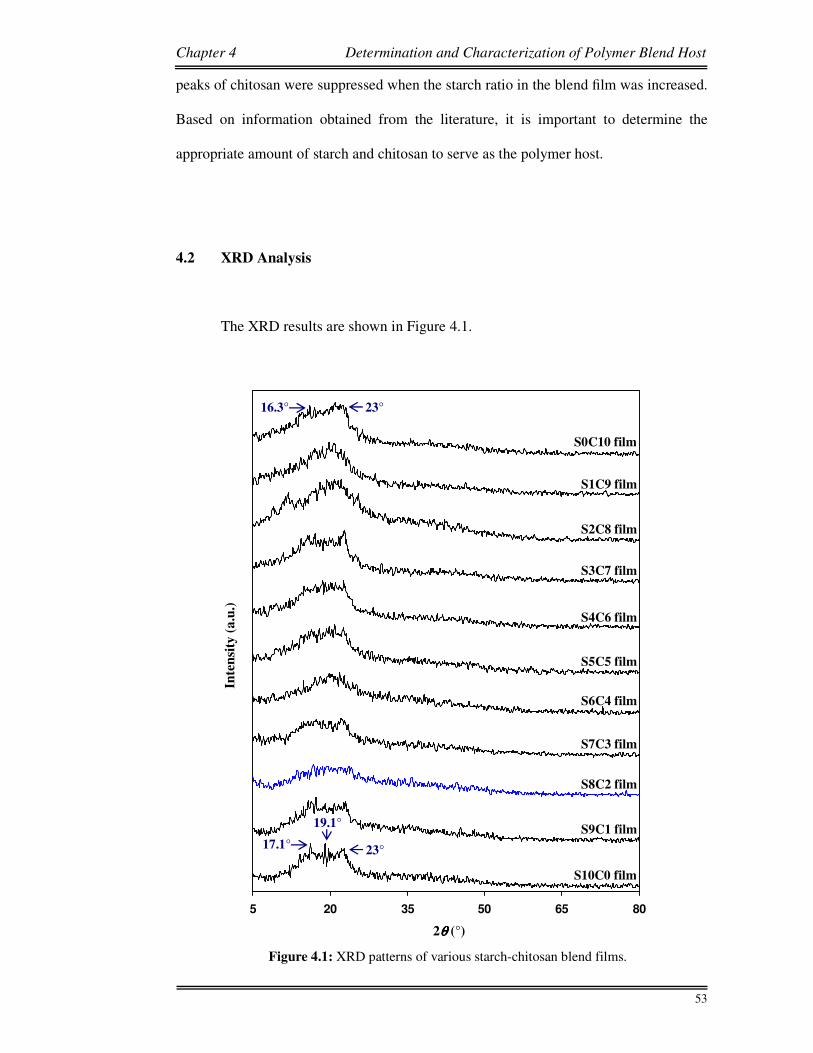
The XRD results are shown in Figure 4.1.
Figure 4.1: XRD patterns of various starch-chitosan blend films.
2θθθθ (°)
Inte
nsi
ty (
a.u
.)
5 20 35 50 65 80
S10C0 film
S0C10 film
S2C8 film
S4C6 film
S6C4 film
S8C2 film
S9C1 film
S7C3 film
S5C5 film
S3C7 film
S1C9 film
23° 16.3°
17.1° 23°
19.1°
Chapter 4 Determination and Characterization of Polymer Blend Host
54
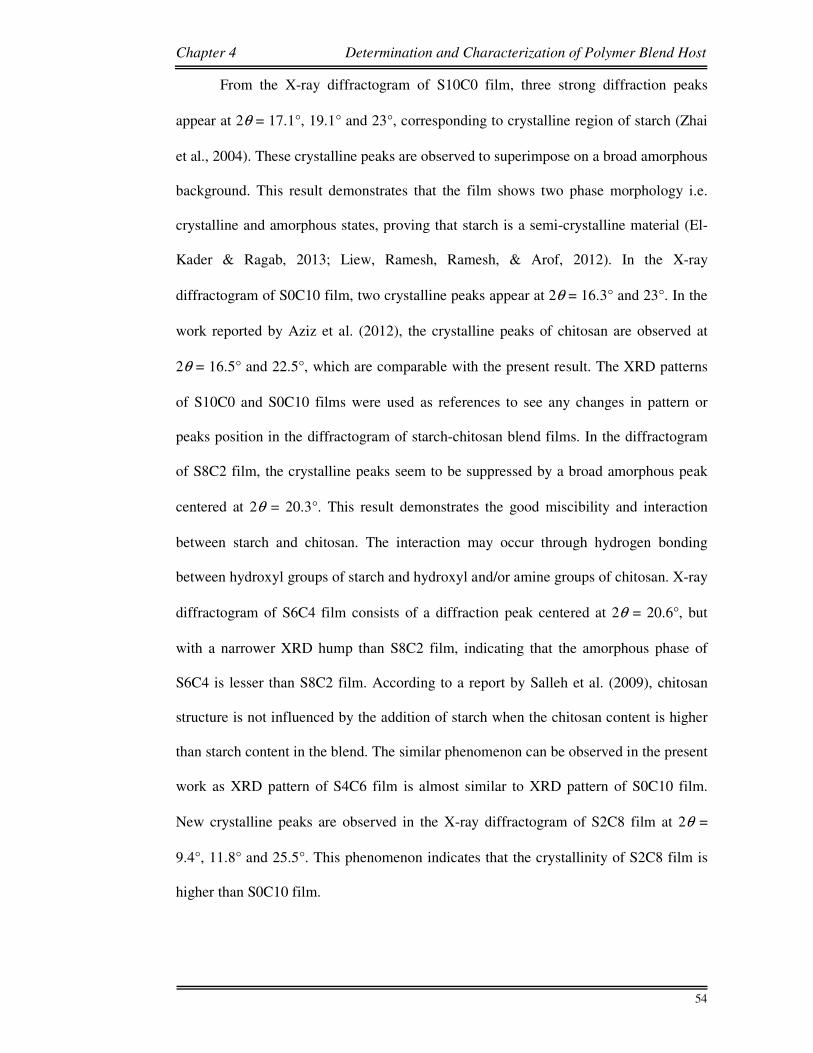
From the X-ray diffractogram of S10C0 film, three strong diffraction peaks
appear at 2θ = 17.1°, 19.1° and 23°, corresponding to crystalline region of starch (Zhai
et al., 2004). These crystalline peaks are observed to superimpose on a broad amorphous
background. This result demonstrates that the film shows two phase morphology i.e.
crystalline and amorphous states, proving that starch is a semi-crystalline material (El-
Kader & Ragab, 2013; Liew, Ramesh, Ramesh, & Arof, 2012). In the X-ray
diffractogram of S0C10 film, two crystalline peaks appear at 2θ = 16.3° and 23°. In the
work reported by Aziz et al. (2012), the crystalline peaks of chitosan are observed at
2θ = 16.5° and 22.5°, which are comparable with the present result. The XRD patterns
of S10C0 and S0C10 films were used as references to see any changes in pattern or
peaks position in the diffractogram of starch-chitosan blend films. In the diffractogram
of S8C2 film, the crystalline peaks seem to be suppressed by a broad amorphous peak
centered at 2θ = 20.3°. This result demonstrates the good miscibility and interaction
between starch and chitosan. The interaction may occur through hydrogen bonding
between hydroxyl groups of starch and hydroxyl and/or amine groups of chitosan. X-ray
diffractogram of S6C4 film consists of a diffraction peak centered at 2θ = 20.6°, but
with a narrower XRD hump than S8C2 film, indicating that the amorphous phase of
S6C4 is lesser than S8C2 film. According to a report by Salleh et al. (2009), chitosan
structure is not influenced by the addition of starch when the chitosan content is higher
than starch content in the blend. The similar phenomenon can be observed in the present
work as XRD pattern of S4C6 film is almost similar to XRD pattern of S0C10 film.
New crystalline peaks are observed in the X-ray diffractogram of S2C8 film at 2θ =
9.4°, 11.8° and 25.5°. This phenomenon indicates that the crystallinity of S2C8 film is
higher than S0C10 film.
Chapter 4 Determination and Characterization of Polymer Blend Host
55
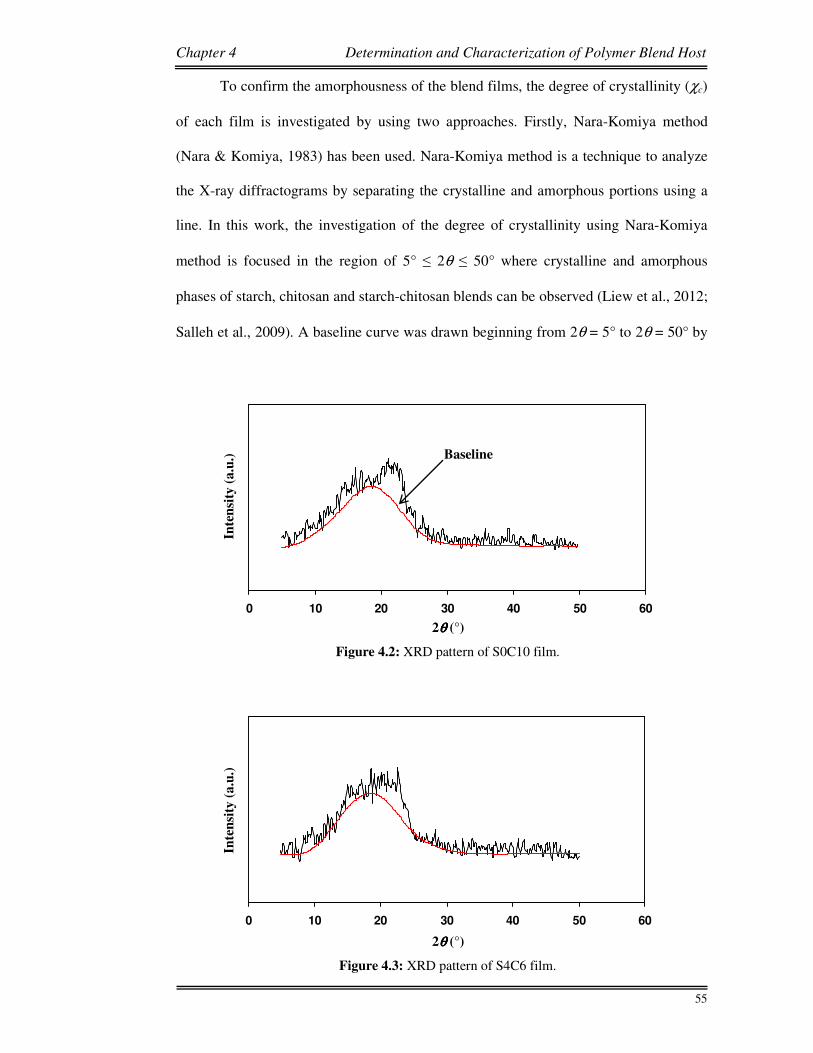
To confirm the amorphousness of the blend films, the degree of crystallinity (χc)
of each film is investigated by using two approaches. Firstly, Nara-Komiya method
(Nara & Komiya, 1983) has been used. Nara-Komiya method is a technique to analyze
the X-ray diffractograms by separating the crystalline and amorphous portions using a
line. In this work, the investigation of the degree of crystallinity using Nara-Komiya
method is focused in the region of 5° ≤ 2θ ≤ 50° where crystalline and amorphous
phases of starch, chitosan and starch-chitosan blends can be observed (Liew et al., 2012;
Salleh et al., 2009). A baseline curve was drawn beginning from 2θ = 5° to 2θ = 50° by
.
Figure 4.2: XRD pattern of S0C10 film.
2θθθθ (°)
Inte
nsi
ty (
a.u
.)
0 10 20 30 40 50 60
Baseline
Figure 4.3: XRD pattern of S4C6 film.
0 10 20 30 40 50 60
2θθθθ (°)
Inte
nsi
ty (
a.u
.)
Chapter 4 Determination and Characterization of Polymer Blend Host
56
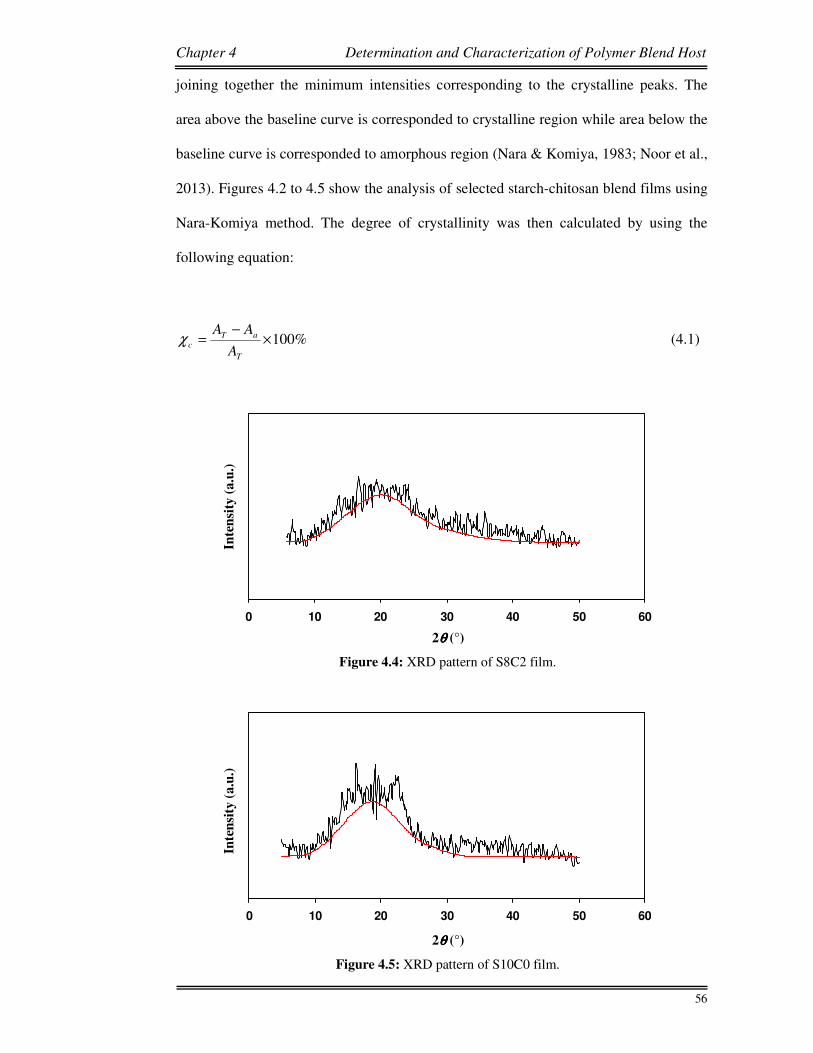
joining together the minimum intensities corresponding to the crystalline peaks. The
area above the baseline curve is corresponded to crystalline region while area below the
baseline curve is corresponded to amorphous region (Nara & Komiya, 1983; Noor et al.,
2013). Figures 4.2 to 4.5 show the analysis of selected starch-chitosan blend films using
Nara-Komiya method. The degree of crystallinity was then calculated by using the
following equation:
%100×−
=T
aT
cA
AAχ (4.1)
Figure 4.4: XRD pattern of S8C2 film.
0 10 20 30 40 50 60
2θθθθ (°)
Inte
nsi
ty (
a.u
.)
Figure 4.5: XRD pattern of S10C0 film.
0 10 20 30 40 50 60
2θθθθ (°)
Inte
nsi
ty (
a.u
.)
Chapter 4 Determination and Characterization of Polymer Blend Host
57
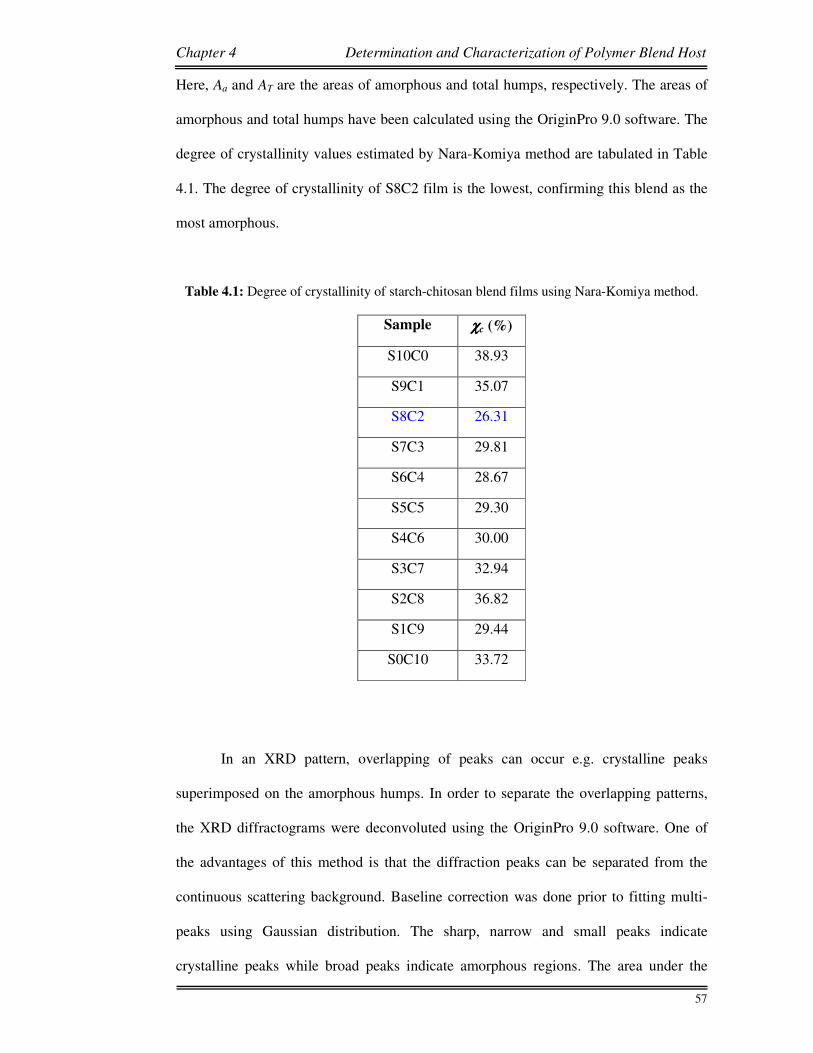
Here, Aa and AT are the areas of amorphous and total humps, respectively. The areas of
amorphous and total humps have been calculated using the OriginPro 9.0 software. The
degree of crystallinity values estimated by Nara-Komiya method are tabulated in Table
4.1. The degree of crystallinity of S8C2 film is the lowest, confirming this blend as the
most amorphous.
Table 4.1: Degree of crystallinity of starch-chitosan blend films using Nara-Komiya method.
Sample χχχχc (%)
S10C0 38.93
S9C1 35.07
S8C2 26.31
S7C3 29.81
S6C4 28.67
S5C5 29.30
S4C6 30.00
S3C7 32.94
S2C8 36.82
S1C9 29.44
S0C10 33.72
In an XRD pattern, overlapping of peaks can occur e.g. crystalline peaks
superimposed on the amorphous humps. In order to separate the overlapping patterns,
the XRD diffractograms were deconvoluted using the OriginPro 9.0 software. One of
the advantages of this method is that the diffraction peaks can be separated from the
continuous scattering background. Baseline correction was done prior to fitting multi-
peaks using Gaussian distribution. The sharp, narrow and small peaks indicate
crystalline peaks while broad peaks indicate amorphous regions. The area under the
Chapter 4 Determination and Characterization of Polymer Blend Host
58
deconvoluted peaks was used to calculate the degree of crystallinity using Equation
(4.1).
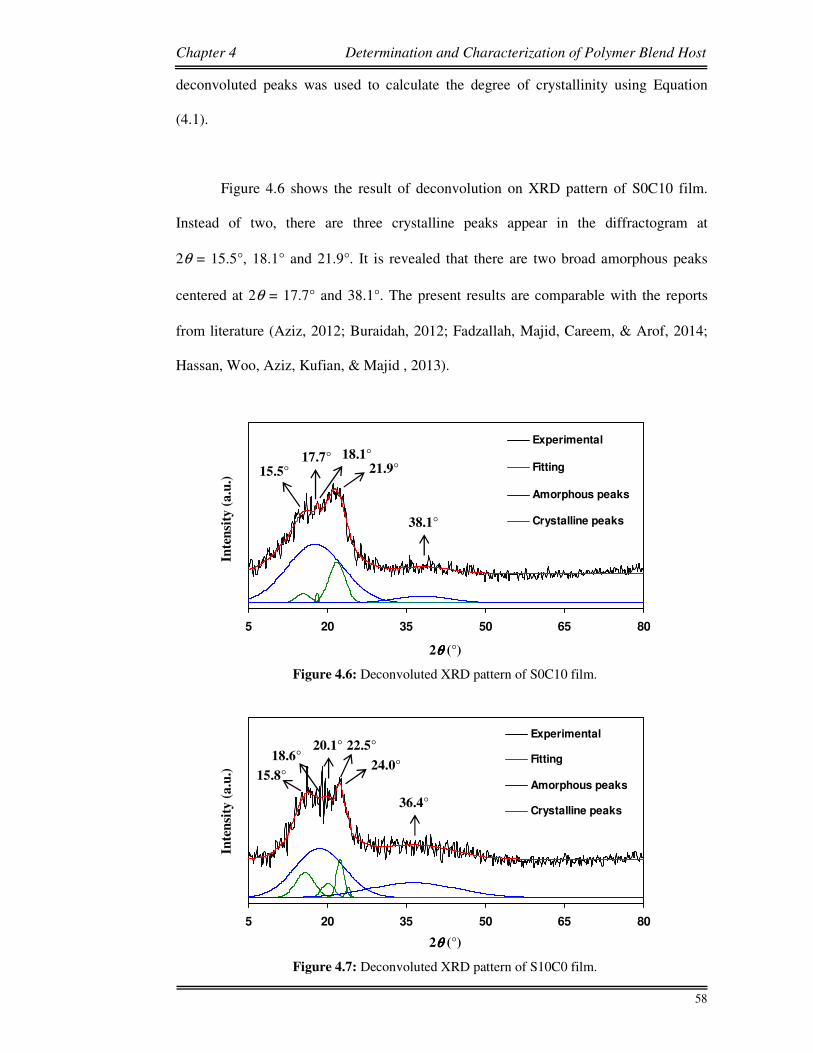
Figure 4.6 shows the result of deconvolution on XRD pattern of S0C10 film.
Instead of two, there are three crystalline peaks appear in the diffractogram at
2θ = 15.5°, 18.1° and 21.9°. It is revealed that there are two broad amorphous peaks
centered at 2θ = 17.7° and 38.1°. The present results are comparable with the reports
from literature (Aziz, 2012; Buraidah, 2012; Fadzallah, Majid, Careem, & Arof, 2014;
Hassan, Woo, Aziz, Kufian, & Majid , 2013).
Figure 4.7: Deconvoluted XRD pattern of S10C0 film.
2θθθθ (°)
Inte
nsi
ty (
a.u
.)
5 20 35 50 65 80
Experimental
Fitting
Amorphous peaks
Crystalline peaks36.4°
15.8° 24.0°
22.5° 20.1° 18.6°
Figure 4.6: Deconvoluted XRD pattern of S0C10 film.
2θθθθ (°)
Inte
nsi
ty (
a.u
.)
5 20 35 50 65 80
Experimental
Fitting
Amorphous peaks
Crystalline peaks
17.7° 18.1° 21.9°
38.1°
15.5°
Chapter 4 Determination and Characterization of Polymer Blend Host
59
The result of deconvolution on XRD pattern of S10C0 film is represented in
Figure 4.7. It can be observed that the diffractogram consists of four crystalline peaks at
2θ = 15.8°, 20.1°, 22.5° and 24.0° and two broad amorphous peaks centered at
2θ = 18.6° and 36.4°.
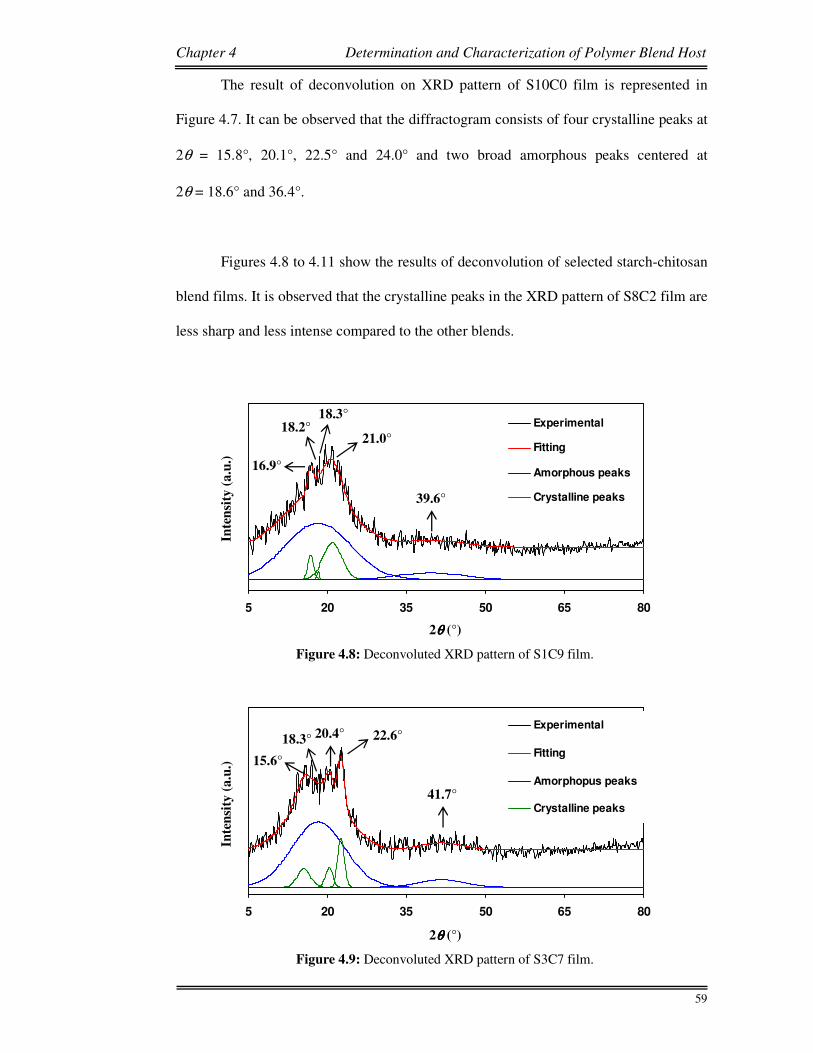
Figures 4.8 to 4.11 show the results of deconvolution of selected starch-chitosan
blend films. It is observed that the crystalline peaks in the XRD pattern of S8C2 film are
less sharp and less intense compared to the other blends.
Figure 4.8: Deconvoluted XRD pattern of S1C9 film.
5 20 35 50 65 80
Experimental
Fitting
Amorphous peaks
Crystalline peaks
2θθθθ (°)
Inte
nsi
ty (
a.u
.)
16.9°
18.2° 18.3°
21.0°
39.6°
Figure 4.9: Deconvoluted XRD pattern of S3C7 film.
5 20 35 50 65 80
Experimental
Fitting
Amorphopus peaks
Crystalline peaks
2θθθθ (°)
Inte
nsi
ty (
a.u
.)
41.7°
22.6° 20.4° 18.3°
15.6°
Chapter 4 Determination and Characterization of Polymer Blend Host
60
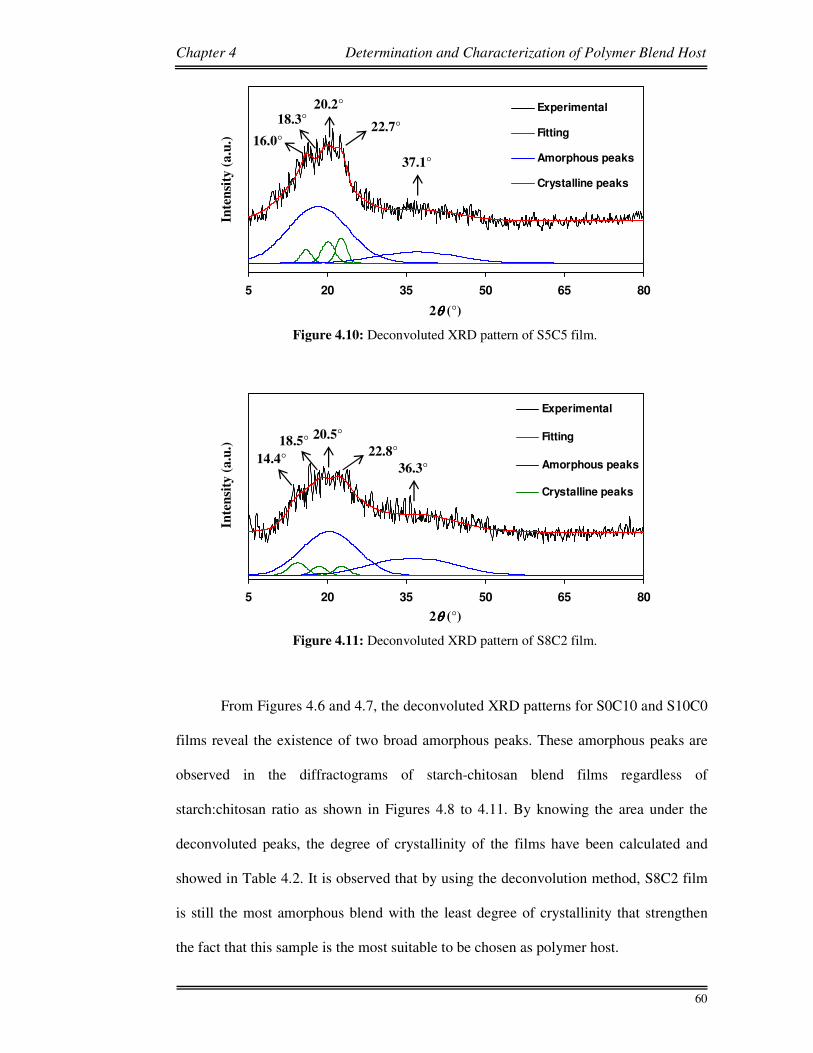
From Figures 4.6 and 4.7, the deconvoluted XRD patterns for S0C10 and S10C0
films reveal the existence of two broad amorphous peaks. These amorphous peaks are
observed in the diffractograms of starch-chitosan blend films regardless of
starch:chitosan ratio as shown in Figures 4.8 to 4.11. By knowing the area under the
deconvoluted peaks, the degree of crystallinity of the films have been calculated and
showed in Table 4.2. It is observed that by using the deconvolution method, S8C2 film
is still the most amorphous blend with the least degree of crystallinity that strengthen
the fact that this sample is the most suitable to be chosen as polymer host.
Figure 4.10: Deconvoluted XRD pattern of S5C5 film.
2θθθθ (°)
Inte
nsi
ty (
a.u
.)
5 20 35 50 65 80
Experimental
Fitting
Amorphous peaks
Crystalline peaks
16.0°
37.1°
22.7°
20.2° 18.3°
Figure 4.11: Deconvoluted XRD pattern of S8C2 film.
2θθθθ (°)
Inte
nsi
ty (
a.u
.)
5 20 35 50 65 80
Experimental
Fitting
Amorphous peaks
Crystalline peaks
36.3° 14.4°
18.5° 20.5°
22.8°
Chapter 4 Determination and Characterization of Polymer Blend Host
61
Table 4.2: Degree of crystallinity of starch-chitosan blend films using deconvolution method.
Sample χχχχc (%)
S10C0 20.53
S9C1 18.66
S8C2 12.05
S7C3 16.04
S6C4 13.13
S5C5 13.66
S4C6 15.35
S3C7 15.42
S2C8 18.68
S1C9 17.12
S0C10 18.09
4.3 Miscibility Studies
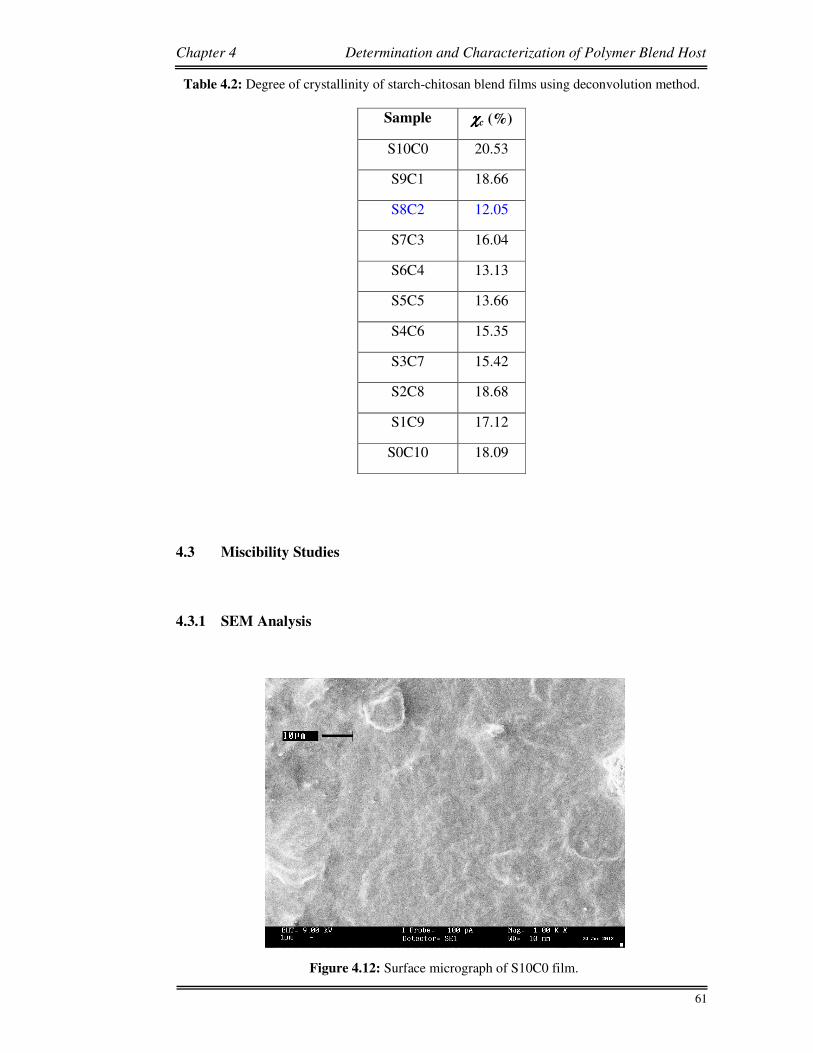
4.3.1 SEM Analysis
Figure 4.12: Surface micrograph of S10C0 film.
Chapter 4 Determination and Characterization of Polymer Blend Host
62
SEM analysis is one of the techniques to study the miscibility between the
components in a polymer blend. The miscibility can be implied from the smooth and
homogenous surface of the blend film (Kadir, 2010). The surface micrograph of S10C0
film is shown in Figure 4.12. It is observed that the micrograph of S10C0 film exhibits
characteristic patterns on the surface. These patterns represent the withered ghost
granules of starch (Salleh et al., 2009). These ghosts were formed during the
gelatinization process where the external layers of starch granules form granule
envelopes which degrade into ghost remnants (Atkin, Abeysekera, & Robards, 1998).
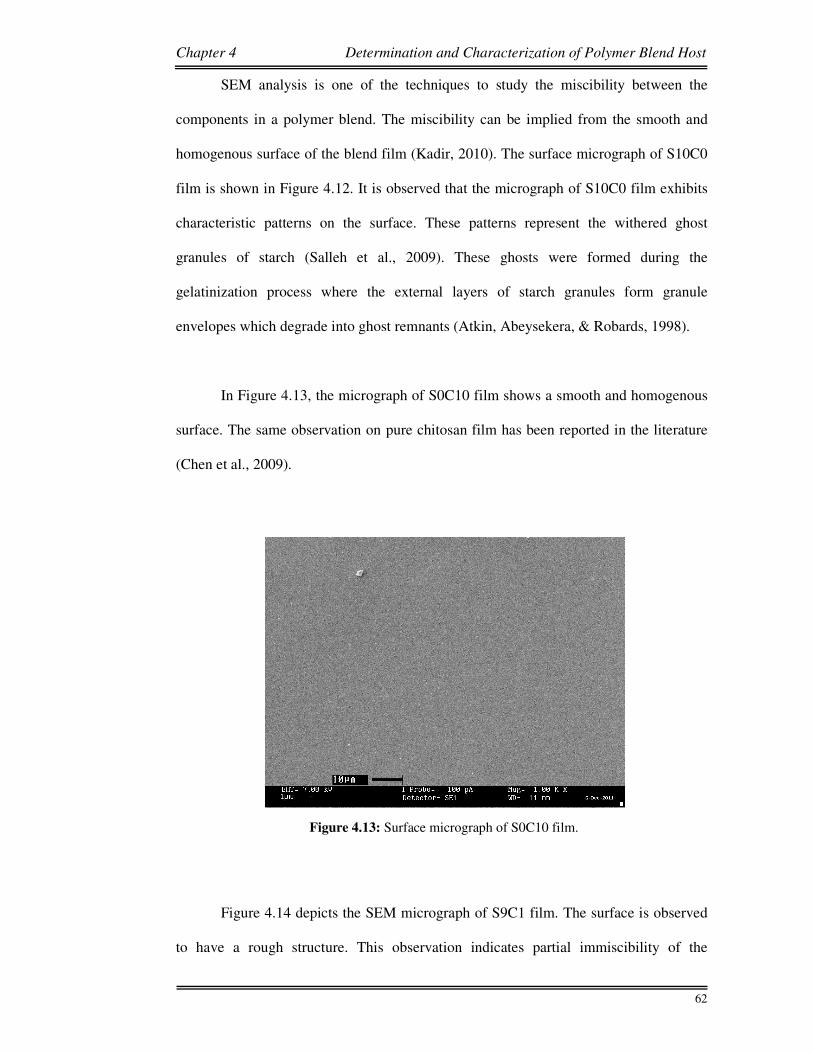
In Figure 4.13, the micrograph of S0C10 film shows a smooth and homogenous
surface. The same observation on pure chitosan film has been reported in the literature
(Chen et al., 2009).
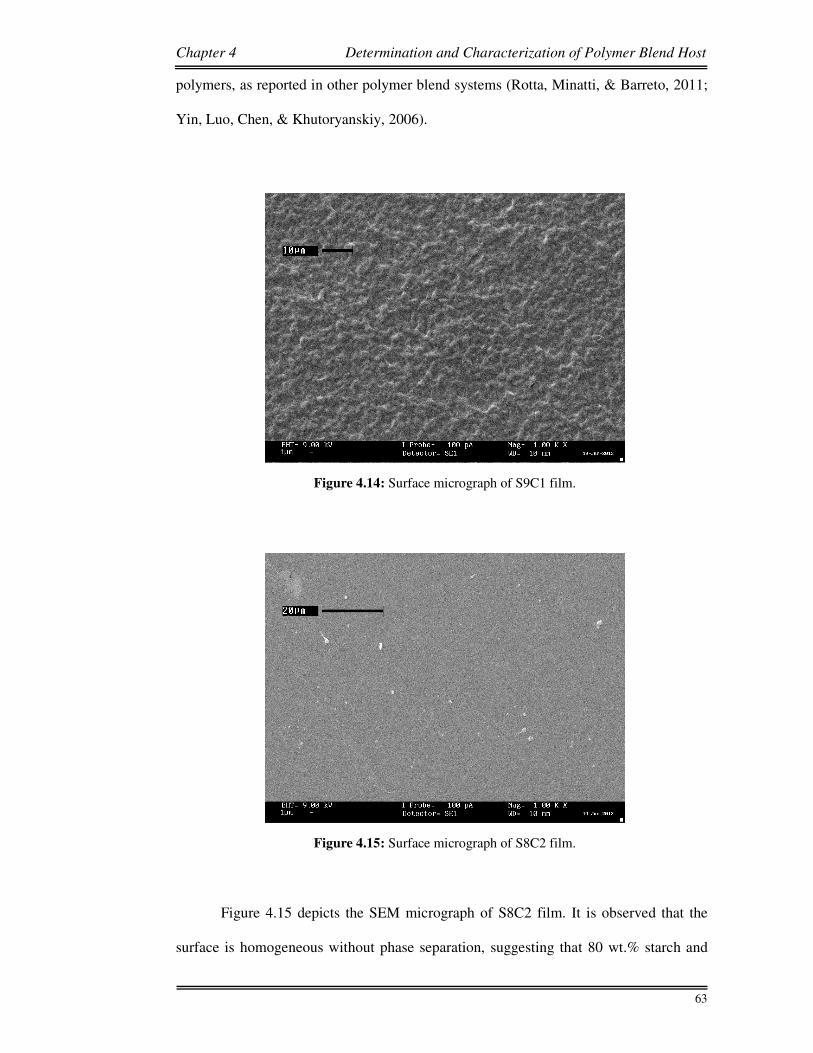
Figure 4.14 depicts the SEM micrograph of S9C1 film. The surface is observed
to have a rough structure. This observation indicates partial immiscibility of the
Figure 4.13: Surface micrograph of S0C10 film.
Chapter 4 Determination and Characterization of Polymer Blend Host
63
polymers, as reported in other polymer blend systems (Rotta, Minatti, & Barreto, 2011;
Yin, Luo, Chen, & Khutoryanskiy, 2006).
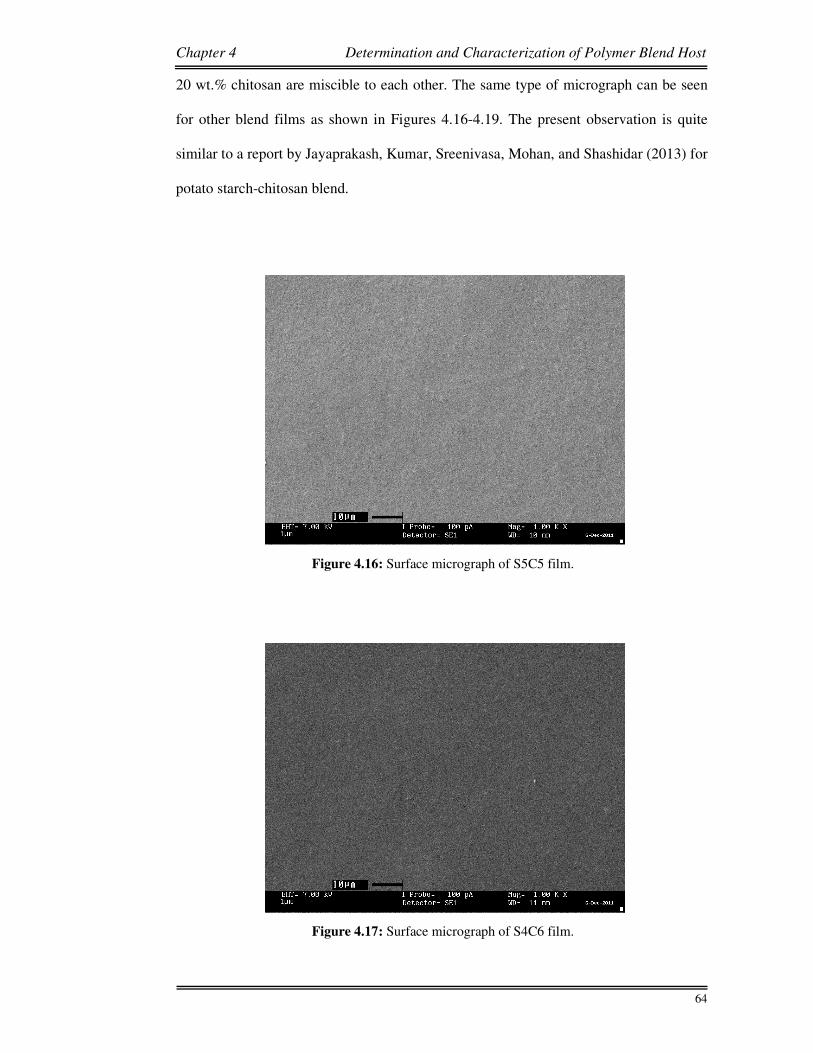
Figure 4.15 depicts the SEM micrograph of S8C2 film. It is observed that the
surface is homogeneous without phase separation, suggesting that 80 wt.% starch and
Figure 4.14: Surface micrograph of S9C1 film.
Figure 4.15: Surface micrograph of S8C2 film.
Chapter 4 Determination and Characterization of Polymer Blend Host
64
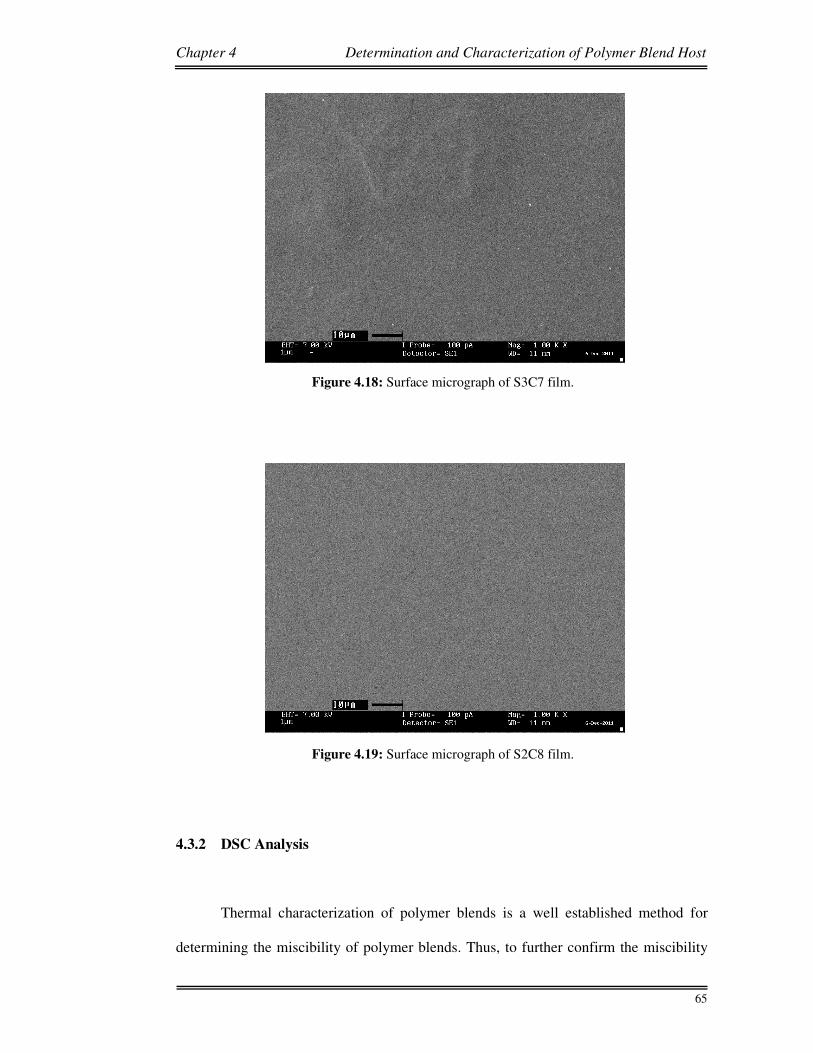
20 wt.% chitosan are miscible to each other. The same type of micrograph can be seen
for other blend films as shown in Figures 4.16-4.19. The present observation is quite
similar to a report by Jayaprakash, Kumar, Sreenivasa, Mohan, and Shashidar (2013) for
potato starch-chitosan blend.
Figure 4.17: Surface micrograph of S4C6 film.
Figure 4.16: Surface micrograph of S5C5 film.
Chapter 4 Determination and Characterization of Polymer Blend Host
65
4.3.2 DSC Analysis
Thermal characterization of polymer blends is a well established method for
determining the miscibility of polymer blends. Thus, to further confirm the miscibility
Figure 4.18: Surface micrograph of S3C7 film.
Figure 4.19: Surface micrograph of S2C8 film.
Chapter 4 Determination and Characterization of Polymer Blend Host
66
between starch and chitosan in S8C2 film, DSC measurements on S10C0, S0C10 and
S8C2 films were carried out. In DSC technique, if the blend shows two transitions, it
means that there is phase separation and the polymer components are immiscible to
each other (Chiou et al., 2014; Kok, Demirelli, & Aydogdu, 2008). If the polymer
components are miscible to each other, only one transition will be observed (Chiou et
al., 2014).
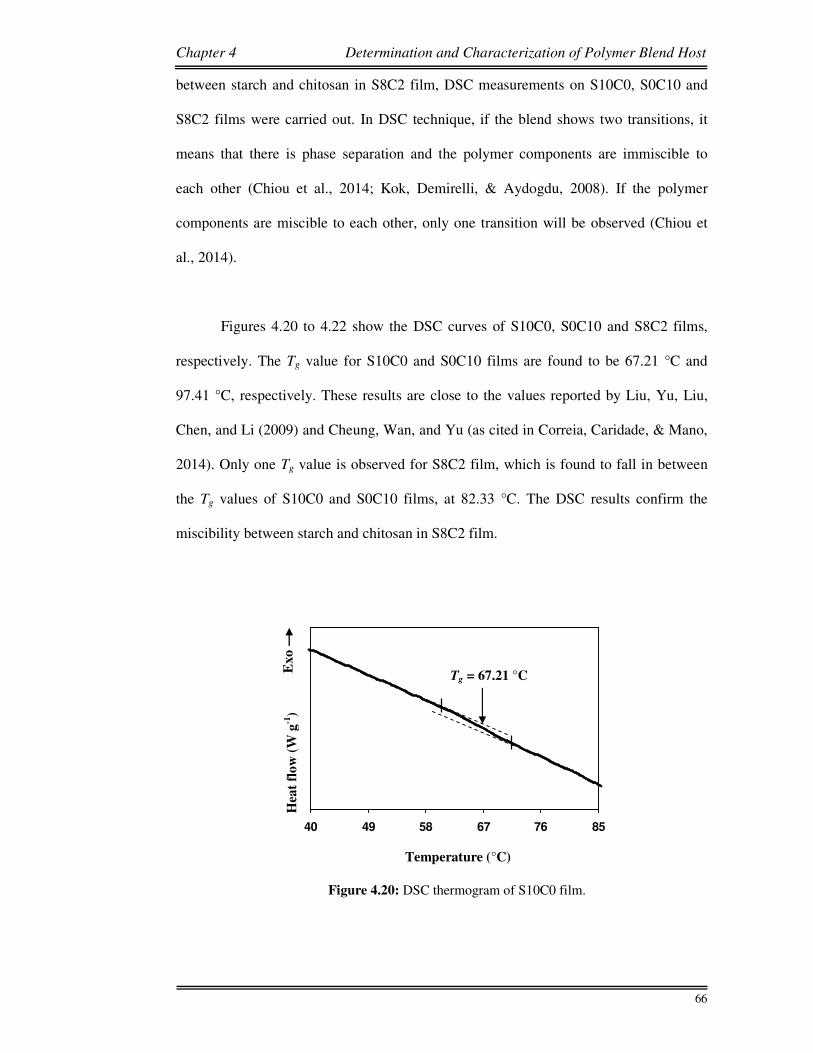
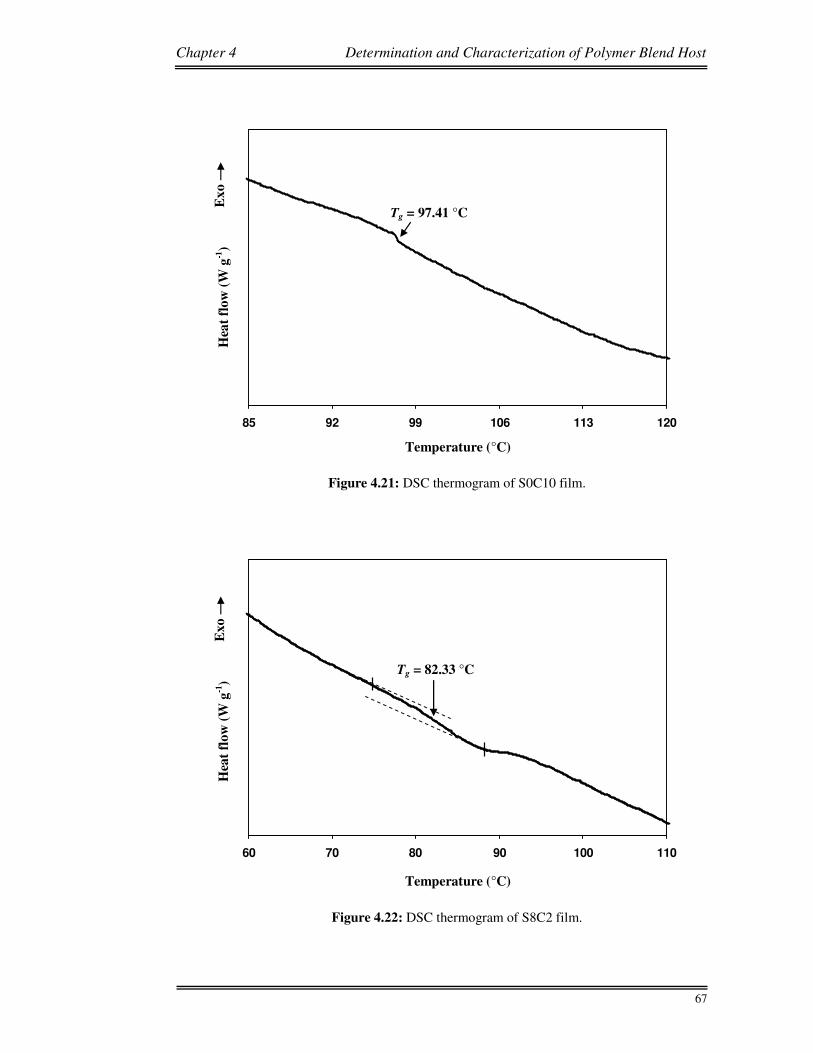
Figures 4.20 to 4.22 show the DSC curves of S10C0, S0C10 and S8C2 films,
respectively. The Tg value for S10C0 and S0C10 films are found to be 67.21 °C and
97.41 °C, respectively. These results are close to the values reported by Liu, Yu, Liu,
Chen, and Li (2009) and Cheung, Wan, and Yu (as cited in Correia, Caridade, & Mano,
2014). Only one Tg value is observed for S8C2 film, which is found to fall in between
the Tg values of S10C0 and S0C10 films, at 82.33 °C. The DSC results confirm the
miscibility between starch and chitosan in S8C2 film.
Temperature (°C)
Hea
t fl
ow
(W
g-1
)
Exo
40 49 58 67 76 85
Tg = 67.21 °C
Figure 4.20: DSC thermogram of S10C0 film.
Chapter 4 Determination and Characterization of Polymer Blend Host
67
85 92 99 106 113 120
Tg = 97.41 °C
Temperature (°C)
Hea
t fl
ow
(W
g-1
)
Ex
o
Figure 4.21: DSC thermogram of S0C10 film.
Figure 4.22: DSC thermogram of S8C2 film.
Temperature (°C)
Hea
t fl
ow
(W
g-1
)
Exo
60 70 80 90 100 110
Tg = 82.33 °C
Chapter 4 Determination and Characterization of Polymer Blend Host
68
4.4 TGA Analysis
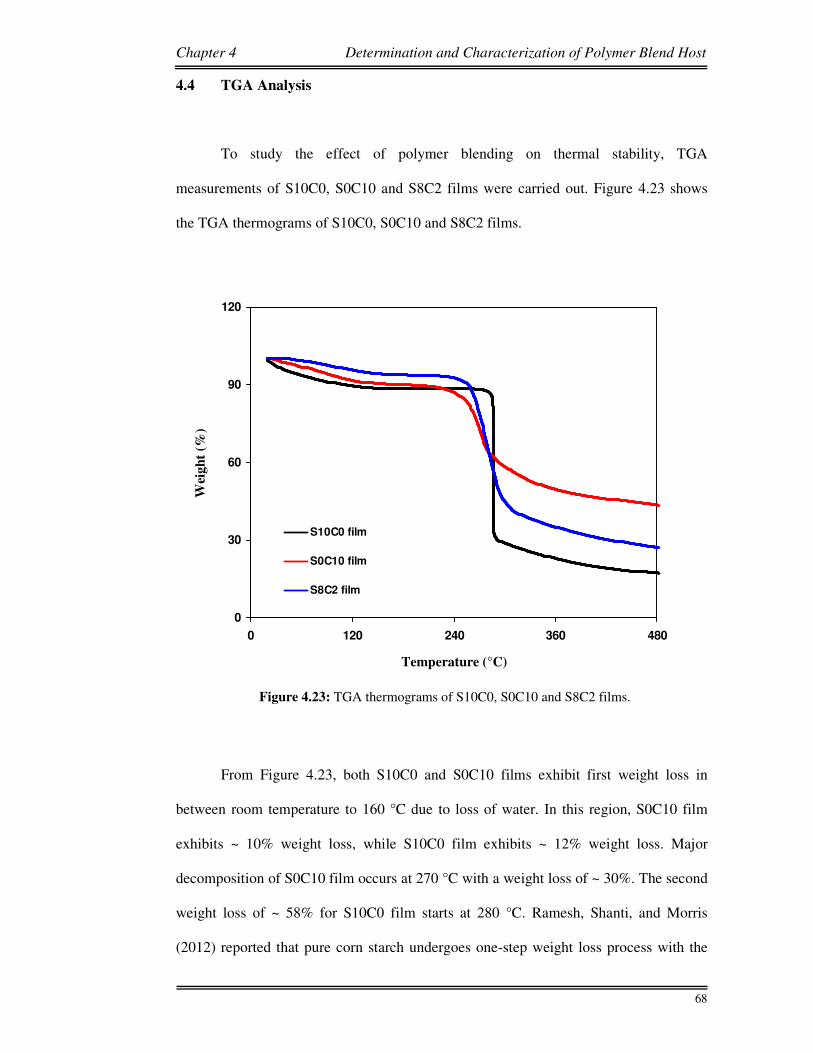
To study the effect of polymer blending on thermal stability, TGA
measurements of S10C0, S0C10 and S8C2 films were carried out. Figure 4.23 shows
the TGA thermograms of S10C0, S0C10 and S8C2 films.
From Figure 4.23, both S10C0 and S0C10 films exhibit first weight loss in
between room temperature to 160 °C due to loss of water. In this region, S0C10 film
exhibits ~ 10% weight loss, while S10C0 film exhibits ~ 12% weight loss. Major
decomposition of S0C10 film occurs at 270 °C with a weight loss of ~ 30%. The second
weight loss of ~ 58% for S10C0 film starts at 280 °C. Ramesh, Shanti, and Morris
(2012) reported that pure corn starch undergoes one-step weight loss process with the
0
30
60
90
120
0 120 240 360 480
S10C0 film
S0C10 film
S8C2 film
Temperature (°C)
Wei
gh
t (%
)
Figure 4.23: TGA thermograms of S10C0, S0C10 and S8C2 films.
Chapter 4 Determination and Characterization of Polymer Blend Host
69
decomposition temperature of 280 °C, which is similar as the present result. The
glucose monomers that initially built up the corn starch tend to detach from the long
polymer chain and subsequent heating beyond the decomposition temperature results in
carbonization and ash formation (Ramesh et al., 2012). Since pure starch has high
moisture sensitivity, blending starch with other polymers is one of the methods to
overcome the problem (Lu et al., 2009). From the thermogram of S8C2 film, a weight
loss of ~ 6% from room temperature to 160 °C is observed. This result shows that the
water content of starch is decreased by blending starch with chitosan. The
decomposition temperature does not change on blending starch with chitosan, as S8C2
film decomposes at 270 °C.
4.5 Summary
The suitable ratio of starch-chitosan blend to serve as polymer host has been
examined using XRD analysis where the blend of 80 wt.% starch and 20 wt.% chitosan
is the most amorphous blend. SEM analysis confirmed that starch and chitosan is
miscible to one another by forming homogenous films. Further confirmation of starch-
chitosan miscibility has been made to the blend of 80 wt.% starch and 20 wt.% chitosan
by DSC. Blending 80 wt.% starch with 20 wt.% chitosan has decreased the water
content of the film as shown in TGA thermograms. Thus, the blend of 80 wt.% starch
and 20 wt.% chitosan has been chosen as the polymer host for further characterization.