Embed Size (px)
Citation preview

6
Crystallization of dense binary ionic mixtures. Application to white dwarf cooling theory. R. MOCHKOVITCH
Instttui d'Astrophysique de Paris, 75014 Ports, France
L. SEGRETAIN Laboratoire de Physique. Ecole Normale Superieure de Lyon, 69364 Lyon Cedex 07. France
Abstract
This paper is organized in two parts. First, phase diagrams for dense binary mixtures are computed with the density functional theory (DFT). The method of calculation is reviewed and the different approximations which are used are clearly stated. The DFT is then applied to several mixtures of astrophysical interest. A comparison is made between several existing phase diagrams and the origin of some discrepancies among them is discussed. In a second part , the consequences of these phase diagrams on the cooling of white dwarfs are presented in a pedagogical way starting from the simple Mestel theory. The importance of the partial separation of carbon and oxygen at crystallisation is emphasized and the possible effect of minor species such as 2 2Ne or Fe is also considered. The separation of carbon and oxygen adds 1 - 2 Gyr to age of the galactic disk estimated from the white dwarf luminosity function while the delay resulting from the presence of minor species is probably negligible when the chemical evolution of the Galaxy is properly taken into account.
Cet article est organise en deux parties. Tout d'abord, les diagrammes de phase des melanges binaires denses sont calcules a l'aide de la theorie de la fonctionnelle de densite. La methode de calcul est detaillee et les differentes approximations utilisees sont clairement expliquees. Le theorie est ensuite appliquee a plusieurs melanges d'interet astrophysique. Une comparaison est faite entre plusieurs diagrammes de phase publies et l'origine de certains
126
https://www.cambridge.org/core/terms. https://doi.org/10.1017/S0252921100026348Downloaded from https://www.cambridge.org/core. IP address: 65.21.228.167, on 28 Nov 2021 at 14:43:28, subject to the Cambridge Core terms of use, available at

Mochkovitch & Segretain: Crystallization of dense binary ionic mixtures 127
disaccords entre eux est discutee. Dans la seconde partie, les consequences de ces diagrammes de phase sur le refroidissement des naines blanches sont presentees de maniere pedagogique avec pour point de depart la theorie de Mestel. L'importance de la separation partielle du carbone et de l'oxygene durant la cristallisation est soulignee et l'effet possible des especes mineures, comme le 2 2Ne et le fer, est aussi considere. La separation du carbone et de l'oxygene ajoute 1 a 2 milliards d'annees a l'age du disque galactique obtenu a partir de la fonction de luminosite des naines blanches alors que le delai du a la presence des especes mineures est probablement negligeable quand revolution chimique de la Galaxie est convenablement prise en compte.
6.1 Calculat ion of the phase diagrams
6.1.1 Introduction
The importance of Coulomb interactions in white dwarf interiors has been recognized long ago (Kirshnitz 1960; Abrikosov 1960; Salpeter 1961), and was shown to lead eventually to crystallization of the core of the star (Van Horn 1968; Lamb and Van Horn 1975). The importance of the alloying behavior of dense Coulomb lattices to astrophysics was first pointed out by Dyson (1971), and the importance of the crystallization diagram of C/O mixtures on the evolution of white dwarfs was first considered by Stevenson (1980). In order to study the crystallization of the white dwarf core, we consider this one as a multi-component plasma, an extension of the one component plasma model (OCP) (Brush, Sahlin, Teller 1966; Hansen 1973). The OCP is characterized universally by the dimensionless parameter T = Z5^e2/kTae = Z 5 / 3 T e where Z is the charge of the ion and ae = (3/(47rne))1^3 is the electronic sphere radius with n e the number density of electrons. The present critical value of the paramater T at crystallization is Tc « 172 - 180 (Ogata, Ichimaru 1987; Strinfellow et al. 1990; Dubin 1990; Farouki and Hamaguchi 1993) and the release of the latent heat is about ksT/particle. However, besides carbon and oxygen, minor elements like neon and iron are present in the core of white dwarfs and the crystallization of this mixture is more difficult to study than for the one component system. In the next section we examine the different methods used to build a phase diagram and we present all existing results.
6.1.2 Methods of calculation
The determination of a phase diagram for a multi-component plasma requires the determination of the free energy in the liquid (FL) and the solid
https://www.cambridge.org/core/terms. https://doi.org/10.1017/S0252921100026348Downloaded from https://www.cambridge.org/core. IP address: 65.21.228.167, on 28 Nov 2021 at 14:43:28, subject to the Cambridge Core terms of use, available at

128 Mochkovitch & Segretain: Crystallization of dense binary ionic mixtures
= >
1.5
1.4
1.3
^ 1.2
1.1
N
: p=cst p - 1 -
i . i
A.
. i . . T
1 0.8 0.6 0.4 0.2 0 * Z . X L X S
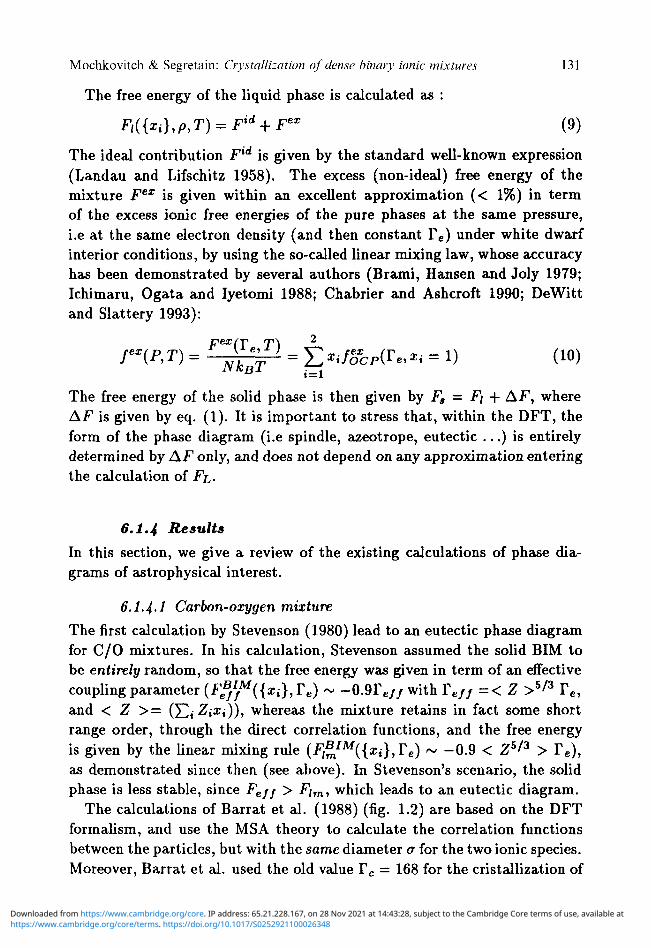
Fig. 6.1 Construction of phase diagram
(Fs) phase, as shown in fig. 1.1. We compute free energies in the two phases at a given temperature for all concentrations and we determine the equilibrium concentrations in the solid (xs) and in the liquid (XL) .phase with a double-tangent method. We iterate this process for several temperatures to build the phase diagram.
Two methods can be used to compute Ft and Fa. The first one is the Monte-Carlo simulation. The advantage of this method is to be an "exact" calculation since the energy is calculated directly from the canonical average of the interaction , but a reliable result requires a large number of particles since the accuracy of the method is proportional to 1/iNT. This requirement becomes really restricting for a mixture when the concentration of one of the species is small ; in this case the total number of particle becomes prohibitive, and the simulation requires a tremendously large computation time.
The second method is based on the density fonctional theory of freezing, and is described below.
6.1.3 The density functional theory of freezing
The density functional theory (DFT) is based on the theorem (Honenberg and Kohn 1964) that any thermodynamic function can be written as a functional of the density. It has been applied to phase diagrams for the first time by Ramakrishnan and Yussouf (1979) for the crystallization of a hard
https://www.cambridge.org/core/terms. https://doi.org/10.1017/S0252921100026348Downloaded from https://www.cambridge.org/core. IP address: 65.21.228.167, on 28 Nov 2021 at 14:43:28, subject to the Cambridge Core terms of use, available at

Mochkovitch & Segretain: Crystallization of dense binary ionic mixtures 129
sphere system. Since then, the DFT has been used for different short range repulsive potentials (V(r) ex r~n , n — oo,12,6,4) (Barrat 1987) and was shown to be in good agreement with the simulations.
Within the framework of the DFT, we can calculate directly A F = Fa — Fi by considering the solid near melting as a non-uniform liquid and by calculating the related correlation functions from the Taylor expansion around the liquid correlation functions. In order to calculate AF, several approximations are necessary.
i) The first one is the truncation of the Taylor expansion at a given order, usually the second order. That yields, for the OCP, t o :
AF = AFid + AFex (1)
with
NkT Jv PL l PL* y '
and
A pex -i /
$5r=~5:c«SW<V (3) G
i
YIQ represents the sum over all non zero reciproqual lattive vectors (RLV), C(G) denotes the Fourier transform of the direct correlation function (DCF) of the liquid and the one-particule density in the solid is written as :
p(r) = pL(l + $ > ( < ? ) exp(idf)) (4) G
However a problem appears for Coulomb systems if the Taylor expansion is truncated at the second order. In this case, Rovere and Tosi (1985) showed that the solid phase is never stable, its energy being overestimated because of the missing compensating negative contribution of the higher order terms. Two solutions can be used to solve this problem. The first one is to include higher orders terms (third order or more). This is tremendously complicated and has been done only for the OCP (Barrat 1987; Iyetomi and Ichimaru 1988; Likos and Aschroft 1992). Then a second, more phenomeno-logical, approach is used. The effect of higher order terms is equivalent to a reduction of the contribution of the second RLV (i.e. the term C^ p2~ ) (Likos and Aschroft 1992). Then the solution is to reduce arbitrarily this contribution in such a way that the crystallization of the OCP is recovered
https://www.cambridge.org/core/terms. https://doi.org/10.1017/S0252921100026348Downloaded from https://www.cambridge.org/core. IP address: 65.21.228.167, on 28 Nov 2021 at 14:43:28, subject to the Cambridge Core terms of use, available at

130 Mochkovitch & Segretain: Crystallization of dense binary ionic mixtures
for Tc = 178 (Barrat et al. 1988; Ichimaru et al. 1988; Segretain and Chabrier 1993).
ii) The second approximation concerns the description of the solid phase, namely the choice of a description of the solid density fluctuation (i.e. pg), of a crystal lattice (i.e. {G}), and of a type of alloy (for a BIM). For the description of the solid density fluctuation, a gaussian approximation is usually adopted (i.e pg — exp(—G2/a)). The accuracy of such an approximation has been assessed in all situations studied so far (Tarazona 1984; Baus and Colot 1985; Baus 1987; Barrat et al. 1987,1988; DeWitt et al. 1993). With respect to the choice of the crystal lattice, the BCC (body centered cubic) lattice has been shown to be the most stable configuration for the OCP (Stringfellow et al. 1990). Finally the type of alloy can be either ordered (like a CsCl crystal) or random, i.e. each species occupies a node of the lattice with a probability equals to xv so that :
pv{f) = x„(a„/7r)3/2 ] T e x p ( - a „ ( r - Rj)2) (5)
Although an ordered crystal is more stable at T = 0, a random alloy is favored at finite temperature because of the entropic contribution (Segretain and Chabrier 1993; Ogata et al. 1993).
iii) The third and last approximation concerns the calculation of the correlation functions (Cg). Two N-body theories are used. The first one is the so-called mean spherical approximation (MSA) (Hansen and MacDonald 1976) which reads (for one component) :
f g(r) = 0, r < a \ c(r) = -pV(r), r>a K)
where V(r) is the potential, c(r) the direct correlation function and g(r) the pair distribution function. The great advantage of the MSA is that it can be solved analytically for a multi-component plasma (Parrinello and Tosi 1979).
The second theory is the so-called (Improved) Hypernetted Chain approximation ((I)HNC) (Hansen and MacDonald 1976) where :
g(r) = exp(-/?Vr(r) + h(r) - c{r) + B(r)) (7)
The HNC solution corresponds to B(r) = 0 in eq. (7), where B(r) is the so-called bridge function, representing the elementary diagrams.
These two approximations form a closed system of equations with the Ornstein-Zernicke relation :
h(r) = g(r) - 1 = c(r) + p f c(\r- P\)h(r')dP (8)
https://www.cambridge.org/core/terms. https://doi.org/10.1017/S0252921100026348Downloaded from https://www.cambridge.org/core. IP address: 65.21.228.167, on 28 Nov 2021 at 14:43:28, subject to the Cambridge Core terms of use, available at
Mochkovitch & Segretain: Crystallization of dense binary ionic mixtures 131
The free energy of the liquid phase is calculated as :
F,({xi},p,T) = Fid + Fex: (9)
The ideal contribution Ftd is given by the standard well-known expression (Landau and Lifschitz 1958). The excess (non-ideal) free energy of the mixture Fex is given within an excellent approximation (< 1%) in term of the excess ionic free energies of the pure phases at the same pressure, i.e at the same electron density (and then constant Te) under white dwarf interior conditions, by using the so-called linear mixing law, whose accuracy has been demonstrated by several authors (Brami, Hansen and Joly 1979; Ichimaru, Ogata and Iyetomi 1988; Chabrier and Ashcroft 1990; DeWitt and Slattery 1993):
fex(P,T) = N\£ > = E^/ocp(re,^ = i) (io)
The free energy of the solid phase is then given by Fa = Fi + AF, where A F is given by eq. (1). It is important to stress that, within the DFT, the form of the phase diagram (i.e spindle, azeotrope, eutectic . . . ) is entirely determined by AF only, and does not depend on any approximation entering the calculation of FL-
6.1.4 Results
In this section, we give a review of the existing calculations of phase diagrams of astrophysical interest.
6.1.4-1 Carbon-oxygen mixture
The first calculation by Stevenson (1980) lead to an eutectic phase diagram for C/O mixtures. In his calculation, Stevenson assumed the solid BIM to be entirely random, so that the free energy was given in term of an effective coupling parameter ( F e ^ M ( { x J , r e ) 0 .9 r e / / with Teff = < Z > 5 / 3 Te, and < Z > = (Y^i^ixi))i whereas the mixture retains in fact some short range order, through the direct correlation functions, and the free energy is given by the linear mixing rule (Fl^i
IM({xi},Te) 0.9 < Z 5 / 3 > Te), as demonstrated since then (see above). In Stevenson's scenario, the solid phase is less stable, since Feff > -F/m, which leads to an eutectic diagram.
The calculations of Barrat et al. (1988) (fig. 1.2) are based on the DFT formalism, and use the MSA theory to calculate the correlation functions between the particles, but with the same diameter a for the two ionic species. Moreover, Barrat et al. used the old value Tc = 168 for the cristallization of
https://www.cambridge.org/core/terms. https://doi.org/10.1017/S0252921100026348Downloaded from https://www.cambridge.org/core. IP address: 65.21.228.167, on 28 Nov 2021 at 14:43:28, subject to the Cambridge Core terms of use, available at

132 Mochkovitch & Segretain: Crystallization of dense binary ionic mixtures
1.8
1 . 6 -N
^ 1.4
1.2
1
_ _.--" m.
— . - " * • * - " * . * " -̂*̂
-" * -" ^*\s.
< ^ ' X '
-•• ^ ^ y ^ ^ / ~ • ' ' . - - " " y ^ ' ^ > ^ '
- --•• ^""^ <S^ ' - - ' - ' - ' " ^ ^ ^ t ^ ^ '
• — y **•
~— ^ ^ ^ . . — •
- a» _ =s —
1 0.8 0.6 x^ 0.4 0.2
' ..;.-'-
•^?-V .
.
-
-~ "
0
Fig. 6.2 Phase diagram for C/O mixture. Full line: Segretain and Chabrier; dotted line : Barrat et al.; dashed line : Ichimaru et al. . Note that for the diagram of Barrat et al. Te = 168 instead of Tc = 178 for the other two.
the pure phase. The diagram is found to be of a spindle form (dotted line). More recently, Segretain and Chabrier (1993) extended these calculations by considering different diameters for the two ionic species and by using Tc = 180 for the crystallization value for the OCR The diagram (full line) confirms essentially the results of Barrat et al.
The calculations of Ichimaru et al. (fig. 1.2) are also based on the DFT, but the correlation functions are calculated within the framework of the IHNC. They find an azeotropic diagram with an azeotropic point characterized by xc = 0.16, with xc the concentration of carbon.
As long as they are used for astrophysical applications, it is interesting to note that these diagrams are very similar, and lead essentially to the same results.
6.1.4-2 Arbitrary ionic mixtures
Recently, Segretain and Chabrier (1993) (fig. 1.2 and 1.3) extended the former calculations to examine the evolution of the crystallization diagram of arbitrary ionic mixtures, as a function of the charge ratio. The calculations were performed within the framework of the DFT, and the correlation functions were calculated within the MSA theory, with different diameters for the two ionic species. The width of the gaussian, au, in the ion distribution function of the solid (eq. (5)), was found to agree perfectly (< 0.5%),
https://www.cambridge.org/core/terms. https://doi.org/10.1017/S0252921100026348Downloaded from https://www.cambridge.org/core. IP address: 65.21.228.167, on 28 Nov 2021 at 14:43:28, subject to the Cambridge Core terms of use, available at
Mochkovitch & Segretain: Crystallization of dense binary ionic mixtures 133
with the value obtained by molecular dynamics simulations, for the OCP (Slattery and DeWitt 1993). They find that the phase diagram evolves from a spindle form for 0.72 < £ = Z\fZi < 1.0, to an azeotropic form for 0.58 < C < 0-72 and to an eutectic form for £ < 0.58. This bears important consequences for the cooling of white dwarfs, as will be detailed below.
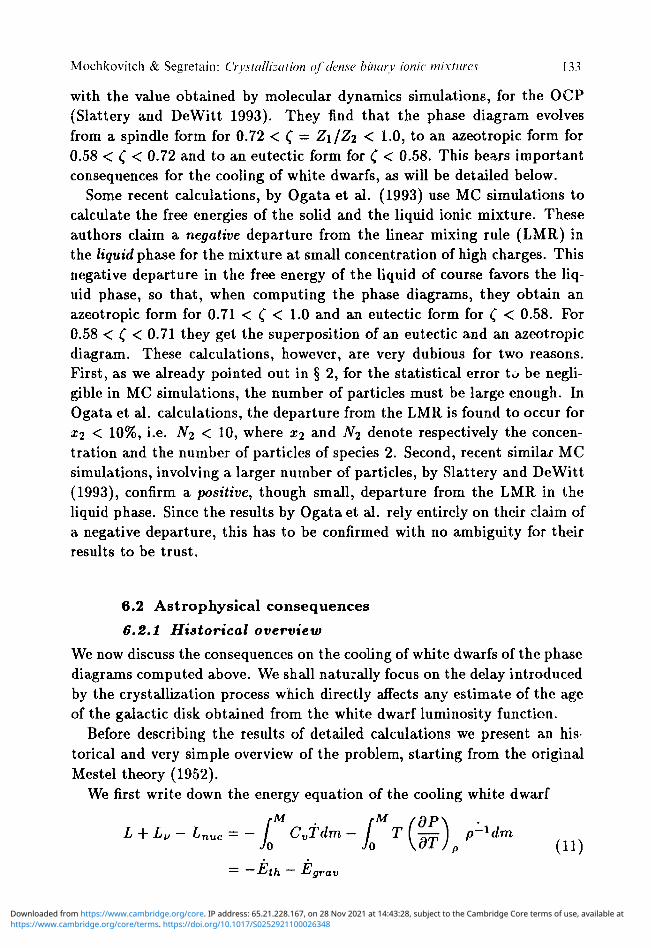
Some recent calculations, by Ogata et al. (1993) use MC simulations to calculate the free energies of the solid and the liquid ionic mixture. These authors claim a negative departure from the linear mixing rule (LMR) in the liquid phase for the mixture at small concentration of high charges. This negative departure in the free energy of the liquid of course favors the liquid phase, so that , when computing the phase diagrams, they obtain an azeotropic form for 0.71 < C < 1.0 and an eutectic form for £ < 0.58. For 0.58 < C < 0-71 they get the superposition of an eutectic and an azeotropic diagram. These calculations, however, are very dubious for two reasons. First, as we already pointed out in § 2, for the statistical error to be negligible in MC simulations, the number of particles must be large enough. In Ogata et al. calculations, the departure from the LMR is found to occur for X2 < 10%, i.e. N2 < 10, where x-i and Ni denote respectively the concentration and the number of particles of species 2. Second, recent similar MC simulations, involving a larger number of particles, by Slattery and DeWitt (1993), confirm a positive, though small, departure from the LMR in the liquid phase. Since the results by Ogata et al. rely entirely on their claim of a negative departure, this has to be confirmed with no ambiguity for their results to be trust.
6.2 Astrophysical consequences
6.2.1 Historical overview
We now discuss the consequences on the cooling of white dwarfs of the phase diagrams computed above. We shall naturally focus on the delay introduced by the crystallization process which directly affects any estimate of the age of the galactic disk obtained from the white dwarf luminosity function.
Before describing the results of detailed calculations we present an historical and very simple overview of the problem, starting from the original Mestel theory (1952).
We first write down the energy equation of the cooling white dwarf
L + L„- Lnuc = - / CvTdm - T [—-) p^dm Jo Jo \oTJp (11)
= H'th E'grav
https://www.cambridge.org/core/terms. https://doi.org/10.1017/S0252921100026348Downloaded from https://www.cambridge.org/core. IP address: 65.21.228.167, on 28 Nov 2021 at 14:43:28, subject to the Cambridge Core terms of use, available at

134 Mochkovitch & Segretain: Crystallization of dense binary ionic mixtures
Fig. 6.3 Phase diagram for an arbitrary mixture. (Segretain and Chabrier)
where L, L„ and Lnuc are respectively the photon and neutrino luminosities and the nuclear energy release in the envelope; Eth and Egrav are the thermal and gravitational energy sources of the white dwarf (all other symbols have their usual meanings). Mestel theory follows from the energy equation after a series of approximations, some of them being excellent and others more questionable:
(i) The interior temperature is assumed to be uniform due to the high thermal conductivity of degenerate electrons.
(ii) Only the photon luminosity is included, the radiation transfer through the envelope being computed with a Kramers opacity.
(iii) The thermal energy source is dominant in the white dwarf interior. (iv) The heat capacity of the dense plasma inside the white dwarf is
https://www.cambridge.org/core/terms. https://doi.org/10.1017/S0252921100026348Downloaded from https://www.cambridge.org/core. IP address: 65.21.228.167, on 28 Nov 2021 at 14:43:28, subject to the Cambridge Core terms of use, available at
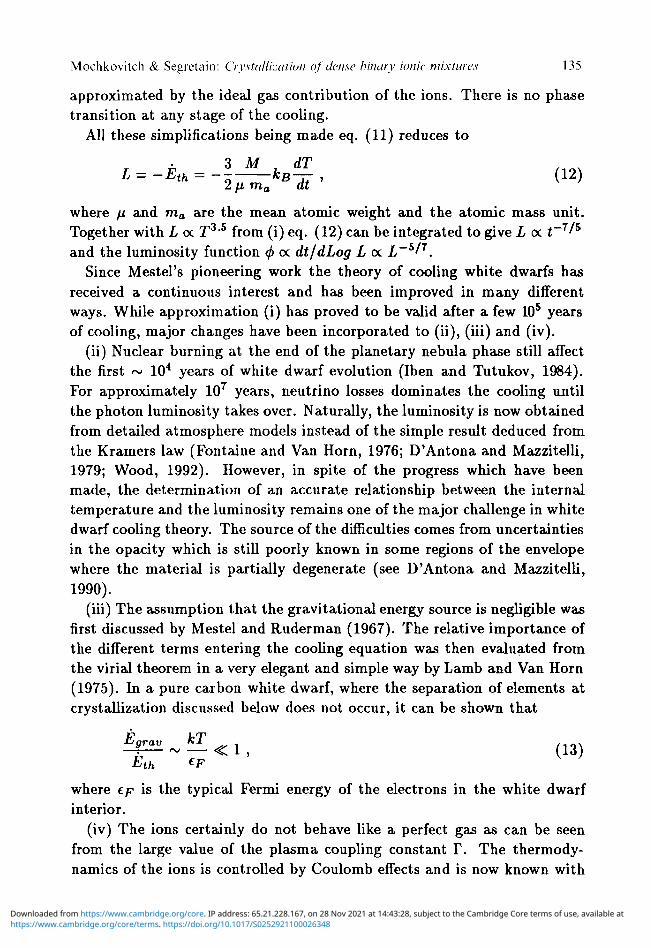
Mochkovitch & Segretain: Crystallization of dense binary ionie mixtures 135
approximated by the ideal gas contribution of the ions. There is no phase transition at any stage of the cooling.
All these simplifications being made eq. (11) reduces to
£ = _ B » JL*" , (12) 2 /x ma at
where /i and ma are the mean atomic weight and the atomic mass unit. Together with L oc T 3 , 5 from (i) eq. (12) can be integrated to give L oc i - 7 / 5
and the luminosity function <f> oc dt/dLog L oc L~5/7. Since Mestel's pioneering work the theory of cooling white dwarfs has
received a continuous interest and has been improved in many different ways. While approximation (i) has proved to be valid after a few 105 years of cooling, major changes have been incorporated to (ii), (iii) and (iv).
(ii) Nuclear burning at the end of the planetary nebula phase still affect the first ~ 104 years of white dwarf evolution (Iben and Tutukov, 1984). For approximately 107 years, neutrino losses dominates the cooling until the photon luminosity takes over. Naturally, the luminosity is now obtained from detailed atmosphere models instead of the simple result deduced from the Kramers law (Fontaine and Van Horn, 1976; D'Antona and Mazzitelli, 1979; Wood, 1992). However, in spite of the progress which have been made, the determination of an accurate relationship between the internal temperature and the luminosity remains one of the major challenge in white dwarf cooling theory. The source of the difficulties comes from uncertainties in the opacity which is still poorly known in some regions of the envelope where the material is partially degenerate (see D'Antona and Mazzitelli, 1990).
(iii) The assumption that the gravitational energy source is negligible was first discussed by Mestel and Ruderman (1967). The relative importance of the different terms entering the cooling equation was then evaluated from the virial theorem in a very elegant and simple way by Lamb and Van Horn (1975). In a pure carbon white dwarf, where the separation of elements at crystallization discussed below does not occur, it can be shown that
Egrav kl -r — < 1 , (13)
Eth f F where ep is the typical Fermi energy of the electrons in the white dwarf interior.
(iv) The ions certainly do not behave like a perfect gas as can be seen from the large value of the plasma coupling constant T. The thermodynamics of the ions is controlled by Coulomb effects and is now known with
https://www.cambridge.org/core/terms. https://doi.org/10.1017/S0252921100026348Downloaded from https://www.cambridge.org/core. IP address: 65.21.228.167, on 28 Nov 2021 at 14:43:28, subject to the Cambridge Core terms of use, available at

136 Mochkovitch & Segretain: Crystallization of dense binary ionic mixtures
a high degree of accuracy thanks to the work of a number of people since twenty years (see Bans and Hansen, 1980 and Ichimaru et al., 1987 for good reviews). The most spectacular consequence of the Coulomb effects is probably the existence of the fluid-solid transition at Tc ~ 180. The related release of latent heat (of the order of ksT per particle) introduces a delay in the cooling of white dwarfs which was first discussed by Van Horn (1968). At low temperature, when kgT < hup (up being the plasma frequency), quantum effects become important and the heat capacity of the ions decreases according to the Debye law, leading to an acceleration of cooling in very faint white dwarfs, known as "Debye cooling".
Since white dwarfs are made of carbon and oxygen (or of oxygen, neon and magnesium for the most massive ones) plus several other minor species such as 22Ne and Fe, it was clear that calculations ignoring a possible separation of elements at crystallization were uncomplete. The problem was considered by Stevenson (1980) who proposed an eutectic phase diagram for the C/O mixture. The implied total separation of carbon and oxygen had a drastic effect on the time needed to reach the cut-off of the luminosity function which was increased by about 5 109 years (Mochkovitch, 1983). The Stevenson phase diagram was the result of a very simple analytical model for the free energies in both liquid and solid phases. Much more reliable results have been obtained recently using the density functional approach described above. Instead of an eutectic all the new phase diagrams for carbon and oxygen have a spindle (or azeotropic) shape. The delays introduced in the cooling of white dwarfs are less spectacular but remain important.
6.2.2 The crystallization of carbon-oxygen white dwarfs
The solid being more oxygen rich than the liquid, it is also slightly denser to maintain the continuity of total pressure at the phase transition. An estimate of the density change between the solid and liquid phases is given by
Ap APi AYe , x
where Pt- and Pe are respectively the ionic and electronic pressures, 7 is the adiabatic index for the electron gas and Ye is the number of electrons per nucleon. Inside a 0.6 Mp> white dwarf ^ « 10 - 4 . The solid therefore settles down at the center while the lighter liquid left behind is redistributed with great efficiency by convective transport (Mochkovitch, 1983). The result of the crystallization process is then an enrichment in oxygen in the central
https://www.cambridge.org/core/terms. https://doi.org/10.1017/S0252921100026348Downloaded from https://www.cambridge.org/core. IP address: 65.21.228.167, on 28 Nov 2021 at 14:43:28, subject to the Cambridge Core terms of use, available at

Mochkovitch & Segretain: Crystallization of dense binary ionic mixtures 137
0.2 0.4 0.6 0.8 1 0.2 0.4 0.6 0.8
Fig. 6.4 Redistribution of carbon and oxygen in a crystallizing white dwarf; a spindle phase diagram leads to the formation of a composition gradient in a white dwarf where Xc = X0 = 0.5 before crystallization. In the example shown a constant enrichment in oxygen, a = 0.3, has been adopted.
regions of the white dwarf and a depletion in the outer parts . This has been illustrated in fig. 1.4 in the case of a spindle phase diagram and for carbon and oxygen with initially equal mass fractions throughout the white dwarf.
Making the rough approximation that the enrichment in oxygen is a constant a ~ 0.3
XI = (1 + a)Xl0 , (15)
(X''1 being respectively the oxygen mass fractions in solid and liquid phases)
and assuming a perfect mixing outside the solid core it becomes possible to
obtain the composition gradient analytically (Barrat et al., 1988). When
the solid core has grown to a mass M , the remaining oxygen mass fraction
in the liquid mantle is
, Q.5Mw - C' XI dm Mwd-Ms
(16)
where Mwd is the total mass of the white dwarf. Taking the derivative of
eq. (16) with respect to Ma and introducing (15) yields
H.X' (17)
https://www.cambridge.org/core/terms. https://doi.org/10.1017/S0252921100026348Downloaded from https://www.cambridge.org/core. IP address: 65.21.228.167, on 28 Nov 2021 at 14:43:28, subject to the Cambridge Core terms of use, available at
138 Mochkovitch & Segretain: Crystallization of dense binary ionic mixtures
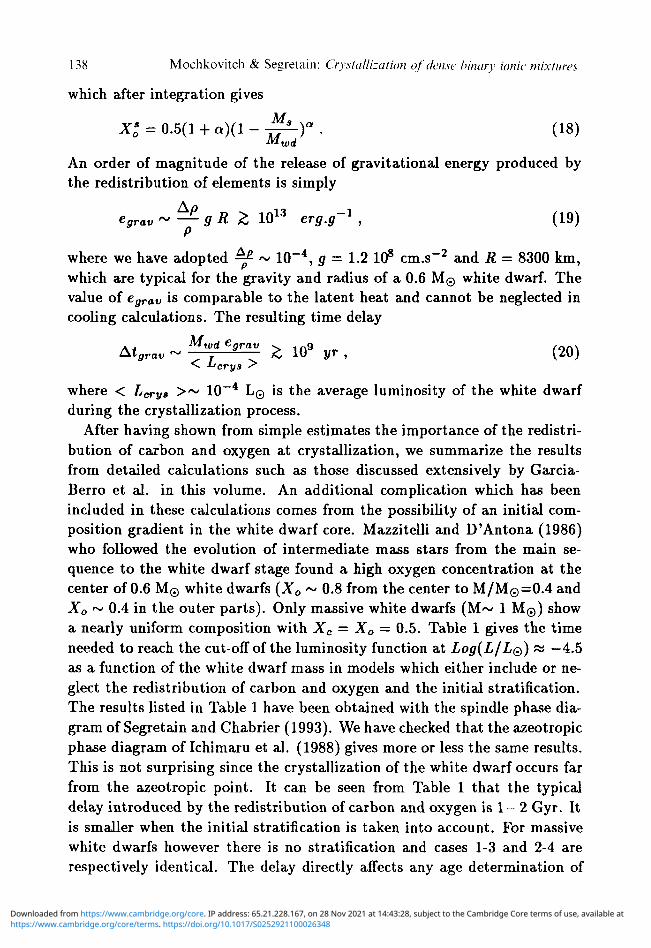
which after integration gives
X>0 = 0.5(1 + a ) ( l - - ^ r . (18)
An order of magnitude of the release of gravitational energy produced by the redistribution of elements is simply
egrav ~—gRZ 1013 erg.g-1 , (19)
where we have adopted ^ ~ 10 - 4 , g = 1.2 108 cm.s - 2 and R = 8300 km, which are typical for the gravity and radius of a 0.6 M© white dwarf. The value of egrav is comparable to the latent heat and cannot be neglected in cooling calculations. The resulting time delay
V ~ ^ 69rZ * 109 yr , (20)
where < Lcrya > ~ 10 - 4 L© is the average luminosity of the white dwarf during the crystallization process.
After having shown from simple estimates the importance of the redistribution of carbon and oxygen at crystallization, we summarize the results from detailed calculations such as those discussed extensively by Garcia-Berro et al. in this volume. An additional complication which has been included in these calculations comes from the possibility of an initial composition gradient in the white dwarf core. Mazzitelli and D'Antona (1986) who followed the evolution of intermediate mass stars from the main sequence to the white dwarf stage found a high oxygen concentration at the center of 0.6 M© white dwarfs (X0 ~ 0.8 from the center to M/M0=O.4 and X0 ~ 0.4 in the outer parts). Only massive white dwarfs (M~ 1 M®) show a nearly uniform composition with Xc = X0 = 0.5. Table 1 gives the time needed to reach the cut-off of the luminosity function at Log(L/LQ) « —4.5 as a function of the white dwarf mass in models which either include or neglect the redistribution of carbon and oxygen and the initial stratification. The results listed in Table 1 have been obtained with the spindle phase diagram of Segretain and Chabrier (1993). We have checked that the azeotropic phase diagram of Ichimaru et al. (1988) gives more or less the same results. This is not surprising since the crystallization of the white dwarf occurs far from the azeotropic point. It can be seen from Table 1 that the typical delay introduced by the redistribution of carbon and oxygen is 1 - 2 Gyr. It is smaller when the initial stratification is taken into account. For massive white dwarfs however there is no stratification and cases 1-3 and 2-4 are respectively identical. The delay directly affects any age determination of
https://www.cambridge.org/core/terms. https://doi.org/10.1017/S0252921100026348Downloaded from https://www.cambridge.org/core. IP address: 65.21.228.167, on 28 Nov 2021 at 14:43:28, subject to the Cambridge Core terms of use, available at

Mochkovitch & Segretain: Crystallization of dense binary ionic mixtures 139
Table 6.1. Values of the cooling time (in Gyr) at
Log(L/LQ) = —4.5 for different white dwarf masses, in the
following four cases: (1) no initial stratification, no CO
redistribution at crystallization; (2) no stratification, CO
redistribution; (3) initial stratification, no redistribution; (4)
initial stratification, CO redistribution. The delays due to CO
redistribution are given for the cases 2-1 and 4-3.
M/MQ
(1)
(2)
Ar(2 - 1)
(3)
(4)
Ar(4 - 3)
0.5 0.6 0.7 0.8 0.9 1.0 1.1
8.73 9.24 9.39 9.27 8.96 8.53 8.10
10.78 11.45 11.53 11.27 10.78 10.13 9.45
2.05 2.21 2.14 2.00 1.82 1.60 1.35
8.10 8.76 9.24 9.28 8.97 8.53 8.10
9.18 9.96 10.76 11.12 10.73 10.13 9.45
1.08 1.20 1.52 1.84 1.76 1.60 1.35
1.2
8.07
9.13
1.06
8.07
9.13
1.06
the galactic disk coming from the white dwarf luminosity function. A calculation which would neglect the redistribution of carbon and oxygen would then yield an age underestimated by at least 1 Gyr.
6.2.3 The effect of minor species
6.2.3.1 -22Ne
From the different minor species which can play a role in the cooling of white dwarfs 2 2Ne is certainly the most important. It is relatively abundant since it is produced from 1 4N during He burning by the chain of reactions u N ( a , 7 ) 1 8 0 ( a , 7 ) 2 2 N e . Its abundance is directly related to the initial concentration of CNO elements, so that one can expect a mass fraction X(2 2Ne) ~ 1 - 2% in population I white dwarfs. 2 2Ne is a neutron rich nucleus (ye(2 2Ne)=10/22=0.45) which can produce a large release of gravitational energy if it accumulates at the center during crystallization. The physics of 2 2Ne deposition should in principle be described by a 3-component (C-O-Ne) phase diagram which is unfortunately not presently available. One has to rely on N-Ne binary phase diagrams where nitrogen mimics the behavior of the CO mixture. As shown in Sect. 1.1.4, for a charge ratio less than 0.72
https://www.cambridge.org/core/terms. https://doi.org/10.1017/S0252921100026348Downloaded from https://www.cambridge.org/core. IP address: 65.21.228.167, on 28 Nov 2021 at 14:43:28, subject to the Cambridge Core terms of use, available at
140 Mochkovitch & Segretain: Crystallization of dense binary ionic mixtures
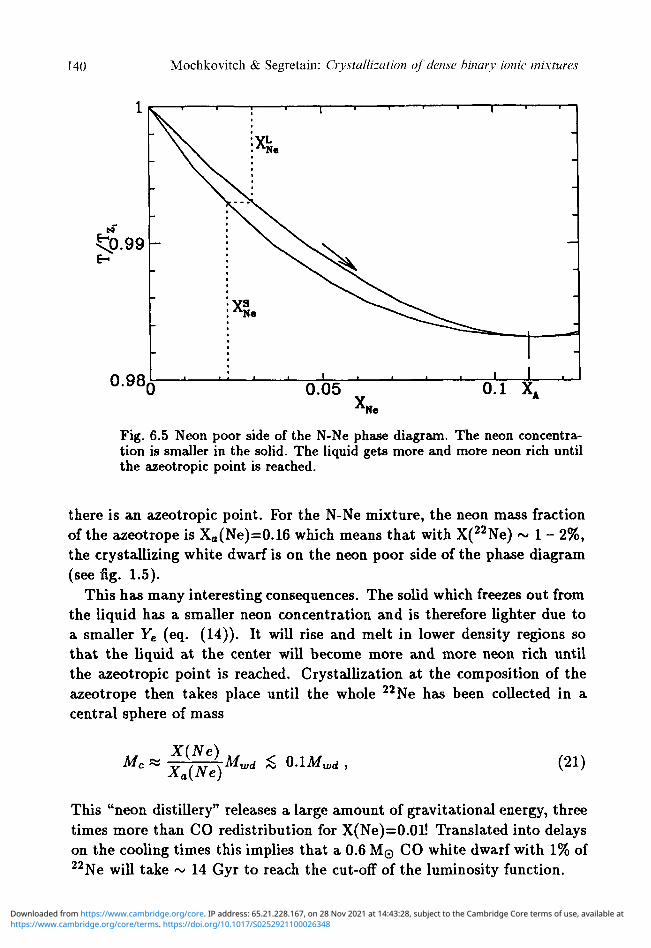
Fig. 6.5 Neon poor side of the N-Ne phase diagram. The neon concentration is smaller in the solid. The liquid gets more and more neon rich until the azeotropic point is reached.
there is an azeotropic point. For the N-Ne mixture, the neon mass fraction of the azeotrope is Xa(Ne)=0.16 which means that with X(2 2Ne) ~ 1 - 2%, the crystallizing white dwarf is on the neon poor side of the phase diagram (see fig. 1.5).
This has many interesting consequences. The solid which freezes out from the liquid has a smaller neon concentration and is therefore lighter due to a smaller Ye (eq. (14)). It will rise and melt in lower density regions so that the liquid at the center will become more and more neon rich until the azeotropic point is reached. Crystallization at the composition of the azeotrope then takes place until the whole 2 2Ne has been collected in a central sphere of mass
Mc X(Ne)
Xa{Ne) MWd <> 0.1Mwd , (21)
This "neon distillery" releases a large amount of gravitational energy, three times more than CO redistribution for X(Ne)=0.0l! Translated into delays on the cooling times this implies that a 0.6 M© CO white dwarf with 1% of 2 2Ne will take ~ 14 Gyr to reach the cut-off of the luminosity function.
https://www.cambridge.org/core/terms. https://doi.org/10.1017/S0252921100026348Downloaded from https://www.cambridge.org/core. IP address: 65.21.228.167, on 28 Nov 2021 at 14:43:28, subject to the Cambridge Core terms of use, available at

Mochkovitch & Segretain: Crystallization of dense binary ionic mixtures 141
Does it mean that the age of the galactic disk is 14 Gyr? Probably not, for at least two independent reasons. First, the white dwarfs at the cutoff come from stars formed very early in the history of the disk and then have a low metallicity. Since the delay is proportional to the abundance of 22Ne, it follows that the faint end of the luminosity function and the estimated age of the disk are only weakly affected by neon deposition. A detailed calculation, where the luminosity function is obtained consistently with a model of galactic evolution is presented by Garcia-Berro et al. in this volume.
Another more fundamental reason is simply that Ne may very well not deposit in the realistic case of a ternary mixture C-O-Ne. As mentioned above the phase diagram is not known for more than two components. Nevertheless, one can try to use the results for the CO and N-Ne cases to predict that the solid which freezes out from the ternary mixture will be oxygen rich and neon poor. The higher oxygen concentration and the depletion in neon have opposite effects on the density difference between the solid and the liquid. Since the "neon distillery" works only if the solid is lighter, this leads to a maximum allowed enrichment in oxygen for a given depletion in neon. Let us assume that in liquid phase Xl
c = Xl0 = 0.495 and Xl(Ne) = 0.01. In
the solid X*(Ne) = aXl(Ne) with a < 1. We have represented in fig. 1.6 the maximum oxygen mass fraction in the solid as a function of a which keeps Apsi < 0. If we adopt the value a « 0.5 as indicated from the study of N-Ne mixtures, X™ax « 0.65, close to the oxygen mass fraction in the solid obtained for a CO mixture with Xl
c = Xl0 = 0.5. The chance that the
solid remains lighter are naturally increased if a w 0 as proposed by Ogata et al. (1993).
6.2.3.2 - Ft
The possibility of iron deposition has been discussed by Xu and Van Horn (1992) and the problem appears very similar to that of neon. The phase diagram of the N-Fe mixture has an eutectic shape and the solid can then be expected to be iron free and lighter than the liquid. In principle an "iron distillery" could work and bring all the iron at the center. For an iron mass fraction of 10 - 3 , the resulting additional delay would reach 0.8 Gyr. However, exactly as for neon, iron deposition is uncertain in a multi-component plasma and even if it occurs, it does not affect the cooling of the old, low metallicity white dwarfs which make the faint end of the luminosity function.
https://www.cambridge.org/core/terms. https://doi.org/10.1017/S0252921100026348Downloaded from https://www.cambridge.org/core. IP address: 65.21.228.167, on 28 Nov 2021 at 14:43:28, subject to the Cambridge Core terms of use, available at

142 Mochkovitch & Segretain: Crystallization of dense binary ionic mixtures
0.9 r . , . 1 . 1 .
0 g _ no Ne deposition _
0 . 6 - ^ ^ \ ^
Ne deposition ^ ^ ^ ^
u o 0 0.25 0.5 0.75 1 a
Fig. 6.6 Maximum oxygen mass fraction in the solid as a function of a (the neon depletion factor) to have Ap,i < 0 and neon deposition.
6.3 Conclusion
During the past twenty years our understanding of the physics of the interior of white dwarfs has been transformed. The thermodynamics of dense plasmas is now known with a high degree of accuracy and the importance of Coulomb effects on the stucture and evolution of white dwarfs has been fully recognized. For one of the most difficult problem - the shape of the phase diagram for mixtures - the density functional theory provides for the first time a reliable solution (at least for binary mixtures) and cooling sequences of white dwarfs with the best input physics for the interior can now be calculated. The partial separation of carbon and oxygen at crystallization adds 1 - 2 Gyr to the time needed to reach Log(L/LQ) = -4 .5 and hence to the age of the galactic disk deduced from the white dwarf luminosity function. The main source of error in white dwarf cooling theory now probably comes from the envelope, where the opacity is still very uncertain in some regions of the p — T plane.
References Abrikosov A.A., Zh. Eksp. i Tear. Fiz. 39, 1798, (Soviet Phys. JETP 12, 1254),
(1960)
https://www.cambridge.org/core/terms. https://doi.org/10.1017/S0252921100026348Downloaded from https://www.cambridge.org/core. IP address: 65.21.228.167, on 28 Nov 2021 at 14:43:28, subject to the Cambridge Core terms of use, available at
Mochkovitch & Segretain: Crystallization of dense binary ionic mixtures 143
Barrat J.L., Thesis, university of Paris VI (1987) Barrat J.L., Europhys. Lett. 3, 523, (1987) Barrat J.L., Baus M., Hansen J.P.„ J. Phys. C20, 1413, (1987) Barrat J.L., Hansen J.P., Mochkovitch R., A&A 199, L15, (1988) Baus M., Colot J.L , Mol. Phys. 55, 653, (1985); Baus M., J. Stat. Phys., 48,
1129,(1987) Baus M., Hansen J.P., Phys. Rep. 59, 1, (1980) Brami F., Hansen J.P., Joly B., Physica A 95, 505, (1979) Brush S.G., Sahlin H.L., Teller E., J. Chem. Phys. 45, 2102, (1966) Chabrier G., Ashcroft N.W., Phys. Rev. A 42, 2284, (1990) D'Antona F., Mazzitelli I., A&A , 74, 161, (1979) D'Antona F., Mazzitelli I., Ann. Rev. Astron. Astrophys. , 28, 139, (1990) DeWitt H.E, Slaterry W.L., (1993) Private communication DeWitt H.E, Slattery W.L., Yang J., The international conference on the physics
of strongly coupled plasmas, (1993), in press Dubin D.H.E., Phys. Rev. A 42, 4972, (1990) Dyson F., Ann. Phys. 63, 1, (1971) Farouki R.T., Hamaguchi S., Phys. Rev. E47, 4330, (1993) Fontaine G., Van Horn H.M., Ap.J. Suppl. , 31, 467, (1976) Hansen J.P., Phys. Rev. A 8, 3096, (1973) Hansen J.P., MacDonald I.R., Theory of simple liquids, (Academic Press),
(1976,1989) Honenberg P., Kohn W., Phys. Rev. , 136, B 864, (1964) Iben I.Jr., Tutukov A., Ap.J. , 282, 615, (1984) Ichimaru S., lyetomi H., Tanaka S., Phys. Rep. 149, 91, (1987) Ichimaru S., lyetomi H., Ogata S., ApJ 334, L17, (1988) lyetomi H., Ichimaru S., Phys. Rev. B 38, 6761, (1988) Kirshnitz D.A., Zh. Eksp. i Teor. Fiz. 38, 503, (Soviet Phys. JETP 11, 365),
(1960) Lamb D.Q., Van Horn H.M., Ap.J. 200, 306, (1975) Landau L.D. , Lifshitz E.M., Statistical Physics, (London: Pergamon) (1958) Likos C.N., Aschroft N.W., Phys. Rev. Lett. 69, 316, (1992) Mestel L., M.N.R.A.S. , 112, 583, (1952) Mestel L., Ruderman M.A., M.N.R.A.S. , 136, 27, (1967) Mochkovitch R., A&A , 122 , 212, (1983) Mazzitelli I., D'Antona F., Ap.J. , 308, 706, (1986) Ogata S., Ichimaru S., Phys. Rev. A 36, 5451, (1987) Ogata S., lyetomi H., Ichimaru S., Van Horn H.M. Phys. Rev. E 48, 1344, (1993) Parrinello M., Tosi M.P., Chem. Phys. Lett. 64, 579, (1979) Ramakrisnan T.V., Yussouf M., Phys. Rev. B 19, 2775, (1979) Rovere M., Tosi M., J.Phys. C, 18, 3345, (1985) Salpeter E.E., Ap.J. 134, 669, (1961) Segretain L., Chabrier G., A&A 271, L13, (1993) Singh Y., Phys. Rep. 207, 351, (1991) Stevenson D.J.,/. Physique 41 , C2-61, (1980) Stringfellow G.S., DeWitt H.E., Slaterry W.L., Phys. Rev. A 41, 1105, (1990) Tarazona P., Mol. Phys. 52, 81, (1984) Van Horn H.M., Ap.J., 151, 227, (1968) Wood M., Ap.J. , 386, 539, (1992) Xu , Van Horn H.M., Ap.J. , 387, 662, (1992)
https://www.cambridge.org/core/terms. https://doi.org/10.1017/S0252921100026348Downloaded from https://www.cambridge.org/core. IP address: 65.21.228.167, on 28 Nov 2021 at 14:43:28, subject to the Cambridge Core terms of use, available at


![Crystal nuclei and structural correlations in two ...hlowen/doc/op/op0213.pdf · in two-dimensional colloidal mixtures: ... [17], crystallization [18] and glass formation [19] in](https://img.pdfslide.net/doc/110x75/606343d1bba8377909336277/crystal-nuclei-and-structural-correlations-in-two-hlowendocopop0213pdf.jpg)