Embed Size (px)
Citation preview
6. D
es
ign
ex
am
pl
es
6.16. Design examples
Chapter 6. Design examples
6.1: permeable pavement (level 1) and sheet Flow to Conservation area
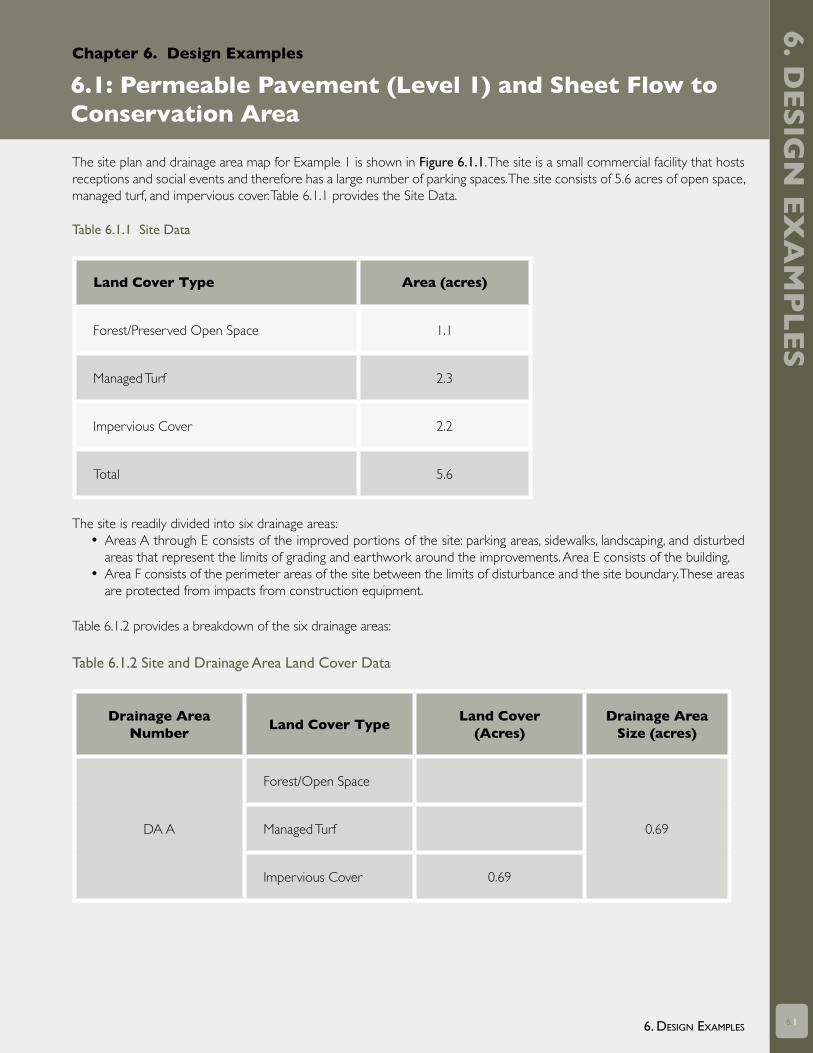
The site plan and drainage area map for Example 1 is shown in Figure 6.1.1. The site is a small commercial facility that hosts receptions and social events and therefore has a large number of parking spaces. The site consists of 5.6 acres of open space, managed turf, and impervious cover. Table 6.1.1 provides the Site Data.
Table 6.1.1 Site Data
land Cover Type area (acres)
Forest/Preserved Open Space 1.1
Managed Turf 2.3
Impervious Cover 2.2
Total 5.6
The site is readily divided into six drainage areas:• Areas A through E consists of the improved portions of the site: parking areas, sidewalks, landscaping, and disturbed
areas that represent the limits of grading and earthwork around the improvements. Area E consists of the building,• Area F consists of the perimeter areas of the site between the limits of disturbance and the site boundary. These areas
are protected from impacts from construction equipment.
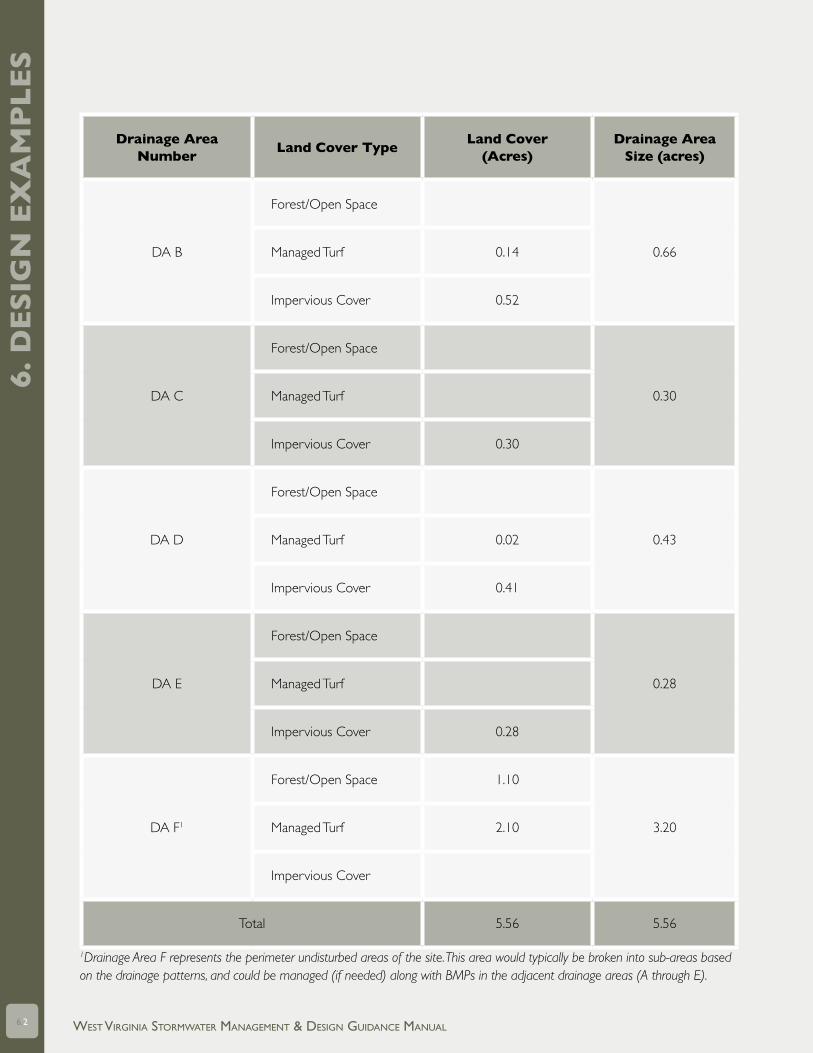
Table 6.1.2 provides a breakdown of the six drainage areas:
Table 6.1.2 Site and Drainage Area Land Cover Data
Drainage area number
land Cover Typeland Cover
(acres)Drainage area
size (acres)
DA A
Forest/Open Space
0.69Managed Turf
Impervious Cover 0.69
6. D
es
ign
ex
am
pl
es
6.2 West Virginia stormWater management & Design guiDance manual
Drainage area number
land Cover Typeland Cover
(acres)Drainage area
size (acres)
DA B
Forest/Open Space
0.66Managed Turf 0.14
Impervious Cover 0.52
DA C
Forest/Open Space
0.30Managed Turf
Impervious Cover 0.30
DA D
Forest/Open Space
0.43Managed Turf 0.02
Impervious Cover 0.41
DA E
Forest/Open Space
0.28Managed Turf
Impervious Cover 0.28
DA F1
Forest/Open Space 1.10
3.20Managed Turf 2.10
Impervious Cover
Total 5.56 5.56
1Drainage Area F represents the perimeter undisturbed areas of the site. This area would typically be broken into sub-areas based on the drainage patterns, and could be managed (if needed) along with BMPs in the adjacent drainage areas (A through E).
6. D
es
ign
ex
am
pl
es
6.36. Design examples
sTep 1 site assessment/narrative: Refer to Chapter 2.3: General Compliance Procedure for New Development and Redevelopment Projects; and Refer to Chapter 4.1: “Self-Crediting” Better Site Design Practices. The reader should note that the perimeter undisturbed area (DA F) is considered to be self crediting since leaving it as undisturbed will generate less runoff. Additional self-crediting can be achieved if portions of this perimeter area can be designated as open space. This will require some form of easement or protective covenant to prevent the typical turf management practices of fertilization, mowing, etc.
This example will address the parking lot designated on Figure 6.1.1 as Drainage Area A.
sTep 2: evaluate Bmp OptionsReference to Chapter 3.3 BMP Selection.Drainage Area A consists entirely of impervious cover. Drainage Area A Characteristics/Feasibility (Table 3.6 of Chapter 3)
• Soil type: Soils consist of HSG B & C soils, and are mapped as HSG B soil complex. The parking area is in slight cut at the southern end and transitions to slight fill in the northern end. The bottom of the permeable pavement section across the entire parking lot is in cut.
• Water Table: Soil survey and field verification indicates the seasonal water table to be a depth greater than 5 feet below existing grade.
• Bedrock: Soil survey and field verification indicates the bedrock to be a depth greater than 5 feet below existing grade.
• Hydraulic Head: Based on the existing and proposed grades, there appears to be at least three to four feet of available hydraulic head to discharge under drains and the drainage system.
• Slopes: mild slopes • Drainage Area size: Drainage area A = 29,940 ft2 • Available space: space is available under the pavement and at the perimeter of the parking area
Select Level 1 Permeable Pavement discharging to a Conservation Area with partial A/B and C/D soils (located along the northwest edge of the parking lot.
sTep 3: Determine Bmp Drainage areas and Treatment Volume (Tv)
Drainage Area Descriptions: Drainage Area A consists entirely of a parking lot (impervious cover) that will be managed using permeable pavement in seven distinct drainage sub-areas itemized in Table 6.1.3, and shown in Figure 6.1.2., labeled as sub-areas 1 through 7.
• The drainage areas consist of the paved areas only as the grading allows the adjacent pervious areas to drain away from the pavement. (This is a critical design element of permeable pavement – any contributing drainage area to the permeable pavement should be 100% impervious.)

6. D
es
ign
ex
am
pl
es
6.4 West Virginia stormWater management & Design guiDance manual
Treatment Volume for Drainage Area A from the Site Data Tab in the West Virginia Compliance Spreadsheet or the following equation:
Equation 3.1 (Chapter 3):
Where: Tv = Target Treatment Volume, in acre-feet (ac.-ft.) P = Depth of target rainfall event = 1” RvI = Volumetric Runoff Coefficient for impervious cover (unit-less)1 = 0.95 %I = Percent of site in impervious cover (fraction) = 1 RvT = Volumetric Runoff Coefficient, turf or disturbed soils (unit-less)1 = 0.2 %T = Percent of site in turf cover (fraction) = 0 RvF = Volumetric Runoff Coefficient for forest cover (unit-less)1= 0.03 %F = Percent of site in forest cover (fraction) = 0 SA = Total site area = 29,940 ft2 = 0.69 acres 1 Refer to Table 3.10
Equation 3.1 reduces to:
Figure 6.1.1. Drainage Areas
Equations Design Example 6.1
Equation 3.1 (Chapter 3)
�� � � � ���� � �� � ��� � �� � ��� ���� � ��12
Equation 3.1 reduces to:
�� � 1� � ����� � 1� � ����12 � ��������� �� � 2�������
Equations Design Example 6.1
Equation 3.1 (Chapter 3)
�� � � � ���� � �� � ��� � �� � ��� ���� � ��12
Equation 3.1 reduces to:
�� � 1� � ����� � 1� � ����12 � ��������� �� � 2�������

6. D
es
ign
ex
am
pl
es
6.56. Design examples
Table 6.1.3. Drainage Area A Sub-Area Tabulation
Drainage sub-area
label
area of permeable pavement (ap) (ft
2)
Contribut-ing impervi-ous Drainage area (ai) (ft
2)
Total sub-area (ft2)
Design Treatment
Volume (ft3)
1 2,520 0 2,520 200
2 2,000 2,640 4,640 367
3 2,6001 0 2,600 206
4 2,000 2,640 4,640 367
5 3,2001 0 3,200 253
6 3,240 3,600 6,840 542
7 2,520 3,000 5,500 435
Drainage Area A Total 29,940 2,3702
1The parking islands on the upstream side of sub-areas 3 and 5 are proposed to be impervious (decorative pavers or similar) and can be eliminated in favor of a continuous section of permeable pavement with wheel-stops to facilitate pavement construction.2Difference of 9 ft3 from calculated value from rounding.
sTep 4: Bmp sizing and DesignThe sub-areas are very similar in terms of size and the selected strategy of utilizing permeable pavement. The two design variants are the sections that have no external contributing area. The design of the permeable pavement section for sub-areas 1 and 6 will be provided here. The remaining sections follow a similar design. Design steps: Permeable Pavement: Determine the depth of the stone reservoir – Sub-Area 1. Equation 4.1 from Chapter 4.2.4 provides the required depth of the stone reservoir to manage the runoff volume form the one-inch rainfall. This also includes the adjacent contributing drainage area.

6. D
es
ign
ex
am
pl
es
6.6 West Virginia stormWater management & Design guiDance manual
Equation 4.1
NOTE: The minimum stone depth based on the design Treatment Volume is defined by Equation 4.1. How-ever, the minimum stone depth for permeable pavement will often be dictated by the pavement section design as a function of the anticipated traffic loading, pavement type (asphalt, concrete, or interlocking pavers), and the strength of the sub-grade soils. Clays and highly expansive soils may require additional design of the sub-grade – either the use of an extra depth of stone, or a geo-grid designed for the specific conditions.
Figure 6.1.2. Drainage Area A with Sub-Areas 1 thru 7 Delineated
In the absence of a minimum design factor based on the structural design of the pavement, the res-ervoir depth should be a minimum of 6 inches above the underdrain or choker layer. The annual runoff reduction volume credit is limited to the credit applied to the design treatment volume based on contributing drainage area, regardless of the reservoir depth. Additional volume reduc-tion credit is not provided for oversized reservoir storage.
Permeable Pavement: Determine the depth of the stone reservoir – Sub-Area 6. Sub-area 6 is larger, and therefore has a larger dstone , however the recommended minimum of 6 inches of stone above the underdrain governs.
Equation PP‐1
Equation PP.1
dstone = Depth of the stone reservoir layer (ft) P = Rainfall depth (1”) for the design Treatment Volume = 0.083 ft. AI = Contributing impervious drainage area (ft2)RvI = Volumetric Runoff Coefficient for impervious cover = 0.95 AP = Area of permeable pavement (ft2)
r = porosity of reservoir layer (0.4)

6. D
es
ign
ex
am
pl
es
6.76. Design examples
Equaiton PP-1
The recommended minimum of six inches of reservoir depth above the underdrain is adequate to achieve the 45% (0.45 watershed-inches) runoff reduction credit. The Level 1 permeable pavement design section for sub-areas 1 and 6 are shown in Figure 6.1.3.
Discharge from the permeable pavement underdrains is directed to Conservation Area by way of two outfalls: one serving sub-areas 1, 2, 3, 4, 5, and 7; and the second serving sub-area 6. (Figure 6.1.2)
Sheet Flow to Conservation Areas: The conservation area designated for the discharge from the permeable pavement underdrains and overflow inlets is a partially wooded buffer area that already has a very flat slope, and adequate vegeta-tion. Inspections may note the need for spot enhancements to help avoid channeling, however, the primary design element will be the construction of level spreaders. Several different designs are illustrated in BMP Specification 4.2.1.
Conservation areas for sub-areas 1, 2, 3, 4, 5, and 7 (Outfall 1):1. Determine the peak discharge for the design off the Level Spreader with by-pass structure:
• Determine peak Q10 and peak QTv for combined sub areas 1, 2, 3, 4 and 5: -Q10 : Rational Method Q = CIA; C = 0.8 (WVDOH Drainage Manual, Table 4-4); I10= 6.1”/hr
(WVDOH Drainage Manual Chart 4-2, Appalachian Plateau; Tc = 5 min); Q10= 0.8*6.1*0.531 = 2.6 cfs;
-QTV: Two methods are referenced – NRCS method in Appendix F; and Rational Method using 1”/hr in sizing the level spreader rigid lip in Design Specification 4.2.1 Vegetated Filter Strips and Conservation Areas (use the larger, more conservative value):
NRCS Method: QTV = 0.6 cfsRational Method: QTV = 0.8*1*0.531 = 0.4 cfs
• Design by-pass structure to divert 0.6 cfs to the level spreader; and safely bypass 2.6 cfs to a stable outfall conveyance.
2. Design Level Spreader and designate Conservation Area minimum width:• From Specification 4.2.1, 40 feet of level spreader length is to be provided for every 1 cfs of inflow (with
a total maximum length of 130 ft.) when the spreader discharges to a Conservation Area consisting of forested or reforested buffer. This outfall is equipped with a by-pass structure so the level spreader is sized for 0.6 cfs:
-Minimum length of level spreader rigid lip = 0.6 cfs*40 l.f./cfs = 24 ft. -In order achieve maximum credit, a rigid lip of 60 l.f. is provided since the receiving conservation
area is sufficient to accept a wider sheet flow.
• The maximum dimensions of the conservation area should be verified in the field based on the topography and vegetation. Field verification indicates that the conservation area adjacent to the level spreader serving Outfall 1 extends 140 feet from the level spreader.
Equation PP‐1

6. D
es
ign
ex
am
pl
es
6.8 West Virginia stormWater management & Design guiDance manual
Conservation area for sub-areas 6 (Outfall 2):1. Determine the peak discharge for the design off the Level Spreader with by-pass structure:
• Determine peak Q10 and peak QTv for sub-area 6: -Q10 : Rational Method Q = CIA; C = 0.8 (WVDOH Drainage Manual, Table 4-4); I10= 6.1”/hr
(WVDOH Drainage Manual Chart 4-2, Appalachian Plateau; Tc = 5 min); Q10= 0.8*6.1*0.531 = 0.8 cfs;
-QTV: Two methods are referenced – NRCS method in Appendix F; and Rational Method using 1”/hr in sizing the level spreader rigid lip in Design Specification 4.2.1 Vegetated Filter Strips and Conservation Areas.
NRCS Method: QTV = 0.2 cfsRational Method: QTV = 0.8*1*0.531 = 0.1 cfs
• There is no bypass structure for the outfall from sub-area 6.
2. Design Level Spreader and designate Conservation Area minimum width:• From Specification 4.2.1, 40 feet of level spreader length is to be provided for every 1 cfs of inflow (with
a total maximum length of 130 ft.) when the spreader discharges to a Conservation Area consisting of forested or reforested buffer. This outfall is not equipped with a by-pass structure, so the level spreader is sized for Q10 = 0.8 cfs:
-Minimum length of level spreader rigid lip = 0.8 cfs*40 l.f./cfs = 32 ft. -In order achieve maximum credit, a rigid lip of 60 l.f. is provided since the receiving conservation
area is sufficient to accept a wider sheet flow.
• The maximum dimensions of the conservation area should be verified in the field based on the topography and vegetation. Field verification indicates that the conservation area adjacent to the level spreader serving Outfall 2 extends 70 feet from the level spreader.
• For purposes of measuring the runoff reduction credit, the first 40 feet of conservation area is in Hydrologic Group B soils, and the remaining 30 feet is in Hydrologic Group C soils.
sTep 5: Verify Compliance permeable pavement:
Similar sizing calculations for the remainder of the sub-areas yield similarly shallow permeable pavement sections. The Level 1 Permeable Pavement design provides 45% volume reduction (or 0.45 watershed inches). The typical Level 1 cross section is shown in Figure 6.1.3 and the cross section through Drainage Area 1 is shown in Figure 6.1.4.
Compliance as computed with the West Virginia Compliance Spreadsheet Drainage Area tab, or the following calcula-tion for the entire drainage area (including all 7 sub-areas) can be summarized as follows:
Total remaining Treatment Volume (Tv) = 2,370 ft3 – (2,370 ft3 x 0.45) = 1,304 ft3
Remaining from Outfall 1: 1,006 ft3
Remaining from Outfall 2: 298 ft3
Conservation areas: Outfall 1: Sheet flow to 60 ft. x 140 ft. Conservation Area in C/D soils provides a volume reduction credit of 4 ft3 per 100 ft2 of conservation area.
The credit derived from the Outfall 1 Conservation Area = (60 ft * 140 ft)*(4 ft3/100ft2) = 336 ft3
Remaining Treatment Volume (Tv) at Outfall 1 = 1,006 ft3 – 336 ft3 = 670 ft3
Outfall 2: Sheet flow to 60 ft x 40 ft. Conservation Area in A/B soils provides a credit of 9 ft3 per 100 ft2 of con-servation area. Sheet flow to remaining 60 ft. x 90 ft. Conservation Area in C/D soils provides a volume reduction credit of 4 ft3 per 100ft2 of conservation area.The credit derived from the Outfall 2 Conservation Area:(60ft*40ft)*(9ft3/100ft2)+(60ft*90ft)*(4ft3/100ft2) = 432 ft3
Remaining Treatment Volume (Tv) at Outfall 2 = 298 ft3 – 432 ft3 = 0 ft3

6. D
es
ign
ex
am
pl
es
6.96. Design examples
Overall Compliance Drainage area 1:The overall Runoff Reduction BMP design for Drainage Area 1 is 670 ft3 short of the target design Treatment Volume. Specifically, the shortfall in treatment occurs in Outfall 1, draining sub-areas 1, 2, 3, 4, 5, and 7. The 134 ft3 of additional volume managed in the Conservation Area of Outfall 2 cannot be credited toward reducing this deficit. Therefore, the shortage must either be managed through a fee-in lieu payment if available through the local plan approving authority, or the designer can evaluate other BMP options.
Since there is no space for additional BMPs downstream of the conservation areas, the designer should evaluate providing Level 1 Permeable Pavement – Refer to Example 6.2).
Example 6.2 provides the computations for sizing the infiltration sump.
Figure 6.1.3. Typical Level 1 Permeable Pavement Section Sub-Areas 1 through 6
Figure 6.1.4. Cross Section of Sub-Areas 1 through 5 and 7

This page blank

6. D
es
ign
ex
am
pl
es
6.116. Design examples
Chapter 6. Design examples
6.2 Design example 2: permeable pavement (level 2-infiltration sump)
This Example will apply the Level 2 Infiltration Sump design to Drainage Area A in an effort to manage the 670 ft3 deficit computed in Example 6.1. The infiltration rates of the existing soils under the proposed permeable pavement must be verified in order to assess the applicability of an infiltration or infiltration sump design, and establish the depth of the stone reservoir or sump.
A Level 2 Infiltration design provides a 100% (or one watershed-inch) runoff reduction credit for the volume of runoff above the filter layer and existing soils.
A Level 2 Infiltration Sump design provides a 45% (or 0.45 watershed-inches) runoff reduction credit for the volume of the runoff above the underdrain, and a 100% runoff reduction credit for the volume of runoff in the infiltration sump (below the underdrain and above the filter layer). However, the combined volume reduction credit of the two storage volumes cannot exceed 100% (or one watershed-inch) for the contributing drainage area.
sTep 1 site assessment/narrative: Refer to Chapter 2.3: General Compliance Procedure for New Development and Redevelopment Projects; and Chapter 4.1: “Self-Crediting” Better Site Design Practices
sTep 2: evaluate Bmp OptionsReference to Chapter 3.3 BMP Selection.Site Characteristics/Feasibility (Table 3.6)
• Soils: The parking area is in a B soil complex. Following the infiltration testing criteria of Appendix E, the soils in this area have a verified infiltration rate of 0.5”/hr or greater (0.5”/hr will be used as the design value for the field verified infiltration rate). The area is in cut at the southern end (sub-area 1) and transitions to slight fill in the northern end (sub-area 7). The bottom of the permeable pavement section across the entire parking lot is in cut.
• The remaining site characteristics are repeated from Example 6.1.
Select Level 2 Permeable Pavement Infiltration Sump Design with infiltration rate (i) equal to 0.5”/hr.
sTep 3: Determine Bmp Drainage areas and Treatment Volume (Tv)
Drainage area Descriptions:The sub-areas and corresponding Treatment Volume for Drainage Area A are as noted in Table 6.1.3.
sTep 4: Bmp sizing and DesignThe stone reservoir depth for sub-area 1 was determined in Example 7.1 to be 0.21 ft., and the stone reservoir depth for sub-area 6 to be 0.43 ft., with the minimum recommended depth for both areas set at 0.5 ft. The maximum depth of the Infiltration Sump for all of the sub-areas of Drainage-Area 1 is determined using Equation 4.2 from Chapter 4.2.4:

6. D
es
ign
ex
am
pl
es
6.12 West Virginia stormWater management & Design guiDance manual
Equation PP-2
Equation 4.3 (depth of stone reservoir above the infiltration sump, dres) is not needed since the maximum depth of the infiltration sump (dIS = 1.0 ft) exceeds the required stone reservoir depth for sub-area 1 (0.21 ft) and sub-area 6 (0.43 ft). Therefore, setting the depth of the infiltration sump equal to or greater than the stone reservoir depth will achieve a 100% runoff reduction credit for the contributing drainage area(s). An underdrain with the minimum recommended cover of 6 inches of stone and a 0.21 ft and 0.43 ft stone sump in sub-areas 1 and 6 respectively will therefore achieve a 100% volume treatment credit and provide for an underdrained system.
The Level 2 permeable pavement infiltration sump design section for sub-areas 1 and 6 are shown in Figure 6.2.1. The structural design of the pavement may require additional depth of stone or a geotextile. The Sheet Flow to conservation area is not needed for Drainage Area 1 as full compliance is achieved with the permeable pavement design.
Sub-Area 1 Sub-Area 6Figure 6.2.1 Typical Level 2 Permeable Pavement Infiltration Sump Section
Equations Design Example 6.2
Equation PP‐2
��� �1 2� � � ��
12Where:
dIS = Depth of the stone infiltration sump (ft) i = field‐verified infiltration rate for the sub‐grade soils = 0.5 “/hr. td = design drain time of sump = 48 hours
��� �1 2� �0.5� � ��
12 � 1.0���.

6. D
es
ign
ex
am
pl
es
6.136. Design examples
Chapter 6. Design examples
6.3. Design example 3: Bioretention
This example continues with the site plan introduced in Example 6.1 and addresses the treatment volume generated in Drainage Area B as shown in Figure 6.3.1.
sTep 1 site assessment/narrative: Refer to Chapter 2.3: General Compliance Procedure for New Development and Redevelopment Projects; and Chapter 4.1: “Self-Crediting” Better Site Design Practices
sTep 2: evaluate Bmp OptionsReference to Chapter 3.3 BMP Selection.Site Characteristics/Feasibility (Table 3.6 of Chapter 3)
• Soils: Soils consist of HSG B & C soils. The area is mapped as a HSG B soil complex.• Water Table / Bedrock • Hydraulic Head • Slope: mild slopes • Drainage Area size • Available space
The available hydraulic head (the vertical distance from the inflow elevation and the invert of the outlet system) allows for a Level 2 Bioretention design: 2 feet of bioretention soil media and an underdrain.
Select Level 2 Bioretention located in the central driveway island.
Figure 6.3.1. Drainage Areas

6. D
es
ign
ex
am
pl
es
6.14 West Virginia stormWater management & Design guiDance manual
sTep 3: Determine Bmp Drainage areas and Treatment Volume (Tv)Drainage area Descriptions:
Drainage Area B consists of parking, sidewalk, and driveway area, as well as some green space in the form of managed turf adjacent to the proposed building and a minor strip of cut/fill slope adjacent to the parking and sidewalk curb and gutters. In addition, the open space reserved for the proposed bioretention area in the interior of the large parking island of Drainage Area B is considered open space.
There are several options for the treatment of the runoff from this drainage area. However, protecting the perimeter portions of the site from disturbance and maintaining them as open space will be a self-crediting measure. Also, the presence of mature hardwood trees along the western edge of the parking lot serves to discourage any grading be-yond the minor fill required for the parking and curb line. Further, the grading required to drain the area to the east creates outfall and earthwork challenges. Therefore, the large parking island is identified as the optimal location for a bioretention basin.
The sub-areas of Drainage Area B provide for two inflow points into the Bioretention Basin. Figure 6.3.2 shows the proposed grading and drainage divides, as well as the proposed stormwater entry points (curb cuts and overflow inlets) into the bioretention area.
Table 6.3.1. Drainage Area B Land Cover Data
land Cover area (ft2) area (ac) percent (%) of Total
Forest/Open Space1 6,350 0.15 19
Managed Turf 6,088 0.14 17
Impervious 22,660 0.52 64
Drainage Area B Total 35,098 0.81
1The Forest/Open Space land cover is applied to the area of the Bioretention Basin
The Treatment Volume for Drainage Area B is taken from the Site Data Tab in the West Virginia Compliance Spreadsheet or the following equation:
Equation 3.1 (Chapter 3):
Equations Design Example 6.3
Equation 3.1 (Chapter 3):
�� � � � ���� � �� � ��� ��� � ��� ���� � ��12
�� � 1� � ����� � ��� � ��2 � �1� � � � �1�� � ���112 � ��������� �� � 1��������

6. D
es
ign
ex
am
pl
es
6.156. Design examples
sTep 4: Bmp sizing and DesignBioretention Basin: From Chapter 4.3.2
Step 1: Surface ponding – For ponding depths of less than 1 foot, surface storage should account for at least 50% of the required total design volume within the practice. For ponding depths of 1 foot or more (18 inches maximum), surface storage should account for at least 70% of the total design volume.
• Select 12” surface ponding depth; • surface ponding volume = 70% of design Tv = 0.7*1,887 ft3 = 1,320 ft3
Step 2: Soil media surface area and depth – The soil media and gravel layer provide the required remaining storage volume within the void spaces to manage the design treatment volume. The minimum surface area of the soil media can be derived as a function of the bottom surface area of the surface ponding volume. The ponding surface area can be larger than the surface area of the soil media as defined in Chapter 4.2.3:
- Ponding depths < 1 ft., ponding surface area can exceed the soil media surface area by up to 50%;- Ponding depths ≥ 1 ft., ponding surface area can exceed the soil media surface area by up to 25%
In order to provide the most economical design, the soil media surface area will be minimized to 25% less than the ponding surface area as measured at the soil surface:
• Use Equation 4.1 from Chapter 4.2.3 to determine the average ponding surface area:
- Surface Ponding Volume = SAavg-ponding*dponding = 1,320 ft3
dponding = 12”; SAavg-ponding = 1,320 ft2 - Approximate surface area at the bottom of the ponding depth = 1,100 ft2 ; based on:
3:1 side slopes; 12” ponding depth.
• Soil media surface area = (ponding surface area bottom)/( 1.25) = 1,100 ft2/1.25 = 880 ft2
Step 3: Verify Total Design Treatment Volume • Total storage volume of the practice: Equation 4.2 from Chapter 4.2.3:
Figure 6.3.2 provides the plan view of the proposed design showing the limits of:
• Surface Area of Ponding (average depth) = minimum 1,320 ft2
• Surface Area of soil media = minimum 880 ft2
Figure 7.3.3 provides the typical section of the Bioretention Basin.
• Ponding depth = 1 ft • Soil media depth = 2 ft• Gravel layer thickness = 9 inches (including 4” underdrain)
Equations Design Example 6.3
Total storage volume of the practice: Equation BR‐2 from Chapter 4.2.3:
���������� � �������� � �������� � ������� � �������� � ��������� � �������������� � ���������
���������� � ��0��� � ��2� � 0.25� � �0.75� � 0.4�� � ��,320 � ��������������2,024ft3����5ft3������������

6. D
es
ign
ex
am
pl
es
6.16 West Virginia stormWater management & Design guiDance manual
Figure 6.3.2. Bioretention Basin Plan View
Figure 6.3.3. Bioretention Basin Section

6. D
es
ign
ex
am
pl
es
6.176. Design examples
Step 4: Design Features – Refer to Chapter 4.2.3; Design Step 4:• Pre-Treatment Cells (or Forebays): Pre-treatment is essential for long term performance of Bioretention
Basins (Refer to Section 4.3 of Chapter 4.2.3). Figure 7.3.2 shows the proposed drainage divides for Forebay 1 and Forebay 2, as well as the proposed entry points (curb cuts) into the bioretention area. The design volume for the forebays is approximated as 15% of the design treatment volume, inclusive:
- Two curb cuts: approximately 36% of drainage area to curb cut #1; 65% to curb cut 2. - The 15% target volume will be proportioned between the two curb cuts.
Forebay 1 Volume = (0.36)*(0.15)*( 2,024 ft3) = 109 ft3
Forebay 2 Volume = (0.64)*(0.15)*( 2,024 ft3) = 194 ft3
• Geometry: The parking grading has been manipulated to position the inlet curb cuts at the farthest possible location from the proposed outlet location.
• Landscaping plan: surface cover is mulch and landscaping (Section 4.17);• 4-inch perforated underdrains with choker stone layer (no sump is provided)• Outlet Structure sized to carry the 2-year design storm, and the overflow curb inlets are sized and designed
to carry the 10-year design storm (or as required by the local plan approving authority).
Step 5: Verify ComplianceThe Level 2 Bioretention provides 100% runoff reduction for the design Treatment Volume. Therefore, Drainage
Area 2 meets the treatment requirements.

This page blank

6. D
es
ign
ex
am
pl
es
6.196. Design examples
Chapter 6. Design examples
6.4. Design example 4: Water Quality swale and grass swale
This example continues with the site plan introduced in Example 6.1 and addresses the treatment volume generated in Drainage Area C as shown in Figure 6.4.1. Drainage Area C consists of parking lot that is gently sloped in one direction creating a BMP location along the long edge of the parking lot. The available hydraulic head (the vertical distance between the elevations of the inflow and the invert of the outlet) is severely limited in this area of the site, necessitating a minimal depth BMP.
sTep 1 site assessment/narrative:
Refer to Chapter 2.3: General Compliance Procedure for New Development and Redevelopment Projects; and Chapter 4.1: “Self-Crediting” Better Site Design Practices
sTep 2: evaluate Bmp OptionsReference to Chapter 3.3 BMP Selection.
Site Characteristics/Feasibility (Table 3.6) was evaluated in Example 6.1. Several BMP options were considered for this drainage area:
• Vegetated Filter Strip: not enough space is available on either side of the parking area; • Impervious Disconnection: small areas of commercial non-residential impervious can be treated with
disconnection. The longest flow path criterion is met (≤ 75’); however, there is insufficient space for the disconnection (similar to the vegetated filter strip).
Select Level 1 Water Quality Swale located adjacent to the long edge of the parking lot (between the parking lot and the building).
Figure 6.4.1. Drainage Areas

6. D
es
ign
ex
am
pl
es
6.20 West Virginia stormWater management & Design guiDance manual
sTep 3: Determine Bmp Drainage areas and Treatment Volume (Tv)Drainage area Description:
Drainage Area C consists of two rows of parking and drive aisle, and an adjacent sidewalk. Portions of the parking area are in fill in order to create proper drainage patterns, so all the adjacent pervious areas drain away from the parking. Therefore, the entire drainage area is impervious.
Table 6.4.1. Drainage Area C Land Cover Data
land Cover area (ft2) area (ac)percent (%) of
Total
Forest/Open Space 0 0 0
Managed Turf 0 0 0
Impervious 12,937 0.297 100
Drainage Area 3 Total
12,937 0.297
The parking area sheet flows across with the downhill edge of pavement serving as a level spreader into the water quality swale. The Level 1 water quality swale only achieves 55% runoff volume reduction, so it will need to be over-sized or additional runoff reduction practices in series will be required to achieve the required reductions in this drainage area. Figure 6.4.2 shows the proposed grading and drainage pattern into the water quality swale.
The Treatment Volume for Drainage Area C is taken from the Site Data Tab in the West Virginia Site Design Spreadsheet or the following equation:
Equation 3.1 (from Chapter 3.4.1):
sTep 4: Bmp sizing and DesignWater Quality swale:
Step 1: Swale length, bottom width, slope, and surface ponding:
• Length is equal to parking area (180 linear feet);
Equations Design Example 6.4
Equation 3.1 (from Chapter 3.4.1):
�� � � � ���� � �� � ��� ��� � ��� ���� � ��12
�� � 1� � ����� � 1� � ��2��12 � ���2����� �� � 1��2�����

6. D
es
ign
ex
am
pl
es
6.216. Design examples
• Bottom width: try 6 ft. bottom width (Level 1 can go as small as 2’ to 4’ bottom width; however, in order to achieve sufficient runoff volume reduction, the swale is oversized);
• Slope: 1.1% slope from each end toward the center (Level 1 can go as steep as 2% to 4%; however, in order to “daylight” the underdrain to the next BMP, a shallower grade is required;
• 12” check dams located at the center (one each side); • Total ponding volume within the surface ponding “wedge” created by the check dams = 810 ft3;• Refer to Figure 6.4.2 and 6.4.3 for Plan, Profile, and Section)
Step 2: Soil media and gravel layer depth
• Soil media depth: Level 1 Water Quality Swale requires minimum 18” soil media depth. • Gravel layer : minimum 6” gravel over top of 4” perforated underdrain.
Step 3: Verify Total Design Treatment Volume
The total storage volume of the practice must be greater than the design Treatment Volume (and be designed according to BMP Specification 4.2.3.A) in order to achieve the full runoff reduction credit. Use a variation of Equation 4.1 from 4.2.3:
Equations Design Example 6.4
Use a variation of Equation BR‐2 from 4.2.3:
���������� � �������� � �������� � ������� � �������� � ��������� � ����������������
Where: Dvpractice = total storage volume of swale (cu. ft.) SAbottom = bottom area of swale (sq. ft.) 180 ft. x 6 ft. = 1080 ft2
dmedia = depth of the soil filter media (ft) 1.5 ft. ηmedia = effective porosity of the soil filter media (typically 0.25) dgravel = depth of the underdrain and gravel layer (ft) 0.833 ft. ηgravel = effective porosity of the gravel layer (typically 0.40)
Surface Ponding = Total volume within the surface ponding “wedge” (Step 1 above)
���������� � 1080��� � ��1.5� � 0.�5� � �0.83� � 0.��� � �810���������������1�5�3��3�1�0����3

6. D
es
ign
ex
am
pl
es
6.22 West Virginia stormWater management & Design guiDance manual
Figure 6.4.2 Drainage Area 3 with Water Quality Swale and Grass Swale

6. D
es
ign
ex
am
pl
es
6.236. Design examples
Figure 6.4.3 Water Quality Swale Profile and Typical Section with Check Dam

6. D
es
ign
ex
am
pl
es
6.24 West Virginia stormWater management & Design guiDance manual
Step 4: Design Features
Design features for a Water Quality Swale include ensuring flow velocities are non-erosive, check dam design and overflow capacity, etc.
• Calculate the peak discharge for the 2- and 10-year design storm and the treatment volume (1” rain event)
- Q10 : Rational Method Q = CIA; C = 0.8 (WVDOH Drainage Manual, Table 4-4); I10= 6.1”/hr ; I2= 4.1”/hr (WVDOH Drainage Manual Chart 4-2, Appalachian Plateau; Tc = 5 min);
Q2= 0.8*4.1*0.297 = 1.0 cfs;
Q10= 0.8*6.1*0.297 = 1.4 cfs;
- QTV: Modified CN Method (Appendix E); QTV = 0.3 cfs
• Verify non-erosive velocities for the 2-year storm using a channel design computer program or Manning’s Equation.
• Verify 10-year freeboard requirements: Using a central notch in the check dam as a broad crested weir, compute the required length or the maximum depth of flow over the weir to carry the 10-year design storm.
- Select a maximum design flow of 3” (0.25 ft) and compute the required width of weir.
Where: Q =10-year design peak discharge = 1.4 cfs C = weir coefficient for broad crested weir = 3.1 L = design length of weir (ft) H = design head over weir (ft) = 0.25 ft
- Use a 3.75 ft. weir notched 3 inches into check dam (Figure 6.4.3) • Verify additional design features:
- Underdrain diameter (4”); - choker stone layer thickness (1”/ foot of soil media), - minimum swale side slopes 3:1, etc.
Step 5: Verify compliance
The Runoff Reduction credit for a water quality swale is 55%. Using the West Virginia Site Design Spread-sheet or a calculation as provided below, the remaining volume of runoff to be managed with BMPs can be calculated. While a minimum design volume is required to achieve the runoff reduction credit, the practice can be oversized to increase the runoff reduction by applying the reduction credit to the larger volume as shown below. (This is distinctly different than the crediting of Permeable Pavement as covered in Example 6.1 since additional runoff reduction credit is not achieved by over sizing the Permeable Pavement stone reservoir).
• The design Tv = 1,024 ft3; Svpractice = 1,573 ft3; • Water Quality Swale Runoff Reduction Credit = 55%• Calculated runoff volume reduction:
-• Remaining runoff volume to be treated:
-Step 6: Consider Additional Runoff Reduction BMPs
Equations Design Example 6.4
- Weir Equation:
Equations Design Example 6.4
- Weir Equation:
-
-
-
-

6. D
es
ign
ex
am
pl
es
6.256. Design examples
The conveyance of flow from the Water Quality Swale (surface and underdrain discharge) can be conveyed by a grass swale to the discharge point from the bioretention basin in Drainage Area B, thereby creating a single point of discharge to the receiving system along the adjacent roadway. The grass swale will be designed with the entire contributing drainage area and corresponding peak dis-charges in order to compute the credit (20%) in the form of watershed-inches (0.2 ) rather than a percent-age.• Design Criteria for Grass Swale (Chapter 4.2.5):
- Flow depth ≤ 4 inches; Flow velocity ≤ 1 ft/s;- Manning’s “n” = 0.2;- Bottom width ≥ 2 ft; side slopes 3:1 minimum;
Step 7: Design Grass Swale
The design steps for a grass swale generally include ensuring that the design swale geometry is such that the Treatment Volume peak discharge (QTv) meets the criteria noted above, the 2-year peak discharge is non-erosive, and the capacity design discharge (Q10) is contained within the swale or bypassed thru an alterna-tive conveyance. Given the small size of the contributing drainage area, the entire discharge will be conveyed through the swale.• Design discharges as calculated in Step 4 above:
- QTV = 0.3 cfs- Q2 = 1.0 cfs- Q10 = 1.4 cfs;
• Equation 4.1 from Chapter 4.2.5:
D = flow depth = 0.3 ft n = 0.2 s = 0.01 ft/ft
• Rearranged Equation 4.2 from Chapter 4.2.5:
• Determine minimum swale length for 9 minute residence time using Equation 4.5 from Chapter 4.2.5: L = 540V = (540)0.3 ft/sec
L = 162 ft
Equations Design Example 6.4
Equation GS‐1 from Chapter 4.2.5:
� � ��1.49� ��� �⁄ �� �⁄ �
� � ��1.490.2 � �0.3�� �⁄ �. 01�� �⁄ � � 0.3 �� ��
Equations Design Example 6.4
Equation GS‐1 from Chapter 4.2.5:
� � ��1.49� ��� �⁄ �� �⁄ �
� � ��1.490.2 � �0.3�� �⁄ �. 01�� �⁄ � � 0.3 �� ��
Equations Design Example 6.4
Rearranged Equation GS‐2 from Chapter 4.2.5:
� � ��� � � �� � 0.30.3 � 0.3
� � 3.3���

6. D
es
ign
ex
am
pl
es
6.26 West Virginia stormWater management & Design guiDance manual
Step 8: Design Features
• Verify non-erosive velocities for the 2-year storm peak discharge using a channel design computer program or Manning’s Equation.
• Verify the swale capacity and freeboard for the 10-year storm peak discharge using a channel design computer program or Manning’s Equation.
• Refer to Figure 6.4.2 for Plan and 6.4.4 for Typical Section
Step 9: Verify compliance
• The remaining Treatment Volume = 159 ft3 from Step 5 above.• Runoff Reduction Volume (RRv) credit from the Grass Swale = 20% or 0.2 watershed-inches:
• Remaining Treatment Volume = 159 ft3 – 216 ft3 = 0
Figure 6.4.4 Grass Swale Typical Section
Equations Design Example 6.4
Step 9: Verify compliance
��� � �0.2"� � �0.2����� � ������0 ��� ��� � � ��� �2"� � � 2�����