Embed Size (px)
Citation preview
Go to ”Insert (View) | Header and Footer" to add your organization, sponsor,
meeting name here; then, click "Apply to All"
Life-Cycle Analysis of Biofuels with the GREET Model
Michael Wang
Center for Transportation Research
Argonne National Laboratory
IEA Bioenergy Task 42 Workshop
Chicago, USA, Oct. 4, 2010
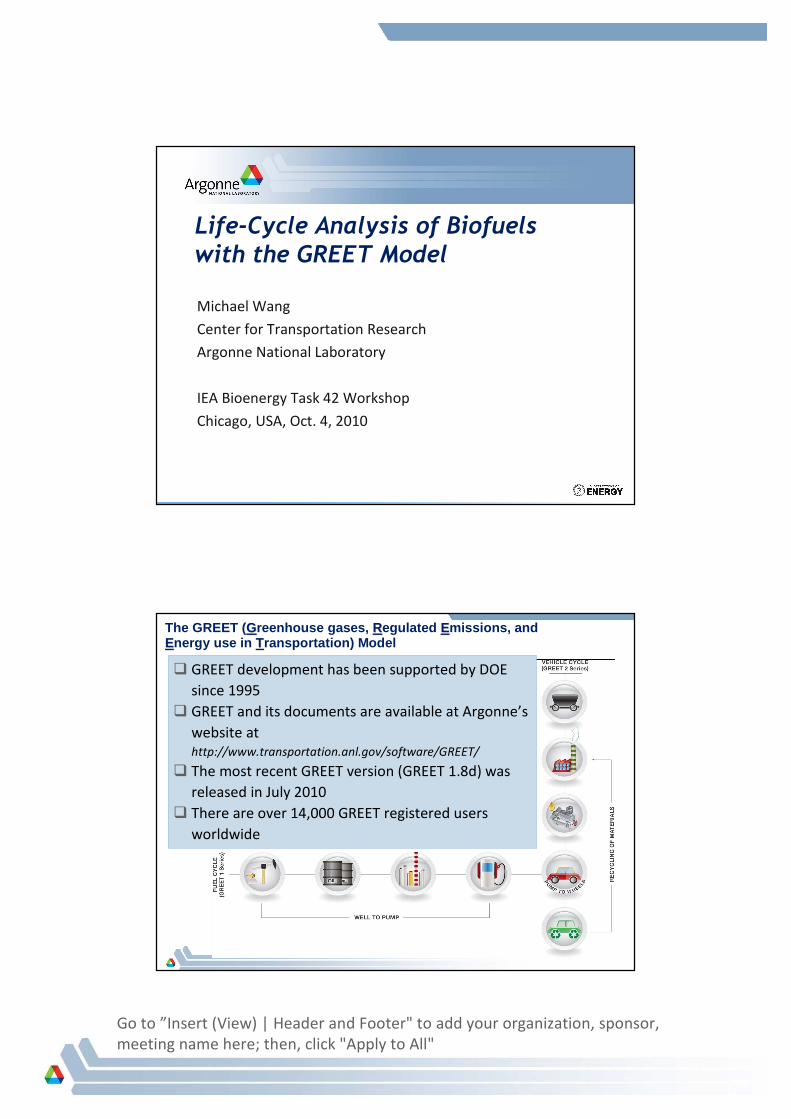
The GREET (GGreenhouse gases, RRegulated EEmissions, and EEnergy use in TTransportation) Model
� GREET development has been supported by DOE
since 1995
� GREET and its documents are available at Argonne’s
website at
http://www.transportation.anl.gov/software/GREET/
� The most recent GREET version (GREET 1.8d) was
released in July 2010
� There are over 14,000 GREET registered users
worldwide
Go to ”Insert (View) | Header and Footer" to add your organization, sponsor,
meeting name here; then, click "Apply to All"
� Energy use
� Total energy: fossil energy and renewable energy
• Fossil energy
– Petroleum
– Natural gas
– Coal
• Renewable energy: biomass, nuclear energy, hydro-power, wind power, and solar energy
� Greenhouse gases (GHGs)
� CO2
� CH4
� N2O
� CO2e of the three (with their global warming potentials of 1, 23, and 296, respectively)
� Criteria pollutants
� VOC
� CO
� NOx
� PM10
� PM2.5
� SOx
� They are estimated separately for
• Total (emissions everywhere)
• Urban (a subset of the total)
The GREET Model Estimates Energy Use and Emissions of GHGs and Criteria Pollutants for Fuel Production and Use
3
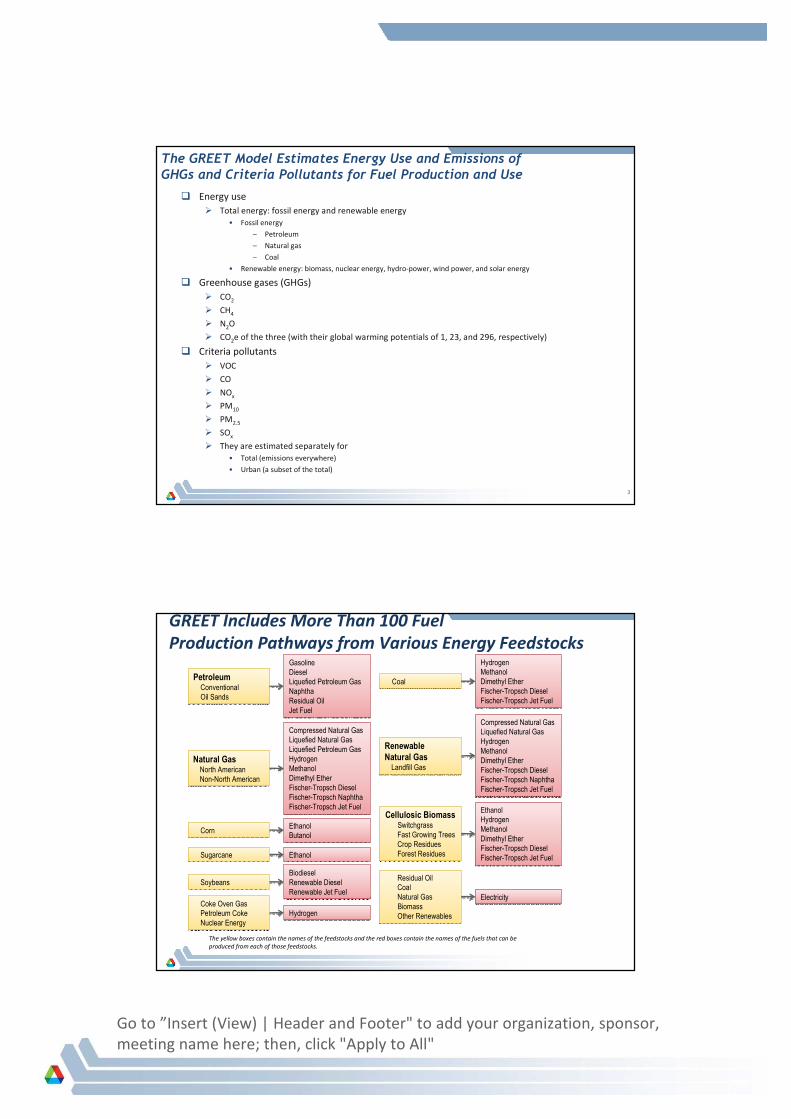
GREET Includes More Than 100 Fuel
Production Pathways from Various Energy Feedstocks
Petroleum
Conventional
Oil Sands
Petroleum
Conventional
Oil Sands
Compressed Natural Gas
Liquefied Natural Gas
Liquefied Petroleum Gas
Hydrogen
Methanol
Dimethyl Ether
Fischer-Tropsch Diesel
Fischer-Tropsch Naphtha
Fischer-Tropsch Jet Fuel
Compressed Natural Gas
Liquefied Natural Gas
Liquefied Petroleum Gas
Hydrogen
Methanol
Dimethyl Ether
Fischer-Tropsch Diesel
Fischer-Tropsch Naphtha
Fischer-Tropsch Jet Fuel
Natural Gas
North American
Non-North American
Natural Gas
North American
Non-North American
CoalCoal
SoybeansSoybeans
Gasoline
Diesel
Liquefied Petroleum Gas
Naphtha
Residual Oil
Jet Fuel
Gasoline
Diesel
Liquefied Petroleum Gas
Naphtha
Residual Oil
Jet Fuel
Hydrogen
Methanol
Dimethyl Ether
Fischer-Tropsch Diesel
Fischer-Tropsch Jet Fuel
Hydrogen
Methanol
Dimethyl Ether
Fischer-Tropsch Diesel
Fischer-Tropsch Jet Fuel
Biodiesel
Renewable Diesel
Renewable Jet Fuel
Biodiesel
Renewable Diesel
Renewable Jet Fuel
SugarcaneSugarcane
CornCorn
Cellulosic Biomass
Switchgrass
Fast Growing Trees
Crop Residues
Forest Residues
Cellulosic Biomass
Switchgrass
Fast Growing Trees
Crop Residues
Forest Residues
Coke Oven Gas
Petroleum Coke
Nuclear Energy
Coke Oven Gas
Petroleum Coke
Nuclear Energy
Residual Oil
Coal
Natural Gas
Biomass
Other Renewables
Residual Oil
Coal
Natural Gas
Biomass
Other Renewables
Ethanol
Butanol
Ethanol
Butanol
EthanolEthanol
Ethanol
Hydrogen
Methanol
Dimethyl Ether
Fischer-Tropsch Diesel
Fischer-Tropsch Jet Fuel
Ethanol
Hydrogen
Methanol
Dimethyl Ether
Fischer-Tropsch Diesel
Fischer-Tropsch Jet Fuel
ElectricityElectricity
HydrogenHydrogen
The yellow boxes contain the names of the feedstocks and the red boxes contain the names of the fuels that can be
produced from each of those feedstocks.
Compressed Natural Gas
Liquefied Natural Gas
Hydrogen
Methanol
Dimethyl Ether
Fischer-Tropsch Diesel
Fischer-Tropsch Naphtha
Fischer-Tropsch Jet Fuel
Compressed Natural Gas
Liquefied Natural Gas
Hydrogen
Methanol
Dimethyl Ether
Fischer-Tropsch Diesel
Fischer-Tropsch Naphtha
Fischer-Tropsch Jet Fuel
Renewable
Natural Gas
Landfill Gas
Renewable
Natural Gas
Landfill Gas
Go to ”Insert (View) | Header and Footer" to add your organization, sponsor,
meeting name here; then, click "Apply to All"
� Oils for Biodiesel/Renewable
Diesel/Renewable Jet Fuel
�Soybeans
�Rapeseed
�Palm oil
�Jatropha
�Waste cooking oil
�Animal fat
� Oils for Biodiesel/Renewable
Diesel/Renewable Jet Fuel
�Soybeans
�Rapeseed
�Palm oil
�Jatropha
�Waste cooking oil
�Animal fat
� Sugar Crops for EtOH
� Sugar cane
� Sugar beet
� Sweet sorghum
� Sugar Crops for EtOH
� Sugar cane
� Sugar beet
� Sweet sorghum
GREET Includes Many Potential Biofuel Production Pathways
� Starch Crops for EtOH
� Corn
� Wheat
� Cassava
� Sweet potato
� Starch Crops for EtOH
� Corn
� Wheat
� Cassava
� Sweet potato
� Cellulosic Biomass for EtOH
� Corn stover, rice straw, wheat straw
� Forest residues
� Municipal solid waste
� Dedicated energy crops
� Black liquor
� Cellulosic Biomass for EtOH
� Corn stover, rice straw, wheat straw
� Forest residues
� Municipal solid waste
� Dedicated energy crops
� Black liquor
The feedstocks and fuels that are underlined are already included in the GREET model.
� Algae
� Biodiesel
� Renewable diesel
� Algae
� Biodiesel
� Renewable diesel
� Landfill Gas
� CNG/LNG
� Fischer-Tropsch diesel
� Hydrogen
� Methanol
� DME
� Fischer-Tropsch jet fuel
� Landfill Gas
� CNG/LNG
� Fischer-Tropsch diesel
� Hydrogen
� Methanol
� DME
� Fischer-Tropsch jet fuel
� Cellulosic Biomass via Gasification
� Fischer-Tropsch diesel
� Hydrogen
� Methanol
� DME
� Fischer-Tropsch jet fuel
� Cellulosic Biomass via Gasification
� Fischer-Tropsch diesel
� Hydrogen
� Methanol
� DME
� Fischer-Tropsch jet fuel
� Butanol
� Corn
� Sugar beet
� Butanol
� Corn
� Sugar beet
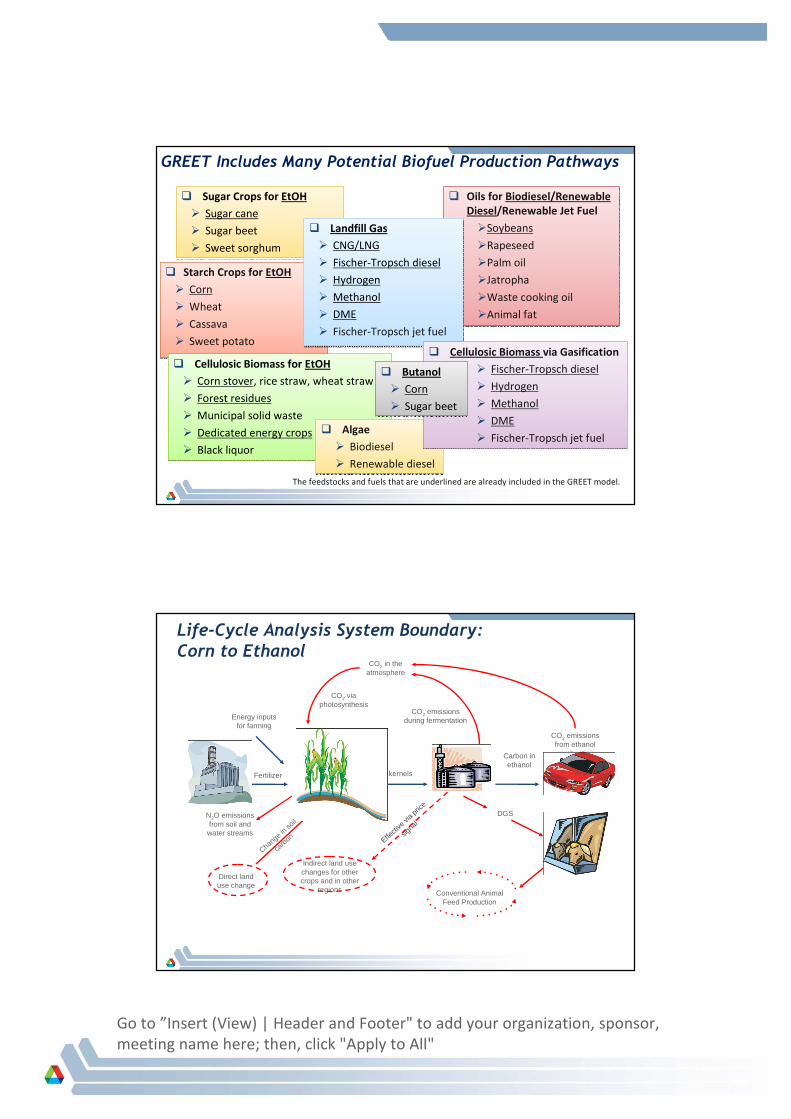
Life-Cycle Analysis System Boundary: Corn to Ethanol
Conventional Animal Feed Production
CO2 in the atmosphere
CO2 via photosynthesis
Energy inputs for farming
Fertilizer
N2O emissions from soil and
water streams
CO2 emissions during fermentation
CO2 emissions from ethanol combustionCarbon in
ethanol Carbon in kernels
Chang
e in so
il
carb
on Effecti
ve vi
a pric
e
signa
lDGS
Direct land use change
Indirect land use changes for other crops and in other
regions
Go to ”Insert (View) | Header and Footer" to add your organization, sponsor,
meeting name here; then, click "Apply to All"
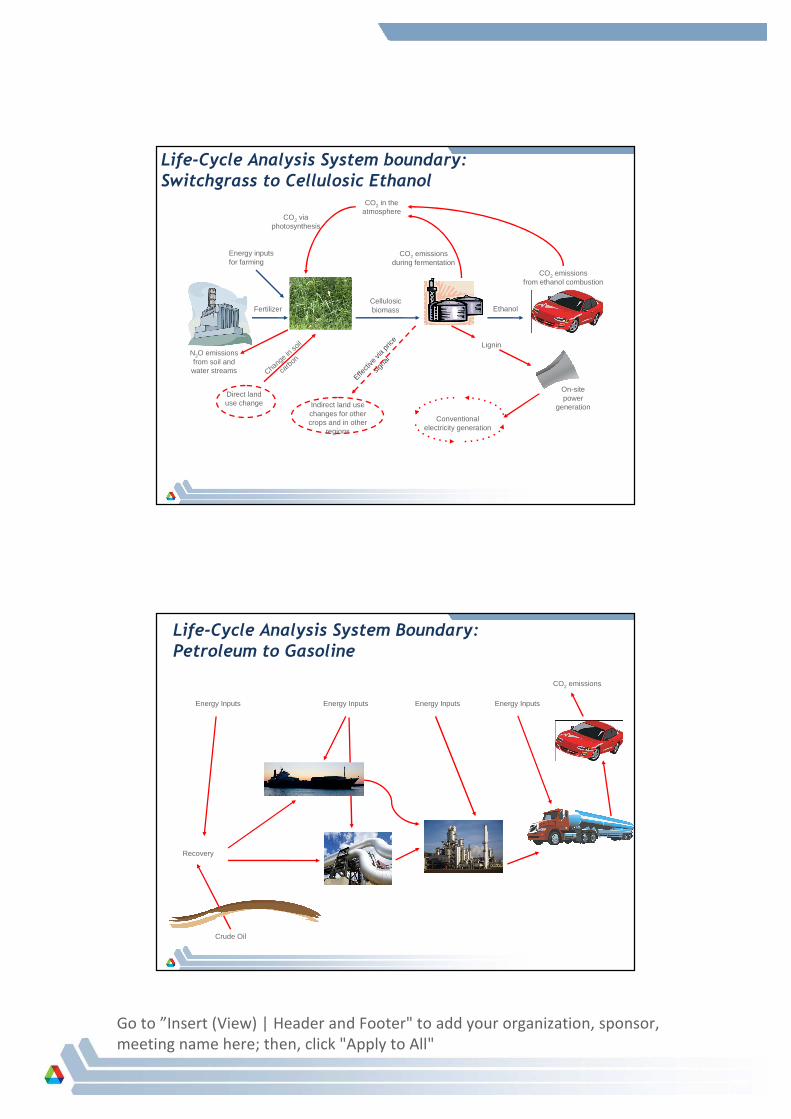
Life-Cycle Analysis System boundary:Switchgrass to Cellulosic Ethanol
Conventional electricity generation
CO2 in the atmosphere
CO2 via photosynthesis
Cellulosic biomass Ethanol
CO2 emissions from ethanol combustion
CO2 emissions during fermentation
Energy inputs for farming
Fertilizer
N2O emissions from soil and
water streams Chang
e in so
il
carb
onEffe
ctive
via
price
signa
l
Lignin
On-site power
generation
Direct land use change Indirect land use
changes for other crops and in other
regions
Life-Cycle Analysis System Boundary: Petroleum to Gasoline
CO2 emissions
Energy Inputs
Recovery
Crude Oil
Energy Inputs Energy Inputs Energy Inputs
Go to ”Insert (View) | Header and Footer" to add your organization, sponsor,
meeting name here; then, click "Apply to All"
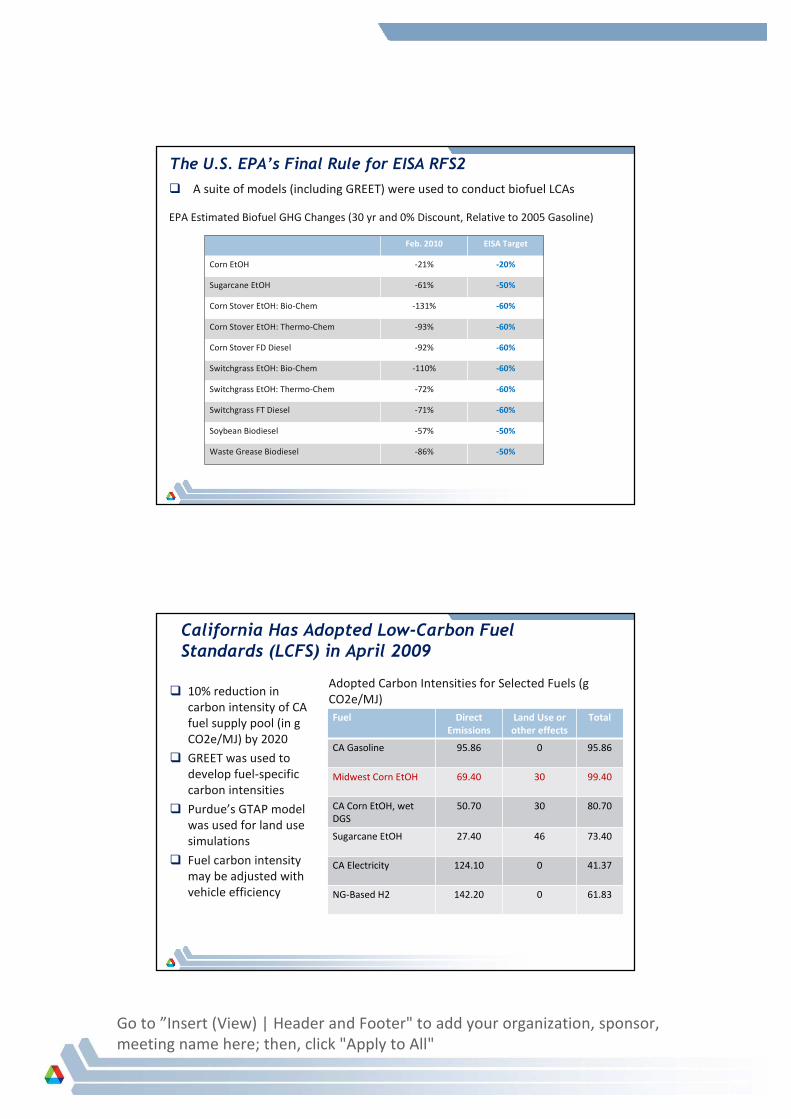
The U.S. EPA’s Final Rule for EISA RFS2
� A suite of models (including GREET) were used to conduct biofuel LCAs
Feb. 2010 EISA Target
Corn EtOH -21% -20%
Sugarcane EtOH -61% -50%
Corn Stover EtOH: Bio-Chem -131% -60%
Corn Stover EtOH: Thermo-Chem -93% -60%
Corn Stover FD Diesel -92% -60%
Switchgrass EtOH: Bio-Chem -110% -60%
Switchgrass EtOH: Thermo-Chem -72% -60%
Switchgrass FT Diesel -71% -60%
Soybean Biodiesel -57% -50%
Waste Grease Biodiesel -86% -50%
EPA Estimated Biofuel GHG Changes (30 yr and 0% Discount, Relative to 2005 Gasoline)
California Has Adopted Low-Carbon Fuel Standards (LCFS) in April 2009
� 10% reduction in
carbon intensity of CA
fuel supply pool (in g
CO2e/MJ) by 2020
� GREET was used to
develop fuel-specific
carbon intensities
� Purdue’s GTAP model
was used for land use
simulations
� Fuel carbon intensity
may be adjusted with
vehicle efficiency
Fuel Direct
Emissions
Land Use or
other effects
Total
CA Gasoline 95.86 0 95.86
Midwest Corn EtOH 69.40 30 99.40
CA Corn EtOH, wet
DGS
50.70 30 80.70
Sugarcane EtOH 27.40 46 73.40
CA Electricity 124.10 0 41.37
NG-Based H2 142.20 0 61.83
Adopted Carbon Intensities for Selected Fuels (g
CO2e/MJ)
Go to ”Insert (View) | Header and Footer" to add your organization, sponsor,
meeting name here; then, click "Apply to All"
Key Issues Affecting Biofuel WTW Results
� Continued technology advancements� Agricultural farming: continued crop yield increase and resultant reduction of
energy and chemical inputs per unit of yield
� Energy use in ethanol plants: reduction in process fuel use and switch of process
fuel types
� Methods of estimating emission credits of co-products
of ethanol
� Direct and indirect land use changes and resulted GHG
emissions
� Life-cycle analysis methodologies� Attributional LCA
� Consequential LCA
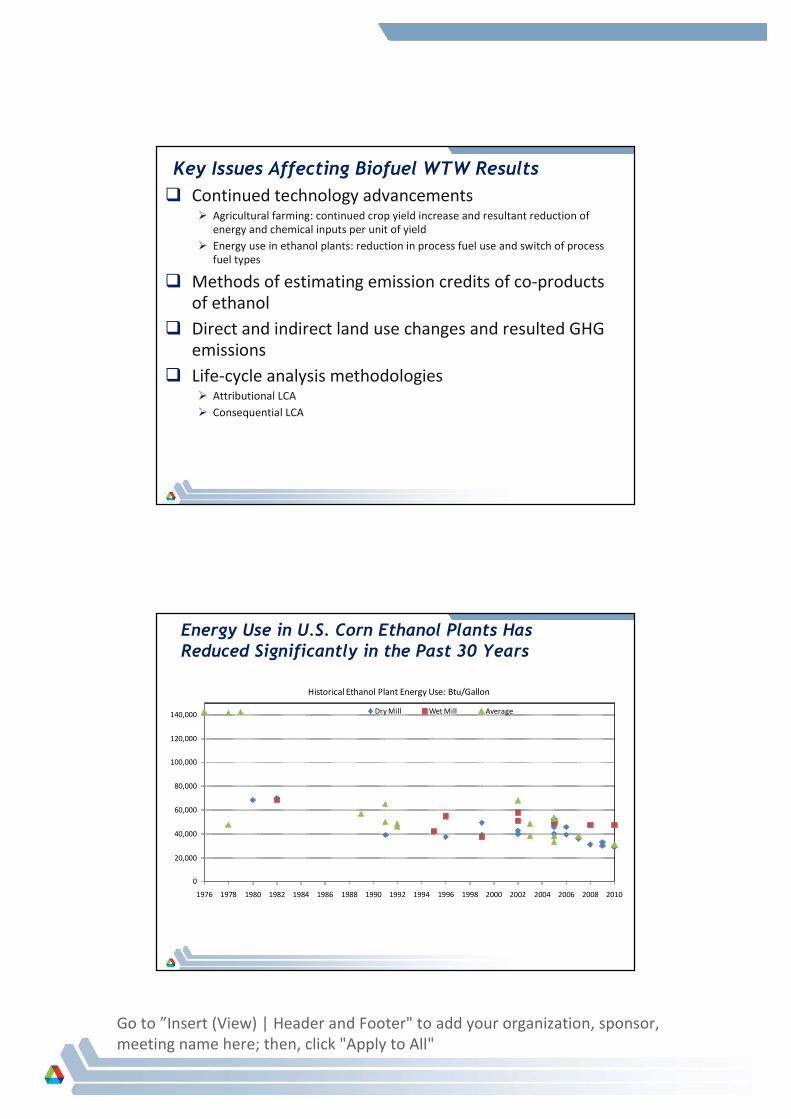
0
20,000
40,000
60,000
80,000
100,000
120,000
140,000
1976 1978 1980 1982 1984 1986 1988 1990 1992 1994 1996 1998 2000 2002 2004 2006 2008 2010
Dry Mill Wet Mill Average
Historical Ethanol Plant Energy Use: Btu/Gallon
Energy Use in U.S. Corn Ethanol Plants Has Reduced Significantly in the Past 30 Years
Go to ”Insert (View) | Header and Footer" to add your organization, sponsor,
meeting name here; then, click "Apply to All"
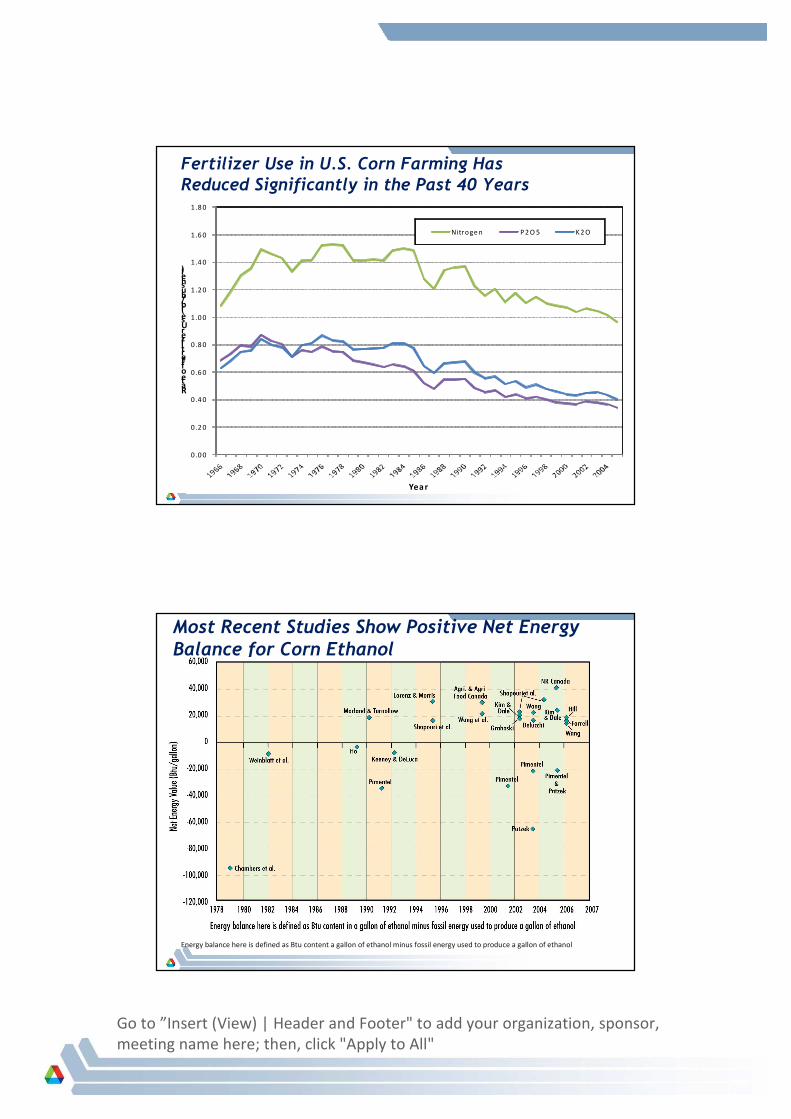
0 .0 0
0 .2 0
0 .4 0
0 .6 0
0 .8 0
1 .0 0
1 .2 0
1 .4 0
1 .6 0
1 .8 0
Rate of Fertilizer Use (lb/bushel)
Year
Nitroge n P 2 O 5 K 2 O
Fertilizer Use in U.S. Corn Farming Has Reduced Significantly in the Past 40 Years
Most Recent Studies Show Positive Net Energy Balance for Corn Ethanol
Energy balance here is defined as Btu content a gallon of ethanol minus fossil energy used to produce a gallon of ethanol
Go to ”Insert (View) | Header and Footer" to add your organization, sponsor,
meeting name here; then, click "Apply to All"
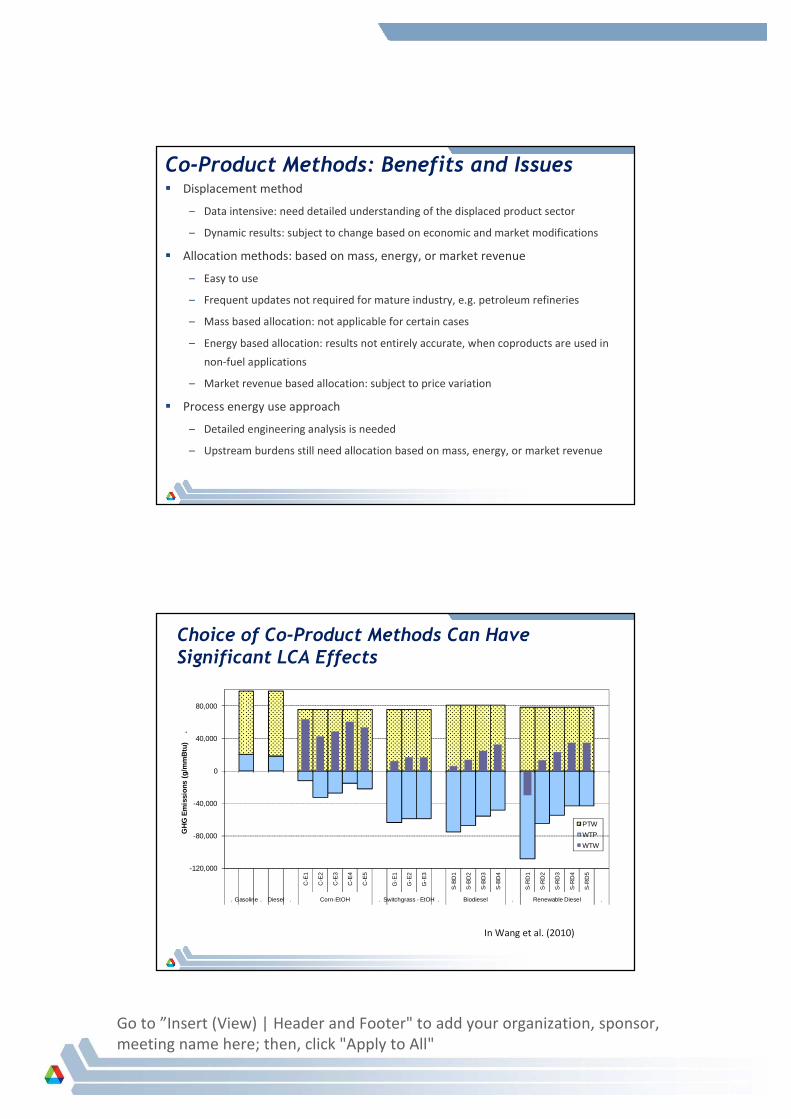
Co-Product Methods: Benefits and Issues � Displacement method
– Data intensive: need detailed understanding of the displaced product sector
– Dynamic results: subject to change based on economic and market modifications
� Allocation methods: based on mass, energy, or market revenue
– Easy to use
– Frequent updates not required for mature industry, e.g. petroleum refineries
– Mass based allocation: not applicable for certain cases
– Energy based allocation: results not entirely accurate, when coproducts are used in
non-fuel applications
– Market revenue based allocation: subject to price variation
� Process energy use approach
– Detailed engineering analysis is needed
– Upstream burdens still need allocation based on mass, energy, or market revenue
Choice of Co-Product Methods Can Have Significant LCA Effects
-120,000
-80,000
-40,000
0
40,000
80,000
C-E
1
C-E
2
C-E
3
C-E
4
C-E
5
G-E
1
G-E
2
G-E
3
S-B
D1
S-B
D2
S-B
D3
S-B
D4
S-R
D1
S-R
D2
S-R
D3
S-R
D4
S-R
D5
. Gasoline . Diesel . Corn-EtOH . Switchgrass - EtOH . Biodiesel . Renewable Diesel .
GH
G E
mis
sion
s (g
/mm
Btu
)
.
PTW
WTP
WTW
In Wang et al. (2010)
Go to ”Insert (View) | Header and Footer" to add your organization, sponsor,
meeting name here; then, click "Apply to All"
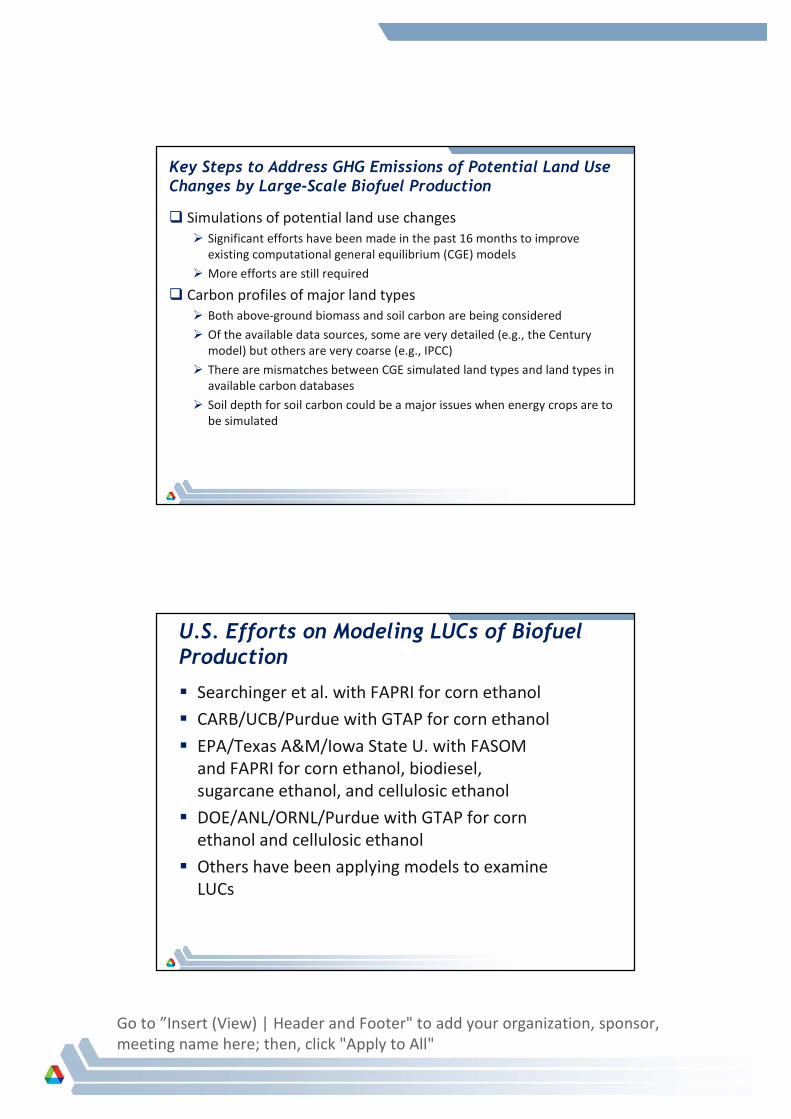
Key Steps to Address GHG Emissions of Potential Land Use Changes by Large-Scale Biofuel Production
� Simulations of potential land use changes
� Significant efforts have been made in the past 16 months to improve
existing computational general equilibrium (CGE) models
� More efforts are still required
� Carbon profiles of major land types
� Both above-ground biomass and soil carbon are being considered
� Of the available data sources, some are very detailed (e.g., the Century
model) but others are very coarse (e.g., IPCC)
� There are mismatches between CGE simulated land types and land types in
available carbon databases
� Soil depth for soil carbon could be a major issues when energy crops are to
be simulated
U.S. Efforts on Modeling LUCs of Biofuel Production
� Searchinger et al. with FAPRI for corn ethanol
� CARB/UCB/Purdue with GTAP for corn ethanol
� EPA/Texas A&M/Iowa State U. with FASOM
and FAPRI for corn ethanol, biodiesel,
sugarcane ethanol, and cellulosic ethanol
� DOE/ANL/ORNL/Purdue with GTAP for corn
ethanol and cellulosic ethanol
� Others have been applying models to examine
LUCs
Go to ”Insert (View) | Header and Footer" to add your organization, sponsor,
meeting name here; then, click "Apply to All"
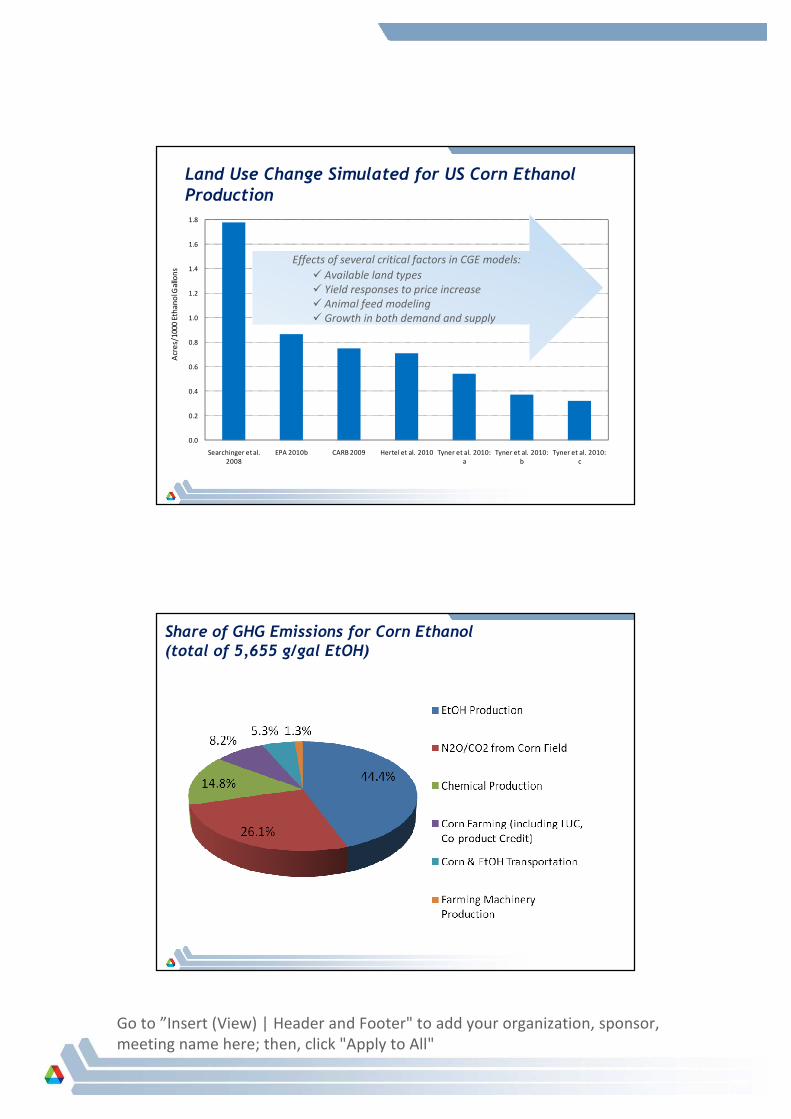
Land Use Change Simulated for US Corn Ethanol Production
0.0
0.2
0.4
0.6
0.8
1.0
1.2
1.4
1.6
1.8
Searchinger et al.
2008
EPA 2010b CARB 2009 Hertel et al. 2010 Tyner et al. 2010:
a
Tyner et al. 2010:
b
Tyner et al. 2010:
c
Acr
es/
10
00
Eth
an
ol G
allo
ns
Effects of several critical factors in CGE models:
� Available land types
� Yield responses to price increase
� Animal feed modeling
� Growth in both demand and supply
Share of GHG Emissions for Corn Ethanol (total of 5,655 g/gal EtOH)
Go to ”Insert (View) | Header and Footer" to add your organization, sponsor,
meeting name here; then, click "Apply to All"
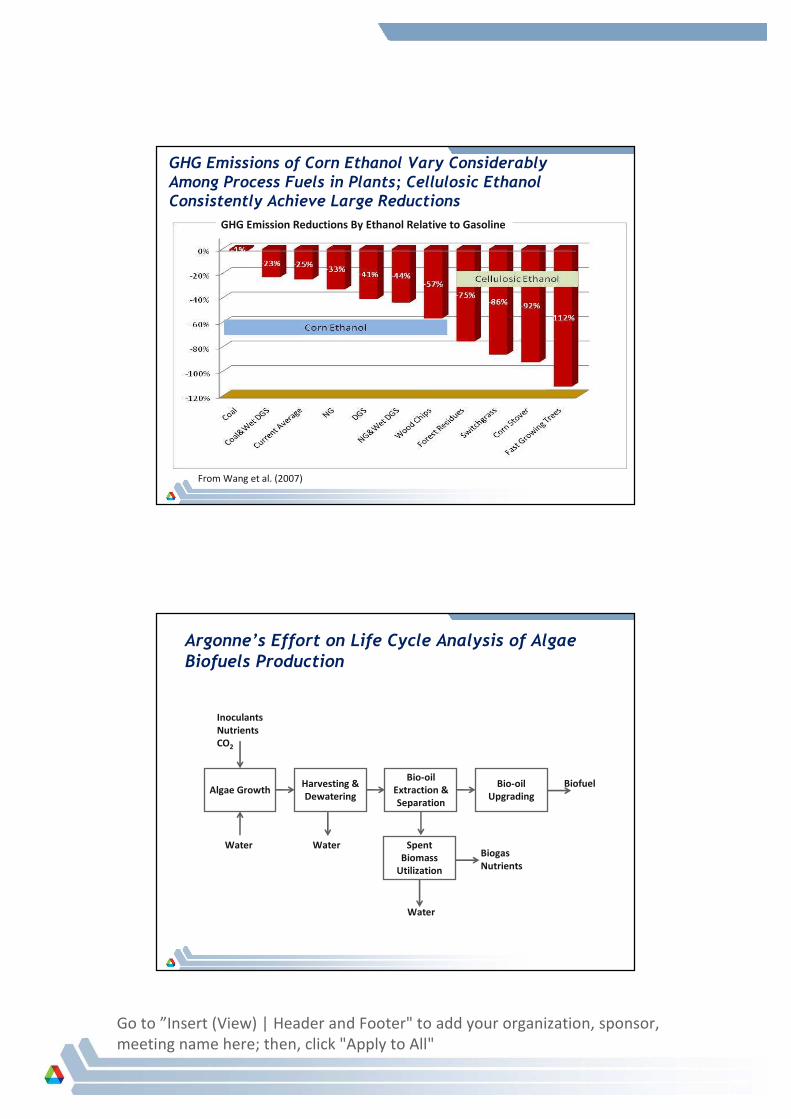
GHG Emissions of Corn Ethanol Vary Considerably Among Process Fuels in Plants; Cellulosic Ethanol Consistently Achieve Large Reductions
From Wang et al. (2007)
GHG Emission Reductions By Ethanol Relative to Gasoline
Argonne’s Effort on Life Cycle Analysis of Algae Biofuels Production
Algae GrowthHarvesting &
Dewatering
Bio-oil
Extraction &
Separation
Spent
Biomass
Utilization
Bio-oil
Upgrading
Biofuel
WaterWater
Inoculants
Nutrients
CO2
Water
Biogas
Nutrients
Go to ”Insert (View) | Header and Footer" to add your organization, sponsor,
meeting name here; then, click "Apply to All"
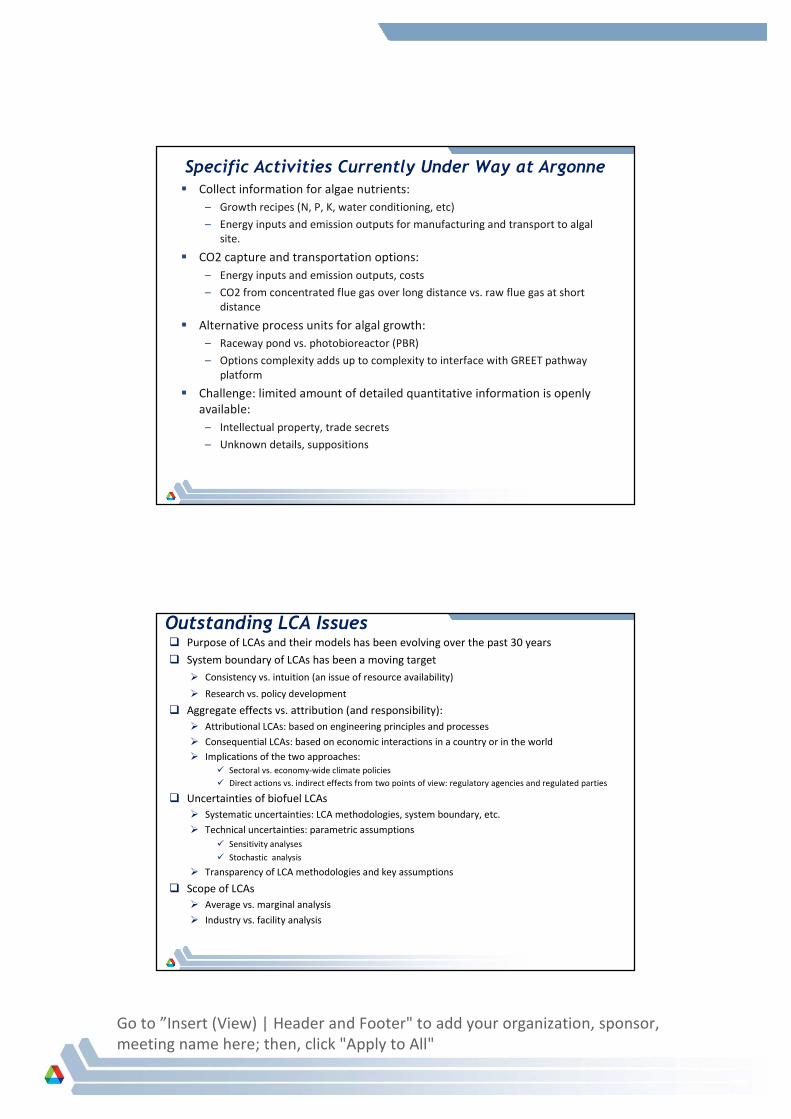
Specific Activities Currently Under Way at Argonne� Collect information for algae nutrients:
– Growth recipes (N, P, K, water conditioning, etc)
– Energy inputs and emission outputs for manufacturing and transport to algal
site.
� CO2 capture and transportation options:
– Energy inputs and emission outputs, costs
– CO2 from concentrated flue gas over long distance vs. raw flue gas at short
distance
� Alternative process units for algal growth:
– Raceway pond vs. photobioreactor (PBR)
– Options complexity adds up to complexity to interface with GREET pathway
platform
� Challenge: limited amount of detailed quantitative information is openly
available:
– Intellectual property, trade secrets
– Unknown details, suppositions
Outstanding LCA Issues� Purpose of LCAs and their models has been evolving over the past 30 years
� System boundary of LCAs has been a moving target
� Consistency vs. intuition (an issue of resource availability)
� Research vs. policy development
� Aggregate effects vs. attribution (and responsibility):
� Attributional LCAs: based on engineering principles and processes
� Consequential LCAs: based on economic interactions in a country or in the world
� Implications of the two approaches:
� Sectoral vs. economy-wide climate policies
� Direct actions vs. indirect effects from two points of view: regulatory agencies and regulated parties
� Uncertainties of biofuel LCAs
� Systematic uncertainties: LCA methodologies, system boundary, etc.
� Technical uncertainties: parametric assumptions
� Sensitivity analyses
� Stochastic analysis
� Transparency of LCA methodologies and key assumptions
� Scope of LCAs
� Average vs. marginal analysis
� Industry vs. facility analysis
Go to ”Insert (View) | Header and Footer" to add your organization, sponsor,
meeting name here; then, click "Apply to All"
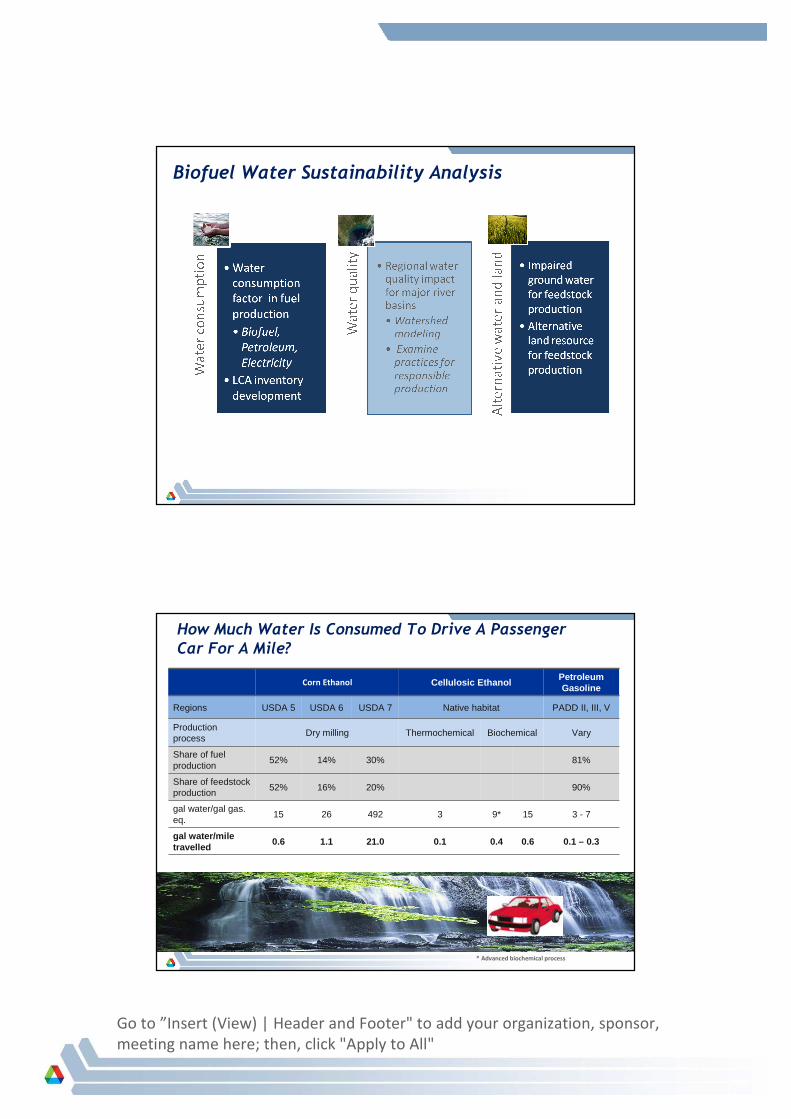
Biofuel Water Sustainability Analysis
How Much Water Is Consumed To Drive A Passenger Car For A Mile?
Corn Ethanol Cellulosic EthanolPetroleum Gasoline
Regions USDA 5 USDA 6 USDA 7 Native habitat PADD II, III, V
Production process
Dry milling Thermochemical Biochemical Vary
Share of fuel production
52% 14% 30% 81%
Share of feedstock production
52% 16% 20% 90%
gal water/gal gas. eq.
15 26 492 3 9* 15 3 - 7
gal water/mile travelled
0.6 1.1 21.0 0.1 0.4 0.6 0.1 – 0.3
* Advanced biochemical process
Go to ”Insert (View) | Header and Footer" to add your organization, sponsor,
meeting name here; then, click "Apply to All"
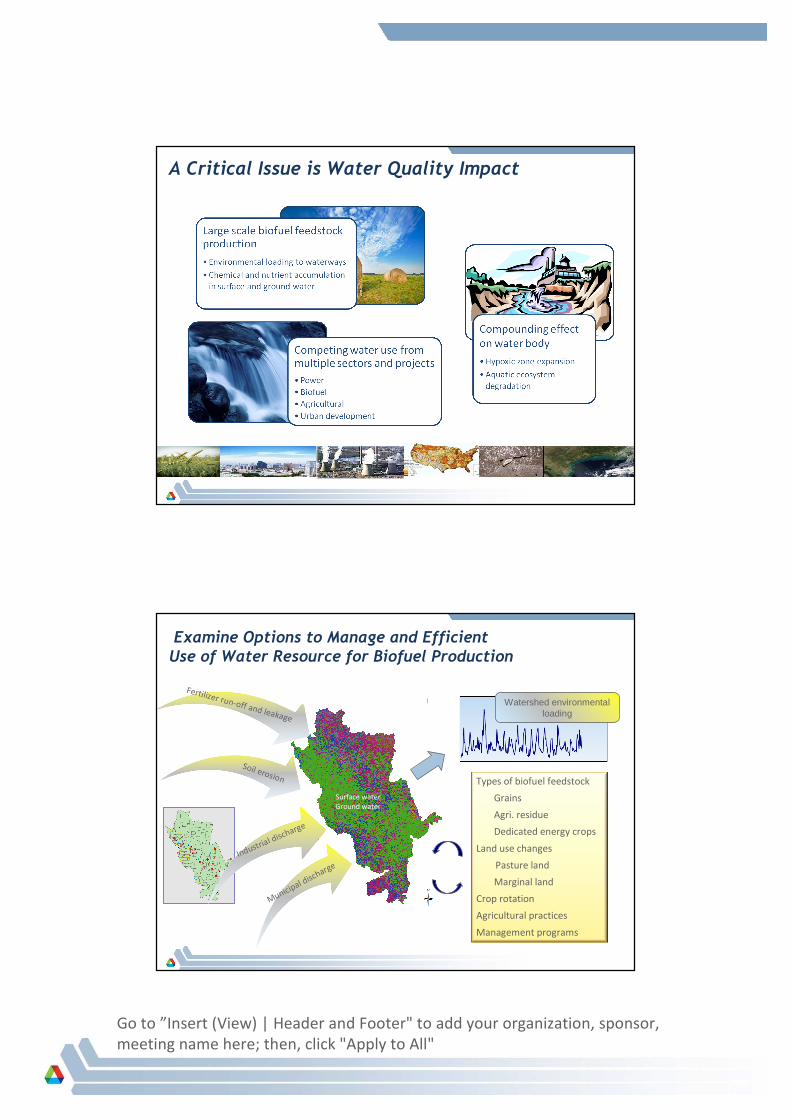
A Critical Issue is Water Quality Impact
Examine Options to Manage and Efficient Use of Water Resource for Biofuel Production
Types of biofuel feedstock
Grains
Agri. residue
Dedicated energy crops
Land use changes
Pasture land
Marginal land
Crop rotation
Agricultural practices
Management programs
Watershed environmental loading
Soil erosion
Surface water
Ground water
Industrial discharge
Municipal discharge
Fertilizer run-off and leakage