Embed Size (px)
Citation preview
MORPHOLOGICAL STUDY OF A SMALL TOWN‐ BARKUR IN COASTAL KARNATAKA, INDIA
Cha
pter
: PE
RC
EP
TIO
N A
ND
CO
GN
ITIO
N A
NA
LYSI
S
127
6 PERCEPTION AND COGNITION ANALYSIS
A preliminary survey of 30 people was conducted which included name, income,
place of residence, occupation, family size and opinion of Barkur. This enabled to
identify the landmarks and sectors of reference made by people. Also it helped to
develop logical method to do detailed survey. As explained in the methodology
the questionnaire tried to address the operative perception, responsive perception
and inferential perception. After this understanding a further elaborate
questionnaire survey was done with 80 people. People from various parts of
Barkur were randomly selected. Care was taken that variety in age, religion, place
of residence; occupation was there as much as possible.
The questionnaire consisted of 4 parts.
The first part takes the profile of the person: the name, age, qualification,
occupation, number of years in Barkur, place of birth, family size, and place
of residence and place of work.
The second part asks them to draw the map of the town with the key
features marked and important names of places.
The third part talks of the places in their daily life, places of visit for social
life, religious purposes, education, work and shops and other requirements.
They were also asked about places which they like the most what they
wanted to change in Barkur and what about Barkur should not change.
The last part showed 18 photographs of Barkur, which included views of
main road, views of important landmarks, views of small elements of historic
importance, views of landscape features, views of tanks, interior views of
temples and landmarks.
Each of the parts was used to give an idea of knowledge and association of the
town with the people

MORPHOLOGICAL STUDY OF A SMALL TOWN‐ BARKUR IN COASTAL KARNATAKA, INDIA
Cha
pter
: PE
RC
EPT
ION
AN
D C
OG
NIT
ION
AN
ALY
SIS
128
The pilot survey made it possible to define the types of variables to be included in
the detailed questionnaire i.e. age, place of residence, familiarity with the town.
The other variables of income, religion, profession were neglected as they seem
to have less influence on the cognition of the town. The key aspects of daily
routine were identified as residence, workplace, commercial area for daily needs,
and religious institutions. Kote and Kathale Basadi were identified as landmarks or
places of pride for Barkur rather than places to visit or refer for movement in the
town. The photographic survey included details along the street as well as
elevations of structures, old as well as new areas of Barkur, landscape elements
as well as manmade elements.
6.1 Profile of the people in detailed survey
The people selected were such that they were using the town independently and
were able to take decisions about the way they move in town and use the
facilities. Hence the age group below 15years is not seen, as they will be
dependent on the parents to visit places of the town. The population of town is
7000 with 1200 households and another 2000 visitors, the people visiting and
using the town in the day-to day activities would be in the age groups of 15-60
years where people above 60 were only 2-3 hence the conclusions of that
category was neglected. Also the aim was to identify the working of the town for
the daily routine so the people not residing in the town on daily basis were
neglected. Effectively the people studied were around 3000-4000 of which 80
were picked from all parts of town with as much variety as possible in terms of
age, occupation, income group and place of residence and work within the town.
Hence the sample size is to ensure more than 10 in each category and sourced
from all parts of town as well as different user groups and different household.
The individual parameters are of less concern in the study whereas the overall
cognition and characteristics of the town is the main concern hence 110 sample
size seems adeqate to represent the overall population.

had
ext
diff
tha
res
par
6.2
MORP
The param
d been se
tent. The n
ficult to giv
at the age g
sidence in .
Figure 6-1: B
The bar
rameters o
2 Analys
50
sex
Fam
iliar
ity w
ith th
e to
wn
Pla
ce o
f
resi
denc
e
PHOLOGICAL S
meter of re
een in sam
numbers o
ve decisive
groups are
.5km of Old
Bar Chart sho
chart show
of religion, s
sis of ske
in barkur
in bark
o
0‐5y
5‐10 y
10‐20 y
20‐30 y
30‐50 y
0 and above y
STUDY OF A S
eligion and
mple survey
of persons
e conclusio
e almost ev
d Barkur do
owing the pro
ws the dis
sex, familia
etch map
r within 0.5km
ur within 1km
outside Barkur
ears in Barkur
ears in Barkur
ears in Barkur
ears in Barkur
ears in Barkur
ears in Barkur
male
female
SMALL TOWN
sex was n
y that it di
in religion
on along th
venly distrib
oes not ha
ofile of people
stribution
arity with th
p
0 10
m
m
r
r
r
r
r
r
r
e
e
N‐ BARKUR IN
ot conside
id not affe
n after ran
hese param
buted in al
ave 15-25 y
e questioned
of differen
he town, pl
20 30
N COASTAL KA
red for det
ect the res
ndom sam
meters. Th
ll paramete
years age g
in detailed qu
nt age gro
ace of resi
40 50
ARNATAKA, IN
tailed analy
ponses to
pling also
e bar char
ers except
group.
uestionnaire.
oups acros
idence.
15‐24
25‐44
45‐59
60‐10
NDIA
ysis as it
a large
make it
rt shows
place of
ss other
4
4
9
00
Cha
pter
: PE
RC
EP
TIO
N A
ND
CO
GN
ITIO
N A
NA
LYS
IS
129

MORPHOLOGICAL STUDY OF A SMALL TOWN‐ BARKUR IN COASTAL KARNATAKA, INDIA
Cha
pter
: PE
RC
EPT
ION
AN
D C
OG
NIT
ION
AN
ALY
SIS
130
6.2.1 Accuracy of sketch map: The people in Barkur were asked to sketch the map of town in their own way
pointing key landmarks. The maps were analyzed for accuracy in terms of name,
location, route geometry and distance proportion and this was multiplied by the
number of places identified. Some examples are as follows:

MORPHOLOGICAL STUDY OF A SMALL TOWN‐ BARKUR IN COASTAL KARNATAKA, INDIA
Cha
pter
: PE
RC
EPT
ION
AN
D C
OG
NIT
ION
AN
ALY
SIS
131
Table 6-1: Table showing how the calculation for points for accuracy was done for the examples
num
ber
of
ques
tionn
aire
age
resi
dent
no
of
year
s us
ing
num
ber
of
ques
tionn
aire
na
me
loca
tion
rout
e
dist
ance
accu
racy
nu
mbe
r of
pl
aces
to
tal
poin
ts
in a
ccur
acy Sketch map
60 25-45 1 30-
50 60 N L R D 1 8 8
57 60-80 2
50-… 57 N L R D 2 16 32
41 15-25 2 20-
30 41 N L R D 3 19 57
27 45-60
2 30-50
27 N L R D 4 17 68
Overall in sketch map age group 60-80 years who have spent a long time in
Barkur have scored well in terms sketch map and accuracy. Age group 15-25 has

MORPHOLOGICAL STUDY OF A SMALL TOWN‐ BARKUR IN COASTAL KARNATAKA, INDIA
Cha
pter
: PE
RC
EPT
ION
AN
D C
OG
NIT
ION
AN
ALY
SIS
132
also done well. The least is scored by the category of people residing beyond 1km
radius of Barkur town. (Residence 3) as shown in the chart below.
Table 6-2: Table showing the level of accuracy scores in each category for sketch map
sketch map and accuracy
CATEGORY NO. OF PEOPLE
Avg. no of places
accuracy of 3-4 in %
avg. score
highest score
score below 10 in %
score above 30 in %
As per age group 15-25 19 9.4 47.0 23.2 57.0 21.0 42.0 25-45 36 7.9 36.0 17.4 45.0 47.0 17.0 45-60 21 10.3 47.0 26.9 68.0 42.9 38.0 60-80 4 12.8 50.0 30.3 57.0 25.0 50.0
As per place of residence 1-IN KACCHUR 23 9.3 47.8 22.2 48.0 30.0 39.0 2- WITHIN 1KM 33 10.0 45.5 24.0 68.0 30.0 42.4 3- BEYOND 1KM 24 6.6 29.2 10.9 39.0 58.0 4.0
As per familiarity of the town 0-10 YRS 5 7.8 40.0 16.6 32.0 40.0 40.0 10-20 YRS 13 6.9 38.5 15.3 39.0 40.0 30.1 20-30 YRS 25 7.9 40.0 19.8 57.0 32.0 28.0 30-50YRS 28 8.4 29.3 19.3 68.0 25.0 42.9 50 AND ABOVE 9 12.8 55.5 26.4 57.0 55.6 33.3
OVERALL 80 8.13 41.25 19.4 68 37.5 30
Places identified in sketch plan:
Table 6-3: Table showing number of places identified in each category in sketch plan
CATEGORY NO. OF
PEOPLE avg. no of
place avg.
score highest no of
places highest
score As per age group 15-25 19 9.2 54.8 19.0 96.0 25-45 36 9.7 49.9 17.0 121.0 45-60 21 10.8 61.0 18.0 113.0 60-80 4 11.8 65.3 19.0 102.0
As per place of residence 1-IN
KACCHUR 23 9.2 52.1 23.0 121.0 2- WITHIN
1KM 33 9.6 53.2 19.0 102.0 3- BEYOND 24 5.5 31.9 18.0 113.0

MORPHOLOGICAL STUDY OF A SMALL TOWN‐ BARKUR IN COASTAL KARNATAKA, INDIA
Cha
pter
: PE
RC
EPT
ION
AN
D C
OG
NIT
ION
AN
ALY
SIS
133
1KM
As per familiarity with the town 0-10 YRS 5 7.8 45.6 16.0 96.0 10-20 YRS 13 6.9 41.2 13.0 83.0 20-30 YRS 25 8.2 47.3 23.0 121.0 30-50YRS 28 8.4 44.4 17.0 92.0 50 AND
ABOVE 9 10.2 59.2 18.0 113.0
OVERALL 80 8.25 46.5 23 121
Overall in sketch map age group 60-80 years and 45-60 years who have
spent a long time in Barkur have scored well in terms sketch map and importance
of places. The least is scored by the category of people residing beyond 1km
radius of Barkur town (residence 3) and people who have been using Barkur for
10-20years as shown in the table above.
Later the sketch plan was analyzed for the places identified by people, which
came up to be around 24 landmarks, which had importance as per history and
religion. The number written next to the names of places relates to the importance
of the place in history rated by historian Dr. Jagdeesh Shetty(H.O.D history in Poorna Pradnya
College, Udupi)
Table 6-4: Identification of landmarks as per sketch map- overall, as per age group, as per place of residence, as per familiarity of town
cate
gory
Panc
halin
gesh
war
a -
10
Bha
tta
Vina
yaka
tem
ple-
10
Kal
chap
ra- 1
0
Ben
neku
dra-
08
Kat
hale
Bas
adi -
08
Kal
ikha
mba
-08
Veer
abad
ra -0
7
Som
nath
eshw
ara
tem
ple
07Pa
ncha
linge
shw
ara
tem
ple
07w
ater
tank
s- 0
7
Kac
chur
N
ages
hwar
-
06
chur
ch 0
6
Sant
he- 0
6
fort
Kot
e- 0
6
Ran
gana
keri-
05
Jann
arda
na K
oodl
e -
05
Sim
hasa
na G
udde
- 05
Mas
tiam
ma
tem
ple-
04
Hos
aker
i G
anap
ati
Tem
ple
- 04
Som
nath
eshw
ara
tem
ple
04Ve
nugo
palk
rishn
a
tem
ple
04B
abbu
Swam
y/
Mal
atid
evi t
empl
e- 0
4
Ban
dar K
eri M
atta
- 04
Bra
hma
Bad
raka
li
Gar
di- 0
4
ove
rall
54%
64%
65%
44%
23%
31%
11%
19%
23%
23%
13%
28%
10%
10%
1%
4%
13%
8%
4%
8%
8%
9%
1%
3%
Classification as per age group in years
15-25
68%
68%
74%
47%
32%
37%
11%
26%
26%
16%
5%
32%
16%
5%
0%
5%
16%
11%
5%
5%
5%
11%
0%
0%
25-45
44%
58%
56%
44%
17%
19%
8%
14%
17%
17%
8%
28%
6%
8%
0%
0%
8%
6%
3%
6%
6%
8%
0%
0%
45-60
52%
67%
67%
38%
19%
43%
14%
24%
29%
29%
24%
24%
14%
14%
0%
5%
19%
5%
0%
5%
10%
5%
0%
10%
60-100
75%
75%
100%
50%
50%
50%
25%
0%
25%
75%
25%
25%
0%
25%
25%
25%
0%
25%
25%
50%
25%
25%
25%
0%
Classification as per location of residence in km

MORPHOLOGICAL STUDY OF A SMALL TOWN‐ BARKUR IN COASTAL KARNATAKA, INDIA
Cha
pter
: PE
RC
EP
TIO
N A
ND
CO
GN
ITIO
N A
NA
LYSI
S
134
stay in Kacchur
61%
74%
61%
43%
22%
26%
22%
26%
26%
30%
17%
61%
17%
9%
0%
0%
22%
9%
4%
13%
9%
13%
0%
4%
stay within 1km
61%
67%
82%
48%
27%
42%
6%
24%
27%
33%
15%
15%
6%
12%
3%
6%
15%
9%
3%
9%
9%
9%
3%
0%
stay beyond 1km
38%
50%
46%
38%
17%
21%
8%
4%
13%
0%
4%
13%
8%
8%
0%
4%
0%
4%
4%
0%
4%
4%
0%
4%
Classification as per familiarity of town in years
0-10
40%
80%
60%
80%
0%
0%
20%
20%
20%
0%
20%
20%
0%
0%
0%
0%
20%
20%
40%
20%
20%
40%
0%
0%
10-20
54%
54%
54%
38%
23%
38%
8%
38%
23%
0%
8%
0%
0%
0%
0%
0%
8%
0%
0%
8%
0%
0%
0%
0%
20-30
56%
56%
60%
28%
20%
32%
16%
16%
20%
28%
16%
32%
8%
4%
0%
4%
12%
12%
0%
0%
8%
8%
0%
0%
30-50
46%
64%
68%
39%
14%
25%
0%
7%
18%
18%
4%
32%
14%
11%
0%
0%
14%
0%
0%
4%
4%
7%
0%
0%
50-above
67%
67%
67%
56%
44%
44%
33%
33%
44%
67%
33%
22%
0%
33%
11%
22%
0%
22%
11%
33%
22%
11%
11%
22%
Table 6-5: Identification of nodes, boundaries and districts- overall, as per age group, as per location of residence, as per familiarity of town.
category river
fron
t/ na
ture
04
shop
s an
d ot
her f
acili
ties
of to
wn
03
loca
litie
s/vi
llage
nam
es 0
3
othe
rs 0
3
Her
adi r
oad
Mud
uker
i roa
d
Bra
hmav
ara
road
chur
ch/ p
anch
ayat
roa
d
rath
a-be
edi r
oad
Ben
neku
dra
road
saib
raka
tte ro
ad
link
to c
hurc
h ro
ad
people 15% 51% 39% 54% 54% 38% 74% 13% 58% 29% 58% 10%
Classification as per age group in years
15-25 11% 42% 32% 89% 37% 26% 37% 21% 84% 16% 26% 5%
25-45 14% 56% 36% 44% 33% 19% 47% 11% 47% 17% 39% 11%
45-60 19% 43% 29% 43% 48% 24% 62% 10% 52% 14% 52% 5%
60-100 25% 100% 100% 25% 0% 25% 100% 25% 50% 25% 25% 0%
Classification as per location of residence in km
stay in Kacchur 22% 70% 35% 74% 22% 13% 70% 9% 87% 13% 30% 9%
stay within 1km 9% 64% 52% 58% 55% 36% 45% 24% 52% 24% 42% 9%
stay beyond 1km 17% 17% 25% 29% 33% 13% 42% 4% 38% 8% 33% 4%

Clas
0-10
10-2
20-3
30-5
50-a
an
ac
na
37
13
by
sk
1234567
F1
MORP
ssification as per fam
20%
0 8%
30 12%
50 18%
above 22%
Figu(Eac
d amount it is
The grap
cts as refer
ame where
7persons,
3persons, S
y 34person
ketch by so
65 64
010203040506070
Kalchapra‐ 10
bhatta vinayaka…
FIRST HIERARC100-50%
PHOLOGICAL S
miliarity of town in yea
20% 80%
23% 8%
56% 20%
54% 43%
56% 89%
ure 6.2: Graphch number nes active in pre
ph clearly s
rence for t
e Brahmav
Church ro
Saibrakatte
ns, Muduk
ome as chu
59 54 54 5
brahmavar
Panchalingeshwa…
othe
rs 03
shop
sand
othe
r
CHY
STUDY OF A S
ars
40% 0% 20%
38% 69% 31%
80% 36% 24%
43% 36% 18%
11% 0% 22%
h showing thext to the naesent times i
shows that
he people
vara road w
oad/pancha
e by 37per
keri road b
urch link ro
51 46 46 44
shop
s and
other…
rathabeedi
saibrakatte
bene
kudre‐ 08
SECOND HI49-30%
SMALL TOWN
60% 0% 2
69% 0% 3
44% 16% 4
54% 18% 6
33% 22% 6
e % number ome of the plan the scale of
t the roads
of the tow
was identifi
ayat road
rsons, Hera
by 24perso
ad which f
4 43 3931
bene
kudre
08
mandarthi
localities/village…
kalikam
ba ‐0
8
ERARCHY
N‐ BARKUR IN
20% 0% 20%
31% 8% 38%
48% 20% 36%
64% 21% 54%
67% 11% 11%
of people whoace gives impf 1-10)
s are the m
wn. There a
ed by 47pe
by 11per
adi road/ M
ons. The
urther led t
30 28 23mud
ukere
church 06
kathale basadi ‐0
8
N COASTAL KA
0%
0%
8%
7%
11%
o identified eportance of th
most identif
are seven
ersons, Ra
rsons, Ben
Mandarthi r
eighth roa
to Simhasa
23 23 23 1
chou
likerep
ancha…
water ta
nks‐ 07
benn
ekud
ra
Mud
ukere
ARNATAKA, IN
ach place he place as p
fied elemen
roads iden
atha-beedi
nnekudra
road was id
ad was ma
ana Gudde
19 15 13 13
Mud
ukere…
riverfron
t/…
Kacchu
r…
Simhasana…
THIRD HIERAR29-15%
NDIA
per history
nt which
ntified by
road by
road by
dentified
arked in
e.
3 11 10
Simhasana…
veerabadra ‐0
7
santhe
‐ 06
RCHY
Cha
pter
: PE
RC
EP
TIO
N A
ND
CO
GN
ITIO
N A
NA
LYS
IS
135

MORPHOLOGICAL STUDY OF A SMALL TOWN‐ BARKUR IN COASTAL KARNATAKA, INDIA
Cha
pter
: PE
RC
EPT
ION
AN
D C
OG
NIT
ION
AN
ALY
SIS
136
Figure 6-2: Bar chart of the number of people identifying the main roads in each parameter
1st hierarchy places identified by 50% and above: The places or landmarks
most identified are Bhatt Vinayaka temple (51persons), Kalchapra
(52persons),Next most popular landmarks are Panchalingeshwara temple
(43persons),all shops and facilities put together (41persons), all other landmarks
put together (43persons). In other landmarks the places identified were Ram
Mandir, Gopal Krishna temple, some popular houses, offices used by individuals,
one own residence.
2nd hierarchy places identified by 30%-49%:Next hierarchy come Bennekudra
temple(35persons), Kalikhamba temple(25persons). Names of localities put
together also features high (31persons). The locality names used are Kotakeri,
Chowlikeri, Mudukeri, Manigarkeri, Hosakeri, and Bennekudra from the ancient
times. It is to be noted that ‘Keri’ means sector and ‘kudra’ means island. In
present times the panchayat nomenclature used by people are Kacchur, Heradi,
Hosala, and Hanehalli
3rd hierarchy places identified by 10%-29%:In this hierarchy is
church(22persons), Kathale Basadi(18persons), Mudukeri temple(15persons),
0%
20%
40%
60%
80%
100%
120%
15‐25
25‐45
45‐60
60‐80
1‐IN KACCHUR
2‐ WITHIN 1KM
3‐ BEYOND 1KM
0‐10 YRS
10‐20 YRS
20‐30 YRS
30‐50YRS
50 AND ABOVE

MORPHOLOGICAL STUDY OF A SMALL TOWN‐ BARKUR IN COASTAL KARNATAKA, INDIA
Cha
pter
: PE
RC
EPT
ION
AN
D C
OG
NIT
ION
AN
ALY
SIS
137
Chowlikeri temple(18persons), water tanks put together(18persons), river
front(12persons) .

MORPHOLOGICAL STUDY OF A SMALL TOWN‐ BARKUR IN COASTAL KARNATAKA, INDIA
Cha
pter
: PE
RC
EPT
ION
AN
D C
OG
NIT
ION
AN
ALY
SIS
138
Figure 6-3 : Map showing conclusions after sketch map analysis in terms of five element of image ability.

MORPHOLOGICAL STUDY OF A SMALL TOWN‐ BARKUR IN COASTAL KARNATAKA, INDIA
Cha
pter
: PE
RC
EPT
ION
AN
D C
OG
NIT
ION
AN
ALY
SIS
139
Figure 6-4: the five elements of cognition as per Kevin lynch derived from sketch plan as per age group classification.

MORPHOLOGICAL STUDY OF A SMALL TOWN‐ BARKUR IN COASTAL KARNATAKA, INDIA
Cha
pter
: PE
RC
EPT
ION
AN
D C
OG
NIT
ION
AN
ALY
SIS
140
When we see the sketch map analysis differentiated as per age group the
student crown 15-25 years have good knowledge of town and landmark however
the Ratha-beedi dominates their understanding and the landmarks of Kacchur and
Kalchapra dominate the map. The most balanced diagram of the town is from age
group 45-60 years as they are familiar with the whole town and travel to various
places of the town. The identification of landmarks in first hierarchy is same in all
age groups. Mudukeri Chowlikeri, Kalikhamba, Nageshwara temple, Bennekudra
temple etc. are all in the average category. The lowest scores are for the Gardi,
Janardana Kudli, Mastiamma temple, Hosakeri Ganapathy temple, etc.
Figure 6-5: sketch map analysis as per place of residence: within Kacchur old town, within 1km
radius beyond Kacchur and beyond 1km radius of the town.

MORPHOLOGICAL STUDY OF A SMALL TOWN‐ BARKUR IN COASTAL KARNATAKA, INDIA
Cha
pter
: PE
RC
EP
TIO
N A
ND
CO
GN
ITIO
N A
NA
LYSI
S
141
This analysis shows that the familiarity of roads is well distributed with the first
two categories. The analysis shows that the familiarity goes along the main road
more and less on inner roads when it comes to residents staying beyond 1km
radius.
6.3 Analysis of verbal description
6.3.1 Places people associate for daily activity. People were asked about their routine for day to day needs and places they
use and visit for different purposes. This is to identify the places they use to define
their movement and distinguish the references and important details they include
while describing the town features.
Table 6-6: table showing the number and accuracy of places and routes identified in verbal description survey
CATEGORY NO. OF
PEOPLE avg. no of
place avg.
score highest no of
places highest
score As per age group 15-25 19 6.8 52.3 10.0 82.0 25-45 36 7.0 54.0 20.0 179.0 45-60 21 8.2 63.7 23.0 219.0 60-80 4 6.5 52.3 10.0 70.0
As per place of residence 1-IN
KACCHUR 23 7.7 57.2 20.0 179.0 2- WITHIN
1KM 33 6.5 49.5 12.0 87.0 3- BEYOND
1KM 24 7.0 57.0 23.0 219.0
As per familiarity with the town 0-10 YRS 5 7.6 54.6 12.0 77.0 10-20 YRS 13 7.2 56.6 15.0 134.0 20-30 YRS 25 6.4 48.4 12.0 88.0 30-50YRS 28 7.4 58.5 23.0 219.0 50 AND
ABOVE 9 6.7 51.4 11.0 73.0 OVERALL 80 6.98 54 23 219
This score is low for older people above 60 years of age as well as 15-25years
as they visit less number places in their daily routine and less requirements for

sho
of
yea
Pa
Ka
te
m
Si
to
MORP
opping. Pe
mature ag
ars and ab
Figure 6-6: G
1st hierar
anchalinge
athale Bas
2ndhierarc
mple (32)
ain road.
3rdhierarc
mhasana G
Other fac
gether sco
1
1
PHOLOGICAL S
eople who
e. I the las
ove also sc
Graph showin
rchy places
eshwara te
adi (56), B
chy place
Mudukeri t
chy in p
Gudde(14)
cilities of s
ored 79.
100%99
0%
20%
40%
60%
80%
100%
120%
FIRS100-5
STUDY OF A S
stayed wit
st category
cored less
ng places ide
s identified
mple (60),
Bennekudra
es identifie
temple (26
places ide
), Riverfron
hops, work
9%
75%70%59
T HIERARCHY50%
SMALL TOWN
thin 1km of
y of people
as they m
ntified by peo
d by 50% a
and most
a (45), Kote
ed by 30-
6)come as p
entified by
nt and natu
k places sc
9%56%43%40
SECOHIERAY 49-30
N‐ BARKUR IN
f Barkur sc
e those wh
oved abou
ople in daily r
and above:
t popular fo
e (47).
-49%:Kalch
places in r
y 10-24%
ure scores (
cored toge
%33%
18%18%
OND ARCH
0%
THIRD29-15%
N COASTAL KA
cored less a
ho have us
ut less in th
routine and as
The place
or picnics
hapra (34)
outine whic
%:Kalikham
(11).
ther 84 an
%14%10%10%
D HIERARCHY %
ARNATAKA, IN
as they we
sed Barkur
heir old age
ssociation in
es most vis
and visits
), and Ch
ch are clos
mba templ
nd other lan
%10%
NDIA
ere more
r for 50
e.
words.
sited are
are and
howlikeri
se to the
le (14),
ndmarks
Cha
pter
: PE
RC
EP
TIO
N A
ND
CO
GN
ITIO
N A
NA
LYS
IS
142

MORPHOLOGICAL STUDY OF A SMALL TOWN‐ BARKUR IN COASTAL KARNATAKA, INDIA
Cha
pter
: PE
RC
EPT
ION
AN
D C
OG
NIT
ION
AN
ALY
SIS
143
Figure 6-7: map showing the intensity of use, association and concern for the town for overall
This analysis shows that the references are more at spots rather than
continuous, the routes are marked at beginning and end in terms of bus stops or
bridges or nodes and junctions. The district names are added to description of
landmark. Certain landmarks like Chowlikeri, Mudukeri, Gardi, temples score more

MORPHOLOGICAL STUDY OF A SMALL TOWN‐ BARKUR IN COASTAL KARNATAKA, INDIA
Cha
pter
: PE
RC
EPT
ION
AN
D C
OG
NIT
ION
AN
ALY
SIS
144
than the sketch map analysis and the routes are not mentioned other than Ratha-
beedi and the main road from Brahmavara to Chowlikeri.
Figure 6-8: the verbal description and association with the places of the town as per age group
The variation as per age group for verbal description of places associated by
the people is not varying too much except that the category 15-25 age group has
identified more number of places than the other age group on an average.
However the hierarchy and dominant landmarks remain the same.

MORPHOLOGICAL STUDY OF A SMALL TOWN‐ BARKUR IN COASTAL KARNATAKA, INDIA
Cha
pter
: PE
RC
EPT
ION
AN
D C
OG
NIT
ION
AN
ALY
SIS
145
Figure 6-9: The verbal description and association with the places of the town as per place of residence
The place of residence has definite impact on the familiarity of the places in the
town. The n8umber of places identified is more with residents in Kacchur and
people staying within 1km radius. The number of landmark and attachment
reduces when the place of residence is beyond 1km radius.
6.4 Analysis of photo identification survey

MORPHOLOGICAL STUDY OF A SMALL TOWN‐ BARKUR IN COASTAL KARNATAKA, INDIA
Cha
pter
: PE
RC
EPT
ION
AN
D C
OG
NIT
ION
AN
ALY
SIS
146
Table 6-7: performance of people in each parameter in photo identification survey
CATEGORY NO. OF
PEOPLE
avg. % of no of photographs
highest % of no of photographs
15-25 19 61.7 100.0 25-45 36 70.9 94.4 45-60 21 57.2 100.0 60-80 4 63.9 94.4 1-IN KACCHUR 23 60.6 100.0 2- WITHIN 1KM 33 65.8 94.4 3- BEYOND 1KM 24 56.0 100.0 0-10 YRS 5 63.3 100.0 10-20 YRS 13 65.4 94.4 20-30 YRS 25 68.9 94.4 30-50YRS 28 62.9 100.0 50 AND ABOVE 9 51.2 83.3 OVERALL 80 61.39 100
Recognition of photographs was high by age 25-45 and low by 45-60, people
staying beyond 1km radius scored low and people using Barkur for 50 and above
years also scored low where age could be the reason and less movement in the
town and hence not familiar with the changes in the town in recent times. People
using Barkur for 30-50years scored well on an average.

sid
no.
col
Bra
hig
eve
poi
Be
old
no.
57p
Ch
24p
MORP
Figure 6-10:
1st hierarc
e like no.3
.7(chariot f
umn in fr
ahmavara-
gh as they
ery day. Ph
int-49perso
nnekudra i
dest street
.1(element
persons) s
2nd hierar
owlikeri t
persons), s
9
0%
20%
40%
60%
80%
100%
120%
PHOLOGICAL S
% of people
chy of phot
3 (Kathale
for temple
ront of ka
56persons
are along
hotographs
ons), no.1
island-45p
ts of Bar
t of Cho
cored well
rchy ident
tank-36per
scored les
96%93%
76%76
STUDY OF A S
identifying ea
tographs id
basadi-77
festival on
alchapra-61
s), no.13(h
g the main
s like no.14
6(house
ersons), no
rkur and
owlikeri te
as they we
ified by p
rsons), no
ss as they
6%75%71%70%
SMALL TOWN
ach photogra
dentified 50
7persons),
n the road-5
1persons),
ouse of P
road and
4(end of th
next to c
o.18(Santh
are recog
emple-50pe
ere belong
people 30-
o.5(Muduke
are from
%70%63%61%
N‐ BARKUR IN
aph
0-100%:Th
no. 4(panc
56persons
no.10(rive
Panchayat
are popu
he old stree
church-45p
he-old mark
gnized we
ersons), n
ging to popu
-49%: Pho
eri temple
areas not
%59%58%56%4
N COASTAL KA
e photogra
chalingesh
), no.9(view
er edge a
member-6
lar structu
et to the riv
persons),
ket-50pers
ell and in
no.8(lamp
ular structu
otograph n
e shasan
frequented
45%45%33%30
ARNATAKA, IN
aphs from t
wara-74pe
w of road w
at Barkur
61persons)
res or view
ver which i
no.17(ban
sons) are a
nterior vie
in the
ures.
no.2(inner
a on the
d by peop
0%29%
NDIA
the road
ersons ),
with one
towards
, scored
ws seen
s a ferry
k along
along the
ews like
temple-
view of
e road-
le. The Cha
pter
: PE
RC
EP
TIO
N A
ND
CO
GN
ITIO
N A
NA
LYS
IS
147

MORPHOLOGICAL STUDY OF A SMALL TOWN‐ BARKUR IN COASTAL KARNATAKA, INDIA
Cha
pter
: PE
RC
EPT
ION
AN
D C
OG
NIT
ION
AN
ALY
SIS
148
interior view of structures like no.6(path around the temple-24persons) did not
score high as it was from the back and not the regular angle to be seen.
3rd hierarchy identified by people 15-24%:Structures and view off the main road
like photograph no.11(plantation at Kacchur village-26persons), no.15(house along
old road to mudukeri-24persons) have lesser number of people recognizing them.
The reason could be that they do not form reference while walking or orienting
oneself. Also they may not be used very often by people. When it comes to private
property the number is very low.

MORPHOLOGICAL STUDY OF A SMALL TOWN‐ BARKUR IN COASTAL KARNATAKA, INDIA
Cha
pter
: PE
RC
EPT
ION
AN
D C
OG
NIT
ION
AN
ALY
SIS
149
Figure 6-11: map showing photos identified most overall
6.5 Overall conclusion Age wise: It is seen that the age group 60-80 does well in overall
understanding of the town. However it cannot be concluded for sure that more the

MORPHOLOGICAL STUDY OF A SMALL TOWN‐ BARKUR IN COASTAL KARNATAKA, INDIA
Cha
pter
: PE
RC
EPT
ION
AN
D C
OG
NIT
ION
AN
ALY
SIS
150
age better is the understanding as 15-25 did well in sketch map analysis and 45-
60 in daily routine and associational value, while 25-45 scored well in sketch map
and photo identification.
Figure 6-12: bar chart showing accuracy and performance in each survey for different age group
Place of residence: Here there is a definite pattern beyond doubt that people
staying beyond 1km of town have lower comprehension of town than ones staying
within 1km of Barkur. However there is no difference between people staying in
Kacchur that is the oldest part of the town to people staying within 1km radius of
the town.
0.0
10.0
20.0
30.0
40.0
50.0
60.0
70.0
80.0
15‐25
25‐45
45‐60
60‐80

MORPHOLOGICAL STUDY OF A SMALL TOWN‐ BARKUR IN COASTAL KARNATAKA, INDIA
Cha
pter
: PE
RC
EPT
ION
AN
D C
OG
NIT
ION
AN
ALY
SIS
151
Figure 6-13: bar chart showing performance of people in three surveys as per place of residence
No. of years using Barkur: Here it is seen that less than 20 years scores less
than above 20 years and 30 years and above shows better understanding than all
other categories. Since the sample size of 0-10 and above 50years is small there
is no definite conclusion about the same. It is seen that readings about daily
activity and photographs is low of age above 50 years which matches the age
group findings. It could be less mobility or poor eyesight or fixed routine limited in
distance and places.
Figure 6-14: bar chart showing performance of people in three surveys as per familiarity with the town
0.010.020.030.040.050.060.070.0
1‐IN KACCHUR
2‐ WITHIN 1KM
3‐ BEYOND 1KM
0.010.020.030.040.050.060.070.080.0
0‐10 YRS
10‐20 YRS
20‐30 YRS
30‐50YRS
50 AND ABOVE

MORPHOLOGICAL STUDY OF A SMALL TOWN‐ BARKUR IN COASTAL KARNATAKA, INDIA
Cha
pter
: PE
RC
EP
TIO
N A
ND
CO
GN
ITIO
N A
NA
LYSI
S
152
The response in each aspect of questionnaire as explained before was divided
into five hierarchy.
HIERARCHY FIRST- 50-100% (40-80 PERSONS)
SECOND 30-49% (24-39 PERSONS)
THIRD 15-29% (12-23 PERSONS)
Landmarks: Nodes Paths Edges Districts
Bhatt Vinayaka, Panchalingeshwara, Kalchapra, Shops And Other Facilities Brahmavara road, Heradi Mandarthi road, ratha-beedi, Saibrakatte road
Bennekudra, Kalikhamba, Mudukeri road Names Of Locality-Mudukeri, Kacchur,Chowlikeri, Manigarkeri,Hannehalli, Hosala,Bennekudra, Heradi
Church, Kathale Basadi, Mudukeri Temple, Chowlikeri Temple, Water Tanks, Bennekudra road River Front
Landmarks Nodes Paths Edges districts
Panchalingeshwara,, Kathale Basadi, Bennekudra Temple, Kote
Kalchapra, Chowlikeri temple, Mudukeri temple
Kalikhamba Simhasana Gudde
Landmarks:
Kathale Basadi, Panchalingeshwara, Chariot Festival Of Panchalingeshwara, Kalchapra,, Santhe,
Path Behind Panchalingeshwara Temple

MORPHOLOGICAL STUDY OF A SMALL TOWN‐ BARKUR IN COASTAL KARNATAKA, INDIA
Cha
pter
: PE
RC
EPT
ION
AN
D C
OG
NIT
ION
AN
ALY
SIS
153
Nodes Paths Edges Districts
Chowlikeri interior Old Ferry Point From Panchayat Road, House Of Panchayat Member Opposite Santhe, House Next To Church, River Edge From Brahmavara Bridge, River Edge From Bennekudra Bridge,
Chowlikeri Tank, Shasana At Mudukeri,
Plantation, House Along Old Mudukeri Road
It is seen that Panchalingeshwara and temple come in first hierarchy in sketch
plan, places of daily routine, photograph identification. This shows they are
important landmark for identification of the town, it is also part of their present
lifestyle and they are visually familiar with the structures,
Kalchapra though first in important landmark and visual familiarity it comes
second in terms of association value. Bennekudra though first in daily routine
comes second in landmark as it is far away from the center of the town. Kathale
Basadi though first in association comes third in landmark and Kote being first in
association comes fourth in landmark.

MORPHOLOGICAL STUDY OF A SMALL TOWN‐ BARKUR IN COASTAL KARNATAKA, INDIA
Cha
pter
: PE
RC
EPT
ION
AN
D C
OG
NIT
ION
AN
ALY
SIS
154
Chowlikeri Panchalingeshwara temple and Mudukeri Somnatheshwara temple
come second in daily routine and landmark however are first in visual familiarity
SKETCH PLAN DAILY ROUTINE PHOTO IDENTIFICATION
1stHIERARCHY
Panchalingeshwara -10 54% Panchalingeshwar
a -10 75%
4. Panchalingeshwara temple 6. path around temple
92.5% 28.75%
Bhatt Vinayaka temple-10 64% 8. lamp in the temple 71%
Kalchapra- 10 65% Kalchapra -10 43% 9. column in the road at Kalchapra 76%
Bennekudra- 08 44% Bennekudra- 07 56%
Kathale Basadi -08 23% Kathale Basadi -05 70% 3. Kathale Basadi 96%
Brahmavara 59% 10. river edge at Barkur towards Brahmavara 70%
ratha-beedi 46% 7. chariot of festival 70% 2ndHIERARCHY localities/village names 03 39%
Kalikhamba -08 31% Kalikhamba -07 18% Veerabadra -07 11% Veerabadra -07 5% Mudukeri Somnatheshwara temple -07
19% Mudukeri temple -07 33%
5.shasana around Mudukeri temple 59%
Chowlikeri Panchalingeshwara temple- 07
23% Chowlikeri temple- 07 40%
1. elements of Chowlikeri temple 63%
water tanks- 07 23% 2.chowlikere tank 45% church 06 28% Church - 07 10% Mandarthi 43%
Mudukeri 30% 15. house along the old street of Mudukeri 30%
panchayat 10%
11. Plantation at Kacchur village 12. Compound of house of political leader 13. House of panchayat member 14. end of old street to river where boats come
33%, 45%, 76% 61.25%
Bennekudra 23% 17. bank along Bennekudra island 56%
saibrakatte 46%

MORPHOLOGICAL STUDY OF A SMALL TOWN‐ BARKUR IN COASTAL KARNATAKA, INDIA
Cha
pter
: PE
RC
EPT
ION
AN
D C
OG
NIT
ION
AN
ALY
SIS
155
3rdHIERARCHY
Kacchur Nageshwar- 06 13% Kacchur
Nageshwar- 05 3% Santhe- 06 10% Santhe- 05 5% 18. old market 75% fort Kote- 06 10% fort Kote- 05 59% Simhasana Gudde- 05 13% Simhasana
Gudde- 05 18%
riverfront/ nature 04 15% riverfront/ nature 04 14%
church road 8% 16. house along road next to church 58%
4thHIERARCHY Manigarkeri Somnatheshwara temple- 04
8% Manigarkeri Somnatheshwara temple- 05 10%
Mudukeri Venugopalkrishna temple -04
8% Mudukeri Venugopalkrishna temple -05 6%
BabbuSwamy/ Malatidevi temple- 04
9% BabbuSwamy/ Malatidevi temple- 05 10%
Mastiamma temple- 04 8% Mastiamma
temple- 05 5%
5thHIERARCHY
Hosakeri Ganapati Temple - 04 4% Hosakeri Ganapati
Temple - 05 4% Ranganakeri- 05 1% Ranganakeri- 05 4% Jannardana Koodle -05 4% Jannardana
Koodle -05 3%
Bandar Keri Matta- 04 1% Bandar Keri
Matta- 04 4% Brahma Badrakali Gardi- 04 3% Brahma Badrakali
Gardi- 04 4% NOT CONSIDERED
shops and other facilities of town 03 51%
shops and other facilities of town 10 100%
others 03 54% others 10 99%
From all the above analysis it is clear that the age group of 15-45 has good
mobility and show little variation in understanding of the town. The familiarity with
MORPHOLOGICAL STUDY OF A SMALL TOWN‐ BARKUR IN COASTAL KARNATAKA, INDIA
Cha
pter
: PE
RC
EPT
ION
AN
D C
OG
NIT
ION
AN
ALY
SIS
156
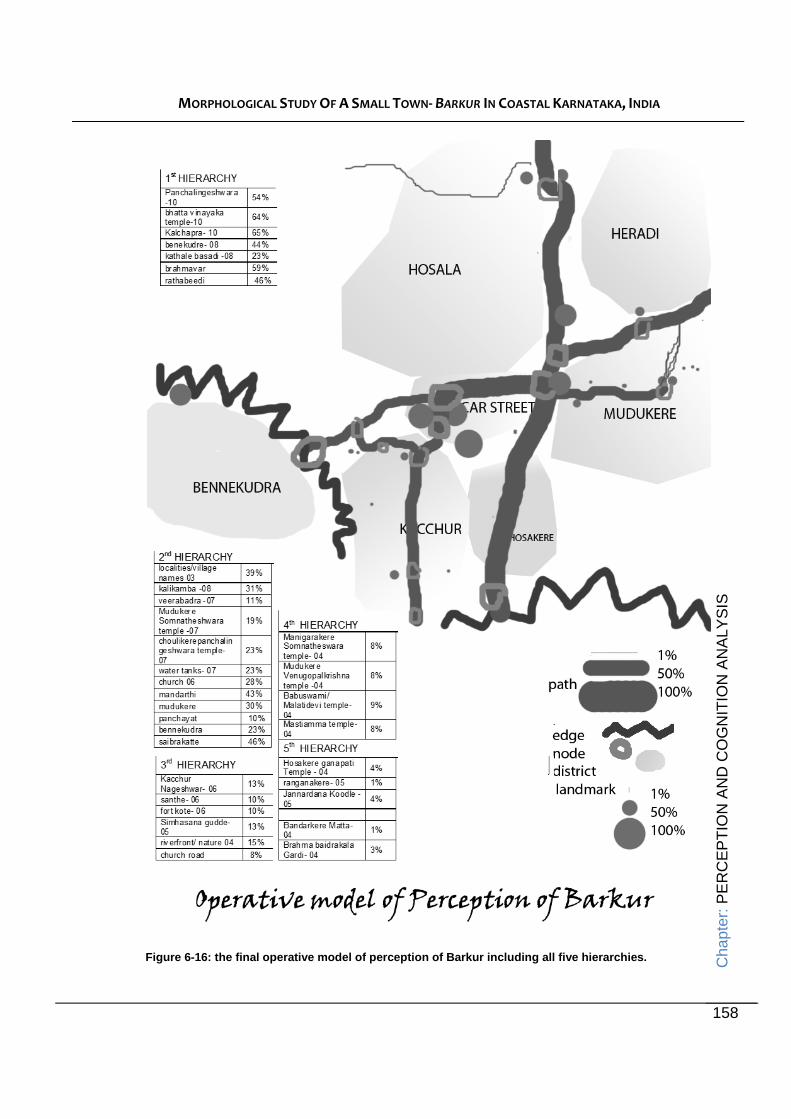
landmarks is more with residents staying within 1km radius and the inner roads are
more used by these residents. The familiarity of use pattern shows that it takes up
to 5-10 years as per frequency of use for the people to understand 90% of the
town area. There is less difference in understanding of town beyond 10 years.
From the above analysis the operative model of perception for the town of Barkur
is as follows:

MORPHOLOGICAL STUDY OF A SMALL TOWN‐ BARKUR IN COASTAL KARNATAKA, INDIA
Cha
pter
: PE
RC
EPT
ION
AN
D C
OG
NIT
ION
AN
ALY
SIS
157
Figure 6-15: the figures show the operative perception overall comparing first and second and final all five hierarchy
MORPHOLOGICAL STUDY OF A SMALL TOWN‐ BARKUR IN COASTAL KARNATAKA, INDIA
Cha
pter
: PE
RC
EPT
ION
AN
D C
OG
NIT
ION
AN
ALY
SIS
158
Figure 6-16: the final operative model of perception of Barkur including all five hierarchies.

MORPHOLOGICAL STUDY OF A SMALL TOWN‐ BARKUR IN COASTAL KARNATAKA, INDIA
Cha
pter
: PE
RC
EP
TIO
N A
ND
CO
GN
ITIO
N A
NA
LYSI
S
159
6.6 Visual analysis of form of Barkur town without familiarity of town
The town was surveyed and documented by people who had no knowledge of
the present town and no knowledge of historic, social or political background. This
analysis helps in evaluating the physical aspects of the town w.r.t. perception and
cognition of the town. The studies done were for the experiential aspects in space
motion diagrams and visual aspects of the street elevations of the town.
6.6.1 Format of visual impact analysis of street elevation: Students from Serbia, Austria and Aurangabad from India were made to
evaluate the street elevation of the structures in terms of visual impact. Through
these analyses we tried to determine the most influential elements that are
affecting the creation of the certain flavor of the space or its ambience. City of
Barkur, as one of the main centers of religion and culture from the past, was a
perfect choice for this project, because of its mix of old and new, traditional and
global, and the constant change of this thing. It was important to find out what is
making us feel different in various parts of the same road, with a distance of just a
few meters. What were the elements that are making such a radical change of the
atmosphere possible? We tried to give the answer through the analysis of the
street front and building facades.
6.6.2 Conclusion from the visual impact analysis of street elevation

enc
lan
the
arc
occ
MORP
Area 01
Dominatin
closure, bu
ndmarks. H
e overall im
chitecture c
curs in this
Dominatin
Vegetatio
Roof deco
Ratio was
PHOLOGICAL S
ng elemen
uilt environ
Highly deco
mpression
characteris
s area, give
ng element
n – 85%
orations – 5
s defined o
STUDY OF A S
ts in this
nment is b
orated roof
of the a
stic for this
es an addit
t – 2 landm
5%
nly on one
SMALL TOWN
area are
ecoming m
fs of templ
mbient, w
part of Ind
ional accen
marks – 15%
side – h/w
N‐ BARKUR IN
temples. B
more attrac
le structure
hich gives
dia. Also, t
nt on the im
%
w – 1/3
N COASTAL KA
Because o
ctive and t
es are add
s us a fee
the slopes
mportance
ARNATAKA, IN
of the low
takes a rol
ding more
eling of tra
of the roa
of this plac
NDIA
level of
le of the
value to
aditional
ad which
ce.
Cha
pter
: PE
RC
EP
TIO
N A
ND
CO
GN
ITIO
N A
NA
LYS
IS
160

tha
of
wh
we
MORP
Area 02
Elements
at is probab
the whole
ich is stron
e are passin
Dominatin
Gaps – 20
Ratio was
Area 03
PHOLOGICAL S
which are
bly the size
building. O
ngly influen
ng by it.
ng element
0%
s defined o
STUDY OF A S
most notic
e of the ro
One more
ncing the f
t – slope ro
nly on one
SMALL TOWN
ceable in th
of surface
thing that
feeling of le
oof – 80%
side – h/w
N‐ BARKUR IN
his area ar
which we
should be
ess enclos
w – 2/3
N COASTAL KA
re roof stru
can see c
e noticed is
sed space
ARNATAKA, IN
ctures. Re
compared w
s the empt
which we
NDIA
ason for
with size
ty parcel
have as
Cha
pter
: PE
RC
EP
TIO
N A
ND
CO
GN
ITIO
N A
NA
LYS
IS
161

fro
les
the
arc
mo
floo
allo
are
MORP
Character
m quite or
ss similar h
e slope ro
chitecture.
Dominatin
H/w – 2/3
Area 04
Difference
ost charact
or whose r
owing us to
e produced
Dominatin
Roof – 35
H/w – 2/3
PHOLOGICAL S
ristic of this
rdered buil
eight and p
oofs of the
ng element
e between
teristic elem
relation with
o notice th
d).
ng element
5%
STUDY OF A S
s part of th
lding line (
proportion
e buildings
t – slope ro
sizes of b
ment for th
h the rest o
e ground f
t – second
SMALL TOWN
he street is
(with one e
of houses
s are givi
oof – 80%
building in
his segme
of the build
floor (main
floor – 65%
N‐ BARKUR IN
s the feelin
exception
is making
ng this ar
this area
nt. Most o
ding is affe
ly because
%
N COASTAL KA
g of contin
of one em
this area q
rea the fla
is obvious
of the build
cting our p
e of the de
ARNATAKA, IN
nuity, which
mpty plot).
quite const
avor of tra
s, and may
dings have
perception,
ep shadow
NDIA
h comes
More or
tant, and
aditional
y be the
second
and not
ws which C
hapt
er: P
ER
CE
PTI
ON
AN
D C
OG
NIT
ION
AN
ALY
SIS
162

wh
les
bou
MORP
Area 05
This segm
ich is ove
ss enclose
undaries d
Dominatin
Roof – 10
Ratio was
Area 06
PHOLOGICAL S
ment is ch
rwhelming
ed space,
oes exist.
ng element
0%
s not define
STUDY OF A S
aracterized
the amou
although
t – vegetati
ed
SMALL TOWN
d by the a
unt of built
not tota
ion – 90%
N‐ BARKUR IN
amount of
structures
lly opened
N COASTAL KA
vegetation
s. That giv
d, becaus
ARNATAKA, IN
n and open
ves us a fe
se some
NDIA
n space,
eeling of
kind of
Cha
pter
: PE
RC
EP
TIO
N A
ND
CO
GN
ITIO
N A
NA
LYS
IS
163

pre
bui
the
pre
bec
roo
of t
MORP
Amount o
evious one
ilt structure
e sky that w
Dominatin
Vegetatio
Old house
H/w – 2/3
Area 07
Size of th
esent on t
coming con
of structure
the “Indian
Dominatin
Gaps betw
H/w – 1/2
PHOLOGICAL S
of green ar
, but the fe
es is giving
we can perc
ng element
n – 20%
es – 10%
e building
this whole
nstant on t
es are agai
” street.
ng element
ween build
STUDY OF A S
reas in thi
eeling of le
g us the fee
ceive beco
t – new stru
in this are
location.
the left side
n becomin
t – slope ro
ings – 25%
SMALL TOWN
s part of t
ess enclose
eling of ver
omes less t
uctures – 7
ea is again
Number o
e of the roa
ng dominan
oof – 40%
%
N‐ BARKUR IN
the road is
ed space s
rtical enclo
than before
70%
coming ba
of “green
ad. Besides
nt and high
N COASTAL KA
s becomin
still remain
sure, beca
e.
ack to the
gaps” bet
s that, we
hly influenti
ARNATAKA, IN
g less tha
ns. Size of
ause the am
one that is
tween buil
can notice
al to the am
NDIA
an in the
the new
mount of
s mostly
dings is
that the
mbience C
hapt
er: P
ER
CE
PTI
ON
AN
D C
OG
NIT
ION
AN
ALY
SIS
164

the
stre
MORP
Area 08
Most dom
e street. C
eet are sta
Dominatin
Color – 15
Gaps – 15
H/w – 1/2
PHOLOGICAL S
minant elem
ontinuous
aying in the
ng element
5%
5%
STUDY OF A S
ment in this
row of ho
e back plan
t – zig-zag
SMALL TOWN
s part is fo
ouses and
n because o
roof line –
N‐ BARKUR IN
r sure hug
“green ga
of the zig-z
25%
N COASTAL KA
ge building
aps” on the
zag roof lin
ARNATAKA, IN
on the lef
e right sid
e of this bu
NDIA
ft side of
e of the
uilding.
Cha
pter
: PE
RC
EP
TIO
N A
ND
CO
GN
ITIO
N A
NA
LYS
IS
165

fee
Re
the
trad
bet
MORP
Area 09
Enclosure
eling that w
eason for th
e street. E
ditional arc
tween build
Dominatin
Roof – 70
Gap betw
H/w – 3/2
PHOLOGICAL S
e in this pa
we get while
hat is the s
Even thoug
chitecture;
dings and t
ng element
0%
ween the bu
STUDY OF A S
art is gettin
e walking t
size of the
gh the roo
it is not so
their size.
t – height o
uildings – 5
SMALL TOWN
ng bigger,
through is
buildings,
ofs have t
o easy to p
of buildings
5%
N‐ BARKUR IN
especially
that the st
which are
he shape
perceive th
s – 50%
N COASTAL KA
y the vertic
treet is nar
e higher on
that is gi
hem becau
ARNATAKA, IN
cal enclosu
rrower than
n the both
iving the f
use of the d
NDIA
ure. The
n before.
sides of
flavor of
distance
Cha
pter
: PE
RC
EP
TIO
N A
ND
CO
GN
ITIO
N A
NA
LYS
IS
166
Als
aro
MORP
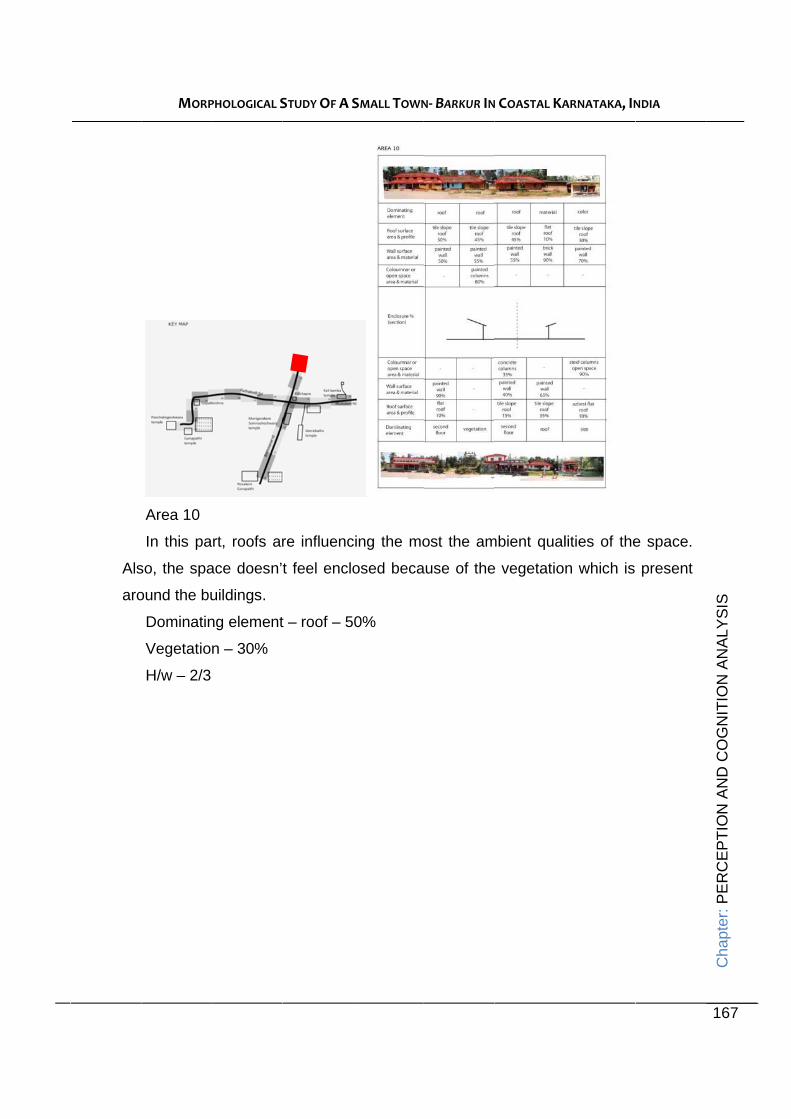
Area 10
In this pa
so, the spa
ound the bu
Dominatin
Vegetatio
H/w – 2/3
PHOLOGICAL S
rt, roofs ar
ace doesn’
uildings.
ng element
n – 30%
STUDY OF A S
re influenc
t feel enclo
t – roof – 5
SMALL TOWN
cing the mo
osed beca
0%
N‐ BARKUR IN
ost the am
ause of the
N COASTAL KA
mbient qual
e vegetatio
ARNATAKA, IN
lities of the
n which is
NDIA
e space.
present
Cha
pter
: PE
RC
EP
TIO
N A
ND
CO
GN
ITIO
N A
NA
LYS
IS
167

exc
the
MORP
Area 11
Street line
ception of t
e “future” e
Dominatin
New struc
H/w – 2/3
Area 12
PHOLOGICAL S
e continue
the large b
nvironmen
ng element
cture – 15%
STUDY OF A S
es with sa
building on
nt.
t – roof – 5
%
SMALL TOWN
me eleme
the left sid
0%
N‐ BARKUR IN
nts as in
de, which i
N COASTAL KA
the previo
s creating
ARNATAKA, IN
ous area, w
the atmos
NDIA
with the
phere of
Cha
pter
: PE
RC
EP
TIO
N A
ND
CO
GN
ITIO
N A
NA
LYS
IS
168

we
Pre
stre
bui
wa
fee
MORP
On this pa
e are talkin
esence of
eet.
Dominatin
H/w – 2/3
Area 13
Most dom
ildings and
alls that app
eling of a “c
Dominatin
Decoratio
Roof – 15
H/w – 3/2
PHOLOGICAL S
art of the ro
ng about th
the empty
ng element
minating e
d distance
pear on bo
canyon” an
ng element
n – 15%
5%
STUDY OF A S
oad, the ro
he elemen
y plots kee
t – sloping
lement on
between t
oth sides of
nd the direc
t – walls –
SMALL TOWN
oof is again
nts that are
eps the sa
roof – 80%
n this part
hem. One
f the road,
ctional mov
95%
N‐ BARKUR IN
n one of th
e affecting
ame atmos
%
t is the re
more thin
and add m
vement.
N COASTAL KA
e most infl
the archit
sphere as
elation bet
g that is c
more influen
ARNATAKA, IN
luential ele
tectural am
in the res
tween size
haracterist
nce to crea
NDIA
ements if
mbience.
st of the
e of the
tic is the
ating the
Cha
pter
: PE
RC
EP
TIO
N A
ND
CO
GN
ITIO
N A
NA
LYS
IS
169

wh
dom
con
MORP
Area 14
Even dou
o are also
minant ele
ntext.
Dominatin
Vegetatio
Roof – 30
H/w – 1/3
PHOLOGICAL S
ugh the am
o present
ements is f
ng element
n – 70%
0%
STUDY OF A S
mount of ve
are keepi
for sure th
t – gate – 1
SMALL TOWN
egetation p
ing the fe
he Gate w
15%
N‐ BARKUR IN
present on
eling of e
which has a
N COASTAL KA
n this part
enclosed s
a role of a
ARNATAKA, IN
is large, th
pace. One
a landmark
NDIA
he walls
e of the
k in this
Cha
pter
: PE
RC
EP
TIO
N A
ND
CO
GN
ITIO
N A
NA
LYS
IS
170

no
fee
MORP
Area 15
This part o
wall as a b
eling that th
Dominatin
Roof – 10
Vegetatio
H/w – 1/3
PHOLOGICAL S
of the stree
boundary.
hey are con
ng element
0%
n – 30%
STUDY OF A S
et is a bit d
Most influe
ntemporary
t – color – 3
SMALL TOWN
different fro
ential elem
y.
30%
N‐ BARKUR IN
om the prev
ment is the c
N COASTAL KA
vious ones
color of the
ARNATAKA, IN
s, because
e buildings
NDIA
e there is
and the
Cha
pter
: PE
RC
EP
TIO
N A
ND
CO
GN
ITIO
N A
NA
LYS
IS
171

left
ser
cha
MORP
Area 16
Most dom
t side of th
rves as a
ange betwe
Dominatin
Gaps – 15
H/w – 1/3
PHOLOGICAL S
minant thing
he road, an
barrier th
een built a
ng element
5%
STUDY OF A S
g on this p
nd the pres
at bounde
nd green s
t – wall – 5
SMALL TOWN
part of the
sence of th
er the spac
space is the
0%
N‐ BARKUR IN
road is th
he wall wh
ce. On the
e most influ
N COASTAL KA
e absence
hich is bloc
e other sid
uential elem
ARNATAKA, IN
e of houses
cking the v
de, the rh
ment
NDIA
s on the
view and
ythmical
Cha
pter
: PE
RC
EP
TIO
N A
ND
CO
GN
ITIO
N A
NA
LYS
IS
172

bec
opp
bui
ma
com
but
MORP
Area 17
Contrast b
cause mas
posed by g
Dominatin
Vegetatio
Ratio was
Area 18
Percent o
Dominatin
Ratio was
The above
This analy
The refere
ilt edge and
ain routes f
mmercial d
t after that
PHOLOGICAL S
between bu
ssive built
green area
ng element
n – 50%
s defined o
f vegetatio
ng element
s not define
e conclusio
ysis gives u
ence point
d roof lines
for the user
developme
the visitor
STUDY OF A S
uilt and gre
structure w
that is ope
t – new bui
nly on one
on should b
t – vegetati
ed
on can be s
us the follo
of Kalchap
s guide the
r. The road
ent. The tu
is hesitant
SMALL TOWN
een is mos
which clos
ened.
ilt structure
side – h/w
be highlight
ion – 80%
summarize
owing main
pra acts as
e viewer to
d to the left
urn up to t
t to venture
N‐ BARKUR IN
st characte
ses the spa
e – 45%
w – 1/3
ted in this a
ed as follow
n points.
s the startin
define the
t is taken a
he Pancha
e further,
N COASTAL KA
ristic for th
ace in eve
area
ws:
ng point fo
town. The
as main roa
alingeshwa
ARNATAKA, IN
his part of t
ry way po
r the analy
e cross road
ad from the
ara is well
NDIA
he road,
ssible is
ysis. The
ds is the
e intense
defined
Cha
pter
: PE
RC
EP
TIO
N A
ND
CO
GN
ITIO
N A
NA
LYS
IS
173
MORPHOLOGICAL STUDY OF A SMALL TOWN‐ BARKUR IN COASTAL KARNATAKA, INDIA
Cha
pter
: PE
RC
EPT
ION
AN
D C
OG
NIT
ION
AN
ALY
SIS
174
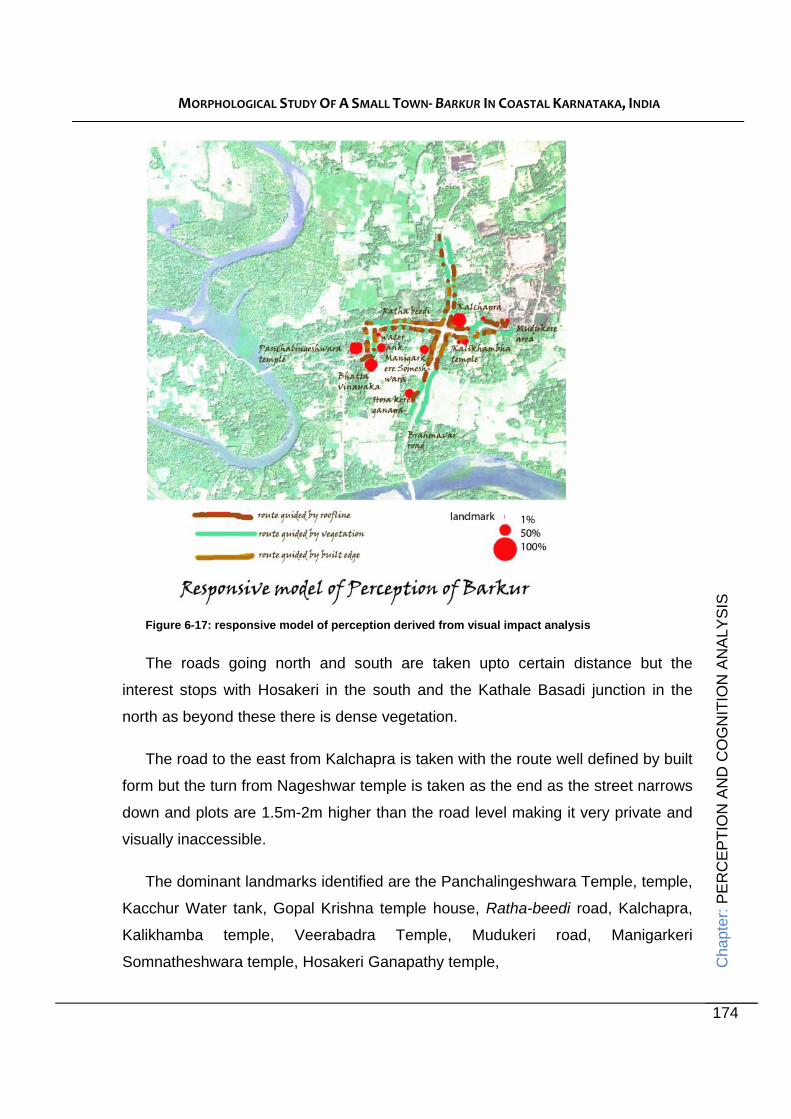
Figure 6-17: responsive model of perception derived from visual impact analysis
The roads going north and south are taken upto certain distance but the
interest stops with Hosakeri in the south and the Kathale Basadi junction in the
north as beyond these there is dense vegetation.
The road to the east from Kalchapra is taken with the route well defined by built
form but the turn from Nageshwar temple is taken as the end as the street narrows
down and plots are 1.5m-2m higher than the road level making it very private and
visually inaccessible.
The dominant landmarks identified are the Panchalingeshwara Temple, temple,
Kacchur Water tank, Gopal Krishna temple house, Ratha-beedi road, Kalchapra,
Kalikhamba temple, Veerabadra Temple, Mudukeri road, Manigarkeri
Somnatheshwara temple, Hosakeri Ganapathy temple,
MORPHOLOGICAL STUDY OF A SMALL TOWN‐ BARKUR IN COASTAL KARNATAKA, INDIA
Cha
pter
: PE
RC
EPT
ION
AN
D C
OG
NIT
ION
AN
ALY
SIS
175
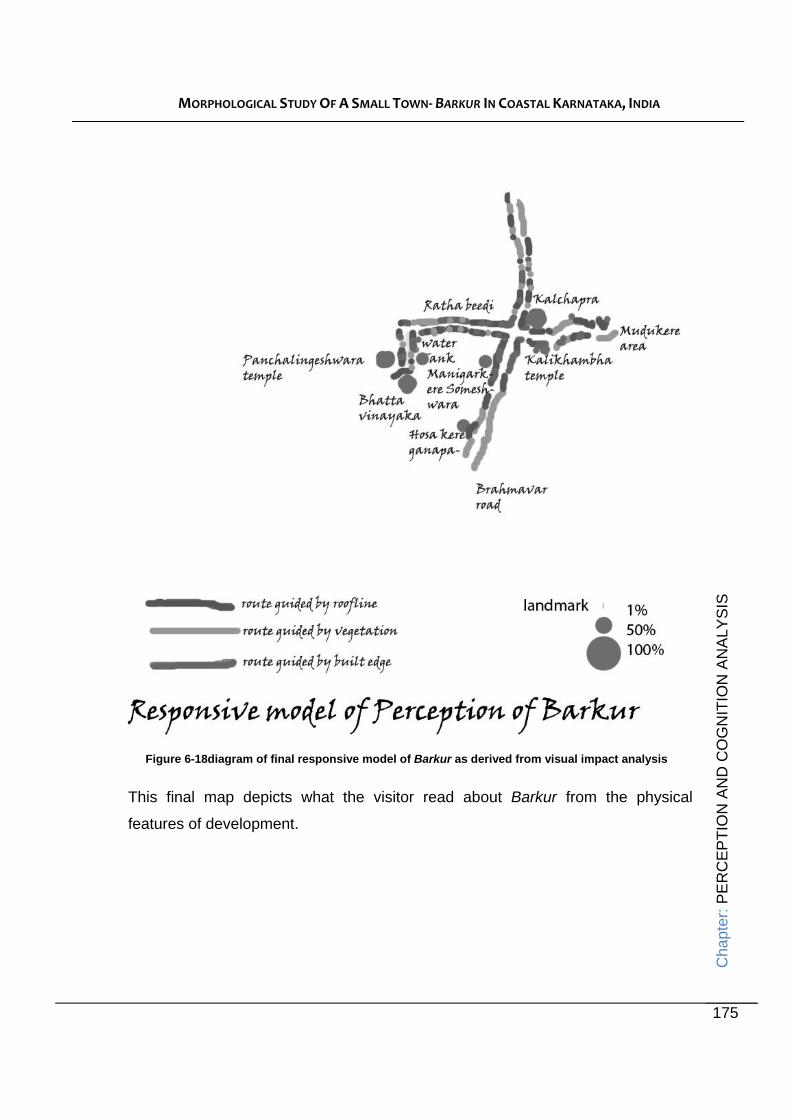
Figure 6-18diagram of final responsive model of Barkur as derived from visual impact analysis
This final map depicts what the visitor read about Barkur from the physical
features of development.

MORPHOLOGICAL STUDY OF A SMALL TOWN‐ BARKUR IN COASTAL KARNATAKA, INDIA
Cha
pter
: PE
RC
EPT
ION
AN
D C
OG
NIT
ION
AN
ALY
SIS
176
6.6.3 Format of space motion diagram analysis:
The space motion Diagram method is to document the experience in totality.
The space motion diagram drawn first roughly includes the physical shape of the
street as seen by the eye, the slopes, culverts, turns, visual links etc. the second is
the percentage of enclosure defined by the built forms or landscape accompanied
by section shown diagrammatically, third is the number of steps it took to notice the
next important visual aspect, fourth diagram is the orientation diagram where the
landmarks, noise level, key features noticed are drawn. Finally the photographs of
sample experience are put along the side. This example of documentation led to
concluding the key features of the street experience as felt by the visitor who is an
architecture student from Austria. Similar studies were done by the Serbian student
and the students from Aurangabad separately.
The roads chosen were which she felt comfortable finding and walking and she
was free to interact with the locals to find her way. No map was provided and no
explanation about the town was given.
In order to find the quality of the physical form space motion diagram was done for
the main streets of Barkur.
The first map is the visual penetration from the road and
quality of turns and slope felt while moving. The edge conditions if strong are also
noted.
The next column shows the definition of space through scale of explicitness.

MORPHOLOGICAL STUDY OF A SMALL TOWN‐ BARKUR IN COASTAL KARNATAKA, INDIA
Cha
pter
: PE
RC
EPT
ION
AN
D C
OG
NIT
ION
AN
ALY
SIS
177
Third column is a key section of the street and the number of steps taken to
reach that stage.
Fourth column marks the nodes, , landmarks , edges, , and
noise levels.
Final column shows key photographs demonstrating the notes made.
The following is one section out of 5 done
Kotakeri to school road:
6.6.4 Conclusion from the space motion diagram analysis
MORPHOLOGICAL STUDY OF A SMALL TOWN‐ BARKUR IN COASTAL KARNATAKA, INDIA
Cha
pter
: PE
RC
EPT
ION
AN
D C
OG
NIT
ION
AN
ALY
SIS
178
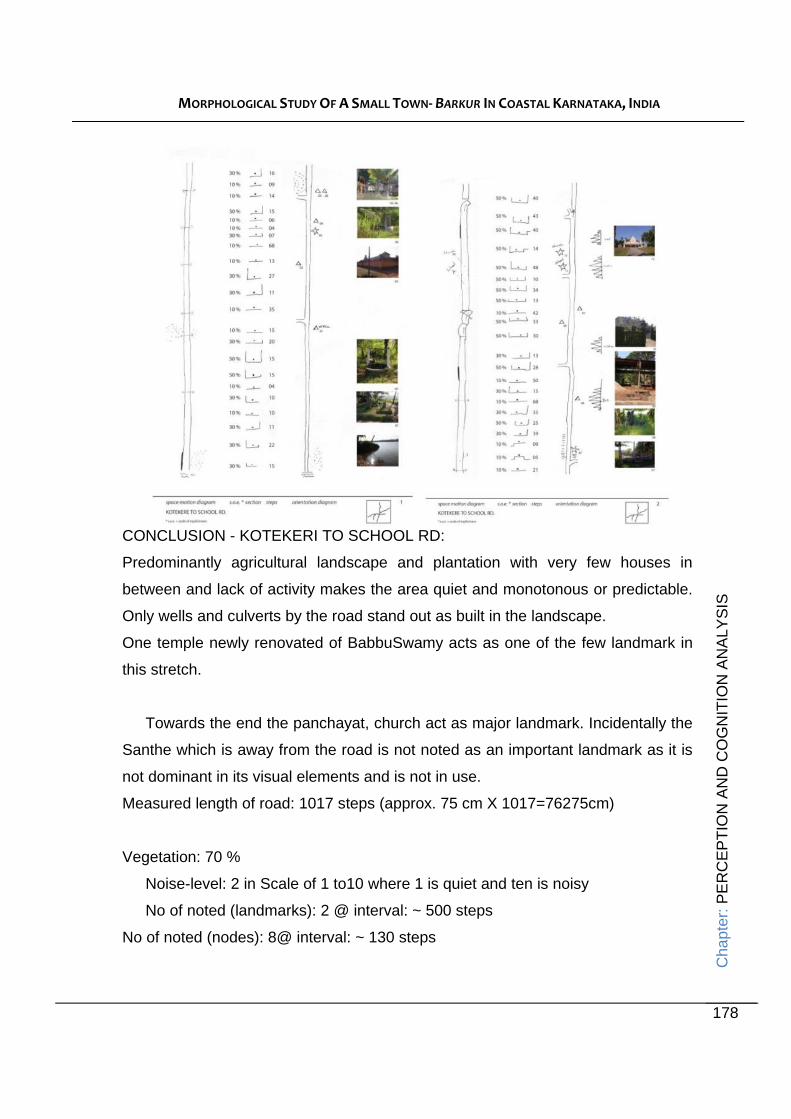
CONCLUSION - KOTEKERI TO SCHOOL RD:
Predominantly agricultural landscape and plantation with very few houses in
between and lack of activity makes the area quiet and monotonous or predictable.
Only wells and culverts by the road stand out as built in the landscape.
One temple newly renovated of BabbuSwamy acts as one of the few landmark in
this stretch.
Towards the end the panchayat, church act as major landmark. Incidentally the
Santhe which is away from the road is not noted as an important landmark as it is
not dominant in its visual elements and is not in use.
Measured length of road: 1017 steps (approx. 75 cm X 1017=76275cm)
Vegetation: 70 %
Noise-level: 2 in Scale of 1 to10 where 1 is quiet and ten is noisy
No of noted (landmarks): 2 @ interval: ~ 500 steps
No of noted (nodes): 8@ interval: ~ 130 steps
MORPHOLOGICAL STUDY OF A SMALL TOWN‐ BARKUR IN COASTAL KARNATAKA, INDIA
Cha
pter
: PE
RC
EPT
ION
AN
D C
OG
NIT
ION
AN
ALY
SIS
179
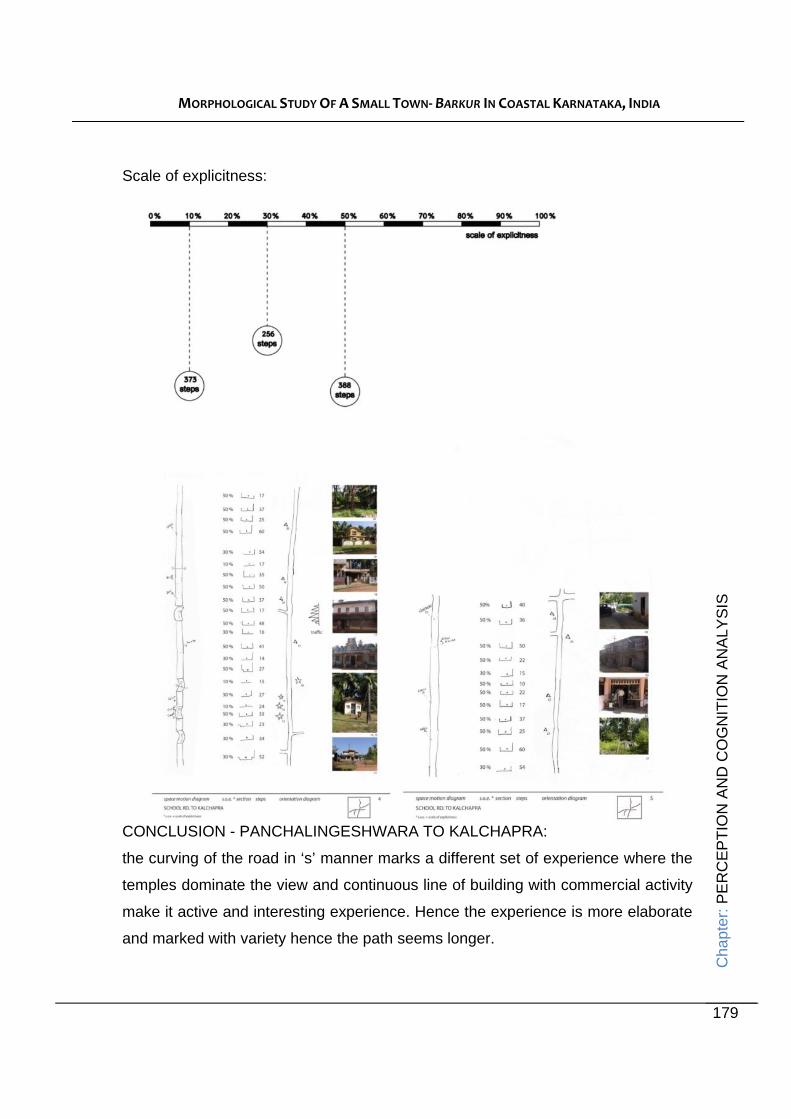
Scale of explicitness:
CONCLUSION - PANCHALINGESHWARA TO KALCHAPRA:
the curving of the road in ‘s’ manner marks a different set of experience where the
temples dominate the view and continuous line of building with commercial activity
make it active and interesting experience. Hence the experience is more elaborate
and marked with variety hence the path seems longer.

MORPHOLOGICAL STUDY OF A SMALL TOWN‐ BARKUR IN COASTAL KARNATAKA, INDIA
Cha
pter
: PE
RC
EPT
ION
AN
D C
OG
NIT
ION
AN
ALY
SIS
180
The increase in activity and more defined edge with built form and commercial
activity suggests the center of the town and the two storied buildings on either side
of the road give better enclosure and sense of definition to the road.
Also the change in noise level many auto-rickshaws on the streets and other
activity and traffic noise make it part of main town activity.
Measured length of road: 1091 steps (approx. 75 cmx 1091=81825cm)
Vegetation: 20 %
Noise-level: 8 in Scale of 1 to10 where 1 is quiet and ten is noisy
No of noted(landmarks): 4 @ interval: ~ 270 steps
No of noted (nodes):8 @ interval: ~ 140 steps
Scale of explicitness:
MORPHOLOGICAL STUDY OF A SMALL TOWN‐ BARKUR IN COASTAL KARNATAKA, INDIA
Cha
pter
: PE
RC
EPT
ION
AN
D C
OG
NIT
ION
AN
ALY
SIS
181
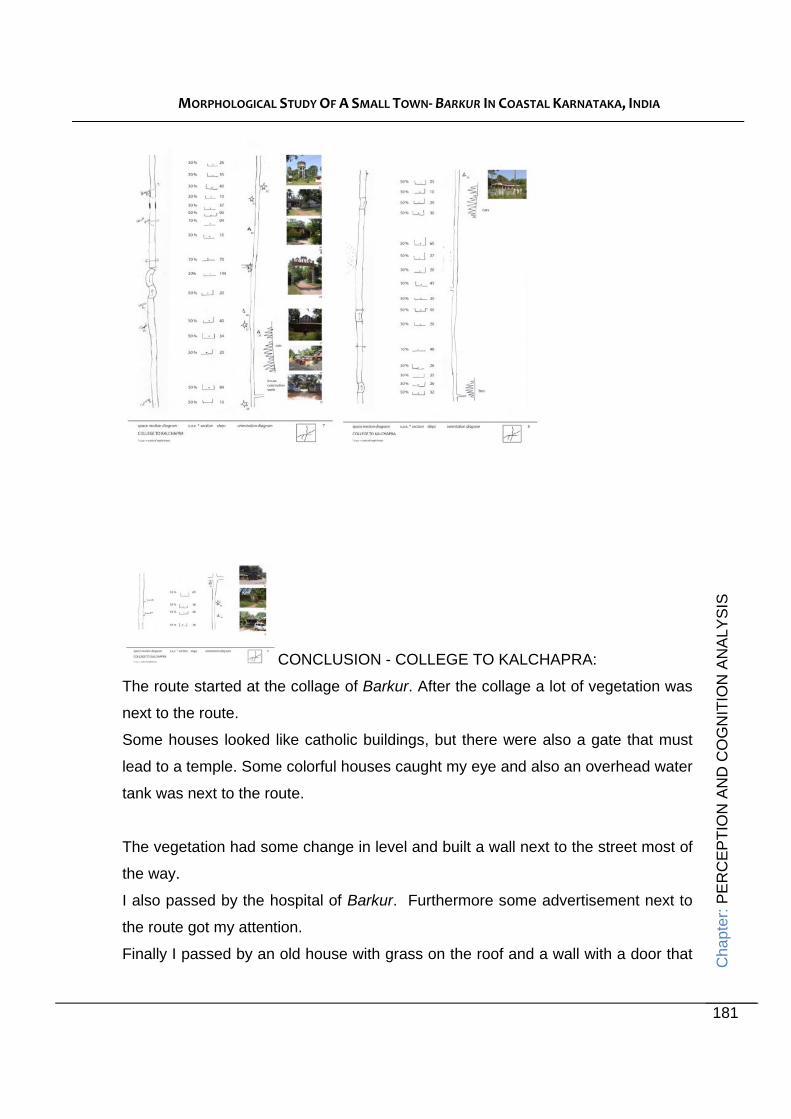
CONCLUSION - COLLEGE TO KALCHAPRA:
The route started at the collage of Barkur. After the collage a lot of vegetation was
next to the route.
Some houses looked like catholic buildings, but there were also a gate that must
lead to a temple. Some colorful houses caught my eye and also an overhead water
tank was next to the route.
The vegetation had some change in level and built a wall next to the street most of
the way.
I also passed by the hospital of Barkur. Furthermore some advertisement next to
the route got my attention.
Finally I passed by an old house with grass on the roof and a wall with a door that
MORPHOLOGICAL STUDY OF A SMALL TOWN‐ BARKUR IN COASTAL KARNATAKA, INDIA
Cha
pter
: PE
RC
EPT
ION
AN
D C
OG
NIT
ION
AN
ALY
SIS
182
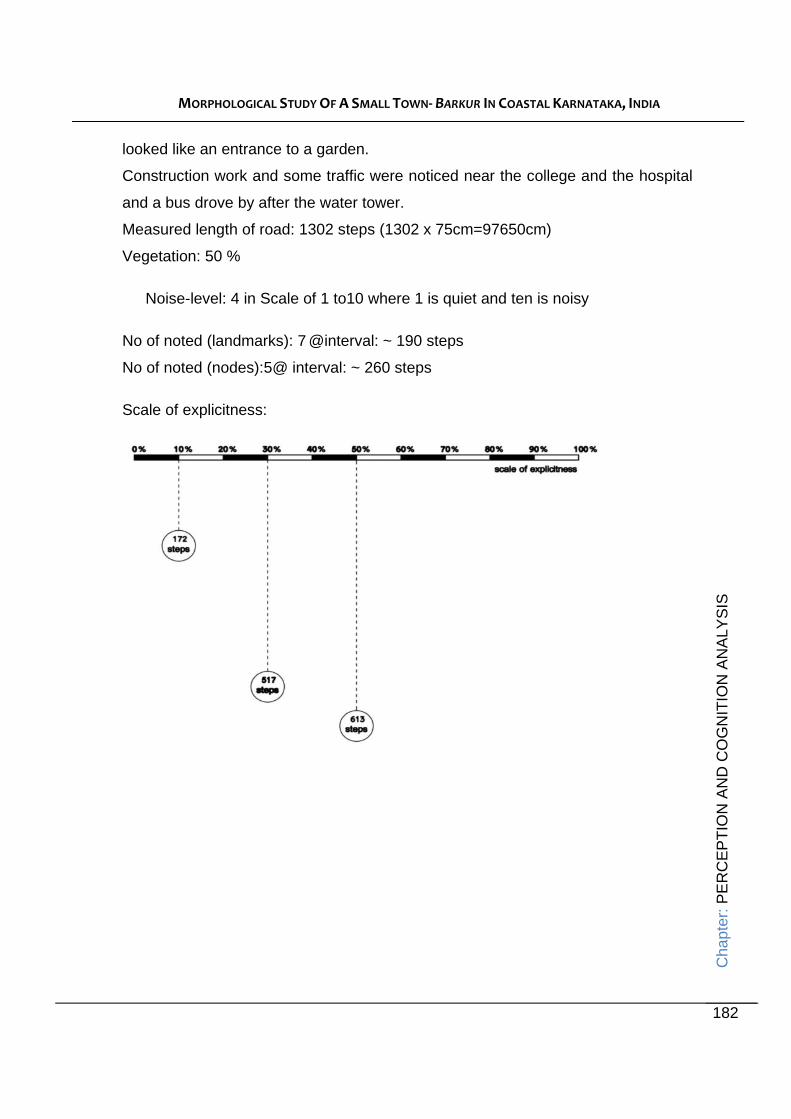
looked like an entrance to a garden.
Construction work and some traffic were noticed near the college and the hospital
and a bus drove by after the water tower.
Measured length of road: 1302 steps (1302 x 75cm=97650cm)
Vegetation: 50 %
Noise-level: 4 in Scale of 1 to10 where 1 is quiet and ten is noisy
No of noted (landmarks): 7 @interval: ~ 190 steps
No of noted (nodes):5@ interval: ~ 260 steps
Scale of explicitness:

MORPHOLOGICAL STUDY OF A SMALL TOWN‐ BARKUR IN COASTAL KARNATAKA, INDIA
Cha
pter
: PE
RC
EPT
ION
AN
D C
OG
NIT
ION
AN
ALY
SIS
183
CONCLUSION - HOSAKERI TO KALCHAPRA:
The route started at the main road surrounded by open field. There was only one
house in the middle of the vegetation. On both sides the level changed to a lower
level.
The street was surrounded by vegetation on the way and only some houses
hidden behind trees were there. When I got closer to Kalchapra the situation
changed and long houses with different kind of shops where on one side and a
rickshaw stand at a wall on the other side.
It was very loud because of the traffic and the horns.
Measured length of road: 205 steps(205x75cm= 15375cm)
Vegetation: 60 %
Noise-level: 9 in Scale of 1 to10 where 1 is quiet and ten is noisy

MORPHOLOGICAL STUDY OF A SMALL TOWN‐ BARKUR IN COASTAL KARNATAKA, INDIA
Cha
pter
: PE
RC
EP
TIO
N A
ND
CO
GN
ITIO
N A
NA
LYSI
S
184
No of noted (landmarks): 0 intervals: -
No of noted (nodes): 3 intervals: ~ 70 steps
Scale of explicitness:
CONCLUSION - CHOWLIKERI TO TURN TO RAILWAY STATION:
The route started at Chowlikeri temple. I saw a gate in front of the building. After
some meters there was another religious building but it was built at a change of
level in higher position.
Some pink and yellow houses caught my eye and a house that was a bit away of
the street hidden by trees.
There was also an entrance to a garden that looked very old to me and finally I
MORPHOLOGICAL STUDY OF A SMALL TOWN‐ BARKUR IN COASTAL KARNATAKA, INDIA
Cha
pter
: PE
RC
EPT
ION
AN
D C
OG
NIT
ION
AN
ALY
SIS
185
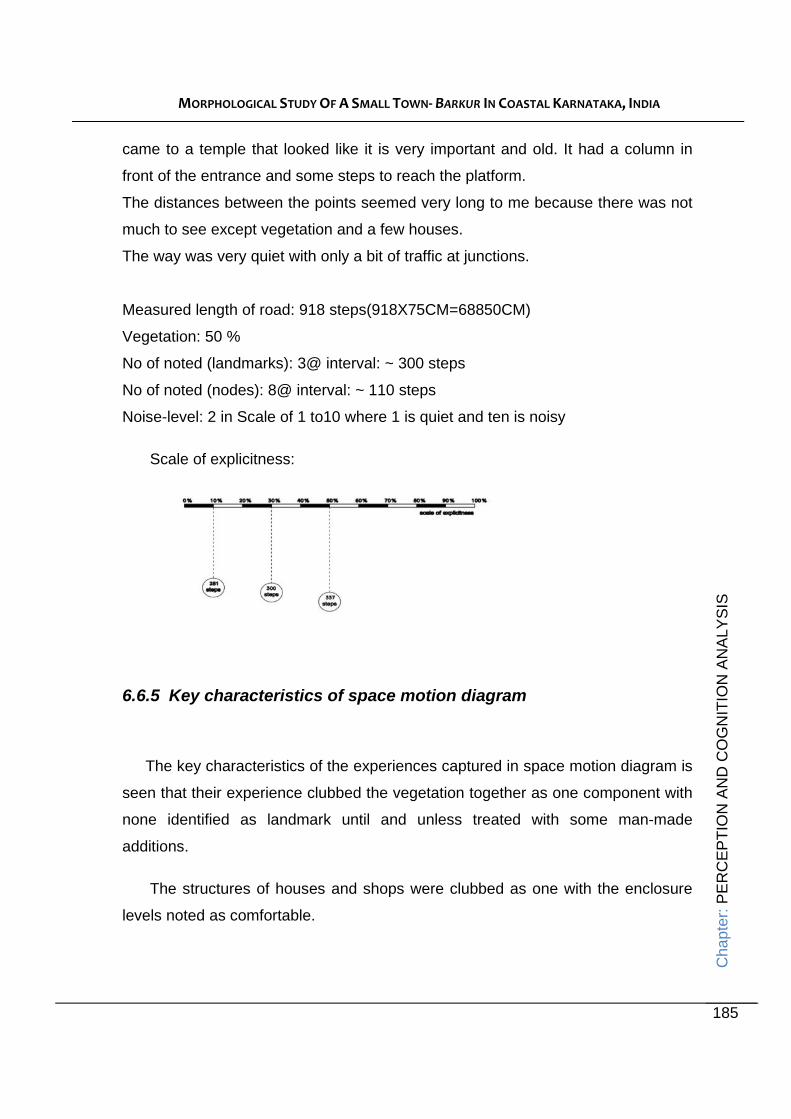
came to a temple that looked like it is very important and old. It had a column in
front of the entrance and some steps to reach the platform.
The distances between the points seemed very long to me because there was not
much to see except vegetation and a few houses.
The way was very quiet with only a bit of traffic at junctions.
Measured length of road: 918 steps(918X75CM=68850CM)
Vegetation: 50 %
No of noted (landmarks): 3@ interval: ~ 300 steps
No of noted (nodes): 8@ interval: ~ 110 steps
Noise-level: 2 in Scale of 1 to10 where 1 is quiet and ten is noisy
Scale of explicitness:
6.6.5 Key characteristics of space motion diagram
The key characteristics of the experiences captured in space motion diagram is
seen that their experience clubbed the vegetation together as one component with
none identified as landmark until and unless treated with some man-made
additions.
The structures of houses and shops were clubbed as one with the enclosure
levels noted as comfortable.

MORPHOLOGICAL STUDY OF A SMALL TOWN‐ BARKUR IN COASTAL KARNATAKA, INDIA
Cha
pter
: PE
RC
EPT
ION
AN
D C
OG
NIT
ION
AN
ALY
SIS
186
Too much vegetation was uncomfortable as she was not familiar with what to
do or how to comprehend.
The temples and other ancient structures caught her attention as distinct.
Wells and other water bodies also were found fascinating and were marked as
nodes.
It is seen that they identified the roads as main roads when the enclosure was
more than 30% and most often 50%.
The landmarks in the main part of the town was marked at an interval of 190
steps (190X0.75=142.5m) whereas the other ends of the road the landmark
scattered at a distance of 350 steps (350X0.75=262.5m)
The nodes were found at an interval of 150-200steps (112.5-150m).
The maximum distance walked was that of 500m from the central node which
is the main bus stand. Hence we find here that the experience of the visitor is
guided by the distance from the node.
The amount of enclosure and guided routes, well defined by the structures with
familiar functions and distinct landmark to keep the interest of the town, were found
as comfortable.
The unique features of the town and history would add flavor to the experience.
Lack of defined routes and wild landscape makes a visitor disoriented and
uncomfortable. Also venturing very far off the main landmark is difficult without
guidance.
The space motion diagram analysis shows that a visitor is guided by the traffic
and movement of people in general and the type of built forms along the road.
Hence when the enclosure through built form is between 30-50% it is comfortable
and considered town. A landmark every 300-500 steps makes it comfortable to
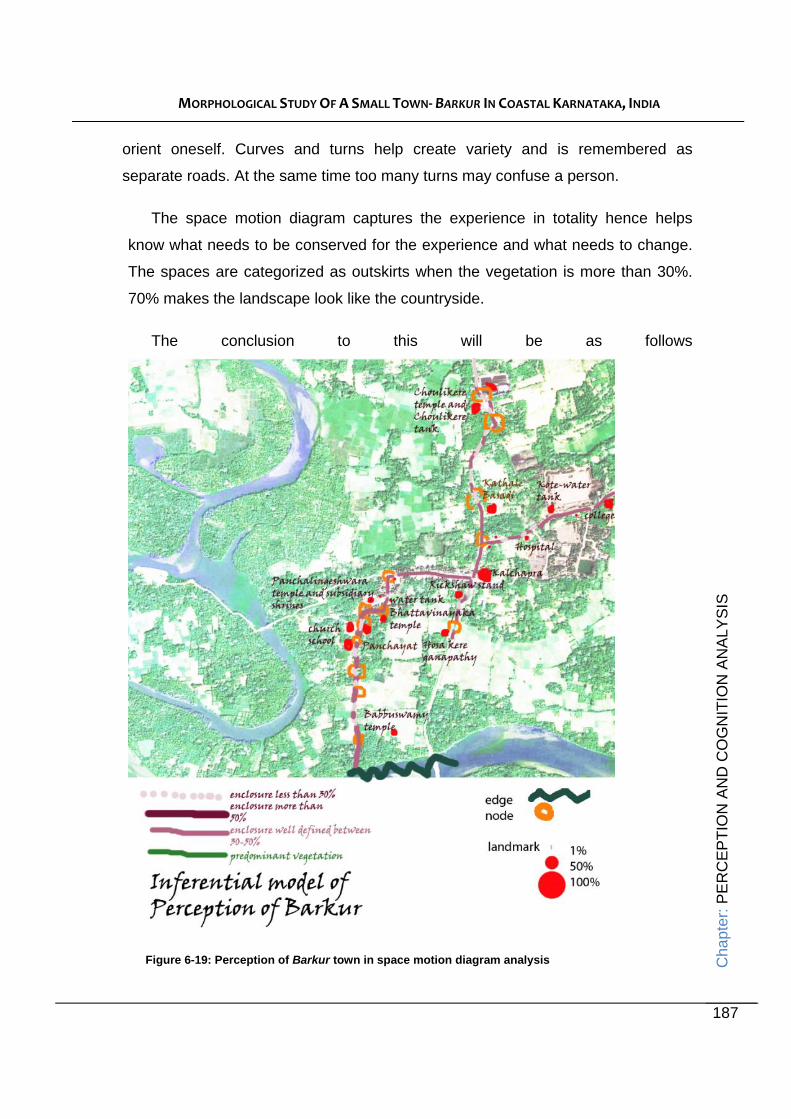
MORPHOLOGICAL STUDY OF A SMALL TOWN‐ BARKUR IN COASTAL KARNATAKA, INDIA
Cha
pter
: PE
RC
EPT
ION
AN
D C
OG
NIT
ION
AN
ALY
SIS
187
orient oneself. Curves and turns help create variety and is remembered as
separate roads. At the same time too many turns may confuse a person.
The space motion diagram captures the experience in totality hence helps
know what needs to be conserved for the experience and what needs to change.
The spaces are categorized as outskirts when the vegetation is more than 30%.
70% makes the landscape look like the countryside.
The conclusion to this will be as follows
Figure 6-19: Perception of Barkur town in space motion diagram analysis

MORPHOLOGICAL STUDY OF A SMALL TOWN‐ BARKUR IN COASTAL KARNATAKA, INDIA
Cha
pter
: PE
RC
EPT
ION
AN
D C
OG
NIT
ION
AN
ALY
SIS
188
Figure 6-20: conclusion of perception of town in inferential mode
6.7 Reading from cognition mapping from three modes: OPERATIVE MODE- Interpretive mode/ Operative mode which is the cognitive
representation of the spatial environment deals with the process of mapping the
spatial cognition, where the spatial cognition of objects is derived from the people.
This is derived from sketch map analysis, verbal description of routes and nodes
and photograph identification. It is noted that spatial cognition develops
ontogenetically from need based to complex diagram of orientation, personal need
MORPHOLOGICAL STUDY OF A SMALL TOWN‐ BARKUR IN COASTAL KARNATAKA, INDIA
Cha
pter
: PE
RC
EPT
ION
AN
D C
OG
NIT
ION
AN
ALY
SIS
189
changing and realigning the environment mapping, variables such as sex, ethnic
group also affecting the cognition, studies found overlap in results of verbal,
graphical and behavioral studies of spatial orientation. In this research the
operative model has been derived by analysis of perception of 80 locals which has
cultural bias, social bias, familiarity of town and impact of physical features and
configuration of town.
RESPONSIVE MODE – Responsive mode is to find the environmental stressors
that affect the behavior of people and hence qualify the physical attributes with
respect to experience of form and its interpretation without being familiar with the
town. They can be measured objectively and categorized by way of notation
diagrams, here there is a need for trained people in notation to filter the
environmental features and note its influence in the spatial cognition process
(space –motion diagram). Again objectivity is achieved by standardizing the
aspects to be noted. This is used to distinguish physical aspects and measure its
influence to perception and cognition in a diagram. In this study the analysis was
done by four different students and summarized to avoid individual bias.
INFERENTIAL MODE- Inferential mode is to note the features of the environment
and its influence in the visual understanding of the environment or immediate
reaction. This is also a measure to relate the physical form of elevation to the
cognition of people derived from sketch map analysis. The trained eye is used to
objectively classify the elements of form that influence the assessment of the
environment and hence influence the attitude of people. The parameters selected
are based on the visual features assessed from the road and does not include
experiences within the structures and the activities therein. The elements
identified are the roofline, opening or porosity, material and color, enclosure (width
to height ratio), dominant features, landscape as a treatment.
MORPHOLOGICAL STUDY OF A SMALL TOWN‐ BARKUR IN COASTAL KARNATAKA, INDIA
Cha
pter
: PE
RC
EPT
ION
AN
D C
OG
NIT
ION
AN
ALY
SIS
190
The common aspects between the operative mode (by residents), responsive
mode and inferential mode (by first time visitors) are -
• Importance is given to road and accessibility to the main functions of the town. Facilities from the central node (like bust stand) with more than 4 turns in terms of visual axis (depth index in terms of space syntax analysis) are for the residents only.
• If there is visual link to structures from the street, it is comprehended and remembered better than the ones in the interior or hidden by vegetation. Hence in case of visual impact for responsive and inferential perception the depth of building from public space and building space index makes a difference.
• Familiar functions and buildings are identified and remembered for orientation.
• The steep turns and change in physical features of built forms are also part of memory of the town.
• Important landmarks were distinct in terms of their physical features and had open areas around it, marking it special as compared to closely spaced residential and commercial buildings.
The features noted in responsive and inferential mode (by first time visitors)
different from operative mode (done by residents) that influenced perception were
as follows
• The amount of enclosure is distinctly remembered for identification of streets and comfort level while walking.
• The man-made structures defining the enclosure were preferred to natural vegetation. This could also be because the present towns are more defined by built forms than vegetation. Also different areas have different forms of landscape hence difficult to remember and interpret.
• Vegetation is taken as outskirts or beyond the main route hence not used for perception of town character or orientation.
• The requirement of landmarks/ nodes within a distance of 200m was felt by non-residents for orientation which was in form of buildings distinct from the surrounding or a water body or a man-made landscape feature.

MORPHOLOGICAL STUDY OF A SMALL TOWN‐ BARKUR IN COASTAL KARNATAKA, INDIA
Cha
pter
: PE
RC
EP
TIO
N A
ND
CO
GN
ITIO
N A
NA
LYSI
S
191
• Bombardment of variety in elevation features and color lead to confusion and lack of definition in terms of character of the town.
• The visitors would like distinct character of old town to be maintained and the modern structures to be subdued to bring distinct character of the town.
The difference in perception in operative mode (residents) due to non-
physical aspects were as follows
• Awareness of history and appreciation from outside agencies make them want to conserve the old structures and physical features.
• Constant use and visual link from the street increases the association value of the structures in the mind of the people.
• Better road and infrastructure and good condition of built forms is found as most important for wellbeing of the town.
• Up gradation of buildings and more modern facilities are found necessary to relate to the town and make it good for the future. They are not concerned with maintaining distinct character in general structures.
• Locals are able to relate to vegetation and water bodies, but do not use them as important nodes or landmarks.