Embed Size (px)
Citation preview

6. Processes Selection and LayoutOperations ManagementDr. Ron Lembke
Process Flow Structures
• Job Shop - low standardization, every order is a different product, new design
• Batch Shop - Stable line of products, produced in batches
• Assembly Line - Discrete parts moving from workstation to workstation
• Continuous Flow - Undifferentiated flow of product (beer, paper, etc.)
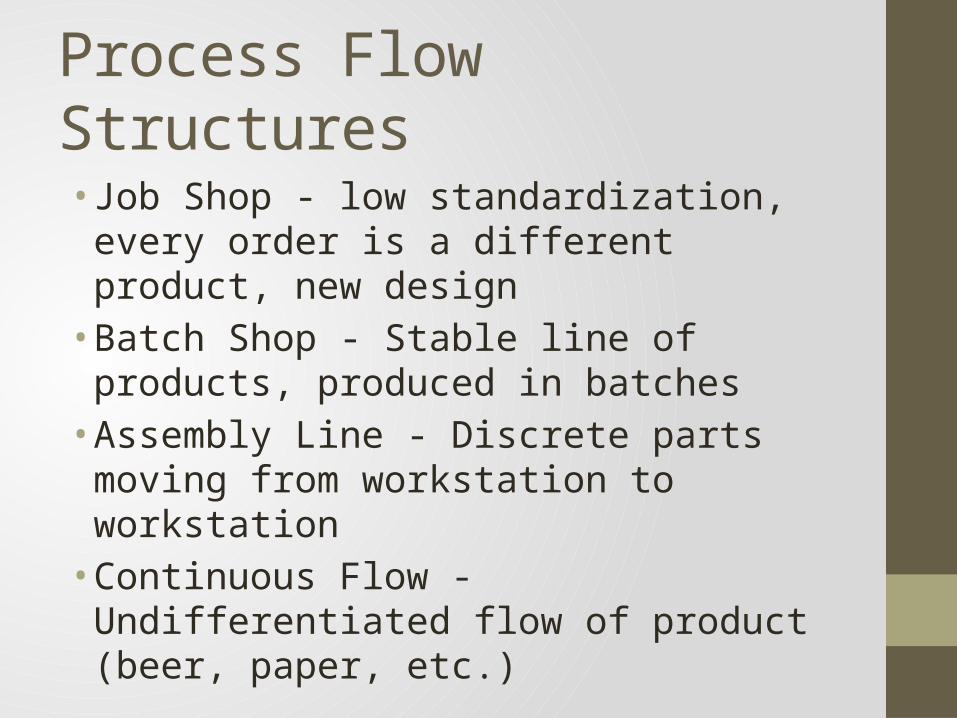
Process Strategy
Variety
Low
Medium
High
VolumeLow Medium High
project
Manufacturing Cell
Workcenter
AssemblyLine Continuous
Process
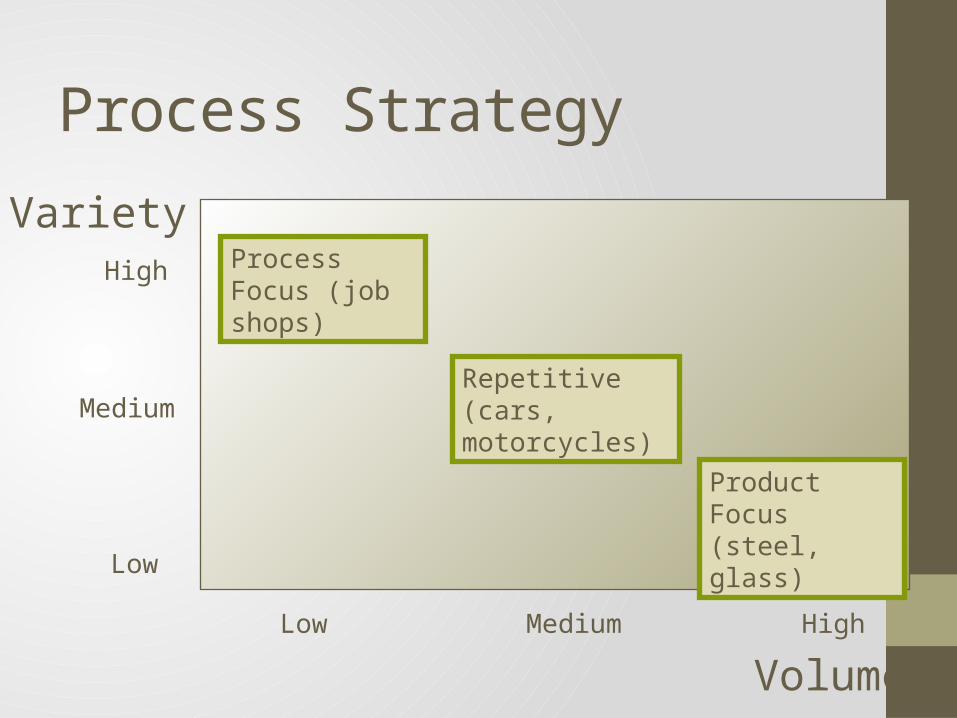
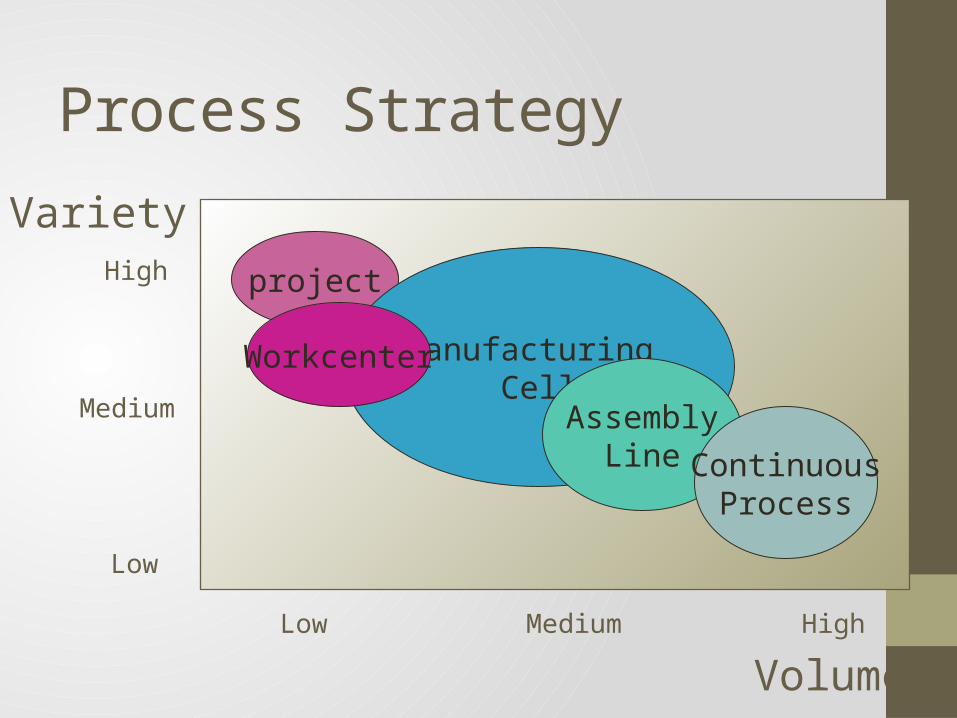
Process Strategy
Variety
Low
Medium
High
VolumeLow Medium High
Process Focus (job shops)
Repetitive (cars, motorcycles)
Product Focus (steel, glass)
Process Focus (Job Shop)• Low volume, high variety, “do it all”• “Job shop” environment (e.g. Kinko’s)• High amount of flexibility• Each job is different• Relatively high cost per unit• Very high flexibility
Process Selection / Evolution• Products tend to move through the four stages over life cycle.• Unit costs decrease as standardization increases, and
production increases.• Flexibility decreases as volume, standardization increase
Designing the System
• How do we decide where to put things?
Layout Types• Project or Fixed-position layout• Process-oriented layout• Product-oriented layout • Office layout• Warehouse layout• Retail/service layout
Project or Fixed-Position• Design is for stationary project • Workers & equipment come to site• Complicating factors
• Limited space at site• Changing material needs
• Examples• Ship building• Highway construction
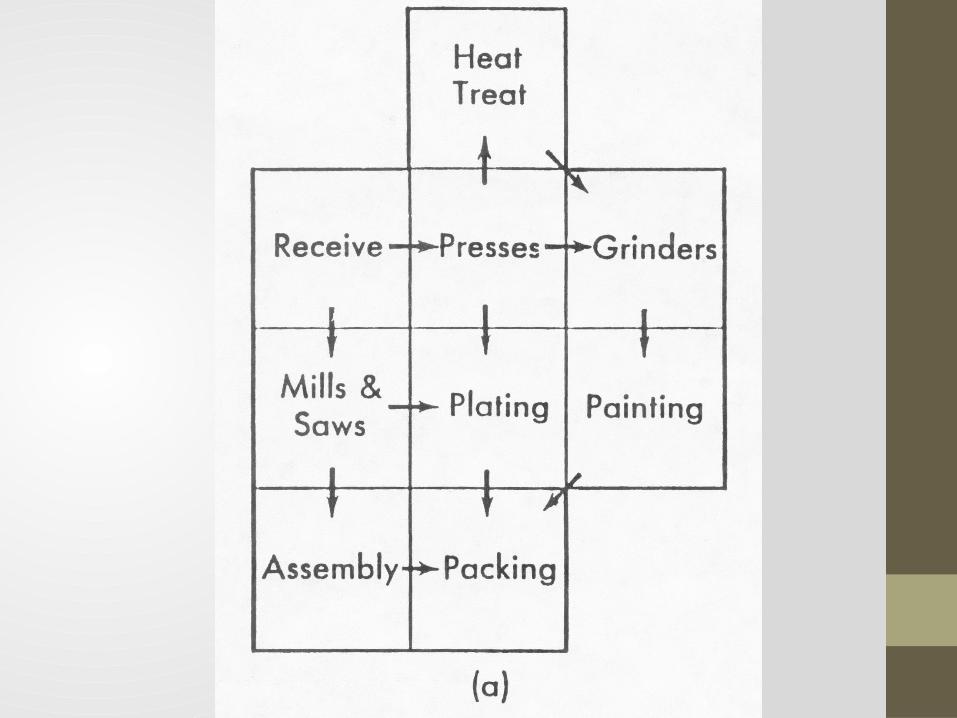
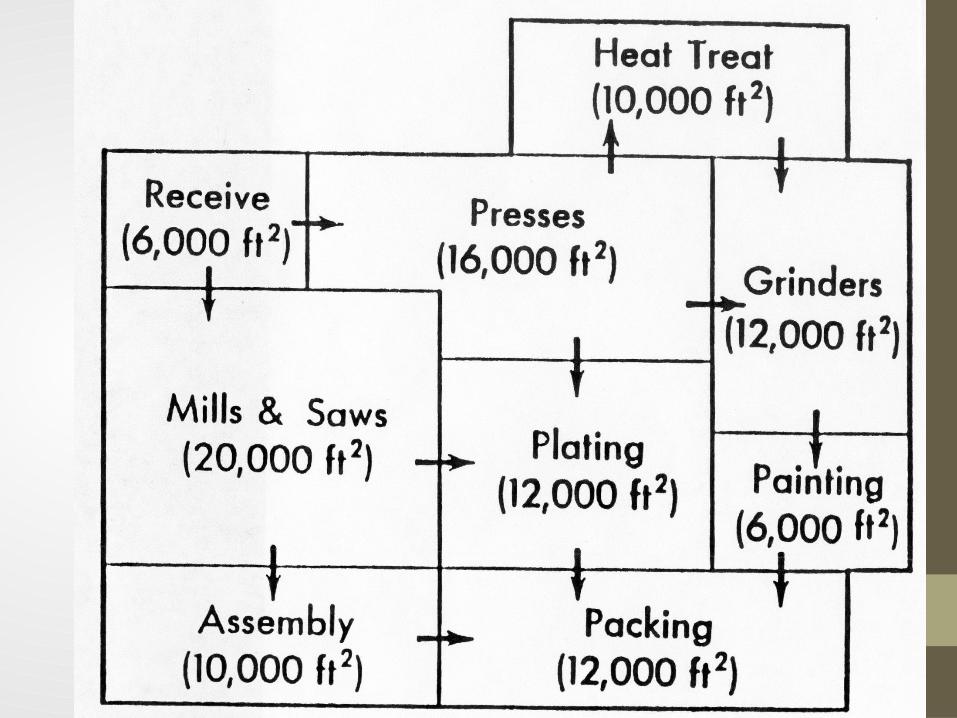
Process-Oriented Layout
• Design places departments with large flows of material or people together
• Dept. areas have similar processes• e.g., All x-ray machines in same area
• Used with process-focused processes• Examples
• Hospitals• Machine shops
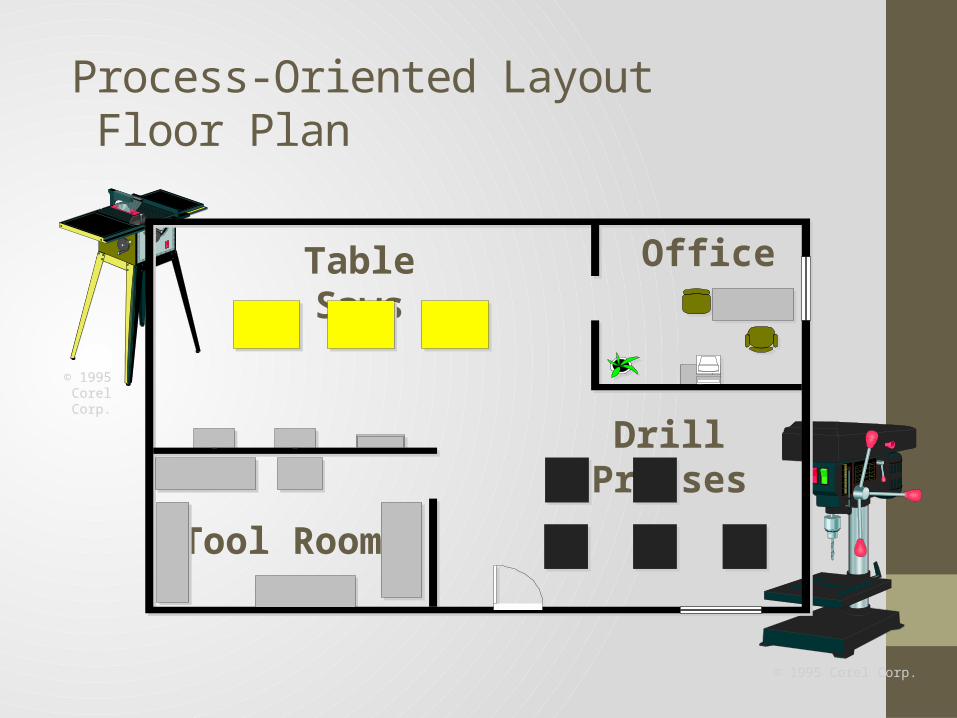
Process-Oriented Layout Floor Plan
Office
Tool Room
Drill Presses
Table Saws
© 1995 Corel Corp.
© 1995 Corel Corp.
Process Layout+ Allows specialization - focus on one skill+ Allows economies of scale - worker can watch several
machines at once+ High level of product flexibility-- Encourages large lot sizes-- Difficult to incorporate into JIT-- Makes cross-training difficult
Product-Oriented Layout
• Facility organized around product• Design minimizes line imbalance
• Delay between work stations• Types: Fabrication line; assembly line• Examples
• Auto assembly line• Brewery• Paper manufacturing.
Cellular Layout (Work Cells)• Special case of process-oriented layout• Consists of different machines brought together to make a
product• May be temporary or permanent• Example: Assembly line set up to produce 3000 identical parts
in a job shop
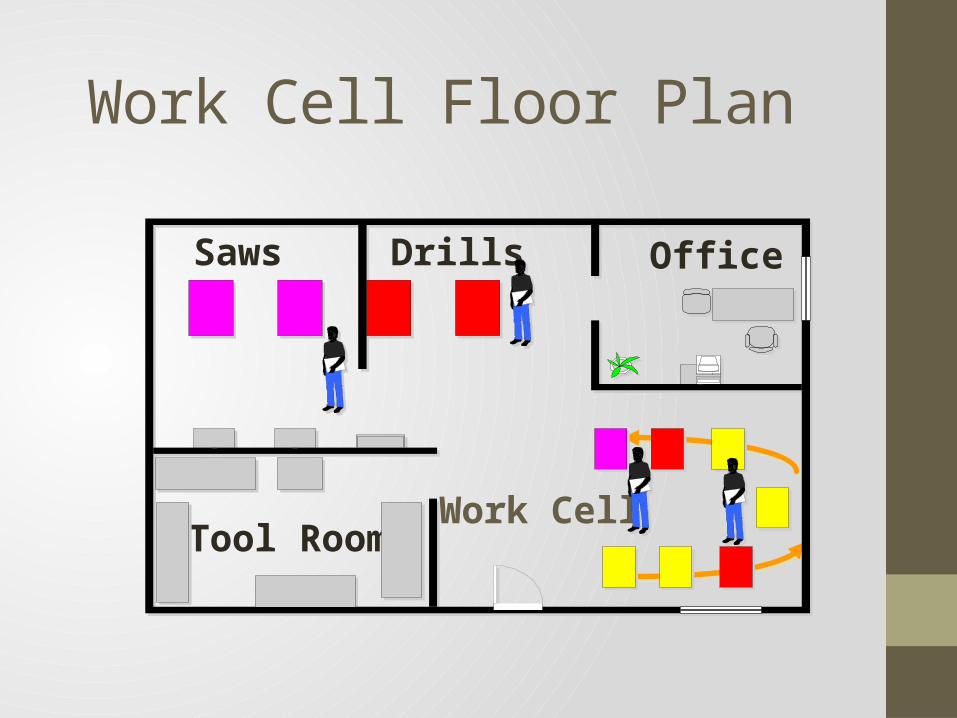
Work Cell Floor Plan
Office
Tool RoomWork Cell
Saws Drills
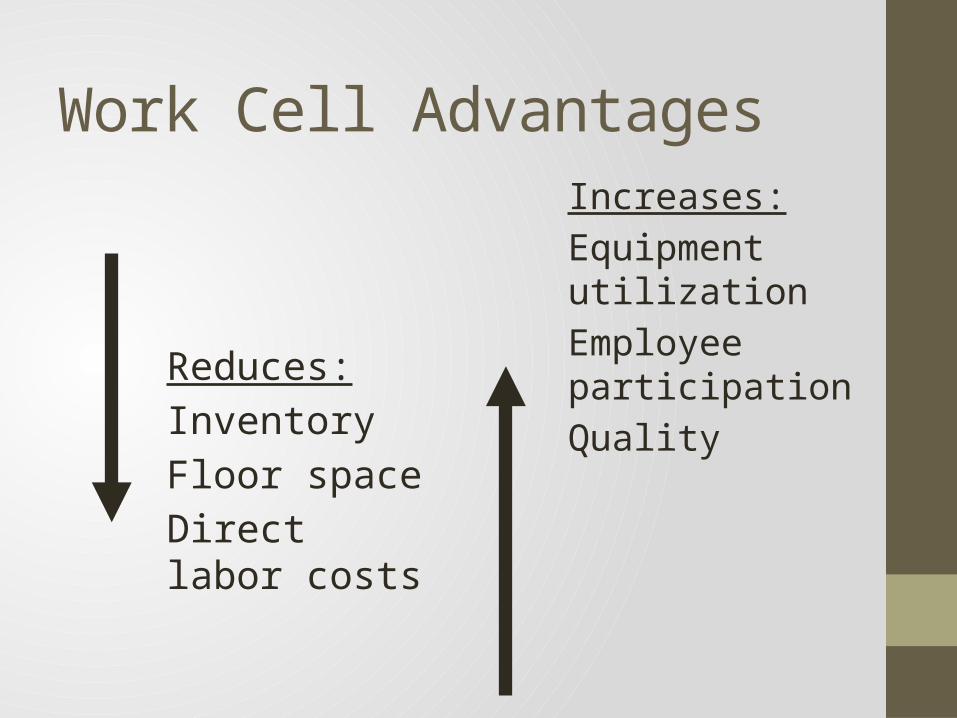
Work Cell Advantages
Reduces:InventoryFloor spaceDirect labor costs
Increases:Equipment utilizationEmployee participationQuality
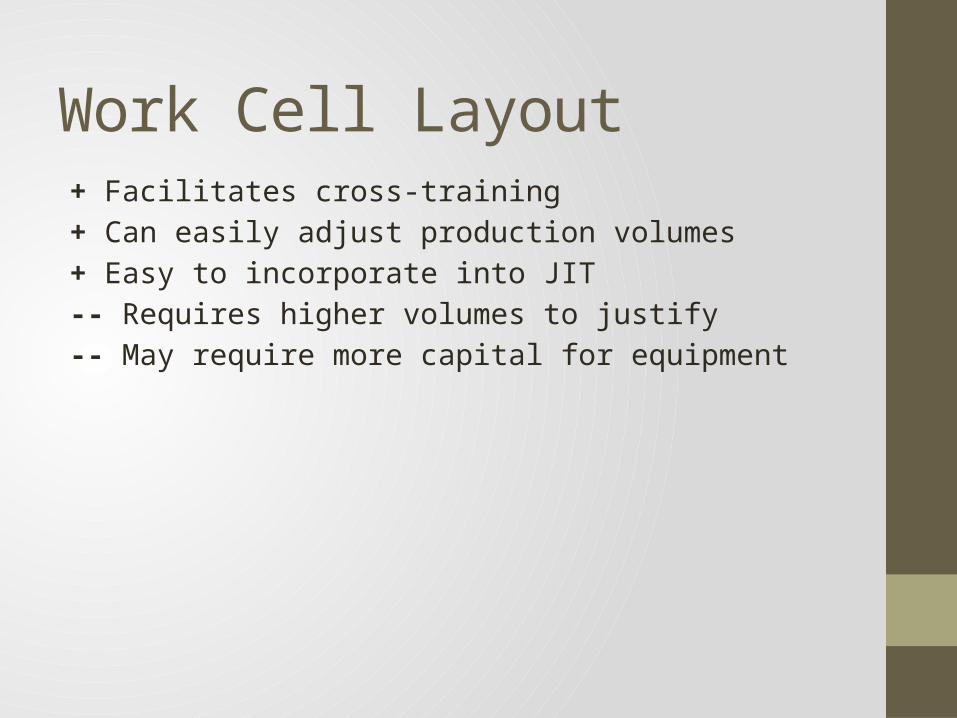
Work Cell Layout+ Facilitates cross-training+ Can easily adjust production volumes+ Easy to incorporate into JIT-- Requires higher volumes to justify-- May require more capital for equipment
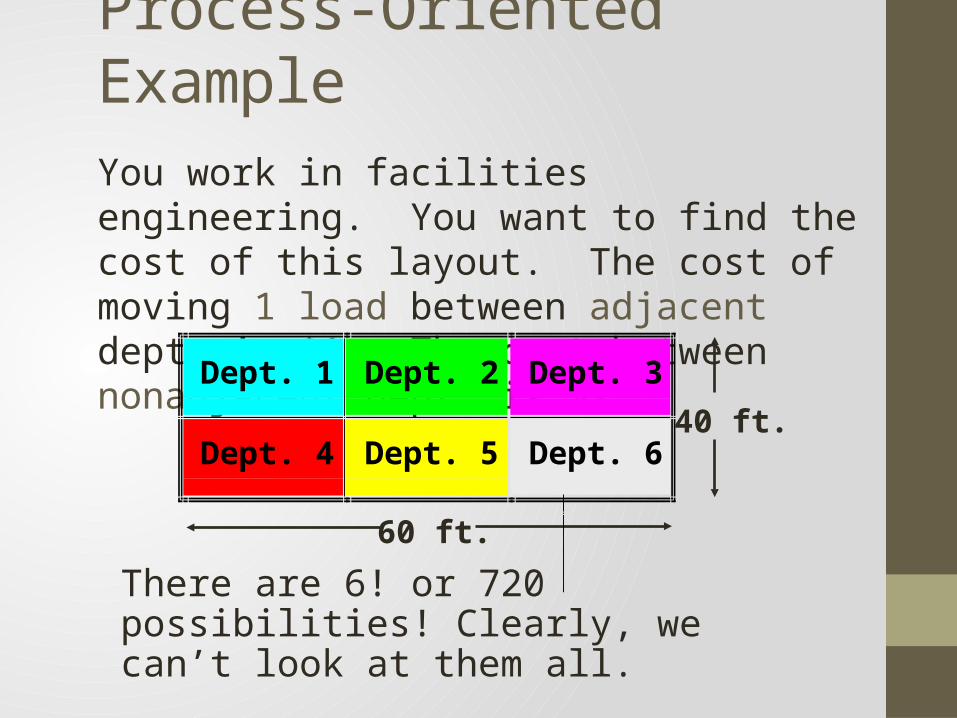
Process-Oriented ExampleYou work in facilities engineering. You want to find the cost of this layout. The cost of moving 1 load between adjacent dept. is $1. The cost between nonadjacent dept. is $2.
60 ft.
40 ft.
Dept. 1 Dept. 2 Dept. 3
Dept. 4 Dept. 5 Dept. 6
There are 6! or 720 possibilities! Clearly, we can’t look at them all.
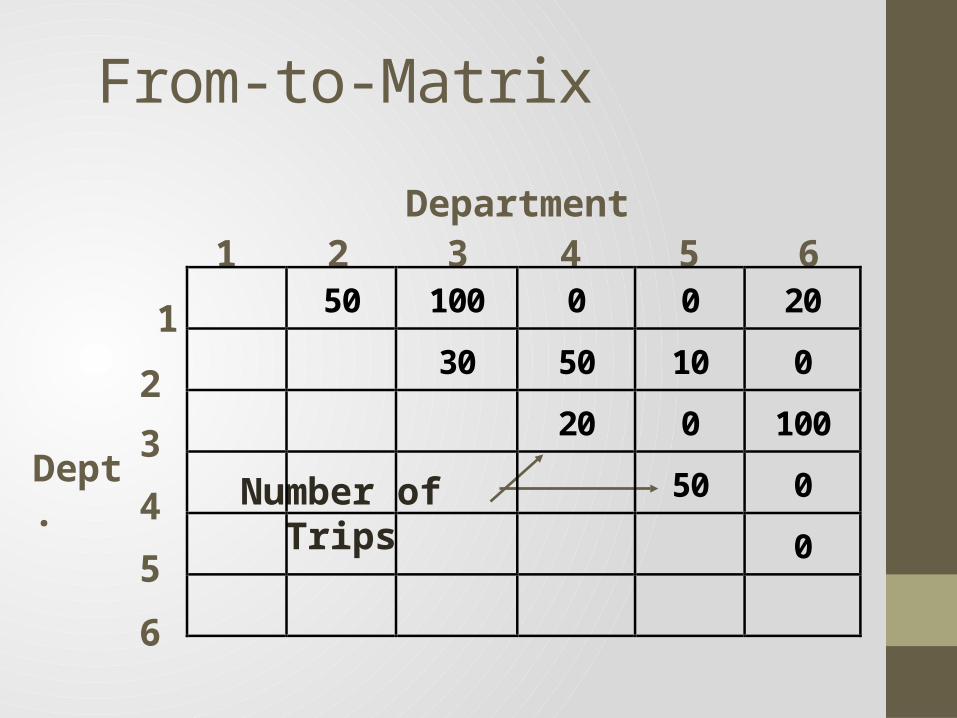
50 100 0 0 20
30 50 10 0
20 0 100
50 0
0
From-to-Matrix
5
1 2 3 4 5 6Department
Dept.
1
2
3
4
6
Number of Trips
20
100
50 30
50
50
10
20
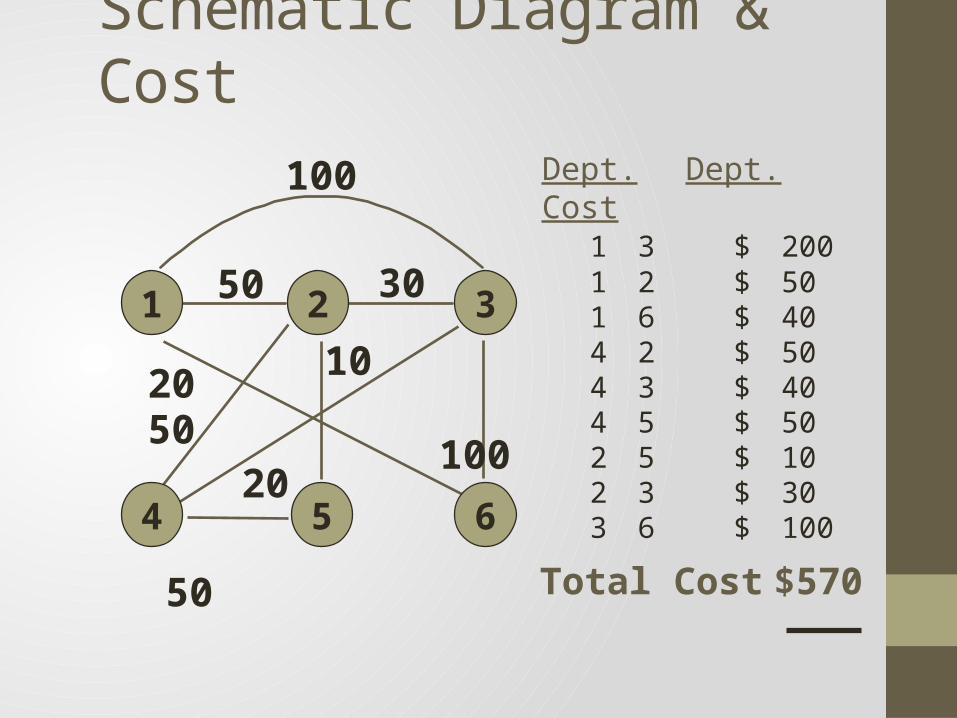
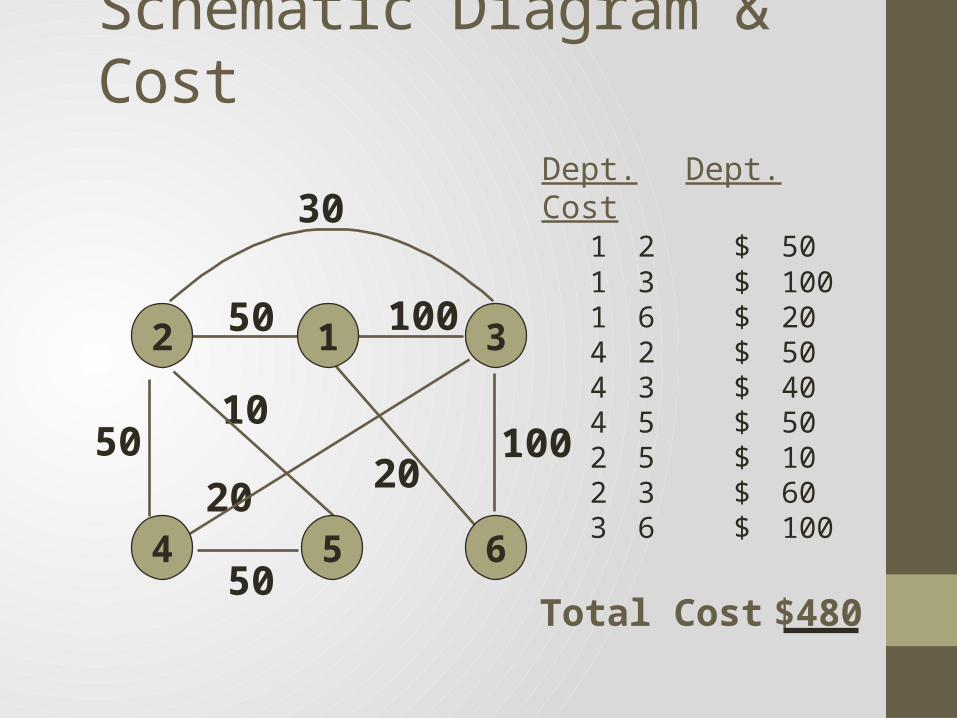
Schematic Diagram & CostDept. Dept. Cost
1 3$ 2001 2$ 501 6$ 404 2$ 504 3$ 404 5$ 502 5$ 102 3$ 303 6$ 100
Total Cost $570
1 2 3
64 5
100
20
30
50 100
50
50
10
20
Schematic Diagram & CostDept. Dept. Cost
1 2$ 501 3$ 1001 6$ 204 2$ 504 3$ 404 5$ 502 5$ 102 3$ 603 6$ 100
Total Cost $480
2 1 3
64 5
100
Line Balancing
• Situation: Assembly-line production.• Many tasks must be performed, and the sequence is flexible• Parts at each station same time• Tasks take different amounts of time• How to give everyone enough, but not too much work for the
limited time.
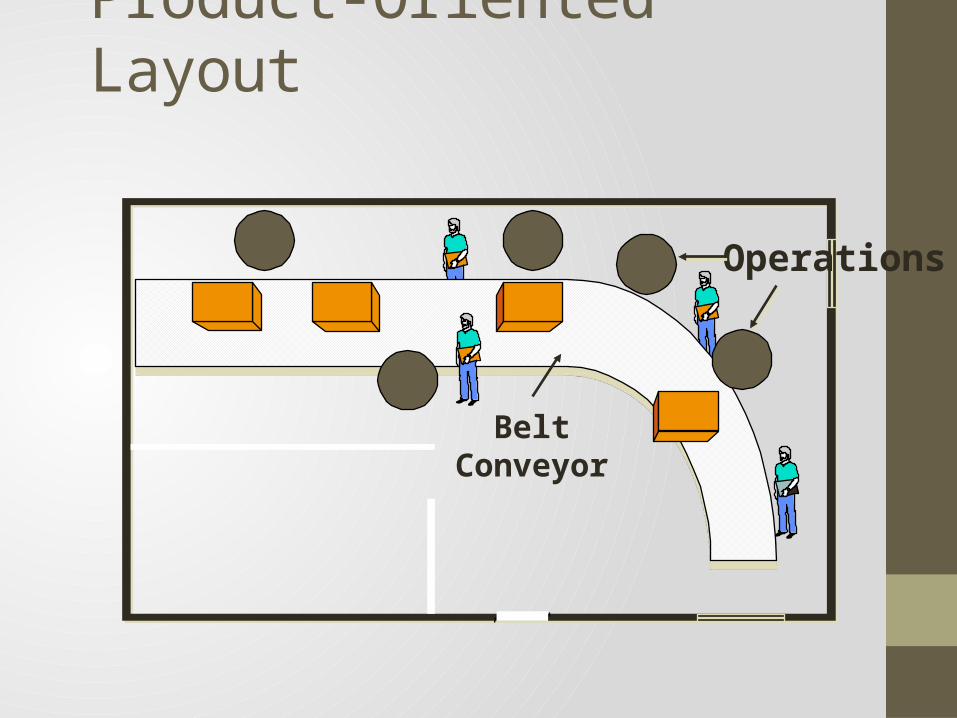
Product-Oriented Layout
Belt Conveyor
Operations
A
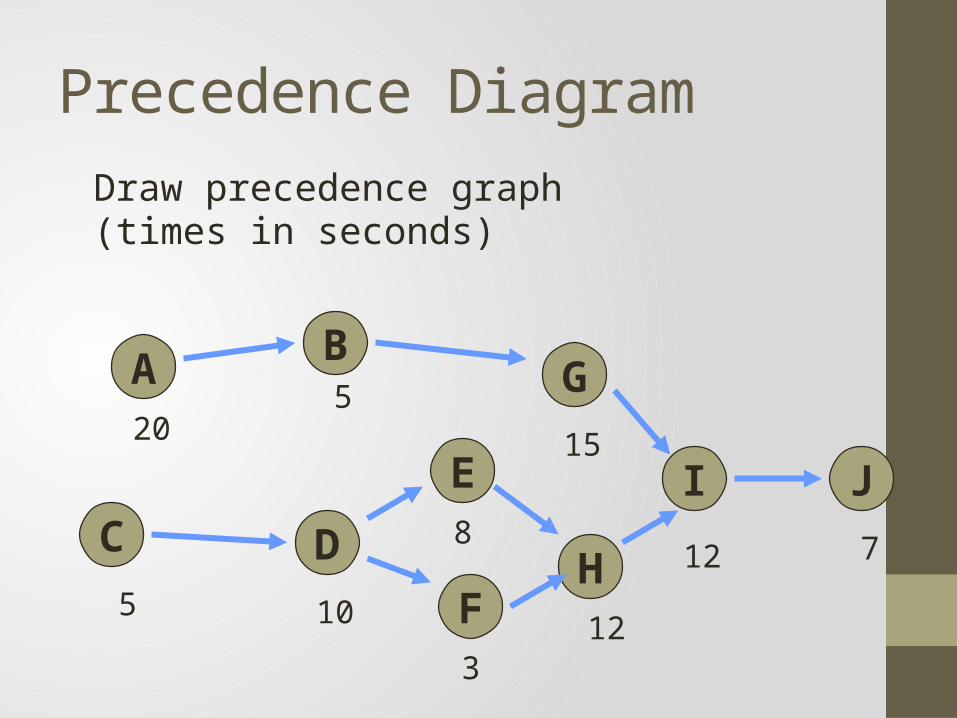
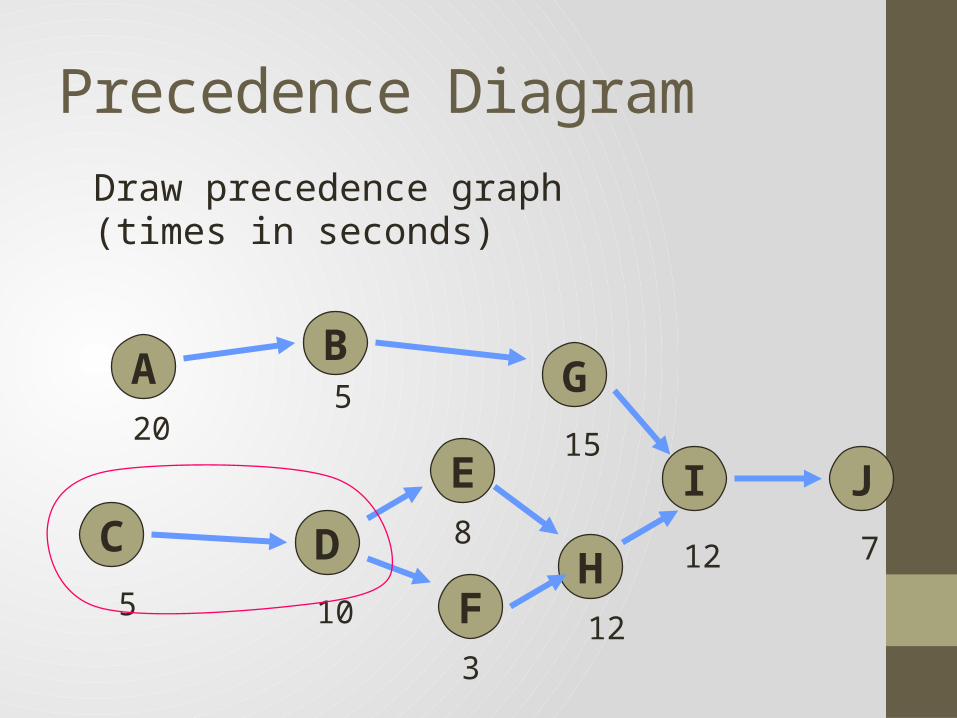
Precedence DiagramDraw precedence graph (times in seconds)
C
F
D
B
E
H
G
I J20
5
15
12
5 10
8
3
7
12
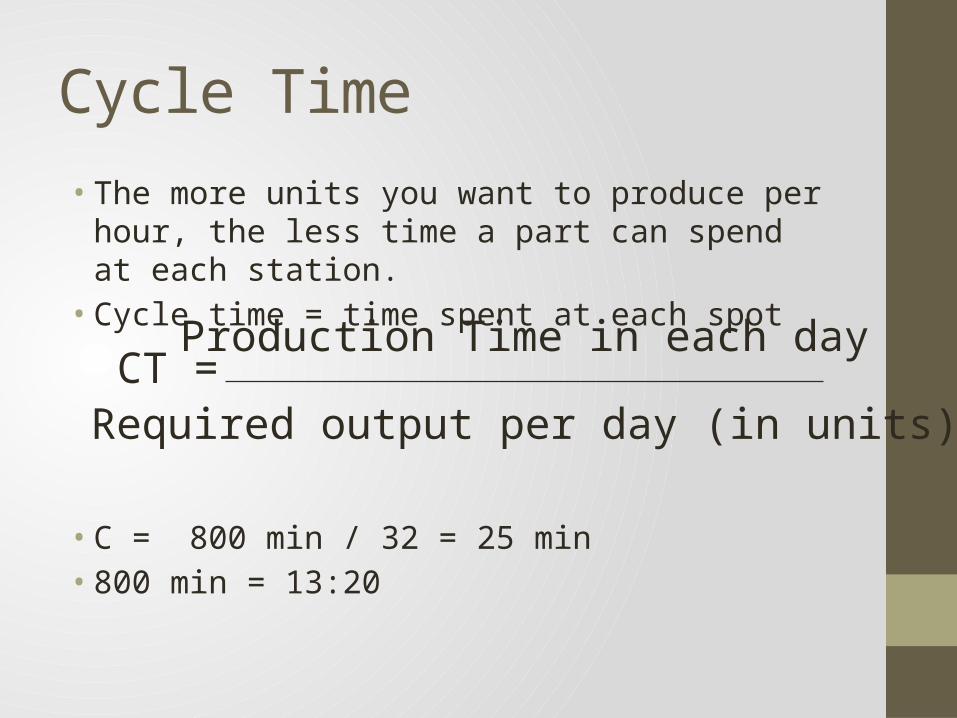
Cycle Time
• The more units you want to produce per hour, the less time a part can spend at each station.
• Cycle time = time spent at each spot
• C = 800 min / 32 = 25 min• 800 min = 13:20
CT =Production Time in each day
Required output per day (in units)
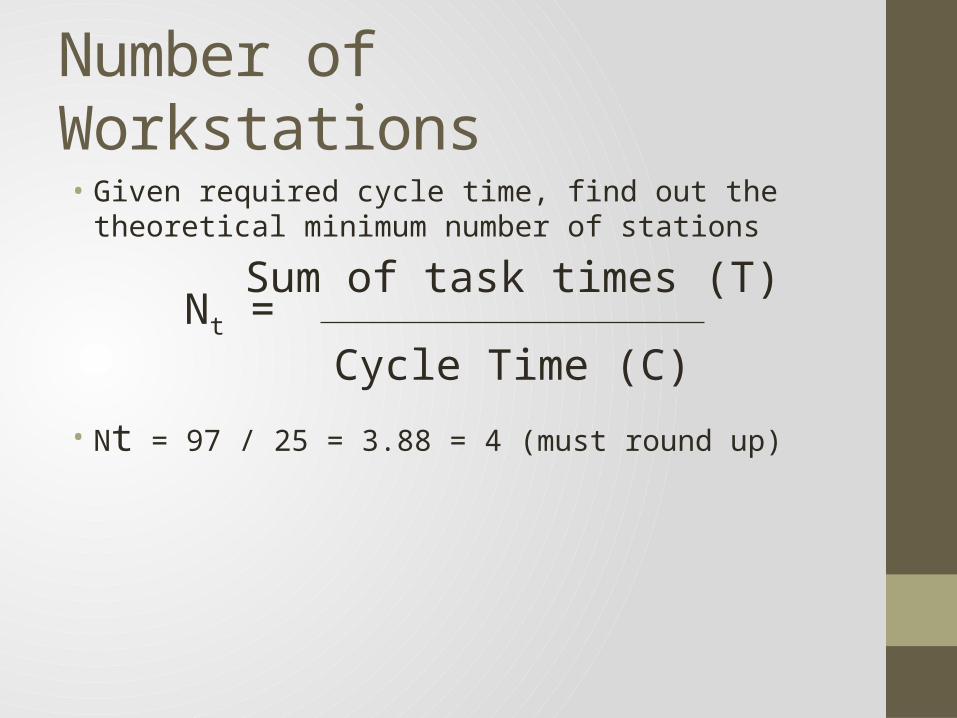
Number of Workstations• Given required cycle time, find out the theoretical minimum
number of stations
• Nt = 97 / 25 = 3.88 = 4 (must round up)
Nt =Sum of task times (T)
Cycle Time (C)
Assignments
Assign tasks by choosing tasks:• with largest number of following tasks• OR by longest time to complete
Break ties by using the other rule
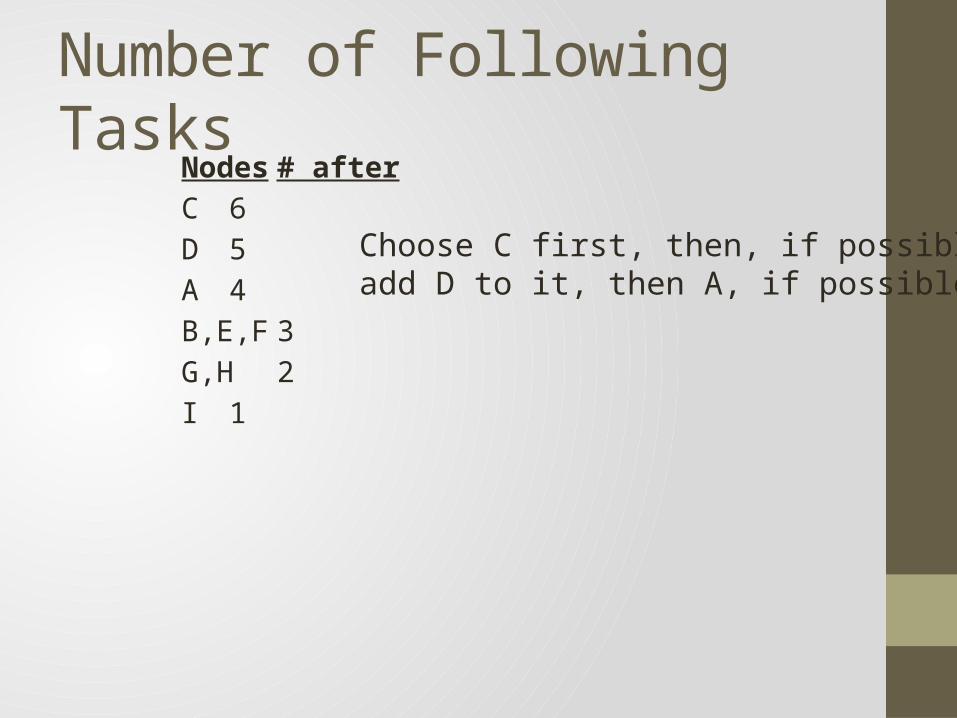
Number of Following TasksNodes # afterC 6D 5A 4B,E,F 3G,H 2I 1
Choose C first, then, if possible,add D to it, then A, if possible.
A
Precedence DiagramDraw precedence graph (times in seconds)
C
F
D
B
E
H
G
I J20
5
15
12
5 10
8
3
7
12
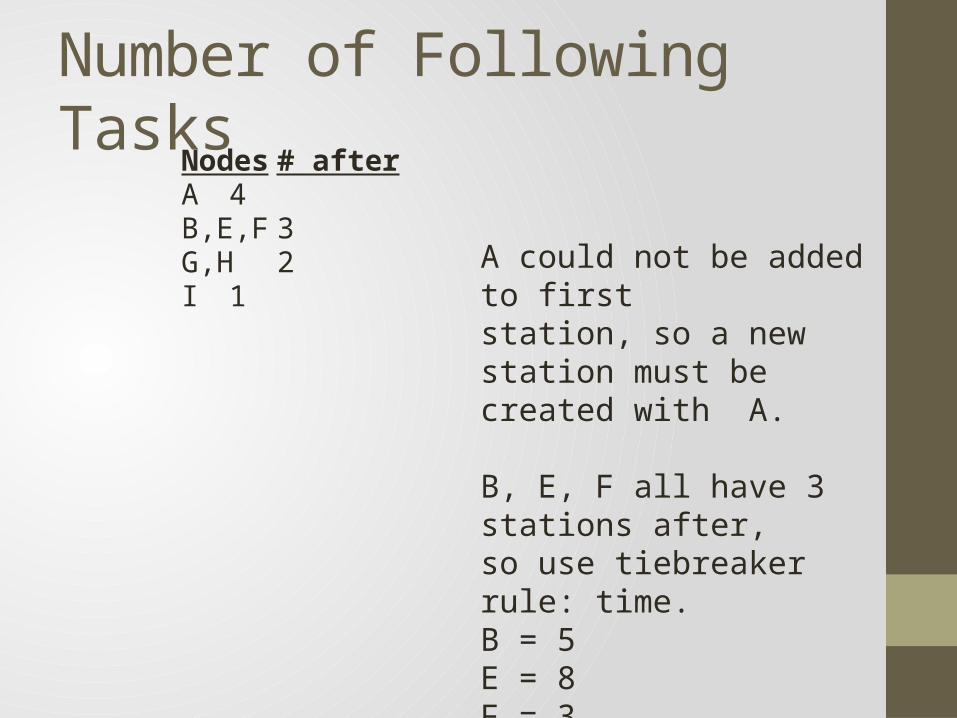
Number of Following TasksNodes # afterA 4B,E,F 3G,H 2I 1
A could not be added to firststation, so a new station must becreated with A.
B, E, F all have 3 stations after,so use tiebreaker rule: time.B = 5E = 8F = 3 Use E, then B, then F.
A
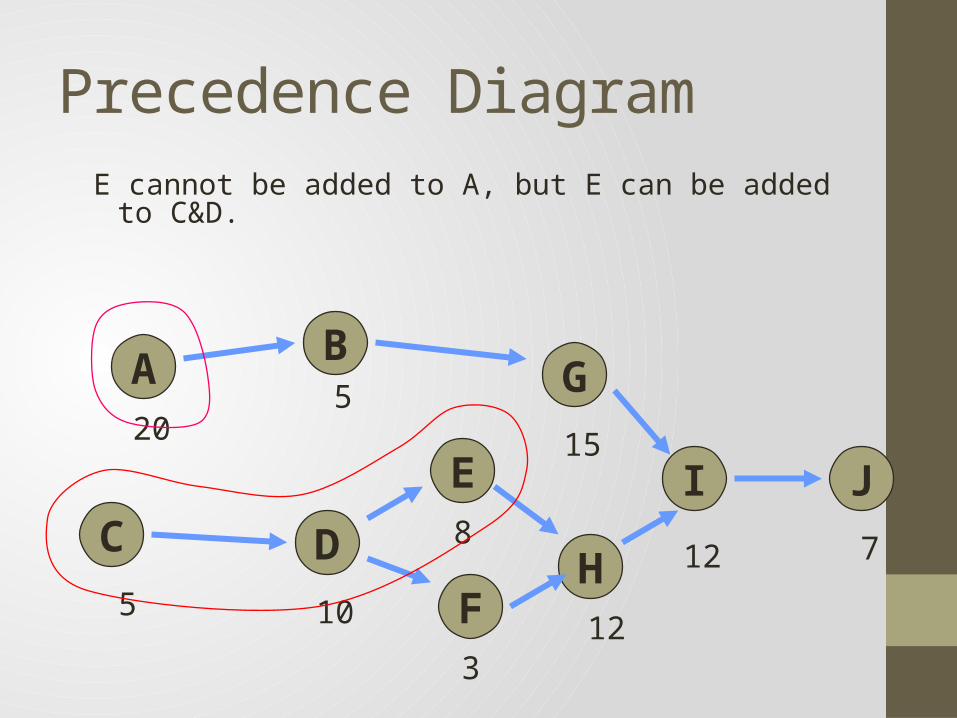
Precedence DiagramE cannot be added to A, but E can be added to C&D.
C
F
D
B
E
H
G
I J20
5
15
12
5 10
8
3
7
12
A
Precedence Diagram
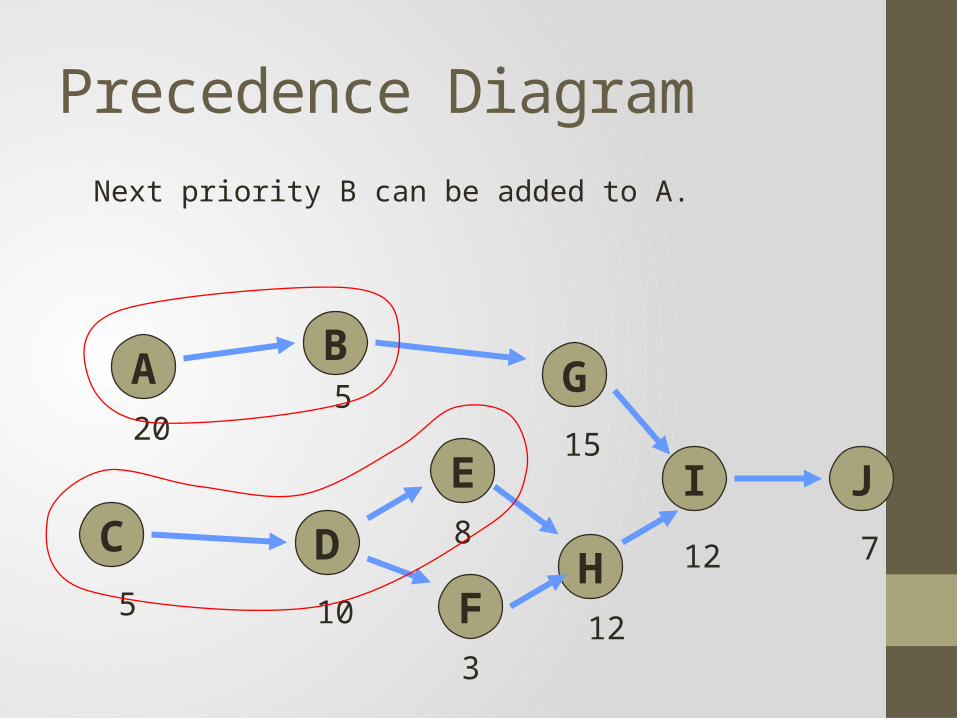
Next priority B can be added to A.
C
F
D
B
E
H
G
I J20
5
15
12
5 10
8
3
7
12
A
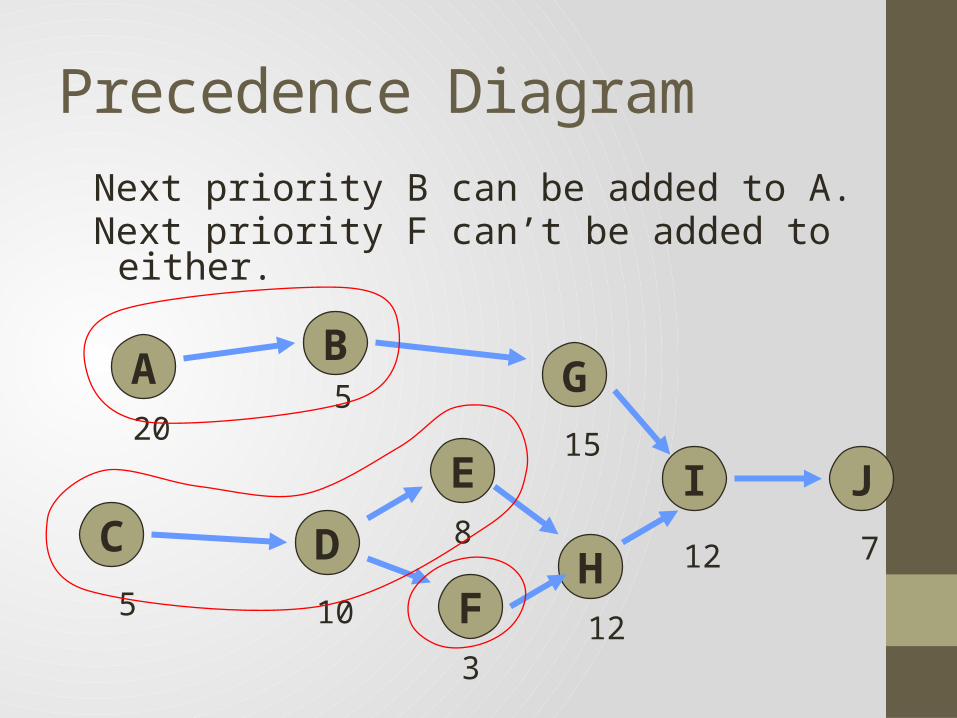
Precedence DiagramNext priority B can be added to A.Next priority F can’t be added to either.
C
F
D
B
E
H
G
I J20
5
15
12
5 10
8
3
7
12
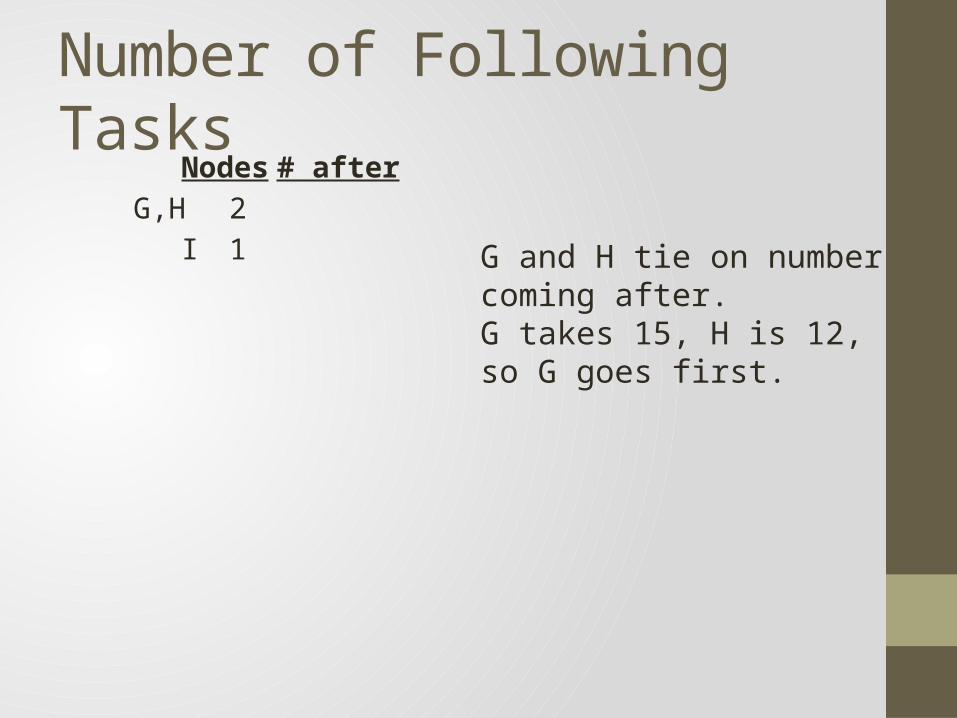
Number of Following TasksNodes # after
G,H 2I 1 G and H tie on number coming
after. G takes 15, H is 12, so G goes first.
A
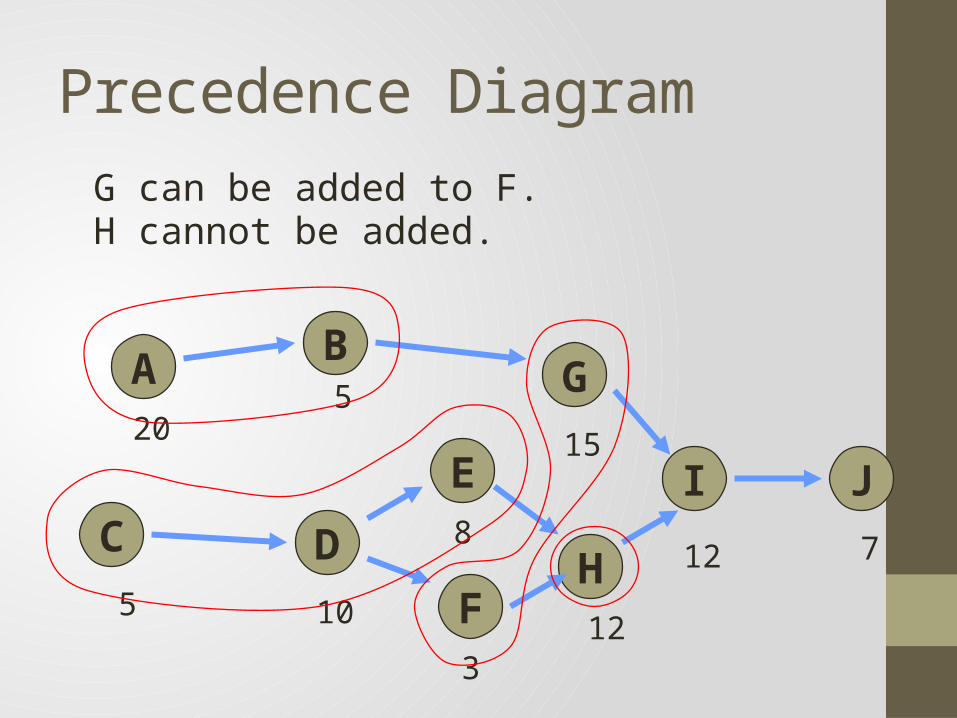
Precedence DiagramG can be added to F.H cannot be added.
C
F
D
B
E
H
G
I J20
5
15
12
5 10
8
3
7
12
A
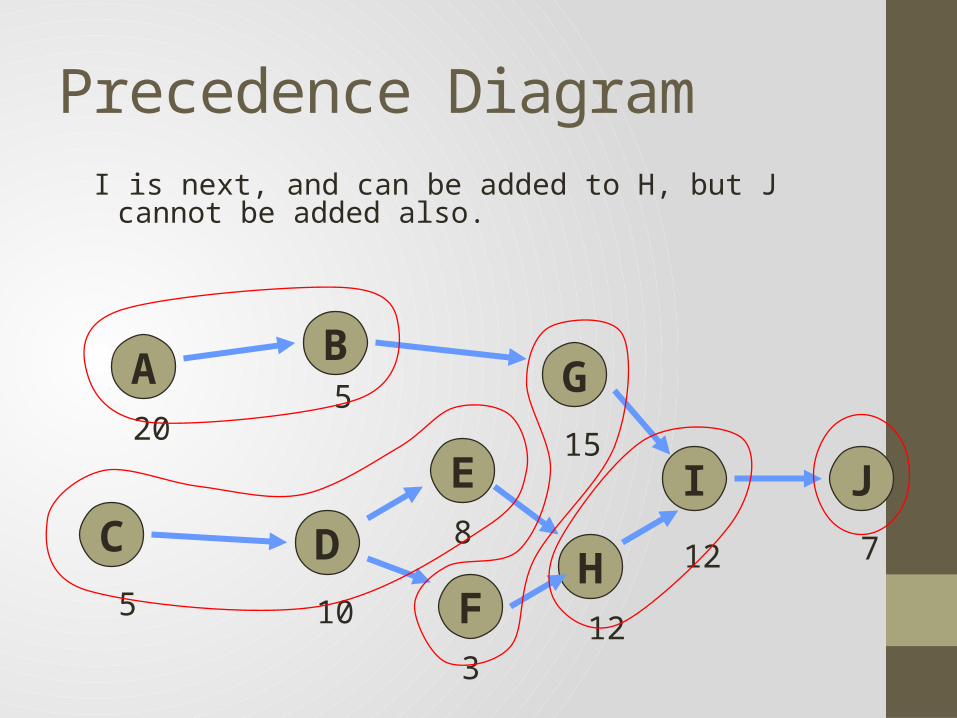
Precedence DiagramI is next, and can be added to H, but J cannot be added also.
C
F
D
B
E
H
G
I J20
5
15
12
5 10
8
3
7
12
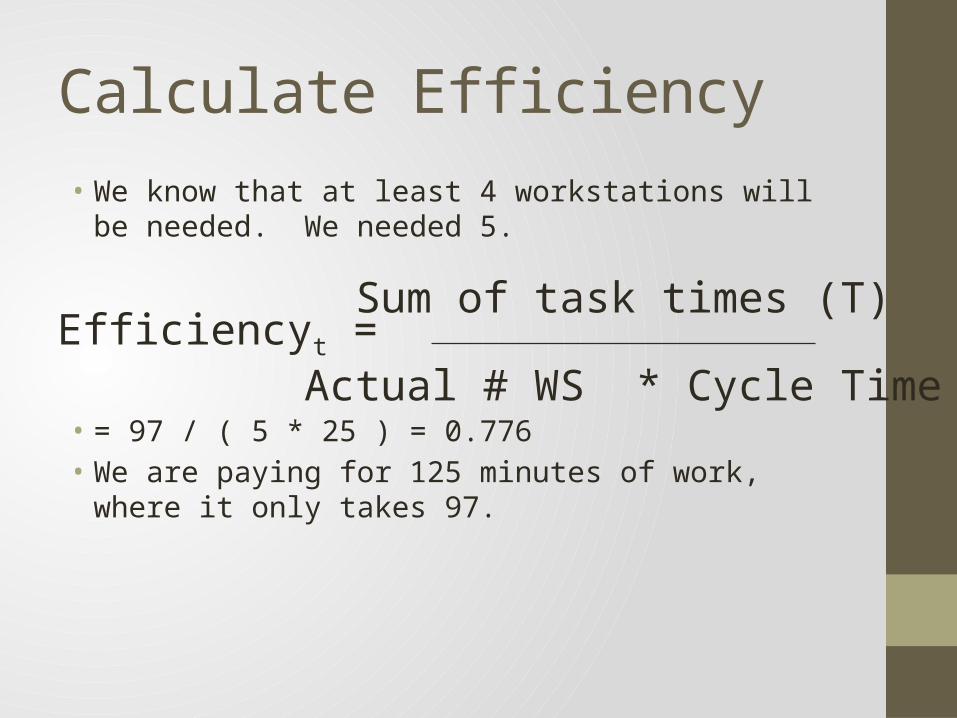
Calculate Efficiency• We know that at least 4 workstations will be needed. We
needed 5.
• = 97 / ( 5 * 25 ) = 0.776• We are paying for 125 minutes of work, where it only takes 97.
Efficiencyt =Sum of task times (T)
Actual # WS * Cycle Time
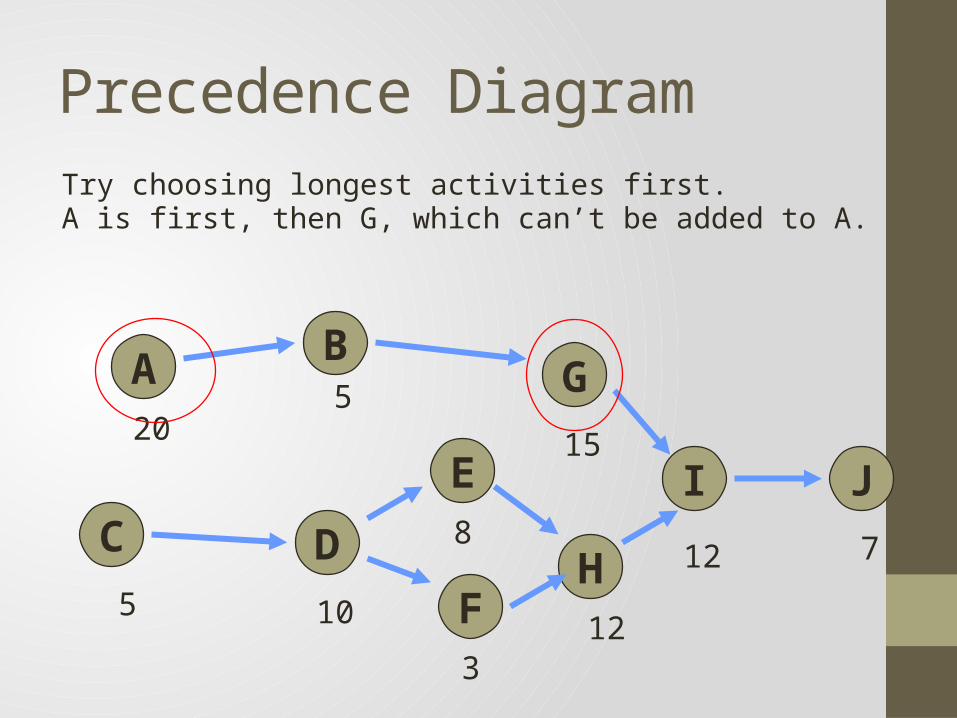
A
Precedence DiagramTry choosing longest activities first.A is first, then G, which can’t be added to A.
C
F
D
B
E
H
G
I J20
5
15
12
5 10
8
3
7
12
A
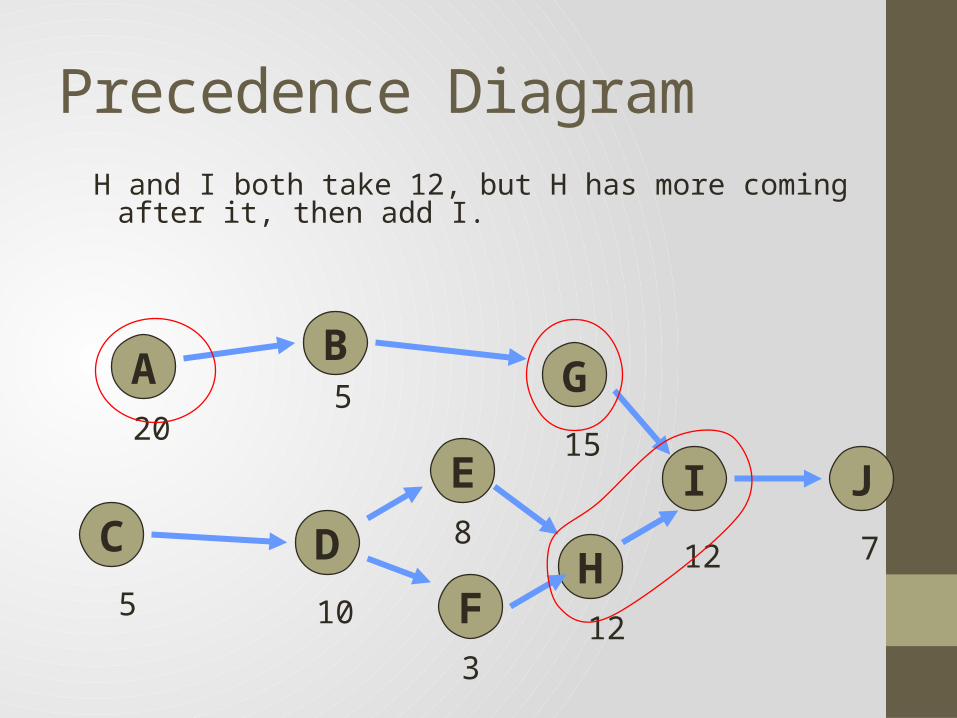
Precedence DiagramH and I both take 12, but H has more coming after it, then add I.
C
F
D
B
E
H
G
I J20
5
15
12
5 10
8
3
7
12
A
Precedence Diagram
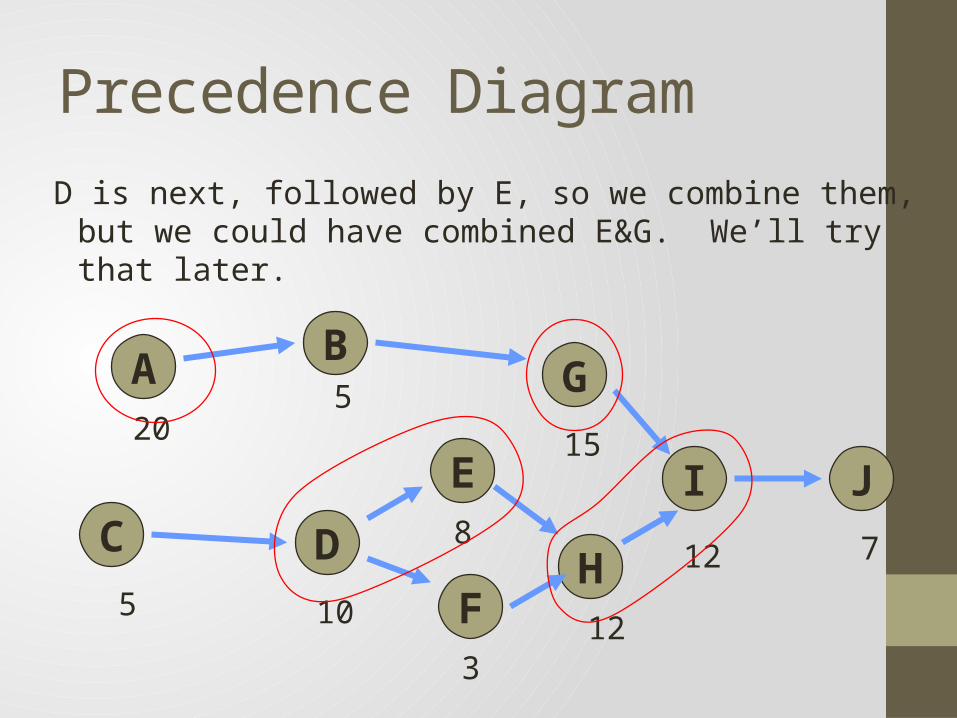
D is next, followed by E, so we combine them, but we could have combined E&G. We’ll try that later.
C
F
D
B
E
H
G
I J20
5
15
12
5 10
8
3
7
12
A
Precedence Diagram
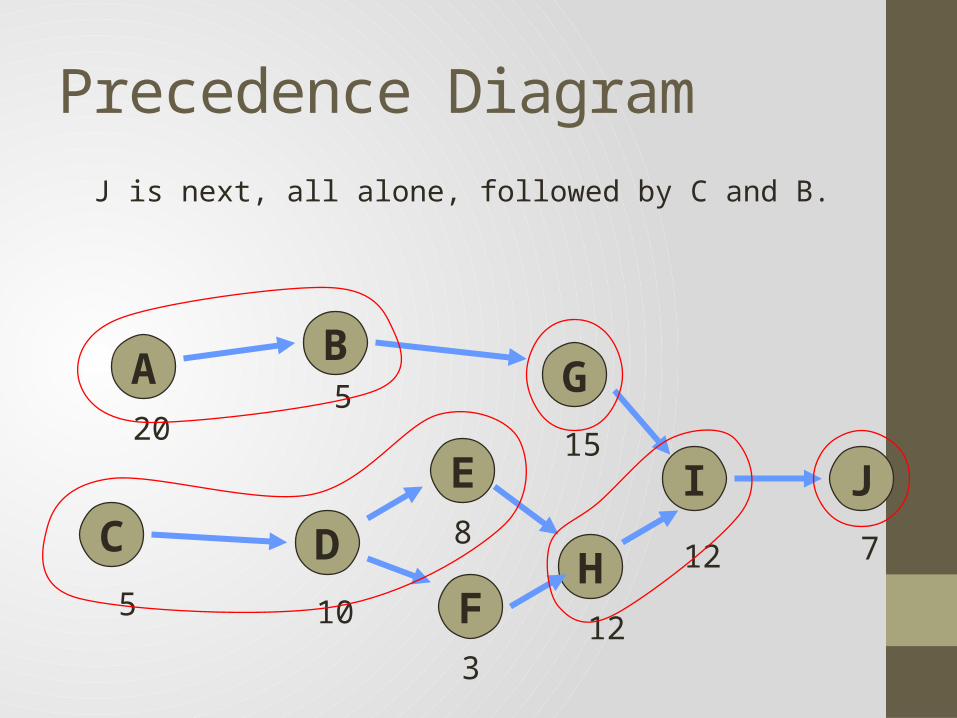
J is next, all alone, followed by C and B.
C
F
D
B
E
H
G
I J20
5
15
12
5 10
8
3
7
12
A
Precedence Diagram
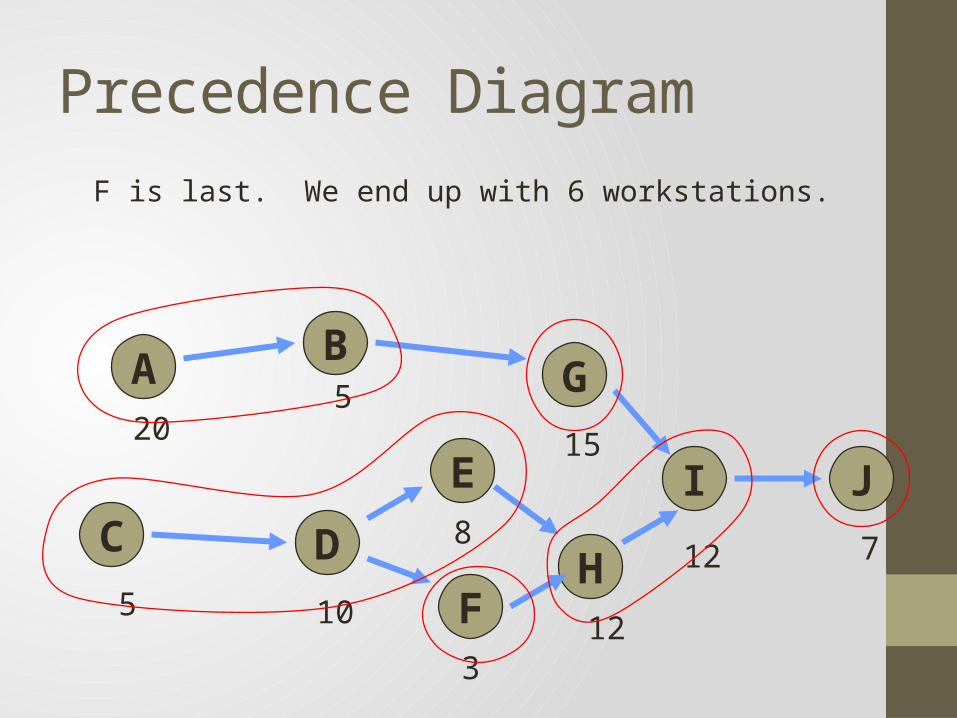
F is last. We end up with 6 workstations.
C
F
D
B
E
H
G
I J20
5
15
12
5 10
8
3
7
12
A
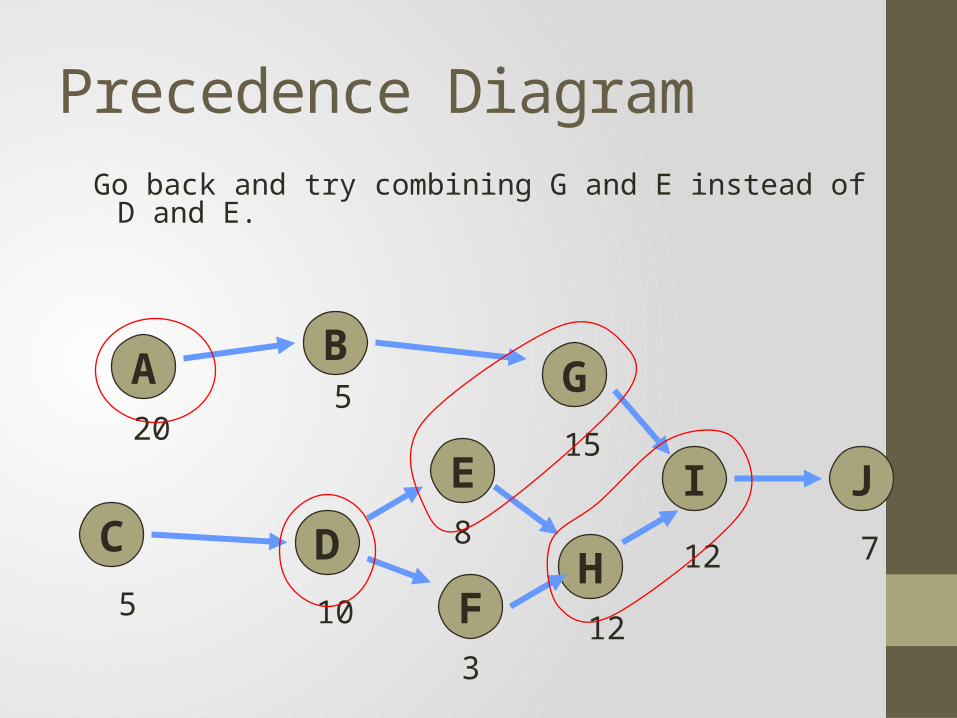
Precedence DiagramGo back and try combining G and E instead of D and E.
C
F
D
B
E
H
G
I J20
5
15
12
5 10
8
3
7
12
A
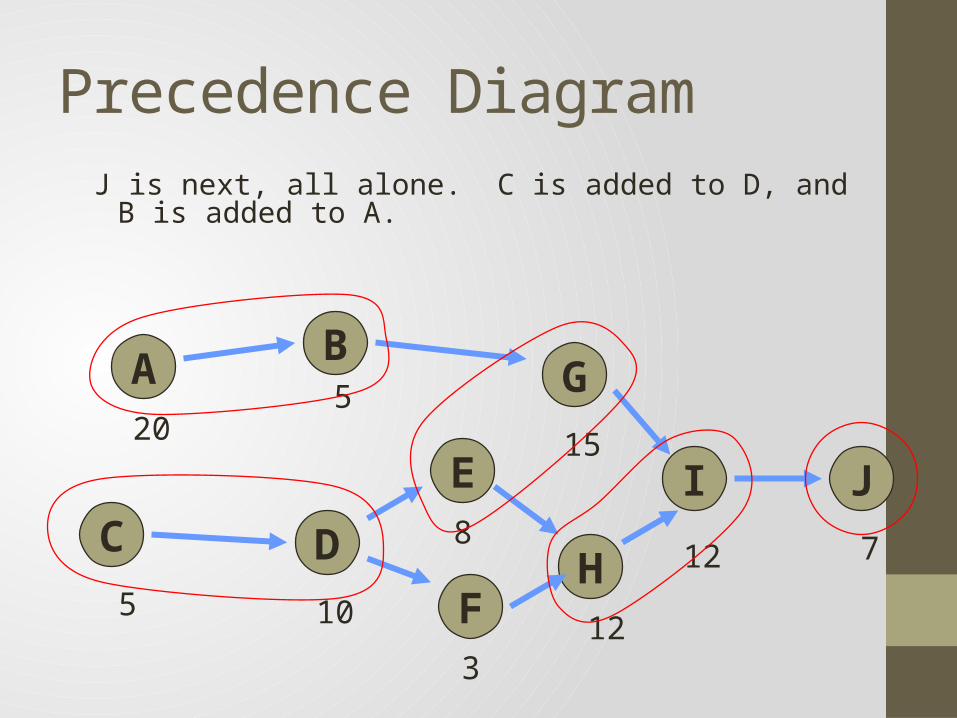
Precedence DiagramJ is next, all alone. C is added to D, and B is added to A.
C
F
D
B
E
H
G
I J20
5
15
12
5 10
8
3
7
12
A
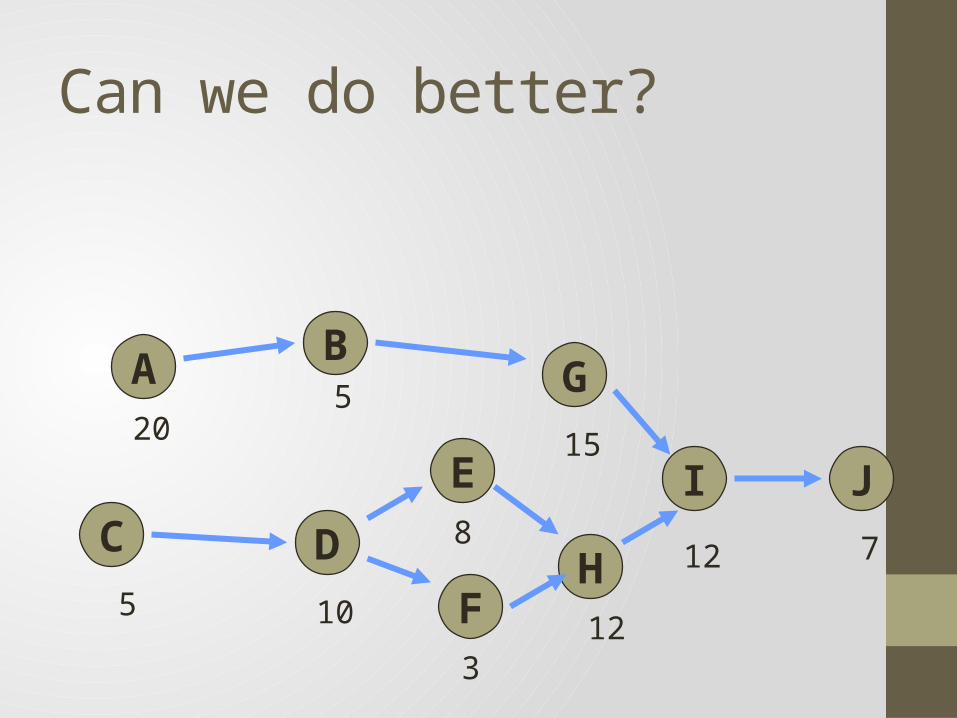
Can we do better?
C
F
D
B
E
H
G
I J20
5
15
12
5 10
8
3
7
12
A
Precedence Diagram
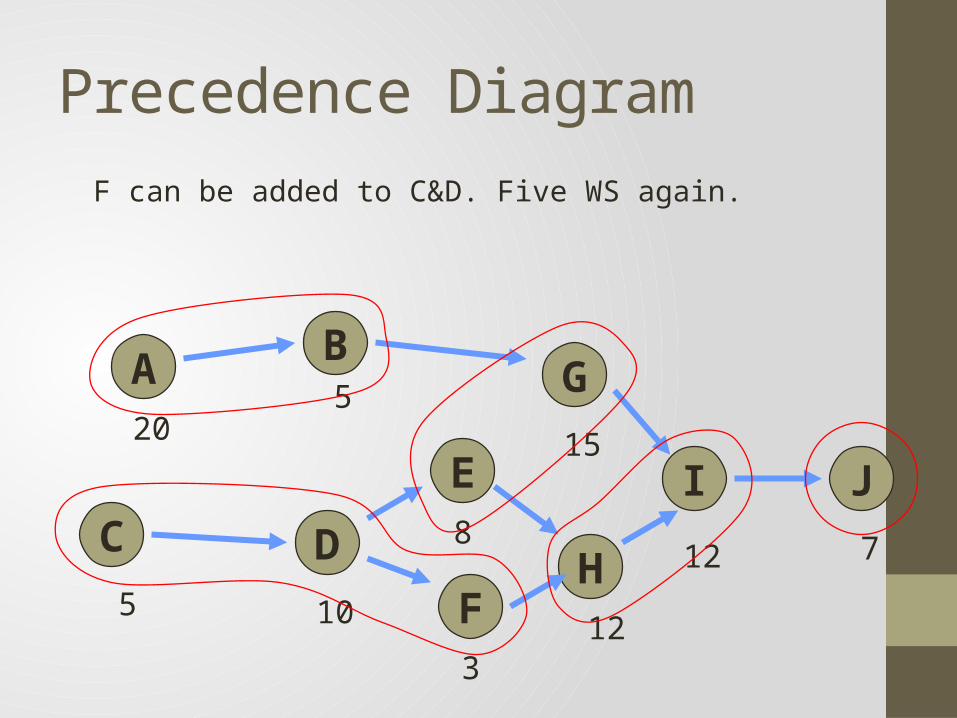
F can be added to C&D. Five WS again.
C
F
D
B
E
H
G
I J20
5
15
12
5 10
8
3
7
12
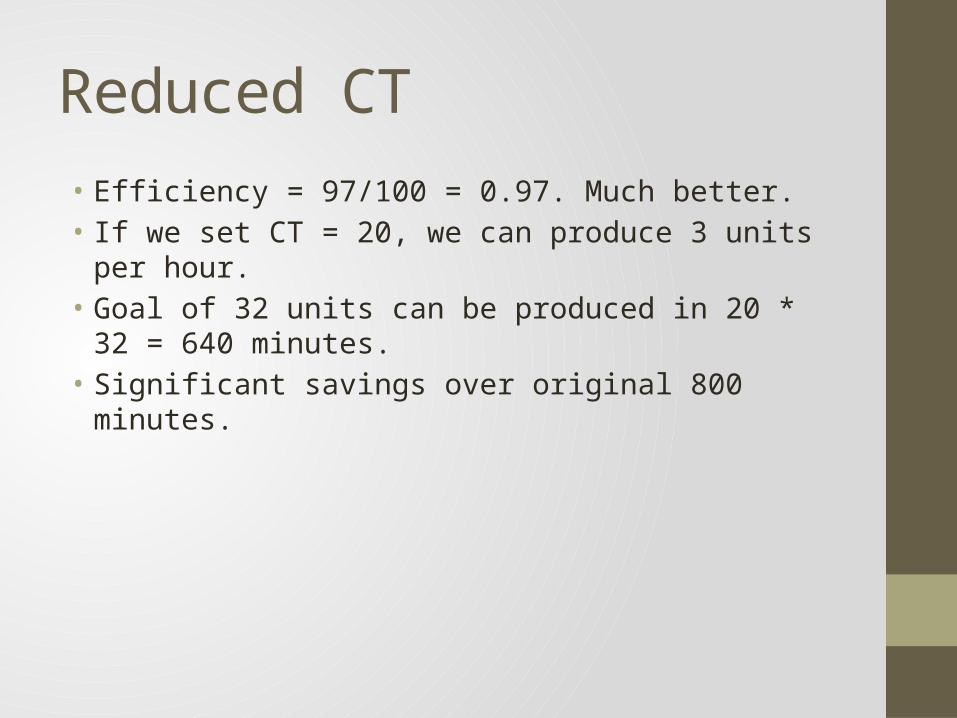
Reduced CT• Efficiency = 97/100 = 0.97. Much better.• If we set CT = 20, we can produce 3 units per hour. • Goal of 32 units can be produced in 20 * 32 = 640 minutes.• Significant savings over original 800 minutes.
A
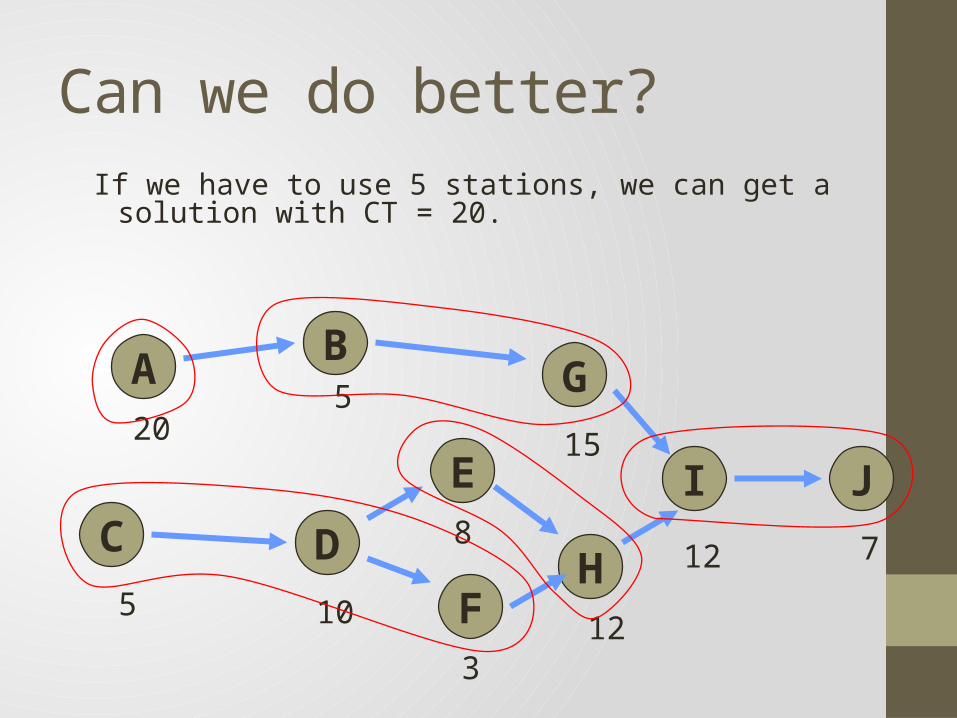
Can we do better?If we have to use 5 stations, we can get a solution with CT = 20.
C
F
D
B
E
H
G
I J20
5
15
12
5 10
8
3
7
12
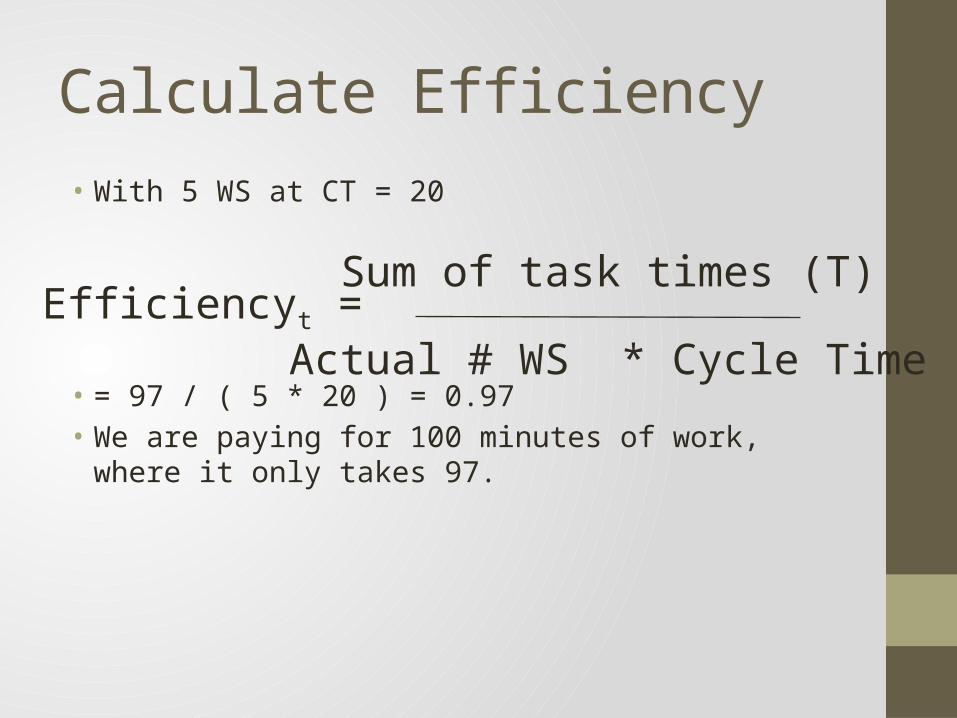
Calculate Efficiency• With 5 WS at CT = 20
• = 97 / ( 5 * 20 ) = 0.97• We are paying for 100 minutes of work, where it only takes 97.
Efficiencyt =Sum of task times (T)
Actual # WS * Cycle Time
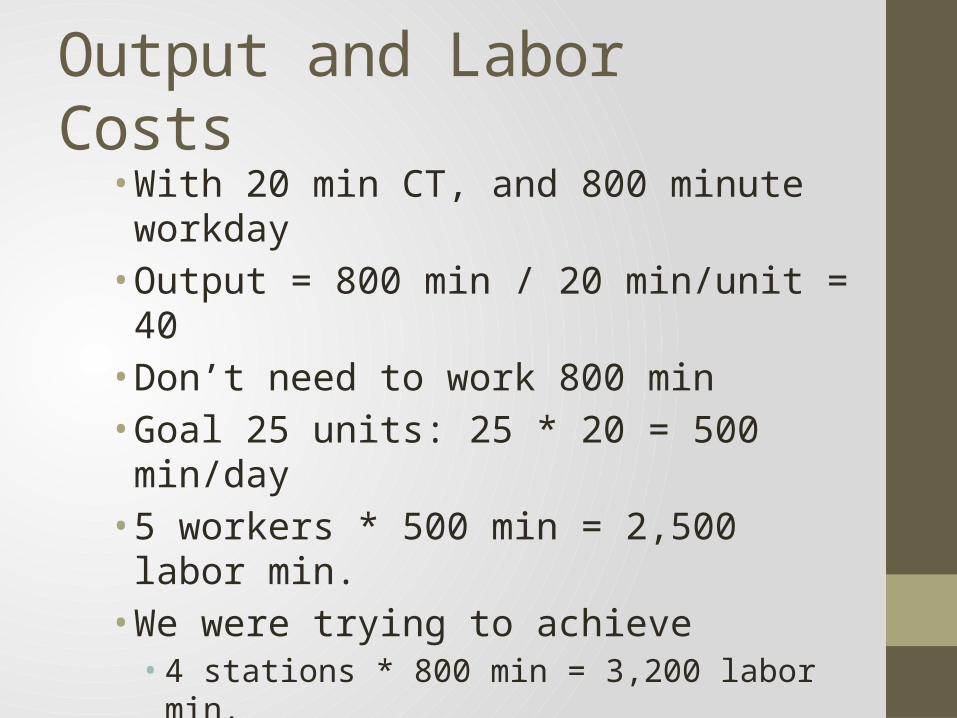
Output and Labor Costs• With 20 min CT, and 800 minute workday• Output = 800 min / 20 min/unit = 40• Don’t need to work 800 min• Goal 25 units: 25 * 20 = 500 min/day• 5 workers * 500 min = 2,500 labor min.• We were trying to achieve
• 4 stations * 800 min = 3,200 labor min. • Significant labor cost savings
Handling Long Tasks• Long tasks make it hard to get efficient combinations.• Consider splitting tasks, if physically possible.• If not:
• Parallel workstations• use skilled (faster) worker to speed up
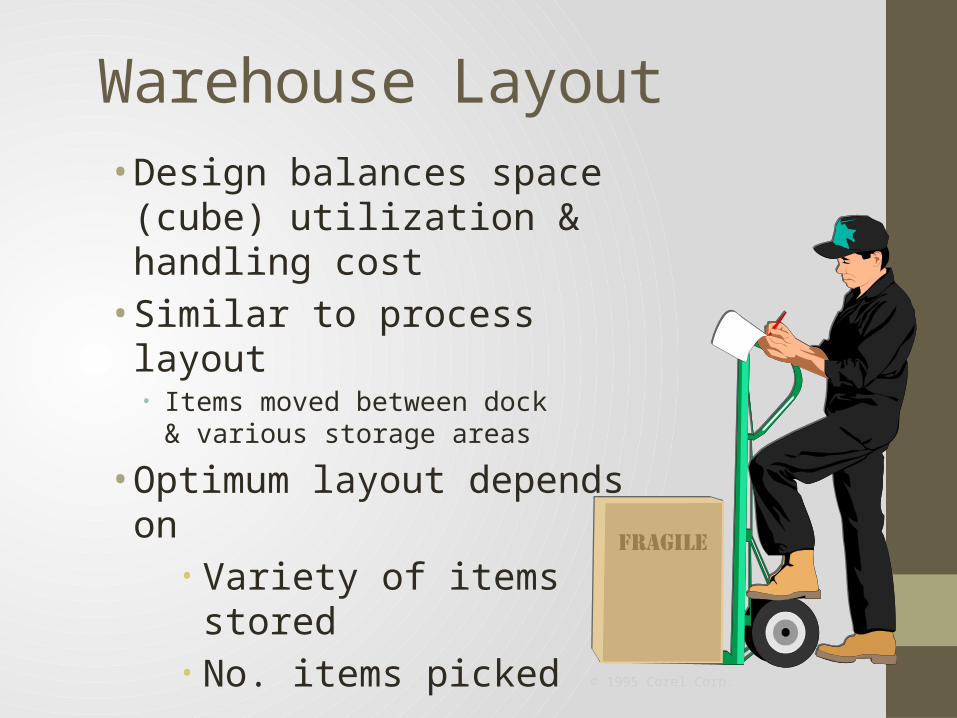
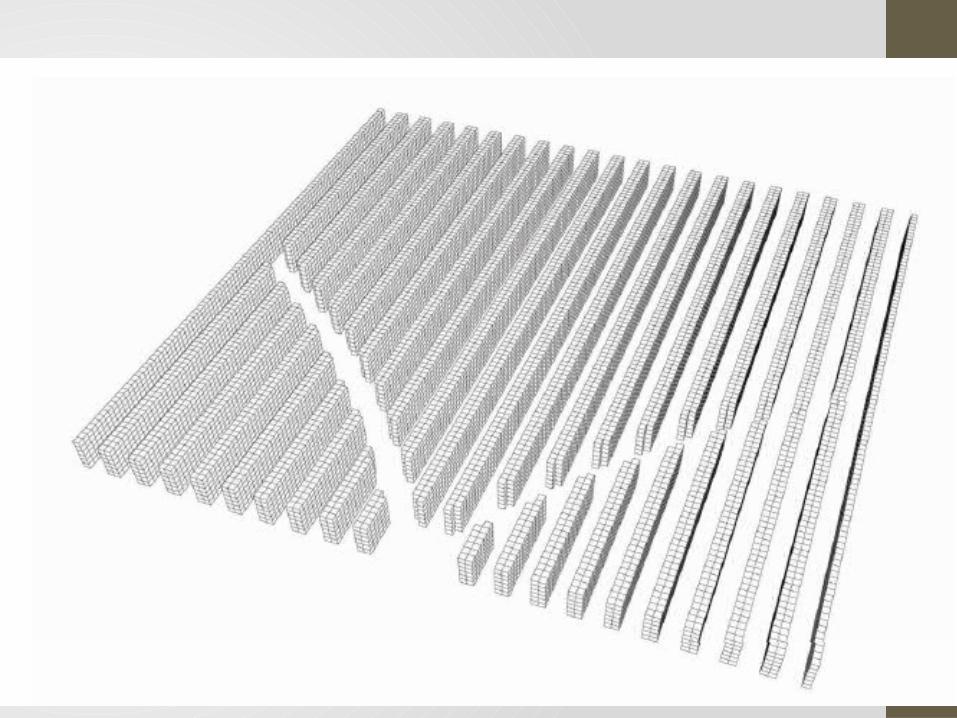
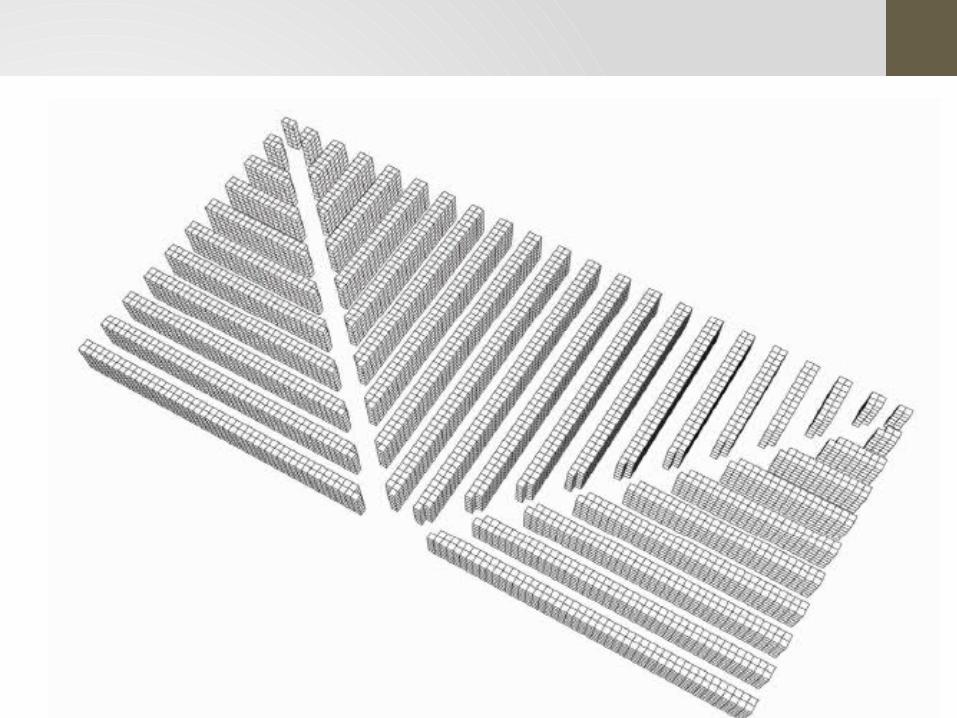
Warehouse Layout• Design balances space (cube)
utilization & handling cost• Similar to process layout
• Items moved between dock & various storage areas
• Optimum layout depends on• Variety of items
stored• No. items picked
© 1995 Corel Corp.
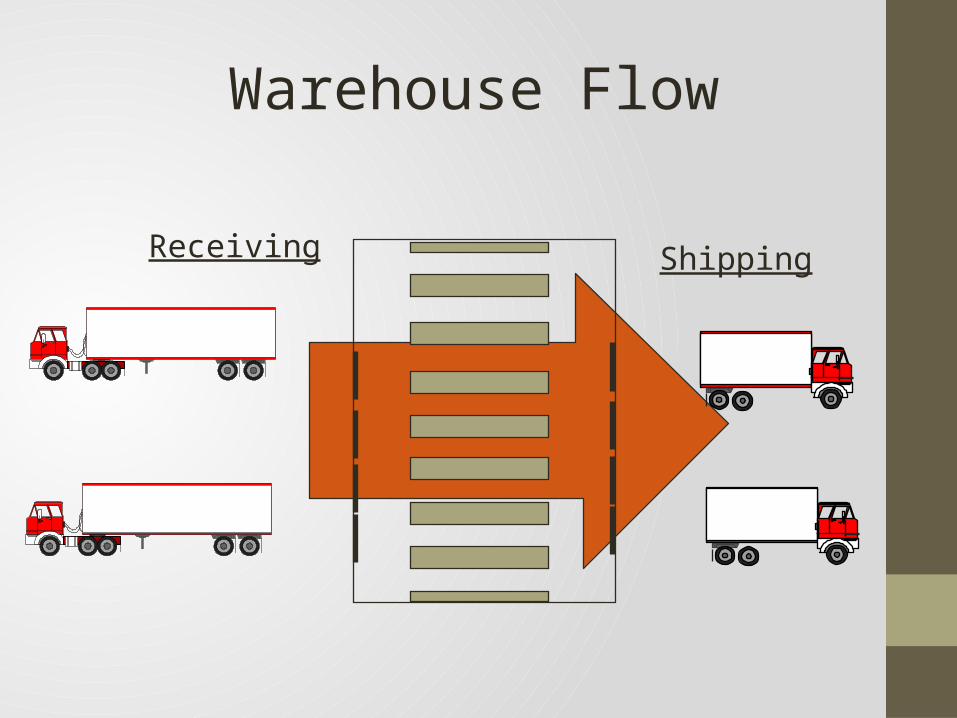
Warehouse Flow
Receiving Shipping
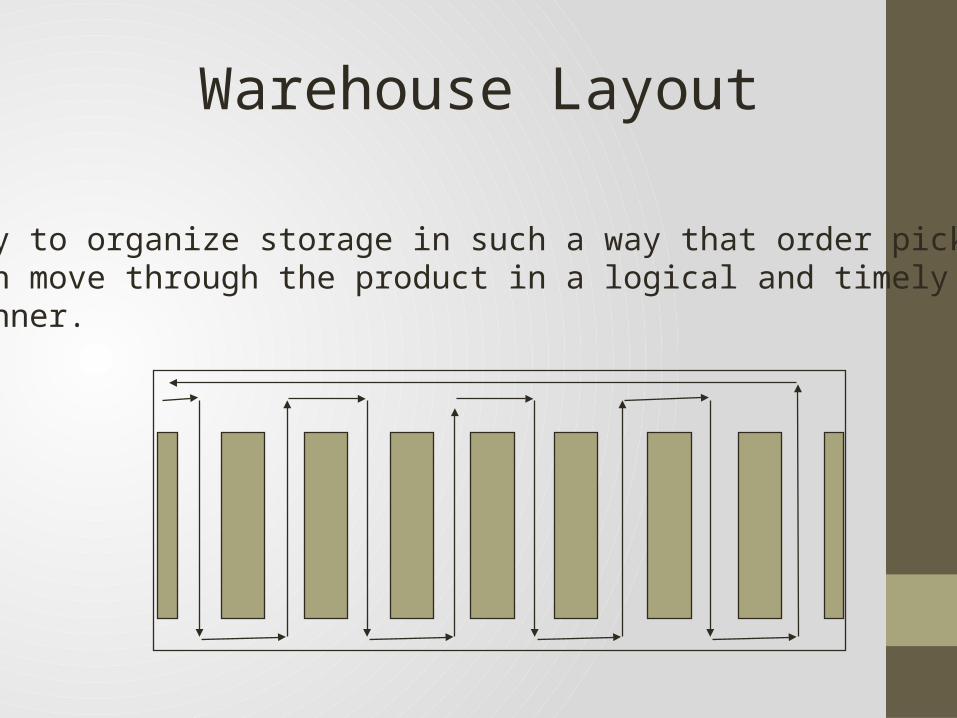
Warehouse Layout
Try to organize storage in such a way that order pickerscan move through the product in a logical and timely manner.
Warehouse Layout
• Fastest near the front• Fastest within easy reach• Bulk storage vs. Single item picking• Serpentine vs. oval picking order• Restocking: frequency, safety stock
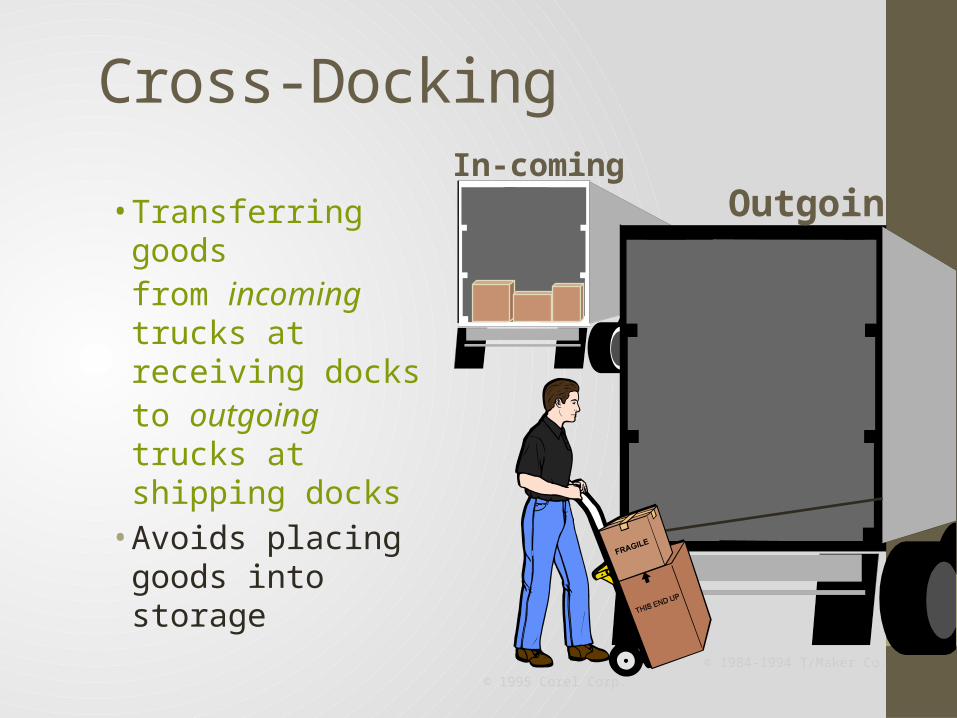
Cross-Docking
• Transferring goods from incoming trucks at receiving docks to outgoing trucks at shipping docks
• Avoids placing goods into storage
In-comingOutgoing
© 1984-1994 T/Maker Co.
© 1995 Corel Corp.
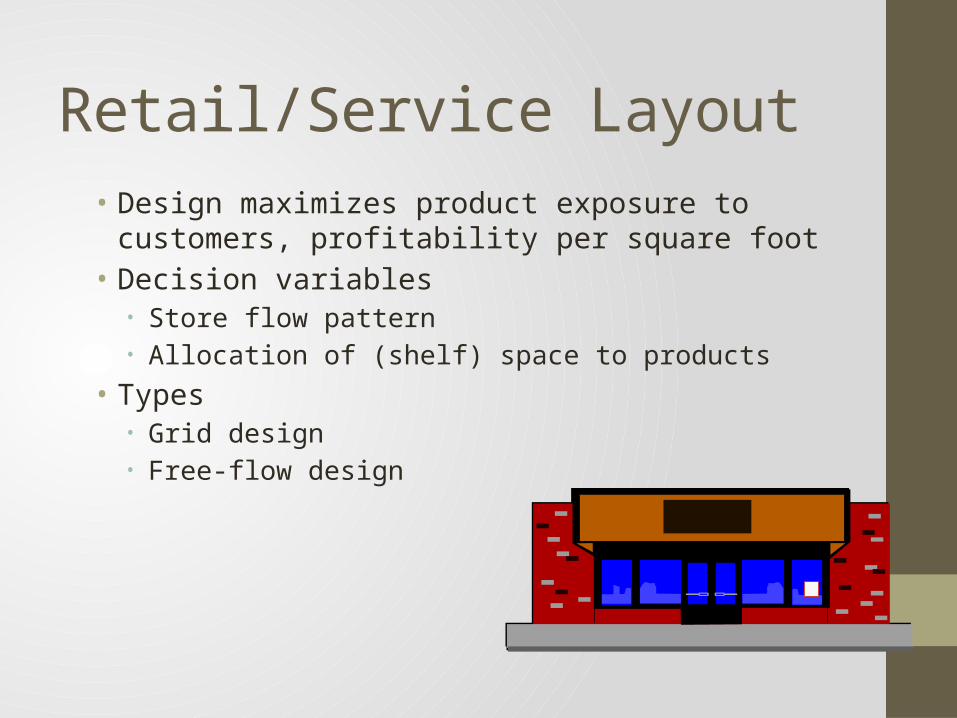
Retail/Service Layout• Design maximizes product exposure to customers, profitability per
square foot• Decision variables
• Store flow pattern• Allocation of (shelf) space to products
• Types• Grid design• Free-flow design
Video
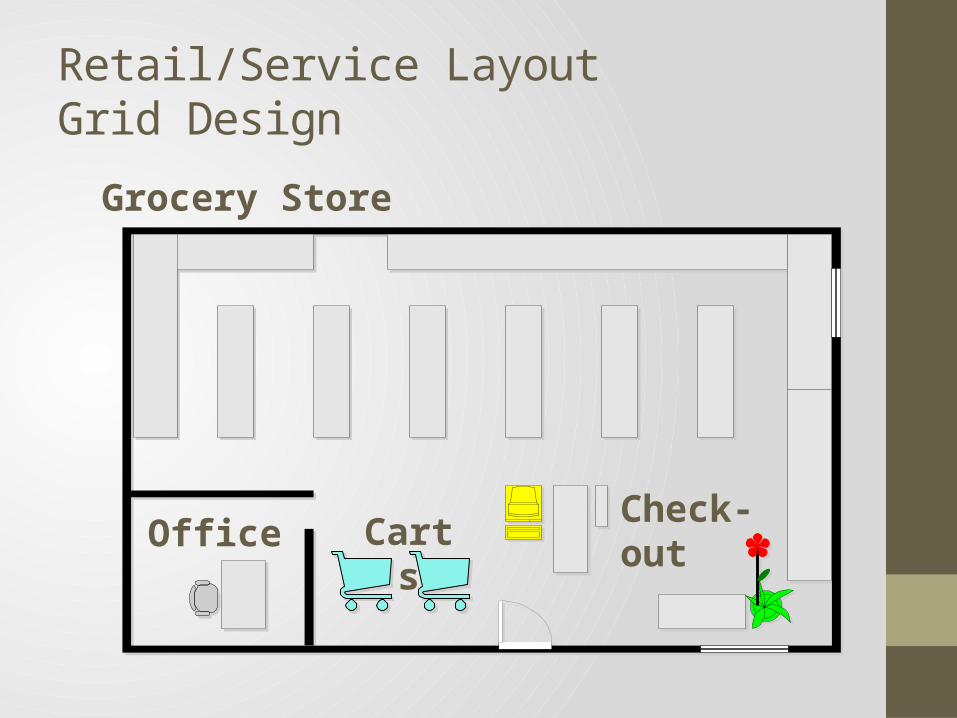
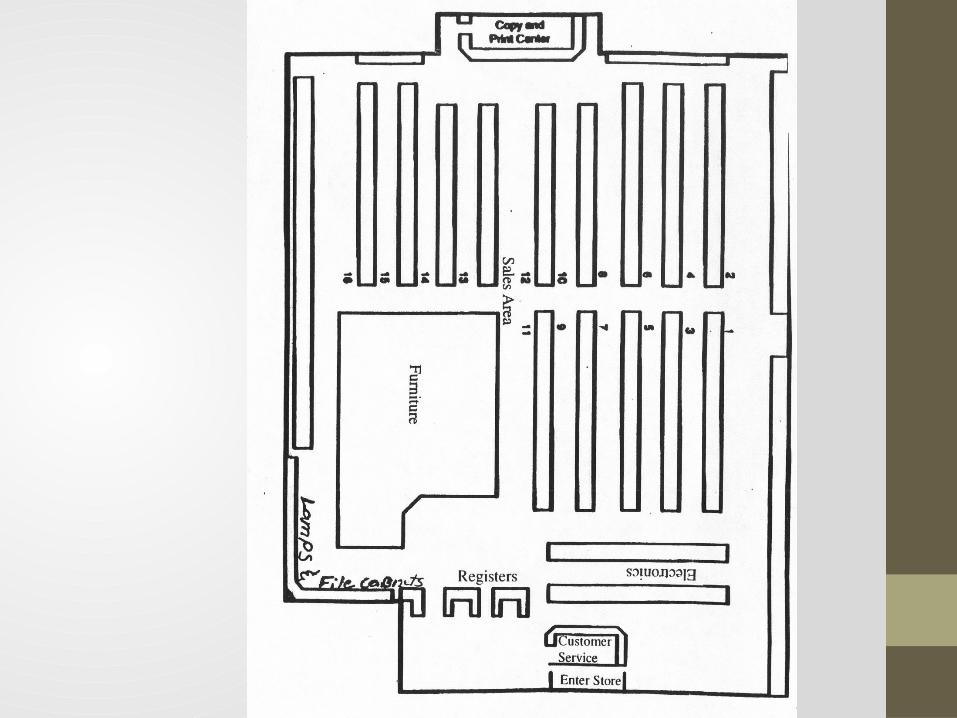
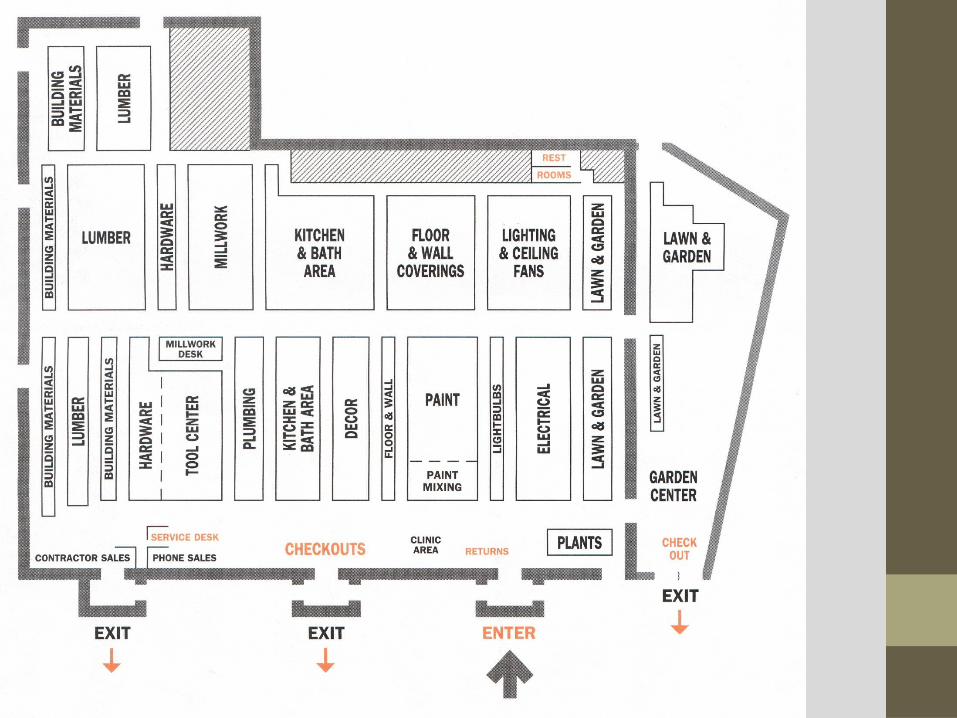
Retail/Service Layout Grid Design
Office CartsCheck-out
Grocery Store
MeatBread
Mil
k
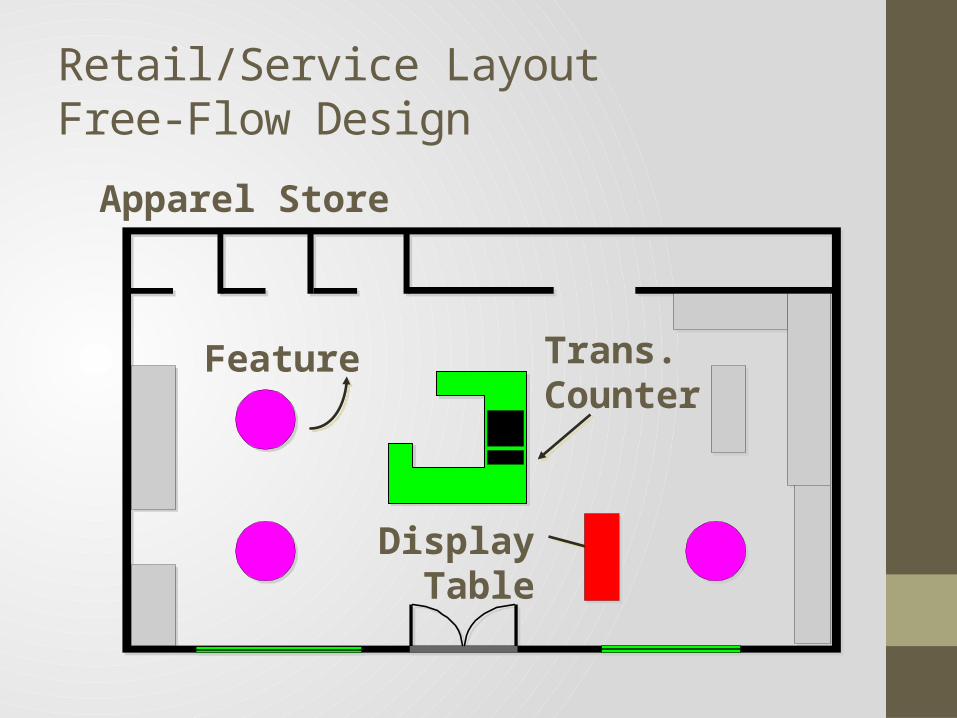
Retail/Service Layout Free-Flow Design
Feature
Display Table
Trans.Counter
Apparel Store
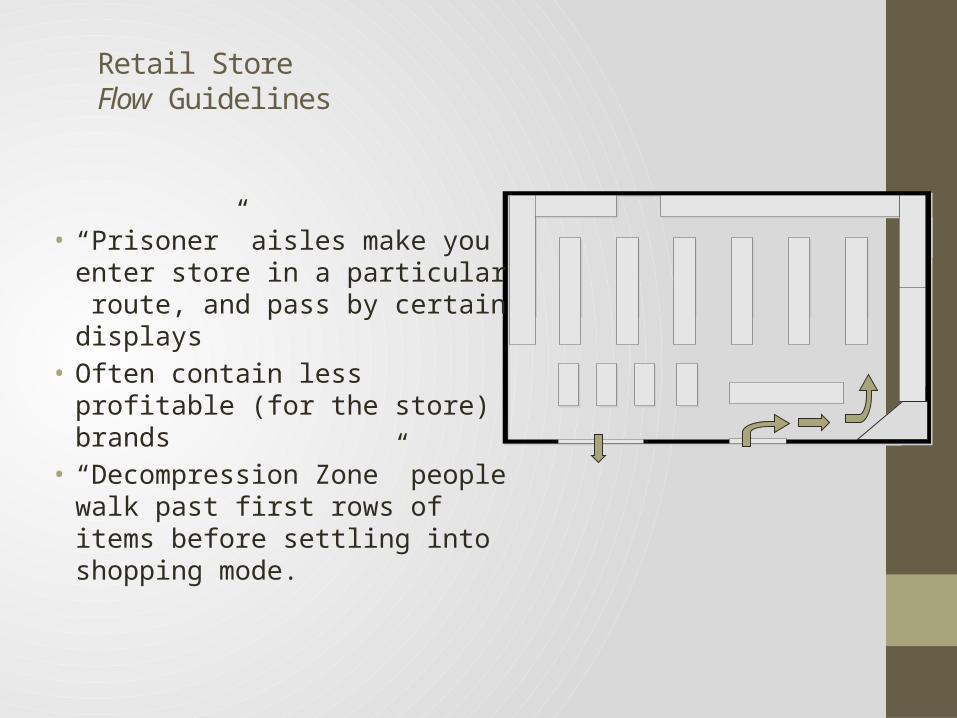
Retail Store Flow Guidelines
• “Prisoner” aisles make you enter store in a particular route, and pass by certain displays
• Often contain less profitable (for the store) brands
• “Decompression Zone” people walk past first rows of items before settling into shopping mode.
Retail Store Flow Guidelines
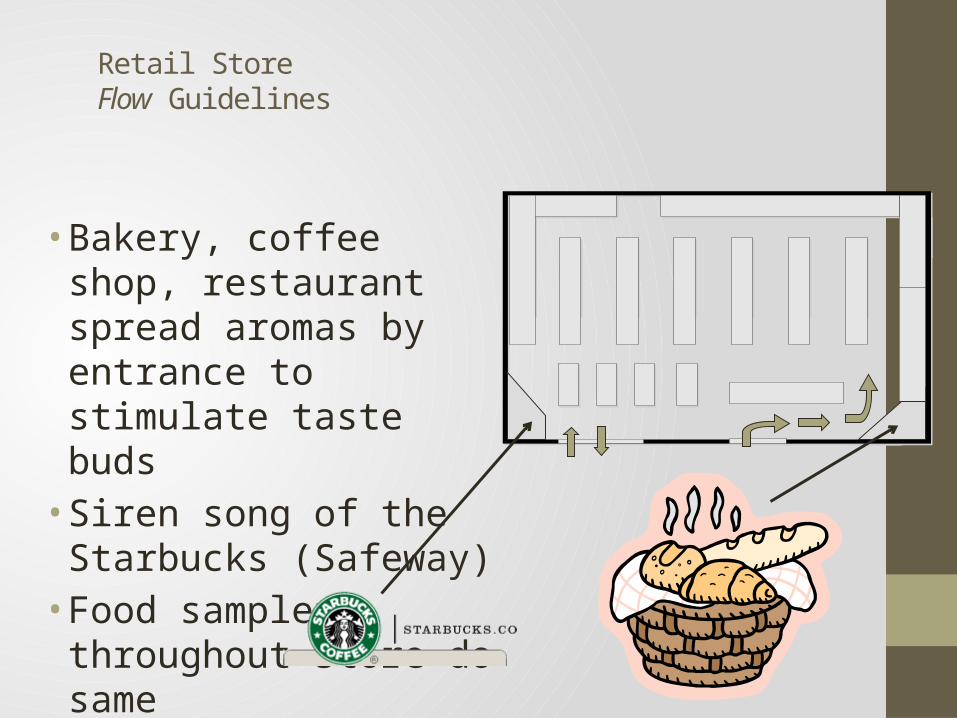
• Bakery, coffee shop, restaurant spread aromas by entrance to stimulate taste buds
• Siren song of the Starbucks (Safeway)
• Food samplers throughout store do same
Retail Store Flow Guidelines
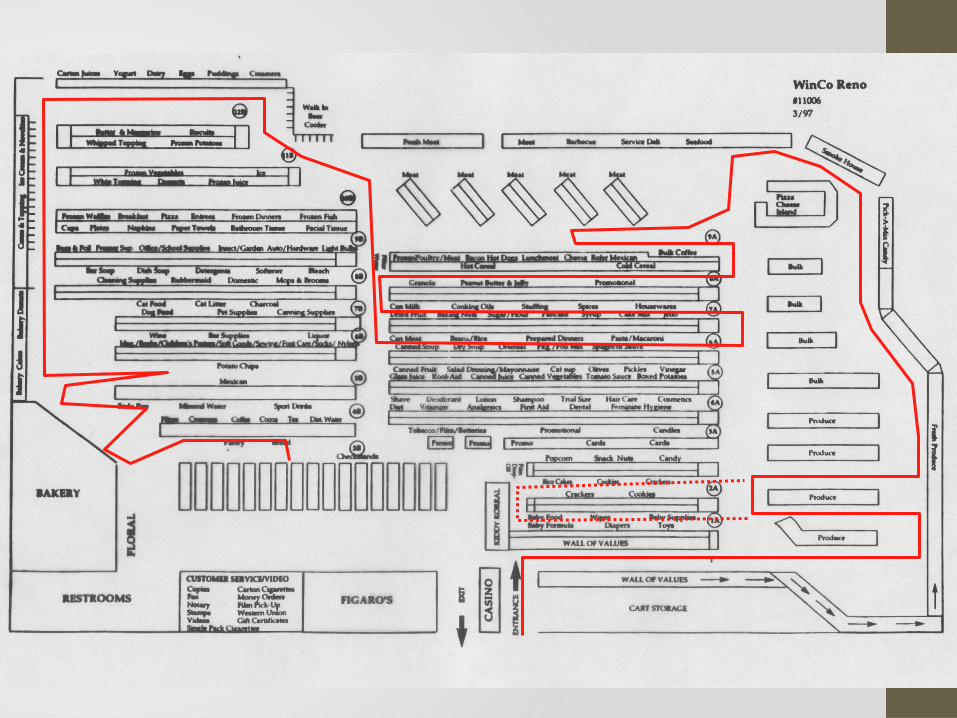
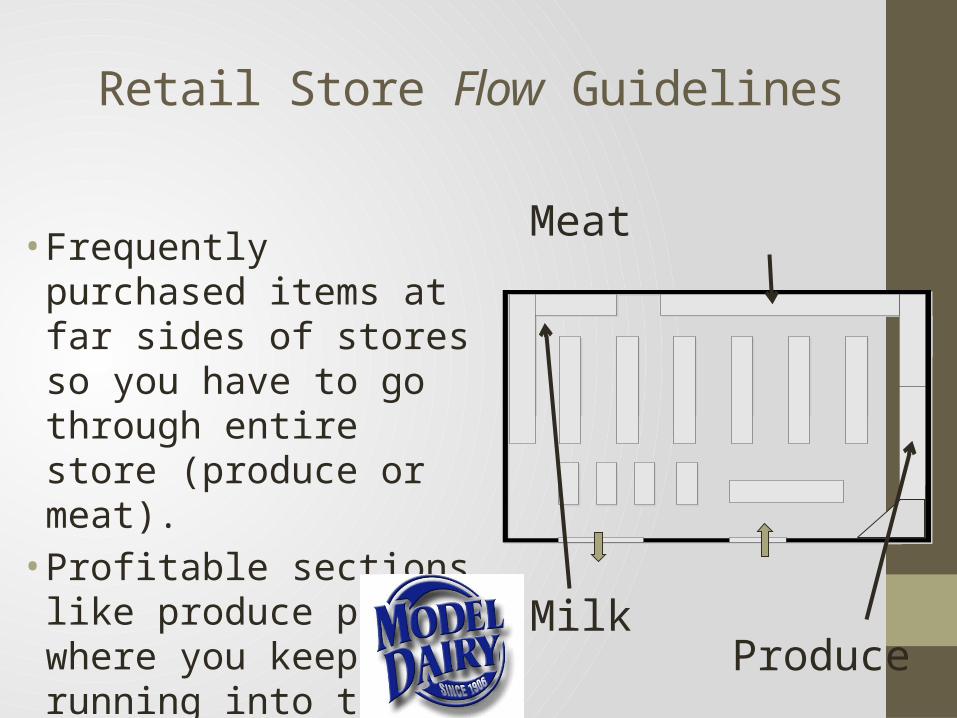
• Frequently purchased items at far sides of stores so you have to go through entire store (produce or meat).
• Profitable sections like produce placed where you keep running into them
Milk
Meat
Produce
Retail Store Flow Guidelines
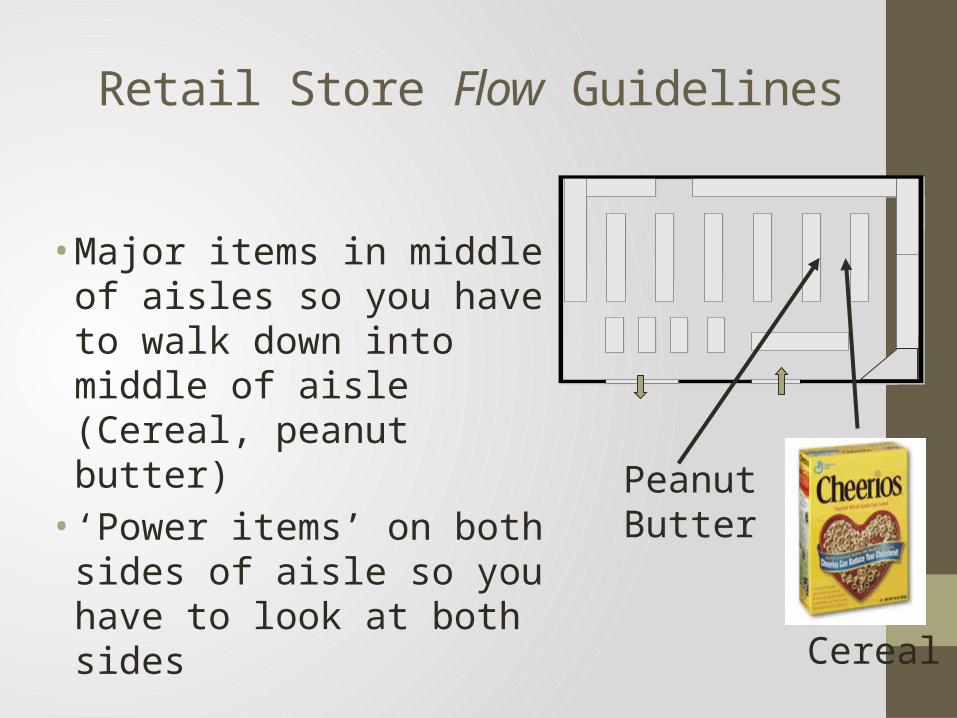
• Major items in middle of aisles so you have to walk down into middle of aisle (Cereal, peanut butter)
• ‘Power items’ on both sides of aisle so you have to look at both sides
Cereal
PeanutButter
Retail Store Flow Guidelines
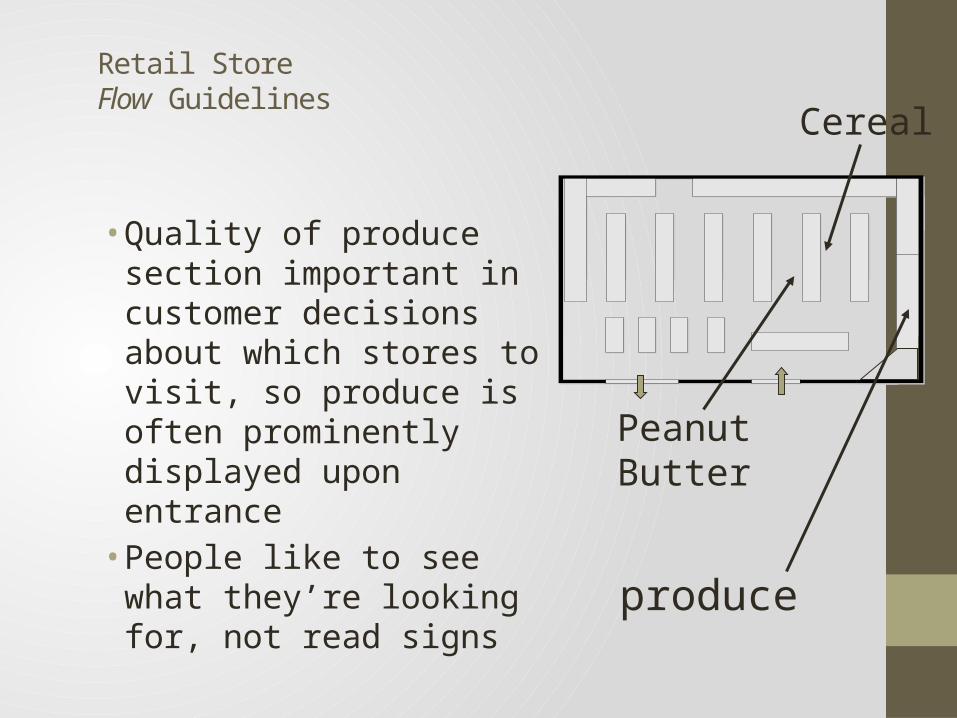
• Quality of produce section important in customer decisions about which stores to visit, so produce is often prominently displayed upon entrance
• People like to see what they’re looking for, not read signs
Cereal
PeanutButter
produce
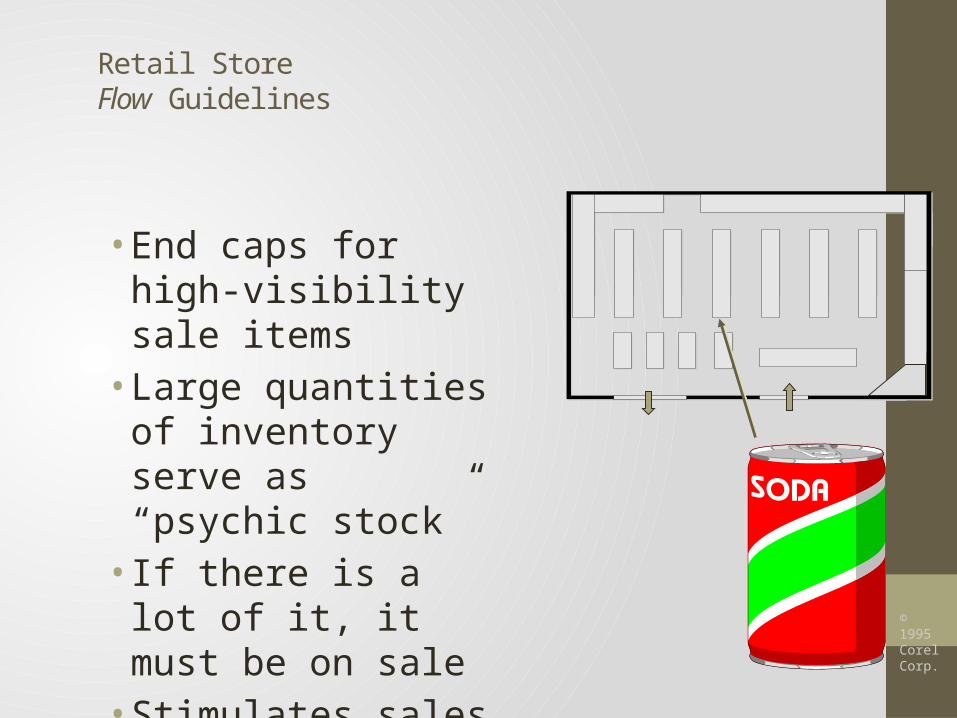
Retail Store Flow Guidelines
• End caps for high-visibility sale items
• Large quantities of inventory serve as “psychic stock”
• If there is a lot of it, it must be on sale
• Stimulates sales© 1995
Corel Corp.
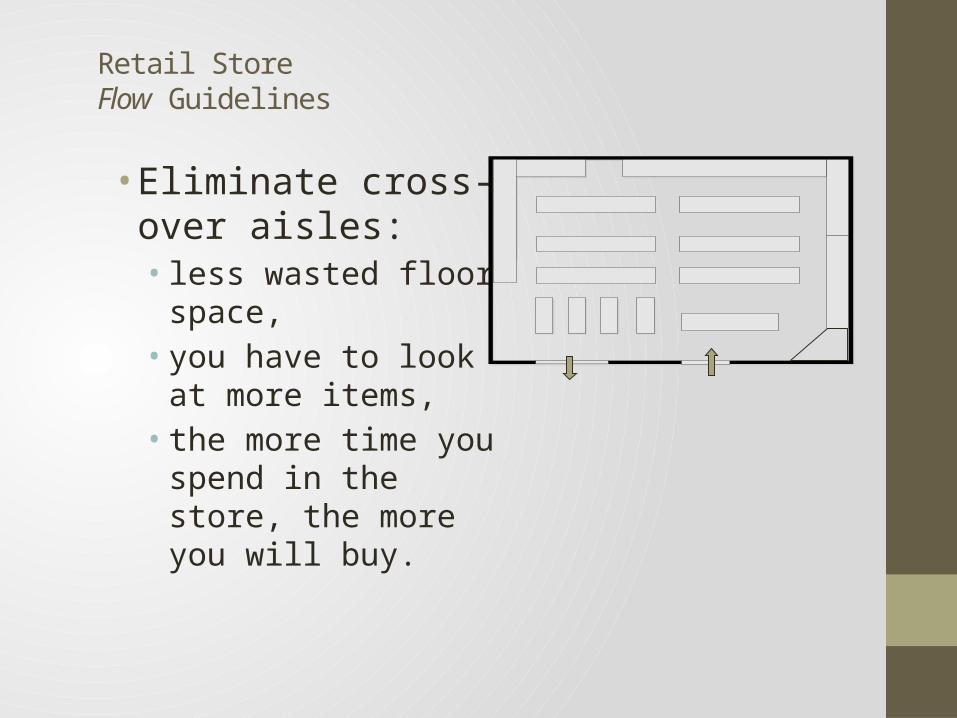
Retail Store Flow Guidelines
• Eliminate cross-over aisles: • less wasted floor space, • you have to look at more
items,• the more time you spend
in the store, the more you will buy.
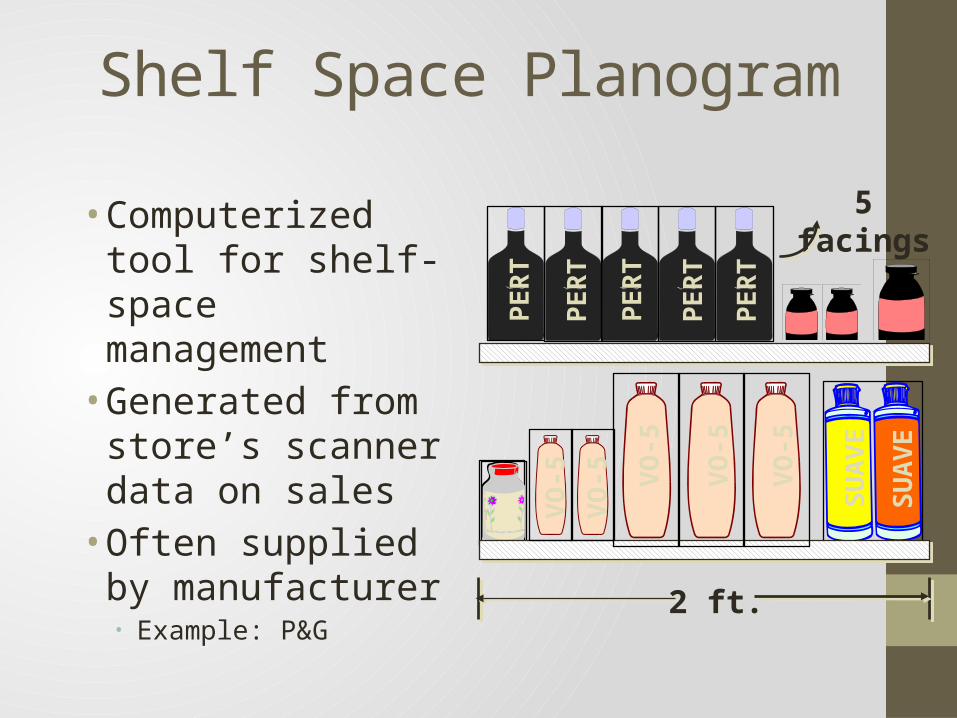
Shelf Space Planogram
• Computerized tool for shelf-space management
• Generated from store’s scanner data on sales
• Often supplied by manufacturer• Example: P&G
2 ft.
5 facings
VO
-5
VO
-5
VO
-5
SU
AV
E
SU
AV
E
VO
-5P
ER
T
PE
RT
PE
RT
PE
RT
PE
RT
VO
-5
Shelf Placement• Companies prefer to be at eye-level or at child-reaching level• Close to leading brands or high-draw items: snack foods next
to the peanut butter or across from the cereal:• Lots of kids visit the area
Slotting Fees
• Manufacturer pays retailer to get a product into a store• 35,000 new grocery products per year• Grocery stores often stock 30,000 items• Impossible to evaluate all new products to choose the
best new ones• Slotting fees guarantee grocer profits on a product, help
balance risk of trying unknown product.• Grocery is a narrow margin business, slotting fees can
represent a significant revenue source.
Slotting Fees
• Senate Small Business Committee held hearings on them in 2000.
• Industry refused to cooperate with GAO.• Growers of produce (not just brand names) now
getting involved and complaining.• Small businesses claim they can’t afford the big
payments big companies can make.• Advocates say small companies can “put their
money where their mouths are” just like anyone else
Perimeter Items• People follow perimeter pattern• Sale items on end – everyone sees• Half of a store’s profit comes from items on the
perimeter• Breakfast cereal brings in the most dollars per
square foot• Manufacturer incentives increase profitability of
soft drinks• “Anchors” at ends of a section: milk and butter
at opposite ends of dairy case