Embed Size (px)
Citation preview
Inflation Report December 2001
113
6 – Prospects for inflation
This chapter of the Inflation Report presents the Monetary Policy Committee
(Copom) assessment of Brazilian economic performance since the
September Report, as well as prospects for inflation through 2003. The
projections are based on the assumption that the basic interest rate will
remain unchanged during the period under analysis at 19% per year, rate
set by Copom in its December 18th and 19th meeting. In addition, an
alternative forecast is presented, taking into account the market expectations
for the interest rate and exchange rate paths. It is important to note that
these procedures are strictly technical. Hence, these assumptions should
not been taken as forecasts of the future interest rate path.
The inflation and GDP growth forecasts presented in this Report are not
meant to be restricted to point estimates. They are projected within
probability intervals, reflecting the degree of uncertainty when setting the
basic interest rate. Inflation forecasts depend are based not only on the
interest rate assumption, but also on assumptions concerning the behavior
of the relevant exogenous variables. The baseline scenario, based on which
Copom makes its decisions regarding interest rates, depend on the set of
assumptions considered as the most likely by Copom. The forecasts are
presented in this Report in order to enhance monetary policy transparency,
contributing to its efficacy to control inflation, which is its main objetive.
6.1 – Determinants of inflation
Aggregate demand and aggregate supply
The economic environment has improved since the last Copom meeting.
The exchange rate has appreciated rapidly in response to the positive
evolution of the external accounts and to the severance of Brazil’s risk
premium from that of Argentina. Government projections for the

Inflation Report December 2001
114
government-managed prices in 2002 have been revised downwards because
of the lower readjustments of electric energy prices, the liberalization of the
market for oil by-product and changes in taxation of this sector that should
imply significant reduction in prices. The projected slope of the term structure
of interest rate has decreased, affecting positively economic growth.
The indicators of the level of economic activity in the third quarter of 2001
show a weakening of the trend of deceleration of the economic growth
previously observed. Agricultural activity has contributed positively to GDP
growth in contrast to the negative performance of the industrial sector. This
signals a recovery of economic growth for 2002.
The Brazilian economy grew 0.5% in the third quarter of 2001 in comparison
with the same period of the previous year. In comparison with the second
quarter of 2001, seasonally adjusted GDP grew 0.13%. Considering the
first three quarters of 2001, the economy grew at an accumulated rate of
2.25% (figures revised by IBGE).
According to the Monthly Industrial Survey released by IBGE, the industri-
al production, in October 2001, decreased 3.4% in comparison with
October 2000, but fell 1.9% in comparison with September 2001
(seasonally adjusted series). In spite of that, the accumulated growth in the
year is positive: 2.5%. The positive growth was mainly a consequence of
the production of investment goods, such as, farm tractors, high-tension
transformers and railway coaches. This signals an increase in productive
capacity of the economy next year.
The GDP figures do not corroborate assessments whereby the shocks that
affected the economy in the first semester would result in an economic
recession. The deceleration of economic activity in the second quarter was
followed by a tendency to stabilization in the third quarter. The expansion of
GDP should be around 2% in 2001.
In line with the industrial production indicators, the open unemployment
rate calculated by IBGE, considering the six main metropolitan areas in
Brazil, increased from 6.15% in September to 6.55% in October.
However, the unemployment rate average in the first ten months of 2001
decreased from 7.46% to 6.27% in comparison with the same period in
the previous year.
Inflation Report December 2001
115
The performance of the industrial sector affected the real income of employed
personnel: it decreased 1.6% in the third quarter of 2001 in comparison
with the previous quarter.
The contribution of the external sector to economic growth has been
increasing. The trade balance accumulated a US$ 1.9 billion surplus until
the second week of December as a consequence mainly of the exchange
rate depreciation, which accumulates 18% in the year. As monetary policy
acts to limit the inflationary effects of depreciation, the real exchange rate
generates strong incentives to the improvement of the trade balance in spite
of the foreign demand contraction.
The recently released statistics reflect the worsening of the deceleration of
the global economy. The U.S. GDP has decreased by 0.4% in the third
quarter - first negative growth since 1993. Furthermore, the industrial
production decreased by 1.1% in October, the eleventh consecutive monthly
reduction. In Japan, the main indicators of domestic demand and price
deflation indicate that the “zero interest rate” policy has not been effective
to generate a recovery in economic growth. Besides, the negative
environment may worsen in case rating agencies downgrade Japanese public
debt. The Euro Zone was apparently contaminated by the fragility of the
other economic areas, although, similarly to the previous month, the growth
rates of the retail sales and the trade balance were positive in September.
Industrial production, in September, fell by the third time in 2001.
The difficulties faced by the Argentinean economy are still present. Even
though the “contagion” has decreased recently, the unfolding of the
Argentinean crisis still deserves attention. The increase of liquidity promoted
by the Fed in the American market—the basic interest rate was again
reduced and is currently at the level of 1.75%—should help the recovery of
economic growth in the US and in the world.
A recovery of the global demand in the middle of the next year is expected,
strengthening the perspective for improvements in Brazilian external accounts
in 2002, compatible with a greater GDP growth.
Concerning the interest rate movement in the credit market, like that
observed in the second quarter, the lending rates rose in the third quarter.
The borrowing rates, in turn, grew at a lower intensity, leading to a small
Inflation Report December 2001
116
increase in the spread. For the fourth quarter, however, the available statistics
show a reversion of this movement, and the spread in December should be
close to that verified in August. With regard to loans, the balance of credit
operations in the free segment grew significantly over the year—more than
27% until October.
The slope of the term structure of interest rate—defined as the difference
between the six-month interest rate swap and the one-day Selic rate, both
at annual rates—has decreased significantly. Currently, the slope is at about
100 base points in contrast to the 540 base points observed when the last
Inflation Report was released. This movement reflects the change in
perception of the risk related to the Brazilian economy. The flattening of the
term structure may lead to a reduction in the cost of credit in a not so distant
future and, as a consequence, may lead to higher aggregate demand.
It is ratified the assessment of the previous Inflation Report that the negative
effect on aggregate supply of the measures to rationalize the use of electric
energy would be smaller than initially forecasted. Therefore, it is possible
that aggregate supply does not constrain the recovery of economic growth.
Similarly, the lower level of capacity utilization (79.9% in October against
83.9% and 80.9% in April and July, respectively) indicates favorable
conditions for a higher level of economic activity without pressuring prices.
Besides, production of capital goods grew 15.7% between January and
October compared to the same period of the previous year.
The pressure of the exchange rate depreciation on inflation, in particular, its
effect on readjustment of government-managed prices, should be monitored
carefully. However, the recent fall of the exchange rate, as well as of the
price of the barrel of oil—the Brent crude oil price presented an average
price of US$ 20.3 in the fourth quarter until December 17th, against US$
26.20 in the third quarter—indicate lower pressure on fuel prices in 2002.
Regarding market prices, the contraction in domestic and external demand
counteracts the pressure of the pass-through from the exchange rate
depreciation accumulated over the year.
Despite the difficulty to assess the stage of the adjustment of relative prices,
this Report considers that the higher than expected increases in the IPCA in
October (0.83%) and November (0.71) are in part a result of the exchange
Inflation Report December 2001
117
rate pass-through not occurred in the previous months. If inflation in the
third and fourth quarters already incorporates partially or totally the exchange
rate pass-trough not occurred—which was expected for 2002 as a result
of economic recovery—the effect on 2002 inflation should be smaller.
On the other hand, the greater inflation in the fourth quarter affects positively
the inflation in 2002 by means of inflation inertia.
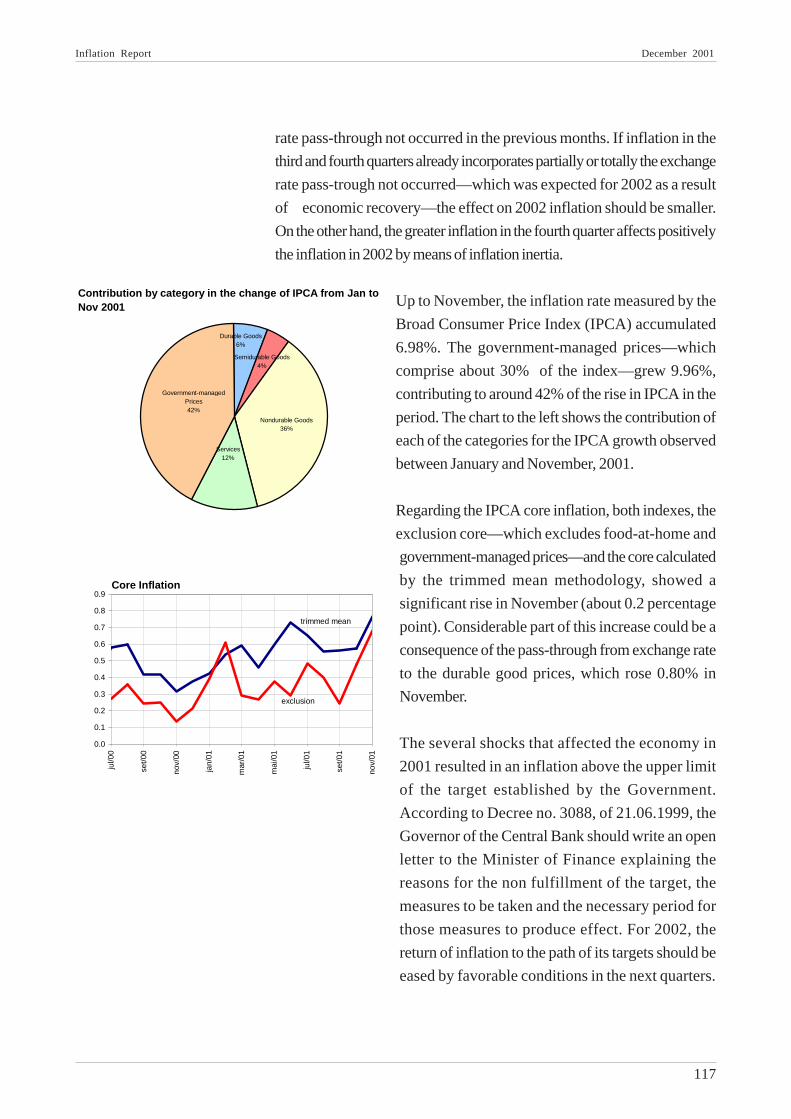
Up to November, the inflation rate measured by the
Broad Consumer Price Index (IPCA) accumulated
6.98%. The government-managed prices—which
comprise about 30% of the index—grew 9.96%,
contributing to around 42% of the rise in IPCA in the
period. The chart to the left shows the contribution of
each of the categories for the IPCA growth observed
between January and November, 2001.
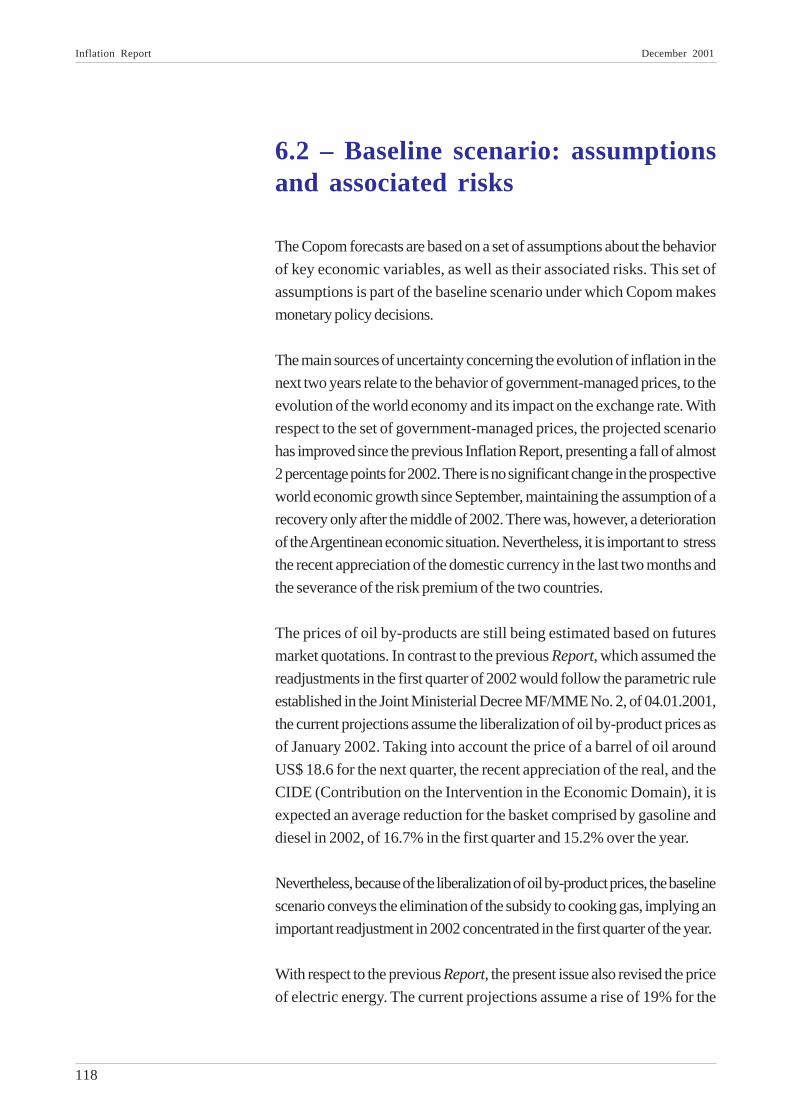
Regarding the IPCA core inflation, both indexes, the
exclusion core—which excludes food-at-home and
government-managed prices—and the core calculated
by the trimmed mean methodology, showed a
significant rise in November (about 0.2 percentage
point). Considerable part of this increase could be a
consequence of the pass-through from exchange rate
to the durable good prices, which rose 0.80% in
November.
The several shocks that affected the economy in
2001 resulted in an inflation above the upper limit
of the target established by the Government.
According to Decree no. 3088, of 21.06.1999, the
Governor of the Central Bank should write an open
letter to the Minister of Finance explaining the
reasons for the non fulfillment of the target, the
measures to be taken and the necessary period for
those measures to produce effect. For 2002, the
return of inflation to the path of its targets should be
eased by favorable conditions in the next quarters.
Contribution by category in the change of IPCA from Jan to Nov 2001
Government-managed Prices42%
Services12%
Nondurable Goods36%
Durable Goods6%
Semidurable Goods4%
0.0
0.1
0.2
0.3
0.4
0.5
0.6
0.7
0.8
0.9
jul/0
0
set/0
0
nov/
00
jan/
01
mar
/01
mai
/01
jul/0
1
set/0
1
nov/
01
Core Inflation
trimmed mean
exclusion
Inflation Report December 2001
118
6.2 – Baseline scenario: assumptionsand associated risks
The Copom forecasts are based on a set of assumptions about the behavior
of key economic variables, as well as their associated risks. This set of
assumptions is part of the baseline scenario under which Copom makes
monetary policy decisions.
The main sources of uncertainty concerning the evolution of inflation in the
next two years relate to the behavior of government-managed prices, to the
evolution of the world economy and its impact on the exchange rate. With
respect to the set of government-managed prices, the projected scenario
has improved since the previous Inflation Report, presenting a fall of almost
2 percentage points for 2002. There is no significant change in the prospective
world economic growth since September, maintaining the assumption of a
recovery only after the middle of 2002. There was, however, a deterioration
of the Argentinean economic situation. Nevertheless, it is important to stress
the recent appreciation of the domestic currency in the last two months and
the severance of the risk premium of the two countries.
The prices of oil by-products are still being estimated based on futures
market quotations. In contrast to the previous Report, which assumed the
readjustments in the first quarter of 2002 would follow the parametric rule
established in the Joint Ministerial Decree MF/MME No. 2, of 04.01.2001,
the current projections assume the liberalization of oil by-product prices as
of January 2002. Taking into account the price of a barrel of oil around
US$ 18.6 for the next quarter, the recent appreciation of the real, and the
CIDE (Contribution on the Intervention in the Economic Domain), it is
expected an average reduction for the basket comprised by gasoline and
diesel in 2002, of 16.7% in the first quarter and 15.2% over the year.
Nevertheless, because of the liberalization of oil by-product prices, the baseline
scenario conveys the elimination of the subsidy to cooking gas, implying an
important readjustment in 2002 concentrated in the first quarter of the year.
With respect to the previous Report, the present issue also revised the price
of electric energy. The current projections assume a rise of 19% for the

Inflation Report December 2001
119
consumer in 2002, with a direct effect of 0.72 percentage point on the
IPCA. The projections also incorporate an indirect effect of 0.21 percentagepoints on IPCA stemming from an increase of 24% in the price of industrialelectric energy. This effect reflects the fact that electric energy represents acost for firms, but, because of the estimated output gap, the firms will beable to pass through only part of the increase to consumers.
Besides the direct and indirect effects on inflation resulting from theadjustments of electric energy prices, other effects related to the restrictionof aggregate supply are not being considered. First, the rationing of electricenergy affected aggregate supply less than initially expected. Besides, therecovery of the levels of the reservoirs and the additional supply of energycoming from other sources have increased the probability that supply
conditions comes back to normal in the medium run.
For the set of government-managed prices, which comprises 30.7% of theIPCA in November, it is forecasted an inflation of 10,7%, 5,3% e 3.1% for2001, 2002, and 2003, respectively. For 2003, most of the government-managed prices should follow market inflation, except telephones and electricenergy, whose prices should increase by around 5,5%, based on the IGP-
M. The government-managed prices should contribute with 3.1, 1.6 and0.9 percentage points in these three years.
The baseline scenario conveys a stable path for exchange rate in 2002.Specifically, the exchange rate maintains a stable level with respect to theone that prevailed the day before the Copom meeting. Because of this
treatment for the exchange rate and its recent appreciation, the averageexchange rate in the next quarter should be more appreciated when comparedto the current quarter, contributing to lower inflation in 2002.
The baseline scenario assumes that Brazil’s risk, measured by the spreadover Treasury of the Global 04, should decline from a 870 base point average
in the last quarter of 2001— 719 base points on December 17th, 2001—toabout 700 base points until the end of the first quarter of 2002. For the Fedfunds rate, based on the behavior of futures markets, it is assumed themaintenance of the current level for the following quarter, a gradual increasereaching 2.25% by the end of 2002, and stability thereafter.
The current exchange rate implies a 18% depreciation since the beginning
of the year. Exports are reacting satisfactorily. The trade balance should be
Inflation Report December 2001
120
near to US$ 2 billion in 2001, and, in the next year, should reach US$ 5
billion. Furthermore, one notes a new impulse in foreign issues, which may
continue over the next year as the international markets situation normalizes.
The baseline scenario assumes that agricultural prices should evolve according
to market inflation in the next two years. The 3.5% growth forecast for the
agricultural production in 2002 should be in line with the rise of demand and,
therefore, the agricultural sector should be neutral with respect to the inflation.
Concerning the slope of the interest rate term structure, measured by the
difference between the 6-month interest rate swap and the Selic rate, one
assumes this difference will decline from the average of 2.9 percentage points
in the fourth quarter, reaching 1 percentage point as of the second quarter
of 2002 and slightly decreasing then on.
Finally, regarding fiscal policy, one maintains the assumption of fulfillment of
the targets for the primary surplus of the consolidated public sector
established in the Government’s Economic Program.
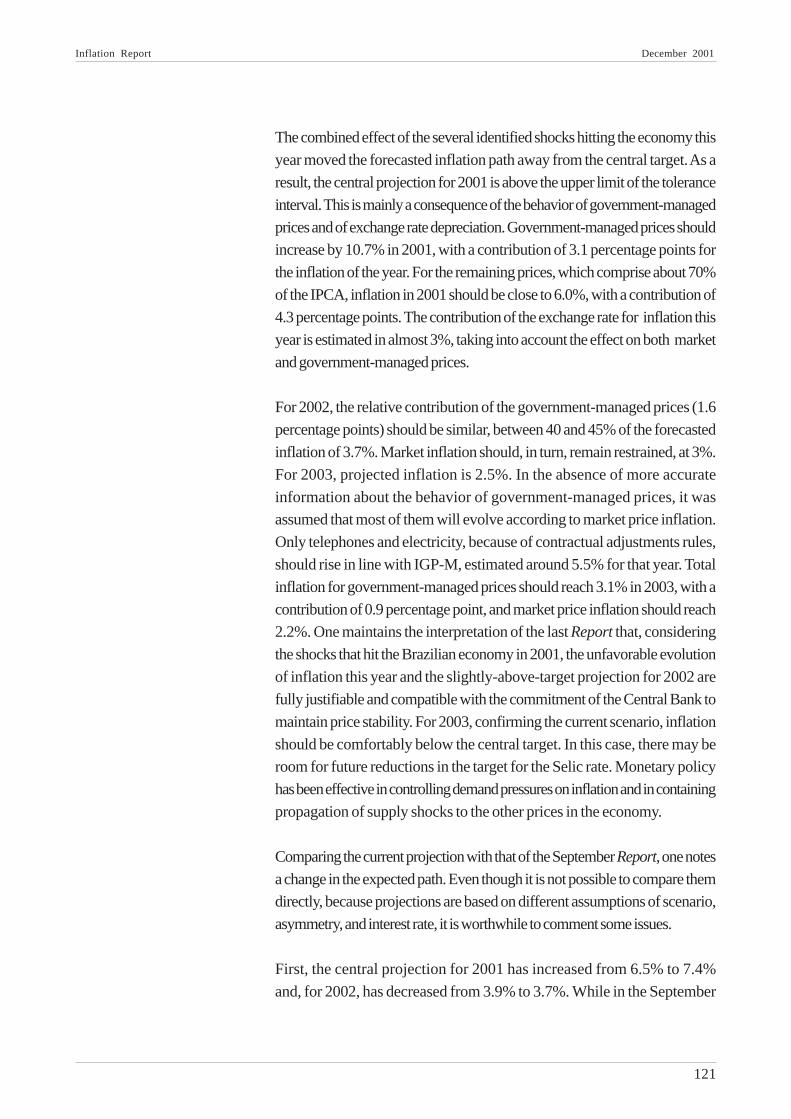
6.3 – Inflation forecastBased on available information and the assumptions
with associated risks considered by Copom, a
projection of the 12-month IPCA inflation rate was
constructed. This projection considers that the basic
interest rate will remain constant at the level of 19%
per year set out at the Committee’s December 18th
and 19th, 2001 meeting.
This Report includes, for the first time, inflation
projections until 2003. The central path expected for
the 12-month inflation decreases monotonically from
7.4% in 2001 to 3.7% in 2002 and 2.5% in 2003.
Note that the probabilities of deviations are
symmetrically distributed around the median, reflecting
Copom’s judgment on the balance of risks associated
with the projection.
(accumulated inflation in 12 months)
Forecasted IPCA-inflation with interest rate fixed at 19% p.y.
Inflation Fan Chart
-4
-2
0
2
4
6
8
10
1999
:2
1999
:4
2000
:2
2000
:4
2001
:2
2001
:4
2002
:2
2002
:4
2003
:2
2003
:4
IPCA with 19% p.y. fixed interest rateYear Q Central
Projection
2001 4 7.0 7.2 7.3 7.5 7.6 7.7 7.4
2002 1 6.1 6.4 6.6 6.9 7.2 7.5 6.8
2002 2 5.1 5.5 6.0 6.3 6.8 7.2 6.1
2002 3 3.4 4.0 4.6 5.1 5.6 6.3 4.8
2002 4 2.0 2.7 3.3 4.0 4.6 5.4 3.7
2003 1 1.4 2.2 3.0 3.7 4.4 5.2 3.3
2003 2 0.9 1.7 2.5 3.3 4.0 4.9 2.9
2003 3 0.5 1.4 2.2 3.0 3.8 4.7 2.6
2003 4 0.3 1.3 2.1 2.9 3.7 4.7 2.5
10%
Note: Accumlulated inflation in 12 month, in % p.y. The values correspond to the ones shown in inflation fan chart.
Confidence Intervals
50%
30%
Inflation Report December 2001
121
The combined effect of the several identified shocks hitting the economy this
year moved the forecasted inflation path away from the central target. As a
result, the central projection for 2001 is above the upper limit of the tolerance
interval. This is mainly a consequence of the behavior of government-managed
prices and of exchange rate depreciation. Government-managed prices should
increase by 10.7% in 2001, with a contribution of 3.1 percentage points for
the inflation of the year. For the remaining prices, which comprise about 70%
of the IPCA, inflation in 2001 should be close to 6.0%, with a contribution of
4.3 percentage points. The contribution of the exchange rate for inflation this
year is estimated in almost 3%, taking into account the effect on both market
and government-managed prices.
For 2002, the relative contribution of the government-managed prices (1.6
percentage points) should be similar, between 40 and 45% of the forecasted
inflation of 3.7%. Market inflation should, in turn, remain restrained, at 3%.
For 2003, projected inflation is 2.5%. In the absence of more accurate
information about the behavior of government-managed prices, it was
assumed that most of them will evolve according to market price inflation.
Only telephones and electricity, because of contractual adjustments rules,
should rise in line with IGP-M, estimated around 5.5% for that year. Total
inflation for government-managed prices should reach 3.1% in 2003, with a
contribution of 0.9 percentage point, and market price inflation should reach
2.2%. One maintains the interpretation of the last Report that, considering
the shocks that hit the Brazilian economy in 2001, the unfavorable evolution
of inflation this year and the slightly-above-target projection for 2002 are
fully justifiable and compatible with the commitment of the Central Bank to
maintain price stability. For 2003, confirming the current scenario, inflation
should be comfortably below the central target. In this case, there may be
room for future reductions in the target for the Selic rate. Monetary policy
has been effective in controlling demand pressures on inflation and in containing
propagation of supply shocks to the other prices in the economy.
Comparing the current projection with that of the September Report, one notes
a change in the expected path. Even though it is not possible to compare them
directly, because projections are based on different assumptions of scenario,
asymmetry, and interest rate, it is worthwhile to comment some issues.
First, the central projection for 2001 has increased from 6.5% to 7.4%
and, for 2002, has decreased from 3.9% to 3.7%. While in the September
Inflation Report December 2001
122
Report, the initial inflation was lower and remained stable until the third
quarter of 2002, in the current projection, inflation starts from a higher level,
but declines more rapidly. Inflation in the last quarter of 2001 will be above
of that projected in September, probably due to anticipation of the exchange
rate pass-through to prices. As it was discussed in the Notes of the 64th
Copom meeting, part of the pass-through to the prices stemmed from the
depreciation of the real in 2001 could take place in the next year, when
aggregate demand could be higher. The signals, still tenuous, of stabilization,
or even of a slight recovery of economic activity, are consistent with an
anticipation of this pass-through, already affecting negatively inflation in 2001.
For 2002, the increase in forecasted inflation for the first quarter is mainly a
result of the inertial effect of the more than the previously forecasted inflation
at the end of 2001. Nevertheless, because of the appreciation of the real
and of the lower forecasted inflation for the set of government-managed
prices, there was a reduction in the projected inflation for 2002, since the
last Report, from 3.9% to 3.7%.
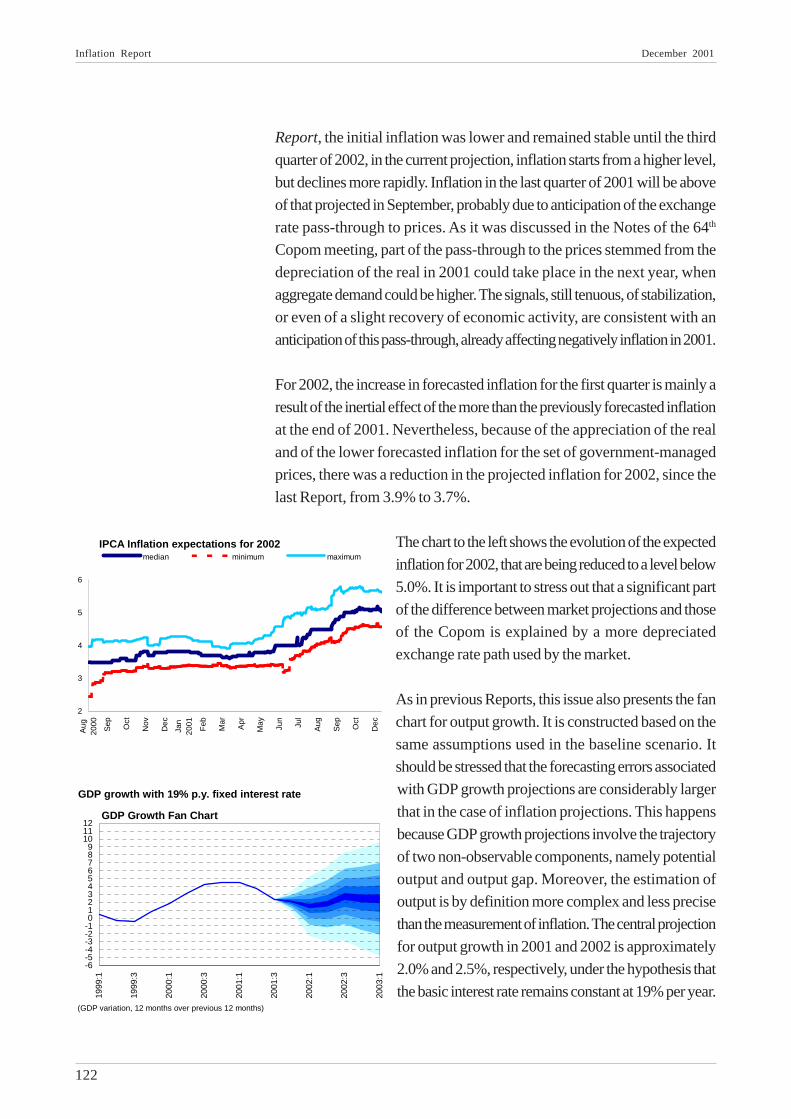
The chart to the left shows the evolution of the expected
inflation for 2002, that are being reduced to a level below
5.0%. It is important to stress out that a significant part
of the difference between market projections and those
of the Copom is explained by a more depreciated
exchange rate path used by the market.
As in previous Reports, this issue also presents the fan
chart for output growth. It is constructed based on the
same assumptions used in the baseline scenario. It
should be stressed that the forecasting errors associated
with GDP growth projections are considerably larger
that in the case of inflation projections. This happens
because GDP growth projections involve the trajectory
of two non-observable components, namely potential
output and output gap. Moreover, the estimation of
output is by definition more complex and less precise
than the measurement of inflation. The central projection
for output growth in 2001 and 2002 is approximately
2.0% and 2.5%, respectively, under the hypothesis that
the basic interest rate remains constant at 19% per year.
IPCA Inflation expectations for 2002
2
3
4
5
6
Aug
2000
Sep Oct
Nov
Dec
Jan
2001
Feb
Mar
Apr
May
Jun
Jul
Aug
Sep Oct
Dec
median minimum maximum
GDP growth with 19% p.y. fixed interest rate
(GDP variation, 12 months over previous 12 months)
GDP Growth Fan Chart
-6-5-4-3-2-10123456789
101112
1999
:1
1999
:3
2000
:1
2000
:3
2001
:1
2001
:3
2002
:1
2002
:3
2003
:1
Inflation Report December 2001
123
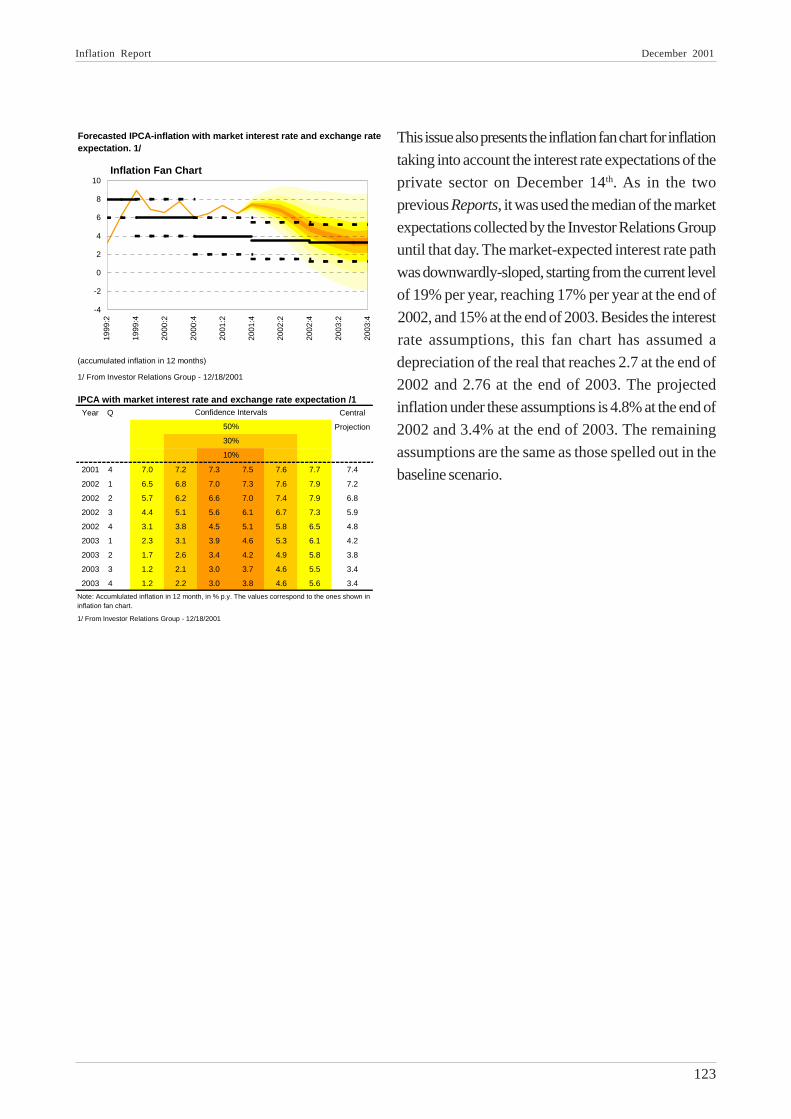
This issue also presents the inflation fan chart for inflation
taking into account the interest rate expectations of the
private sector on December 14th. As in the two
previous Reports, it was used the median of the market
expectations collected by the Investor Relations Group
until that day. The market-expected interest rate path
was downwardly-sloped, starting from the current level
of 19% per year, reaching 17% per year at the end of
2002, and 15% at the end of 2003. Besides the interest
rate assumptions, this fan chart has assumed a
depreciation of the real that reaches 2.7 at the end of
2002 and 2.76 at the end of 2003. The projected
inflation under these assumptions is 4.8% at the end of
2002 and 3.4% at the end of 2003. The remaining
assumptions are the same as those spelled out in the
baseline scenario.
(accumulated inflation in 12 months)
1/ From Investor Relations Group - 12/18/2001
Forecasted IPCA-inflation with market interest rate and exchange rate expectation. 1/
Inflation Fan Chart
-4
-2
0
2
4
6
8
10
1999
:2
1999
:4
2000
:2
2000
:4
2001
:2
2001
:4
2002
:2
2002
:4
2003
:2
2003
:4
Year Q Central
Projection
2001 4 7.0 7.2 7.3 7.5 7.6 7.7 7.4
2002 1 6.5 6.8 7.0 7.3 7.6 7.9 7.2
2002 2 5.7 6.2 6.6 7.0 7.4 7.9 6.8
2002 3 4.4 5.1 5.6 6.1 6.7 7.3 5.9
2002 4 3.1 3.8 4.5 5.1 5.8 6.5 4.8
2003 1 2.3 3.1 3.9 4.6 5.3 6.1 4.2
2003 2 1.7 2.6 3.4 4.2 4.9 5.8 3.8
2003 3 1.2 2.1 3.0 3.7 4.6 5.5 3.4
2003 4 1.2 2.2 3.0 3.8 4.6 5.6 3.4
1/ From Investor Relations Group - 12/18/2001
10%
Note: Accumlulated inflation in 12 month, in % p.y. The values correspond to the ones shown in inflation fan chart.
Confidence Intervals
50%
30%
IPCA with market interest rate and exchange rate expectation /1
Inflation Report December 2001
124
Modeling Exchange Rate and Risk Premium
The Central Bank of Brazil Research Department has been working on a medium-scale
macroeconomic model intended to be used as a complementary model to the small scale
structural model (SSSM), used by the Central Bank of Brazil authorities, Copom members,
as a supporting tool for the monetary policy decision process. In this box, some preliminary
results, related to nominal exchange rate, defined here as the domestic price of the foreign
currency, and sovereign risk premium, are presented. The nominal exchange rate is modeled
by an Uncovered Interest Parity (UIP) derived equation, monthly estimated with post ex-
change rate floating (Jan/1999) information. As a sovereign risk premium measure, we used
the C-Bond spread over treasury, regressed against fiscal, liquidity/solvency and external
variables and a few domestic and foreign shocks.
1.Exchange RateThe small scale structural model (SSSM), used by the Central Bank of Brazil authorities as
a supporting tool for the monetary policy decision process, can be resumed in a 4-equation
model as quoted in Bogdanski et alli (2000)1 . Among them, the Uncovered Interest Parity
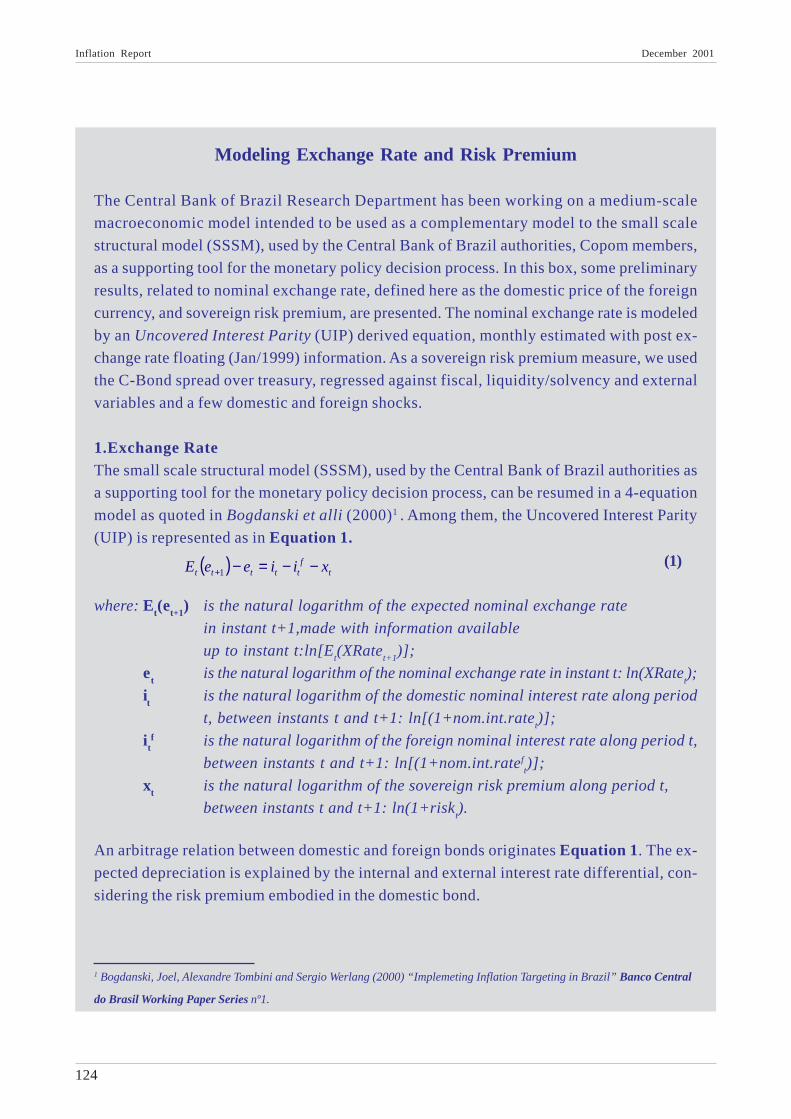
(UIP) is represented as in Equation 1.
1 Bogdanski, Joel, Alexandre Tombini and Sergio Werlang (2000) “Implemeting Inflation Targeting in Brazil” Banco Central
do Brasil Working Paper Series nº1.
( ) tf
ttttt xiieeE −−=−+1
where: Et(et+1) is the natural logarithm of the expected nominal exchange rate
in instant t+1,made with information available
up to instant t:ln[Et(XRate
t+1)];
et
is the natural logarithm of the nominal exchange rate in instant t: ln(XRatet);
it
is the natural logarithm of the domestic nominal interest rate along period
t, between instants t and t+1: ln[(1+nom.int.ratet)];
itf is the natural logarithm of the foreign nominal interest rate along period t,
between instants t and t+1: ln[(1+nom.int.rateft)];
xt is the natural logarithm of the sovereign risk premium along period t,
between instants t and t+1: ln(1+riskt).
An arbitrage relation between domestic and foreign bonds originates Equation 1. The ex-
pected depreciation is explained by the internal and external interest rate differential, con-
sidering the risk premium embodied in the domestic bond.
(1)
Inflation Report December 2001
125
Despite the fact of being derivated by an arbitrage condition, empirical results indicate that
UIP relation is not observed in several situations. In econometric exercises applied to industri-
alized countries data, whose risk premium are supposed to be zero, the estimated coefficient
to the (it - i
tf ) term are often close to zero or even negative and, in some cases, the results
reject the null hypothesis that this coefficient equals one. Other results indicate that the UIP
empirical observation depends on the considered horizon length, as well on the fact of whether
the country is industrialized or emerging, or even on the adopted exchange rate regime. Other
causes are information asymmetry, imperfect asset mobility and market inefficiency.
Aiming to adequately estimate the nominal exchange rate we might consider an UIP rewrit-
ing in order to achieve a higher empirical support. Indeed, we might consider a more flexible
way by which interest rate differential and risk premium affect exchange depreciation.
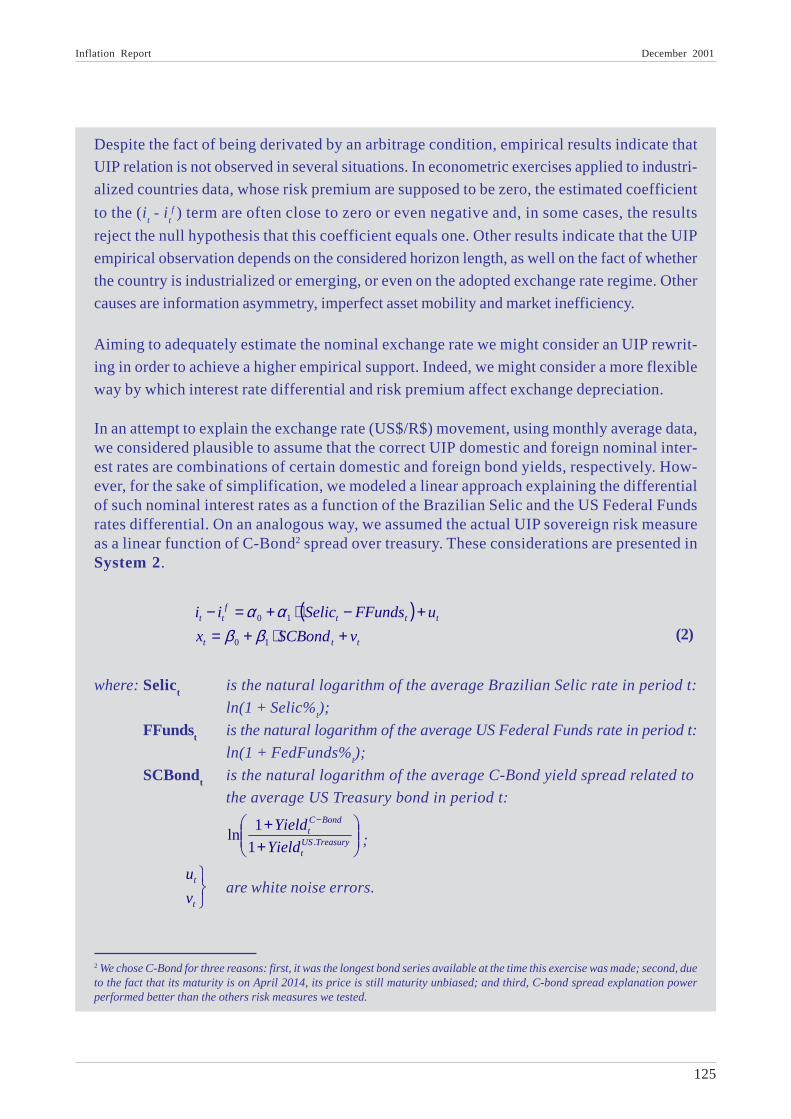
In an attempt to explain the exchange rate (US$/R$) movement, using monthly average data,we considered plausible to assume that the correct UIP domestic and foreign nominal inter-est rates are combinations of certain domestic and foreign bond yields, respectively. How-ever, for the sake of simplification, we modeled a linear approach explaining the differentialof such nominal interest rates as a function of the Brazilian Selic and the US Federal Fundsrates differential. On an analogous way, we assumed the actual UIP sovereign risk measureas a linear function of C-Bond2 spread over treasury. These considerations are presented inSystem 2.
2 We chose C-Bond for three reasons: first, it was the longest bond series available at the time this exercise was made; second, dueto the fact that its maturity is on April 2014, its price is still maturity unbiased; and third, C-bond spread explanation powerperformed better than the others risk measures we tested.
( )ttt
tttf
tt
vSCBondx
uFFundsSelicii
+⋅+=+−⋅+=−
10
10
ββαα
where: Selict
is the natural logarithm of the average Brazilian Selic rate in period t:
ln(1 + Selic%t);
FFundst is the natural logarithm of the average US Federal Funds rate in period t:
ln(1 + FedFunds%t);
SCBondt is the natural logarithm of the average C-Bond yield spread related to
the average US Treasury bond in period t:
are white noise errors.
���
����
�
++ −
TreasuryUSt
BondCt
Yield
Yield.1
1ln ;
���
t
t
v
u
(2)
Inflation Report December 2001
126
To model Et(e
t+1), we considered a simple univariate function described as follows. Due the
fact that this expectation is obtained with known information up to instant t, the most recentlag to explain it is in period t-1. Therefore, we modeled this expectation as in System 3.
( ) 1101
1101
−+
−+
⋅+=+⋅+=
ttt
ttt
eeE
zee
γγγγ
( ) ( ) ( ) tf
ttttttt SCBondFFundsSelicee εππγβαγ +−⋅−+∆⋅+−∆⋅−∆⋅=∆ − 11111 1
where: γi are the approach parameters;
zt is a white noise error.
Considering the first difference equation3 originated from Equation 1 and Systems 2 and 3and incorporating a long-run equilibrium condition based on purchase power parity (PPP)hypothesis, we could specify the nominal exchange rate dynamics according to Equation 4,assuming that the errors combination follows a white noise process.According to Equation 4, long-run ∆e
t equals inflation rate differential, considering Brazil-
ian IPCA and US PPI, as described in Equation 5, once considering that long-run move-ments of nominal interest rate differential and risk must be close to zero.
3 We couldn’t reject the null hypothesis that the exchange rate series has a unit root along post floating period.
where: ∆⋅ is a first difference operator: ∆ϕt ≡ ϕ
t - ϕ
t-1 ;
εt is a error combination , supposed to follow a white noise process;
( )11 −− +−− tttt uuvv
( )11 −− +−− tttt uuvv
πt is the natural logarithm of the Brazilian IPCA inflation rate in period t: ln(1+Π t);
πft
is the natural logarithm of the US PPI inflation rate in period t: ln(1+PPI%t).
( ) ( ) ( )flplpeq
flplpeq ee ππππγ
γ−=∆∴−⋅−⋅
−=∆ 1
1
11
1Conditioned to: γ
1 < 1
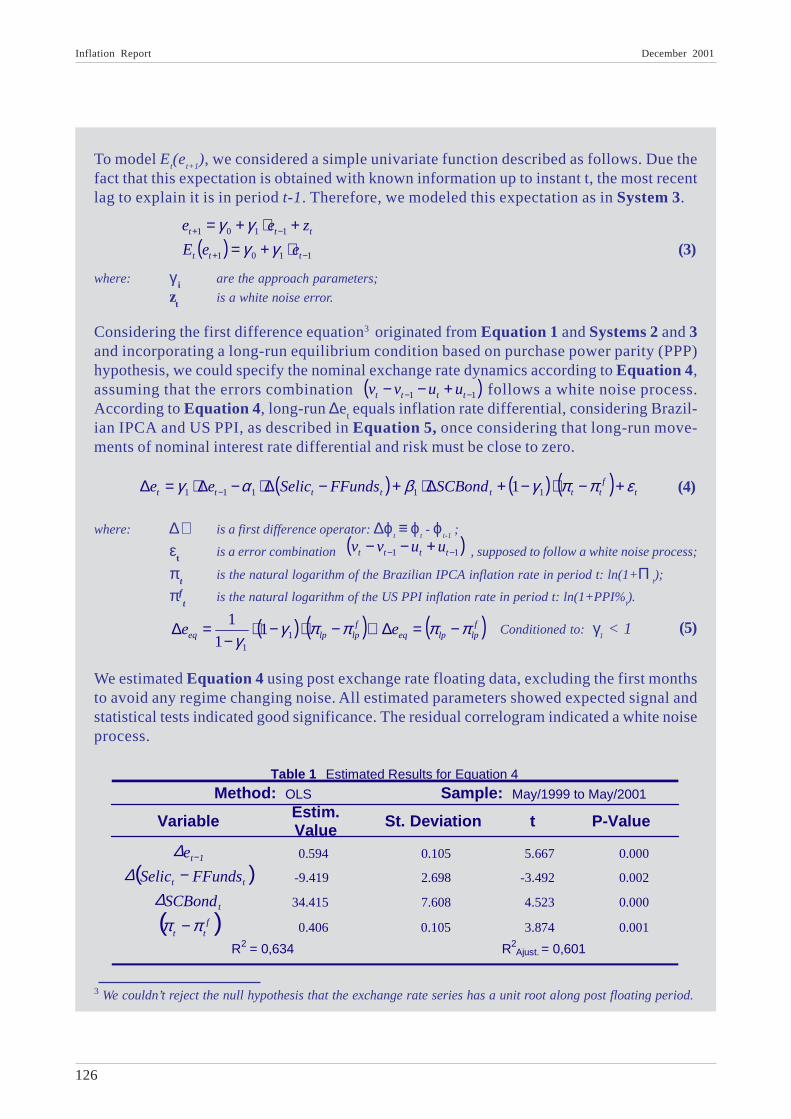
We estimated Equation 4 using post exchange rate floating data, excluding the first monthsto avoid any regime changing noise. All estimated parameters showed expected signal andstatistical tests indicated good significance. The residual correlogram indicated a white noiseprocess.
Table 1 Estimated Results for Equation 4
Method: OLS Sample: May/1999 to May/2001
Variable Estim.Value St. Deviation t P-Value
1te −∆ 0.594 0.105 5.667 0.000
( )tt FFundsSelic −∆ -9.419 2.698 -3.492 0.002
tSCBond∆ 34.415 7.608 4.523 0.000
( )ftt ππ − 0.406 0.105 3.874 0.001
R2 = 0,634 R2Ajust. = 0,601
(3)
(4)
(5)
Inflation Report December 2001
127
Table 1 shows output result. Nominal interest rates differential risings generate exchangerate appreciations while risk premium risings are associated to exchange rate depreciations.
Although interest rates differential and risk coefficients are significant, its absolute valuesare much higher than the predicted by UIP relation. However, due to the small sample length,nothing guarantee us that the real exchange rate obtained by the Equation 5 projectionsshould converge to a long-run equilibrium. The fact that the domestic interest rate and therisk premium have been considered far from the supposed equilibrium values, during allsample period, supports the last assertive.
2.Risk Premium
In this second part, we will try to endonize the sovereign risk premium proxy considered in Equation4, the C-Bond spread over treasury. Although literature indicates several economic variables to
explain risk perceptions, it’s necessary to use a parsimonious criterion. We decided to estimate a
C-Bond spread over treasury explained by fiscal, foreign trade and liquidity/solvency variables.
Intending to follow a parsimonious criterion, we needed to pursue relevant variables avoiding, on
the other hand, an over fitting bias, mainly when including dummy variables related to domestic
and foreign economic shocks.
In the best specification, represented on Equation 6, three variables, representing fiscal, foreign
trade and liquidity/solvency variables, explained the risk premium: foreign exchange reserves (% of
GDP), net public sector debt (% of GDP) and current account balance (% of GDP). In order to
capture economic shocks, we used pulse dummies related to Mexico crisis, whose bigger effects
were felt on January 1995, Russia moratorium on August 1998 and speculative attack to Real on
December 1998, that culminated on an exchange rate regime change in the following month.
where: Res/GDPt
is the 12 month foreign exchange reserves (% of GDP);
NPD/GDPt
is the 12 month net public sector debt (% of GDP);
CurAc/GDPt
is the 12 month current account balance (% of GDP);
DUMMYj
are pulse dummy variables related to economic shocks (Jan/95, Aug/98 and Dec/98);
ηt is a white noise error.
Considering that the higher the foreign exchange reserves level, the better is the economyliquidity/solvency situation. Thus, a negative Res/GDP
t coefficient is expected. Analogously,
the higher the net public sector debt or the lower the current account balance, the higher isthe sovereign risk premium expectation, that leads us to an expectancy of positive and nega-tive coefficients signals, respectively. Estimated output is shown in Table 2.
tj
Jjt
tttt
DUMMYaGDPCurAca
GDPNPDaGDPsaSCBondaaSCBond
η+⋅+∆⋅+
+∆⋅+∆⋅+⋅+=
�
−
/
//Re
4
32110
(6)
Inflation Report December 2001
128
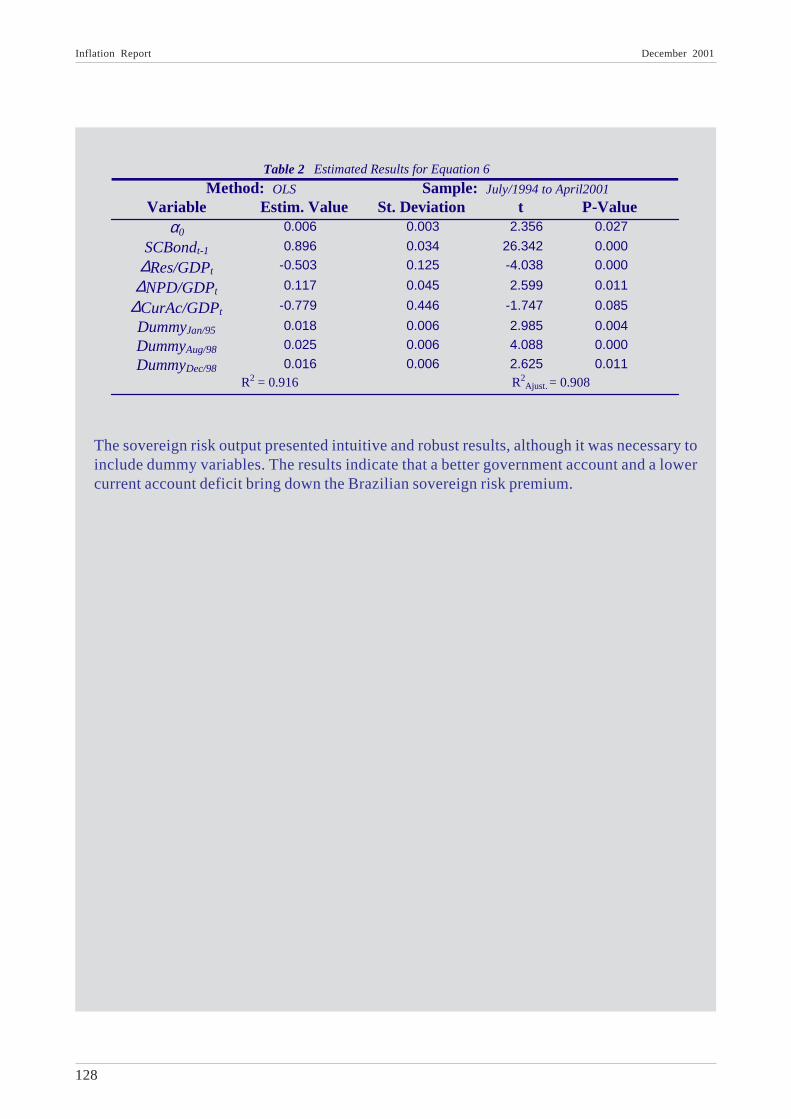
The sovereign risk output presented intuitive and robust results, although it was necessary toinclude dummy variables. The results indicate that a better government account and a lowercurrent account deficit bring down the Brazilian sovereign risk premium.
Table 2 Estimated Results for Equation 6
Method: OLS Sample: July/1994 to April2001
Variable Estim. Value St. Deviation t P-Valueα0 0.006 0.003 2.356 0.027
SCBondt-1 0.896 0.034 26.342 0.000
∆Res/GDPt -0.503 0.125 -4.038 0.000
∆NPD/GDPt 0.117 0.045 2.599 0.011
∆CurAc/GDPt -0.779 0.446 -1.747 0.085
DummyJan/95 0.018 0.006 2.985 0.004
DummyAug/98 0.025 0.006 4.088 0.000
DummyDec/98 0.016 0.006 2.625 0.011R2 = 0.916 R2
Ajust. = 0.908
Inflation Report December 2001
129
Annex
Minutes of the 63rd Meeting of the Banco Central do BrasilMonetary Policy Committee (Copom)
Date: September 18 and 19, 2001
Place: Central Bank’s Headquaters 8th floor meeting room (on 09.18) and 20th floor (on 09.19)
-Brasília - DF
Called to Order: 4:17 PM on 09.18 and 5:41 PM on 09.19
Adjourned: 8:01 PM on 09.18 and 7:58 PM on 09.19
In attendance:Members of the BoardArminio Fraga Neto - PresidentCarlos Eduardo de Freitas
Daniel Luiz Gleizer
Edison Bernardes dos Santos
Ilan Goldfajn
Luiz Fernando Figueiredo
Tereza Cristina Grossi Togni
Department Heads (all present on 09.18)Altamir Lopes - Economics Department (DEPEC)
Daso Maranhão Coimbra - International Reserve Operations Department (DEPIN)
Gustavo Bussinger - Research Department (DEPEP)
José Antônio Marciano - Department of Banking Operations and Payments System (DEBAN)
Sérgio Goldenstein - Open Market Operations Department (DEMAB)
Other participants (all present on 09.18)José Pedro Ramos Fachada Martins da Silva - Senior Advisor to the Board
Alexandre Pundek Rocha - Senior Advisor to the Board
Antônio Carlos Monteiro - Executive Secretary
João Borges - Press Secretary (ASIMP)
Fabia Aparecida de Carvalho - Coordinator of the Investor Relations Group
Inflation Report December 2001
130
The Board analyzed the recent performance of, and prospects for the Brazilian and international
economies under the monetary policy framework, designed to comply with the inflation targets
determined by the government.
Economic activity
Domestic economic activity continues to indicate deceleration, following the trend observed
since the end of the first quarter. This has been reflecting the deterioration in the external economic
situation and the energy crisis and, the resulting impact on expectations and on the behavior of
interest and exchange rates.
The demand indicators exhibited relative stability in August and September, partly due to their
prompt and stronger response to the changes in the economic environment. Nevertheless, the
signs are still incipient to affirm that the deceleration process is near the end. In addition, the
repercussion of the attacks to the U.S.A. has not yet reflected in the economic indicators released
so far. It shall be stressed, however, that the likely unraveling of this crisis creates new uncertainties
regarding the external economic environment, which is unfavorable for recovery in the domestic
economic activity in the current circumstances.
Preliminary data released by the Trade Federation of the State of São Paulo (FCESP), showed
that the retailers turnover in the Metropolitan Region of São Paulo increased by 1% in August
compared to July, but accumulated a 3% drop year-to-date compared to the same period of
2000. The outcome in August was affected by the 7.2% increase in the sales of construction
material, which offset the 1.3% decline in the sales of consumer goods and 8.3% in the auto-
vehicle sales.
The Consumer Intentions Index (IIC), also measured by FCESP, partially recovered in September
to reach 94.9, still within the pessimistic range – below 100, in a 0 to 200 scale. This recovery
featured the positive evolution of both components, current and future intentions, mirroring a less
negative perception of domestic economic and political environment at the end of August, when
the survey was carried out. Therefore, the result in September still does not reflect the repercussion
of the attacks to the U.S.A. on the formation of domestic expectations.
The overall investment indicators in the country exhibited signs of cooling in July, mainly regarding
imports and exports of capital goods, whereas domestic production of capital goods still showed
some dynamism, geared by the effects of the energy rationing, which bolstered the production of
energy generation equipments. The production of raw material for the building industry leveled
off in the month, after plunging in the previous bimester.
Inflation Report December 2001
131
The industrial production decelerated for the fifth consecutive month in July, with a 1.2% decline
in the seasonally adjusted series. In the year, the industrial production grew by 4.3%, with the
accumulated change reaching 5.1% in the twelve months to July, from 5.7% in June. In the
month, negative growth was observed in 13 of a total of 20 industrial sectors and 3 of the 4 usage
categories. Positive growth was observed solely in the production of capital goods. Noteworthy,
in the two first months under the energy rationing program, the industrial production diminished
by 0.1% compared to the same months last year, as a result of the 4.7% reduction in the production
of durable consumer goods and 1.6% in intermediate goods. Considering the intensity of electrical
energy expenditures, highly intensive sectors cut down on production by 10.1% in the June-July
period, whereas medium and low intensive sectors expanded by 4.4% and 4%, respectively,
compared to the same period of 2000.
The weaker performance in industrial production resulted in a new reduction of productive
capacity, as surveyed by the National Confederation of Industries (CNI), reaching 79.7% in July
in the seasonally adjusted basis. It was the fifth consecutive drop since the recent 82% peak
observed in February 2001. Working hours in the production reduced by 1.5% in July, in the
seasonally adjusted basis, as reported by CNI, revealing that the overtime cuts and the collective
vacation have constituted the preferred alternative as compared to job cuts to adjust to deceleration
in t industrial activity. Notwithstanding, industrial surveys indicate reduction in employment in this
sector. The unemployment rate reached 6.19% in July, versus 6.38% in June, though as a result of
reduction of 49 thousand positions and of 91 thousand people in the employable population (PEA).
Regarding credit operations, the outstanding stock of free resources increased by 2.4% in August,
due to a 2.6% increase in the operations with corporations and 2.1% with households. This
performance, however, continued to reflect a positive flow resulting from transactions settled
previously, as new loans fell for the second consecutive month, a response to the environment of
uncertainties together with the maintenance of lending rates on an upward trend. The daily average
of credit concession to corporations and households dropped by 6.1% and 1.3% in August,
respectively, compared to the previous month.
On the fiscal front, the increase of the primary surplus to R$ 34.4 billion up to September confirms
the maintenance of austerity. In August, collection of taxes and contributions remained at a growing
pace, mainly due to the effects of tax collection on capital income and financial turnover, as tax
collection on corporate revenue has been growing at a lower pace, reflecting the deceleration of
the economic activity.
As to the external transactions of the Brazilian economy, the trade balance recorded a US$ 663
million surplus in August and a US$ 120 million surplus on the first two weeks of September,
accumulating a positive result of US$ 779 million year to date. Noteworthy, after May, exports
Inflation Report December 2001
132
and imports started to grow at lower rates, reflecting, simultaneously, but at a different intensity,
the effects of deceleration in the Brazilian and global economies.
In August, exports was improved by aircraft re-exports, similarly to August 2000, although growth
in sales of basic products continued to be remarkable, mainly poultry, beef and pork, together
with the recovery in exports of semi-manufactured products, resulting from the recovery in sales
of iron and steel products and the continuing sugar export growth. Shipment of manufactured
products fell once again compared to the same month of 2000. As to market destination, the best
results were achieved with countries holding a smaller share of Brazilian exports, confirming the
diversification of destination of Brazilian sales in 2001, at the same time as the sales to the main
markets, United States and Mercosur, slowed.
Regarding total import volumes, purchases of capital goods were the sole segment to increase comparing
to August 2000. In terms of daily average volumes , only the acquisition of fuel and oil surpassed August
2000 results. The reduction in purchases of consumption and intermediate goods reflects the slower
industrial output growth in the country and the recent depreciation of the exchange rate.
To conclude, the deterioration in the external front and the adjustment of the economy to the
energy crisis triggered a process deceleration in economic activity, which is still on. As a result,
the observed and projected growth rates for the Brazilian economy for 2001 is lower. The labor
market is starting to adjust, albeit gradually, to this environment, which shall exert additional
pressure to the real wage bill, already affected by the impact from administered price adjustments.
The deterioration of credit conditions, with more selectivity, shorter maturities and higher interest
rates, does not favor demand recovery. The fiscal position remains favorable, yet with prospect
for continued decelerating revenue growth. The recent trend in trade suggests recovery of surpluses,
mainly reflecting the downward trend of imports inasmuch as the international environment, even
prior to the attacks to the United States, was unfavorable for exports .
External environment
To evaluate the world economic outlook after the attacks to the United States on September 11
is more difficult as it tends to be tightly linked to the impact of such actions upon the North
American economy. Although premature, the analysis is based on the acute expectation of
unfavorable influence on consumer confidence and the prospects for deepening the slowing in the
short run. This led the Federal Reserve to reduce basic interest rates by 50 bp, for the eighth time
in the year, on September 17, currently standing at 3% . Alongside monetary loosening, the
government signals the adoption of expansionary fiscal policy, partially using the primary surplus,
which tends to produce positive impacts over the medium term, fostering the recovery stimulated
by an easier monetary policy.
Inflation Report December 2001
133
Until early September, U.S. economy remained on a decelerating process and statistics released did
not signal recovery in the short run. The consumption remained as the main pillar of demand, albeit
on a downward trend, as investments decreased significantly since the end of 2000. The accentuated
drop in investments has been recorded in the levels of inventory and fixed assets, such as facilities,
machinery and software. It shall be stressed that this adjustment is considered relevant for the correction
of imbalances impelled by the high growth period. The positive fiscal results have been inferior to
initially expected, reflecting tax reduction, the change in collecting dates and the lower activity level.
Trade has also been influenced by the deceleration growth , resulting in lower rates of import growth.
Additionally, global repercussion of the fall in U.S. economic activity has translated into lower
export growth rates. The evolution of price indices does not evidence existence of inflation pressures,
enabling interest rate reduction. It shall be stressed that the expectations of manager’s purchases
(NAPM ) in the manufacturing sector had improved substantially in July, differently from the
expectations of the managers in the services sector and consumers.
In the Euro Area, statistics point to the contagion from the deceleration process in the United
States. The Gross Domestic Product in the second quarter expanded by 1.7% relatively to the
same period in the previous year, after a 2.4% rise in the first quarter. Country specific indicators
relative to July and August and entrepreneurs’ perception, translated into the fall in confidence
indicators of the three major economies in the region – Germany, Italy and France-, suggest the
maintenance of this trend in the next quarter. It shall be emphasized that, in coordination with the
Federal Reserve, the European Central Bank reduced basic interest rates by 50 basis points on
September 17th, after which the main rediscount rate stood at 3.75% p.a.
The Japanese economy remains with no signs of recovery in the activity level although the yen has
been showing appreciation trend. Eastern Asian economies, which tend to present high dependence
on both American and Japanese demand, are searching for measures to countervail external sector
retraction, with China and South Korea featuring as the most successful.
Latin American economies are undergoing the unfavorable impacts from the international markets
via trade and tighter liquidity in financial markets, resulting in higher uncertainty and risk aversion
from investors. The Argentine economy remains in recession, despite internal efforts and financial
support programs by international financial institutions.
In synthesis, the trend of cooling in economic activity is observed at a global level, led by the
United States. This scenario tends to become deepen in the short run, as a function of the
recrudescence of American consumer and corporate spending contraction, in response to the
attacks on September 11. Nonetheless, the easing, already in progress, of monetary and fiscal
policies in the United States should contribute to mitigate the contracting output trend in the medium
term, with positive impacts for the world economy.

Inflation Report December 2001
134
Prices
In August, the adjustment of the administered prices continued to exert pressure on the main
inflation indices, albeit at a lower intensity, thus contributing to lower monthly changes as compared
to July. Considering consumer prices, electricity price adjustments in São Paulo, Curitiba and
Belém, together with the rise of fuel prices at a national level put forth the most significant impact
on the monthly outcome. As to wholesale prices, in addition to the impact from fuel prices, it shall
be stressed the pressure from the increase in cereals and grains and crops for exports, among
agricultural products, reflecting, in part, the effects of the exchange rate variation.
The IPCA rose by 0.70% in August, compared to 1.33% in July, accumulating 5.06% in the year
and 6.41% in the last twelve months. The retreat in the monthly outcome was due to the lesser
impact of administered price adjustments, which concentrated in July. Food prices increased by
0.83%, geared by the 21% hike in soy oil prices, mostly led by the rise in international prices
which had impacted wholesale prices in July. The impressive hikes in wheat flour, bread and pasta
prices reflected both wheat price increases and the exchange rate variation. Still in the food sector,
price increases were associated with off-season effects. The item domestic employee, which
incremented by 2.38%, featured as the main individual contribution for the monthly variation (0,08
pp). This percentage reflects the variations in the labor market after the minimum wage adjustment
in May. Regarding the item electricity , the 1.21% variation was a consequence of a 10.79%
increase recorded in Belém, where the tariffs were readjusted by 14%, after August 7.
The IGP-DI rose by 0.9% in August, compared to 1.62% in July, accumulating 7.4% in the year
and 9.8% in the last twelve months. The 1.13% variation in IPA was the main determinant of the
IGP-DI result, whereas the IPC rose by 0.54%, still reflecting the hike in administered prices. The
INCC increased by 0.62%, exclusively as a result of the hikes in civil construction prices inasmuch
as labor costs remained stable.
Based on the analysis of July and August indices, a conclusion may be drawn that the hikes
observed stemmed from pressures arising from specific groups. A generalized rise among sectors
is not evident, nor are continuous upward movements, which evinces the absence of indexation
mechanisms in the economy. Taking into account this fact, together with the waning of pressures
derived from administered price adjustments, a prospect for significant reduction in inflation rates
is expected for the coming months.
Money market and open market operations
The trend of reduction in the slope of the interest rate yield curve continued some weeks after last
Copom meeting, motivated by the interpretation that the 19% Over-Selic target would be an
Inflation Report December 2001
135
interest rate ceiling and by the favorable news on the external front¾increase in the Purchasing
Manager’s Index (NAPM) in August, indicating smaller retraction in the activity level, and tax
collection in Argentina at a level higher than expected. Between August 22 and September 9, the
spread between the Over-Selic rate and the Futures DI to January reduced to 190 bp from 340
bp. Nonetheless, after the attacks to the U.S. on September 11, this trajectory reverted, with the
spread increasing to 320 bp on September 17. On that date, a higher slope was observed in the
whole extension of the curve.
In September, the strategy of rolling over integrally the principal and final interest payments of
exchange rate indexed securities, preferably with placements of NTN-D, has started. As a means
to roll over the R$5.8 billion in NBCE redeeming on September 6, three auctions of 3-year
NTND were carried out, at a financial volume equivalent to 67% of the total redeemed, in addition
to an 11-month placement, matching the demand for long term securities. The yield for the three-
year securities reduced to 10.38% p.a. in the last auction from 10.87% p.a. in the two first ones.
For shorter maturity securities, the average yield was of 5.54% p.a..
The rollover of the R$3.7 billion redemption on September 17 was carried out with two auctions
of three-year NTND (totaling 69% of the redemption), at rates of 11.50% and 11.95%, and an 8-
month security offer at an average yield of 5.81%. On August 29, there was still a 3-year NBCE
auction to rollover R$1.1 billion in NTND maturing on September 3. The average yield was of
10.29% p.a.. On September 13 and 14, a total of three placements of five-month NBCE was
realized to meet the demand for hedge. The resulting financial volume transacted was of R$6.7
billion and the average yields were of 9.69%, 9.96% and 10.26%. The large quantities offered
and the yields accepted sanctioned an increase of the exchange rate coupon.
On August 29, a five-month LTN auction was settled. The financial volume transacted was of
R$0.9 billion at an average yield of 22.6%, which presented reduction relatively to similar auction
carried out in the previous week, under the expectation that the Selic target would not be elevated.
In this scenario, on September 4, the National Treasury placed R$1.3 billion in 7-month LTN, at
the average yield of 22.86%.
On September 5, a five-year LFT auction was settled, totaling a financial volume of R$1.2 billion.
Demand outstripped the offer (2.2), due to the lower volumes offered and investment funds’ needs
to recompose their portfolios, which led to a halt in the upward movement of average discounts
over face values, reducing to 0.34% from 0.40%.
Stemming from the effects of the terrorist attack on September 11 in the market, the National
Treasury decided to cancel the LFT and LTN auctions scheduled for that day. The auction was
resumed on September 18, with the sale of R$1.2 billion five-year LFT, at an average discount
Inflation Report December 2001
136
slightly below the previous auction (0.33%) and with a demand again superior to the offer (1.6
ratio). Considering the financial settlements between August 22 and September 18, a R$142
million expansionary monetary impact was observed in the period. The additional placements of
NBCE offset the net redemption of National Treasury securities.
Within a 19 working day period, the Central Bank intervened for ten times in the open market,
aiming at administering the short-term interest rate. In all interventions, the Central Bank carried
out purchases of federal securities with resale agreements, at a minimum yield of 19.06% p.a..
The average volume of the interventions reached R$5.3 billion.
Prospective assessment of inflation
The identified shocks and their impacts were reassessed in light of newly available information.
The scenario considered in the simulations encompasses the following assumptions:
1. August inflation rate, measured by the IPCA, reached 0.70%, near the expected results for
the month;
2. the forecasts for the prices of oil products was calculated based on the price structure
implied by Brent crude oil futures contracts. The expectation for the average price of the barrel
was raised to US$ 26.2 on the third quarter and to US$ 28.1 on the fourth quarter of 2001. For
2002, it was assumed that the prices of oil by-products in the domestic market would be adjusted
based on the structure of costs determined by the average prices effective on the last quarter of
2001. From the second quarter on, these prices wouldfollow market inflation.
3. for a wider set of administered prices, weighting 30.4% of the IPCA in August, the expected
inflation in 2001 remained relatively stable at 11.0%, from 10.0% in August. Price variation from
January to August accumulates 7.9% with further 3.0% being expected for the remainder of the
year. The evolution of these prices is expected to directly contribute with 3.2% for the year inflation,
compared to the 2.9% estimated in August.
4. the forecast for the adjustment of electricity tariffs in 2001 remained at 20%. For 2002, the
expected readjustment is of 20%, considering residential and non-residential consumers;
5. the slope of the domestic yield curve - defined as the difference between the 180 day swap
rate and the one day Selic rate - is projected at an average of nearly 500 basis points on the third
quarter of 2001, linearly declining to an average of 300 basis points at the end of 2002;
Inflation Report December 2001
137
6. the path for the Fed funds interest rates was projected based on the maturity of forward
contracts that indicate a decrease in the rate until the end of the second quarter of 2002 and a
slight increase in the remainder of the year;
7. on the external front, the ssumption for the average risk premium – measured as the difference
between the yield of Brazil’s Global Bonds and the United States Treasury Bonds with equivalent
duration calculated by linear interpolation – was revised to incorporate a declining path from
current levels to a plateau near 700 basis points from the second quarter of 2002 on.
It was assumed a stable exchange rate, in 2001 and 2002, around the levels observed on the eve
of the Copom meeting.
The core inflation of the IPCA, calculated under the symmetric trimmed-mean method, declined in
August to 0.56%, from 0.65% in July. Accumulated in 12 months, the core index increased by
6.25%. The core inflation of the IPC-BR, calculated under the symmetric trimmed-mean method,
declined to 0.59% in August. Accumulated in 12 months, this core increased by 3.73%. The
inflation core calculated with the exclusion of administered prices – considering the wide set
weighting 30.4% of the IPCA in August - and of household food prices increased by 0.40% in
August, with accumulated variation of 4.04% in 12 months.
The median of market expectations for the IPCA variation, as surveyed by the Central Bank on a
daily basis, was revised to 6.5% from 6.3% for 2001 and remained stable at 4.5% for 2002.
In relation to the fiscal policy, it was assumed that the primary surplus targets for the consolidated
public sector would be met, as stated in the Economic Program of the Government.
The remaining assumptions established in the previous meeting were maintained.
Simulation exercises with several specifications of the structural model allowed for the conclusion
that the maintenance of the interest rate at the current level of 19.0% p.a. would result in inflation
above the upper limit of the target for 2001. For 2002, the projected inflation is slightly above the
3.5% central target for the year.
Monetary Policy Guidelines
Recently released indicators confirm the slowdown trend in demand as a result of the set of shocks
that affected the Brazilian economy. The drop in demand may be explained by the worsening in the
external scenario, by effects of the energy crisis on expectations and by the recent tightening in
monetary policy, yet enough for GDP to grow moderately this year. As addressed in the last
Inflation Report December 2001
138
Copom meeting, the balance between aggregate supply and demand has been exerting downward
pressure on inflation, since the slowdown in demand has outstripped the effect of the energy
rationing on the aggregate supply. After an expected increase in inflation in July and August ,
basically due to the hike in administered prices, the IPCA and other indices already show marginal
decrease, with reduced variation in market prices.
Notwithstanding the downward pressure on inflation stemming from the activity slowdown, the
exchange rate remains under pressure. In the international scenario, adverse expectations prevail.
The recovery of the U.S. economy had been postponed as indicated by recent released data.
With the recent attacks on September 11th, the probability that this recovery will be delayed for
the third quarter of next year is higher. In Europe, following the developments in the U.S. economy,
the reduction trend in the pace of economic activity will be accentuated. The Japanese economy
will not present signals of recovery in the short run.
It is still premature to predict the effects of U.S. crisis in the world economy and in Brazil.
Nonetheless, it is possible that the recent international scenario has two consequences in the short
run: i) doubts about the world economic situation, aggravated by the attacks to the U.S., may
weaken consumers’ confidence, increase the volatility in stock markets and oil prices, and reduce
capital flows; and ii) the level of global economic activity shall retract, global trade flows.
The improvement in the result of the trade balance, as a result of weaker aggregate domestic
demand and depreciation of the real, and the recovery of economic growth on the second half of
next year will intensify the ongoing narrowing of current account deficit and improve the quality of
its financing. In the meantime, the new agreement between the IMF and Brazil will provide support
for the financing of the Balance of Payments.
The IPCA core inflation registered the second consecutive monthly reduction. Nonetheless, August
outcome remains high (+0.56%). Inflation expectations, as surveyed daily by the Central Bank
with the participation of a number of institutions, exhibited small marginal increase for 2001 and
indicate a downward trend for inflation in 2002. In 2001, the IPCA accumulated a 5.06% variation
until August, led by the evolution of administered prices (7.86%), with a contribution of 2.30% for
the IPCA. The remaining prices, weighting 69.6% of IPCA, increased by 3.86% in the period,
with a contribution of 2.76%.
For 2002, the forecasts derived from Central Bank’s structural model, built upon the assumption
of a constant interest rate trajectory, indicate an inflation rate above 3.5%. The increase in the
projected inflation for the next year results exclusively from the path of exchange rate and energy
and oil products prices . In this sense, the shocks that affected the Brazilian economy this year will
Inflation Report December 2001
139
still have reflexes on next year inflation. The forecast for market price inflation, upon which monetary
policy has the major impact, remains significantly below 3.5%.
Copom recognizes that there are risks of a passthrough of the recent exchange rate devaluation on
domestic prices next year, as long as the exchange rate remains under pressure. However, Copom
understands that the monetary policy is currently adequate to maintain market prices under control
and to neutralize secondary effects of the supply shocks.
Accordingly, Copom unanimously decided to maintain the Selic rate target in 19% p.a. .
At the close of the meeting, it was announced that the Committee would meet again on October
16, 2001, at 3:00 PM, for technical presentations and, on the following day, at 4:30 PM, in order
to discuss monetary policy guidelines, as set in the Calendar of Copom’s Ordinary Meetings,
published in the Central Bank Communiqué n. 8,018, of 11.22.2000.
Minutes of the 64th Meeting of the Banco Central do BrasilMonetary Policy Committee (Copom)
Date: October 16 and 17, 2001
Place: Central Bank’s Headquaters 8th floor meeting room (on 10.16) and 20th floor (on 10.17)
-Brasília - DF
Called to Order: 4:08 PM on 10.16 and 4:35 PM on 10.17
Adjourned: 8:32 PM on 10.16 and 6:58 PM on 10.17
In attendance:Members of the BoardArminio Fraga Neto - PresidentCarlos Eduardo de Freitas
Daniel Luiz Gleizer
Edison Bernardes dos Santos
Ilan Goldfajn
Luiz Fernando Figueiredo
Sérgio Darcy da Silva Alves
Department Heads (all present on 10.16)Altamir Lopes - Economics Department (DEPEC)
Inflation Report December 2001
140
Daso Maranhão Coimbra - International Reserve Operations Department (DEPIN)
Gustavo Bussinger - Research Department (DEPEP)
Luis Gustavo da Matta Machado - Department of Banking Operations and Payments System (DEBAN)
Sérgio Goldenstein - Open Market Operations Department (DEMAB)
Other participants (all present on 10.16)Antônio Carlos Monteiro - Executive Secretary
João Borges - Press Secretary (ASIMP)
Fabia Aparecida de Carvalho - Coordinator of the Investor Relations Group
The Board analyzed the recent performance and prospects for the Brazilian and international
economies under the monetary policy framework, designed to comply with the inflation targets
determined by the government.
Economic activity
Economic activity has leveled off at a lower pace in August and September, after having slowed
since April. Indicators of consumption recovered slightly in August and September, after falling
steeply in the previous quarter. Consumers, however, have remained cautious in the face of tighter
credit conditions, decline in real earnings and worsening of external environment. Industrial
production is slowing gradually, still sustained by placement of orders, particularly those related to
deal with the energy crisis.
The Index of Consumer Intentions (IIC), surveyed by the São Paulo State’s Federation of
Commerce (FCESP), continued to fall in October, particularly affected by the turbulent environment
prevailing after the events of September 11th in the United States. The surveyed sample also
evidenced increasing concern on unemployment. The fall in the index by 9% affected its two
components – current and future intentions – halting the rebound observed since June when the
index reached its minimum by the time the energy rationing began.
Retailers turnover expanded by 0.8% in September from August, according to FCESP. This result
reflected mainly the sales of non-durable consumer goods. Nonetheless, retailers turnover dropped
by 4% year to date, reflecting particularly a reduction of 19.4% in car sales.
A more dynamic sales of non-durable goods is shown by an increase of 2.7% in September in the
enquiries to the Telecheque, a leading indicator for cash and predated check payment sales, surveyed
by the São Paulo Association of Commerce (ACSP), while enquiries to the Credit Protection
Service (SPC), a leading indicator for credit sales, declined by 2.8%. Default rate in commerce,
as measured by ACSP, remained stable at 6% in September, with both the number of new registries
Inflation Report December 2001
141
and cancellations falling. In the financial sector, the ratio of checks returned due to insufficient
funds remained stable at 5% as compared to the previous months, though 30% higher than the
level observed in 2000.
Investment spending has evolved favorably throughout the year. According to the Brazilian Institute
of Geography and Statistics (IBGE), the share of investments in the GDP in the first half of 2001
reached 24.7% compared to 23% in the same period of 2000. Monthly indicators of gross capital
formation continue to perform positively in recent months, partly reflecting the effects of investment
decisions to face the energy crisis. Output of capital goods grew by 17% in the year-to-August, with
an expansion of 6.1% in August (seasonally adjusted). Equipment for electricity generation showed
expansion of 46.5% and 15.5%, respectively. It should be underscored the performance of production
of agricultural machinery, with expansion of 26.1% in the year and 16.6% in September. Imports of
capital goods showed a similar trend, growing by 24% in the year and 5.8% in August (seasonally
adjusted). Construction industry, the main component of gross capital formation, however, performed
differently, contracting by 1% in August and showing stability in the year (0.4%).
After 5 months of decline, industrial production stabilized in August (+0.2%, seasonally adjusted),
mainly driven by growth in the production of capital goods, and at a lesser extent by production of
semi-durable and non-durable consumer goods. It should be noted that industrial production
showed stability in August compared to August 2000, evidencing that this sector overcame the
restrictions in energy supply through the rationalization of consumption, substitution of energy
sources, and trading of excess energy among industrial sectors.
Despite these favorable results, some industrial sectors are being affected more intensely by the
difficulties of the current economic conditions, as is the case of the production of durable goods,
which declined by 7.1% in August compared to July, and 14.5% compared to August 2000. Year-
to-date, it grew by 5.2%, but at a sharp slowing pace. Among the durable goods, it should be
noted especially the performance of car industry. Even after the reduction in the production,
inventory is still increasing, as a result of plummeting car sales in recent months. In September, the
production of cars fell by 5% (seasonally adjusted), sales to car dealers dropped by 6.2%, and
the inventory of vehicles in the stores was approximately 100,000 units (or around 28 days of
sales). Inventory in the factories is also high, which may lead to a cut down in production, as
attested by recent decisions of collective holidays determined by several carmakers.
In August, despite positive evolution of industrial production, capacity utilization declined as
compared to July. In the seasonally adjusted series, capacity utilization in the industrial sector in
São Paulo fell by 0.32% and 0.4%, according to CNI and FIESP, respectively. Industrial
employment and real wage also fell in August.
Inflation Report December 2001
142
Open unemployment, as computed by IBGE in six metropolitans regions, was 6.18% in August,
after recording 6.19% in the previous month. The number of employed increased by 0.44% (or
75,000 jobs), though not sufficient to absorb growth of 0.42% in the employable population
(PEA), resulting in an increase of 0.16% in the number of unemployed. This information, and the
fact that the upward trend in formal employment remained rising by 0.1% in August (seasonally
adjusted), indicated that the impact of the energy crisis on the labor market was less intense than
previously projected.
In September, in terms of daily average, new lending provided by the domestic financial system
from its free resources presented an expansion in general compared to August. Even though this
expansion could indicate the addition of new borrowers, it resulted in part from the concentration
of demand in fewer working days (19 in September compared to 23 in August), as the accumulated
flows in September reduced for almost all credit lines.
Daily average of new credit to households in September expanded by 9.6% and accumulated
flows fell by 6.2%, while in terms of volume increased by 2%. The primary contraction in the
month is consistent with slowing economic activity, the level of interest rates, and uncertainties in
the external environment.
As to the external sector of the Brazilian economy, the trade balance recorded a surplus of US$
594 million in September, and a surplus of US$ 29 million for the first two weeks in October,
accumulating a surplus of US$ 1.3 billion in the year. This recent improvement in the overall trade
balance is associated with the slowing in domestic economic activity and the exchange rate
depreciation, leading to import reduction and maintenance of the export growth, even though at a
moderate pace. The expansion in commodity sales remains notable, mainly meat and soy, as a
consequence of an enlarged market opportunity resulting from livestock diseases in Europe. On
the other hand, the sales of manufactured goods are decelerating, as a result of weaker demand in
the major export markets (the United States and Argentina).
In concluding, economic activity remains at a low level, due to the slowing process started by the
end of the first quarter of the year. Recent outcome which might indicate a possible reversal of this
trend, as shown particularly by the consumption indices, is still incipient, and has not yet incorporated
fully the effects of the international crisis. Therefore, one cannot draw any conclusion as to the
start of a new trend. In addition, in shaping the expectations for coming months, the decision of
carmakers to reduce their output should be incorporated, as well as the impact of such a decision
on the other sectors of industry.
A slowing demand due to the lower credit expansion, and to the drop in consumers confidence,
have more than offset the effect of the energy crisis on the aggregate supply, generating an output
Inflation Report December 2001
143
gap which contains inflationary pressures and improves the trade balance mainly by means of
reduction in imports in view of difficulties in the international environment to expand exports.
External environment
Data released last month showed that the U.S. economy has been in a slowing trend since the
second half of 2000, even before the attacks of September 11th. In this regard, capital spending
remained declining, with a reduction in the output of capital goods and stability in orders to factories.
Data on the evolution of consumption suggest that the consumption was slowing, with retail sales
declining by 2.1% in September compared to the previous month (seasonally adjusted), and a
reduction of accumulated growth in 12 months to 1.8% from 3% up to August. In this context,
consumer credit, which increased by US$ 2.3 billion in September, remains in a downward trend
in terms of 12 month growth rate.
The events of September 11th in the United States and the following actions have contributed
considerably to the increase of uncertainties in the economic environment. In this context, and
taking into account the absence of inflationary pressures, monetary and fiscal policies were loosened.
After 50 points cut in the fed funds rate in an unscheduled meeting on September 17th, the Federal
Reserve cut interest rates further by another 50 basis points in the regular meeting of October 2nd,
after which the basic interest rate stood at 2.5%. Simultaneously, the government decided to grant
a financial support of US$ 15 billion to airlines, to be disbursed in 2001 through 2002, and was
also authorized by Congress to spend US$ 40 billion for assistance and recovery, which should be
used during this year and the next. This financial support, added to the tax refund proposal, may
represent a considerable fiscal incentive.
Expectations that government measures to support recovery in the economic activity will be effective
in the medium run are not yet explicit in the business outlook, as measured by the indices of the
National Association of Purchase Managers. Overall index for the manufacturing sector remained
below 50 in September, for the 14th consecutive month. The index relative to the services sector
reached 50.2 in September, which was still regarded as insufficient to indicate a consistent reversal
of trend. Consumers’ expectations as surveyed by the Conference Board have deteriorated, falling
to 97.6 in September from 114 in August. Consumers’ sentiment, as evaluated by the University of
Michigan, suggested an improvement as the preliminary figure for the index rose to 83.4 in October
from 81.8 in September.
It should be pointed out that the military reaction to the attacks and fears for further offensive
actions in the U.S. territory have increased the uncertainties regarding the recovery in economic
activity, contributing to an even weaker performance than it would be expected for the short run in
this stage of economic cycle.
Inflation Report December 2001
144
In the euro area, indicators showed that the slowing economic activity has persisted in the period.
Retail sales recorded an expansion of 1.3% in July, compared to 1.5% in the previous month.
Industrial production, after expanding by 1.8% in June relative to the same month last year,
contracted by 1.1% in July, unemployment remained stable at a rate of 8.3% in July and August.
Regarding inflation, the harmonized consumer price index has indicated a downward trend since
May, when it reached 3.4% (2.7% in August, still above the reference rate of 2%). Considering
the producers price index, the downward trend is even more apparent, reducing to 1.7% in August
from 4.8% in January. The recent increase in the annualized quarterly moving average of the M3-
- a leading indicator of inflation and first pillar of the monetary policy conducted by the European
Central Bank— is being interpreted as a transitory phenomenon and resulting from statistical
problems in the measurement of the indicator, thus not regarded as a deterioration in inflation
prospects. Entrepreneurs’ expectations about the economic outlook of the major countries in the
region remain low. In this scenario, the European Central Bank cut the basis rate by 25 points on
August 30th and, in September, decided on another reduction of 50 points, to 3.75%, jointly with
the Federal Reserve.
The evolution of the Japanese economy has not been favored by the international scenario, leading
the Bank of Japan to intervene in the foreign exchange market in an attempt to hold the Japanese
currency against the dollar, as well as to increase the liquidity in the domestic market to stimulate
the economy.
In Argentina, uncertainties regarding the ability of its economy to recover remain, together with the
maintenance of a downward trend in demand and supply. In this context, the trade balance registered
a surplus of US$ 692 million in August, accumulating a surplus of US$ 3 billion in the year. This
performance reflects mainly a contraction of 7.8% in imports, while exports increased by 4%.
The widening of spread of Argentine securities has affected other emerging market papers, as
perceived by international investors.
In summary, the process of slowing in the U.S. economy, which had already affected other industrial
countries, with negative impact on the emerging economies, mostly for those within its area of
influence, tends to be exacerbated by the consequences of the September attacks, delaying
therefore the start of economic recovery.
Prices
In September, inflation measured by the main price indices abated, reflecting the reduction in
agricultural prices and, especially, the easing of pressures derived from adjustment of administered
prices which weighed considerably on these indices in the two previous months.
Inflation Report December 2001
145
The IPCA rose by 0.28% in September, compared to 0.70% in August, accumulating 6.46% in
12 months. This result was due to a smaller increment in the administered prices and to a fall in
agricultural prices, particularly fresh products. Food prices decelerated to 0.39% in September
from 0.83% in August. Still, higher cost pressures on food prices persisted, coming from off-
season effects and/or climate problems, and effects from the exchange rate depreciation. Prices of
non-food products eased to 0.25% in September, compared to 0.66% in August in view of the
ending of the period where controlled price adjustments are concentrated. Nevertheless, this sector
contributed to 0.19 percentage point in the IPCA variation, affected by the rise in urban bus fares
in Recife and Salvador, intermunicipal bus fares in five of the eleven capitals surveyed for the price
collection, water and sewage in Rio de Janeiro and electricity prices in Belém, Brasilia and Goiânia.
The IGP-DI recorded a deceleration to 0.38% in September, from 0.9% in August, accumulating
7.81% in 2001 and 9.44% in the 12 month period. Compared to the previous month, the deceleration
was observed in all components, led by the IPA, which declined to 0.48%, from 1.13%. This
result was associated with the negative variation in the agricultural IPA in September (minus 0.21%)
from 1.33% in August driven by the reductions in the prices of milk and eggs, affecting also their
retail prices as food prices in the CPI decreased by 0.37%. Upward pressures from exchange
rate, however, persisted on the prices of soy and its by-product, in addition to supply problems
due to off-season effects in some products such as rice, beans and cattle. The monthly variation of
the Industrial IPA slowed to 0.75% in September, from 1.05% in August, with the main determining
factors being the price behavior of processed food products and chemicals. The INCC rose by
0.55% simply as a result, for the third consecutive month, of increases in civil construction prices
and services (1.07% from 1.22% in August), while labor costs remained stable.
A larger increase in all indices is expected for October, basically as a consequence of the fuel
price adjustment on October 5th. It should be pointed out also the pressures on agricultural products,
especially regarding those still affected by off-season factors. Nonetheless, these pressures are
localized, and there are no expectations of a generalized price increase, taking into account the
weak demand and the absence of indexation mechanisms in the economy.
Money market and open market operations
The volatility in the interest rate yield curve increased since the last Copom meeting, due to the
effects of the attacks in the USA and increased uncertainties in Argentina. The slope of the interest
rate yield curve, as measured by the spread between the Over Selic rate and the 90 day Futures
DI rate widened by 255 basis points to 370, between September 19th to October 9th. Nonetheless,
after the parliamentary elections in Argentina, the slope reverted partially and the spread narrowed
to 300 basis points on October 15th.
Inflation Report December 2001
146
Between September 11th and October 11th, 21 unscheduled offers of exchange rate indexed
securities were carried out by the central bank, amounting to R$23.4 billion in financial volumes.
Since end-September, the unscheduled placements have been carried out with NTN-D. On
October 3rd and 4th, the National Treasury attempted to lengthen the tenure of the outstanding
securities by offering maturities to 2003 and 2004. Low demand and increased bid yields, however,
were observed, leading to further placements of NTN-D with maturity in 2002.
In addition, four auctions of federal securities were carried out between September 19th and
October 16th to roll over maturing exchange rate indexed securities. As a means to roll over the
R$1.2 billion maturing on September 25th, two auctions were carried out. In the first, R$0.2
billion was placed through 3-year NTN-D. In spite of the shortened maturity, demand was below
supply. The rollover of the R$4.1 billion in NBC-E on October 18th was made through two
placements of NTN-D. The first offer, of 5-year securities, was placed only partially, due to the
high bid yields. The second, with a shorter maturity, was fully sold. The longer maturity issues
represented only 7% of the total maturing value.
On October 2nd, the National Treasury proceeded with the offers of LTN, which had been interrupted
as a result of the effects of the attacks in the US on the market. Until October 16th, three auctions of
6-month papers were carried out, totaling R$3.1 billion. Average yields have been reduced from
24.28%, to 24.19%, and then to 23.71%. Demand/offer ratios were higher (2.5, 3.4, and 2.0), as
the future DI yield curve presented a significant premium over the Selic rate.
On September 25th, an auction of five-year LFT was carried out, totaling a financial volume of
R$0.6 billion, at an average discount of 0.33%. In October, in spite of the shortening of maturity
of the securities to 2 years from 5 years, demand was below the supply in both events in the
month. In the auction of October 2nd, R$1.3 billion were placed at an average discount of 0.16%.
In the following week, R$0.5 billion was placed at an average discount of 0.24%.
Considering the financial settlements between September 19th and October 16th, a contractionary
monetary impact of R$5.1 billion was observed in the period. The net placement of R$14.8 billion
in exchange rate indexed securities offset the net redemptions of LTN and LFT.
Within 19 working day period, the central bank intervened for sixteen times in the open market,
aiming at administering the short-term interest rate. In all interventions, the central bank carried
out purchases of federal securities with resale agreements, at minimum yields ranging from 19.05%
p.a. to 19.10% p.a.. The average volume of the interventions reached R$14.2 billion. In addition,
the central bank carried out two go-arounds to purchase LFT to reduce the liquidity shortage in
the system. In the first operation, on October 2nd, no bids were accepted. In the second, however,
on October 5th, R$4.3 billion were purchased at the average discount of 0.06%.
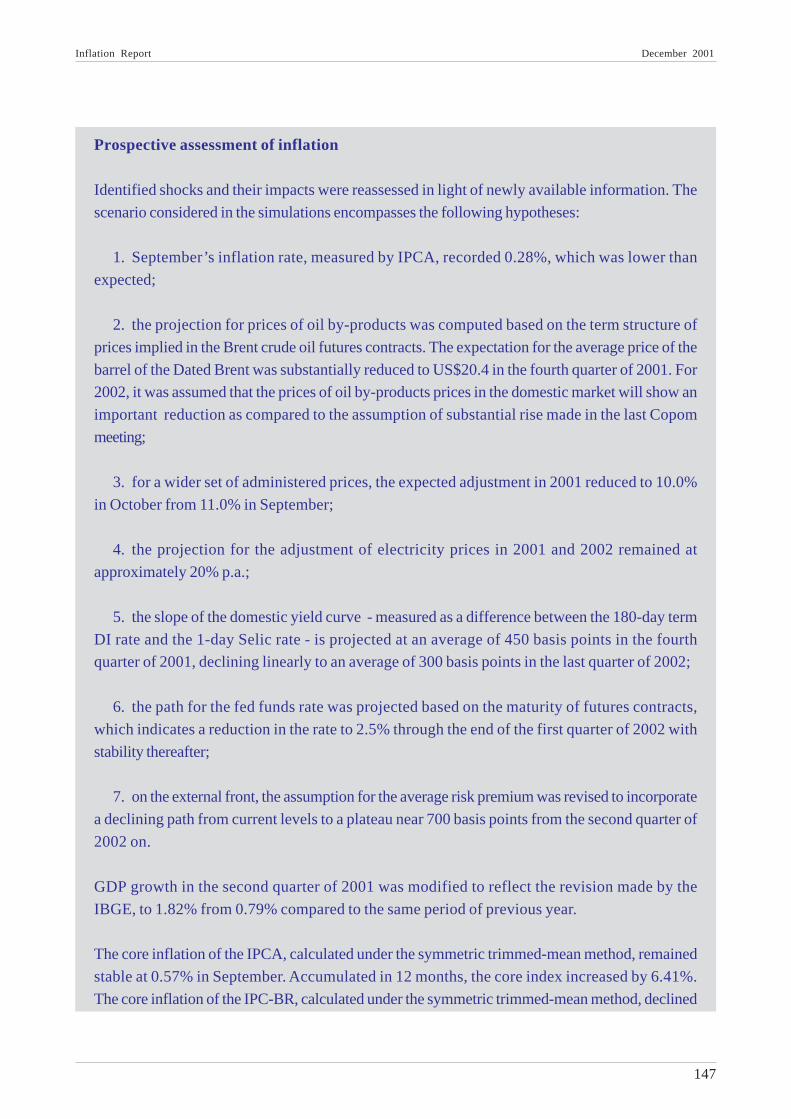
Inflation Report December 2001
147
Prospective assessment of inflation
Identified shocks and their impacts were reassessed in light of newly available information. The
scenario considered in the simulations encompasses the following hypotheses:
1. September’s inflation rate, measured by IPCA, recorded 0.28%, which was lower than
expected;
2. the projection for prices of oil by-products was computed based on the term structure of
prices implied in the Brent crude oil futures contracts. The expectation for the average price of the
barrel of the Dated Brent was substantially reduced to US$20.4 in the fourth quarter of 2001. For
2002, it was assumed that the prices of oil by-products prices in the domestic market will show an
important reduction as compared to the assumption of substantial rise made in the last Copom
meeting;
3. for a wider set of administered prices, the expected adjustment in 2001 reduced to 10.0%
in October from 11.0% in September;
4. the projection for the adjustment of electricity prices in 2001 and 2002 remained at
approximately 20% p.a.;
5. the slope of the domestic yield curve - measured as a difference between the 180-day term
DI rate and the 1-day Selic rate - is projected at an average of 450 basis points in the fourth
quarter of 2001, declining linearly to an average of 300 basis points in the last quarter of 2002;
6. the path for the fed funds rate was projected based on the maturity of futures contracts,
which indicates a reduction in the rate to 2.5% through the end of the first quarter of 2002 with
stability thereafter;
7. on the external front, the assumption for the average risk premium was revised to incorporate
a declining path from current levels to a plateau near 700 basis points from the second quarter of
2002 on.
GDP growth in the second quarter of 2001 was modified to reflect the revision made by the
IBGE, to 1.82% from 0.79% compared to the same period of previous year.
The core inflation of the IPCA, calculated under the symmetric trimmed-mean method, remained
stable at 0.57% in September. Accumulated in 12 months, the core index increased by 6.41%.
The core inflation of the IPC-BR, calculated under the symmetric trimmed-mean method, declined
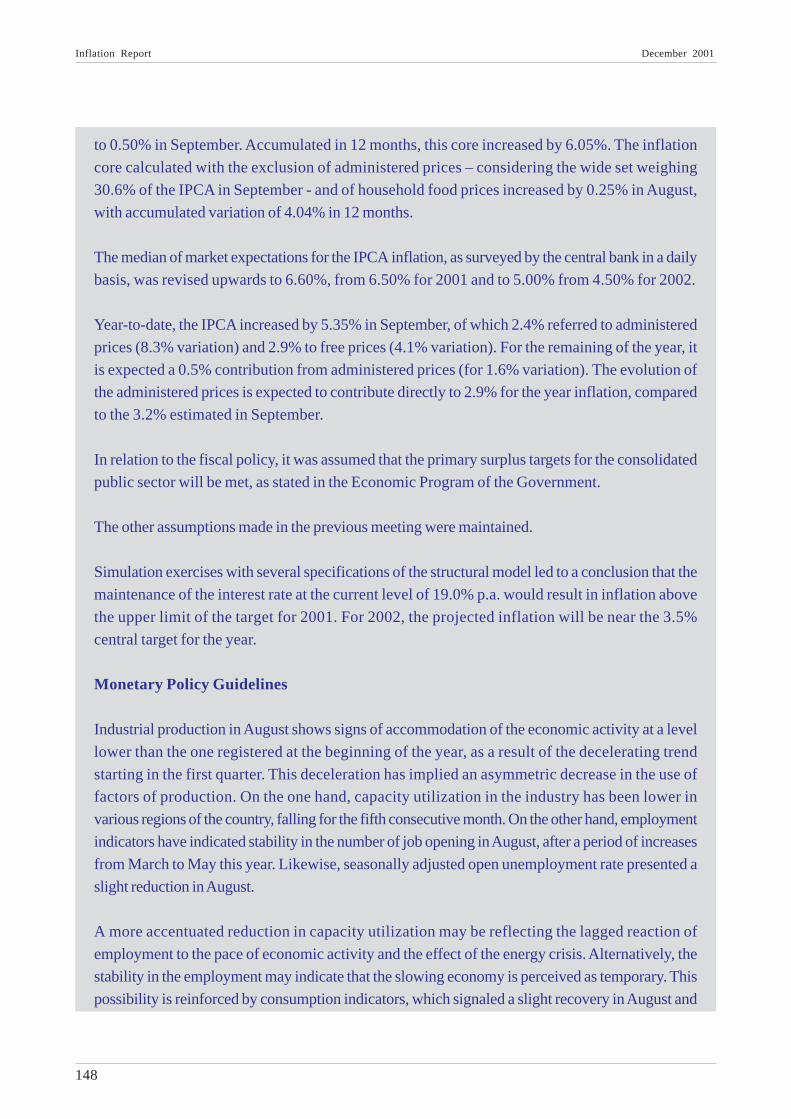
Inflation Report December 2001
148
to 0.50% in September. Accumulated in 12 months, this core increased by 6.05%. The inflation
core calculated with the exclusion of administered prices – considering the wide set weighing
30.6% of the IPCA in September - and of household food prices increased by 0.25% in August,
with accumulated variation of 4.04% in 12 months.
The median of market expectations for the IPCA inflation, as surveyed by the central bank in a daily
basis, was revised upwards to 6.60%, from 6.50% for 2001 and to 5.00% from 4.50% for 2002.
Year-to-date, the IPCA increased by 5.35% in September, of which 2.4% referred to administered
prices (8.3% variation) and 2.9% to free prices (4.1% variation). For the remaining of the year, it
is expected a 0.5% contribution from administered prices (for 1.6% variation). The evolution of
the administered prices is expected to contribute directly to 2.9% for the year inflation, compared
to the 3.2% estimated in September.
In relation to the fiscal policy, it was assumed that the primary surplus targets for the consolidated
public sector will be met, as stated in the Economic Program of the Government.
The other assumptions made in the previous meeting were maintained.
Simulation exercises with several specifications of the structural model led to a conclusion that the
maintenance of the interest rate at the current level of 19.0% p.a. would result in inflation above
the upper limit of the target for 2001. For 2002, the projected inflation will be near the 3.5%
central target for the year.
Monetary Policy Guidelines
Industrial production in August shows signs of accommodation of the economic activity at a level
lower than the one registered at the beginning of the year, as a result of the decelerating trend
starting in the first quarter. This deceleration has implied an asymmetric decrease in the use of
factors of production. On the one hand, capacity utilization in the industry has been lower in
various regions of the country, falling for the fifth consecutive month. On the other hand, employment
indicators have indicated stability in the number of job opening in August, after a period of increases
from March to May this year. Likewise, seasonally adjusted open unemployment rate presented a
slight reduction in August.
A more accentuated reduction in capacity utilization may be reflecting the lagged reaction of
employment to the pace of economic activity and the effect of the energy crisis. Alternatively, the
stability in the employment may indicate that the slowing economy is perceived as temporary. This
possibility is reinforced by consumption indicators, which signaled a slight recovery in August and
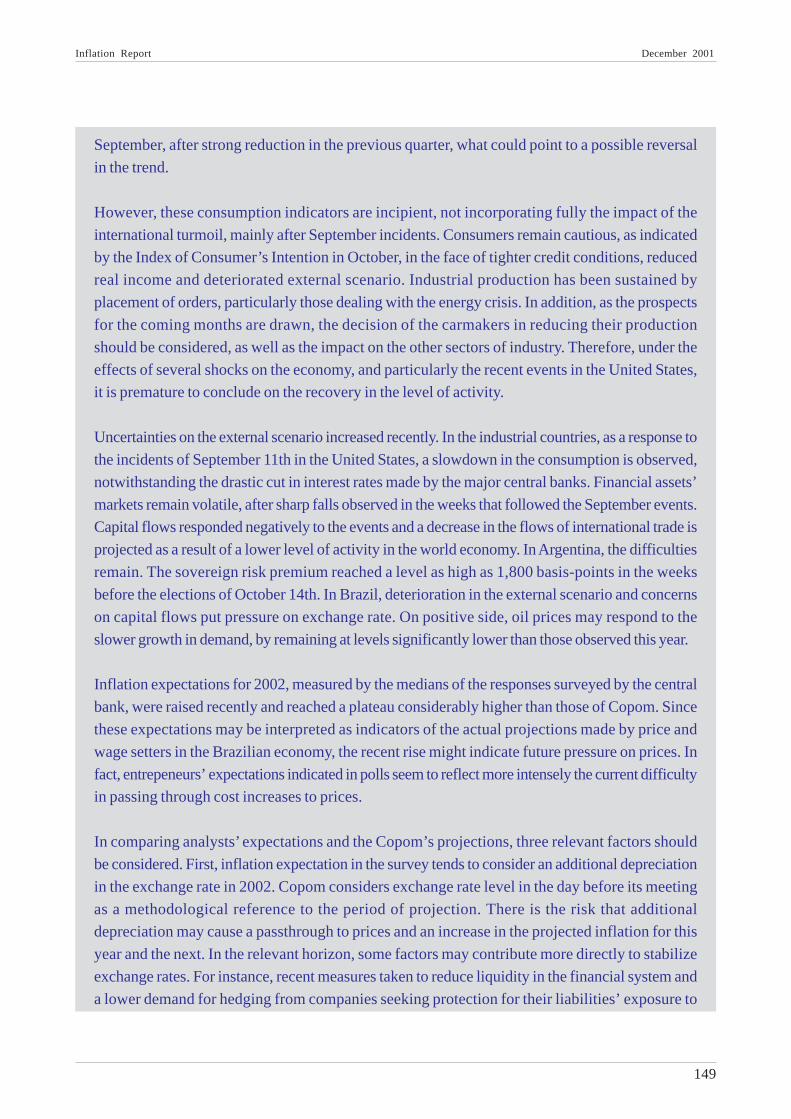
Inflation Report December 2001
149
September, after strong reduction in the previous quarter, what could point to a possible reversal
in the trend.
However, these consumption indicators are incipient, not incorporating fully the impact of the
international turmoil, mainly after September incidents. Consumers remain cautious, as indicated
by the Index of Consumer’s Intention in October, in the face of tighter credit conditions, reduced
real income and deteriorated external scenario. Industrial production has been sustained by
placement of orders, particularly those dealing with the energy crisis. In addition, as the prospects
for the coming months are drawn, the decision of the carmakers in reducing their production
should be considered, as well as the impact on the other sectors of industry. Therefore, under the
effects of several shocks on the economy, and particularly the recent events in the United States,
it is premature to conclude on the recovery in the level of activity.
Uncertainties on the external scenario increased recently. In the industrial countries, as a response to
the incidents of September 11th in the United States, a slowdown in the consumption is observed,
notwithstanding the drastic cut in interest rates made by the major central banks. Financial assets’
markets remain volatile, after sharp falls observed in the weeks that followed the September events.
Capital flows responded negatively to the events and a decrease in the flows of international trade is
projected as a result of a lower level of activity in the world economy. In Argentina, the difficulties
remain. The sovereign risk premium reached a level as high as 1,800 basis-points in the weeks
before the elections of October 14th. In Brazil, deterioration in the external scenario and concerns
on capital flows put pressure on exchange rate. On positive side, oil prices may respond to the
slower growth in demand, by remaining at levels significantly lower than those observed this year.
Inflation expectations for 2002, measured by the medians of the responses surveyed by the central
bank, were raised recently and reached a plateau considerably higher than those of Copom. Since
these expectations may be interpreted as indicators of the actual projections made by price and
wage setters in the Brazilian economy, the recent rise might indicate future pressure on prices. In
fact, entrepeneurs’ expectations indicated in polls seem to reflect more intensely the current difficulty
in passing through cost increases to prices.
In comparing analysts’ expectations and the Copom’s projections, three relevant factors should
be considered. First, inflation expectation in the survey tends to consider an additional depreciation
in the exchange rate in 2002. Copom considers exchange rate level in the day before its meeting
as a methodological reference to the period of projection. There is the risk that additional
depreciation may cause a passthrough to prices and an increase in the projected inflation for this
year and the next. In the relevant horizon, some factors may contribute more directly to stabilize
exchange rates. For instance, recent measures taken to reduce liquidity in the financial system and
a lower demand for hedging from companies seeking protection for their liabilities’ exposure to
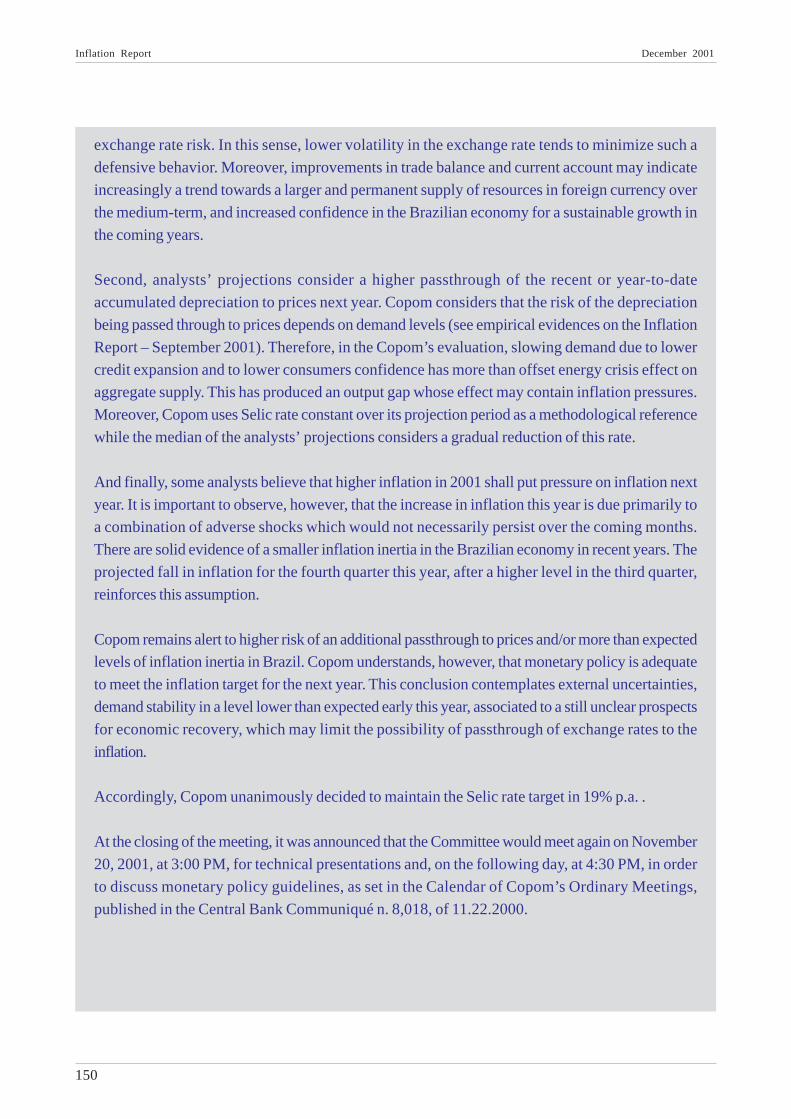
Inflation Report December 2001
150
exchange rate risk. In this sense, lower volatility in the exchange rate tends to minimize such a
defensive behavior. Moreover, improvements in trade balance and current account may indicate
increasingly a trend towards a larger and permanent supply of resources in foreign currency over
the medium-term, and increased confidence in the Brazilian economy for a sustainable growth in
the coming years.
Second, analysts’ projections consider a higher passthrough of the recent or year-to-date
accumulated depreciation to prices next year. Copom considers that the risk of the depreciation
being passed through to prices depends on demand levels (see empirical evidences on the Inflation
Report – September 2001). Therefore, in the Copom’s evaluation, slowing demand due to lower
credit expansion and to lower consumers confidence has more than offset energy crisis effect on
aggregate supply. This has produced an output gap whose effect may contain inflation pressures.
Moreover, Copom uses Selic rate constant over its projection period as a methodological reference
while the median of the analysts’ projections considers a gradual reduction of this rate.
And finally, some analysts believe that higher inflation in 2001 shall put pressure on inflation next
year. It is important to observe, however, that the increase in inflation this year is due primarily to
a combination of adverse shocks which would not necessarily persist over the coming months.
There are solid evidence of a smaller inflation inertia in the Brazilian economy in recent years. The
projected fall in inflation for the fourth quarter this year, after a higher level in the third quarter,
reinforces this assumption.
Copom remains alert to higher risk of an additional passthrough to prices and/or more than expected
levels of inflation inertia in Brazil. Copom understands, however, that monetary policy is adequate
to meet the inflation target for the next year. This conclusion contemplates external uncertainties,
demand stability in a level lower than expected early this year, associated to a still unclear prospects
for economic recovery, which may limit the possibility of passthrough of exchange rates to the
inflation.
Accordingly, Copom unanimously decided to maintain the Selic rate target in 19% p.a. .
At the closing of the meeting, it was announced that the Committee would meet again on November
20, 2001, at 3:00 PM, for technical presentations and, on the following day, at 4:30 PM, in order
to discuss monetary policy guidelines, as set in the Calendar of Copom’s Ordinary Meetings,
published in the Central Bank Communiqué n. 8,018, of 11.22.2000.
Inflation Report December 2001
151
Minutes of the 65th Meeting of the Banco Central do BrasilMonetary Policy Committee (Copom)
Date: November 20th and 21st , 2001
Place: Central Bank’s Headquarters 8th floor meeting room (on 11.20th) and 20th floor (on 11.21st ) -
Brasília - DF
Called to Order: 4:00 PM on 11.20th and 4:26 PM on 11.21st
Adjourned: 7:51 PM on 11.20th and 7:10 PM on 11.21st
In attendance:Members of the BoardArminio Fraga Neto - PresidentCarlos Eduardo de Freitas
Daniel Luiz Gleizer
Edison Bernardes dos Santos
Ilan Goldfajn
Luiz Fernando Figueiredo
Sérgio Darcy da Silva Alves
Department Heads (all present on Nov.20th)Altamir Lopes – Economic Department (DEPEC)
Daso Maranhão Coimbra - International Reserve Operations Department (DEPIN)
Gustavo Bussinger - Research Department (DEPEP)
José Antônio Marciano - Department of Banking Operations and Payment System (DEBAN)
Sérgio Goldenstein - Open Market Operations Department (DEMAB)
Other participants (all present on Nov.20th)José Pedro Ramos Fachada Martins da Silva – Advisor to the Board
João Borges - Press Secretary (ASIMP)
Fabia Aparecida de Carvalho - Coordinator of the Investor Relations Group
The Board analyzed the recent performance and prospects for the Brazilian and international
economies under the monetary policy framework, designed to comply with the inflation targets
established by the government.
Economic activity
The most recent released data indicate that the economic activity has stabilized between the third
and fourth quarters of the year, interrupting the declining trend in place since April. The economic
Inflation Report December 2001
152
stability reveals that the adjustment of demand to the several shocks that occurred this year may
be over, as indicated by the behavior of retail sales and consumer intentions.
Short term expectations of consumers improved. The Consumer Intentions Index (IIC), surveyed
by the Federation of Commerce of the State of São Paulo(FCESP), increased by 0.2% in
November compared to the previous month. The component that measures current consumption
intentions rose by 7%, revealing that customers have overcome the negative emotional impacts
caused by recent international events. Nonetheless, the survey also revealed that consumers remain
cautious in regard to the future economic environment, fearing an increase in unemployment and
inflation, important reasons explaining the 3.4% fall in future consumption intentions.
Retail sales in October increased for the third consecutive month. Retailers turnover in the
Metropolitan Region of São Paulo, measured by FCESP and seasonally adjusted by Central
Bank’s Economics Department (Depec), increased by 1.2%, as a result of the recovery of car
and light vehicle sales through dealers chains to final consumers, basically due to special financing
. As the other segments surveyed presented lower sales in comparison to September, the overall
retailers’ turnover was lower than in the same period last year.
The National Confederation of Industries (CNI) registered a 3.79% expansion of real industrial
sales in September (seasonally adjusted series), which led to a 14.5% growth year to date. Seasonally
adjusted industrial sales moved back by 0.3% in September, reflecting the negative performance
of twelve out of the twenty industrial sectors, and three out of four categories of use, the exception
being the production of semi-durable and non-durable consumer goods, which registered a 0.2%
increase due to the performance of food producers, mainly the ones directed to external markets.
In the year, industrial production accumulates a 3.1% expansion.
The utilization rate of industrial capacity reached 79.15% in September showing a reduction for the
seventh consecutive month in September (0.57%), as informed by CNI (data seasonally adjusted by
Depec). Nonetheless, year to date results are still 0.29% above the levels of the same period last year.
The open unemployment rate, calculated by the Brazilian Institute of Geography and Statistics
(IBGE) for six Metropolitan Regions, was of 6.15% in September, compared to 6.18% in August.
The average rate for the first three quarters of the year reached 6.24%, contrasting with the
7.54% in the same period of 2000. It should be noted the 0.2% expansion in the seasonally
adjusted series of formal employment, leading to a 3% increase year to date, corresponding to
772.7 thousand new labor positions up to September.
Investment indicators still show a favorable performance, despite the 4.9% and 11.3% decline
observed in September in the production and imports of capital goods, respectively. Domestic

Inflation Report December 2001
153
production of such goods, specifically intended to face the energy crisis, grew by 46.4% ytd,
compared to a 15.2% expansion of the overall production of capital goods. It is also worth
emphasizing the 18.2% increase in the production of agricultural machinery, partly due to exports.
Production of inputs for the civil construction industry also declined in September (2.3% in the
seasonally adjusted series), leading to a 0.4% fall ytd. Based on the performance of investment
indices, gross capital formation reached 21.5% of the GDP in September, as estimated by Depec.
Exports of the soybean and by products grew by 25.7% from January to October, in comparison
to the same period of 2000. It should be highlighted that this result was due to the increase of the
shipped quantum, since average prices fell on the same comparison basis. Besides the performance
of soybean and by products, exports of meat were also strong thanks to the qualification of
Brazilian products that conquered new markets that had been left unserviced due to the diseases
in European cattle herds. The 23.7% and 2.4% increase in the sales of basic products and
manufactured goods, respectively, created the 7.3% daily average increase in overall exports in
the aforementioned period.
Considering just ten working-days up to the third week of November, the trade balance totaled
US$ 213 million, increasing the year to date accumulated surplus to US$1.7 billion. This
improvement in the trade surplus is a result of reduced imports, as a consequence of both the
depreciation of the Real and the deceleration of domestic activity. Furthermore exports of
manufactured goods are expanding at a slower pace, given the constraints in foreign markets.
The outstanding balance of the financial system credit operations increased by 0.8% in October,
reaching R$ 335.4 billion, of which R$199.1 billion refer to operations with freely allocated
resources, which increased by 0.6%. Such growth was caused by the 0.2% reduction in operations
with corporations, where the outstanding balance of Anticipated Exchange Contracts (ACC)
plummeted, while credit to households increased by 2.2%.
As for new loans, a 14.4% increase was registered in operations with corporations in October.
The outcome reflected more working-days in October in relation to September, and also seasonal
patterns of the period, particularly operations with working capital (capital de giro) and authorized
overdraft (conta garantida). In relation to household credits, their overall balance increased by
14.1%, to a great extent due to the performance of credit card operations.
The collection of taxes and contributions administered by the Federal Revenue Secretariat totaled
R$17.1 billion in October, an increase of 17.3% in the month and 14.7% ytd compared to the
same period last year. These increases were mainly due to the growth of the collection of Income
Tax Withholdings (IRRF), especially on capital gains, to the Provisional Contribution on Financial
Transactions (CPMF), to the Income Tax (IR) and to the Social Contribution on Net Income
Inflation Report December 2001
154
(CSLL) of financial entities, influenced by their enlarged profits. It should be mentioned that taxes
that are more directly related to the level of economic activity performed below the overall average
collection, reflecting the deceleration of economic activity.
In summary, there are indicators showing that economic activity has already absorbed the impacts
caused by the deterioration of the external environment and the energy crisis, what points to a
gradual recovery in growth. This interpretation is also supported by the favorable performance of
formal employment, enhanced by positive expectations related to year-end sales, previously
postponed by the uncertainties affecting decisions of consumers and producers.
External environment
Economic indicators in industrialized countries show that the deceleration of the economic activity,
in place since the beginning of this year, has been replaced by a contraction, beginning at the end
of the third quarter. In the United States, GDP declined by 0.4% this quarter, compared with the
previous quarter (seasonally adjusted and annualized data). In the Euro area, national and regional
indicators available point to a significant reduction in the growth rate for the third quarter. Japan’s
GDP declined in the second quarter, leading the Bank of Japan to reduce its growth projections
for the current fiscal year.
In the United States, GDP in the third quarter contracted for the first time since 1993 (0.4%),
reflecting the impacts of economic weakening made worse by the terrorist attacks of September
11th. The result was affected by the private investment behavior, -10.7%, which has declined by
over 10% for the past three quarters. Consumer consumption, which had been supporting output,
grew by 1.2%, after reaching 2.5% in the previous quarter. The 1.1% reduction in industrial
production in October, the 13th consecutive contraction, reducing the variation in the 12-month
accumulated figures to -1.4% from -0.5% in the previous month. The unemployment rate increased
half of a percentage point, reaching 5.4% in October, when there were 415,000 less job offers in
the non-agriculture sector.
Demand indicators are still showing decline. Personal expenditures with consumption declined by
1.3% in September, and increased by 3.4% in the last 12 months, maintaining the downward
trend. Orders to the factories and production of capital goods were negative in 5.8% and 2.3%
respectively in September, with the accumulated variation over 12 months registering -5.7% and
1.8%. Retail sales increased by 7.7% in October, after having declined by 2.2% in the previous
month, a result coming mainly from the 25.9% increase in the automobile sales. The core index,
which excludes vehicles and autoparts and components increased by 1%, in line with market
expectations. Credit to consumers increased by 0.2% in September, and the accumulated in 12
months declined to 6.8% from 7.4%, between August and September. Finally, although the initial

Inflation Report December 2001
155
construction of residential homes indicator presented a contraction of 1.3% in October, the
accumulated result over 12 months was positive for the first time since February 2000, reaching
0.4%. Mirroring the slowdown in the economic activity and the new government policy, plus the
initial impacts of the fiscal measures adopted after September 11th, the federal government fiscal
result was lower than in the previous year from June on, reverting the trend of increasing surpluses
observed since 1998. The fiscal year of 2001 represented a $127.2 billion surplus, 46.3% below
the record result of $236.7 billion in 2000.
The terrorist attacks hit market expectations, captured by surveys with entrepreneurs (NAPM)
and consumers (Conference Board). Expectation indicators in the manufacturing sector, as measured
by NAPM, declined to 39.8 in October from 47 in September, once more indicating economic
contraction. In the services sector the reduction measured by NAPM in the same period was from
50.2 to 40.6. Consumer confidence was also affected, and the index declined by 28.5 points
between August and October reaching 85.5.
With the slowdown in the economic activity and the reduction in the energy prices, especially petroleum,
inflation indices declined, widening the space for a more expansionist monetary policy. Consumer
prices (IPC) declined by 0.3% in October, with an annual growth of 2.6% in September and 2.1%
in October. The IPC core in October increased by 0.2% in the month, and 2.6% ytd. Producer
Prices (IPP) declined the most, -1.6% in October, with a negative variation of 0.4% ytd.
Several U.S. statistics indicate a scenario which lacks dynamism, with the likely repetition of the
negative GDP result in the two following quarters. Recovery should start from the second quarter
of 2002 on with the full effects of the fiscal and monetary policy measures.
In the Euro area, world economic slowdown negatively affected the activity level. Notwithstanding,
retail sales and trade balance results increased in August. In regard to the first, annual growth
increased to 1.8% from 1.5%, while trade balance surplus reached $18.7 billion accumulated in
the last 12 months until August, $5.6 billion above the result in the previous month. In September,
industrial production registered the third negative variation in the year, 0.6%, while the unemployment
rate remained stable at 8.3% in September. Harmonized Consumer Price Index (IPCH) declined
to 2.4% ytd in October from 3.4% in May. The quarterly moving average of the M3, first pillar of
the monetary policy in the region, however, accelerated from March on and reached a 6.9%
growth in August, above the 4.5% reference. In the main countries of the Euro area, business
expectations remain unfavorable, with emphasis on the 12 percentage points reduction in the
Italian indicator, between August and September.
In Japan, the contraction of the main indicators of domestic demand – factory orders, residential
home construction initiations and spending-, together with the cooling down of the external demand,

Inflation Report December 2001
156
the deflation, and the lack of supply reaction to the zero interest rate monetary policy, form ascenario of continued recession. The Bank of Japan revised its expectations of GDP growth for
the fiscal year to a range of –0.6% and –1.6% from a range of 0.3% to 0.8%.
In Argentina, continued recession makes it more difficult to reach the “zero deficit” target between
October and December, mainly due to the reduction in tax collection. The government initiated a
debt swap program with local creditors, aiming at reducing interest rate burden. This program
was interpreted by the rating agencies as a “selective default”, resulting in additional lowering of
the country’s ratings. The difficulties in Argentina reflected in the sovereign risk indicators, with the
spread of the Argentine bonds and US securities surpassing 3,000 basis points.
Prices
In October, the inflation rate measured both by the general and the consumer price indices increased
once again. This upward movement reflected mainly the readjustment of fuel prices and the increase
in the prices of cigarettes, rice – due to a smaller than expected harvest -, and meat - caused by
off-season problems and exchange rate effects related to export growth.
The IPCA rose by 0.83% in October compared to 0.28% in September, accumulating 6.22% ytd
and 7.19% in 12 months. Food prices increased by 1.15%, mainly due to the 10.7% and the
5.23% increase in the prices of rice and meat, respectively, responsible for 0.23 percentage points
in the monthly variation of index. The prices of non-food products increased by 0.74%, with the
3.58% increase in gasoline prices being the largest individual contribution to the IPCA of the
month (0.16 percentage point). The prices of cigarettes went up by 6.38%, reflecting a 14%
average readjustment in place since October 12th .
The IGP-DI increased by 1.45% in October, compared to 0.38% in September, accumulating
9.36% ytd and 10.62% in 12 months. In relation to the previous month, there was an acceleration
in all of its component indices, more intensively in the IPA, which increased by 1.88% from 0.48%,
responding for 1.13 percentage points of the IGP result. The growth in October wholesale prices
reflected the behavior of agricultural prices, which increased by 1.74% from 0.48%, as well as
industrial products, which rose by 1.94% from 0.75%. The lower supply of important agricultural
products, caused by off-season problems and by smaller than expected harvests, together with
the influence of the depreciated exchange rate and the readjustment of fuel prices were the main
reasons which explain the hike in wholesale prices, especially beef, rice, oranges, and fuel. In the
retail segment, the main influence came from food (0.27 pp), transport (0.16 pp), housing (0.13
pp) and personal expenditures (0.1 pp).
Inflation Report December 2001
157
For November, a smaller increase is expected for all indices, although the results will still be
influenced by pressures posed by October readjustments, particularly of fuel and cigarettes. The
prices of meat and its by-products will continue to increase due to the reduction in supply, affected
by off-season problems and the increase in exports. The readjustments of electric energy in Light’s
distribution area, added to urban bus fares hikes in Rio de Janeiro and prices of medicines , will
also be observed in November results.
Money market and open market operations
Since the last Copom meeting, the slope of the interest rate curve showed continued reduction.
The reduction in interest rates was stimulated by improvements in the prospects for the domestic
economy. The more optimistic forecasts for the Balance of Payments, the exchange rate
appreciation, and the expressive fiscal surplus built up the basis for a more favorable perception
of the fundamentals of the domestic economy, leading to the decoupling of Brazil’s sovereign risk
from Argentina’s. As a result, the spread between the Over-Selic rate and the three-month Futures
DI to February declined to 13 bps on November 19th from 210 bps on October 17th . Likewise,
the one-year interest rate spread decreased to 150 bp from 560 bp.
After a massive selling of R$23.4 billion in exchange rate indexed securities placed between
September 13th and October 10th , there was a sole unscheduled offer of NTN-D on October
25th , amounting to R$ 1.6 billion. The improvement in the domestic scenario led to a lower
demand for hedging. In addition, there were three auctions to rollover expiring exchange rate
indexed securities in November. The strategy adopted was to lengthen the issuance tenure. The
resulting financial volume transacted was of R$5.5 billion, 83% of which with securities maturing
between 3 and 7 years.
The National Treasury continued to offer six-month LTN on a weekly basis, recommencing at the
beginning of October. Five LTN public offers were carried out since October 23rd , totaling R$
7.3 billion. The improved prospects for the domestic economy accentuated the demand for fixed
rate securities. The average yields presented a downward trend, decreasing to 20.02% on
November 20th from 23.04% on October 23rd . The demand/supply ratio in the auctions oscillated
between 1.6 and 2.7.
As a result of the financial settlements which occurred between October 17th and November 20th
, a R$5.2 billion expansionist monetary impact was observed in the period. This impact resulted
from the net liquidations of R$3.2 billion in LTN, R$1.2 billion in LFT and R$1.1 billion in exchange
rate indexed securities.
Inflation Report December 2001
158
During a 21 working day period, the Central Bank intervened nine times in the open market,
aiming at administering the very short-term interest rate. In all operations, the Central Bank provided
liquidity to the market at a hurdle yield of 19.05%. The average volume of the interventions was of
R$18.3 billion, at a 2.3 day average tenure.
Assessment of inflation trends
The identified shocks and their impacts were reassessed in the light of newly available information.
The scenario considered in the simulations considering the following hypotheses:
1. October inflation rate, measured by the IPCA, reached 0.83%, above the expected result;
2. The forecast for prices of oil-by products was calculated based on the term structure of
prices implied in the Brent crude oil futures contracts. The expectation for the trajectory of the
average price of the Data Brent barrel was substantially reduced to US$19 in the last quarter of
2001, reaching US$20 at the end of 2002. This trend projects a 4.9% reduction in fuel prices to
consumers in 2002;
3. For a wider set of contractual prices, the expected readjustment in 2001 increased to 10.8%
in November from 10.0% in October. For 2002, the expected readjustment is of 5.8%;
4. The forecast for the readjustment of electricity tariffs in 2001 remained at approximately
20%. For 2002, a higher readjustment is expected, which may reach 30%;
5. The projected slope of the domestic yield curve, measured as the difference between the
180-day term DI rate and the 1-day Selic rate, was significantly reduced to an average of 297
basis points in the fourth quarter of 2001, linearly declining to an average of 250 b.p. in the first
quarter of 2002, and remaining stable until the end of the year;
6. The path of the U.S. fed funds rate projected based on the maturity of futures contracts was
altered to reflect an average rate of 2.2% in the fourth quarter of 2001, declining to 1.9% in the
first quarter of 2002 and showing a moderate increase thereafter;
7. On the external front, the assumption for the average risk premium, using Brazil’s Global 04
Bonds, incorporates a declining path from current levels to a plateau near 700 b.p. from the
second quarter on, with stability thereafter;
The core inflation of the IPCA, calculated under the symmetric trimmed-mean method, remained
stable at 0.57% in October. Accumulated in 12 months, the core index increased by 6.57%. The
Inflation Report December 2001
159
core inflation of the IPC-BR, calculated under the symmetric trimmed mean-method, rose by
0.56% in October. Accumulated in 12 months, this core increased by 6.42%. The inflation core
calculated with the exclusion of contractual prices – considering the wide set weighing 30.6% in
the IPCA in October – and of household food prices increased by 0.48% in October, with
accumulated variation of 4.28% in 12 months.
Year-to-date, the IPCA increased by 6.22% in October, reflecting the 2.8% contribution from
contractual prices (9.5% variation) and 3.4% from free prices (4.8% variation). For the remainder
of the year, a 0.4% contribution is expected from contractual prices (1.3% variation). The evolution
of the contractual prices is expected to directly contribute with 3.2% for the year inflation, compared
to the 2.9% estimated in October. In 2002, the contractual prices are expected to increase by
5.8% (with a direct contribution of 1.8%, which excludes the second-round effects on inflation),
influenced by the 30% hikes in electricity for the residential consumer.
Regarding fiscal policy, it was assumed that the primary surplus targets for the consolidated public
sector stated in the Government Economic Program will be achieved. The remaining assumptions
made in the previous meeting were maintained.
Simulation exercises with several specifications of the structural model led to the conclusion that
the maintenance of the interest rate at the current level of 19.0% p.a. and of the exchange rate at
the same plateau as of the eve of the Copom meeting would result in inflation above the upper limit
of the target for 2001. For 2002, the projected inflation is around 4.0%.
Monetary Policy Guidelines
Positive expectations regarding the Brazil’s economic performance in 2001 and 2002 contributed
to the appreciation of the Real as well as to the reduction in Brazil’s risk. The Real significantly
appreciated since the last COPOM meeting, changing to R$ 2,50-2,55/US$ on the eve of the
meeting. Brazil’s risk premium as measured by the yield’s differential between the Global 04
and the U.S. Treasury bond of equivalent duration also improved, as may be observed by the
drop higher than 250 bps in the period. Therefore, the upward trend observed until mid-October
reversed, which becomes more important when compared to the increased risk of emerging
countries, specially that of Argentina. Particularly, the expectation of a reduction in the current
account deficit and an improvement in the country’s external financing, supported by the monetary
and exchange policy adjustments, contributed to the appreciation of the Real as well as to the
reduction of Brazil’s risk.
This improvement was also followed by a significant reduction in the international prices of Brent
crude oil to US$ 19/barrel from US$ 22/barrel since the last meeting. Besides the direct benefit of
Inflation Report December 2001
160
the drop of international crude oil prices on inflation, there is still an indirect benefit caused by the
lower pressure on the exchange rate market, given the weight of this item in our imports.
The expectation regarding the economic growth also improved. There are signs of a smooth
reversion of the cooling trend that followed the effects of the shocks that hit the economy, such as
the deceleration of the world economy, the Argentine crisis, the September 11th attacks in the
U.S. and the energy rationing, in addition to the effects of the more restrictive domestic monetary
policy after March 2001. The reversion, yet incipient, can be observed in the increases in the
retail commerce in São Paulo, in the number of requests to the Credit Protection Service (SPC)
and in the Consumer Intentions Index, as well as in the stability observed in industrial activity.
A reduction in the slope of the term interest rate came along with a lower exchange rate pressure
and a drop in Brazil’s risk. The slope for 6 month-tenure fell to around 130 bps on the eve of the
last Copom meeting from an average of 524 bps in the third quarter.
Despite the favorable performance of the economy, there was not a correspondent improvement
in the prospects for inflation. The median expectations for the IPCA variation, considering the
sample comprising the aggregate of the surveyed financial institutions collected daily by the Central
Bank, showed an increase to 7.1% from 6.6% for 2001 and to 5.1% from 5.0% for 2002.
There are several factors which might have contributed to the worsening of the inflation forecasts. Firstly,
the IPCA in October registered an increase higher than that expected, reflecting a higher passthrough of
the exchange rate depreciation occurred during the year to prices. The increase in inflation in 2001 tends
to feed the expected inflation for 2002 through its inertial component. Indeed, the indicators of the core
inflation, calculated under the symmetric trimmed-mean average method, remains at a high plateau.
Secondly, the lower slope of the term structure of the interest rate also contributes to demand
recovery, what could lead to larger pressure on the prices in 2002. This effect may attenuate the
downward impacts of the recent appreciation of the Real upon the inflation in 2002.
Finally, the perspectives regarding the readjustment of the contractual prices next year remain
high. Particularly, the increase in electricity prices may reach 30%. Besides, the reduction of the
subsidies to the cooking gas prices is being considered, which implies in price increase. These
increases mean an important supply shock for the economy in 2002. In general terms, the behavior
of the contractual prices should directly contribute with 3.2% of the inflation in 2001 and, at least,
with 1.8% in 2002 (even excluding the second-round effects of these increases on inflation).
In summary, the improvement in several Brazilian economic indicators was not accompanied by
an improvement in inflation forecasts despite the favorable effects of the exchange rate appreciation
Inflation Report December 2001
161
and the drop in international oil prices. The hikes in contractual prices expected for 2002 represent
a supply shock that adds to the secondary impact of the shocks occurred this year on the prices.
This imposes narrow limits to the free prices inflation indicator next year. In this context, the
incipient recovery of the demand, which might be stimulated by the lower slope of the interest rate
curve and by an improvement in the expectations in general, must be monitored to avoid the
passthrough of the shocks of 2001 for the inflation in 2002.
Accordingly, COPOM unanimously decided to maintain the target for the Selic rate at 19%.
At the close of the meeting, it was announced that the Committee would meet again on December
18th , at 3:00 p.m, for technical presentations and, on the following day, at 4:30 p.m., in order to
discuss monetary policy guidelines, as set in Calendar of Copom’s Ordinary Meetings, published
in the Central Bank Communiqué n. 8018, of 11.22.2000.
Acronyms
ac 12m accumulated in 12 months
ACC Anticipated Exchange Rate Contracts
BM&F Mercantile and Futures Exchange
CDI Interbank Futures Contract
CETIP Center for Financial Custody and Settlement of Private Securities
CNI National Confederation of Industries
CPMF Provisory Contribution on Financial Transactions
CSLL Social Contribution on Net Profit
DI Interbank Deposit
FCESP Commerce Federation of the State of São Paulo
FED Federal Reserve System
FOMC Federal Open Market Committee
FRA Forward Rate Agreement
GDP Gross Domestic Product
IBGE Brazilian Institute of Geography and Statistics
IF Financial Institution
IGP-DI General Price Index – Domestic Supply
IIC Consumer Intentions Index
IPA Wholesale Price Index
IPC Consumer Price Index
IPCA Consumer Price Index – Extended
IPCH Consumer Price Index – Harmonized
IPP Producer Price Index
Inflation Report December 2001
162
IR Income Tax
IRF-M Market Fixed Income Index
IRRF Withholding Income Tax
NAPM National Association of Purchasing Managers
NTN-D National Treasury Note – D Series
p.a. per annum
p.m. per month
PEA Active Working Population
pp percentage point
STN National Treasury Secretariat
ytd year-to-date