Embed Size (px)
Citation preview

Lidwala Consulting Engineers (SA) (Pty) Ltd
___________________________________________________________________________________________________ 6-1
Majuba Continuous Ashing: Final EIA Report November 2014 Chapter 6: Description of the receiving Environment DEA Reference Number: 14/12/16/3/3/3/53
NEAS Reference: DEA/EIA/0001417/2012
6 RECEIVING ENVIRONMENT
6.1 Introduction
According to section 28(e) of the NEMA EIA Regulations, this section includes a description
of the baseline environment that may be affected by the proposed activity and the manner
in which the biophysical, social, economic and cultural aspects of the environment may be
affected by the proposed activity as well as a description of the environmental issues that
were identified during the impact assessment process. These issues are then further
analysed in Chapter 8 of this report.
6.2 Study Area in Regional Context
6.2.1 Locality
Majuba Power Station is located approximately 16 km southwest (SW) of Amersfoort and
approximately 40km north-northwest (NNW) of Volksrust in the Mpumalanga Province
(Figure 6.1). The power station falls within the Pixley Ka Seme Local Municipality which
falls within the Gert Sibande District Municipality (Figure 6.2).
Figure 6.1: Location of Majuba Power Station within the Pixley Ka Seme Local Municipality
Amersfoort
Volksrust

Lidwala Consulting Engineers (SA) (Pty) Ltd
___________________________________________________________________________________________________ 6-2
Majuba Continuous Ashing: Final EIA Report November 2014 Chapter 6: Description of the receiving Environment DEA Reference Number: 14/12/16/3/3/3/53
NEAS Reference: DEA/EIA/0001417/2012
Figure 6.2: Location of Pixley Ka Seme Local Municipality within the Gert Sibande District
Municipality
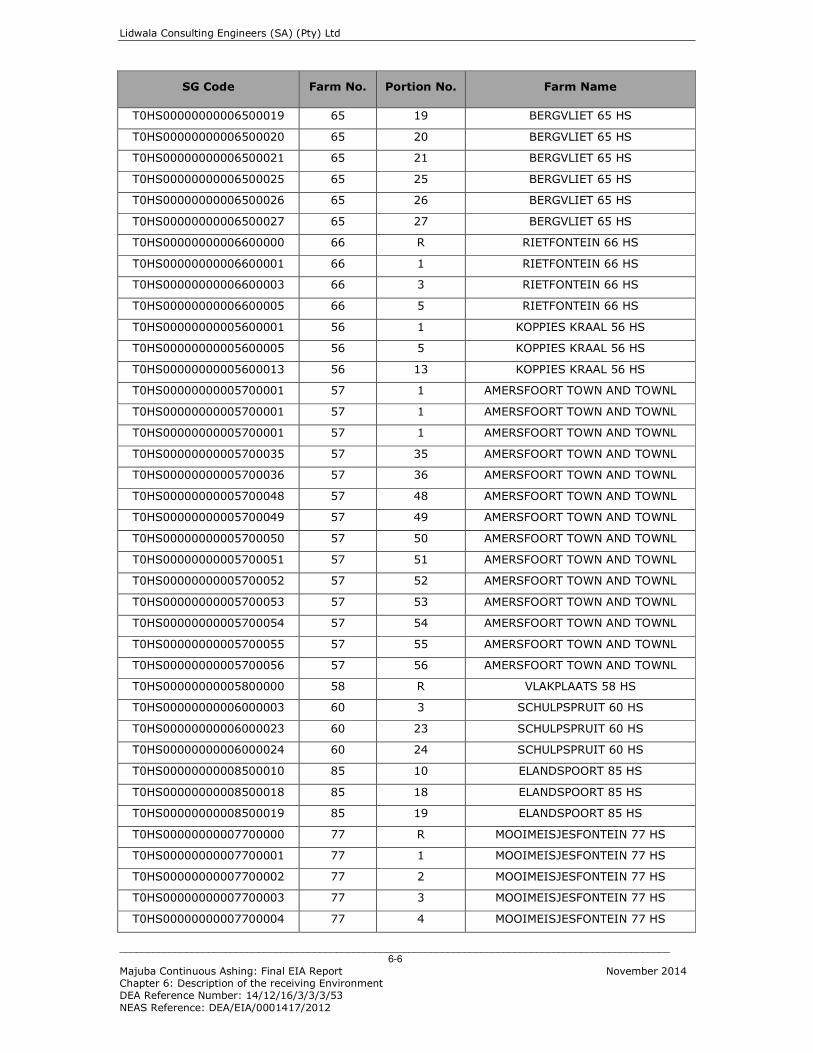
6.2.2 Study Area
The particular area required for the proposed continuous ashing facility is approximately
800 ha. In order to allow for a robust environmental process, all land within a radius of 12
km from the power station was assessed in order to identify potential alternatives sites. The
Majuba Continuous Ashing EIA study area is therefore located within a 12 km radius around
source of ash, the Majuba Power Station (Figure 6.3). The study area is approximately
450 square kilometres in size and includes a total of 40 different farms divided into 195
farm portions. A list of the farm portions are included in Table 6.1 which outlines the farms
associated with the proposed Majuba Continuous Ashing Study? Area.
Pixley Ka Seme Local Municipality

Lidwala Consulting Engineers (SA) (Pty) Ltd
___________________________________________________________________________________________________ 6-3
Majuba Continuous Ashing: Final EIA Report November 2014
Chapter 6: Description of the receiving Environment DEA Reference Number: 14/12/16/3/3/3/53 NEAS Reference: DEA/EIA/0001417/2012
Figure 6.3: Majuba Continuous Ashing EIA Study Area
Table 6.1: Farm Portions situated within the Majuba Continuous Ashing EIA Study Area
SG Code Farm No. Portion No. Farm Name
T0HS00000000008200005 82 5 WELGEDACHT 82 HS
T0HS00000000008200006 82 6 WELGEDACHT 82 HS
T0HS00000000008200007 82 7 WELGEDACHT 82 HS
T0HS00000000008200008 82 8 WELGEDACHT 82 HS
T0HS00000000008200009 82 9 WELGEDACHT 82 HS
T0HS00000000008200010 82 10 WELGEDACHT 82 HS
T0HS00000000008200011 82 11 WELGEDACHT 82 HS
T0HS00000000008200012 82 12 WELGEDACHT 82 HS
T0HS00000000008300001 83 1 RIETPOORT 83 HS
T0HS00000000008300002 83 2 RIETPOORT 83 HS
T0HS00000000008300003 83 3 RIETPOORT 83 HS
T0HS00000000008300004 83 4 RIETPOORT 83 HS
T0HS00000000008300005 83 5 RIETPOORT 83 HS
T0HS00000000008300007 83 7 RIETPOORT 83 HS
T0HS00000000005200000 52 R HOLVLEI 52 HS
T0HS00000000005200001 52 1 HOLVLEI 52 HS

Lidwala Consulting Engineers (SA) (Pty) Ltd
___________________________________________________________________________________________________ 6-4
Majuba Continuous Ashing: Final EIA Report November 2014 Chapter 6: Description of the receiving Environment DEA Reference Number: 14/12/16/3/3/3/53
NEAS Reference: DEA/EIA/0001417/2012
SG Code Farm No. Portion No. Farm Name
T0HS00000000005200004 52 4 HOLVLEI 52 HS
T0HS00000000006500000 65 R BERGVLIET 65 HS
T0HS00000000006500000 65 R BERGVLIET 65 HS
T0HS00000000006500000 65 R BERGVLIET 65 HS
T0HS00000000006500003 65 3 BERGVLIET 65 HS
T0HS00000000006500004 65 4 BERGVLIET 65 HS
T0HS00000000006500006 65 6 BERGVLIET 65 HS
T0HS00000000006500007 65 7 BERGVLIET 65 HS
T0HS00000000006500008 65 8 BERGVLIET 65 HS
T0HS00000000006900000 69 R SLANGFONTEIN 69 HS
T0HS00000000006900008 69 8 SLANGFONTEIN 69 HS
T0HS00000000006900011 69 11 SLANGFONTEIN 69 HS
T0HS00000000006900012 69 12 SLANGFONTEIN 69 HS
T0HS00000000006900013 69 13 SLANGFONTEIN 69 HS
T0HS00000000006900014 69 14 SLANGFONTEIN 69 HS
T0HS00000000006900015 69 15 SLANGFONTEIN 69 HS
T0HS00000000006900016 69 16 SLANGFONTEIN 69 HS
T0HS00000000008500001 85 1 ELANDSPOORT 85 HS
T0HS00000000008500004 85 4 ELANDSPOORT 85 HS
T0HS00000000008000028 80 28 HOLFONTEIN 80 HS
T0HS00000000008000029 80 29 HOLFONTEIN 80 HS
T0HS00000000008100000 81 R WITKOPPIES 81 HS
T0HS00000000008100001 81 1 WITKOPPIES 81 HS
T0HS00000000008100002 81 2 WITKOPPIES 81 HS
T0HS00000000008100003 81 3 WITKOPPIES 81 HS
T0HS00000000008100004 81 4 WITKOPPIES 81 HS
T0HS00000000008100005 81 5 WITKOPPIES 81 HS
T0HS00000000008100006 81 6 WITKOPPIES 81 HS
T0HS00000000008100007 81 7 WITKOPPIES 81 HS
T0HS00000000008100008 81 8 WITKOPPIES 81 HS
T0HS00000000008100009 81 9 WITKOPPIES 81 HS
T0HS00000000008100010 81 10 WITKOPPIES 81 HS
T0HS00000000008100011 81 11 WITKOPPIES 81 HS
T0HS00000000008100012 81 12 WITKOPPIES 81 HS
T0HS00000000008100013 81 13 WITKOPPIES 81 HS
T0HS00000000008100014 81 14 WITKOPPIES 81 HS
T0HS00000000009700013 97 13 TWEEFONTEIN 97 HS
T0HS00000000005400005 54 5 TWEEDEPOORT 54 HS
T0HS00000000005400009 54 9 TWEEDEPOORT 54 HS

Lidwala Consulting Engineers (SA) (Pty) Ltd
___________________________________________________________________________________________________ 6-5
Majuba Continuous Ashing: Final EIA Report November 2014 Chapter 6: Description of the receiving Environment DEA Reference Number: 14/12/16/3/3/3/53
NEAS Reference: DEA/EIA/0001417/2012
SG Code Farm No. Portion No. Farm Name
T0HS00000000009700014 97 14 TWEEFONTEIN 97 HS
T0HS00000000009700015 97 15 TWEEFONTEIN 97 HS
T0HS00000000009700000 97 R TWEEFONTEIN 97 HS
T0HS00000000006600008 66 8 RIETFONTEIN 66 HS
T0HS00000000006600009 66 9 RIETFONTEIN 66 HS
T0HS00000000006600010 66 10 RIETFONTEIN 66 HS
T0HS00000000006600011 66 11 RIETFONTEIN 66 HS
T0HS00000000006600014 66 14 RIETFONTEIN 66 HS
T0HS00000000006700000 67 R ROODEKOPJES 67 HS
T0HS00000000006700001 67 1 ROODEKOPJES 67 HS
T0HS00000000006700002 67 2 ROODEKOPJES 67 HS
T0HS00000000006700003 67 3 ROODEKOPJES 67 HS
T0HS00000000006700004 67 4 ROODEKOPJES 67 HS
T0HS00000000006800001 68 1 PALMIETSPRUIT 68 HS
T0HS00000000006800002 68 2 PALMIETSPRUIT 68 HS
T0HS00000000006800003 68 3 PALMIETSPRUIT 68 HS
T0HS00000000006800004 68 4 PALMIETSPRUIT 68 HS
T0HS00000000006800005 68 5 PALMIETSPRUIT 68 HS
T0HS00000000006800006 68 6 PALMIETSPRUIT 68 HS
T0HS00000000006800007 68 7 PALMIETSPRUIT 68 HS
T0HS00000000006800008 68 8 PALMIETSPRUIT 68 HS
T0HS00000000006900000 69 R SLANGFONTEIN 69 HS
T0HS00000000005300000 53 R STRYDKRAAL 53 HS
T0HS00000000005300001 53 1 STRYDKRAAL 53 HS
T0HS00000000005300001 53 1 STRYDKRAAL 53 HS
T0HS00000000005300004 53 4 STRYDKRAAL 53 HS
T0HS00000000005300005 53 5 STRYDKRAAL 53 HS
T0HS00000000005300006 53 6 STRYDKRAAL 53 HS
T0HS00000000005300007 53 7 STRYDKRAAL 53 HS
T0HS00000000005400000 54 R TWEEDEPOORT 54 HS
T0HS00000000005400001 54 1 TWEEDEPOORT 54 HS
T0HS00000000005400010 54 10 TWEEDEPOORT 54 HS
T0HS00000000006500010 65 10 BERGVLIET 65 HS
T0HS00000000006500011 65 11 BERGVLIET 65 HS
T0HS00000000006500012 65 12 BERGVLIET 65 HS
T0HS00000000006500015 65 15 BERGVLIET 65 HS
T0HS00000000006500016 65 16 BERGVLIET 65 HS
T0HS00000000006500017 65 17 BERGVLIET 65 HS
T0HS00000000006500018 65 18 BERGVLIET 65 HS
Lidwala Consulting Engineers (SA) (Pty) Ltd
___________________________________________________________________________________________________ 6-6
Majuba Continuous Ashing: Final EIA Report November 2014 Chapter 6: Description of the receiving Environment DEA Reference Number: 14/12/16/3/3/3/53
NEAS Reference: DEA/EIA/0001417/2012
SG Code Farm No. Portion No. Farm Name
T0HS00000000006500019 65 19 BERGVLIET 65 HS
T0HS00000000006500020 65 20 BERGVLIET 65 HS
T0HS00000000006500021 65 21 BERGVLIET 65 HS
T0HS00000000006500025 65 25 BERGVLIET 65 HS
T0HS00000000006500026 65 26 BERGVLIET 65 HS
T0HS00000000006500027 65 27 BERGVLIET 65 HS
T0HS00000000006600000 66 R RIETFONTEIN 66 HS
T0HS00000000006600001 66 1 RIETFONTEIN 66 HS
T0HS00000000006600003 66 3 RIETFONTEIN 66 HS
T0HS00000000006600005 66 5 RIETFONTEIN 66 HS
T0HS00000000005600001 56 1 KOPPIES KRAAL 56 HS
T0HS00000000005600005 56 5 KOPPIES KRAAL 56 HS
T0HS00000000005600013 56 13 KOPPIES KRAAL 56 HS
T0HS00000000005700001 57 1 AMERSFOORT TOWN AND TOWNL
T0HS00000000005700001 57 1 AMERSFOORT TOWN AND TOWNL
T0HS00000000005700001 57 1 AMERSFOORT TOWN AND TOWNL
T0HS00000000005700035 57 35 AMERSFOORT TOWN AND TOWNL
T0HS00000000005700036 57 36 AMERSFOORT TOWN AND TOWNL
T0HS00000000005700048 57 48 AMERSFOORT TOWN AND TOWNL
T0HS00000000005700049 57 49 AMERSFOORT TOWN AND TOWNL
T0HS00000000005700050 57 50 AMERSFOORT TOWN AND TOWNL
T0HS00000000005700051 57 51 AMERSFOORT TOWN AND TOWNL
T0HS00000000005700052 57 52 AMERSFOORT TOWN AND TOWNL
T0HS00000000005700053 57 53 AMERSFOORT TOWN AND TOWNL
T0HS00000000005700054 57 54 AMERSFOORT TOWN AND TOWNL
T0HS00000000005700055 57 55 AMERSFOORT TOWN AND TOWNL
T0HS00000000005700056 57 56 AMERSFOORT TOWN AND TOWNL
T0HS00000000005800000 58 R VLAKPLAATS 58 HS
T0HS00000000006000003 60 3 SCHULPSPRUIT 60 HS
T0HS00000000006000023 60 23 SCHULPSPRUIT 60 HS
T0HS00000000006000024 60 24 SCHULPSPRUIT 60 HS
T0HS00000000008500010 85 10 ELANDSPOORT 85 HS
T0HS00000000008500018 85 18 ELANDSPOORT 85 HS
T0HS00000000008500019 85 19 ELANDSPOORT 85 HS
T0HS00000000007700000 77 R MOOIMEISJESFONTEIN 77 HS
T0HS00000000007700001 77 1 MOOIMEISJESFONTEIN 77 HS
T0HS00000000007700002 77 2 MOOIMEISJESFONTEIN 77 HS
T0HS00000000007700003 77 3 MOOIMEISJESFONTEIN 77 HS
T0HS00000000007700004 77 4 MOOIMEISJESFONTEIN 77 HS

Lidwala Consulting Engineers (SA) (Pty) Ltd
___________________________________________________________________________________________________ 6-7
Majuba Continuous Ashing: Final EIA Report November 2014 Chapter 6: Description of the receiving Environment DEA Reference Number: 14/12/16/3/3/3/53
NEAS Reference: DEA/EIA/0001417/2012
SG Code Farm No. Portion No. Farm Name
T0HS00000000007700005 77 5 MOOIMEISJESFONTEIN 77 HS
T0HS00000000007700006 77 6 MOOIMEISJESFONTEIN 77 HS
T0HS00000000007700007 77 7 MOOIMEISJESFONTEIN 77 HS
T0HS00000000007700008 77 8 MOOIMEISJESFONTEIN 77 HS
T0HS00000000007700009 77 9 MOOIMEISJESFONTEIN 77 HS
T0HS00000000007900000 79 R MEZIG 79 HS
T0HS00000000007900001 79 1 MEZIG 79 HS
T0HS00000000007900002 79 2 MEZIG 79 HS
T0HS00000000007900003 79 3 MEZIG 79 HS
T0HS00000000007900004 79 4 MEZIG 79 HS
T0HS00000000007900005 79 5 MEZIG 79 HS
T0HS00000000007900006 79 6 MEZIG 79 HS
T0HS00000000007900007 79 7 MEZIG 79 HS
T0HS00000000007900008 79 8 MEZIG 79 HS
T0HS00000000007900009 79 9 MEZIG 79 HS
T0HS00000000007900010 79 10 MEZIG 79 HS
T0HS00000000007900011 79 11 MEZIG 79 HS
T0HS00000000007900012 79 12 MEZIG 79 HS
T0HS00000000007900013 79 13 MEZIG 79 HS
T0HS00000000007900014 79 14 MEZIG 79 HS
T0HS00000000008000000 80 R HOLFONTEIN 80 HS
T0HS00000000008000001 80 1 HOLFONTEIN 80 HS
T0HS00000000008000005 80 5 HOLFONTEIN 80 HS
T0HS00000000008000006 80 6 HOLFONTEIN 80 HS
T0HS00000000008000007 80 7 HOLFONTEIN 80 HS
T0HS00000000008000008 80 8 HOLFONTEIN 80 HS
T0HS00000000008000010 80 10 HOLFONTEIN 80 HS
T0HS00000000008000011 80 11 HOLFONTEIN 80 HS
T0HS00000000008000012 80 12 HOLFONTEIN 80 HS
T0HS00000000008000012 80 12 HOLFONTEIN 80 HS
T0HS00000000008000014 80 14 HOLFONTEIN 80 HS
T0HS00000000008000015 80 15 HOLFONTEIN 80 HS
T0HS00000000008000022 80 22 HOLFONTEIN 80 HS
T0HS00000000008000024 80 24 HOLFONTEIN 80 HS
T0HS00000000008000025 80 25 HOLFONTEIN 80 HS
T0HS00000000008500005 85 5 ELANDSPOORT 85 HS
T0HS00000000008500006 85 6 ELANDSPOORT 85 HS
T0HS00000000008500007 85 7 ELANDSPOORT 85 HS
T0HS00000000008500008 85 8 ELANDSPOORT 85 HS

Lidwala Consulting Engineers (SA) (Pty) Ltd
___________________________________________________________________________________________________ 6-8
Majuba Continuous Ashing: Final EIA Report November 2014 Chapter 6: Description of the receiving Environment DEA Reference Number: 14/12/16/3/3/3/53
NEAS Reference: DEA/EIA/0001417/2012
SG Code Farm No. Portion No. Farm Name
T0HS00000000008500009 85 9 ELANDSPOORT 85 HS
T0HS00000000005900000 59 R WEILAND 59 HS
T0HS00000000009700004 97 4 TWEEFONTEIN 97 HS
T0HS00000000009700005 97 5 TWEEFONTEIN 97 HS
T0HS00000000009700006 97 6 TWEEFONTEIN 97 HS
T0HS00000000007800029 78 29 ELANDSPOORT THERON 78 HS
T0HS00000000008100015 81 15 WITKOPPIES 81 HS
T0HS00000000008200000 82 R WELGEDACHT 82 HS
T0HS00000000008200002 82 2 WELGEDACHT 82 HS
T0HS00000000008200003 82 3 WELGEDACHT 82 HS
T0HS00000000008200004 82 4 WELGEDACHT 82 HS
T0HS00000000008600022 86 22 OUDEHOUT KLOOF 86 HS
T0HS00000000011500000 115 R JAPTRAP 115 HS
T0HS00000000011600000 116 R WERDA 116 HS
T0HS00000000011700000 117 R KLEIN RIETFONTEIN 117 HS
T0IS00000000052500007 525 7 MOOIGELEGEN 525 IS
T0IS00000000052500009 525 9 MOOIGELEGEN 525 IS
T0IS00000000052500010 525 10 MOOIGELEGEN 525 IS
T0IS00000000052500013 525 13 MOOIGELEGEN 525 IS
T0IS00000000052500015 525 15 MOOIGELEGEN 525 IS
T0IS00000000052600002 526 2 VLEIFONTEIN 526 IS
T0IS00000000052500000 525 R MOOIGELEGEN 525 IS
T0IS00000000052500001 525 1 MOOIGELEGEN 525 IS
6.3 Description of the Baseline Environment
6.3.1 Topography
The study area, within the 12 km radius, is characterised by strong undulating character
typical of the Mpumalanga province with hills and koppies to the south and east. The natural
topography of the area has been disturbed as a result of various mining, agricultural and
power generation activities.
6.3.2 Climate
The climate in the study area can be described as typical highveld conditions with summers
that are moderate and wet, while winters are cold and dry. Severe frost and snow are
sometimes experienced. The area also falls within the mist belt.

Lidwala Consulting Engineers (SA) (Pty) Ltd
___________________________________________________________________________________________________ 6-9
Majuba Continuous Ashing: Final EIA Report November 2014
Chapter 6: Description of the receiving Environment DEA Reference Number: 14/12/16/3/3/3/53 NEAS Reference: DEA/EIA/0001417/2012
According to data from the Majuba monitoring station for 2009 – 2011, the mean annual
precipitation is approximately 760 mm/year. The study area falls within a summer rainfall
region, with over 85% of the annual rainfall occurring during the October to March period.
Between October 2011 and March 2012, monthly rainfall ranged between 21 and 128 mm.
Figure 6.4 shows the monthly rainfall for the Majuba Power Station experienced during the
period August 2011 to July 2012.
Figure 6.4: The monthly rainfall as measured at Majuba Power Station (mm/annum) during
the period August 2011 to July 2012
Based on the measured data at Eskom’s Majuba monitoring station for the period 2009-
2011. Average daily maximum temperatures range from 34.6°C in December to 22.8°C in
July, with daily minima ranging from 14.6°C in January to 2.6°C in June (Figure 6.5).

Lidwala Consulting Engineers (SA) (Pty) Ltd
___________________________________________________________________________________________________ 6-10
Majuba Continuous Ashing: Final EIA Report November 2014
Chapter 6: Description of the receiving Environment DEA Reference Number: 14/12/16/3/3/3/53 NEAS Reference: DEA/EIA/0001417/2012
Figure 6.5: Average monthly maximum, minimum and mean temperatures for Majuba Power
Station
The prevailing wind direction is recorded as being co-dominant, with both easterly and west-
north-westerly winds. Figure 6.6 shows the period, day-time and night-time wind roses
for the Majuba Power Station.
Figure 6.6: Period, day-time and night-time wind roses for the Majuba Power Station
Lidwala Consulting Engineers (SA) (Pty) Ltd
___________________________________________________________________________________________________ 6-11
Majuba Continuous Ashing: Final EIA Report November 2014 Chapter 6: Description of the receiving Environment DEA Reference Number: 14/12/16/3/3/3/53
NEAS Reference: DEA/EIA/0001417/2012
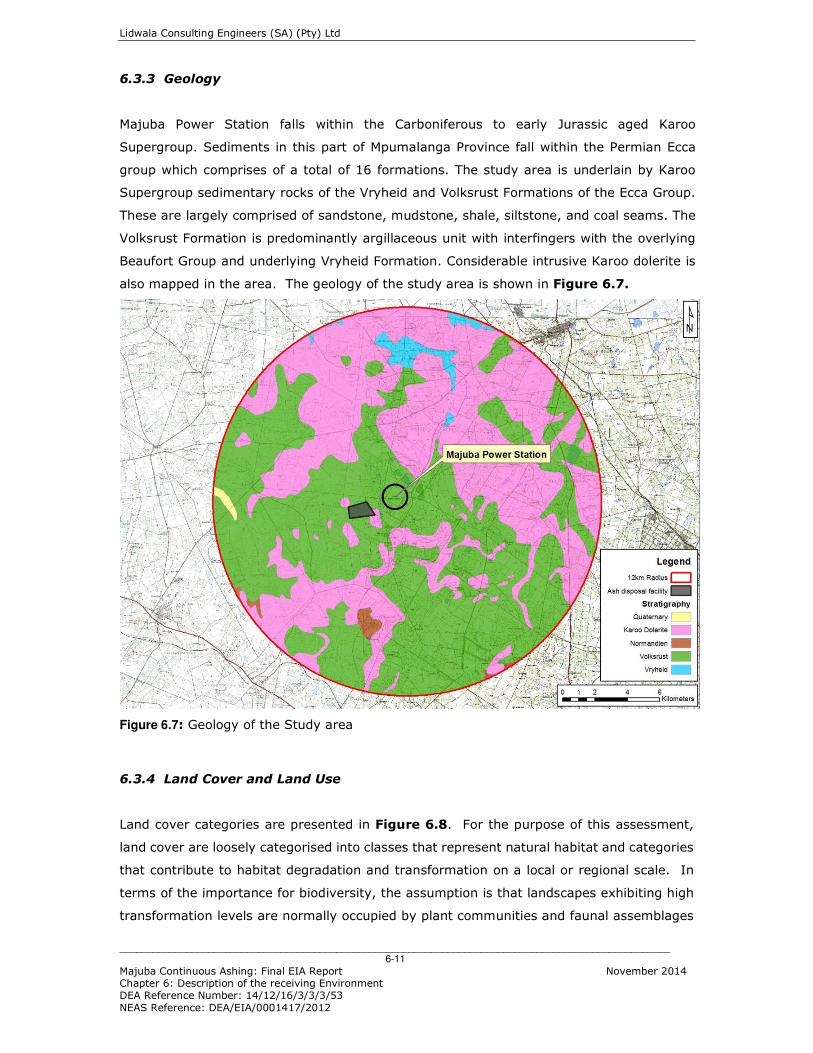
6.3.3 Geology
Majuba Power Station falls within the Carboniferous to early Jurassic aged Karoo
Supergroup. Sediments in this part of Mpumalanga Province fall within the Permian Ecca
group which comprises of a total of 16 formations. The study area is underlain by Karoo
Supergroup sedimentary rocks of the Vryheid and Volksrust Formations of the Ecca Group.
These are largely comprised of sandstone, mudstone, shale, siltstone, and coal seams. The
Volksrust Formation is predominantly argillaceous unit with interfingers with the overlying
Beaufort Group and underlying Vryheid Formation. Considerable intrusive Karoo dolerite is
also mapped in the area. The geology of the study area is shown in Figure 6.7.
Figure 6.7: Geology of the Study area
6.3.4 Land Cover and Land Use
Land cover categories are presented in Figure 6.8. For the purpose of this assessment,
land cover are loosely categorised into classes that represent natural habitat and categories
that contribute to habitat degradation and transformation on a local or regional scale. In
terms of the importance for biodiversity, the assumption is that landscapes exhibiting high
transformation levels are normally occupied by plant communities and faunal assemblages

Lidwala Consulting Engineers (SA) (Pty) Ltd
___________________________________________________________________________________________________ 6-12
Majuba Continuous Ashing: Final EIA Report November 2014 Chapter 6: Description of the receiving Environment DEA Reference Number: 14/12/16/3/3/3/53
NEAS Reference: DEA/EIA/0001417/2012
that do not necessarily reflect the original or pristine status. This is particularly important
in the case of conservation important taxa as these plants and animals generally exhibit
extremely low tolerance levels towards disturbances. This is one of the main reasons for
the threatened status of these species. Changes in the natural environment available to
these species are therefore likely to result in severe impacts on these species and,
subsequently, their conservation status.
Three important aspects are associated with habitat changes that accompany certain land
uses. Permanent transformation of natural habitat by land uses such as agriculture, mining
and urbanisation results in the permanent decimation of available habitat as these areas
will not recover to the original pristine status. A second aspect of habitat transformation or
degradation is that it affects species directly, namely changes in species presence/ absence
and –composition. This result from the exodus of species for which habitat conditions have
become unfavourable, the decrease in abundance of certain species because of decreased
habitat size, or an influx of species that are better adapted to the altered environment.
While some, or most, of the new species that occupy an area might be indigenous, they are
not necessarily endemic to the affected area. Lastly, a larger threat to the natural
biodiversity of a region is represented by the influx of invasive exotic species that can
effectively sterilise large tracts of remaining natural habitat.
The study area is situated within the Pixley Ka Seme Municipality, which comprises a total
of 522,723ha. The BGIS (2007) assessment indicates that approximately 88% of the
municipality are currently considered untransformed. This figure is however regarded an
overestimation of the true extent of remaining natural (pristine) grassland habitat in the
region. This statement is based on the following:
• The current land cover, as presented in ENPAT does not accurately reflect the current
land cover status in all instances; in particular, recent agricultural activities and localised
stands of exotics are not captured within the existing data (pers. obs.); and
• It is well established that the status of much of the remaining portions of ‘natural
grassland’ is not accurately summarized in the assessment. These ‘natural grasslands’
frequently comprehend poor quality grassland or even pastures that exhibit severely
altered species compositions and depleted diversity that does not reflect the natural
grassland of the region (pers. obs.).
By inclusion of portions of other land cover categories, sub-climax grassland types in
particular, within the category of ‘Natural Grassland’ a fallacious view is created of the extent
of remaining natural habitat in the region. It is therefore extremely likely that remaining

Lidwala Consulting Engineers (SA) (Pty) Ltd
___________________________________________________________________________________________________ 6-13
Majuba Continuous Ashing: Final EIA Report November 2014
Chapter 6: Description of the receiving Environment DEA Reference Number: 14/12/16/3/3/3/53 NEAS Reference: DEA/EIA/0001417/2012
untransformed habitat within the municipality is much lower than initially anticipated.
Ultimately, the greater region is characterised by high levels of habitat transformation,
isolation and habitat fragmentation, resulting from persistent increases in mining and
agricultural activities, urban developments, linear infrastructure and poor management
practices.
The effects of commercial agriculture (maize production), infestation by alien invasive trees
and recent increase in mining activities are evident from the mosaical appearance of land
cover in the immediate region. Other noteworthy land transformation effects result from
mining, industrial and urban development. Road and railway infrastructure in the region
caused a moderate level of habitat fragmentation and isolation.
Figure 6.8: Land cover categories in the study area
6.3.5 Land Type
The existing ash disposal facility is situated within the Bd46 land type unit (Figure 6.9).
Other land types represented within the 12km buffer zone include Ae252, Ah86, Bc44 and
Bd44.
Map units Aa to Ai refer to yellow and red soils without water tables and belonging in one
or more of the following soil form: Inanda, Kranskop, Magwa, Hutton, Griffin and Clovelly.

Lidwala Consulting Engineers (SA) (Pty) Ltd
___________________________________________________________________________________________________ 6-14
Majuba Continuous Ashing: Final EIA Report November 2014 Chapter 6: Description of the receiving Environment DEA Reference Number: 14/12/16/3/3/3/53
NEAS Reference: DEA/EIA/0001417/2012
The map units refer to land that does not qualify as a plinthic catena and in which one or
more of the above soil forms occupy at least 40% of the area. In Ab (red, dystrophic and/
or mesotrophic), yellow soils occupy less than 10% of the area and /or mesotrophic soils
occupy a larger area than high base status red-yellow apedal soils.
The B- group includes a large area of the South African interior that is occupied by a catena,
which in its perfect form is represented by (in order from highest to lowest in the upland
landscape) Hutton, Bainsvlei, Avalon and Longlands forms. The valley bottoms are occupied
by one or other grey soil. Soils with hard plinthite are common over sandstones in the moist
climate zones in the eastern part of the country. Depending on the extent to which water
tables have been operative over a landscape, Longlands, Avalon and related grey and yellow
soils may predominate, even to the exclusion of red soils. Where water tables have not
extended beyond the valley bottoms, red soils may predominate with plinthic soils restricted
to narrow strips of land around valley bottoms or pans. For inclusion into Bc and Bd plinthic
soils must cover more than 10% of the area. Unit Bc indicates land in which yellow and/ or
red apedal soils are eutrophic and red soils are widespread, while red soils are not
widespread in unit Bd.
Figure 6.9: Land type units with the study area

Lidwala Consulting Engineers (SA) (Pty) Ltd
___________________________________________________________________________________________________ 6-15
Majuba Continuous Ashing: Final EIA Report November 2014 Chapter 6: Description of the receiving Environment DEA Reference Number: 14/12/16/3/3/3/53
NEAS Reference: DEA/EIA/0001417/2012
6.3.6 Natural Vegetation
• Regional Vegetation - VEGMAP
The study area corresponds to the Grassland Biome as defined by Mucina & Rutherford
(VegMap, 2006). This unit is found in the eastern, precipitation-rich regions of the Highveld.
Grasslands of these parts are regarded ‘sour grasslands’. The following ecological types are
represented within the 12km radius (Figure 6.10):
• Amersfoort Highveld Clay Grassland;
• Bloemfontein Karroid Shrubland;
• Eastern Temperate Freshwater Wetlands;
• Soweto Highveld Grassland; and
• Wakkerstroom Montane Grassland.
A map with the conservation status of respective vegetation types are presented in Figure
6.11.
o Amersfoort Highveld Clay Grassland
This grassland comprises undulating plains, with small, scattered patches of dolerite
outcrops. The vegetation comprises of short, closed grassland, largely dominated by a
dense Themeda triandra sward, often severely grazed. Overgrazing leads to invasion of
Seriphium plumosum. Parts of this unit were once cultivated and these transformed
areas are not picked up by satellite for transformation coverage; the percentage of
grasslands still in a natural state may therefore be underestimated.
The conservation status is regarded as ‘Vulnerable’; none is formally protected. Some
25% of this vegetation type is transformed, predominantly by cultivation (22%). The
area is not suited to forestation. Silver and black wattle and Salix babylonica invade
drainage areas.
o Bloemfontein Karroid Shrubland
Vegetation of this unit comprehends plateaus or slightly sloping flanks of dolerite
outcrops supporting low shrubland dominated by dwarf small-leaved karroid and
succulent shrubs. Grasses are restricted to depressions and crevices filled with fine
soils. Remarkable is the presence of abundant geophytic herbs. Solitary shrubs or small
shrub groups with Diospyros austro-africana, Euclea crisps subsp. ovata, Searsia

Lidwala Consulting Engineers (SA) (Pty) Ltd
___________________________________________________________________________________________________ 6-16
Majuba Continuous Ashing: Final EIA Report November 2014 Chapter 6: Description of the receiving Environment DEA Reference Number: 14/12/16/3/3/3/53
NEAS Reference: DEA/EIA/0001417/2012
burchelli S. ciliata and S. erosa are occasionally present, especially in habitats where
root penetration into deeper crevices is possible.
Some sites of this vegetation are exposed to considerable urban developmental
pressures, especially within the borders of the Mangaung Municipality. None is
conserved in statutory conservation areas, but small portions are found on the premises
of the Free State National Botanical Garden in Bloemfontein; a ‘Least Threatened’
status is currently afforded. About 10% is already transformed, mainly by cultivation.
Potts & Tidmarsh (1937) were the first to describe this vegetation and to recognise the
fact that it is a unique island of succulent-dominated karroid shrub community within
the Grassland Biome. Although there is a strong affinity to the vegetation of the arid
west, it also has a notable grass component. It is therefore suggested that the
occurrence of karroid shrubland within highveld grasslands relates to physiological
drought due to shallow soils, high runoff, high evaporation rates and impeded infiltration
of rainwater. These factors create soil-controlled microhabitat for vegetation that might
be considered a relic of drier (and presumable colder) past climatic periods.
o Eastern Temperate Freshwater Wetlands
This vegetation type occurs around water bodies with stagnant water (lakes, pans,
periodically flooded vleis and edges of calmly flowing rivers) and is embedded within the
Grassland Biome. The landscape is generally flat, or shallow depressions filled with
(temporary) water bodies supporting zoned systems of aquatic and hygrophilous
vegetation of temporarily flooded grasslands and ephemeral herblands. The vleis form
where flow of water is impeded by impermeable soils and/ or by erosion resistant
features, such as dolerite intrusions. Many vleis and pans of this type of wetlands are
inundated and/ or saturated only during the summer rainfall season and for some
months after this into the middle of the dry winter season, but they may remain
saturated all year round. About 5% is statutorily conserved in the Blesbokspruit,
Hogsback, Marievale, Olifantsvlei, Seekoeivlei, Wakkerstroom Wetland, Umgeni Vlei and
Pamula Park Nature Reserves. It is also protected in private nature reserves such as
the Korsman Bird Sanctuary and Langfontein. A ‘Vulnerable’ conservation status is
ascribed to this unit. Some 15% has been transformed to cultivated land, urban areas
or plantations.
o Soweto Highveld Grassland
The Soweto Highveld Grassland comprises a gently to moderately undulating landscape
on the Highveld plateau supporting short to medium-high, dense, tufted grassland
dominated almost entirely by Themeda triandra and accompanied by a variety of other

Lidwala Consulting Engineers (SA) (Pty) Ltd
___________________________________________________________________________________________________ 6-17
Majuba Continuous Ashing: Final EIA Report November 2014 Chapter 6: Description of the receiving Environment DEA Reference Number: 14/12/16/3/3/3/53
NEAS Reference: DEA/EIA/0001417/2012
grasses such as Elionurus muticus, Eragrostis racemosa, Heteropogon contortus and
Tristachya leucothrix. Only scattered small wetlands, narrow stream alluvia, pans and
occasional ridges or rocky outcrops interrupt the continuous grassland cover in
undisturbed areas. This vegetation type is regarded ‘Endangered’ with a target of 24%.
Only a handful of patches are statutorily conserved, including Wadrift, Krugersdorp,
Leeuwkuil, Suikerboschrand and Rolfe’s Pan Nature Reserve. Almost half of the area is
already transformed by cultivation, urban sprawl, mining and building of road
infrastructure. Some areas have been flooded by dams (Grootdraai, Leeukuil,
Trichardtsfontein, Vaal, Willem Brummer). Erosion is generally very low.
o Wakkerstroom Montane Grassland
A small portion of this ecological type is represented in the southeast of the 12km radius.
Vegetation of this unit is a less obvious continuation of the Escarpment that links the
southern and northern Drakensberg escarpments; it straddles this divide and comprises
of low mountains and undulating plains. The vegetation comprises predominantly short
montane grasslands on the plateaus and the relatively flat areas, with short forest and
Leucosidea thickets occurring along steep, mainly east-facing slopes and drainage lines.
L. sericea is the dominant woody pioneer species that invades areas as a result of grazing
mismanagement. A status of ‘Least Threatened’ is afforded to these parts; although
less than 1% is statutorily conserved in the Paardeplaats Nature Reserve. There are 10
Natural Heritage Sites in this unit, although very little of it is formally protected. Land
use pressures from agriculture are low, probable owing to the colder climate and
shallower soils. The area is also suited to afforestation, with more than 1% under Acacia
mearnsii and Eucalyptus plantations.

Lidwala Consulting Engineers (SA) (Pty) Ltd
___________________________________________________________________________________________________ 6-18
Majuba Continuous Ashing: Final EIA Report November 2014
Chapter 6: Description of the receiving Environment DEA Reference Number: 14/12/16/3/3/3/53 NEAS Reference: DEA/EIA/0001417/2012
Figure 6.10: VEGMAP Categories in the Study area (according to Mucina and Rutherford
2006)
Figure 6.11: VEGMAP conservation status of vegetation types (according to Mucina and
Rutherford 2006)

Lidwala Consulting Engineers (SA) (Pty) Ltd
___________________________________________________________________________________________________ 6-19
Majuba Continuous Ashing: Final EIA Report November 2014 Chapter 6: Description of the receiving Environment DEA Reference Number: 14/12/16/3/3/3/53
NEAS Reference: DEA/EIA/0001417/2012
• MBCP Categories
The local and regional designation of Mpumalanga Terrestrial Biodiversity Conservation
Categories (MBCP) is illustrated in Figure 6.12.
The mandate for conserving biodiversity lies with state agencies at national, provincial and
local levels of government, forming part of a wider responsibility for the environment and
the sustainable use of natural resources. Constitutional and national laws require these
environmental issues to be dealt with in cooperative, participatory, transparent and
integrated ways. The MBCP is the first spatial biodiversity plan for Mpumalanga that is
based on scientifically determined and quantified biodiversity objectives. The purpose of
the MBCP is to contribute to sustainable development in Mpumalanga.
The MBCP maps the distribution of Mpumalanga Province’s known biodiversity into seven
categories (Lötter & Ferrar, 2006). These are ranked according to ecological and
biodiversity importance and their contribution to meeting the quantitative targets set for
each biodiversity feature. The categories are:
• Protected areas - already protected and managed for conservation;
• Irreplaceable areas - no other options available to meet targets––protection crucial;
• Highly Significant areas - protection needed, very limited choice for meeting targets;
• Important and Necessary areas - protection needed, greater choice in meeting
targets;
• Ecological Corridors – mixed natural and transformed areas, identified for long term
connectivity and biological movement;
• Areas of Least Concern – natural areas with most choices, including for development;
• Areas with No Natural Habitat Remaining – transformed areas that do not
contribute to meeting targets.
The study area comprises four of these categories (Figure 6.12), namely:
• Highly Significant (red);
• Important & Necessary (green);
• No Natural Habitat Remaining (grey); and
• Least Concern (yellow).

Lidwala Consulting Engineers (SA) (Pty) Ltd
___________________________________________________________________________________________________ 6-20
Majuba Continuous Ashing: Final EIA Report November 2014
Chapter 6: Description of the receiving Environment DEA Reference Number: 14/12/16/3/3/3/53 NEAS Reference: DEA/EIA/0001417/2012
Figure 6.12: The MBCP categories as they relate to the study area.
• Species of Conservation Importance
South Africa’s Red List system is based on the IUCN Red List Categories and Criteria Version
3.1 (finalized in 2001), amended to include additional categories to indicate species that are
of local conservation concern. The IUCN Red List system is designed to detect risk of
extinction. Species that are at risk of extinction, also known as threatened or endangered
species are those that are classified in the categories Critically Endangered (CR),
Endangered (EN) and Vulnerable (VU). Species included in these categories are presented
in Table 6.2. Taking the habitat that is available as well as the status thereof into
consideration, it is regarded likely that plant species included in the Threatened category
might be present within the study areas.
Mpumalanga Province comprises 4,256 plant species of which 276 are included in the
following conservation categories:
1 Extinct;
30 Endangered;
80 Vulnerable;
36 Near Threatened;
2 Critically Rare;
47 Rare;

Lidwala Consulting Engineers (SA) (Pty) Ltd
___________________________________________________________________________________________________ 6-21
Majuba Continuous Ashing: Final EIA Report November 2014 Chapter 6: Description of the receiving Environment DEA Reference Number: 14/12/16/3/3/3/53
NEAS Reference: DEA/EIA/0001417/2012
25 Declining;
19 Data Deficient – insufficient information (DDD); and
36 Data Deficient – taxonomical problem (DDT).
Data records indicate the presence of a number of plant species of conservation importance
within the ¼-degree grids that are sympatric to the study area (Table 6.2).
Table 6.2: Plant species of conservation importance within the region of the study area
Species Name Family Status
Argyrolobium campicola Fabaceae Near Threatened
Crinum bulbispermum Amaryllidaceae Declining
Gladiolus robertsoniae Iridaceae Near Threatened
Ilex mitis Aquifoliaceae Declining
Khadia alticola Mesembryanthemaceae Rare
Kniphofia typhoides Asphodelaceae Near Threatened
Miraglossum davyi Apocynaceae Vulnerable
Nerine platypetala Amaryllidaceae Vulnerable
Stenostelma umbelluliferum Apocynaceae Near Threatened
In addition to the species currently captured in the SANBI infobase (POSA, 2011), the
following provincially protected plants are known to occur within the region of the study
area (Mpumalanga Nature Conservation Act No.10 of 1998) (Table 6.3)
Table 6.3: Protected plant species within the region of the study area
Species Name Family Status
Agapanthus inapertus subsp. intermedius Agapanthaceae Provincially protected
Aloe ecklonis Asphodelaceae Provincially protected
Corycium nigrescens Orchidaceae Provincially protected
Crinum bulbispermum Amaryllidaceae Provincially protected
Cyrtanthus breviflorus Amaryllidaceae Provincially protected
Cyrtanthus tuckii var. transvaalensis Amaryllidaceae Provincially protected
Cyrtanthus tuckii var. tuckii Amaryllidaceae Provincially protected
Eulophia foliosa Orchidaceae Provincially protected
Gladiolus crassifolius Iridaceae Provincially protected
Gladiolus dalenii subsp. dalenii Iridaceae Provincially protected
Gladiolus permeabilis subsp. edulis Iridaceae Provincially protected
Gladiolus robertsoniae Iridaceae Provincially protected
Gladiolus sericeovillosus subsp. calvatus Iridaceae Provincially protected
Gladiolus sericeovillosus subsp. sericeovillosus Iridaceae Provincially protected
Haemanthus montanus Amaryllidaceae Provincially protected
Kniphofia albescens Asphodelaceae Provincially protected
Kniphofia typhoides Asphodelaceae Provincially protected
Leucospermum cuneiforme Proteaceae Provincially protected
Satyrium neglectum subsp. neglectum var. Orchidaceae Provincially protected

Lidwala Consulting Engineers (SA) (Pty) Ltd
___________________________________________________________________________________________________ 6-22
Majuba Continuous Ashing: Final EIA Report November 2014 Chapter 6: Description of the receiving Environment DEA Reference Number: 14/12/16/3/3/3/53
NEAS Reference: DEA/EIA/0001417/2012
Zantedeschia albomaculata subsp. macrocarpa Araceae Provincially protected
Further detail can be obtained from the Biodiversity Specialist Report in Appendix M.
6.3.7 Animal Life
A total of 115 Red Data species from five categories (IUCN) are known to occur in the
Mpumalanga Province (Invertebrates, Reptiles, Frogs and Mammals) and the Q-grids
2729BA and 2729BB (birds), included in the following conservation categories:
• 23 species are listed as Data Deficient (DD);
• 42 species are listed as Near Threatened (NT);
• 34 species are listed as Vulnerable (VU);
• 11 species are listed as Endangered (EN); and
• 5 species are listed as Critically Endangered (CR).
Estimations for the probability of occurrence (PoC) for Red Data fauna taxa for the study
area yielded the following results (Table 6.4):
• 41 species have a low PoC;
• 14 species have a moderate-low PoC;
• 31 species have a moderate PoC;
• 7 species have a moderate-high PoC; and
• 15 species have a high PoC.
Seven Red Data species have been recorded, or are known to occur, in the study area.
Table 6.4: Red Data Faunal assessment for the study area
Species Details Probability
Assessment Binomial Name Colloquial Name RD Status
Dragonflies and Damselflies
Pseudagrion inopinatum Balinsky's Sprite Endangered low
Pseudagrion newtoni Newton's Sprite Vulnerable moderate-low
Butterflies
Aloeides barbarae Barbara's Copper Endangered low
Aloeides merces Wakkerstroom Copper Vulnerable moderate-low
Aloeides nubilus Cloud Copper Endangered low
Aloeides rossouwi Rossouw's Copper Endangered low
Chrysoritis aureus Heidelberg Opal Vulnerable low
Chrysoritis phosphor borealis Scarce Scarlet Data Deficient low
Lepidochrysops irvingi Irving's Blue Vulnerable low
Lepidochrysops jefferyi Jeffrey's Blue Endangered low

Lidwala Consulting Engineers (SA) (Pty) Ltd
___________________________________________________________________________________________________ 6-23
Majuba Continuous Ashing: Final EIA Report November 2014 Chapter 6: Description of the receiving Environment DEA Reference Number: 14/12/16/3/3/3/53
NEAS Reference: DEA/EIA/0001417/2012
Lepidochrysops swanepoeli Swanepoel's Blue Vulnerable low
Metisella meninx Marsh Sylph Vulnerable high
Frogs
Breviceps sopranus Whistling Rain Frog Data Deficient low
Hemisus guttatus Spotted Shovel-nosed Frog Vulnerable moderate
Pyxicephalus adspersus Giant Bullfrog Near Threatened moderate-low
Strongylopus wageri Plain Stream Frog Near Threatened moderate-low
Reptiles
Acontias breviceps Short-headed Legless Skink Near Threatened moderate
Afroedura major Swazi Flat Gecko Near Threatened moderate-low
Chamaesaura aenea Coppery Grass Lizard Near Threatened moderate
Chamaesaura macrolepis Large-scaled Grass Lizard Near Threatened moderate
Homoroselaps dorsalis Striped Harlequin Snake Near Threatened moderate
Kininyx natalensis Natal Hinged Tortoise Near Threatened moderate
Lamprophis fuscus Yellow-bellied House Snake Near Threatened moderate
Smaug giganteus Sungazer Vulnerable confirmed
Tetradactylus breyeri Breyer's Long-tailed Seps Vulnerable moderate-low
Birds
Phoenicopterus roseus Greater Flamingo Near Threatened moderate-low
Phoenicopterus minor Lesser Flamingo Near Threatened moderate-low
Mycteria ibis Yellow-billed Stork Near Threatened moderate-low
Ciconia nigra Black Stork Near Threatened moderate-low
Leptoptilos crumeniferus Marabou Stork Near Threatened moderate-low
Geronticus calvus Southern Bald Ibis Vulnerable confirmed
Botaurus stellaris Eurasian Bittern Critically Endangered moderate
Sagittarius serpentarius Secretarybird Near Threatened high
Gyps coprotheres Cape Vulture Vulnerable moderate-low
Circus ranivorus African Marsh Harrier Vulnerable high
Circus maurus Black Harrier Vulnerable moderate-high
Circus macrourus Pallid Harrier Near Threatened high
Polemaetus bellicosus Martial Eagle Vulnerable moderate-high
Stephanoaetus coronatus Crowned Eagle Near Threatened low
Falco naumanni Lesser Kestrel Vulnerable high
Falco biarmicus Lanner Falcon Near Threatened high
Neotis denhami Denham's Bustard Vulnerable moderate-high
Eupodotis caerulescens Blue Korhaan Near Threatened confirmed
Eupodotis senegalensis White-bellied Korhaan Vulnerable moderate
Lissotis melanogaster Black-bellied Bustard Near Threatened moderate-low
Sarothrura affinis Striped Flufftail Vulnerable moderate-low
Crex crex Corn Crake Vulnerable moderate
Balearica regulorum Grey Crowned Crane Vulnerable moderate-high
Anthropoides paradiseus Blue Crane Vulnerable high
Bugeranus carunculatus Wattled Crane Critically Endangered moderate-high
Turnix nanus Black-rumped Buttonquail Endangered moderate
Vanellus melanopterus Black-winged Lapwing Near Threatened moderate
Rostratula benghalensis Greater Painted-snipe Near Threatened moderate
Glareola nordmanni Black-winged Pratincole Near Threatened moderate
Tyto capensis African Grass-owl Vulnerable moderate-high
Alcedo semitorquata Half-collared Kingfisher Near Threatened moderate-low
Heteromirafra ruddi Rudd's Lark Critically Endangered moderate-low
Spizocorys fringillaris Botha's Lark Endangered moderate-low
Lioptilus nigricapillus Bush Blackcap Near Threatened low
Zoothera gurneyi Orange Ground Thrush Near Threatened low
Anthus brachyurus Short-tailed Pipit Vulnerable low

Lidwala Consulting Engineers (SA) (Pty) Ltd
___________________________________________________________________________________________________ 6-24
Majuba Continuous Ashing: Final EIA Report November 2014 Chapter 6: Description of the receiving Environment DEA Reference Number: 14/12/16/3/3/3/53
NEAS Reference: DEA/EIA/0001417/2012
Anthus chloris Yellow-breasted Pipit Vulnerable low
Mammals
Chrysospalax villosus Rough-haired Golden Mole Critically Endangered moderate-low
Amblysomus hottentotus Hottentot's Golden Mole Data Deficient moderate-low
Amblysomus robustus Robust Golden Mole Endangered low
Amblysomus septentrionalis Highveld Golden Mole Near Threatened moderate-high
Neamblysomus julianae Juliana's Golden Mole Vulnerable low
Atelerix frontalis South African Hedgehog Near Threatened moderate
Elephantulus brachyrhynchus Short-snouted Elephant-shrew Data Deficient low
Myosorex cafer Dark-footed Forest Shrew Data Deficient low
Myosorex varius Forest Shrew Data Deficient high
Crocidura cyanea Reddish-grey Musk Shrew Data Deficient high
Crocidura flavescens Greater Musk Shrew Data Deficient moderate-high
Crocidura fuscomurina Tiny Musk Shrew Data Deficient moderate
Crocidura hirta Lesser Red Musk Shrew Data Deficient moderate
Crocidura maquassiensis Maquassie Musk Shrew Vulnerable low
Crocidura mariquensis Swamp Musk Shrew Data Deficient moderate-high
Crocidura silacea Lesser Grey-brown Musk Shrew Data Deficient moderate-high
Suncus infinitesimus Least Dwarf Shrew Data Deficient moderate
Suncus lixus Greater Dwarf Shrew Data Deficient low
Suncus varilla Lesser Dwarf Shrew Data Deficient moderate
Cloeotis percivali Percival's Short-eared Trident Bat Vulnerable moderate-low
Rhinolophus blasii Blasius's Horseshoe Bat Near Threatened moderate
Rhinolophus swinnyi Swinny's Horseshoe Bat Near Threatened moderate-low
Miniopterus natalensis Natal Long-fingered Bat Near Threatened moderate-high
Scotophilus nigrita Giant Yellow House Bat Near Threatened low
Cercopithecus mitis Samango Monkey Vulnerable low
Cercopithecus mitis labiatus Samango Monkey Endangered low
Manis temminckii Ground Pangolin Vulnerable moderate-low
Graphiurus platyops Rock Dormouse Data Deficient low
Mystromys albicaudatus White-tailed Rat Endangered moderate
Tatera leucogaster Bushveld Gerbil Data Deficient low
Lemniscomys rosalia Single-striped Mouse Data Deficient moderate
Dasymys incomtus Water Rat Near Threatened moderate
Grammomys dolichurus Woodland Mouse Data Deficient low
Otomys slogetti Sloggett's Rat Data Deficient low
Panthera pardus Leopard Near Threatened moderate
Panthera leo Lion Vulnerable low
Leptailurus serval Serval Near Threatened confirmed
Acinonyx jubatus Cheetah Vulnerable low
Felis nigripes Black-footed Cat Vulnerable low
Crocuta crocuta Spotted Hyaena Near Threatened low
Parahyaena brunnea Brown Hyaena Near Threatened high
Paracynictis selousi Selous's Mongoose Data Deficient low
Rhynchogale melleri Meller's Mongoose Data Deficient low
Canis adustus Side-striped Jackal Near Threatened low
Lycaon pictus African Wild Dog Endangered low
Mellivora capensis Honey Badger Near Threatened high
Poecilogale albinucha African Striped Weasel Data Deficient moderate
Hydrictis maculicollis Spotted-necked Otter Near Threatened moderate-low
Loxodonta africana African Savanna Elephant Vulnerable low
Diceros bicornis Black Rhinoceros Critically Endangered low
Ceratotherium simum White Rhinoceros Near Threatened low
Hippopotamus amphibius Common Hippopotamus Vulnerable low

Lidwala Consulting Engineers (SA) (Pty) Ltd
___________________________________________________________________________________________________ 6-25
Majuba Continuous Ashing: Final EIA Report November 2014 Chapter 6: Description of the receiving Environment DEA Reference Number: 14/12/16/3/3/3/53
NEAS Reference: DEA/EIA/0001417/2012
Raphicerus sharpei Sharpe's Grysbok Near Threatened low
Ourebia ourebi Southern Oribi Endangered low
Hippotragus equinus Roan Antelope Vulnerable low
Hippotragus niger Southern Sable Antelope Vulnerable low
Damaliscus lunatus Western Tsessebe Endangered low
Mpumalanga includes 31 provincially listed protected species (www.speciesstatus.sanbi.org
– NEMBA status, Table 6.5) of which one was recorded within the study area.
Table 6.5: Protected Fauna species of Mpumalanga
Species Details Probability Assessment
Binomial Name Colloquial Name NEMBA status
Aonyx capensis African Clawless Otter protected high
Atelerix frontalis South African Hedgehog protected moderate
Bucorvus leadbeateri Southern Ground-Hornbill protected low
Ceratogyrus bechuanicus Starbust Horned Baboon Spider protected moderate-low
Ceratotherium simum White Rhinoceros protected low
Circus ranivorus African Marsh Harrier protected high
Connachaetus gnou Black Wildebeest protected low
Crocuta crocuta Spotted Hyaena protected low
Dromica species Flightless Tiger Beetle species protected moderate-low
Felis nigripes Black-footed Cat protected low
Graphipterus assimilis Velvet Ground Beetle protected moderate-low
Harpactira gigas Transvaal Banded Baboon Spider protected moderate-low
Hydrictis maculicollis Spotted-necked Otter protected moderate-low
Leptailurus serval Serval protected confirmed
Loxodonta africana African Savanna Elephant protected low
Manticora species Monster Tiger Beetle species protected moderate-low
Megacephala asperata Tiger Beetle protected moderate-low
Megacephala regalis Tiger Beetle protected moderate-low
Neotis denhami Denham's Bustard protected moderate-high
Nigidius auriculatus Stag Beetle protected moderate-low
Oonotus adspersus Stag Beetle protected moderate-low
Oonotus interioris Stag Beetle protected moderate-low
Oonotus rex Stag Beetle protected moderate-low
Oonotus sericeus Stag Beetle protected moderate-low
Parahyaena brunnea Brown Hyaena protected high
Prosopocoilus petitclerci Stag Beetle protected moderate-low
Prothyma guttipennis Tiger Beetle protected moderate-low
Pterinochilus breyeri Malelane Golden-brown Baboon Spider protected moderate-low
Pterinochilus nigrofulvus Transvaal Golden Baboon Spider protected moderate-low
Raphicerus sharpei Sharpe's Grysbok protected low
Redunca arundinum Southern Reedbuck protected low
It is estimated that three of the eight species listed in Table 6.5 are unlikely to occur in the
study area (low) and 16 species moderately unlikely (moderate-low). Three species are
considered at least moderately likely (moderate) and four species highly likely to occur in
the study area (high).

Lidwala Consulting Engineers (SA) (Pty) Ltd
___________________________________________________________________________________________________ 6-26
Majuba Continuous Ashing: Final EIA Report November 2014 Chapter 6: Description of the receiving Environment DEA Reference Number: 14/12/16/3/3/3/53
NEAS Reference: DEA/EIA/0001417/2012
Further detail can be obtained from the Biodiversity Specialist Report in Appendix M.
6.3.8 Avifauna
• Bird Micro Habitats
It is important to understand the habitats available to birds at a smaller spatial scale, i.e.
micro habitats. Micro habitats are shaped by factors other than vegetation, such as
topography, land use, food sources and man-made factors. Investigation of this study area
revealed the following bird micro habitats.
o Arable and/or cultivated lands
Arable or cultivated lands (Figure 6.13) can represent significant feeding areas for
many bird species in any landscape for the following reasons: through opening up the
soil surface, land preparation makes many insects, seeds, bulbs and other food sources
readily accessible to birds and other predators; the crop or pasture plants cultivated are
also often eaten by birds, or attract insects which are in turn eaten by birds; during the
dry season arable lands often represent the only green or attractive food sources in an
otherwise dry landscape. Relevant bird species that may be attracted to these areas
include most importantly the Blue Crane, Grey Crowned Crane, Southern Bald Ibis, Blue
Korhaan and White Stork.
Figure 6.13: Agricultural lands.

Lidwala Consulting Engineers (SA) (Pty) Ltd
___________________________________________________________________________________________________ 6-27
Majuba Continuous Ashing: Final EIA Report November 2014 Chapter 6: Description of the receiving Environment DEA Reference Number: 14/12/16/3/3/3/53
NEAS Reference: DEA/EIA/0001417/2012
o Open Grasslands:
As can be seen from the earlier discussion regarding vegetation types, the major
vegetation types present all fall within the greater Grasslands Biome. It was not
surprising, therefore, that the most extensive bird micro habitat available on this site, is
that of Grassland (Figure 6.14). Grasslands represent a significant foraging and/or
hunting area for many bird species. Grassland may attract the Blue Crane, Grey Crowned
Crane, Southern Bald Ibis, Blue Korhaan, White-bellied Korhaan, Secretarybird,
Denham’s Bustard, Black-winged Pratincole, and White Stork, although most of these
species would tend to avoid grassland patches in close proximity to human disturbance.
Pristine patches of grassland, near to water, may provide breeding habitat for the African
Grass Owl. The grassland patches are also a favourite foraging area for game birds such
as francolins and Helmeted Guineafowl, as well as being hunting habitat for raptors such
as African Marsh Harrier, Lanner Falcon, Lesser Kestrel, Amur Falcon and Black-
shouldered kite. Important to this study is that two sensitive species, Rudd’s Lark
(Critically Endangered) and Botha’s Lark (Endangered), have been recorded in the
quarter degree squares (SABAP1 data) examined and both species are grassland species
(Figures 6.15 and 6.16).
Figure 6.14: Relatively undisturbed grassland observed in the broader study area.

Lidwala Consulting Engineers (SA) (Pty) Ltd
___________________________________________________________________________________________________ 6-28
Majuba Continuous Ashing: Final EIA Report November 2014 Chapter 6: Description of the receiving Environment DEA Reference Number: 14/12/16/3/3/3/53
NEAS Reference: DEA/EIA/0001417/2012
Figure 6.15: The Critically Endangered Rudd’s Lark
Figure 6.16: The Endangered Botha’s Lark
o Dams:
Dams have become important attractants to various bird species in the South African
landscape. Various waterfowl, such as Spur-winged geese, Egyptian geese, and
numerous duck species, may frequent these areas and are vulnerable to collision with
power lines, where the dams are in close proximity or on-route to dams. More
importantly, Blue Cranes use dams to roost in communally, and Flamingos may use
these areas as stop over points while moving between larger water bodies. Various
Storks may also frequent these water bodies. Numerous dams were observed in the
study area, of varying sizes, and varying importance to avifauna. A pair of Blue Cranes
as well as a flock of 40 Greater Flamingos were observed at a particular dam (270 06’
05.8”S 290 41’ 33.1” E) in the study area during the site visit (Figure 6.17).

Lidwala Consulting Engineers (SA) (Pty) Ltd
___________________________________________________________________________________________________ 6-29
Majuba Continuous Ashing: Final EIA Report November 2014 Chapter 6: Description of the receiving Environment DEA Reference Number: 14/12/16/3/3/3/53
NEAS Reference: DEA/EIA/0001417/2012
Figure 6.17: A dam in the study area where both Greater Flamingos and Blue Cranes were
observed.
o Wetlands and Rivers or drainage lines:
Wetlands and rivers can be very attractive micro habitats for birds as well as habitats
for water birds etc. In this area species such as Greater Flamingo, Lesser Flamingo,
Yellow-billed Stork and Caspian Tern are attracted to water. The Blue Crane and Grey-
Crowned Crane are also known to occur near vleis, pans and inland water sources. Non
Red Data species may also occur in these areas for example herons.
Rivers in their true form represent an important habitat for many species, including Black
Stork and a variety of other water birds, while the wooded riparian habitat along a river
may provide habitat for various species such as the Hamerkop, African Darter, various
cormorants, kingfishers, bee-eaters, robin-chats and numerous smaller species.
Small rivers are represented in the study area by the Geelklipspruit, Witbankspruit and
Skulpspruit. Numerous smaller drainage lines, some of which do not always carry water
are also present in the broader area. Drainage lines, as well as all of the Rivers/”Spruite”
discussed above, may serve as flight paths for several bird species.
o Stands of Alien vegetation:
Patches of alien trees were observed throughout the study area, often associated with a
farm stead, or along farm roads (Figure 6.18). These areas will mostly be important
to physically smaller bird species. These also provide perching, roosting and nesting

Lidwala Consulting Engineers (SA) (Pty) Ltd
___________________________________________________________________________________________________ 6-30
Majuba Continuous Ashing: Final EIA Report November 2014 Chapter 6: Description of the receiving Environment DEA Reference Number: 14/12/16/3/3/3/53
NEAS Reference: DEA/EIA/0001417/2012
habitats for various raptor species and larger birds such as francolins, Guineafowl,
Herons and Hadeda Ibises.
Figure 6.18: A stand of Alien Trees associated with a farm access road in the study area.
• Relevant bird populations
The relevant bird populations that have been reported by the South African Bird Atlas Project
(1 and 2) (SABAP) can be found below in Tables 6.6 and 6.7. In addition the preferred
habitat as well as likelihood of occurrence can be seen in the last two columns of Table 6.6.
Report rates are essentially an expression of the number of times a species was recorded
in a either a pentad or a quarter degree square, as a percentage of the number of times
that square was counted. A report rate of 0 means that the species was recorded in the
square, but at a very low frequency. It is important to note that these species could have
been recorded anywhere in the square, and not necessarily in the exact study area.
SABAP 2 data for the pentads (2705_2940 and 2705_2945) in the study area was examined,
and in general the area is poorly counted. Pentads 2700_2945, 2700_2940 and 2700_2950
were also considered due to their close proximity to the site. Table 6.6 below shows report
rates, based on the number of cards submitted, for the Red Data species identified during
SABAP2 counts. Interestingly, of the 17 red listed species identified in the SABAP 1 data,
only 7 species have again been recorded in the SABAP 2 data for the pentads examined.
This however, does not necessarily mean that these species do not occur here, or that they
have moved from the area, post SABAP1, but may merely be due to the low counting effort

Lidwala Consulting Engineers (SA) (Pty) Ltd
___________________________________________________________________________________________________ 6-31
Majuba Continuous Ashing: Final EIA Report November 2014 Chapter 6: Description of the receiving Environment DEA Reference Number: 14/12/16/3/3/3/53
NEAS Reference: DEA/EIA/0001417/2012
of the pentads or selective micro habitat counting by the SABAP2 field counters. White Stork,
protected through the Bonn Convention, was recorded in both data sets. Rudd’s Lark was
not recorded in the pentads examined, while Botha’s Lark was recorded in one of the five
pentads, with only one record from that pentad (which in fact does not incorporate the site).
Blue Korhaan was recorded in four pentads, and was observed in the area during the site
visit.
Table 6.6: Red Data species report rates for the two quarter degree squares which cover the
study area-SABAP 1 (Harrison et al, 1997)
Species
Cons.
status
Report rate (%) Preferred
Habitat
Likelihood of
occurrence
QDGS 2729BA 2729BB
Number of cards
submitted 42 62
Total Species 165 162
Rudd’s Lark CR
5
High altitude, dense,
montane grassland on
ridges
Unlikely
Botha’s Lark EN 6 Heavily grazed upland
grasslands
Possible
African Marsh Harrier VU 10 5 Wetlands; Grasslands;
Cultivated lands
Likely
Lesser Kestrel VU 2 3 Open grasslands Possible
Blue Crane VU 2 13 Grasslands; Cultivated
lands; Shrublands
Highly Likely
Grey Crowned Crane VU 2 3
Vleis; Wetlands; Moist
Grassland; Cultivated
lands
Possible
Southern Bald Ibis VU 14 24
High altitude
Grasslands; Pastures
and Cultivated lands
Highly Likely
White-bellied Korhaan VU 2 2 Open Grasslands Possible
Denham’s Bustard VU 2 Grasslands; Pastures;
Karoo Shrublands
Unlikely
Yellow-billed Stork NT 5 Rivers; Pans; Dams Possible
Secretary Bird NT 2 5 Possible
Greater Flamingo NT 7 3
Large, shallow bodies
of Saline and brackish
water
Highly Likely
Lesser Flamingo NT 2
Large inland and
coastal saline water
bodies.
Possible

Lidwala Consulting Engineers (SA) (Pty) Ltd
___________________________________________________________________________________________________ 6-32
Majuba Continuous Ashing: Final EIA Report November 2014 Chapter 6: Description of the receiving Environment DEA Reference Number: 14/12/16/3/3/3/53
NEAS Reference: DEA/EIA/0001417/2012
Black-winged
Pratincole NT 2 3
Open Grassland Possible
Lanner Falcon NT 3 Grasslands; Open
Savannah
Possible
Blue Korhaan NT 21 52 Open Grasslands;
Cultivated lands
Highly Likely
Caspian Tern NT 2
Large inland
Waterbodies;
Estuaries
Possible
White Stork Bonn 7 6
Grasslands; Pastures;
Cultivated lands;
Karoo
Likely
CR = Critically Endangered; EN = Endangered; VU = Vulnerable; NT = Near-threatened; Bonn = Protected
Internationally under the Bonn Convention on Migratory Species.
Table 6.7: Report rates from Southern African Bird Atlas Project 2 (SABAP2) as of
11/06/2013.
Species Cons.
status
Pentad Report Rate (%)
2705_2945 2705_2940 2700_2945 2700_2940 2700_2950
No Cards 2 2 3 1 5
Total Species 68 51 70 35 82
Botha’s Lark EN - - 33.3 - -
Lesser Kestrel VU 50 - - 100 -
Southern Bald Ibis VU - - - - 20
Blue Crane VU - - - - 20
Secretarybird NT 50 - - incidental -
Blue Korhaan NT 50 50 100 - 60
White Stork Bonn - - 33.3 - 20
CR = Critically Endangered; EN = Endangered; VU = Vulnerable; NT = Near-threatened; Bonn = Protected
Internationally under the Bonn Convention on Migratory Species.
Further detail can be obtained from the Avifauna Specialist Report in Appendix J.
6.3.9 Surface Water
As mentioned the study area encompasses a 12 km radius around the current infrastructure,
and falls over five quaternary catchments in the Upper Vaal Water Management Area (WMA)
with the Majuba Power Station located in C11J (Figure 6.19). The study area in relation to
the National Freshwater Ecosystem Priority Areas (NFEPA) and the Mpumalanga Biodiversity
Conservation Plan are provided in Figure 6.20 and Figure 6.21. Portions of the study area

Lidwala Consulting Engineers (SA) (Pty) Ltd
___________________________________________________________________________________________________ 6-33
Majuba Continuous Ashing: Final EIA Report November 2014 Chapter 6: Description of the receiving Environment DEA Reference Number: 14/12/16/3/3/3/53
NEAS Reference: DEA/EIA/0001417/2012
are located in a Freshwater Ecosystem Priority Area (FEPA) and these systems were
identified as being in a good condition (NFEPA – Nel et al., 2011) and therefore need to be
maintained in order to contribute to the biodiversity of the area (Figure 6.20). The
remainder of the study area is located in an Upstream Management Area. Anthropogenic
activities taking place in these areas need to be monitored in order to prevent the
degradation of FEPAs and Fish Support Areas located downstream (Figure 6.20). According
to the MBCP (Ferrrar & Lötter, 2007) the study area is located in an “Ecosystem
Maintenance” sub-catchment (Figure 6.21).
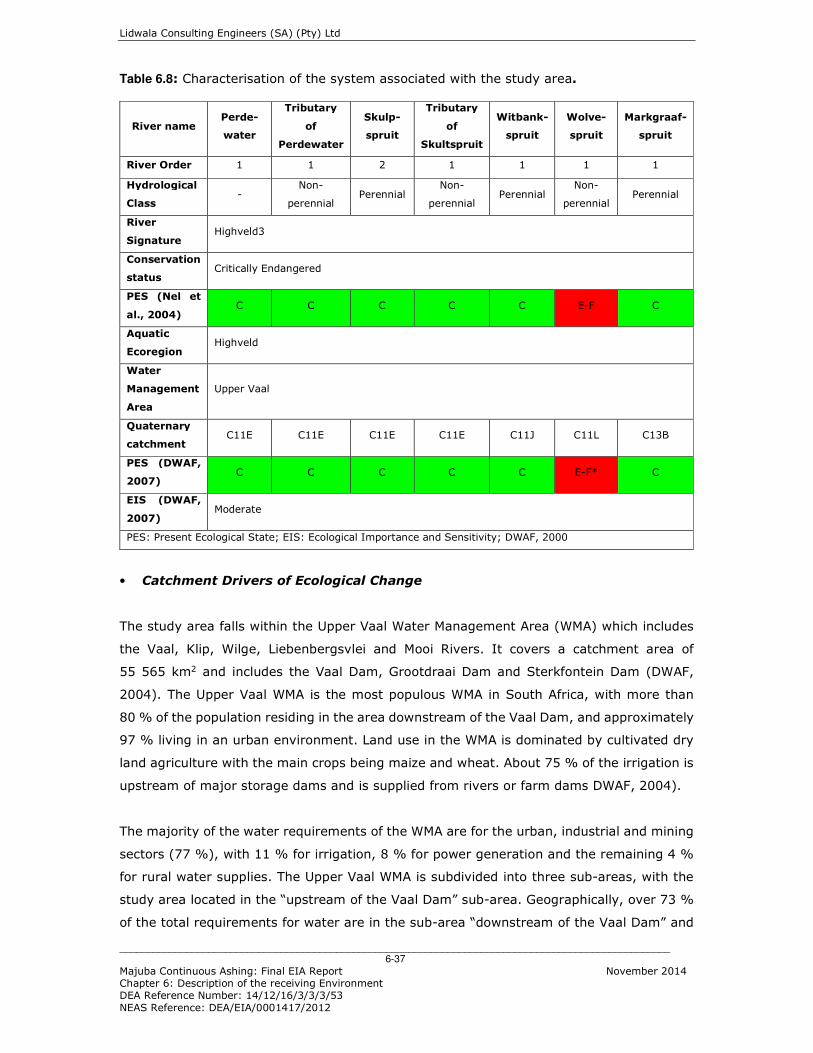
The characterisation of the rivers located within the study area (12 km radius) showed that
with the exception of the Skulpspruit (order two river) all of the remaining associated
systems are order one rivers/streams The Witbankspruit (running along the eastern
boundary of the Majuba Power Station), Skulpspruit and the Markgraafspruit are all
perennial with the remainder of the systems being classed as non-perennial (Figure 6.20;
Table 6.8). Numerous smaller streams are shown in the 1:50 000 river coverage (Figure
6.20). Non perennial rivers located in drier climates hold different characteristics to those
located in wetter climates and function differently to their perennial counterparts (Rossouw
et al., 2005). They therefore require focused attention with regards to ecosystem
management.
The tributary of the Witbankspruit as indicated in Figure 6.20 will be affected by the
proposed continuation of ashing. The aquatic ecosystems in the immediate vicinity include:
• A pan to the south of the existing ashing activity (Figure 6.19);
• The tributary of the Witbankspruit which is a valley bottom system to the east of the
current ash disposal facility footprint (running south to north) (Figure 6.19);
• A tributary of the Witbankspruit to the west of the existing ash disposal facility;
• Various zero order tributaries of the aforementioned system; and
• Visually observed seeps.

Lidwala Consulting Engineers (SA) (Pty) Ltd
___________________________________________________________________________________________________ 6-34
Majuba Continuous Ashing: Final EIA Report November 2014 Chapter 6: Description of the receiving Environment DEA Reference Number: 14/12/16/3/3/3/53
NEAS Reference: DEA/EIA/0001417/2012
Figure 6.19: Photographs taken during the screening/scoping survey: facing south towards
the pan and channelled valley bottom system (A); facing north at the existing ash disposal
facility on the 35 year ashing line (B); facing east toward a dam and the Majuba Power
station (C); and facing southeast at the tributary of the Witbankspruit.
Six attributes were used to obtain the Present Ecological State (PES) on desktop quaternary
catchment level by the National Spatial Biodiversity Assessment (NSBA - Nel et al., 2004).
These attributes predominantly refer to habitat integrity of instream and riparian habitat.
The surrounding catchments are affected by agricultural activities, waste water treatment
works, infrastructural development in the form of power stations and mines.
According to the NSBA (Nel et al., 2004) and DWAF (2007) with the exception of the
Wolwespruit, all the associated systems fall in a C ecological category, indicating a
moderately modified ecosystem state (Table 6.8). The Wolwespruit, however, classed in
an E-F ecological category, indicating that this system is critically modified and is in an
unacceptable state. The Ecological Importance and Sensitivity (EIS - DWAF, 2007) of all the
associated catchments are considered moderately sensitive due to the expected presence
of flow intolerant (Labeobarbus aeneus & Labeobarbus kimberleyensis) and unique /
A B
C D

Lidwala Consulting Engineers (SA) (Pty) Ltd
___________________________________________________________________________________________________ 6-35
Majuba Continuous Ashing: Final EIA Report November 2014 Chapter 6: Description of the receiving Environment DEA Reference Number: 14/12/16/3/3/3/53
NEAS Reference: DEA/EIA/0001417/2012
endemic (Labeo capensis & Austroglanis sclateri) fish species, and the system’s sensitivity
to changes in flow and water quality.
The systems in the immediate area have "Highveld 3" river signatures, which Nel et al.
(2004) assigns a status of critically endangered (Table 6.8). The ascribed river status
indicates a limited amount of intact river systems carrying the same heterogeneity
signatures nationally. This implies a severe loss in aquatic ecological functioning and aquatic
diversity in similar river signatures on a national scale (Nel et al., 2004).
Figure 6.20: Map indicating the 12 km radius study area and DWA monitoring points
associated with the proposed continuation of Majuba ashing activities (Nel et al., 2004; Chief
Directorate – Surveys and Mapping, 2629 and 2729; SANBI, 2010).

Lidwala Consulting Engineers (SA) (Pty) Ltd
___________________________________________________________________________________________________ 6-36
Majuba Continuous Ashing: Final EIA Report November 2014 Chapter 6: Description of the receiving Environment DEA Reference Number: 14/12/16/3/3/3/53
NEAS Reference: DEA/EIA/0001417/2012
Figure 6.21: Map indicating the study area in relation to the NFEPAs (Nel et al., 2004; SANBI,
2010; Nel et al., 2011).
Figure 6.22: Map indicating the study area in relation to the MBCP (Nel et al., 2004; Ferrrar
& Lötter, 2007).
Lidwala Consulting Engineers (SA) (Pty) Ltd
___________________________________________________________________________________________________ 6-37
Majuba Continuous Ashing: Final EIA Report November 2014 Chapter 6: Description of the receiving Environment DEA Reference Number: 14/12/16/3/3/3/53
NEAS Reference: DEA/EIA/0001417/2012
Table 6.8: Characterisation of the system associated with the study area.
River name Perde-
water
Tributary
of
Perdewater
Skulp-
spruit
Tributary
of
Skultspruit
Witbank-
spruit
Wolve-
spruit
Markgraaf-
spruit
River Order 1 1 2 1 1 1 1
Hydrological
Class -
Non-
perennial Perennial
Non-
perennial Perennial
Non-
perennial Perennial
River
Signature Highveld3
Conservation
status Critically Endangered
PES (Nel et
al., 2004) C C C C C E-F C
Aquatic
Ecoregion Highveld
Water
Management
Area
Upper Vaal
Quaternary
catchment C11E C11E C11E C11E C11J C11L C13B
PES (DWAF,
2007) C C C C C E-F* C
EIS (DWAF,
2007) Moderate
PES: Present Ecological State; EIS: Ecological Importance and Sensitivity; DWAF, 2000
• Catchment Drivers of Ecological Change
The study area falls within the Upper Vaal Water Management Area (WMA) which includes
the Vaal, Klip, Wilge, Liebenbergsvlei and Mooi Rivers. It covers a catchment area of
55 565 km2 and includes the Vaal Dam, Grootdraai Dam and Sterkfontein Dam (DWAF,
2004). The Upper Vaal WMA is the most populous WMA in South Africa, with more than
80 % of the population residing in the area downstream of the Vaal Dam, and approximately
97 % living in an urban environment. Land use in the WMA is dominated by cultivated dry
land agriculture with the main crops being maize and wheat. About 75 % of the irrigation is
upstream of major storage dams and is supplied from rivers or farm dams DWAF, 2004).
The majority of the water requirements of the WMA are for the urban, industrial and mining
sectors (77 %), with 11 % for irrigation, 8 % for power generation and the remaining 4 %
for rural water supplies. The Upper Vaal WMA is subdivided into three sub-areas, with the
study area located in the “upstream of the Vaal Dam” sub-area. Geographically, over 73 %
of the total requirements for water are in the sub-area “downstream of the Vaal Dam” and

Lidwala Consulting Engineers (SA) (Pty) Ltd
___________________________________________________________________________________________________ 6-38
Majuba Continuous Ashing: Final EIA Report November 2014 Chapter 6: Description of the receiving Environment DEA Reference Number: 14/12/16/3/3/3/53
NEAS Reference: DEA/EIA/0001417/2012
nearly 20 % in the sub-area upstream of the Vaal Dam. Most of the irrigation in the WMA is
in the sub-area downstream of the Vaal Dam (DWAF, 2004). The available water and total
requirements for the year 2000, including transfers between WMAs is shown in Table 6.10.
Table 6.9: Reconciliation of requirements and available water for the year 2000 (million m3/a)
without yield of Mohale Dam (DWAF, 2004)
Sub-area MAR Local yield Transfers
in
Transfers
out
Local
requirement Deficit
Wilge 868 59 0 0 60 -1
US of Vaal
Dam 1109 184 118 67 216 19
DS of Vaal
Dam 446 889 1224 1343 769 1
MAR: Natural Mean Annual Run-off; US: Upstream, DS: Downstream
The majority of the water requirements in the sub-area upstream of Vaal Dam are for mining
and bulk industrial use, with a considerable portion allocated for urban use and power
generation (DWAF, 2004). The expected future growth in the petro-chemical industry and
the increasing need of power generation in the region are putting pressure on the water
requirements of the sub-area at present.
• Historical Water Quality
Historical water quality data was obtained from DWA water monitoring points located on the
Perdewater and Skulpspruit (Figure 6.20):
• Upstream of the Majuba Power Station at DWA gauging station C11_90606 on the
Perdewater, upstream of the confluence with the Skulpspruit.
• Downstream of the Majuba Power Station at DWA gauging station C11_177963,
downstream of the Amersfoort Waste Water Treatment Works.
These monitoring stations provide minimum, maximum, median and 90th percentile values
for the variables measured between the period of 1996 and 2007 (Table 6.10). The
monitoring points are located Upstream (Perdewater – 90602) and downstream (Skulpspruit
– 177963) of the study area. The monitoring point located on the Perdewater showed better
water quality when compared to monitoring point located downstream on the Skulpspruit.
Despite the pH values falling above CEV, the remainder of the values were within the TWQRs
and benchmark criteria (DWAF, 1996; Kotze, 2002).

Lidwala Consulting Engineers (SA) (Pty) Ltd
___________________________________________________________________________________________________ 6-39
Majuba Continuous Ashing: Final EIA Report November 2014 Chapter 6: Description of the receiving Environment DEA Reference Number: 14/12/16/3/3/3/53
NEAS Reference: DEA/EIA/0001417/2012
The Skulpspruit (downstream) reflected poor water quality with all the variables measured
being considerably higher than the values obtained at the Perdewater weir (Table 6.10).
Na, Cl, SO4 and NH4(N) values were all within the tolerable range while the electrical
conductivity fell within the intolerable range (Kotze, 2002). The NO3(N) and PO4(P) values
were considerably higher when compared to Perdewater, indicating severe organic
enrichment, most likely as a result of effluent from the Amersfoort Waste Water Treatment
Works.
Table 6.10: DWA 90th percentile water quality values for monitoring stations located on the
Perdewater and Skulpsruit systems
Variable Abb Unit
C11_90602 C11_177963
Perdewater Skulpspruit
Min 90th percentile Min 90th percentile
Max Median Max Median
Position in relation to the
Majuba Power Station Upstream Downstream
Flow m3s 4.1 3.0
No data 0 0 n=6604
pH H¹+ ions 9.73 8.74 8.8 7.9
6.85 7.88 n=90 6.4 7.5 n=61
Electrical Conductivity EC mS-mˉ¹ 29.5 13.3 137 115
7.8 11.51 6.4 35 97 n=61
Total Dissolved Solids TDS ppm 223 94.24
No data 56.88 85.0 n=88
Calcium Ca mg/l 33.03 12.6 60.3 44.22
5.759 8.16 n=90 13.4 28.2 n=39
Magnesium Mg mg/l 13.06 5.53 42.8 32.97
0.75 4.6 n=90 4.6 18.3 n=39
Potassium K mg/l 3.12 1.73 26.1 26.02
0.592 1.24 n=89 25.7 25.9 n=2
Sodium Na mg/l 13.79 6.03 110 83.74
1.0 5.2 n=89 9.8 62.3 n=23
TAlkilinity Tal mg/l 120.0 45.3 494 423
23.85 40.53 n=90 141 318 n=2
Chloride Cl mg/l 10.52 6.65 101 84.6
2.0 5.0 n=90 15.0 63.5 n=52
Fluoride F mg/l 0.23 0.18 0.6 0.4
0.05 0.13 n=88 0.05 0.2 n=34
Silica Si mg/l 11.06 6.16 No data

Lidwala Consulting Engineers (SA) (Pty) Ltd
___________________________________________________________________________________________________ 6-40
Majuba Continuous Ashing: Final EIA Report November 2014 Chapter 6: Description of the receiving Environment DEA Reference Number: 14/12/16/3/3/3/53
NEAS Reference: DEA/EIA/0001417/2012
Variable Abb Unit
C11_90602 C11_177963
Perdewater Skulpspruit
Min 90th percentile Min 90th percentile
Max Median Max Median
Position in relation to the
Majuba Power Station Upstream Downstream
0.57 5.18 n=90
Sulphate SO4 mg/l 44.6 14.4 130.0 98
2.0 10.9 n=90 29.0 67 n=40
Ammonium NH4(N) mg/l 0.1 0.06 75.0 58.56
0.015 0.02 n=90 0.05 36.2 n=61
Nitrate NO3(N) mg/l 1.14 0.29 31.2 18.87
0.005 0.2 n=90 0.05 0.3 n=61
Phosphate PO4(P) mg/l 0.1 0.03 17.4 14.5
0.003 0.02 n= 0.05 8.6 n=60
• Expected Macroinvertebrate Species
A list of macroinvertebrates expected to occur in the study area or indicating the possibility
of occurrence was determined for the major drainage lines (Table 6.11; Figure 6.23).
Each taxon was allocated a rating score of either 1, 3 or 5: a rating of 5 indicates that the
specific taxon has been sampled within that sub-quaternary (SQ) reach and is likely to be
sampled; a rating of 3 indicates that the taxon has not been sampled in the SQ reach but
has been sampled in a similar SQ reach and the probability of occurrence has been
extrapolated; a rating of 1 indicates that the taxon has not been sampled in the SQ reach
or any other similar SQ reach but is thought to be potentially present taking into account
the available habitat, water quality and associated land use activities. The majority of
expected macroinvertebrates are of low to moderate sensitivity, scoring between 3 and 8
(Gerber & Gabriel, 2002). A total of five relatively sensitive taxa are expected to occur within
the study area, namely Heptageniidae, Athericidae, Dixidae, Leptophlebiidae and
Tricorythidae. Sensitivity scores of these taxa ranged between 9 and 13 (Gerber & Gabriel,
2002) representing taxa that are moderately to highly intolerant to alterations in water
quality (pollution).

Lidwala Consulting Engineers (SA) (Pty) Ltd
___________________________________________________________________________________________________ 6-41
Majuba Continuous Ashing: Final EIA Report November 2014 Chapter 6: Description of the receiving Environment DEA Reference Number: 14/12/16/3/3/3/53
NEAS Reference: DEA/EIA/0001417/2012
Figure 6.23: Sub-quaternary catchments related to the expected macroinvertebrate species
lists (Chief Directorate – Surveys and Mapping, 2629 and 2729; Pers. Comm. Mrs. Christa
Thirion, 2012)

Lidwala Consulting Engineers (SA) (Pty) Ltd
___________________________________________________________________________________________________ 6-42
Majuba Continuous Ashing: Final EIA Report November 2014
Chapter 6: Description of the receiving Environment DEA Reference Number: 14/12/16/3/3/3/53 NEAS Reference: DEA/EIA/0001417/2012
Table 6.11: Macroinvertebrate species expected to occur, or indicating the possibility of occurrence, in the different sub-quaternary reaches located
within the study area. Taxa in red are considered sensitive taxa
ID A B C D E F G H
SS Perdewater
Tributary of
the
Perdewater
- Skulpspruit
Tributary of
the
Skulpspruit
Witbank-
spruit
Wolwesprui
t
Markgraaff-
spruit
Porifera 5 5
Turbellaria 3 1 1 1 5 1 1 1 1
Oligochaeta 1 1 1 1 5 1 1 1 1
Hirudinea 3 1 1 1 1 1 1 1 1
Potamonautidae 3 1 1 1 5 1 1 1 1
Atyidae 8 1 1 1 5 1 1 1 1
Hydracarina 8 1 1 1 5 1 1 1 1
Baetidae > 2 Sp 12 1 1 1 5 1 1 1 1
Caenidae 6 1 1 1 5 1 1 1 1
Heptageniidae 13 1
Leptophlebiidae 9 1 1 1 5 1 1 1 1
Tricorythidae 9 5
Coenagrionidae 4 1 1 1 5 1 1 1 1
Lestidae 8 5
Aeshnidae 8 1 1 1 1 1 1 1 1
Gomphidae 6 1 1 1 5 1 1 1 1
Libellulidae 4 1 1 1 5 1 1 1 1
Belostomatidae 3 1 1 1 1 1 1 1 1

Lidwala Consulting Engineers (SA) (Pty) Ltd
___________________________________________________________________________________________________ 6-43
Majuba Continuous Ashing: Final EIA Report November 2014
Chapter 6: Description of the receiving Environment DEA Reference Number: 14/12/16/3/3/3/53 NEAS Reference: DEA/EIA/0001417/2012
ID A B C D E F G H
SS Perdewater
Tributary of
the
Perdewater
- Skulpspruit
Tributary of
the
Skulpspruit
Witbank-
spruit
Wolwesprui
t
Markgraaff-
spruit
Corixidae 3 1 1 1 5 1 1 1 1
Gerridae 5 1 1 1 1 1 1 1 1
Hydrometridae 6 1 1 1 1 1 1 1 1
Naucoridae 7 1 1 1 1 1 1 1 1
Nepidae 3 1 1 1 1 1 1 1 1
Notonectidae 3 1 1 1 5 1 1 1 1
Pleidae 4 1 1 1 1 1 1 1 1
Veliidae/Mesoveliidae 5 1 1 1 5 1 1 1 1
Ecnomidae 8 1
Hydropsychidae 1 Sp 4 1 1 1 1 1 1 1
Hydropsychidae > 2 Sp 12 5
Hydroptilidae 6 1 1 1 1 1 1 1 1
Leptoceridae 6 1 1 1 1 1 1 1 1
Dytiscidae 5 1 1 1 5 1 1 1 1
Elmidae/Dryopidae 8 1 1 1 1 1 1 1
Gyrinidae 5 1 1 1 5 1 1 1 1
Haliplidae 5 5
Hydraenidae 8 5
Hydrophilidae 5 1 1 1 5 1 1 1 1
Athericidae 10 1
Ceratopogonidae 5 1 1 1 5 1 1 1 1

Lidwala Consulting Engineers (SA) (Pty) Ltd
___________________________________________________________________________________________________ 6-44
Majuba Continuous Ashing: Final EIA Report November 2014
Chapter 6: Description of the receiving Environment DEA Reference Number: 14/12/16/3/3/3/53 NEAS Reference: DEA/EIA/0001417/2012
ID A B C D E F G H
SS Perdewater
Tributary of
the
Perdewater
- Skulpspruit
Tributary of
the
Skulpspruit
Witbank-
spruit
Wolwesprui
t
Markgraaff-
spruit
Chironomidae 2 1 1 1 5 1 1 1 1
Culicidae 1 1 1 1 1 1 1 1 1
Dixidae 10 1
Muscidae 1 1 1 1 1 1 1 1 1
Simuliidae 5 1 1 1 5 1 1 1 1
Tabanidae 5 1 1 1 1 1 1 1 1
Tipulidae 5 1
Ancylidae 6 1 1 1 5 1 1 1 1
Lymnaeidae 3 1
Physidae 3 1 1 1 1 1 1 1 1
Planorbinae 3 1 1 1 1 1 1 1 1
Corbiculidae 5 1 1 1 5 1 1 1 1
Sphaeriidae 3 1 1 1 1 1 1 1 1
SS = Sensitivity Score (Dickens & Graham, 2001)

Lidwala Consulting Engineers (SA) (Pty) Ltd
___________________________________________________________________________________________________ 6-45
Majuba Continuous Ashing: Final EIA Report November 2014 Chapter 6: Description of the receiving Environment DEA Reference Number: 14/12/16/3/3/3/53
NEAS Reference: DEA/EIA/0001417/2012
• Expected Fish Species
A summary of the expected fish families, species and IUCN conservation status is provided
in Table 6.12. The area of study provides potential refuge for four fish families represented
by approximately 12 species, none of which have conservation status and are listed as Least
Concern (LC) by the IUCN (2012). Barbus neefi and Barbus pallidus are expected to occur
in the study area (IUCN, 2012) and both species are moderately intolerant to alterations in
water quality, making them good indicators of ecosystem health.
Table 6.12: Fish species expected to occur, or indicating the possibility of occurrence, in the
river systems associated with the study area
Family Genus and Species Common Name IUCN
Status
Austroglanididae Austroglanis sclateri Rock Catfish LC
Clariidae Clarias gariepinus Sharptooth Catfish LC
Cyprinidae Barbus anoplus Chubbyhead Barb LC
Cyprinidae Barbus neefi Sidespot Barb LC
Cyprinidae Barbus pallidus Goldie Barb LC
Cyprinidae Barbus paludinosus Straightfin Barb LC
Cyprinidae Cyprinus carpio Common Carp EX
Cyprinidae Labeobarbus aeneus Smallmouth Yellowfish LC
Cyprinidae Labeo capensis Orange River Labeo LC
Cyprinidae Labeo umbratus Moggel LC
Cichlidae Pseudocrenilabrus philander Southern Mouthbrooder LC
Cichlidae Tilapia sparrmanii Banded Tilapia LC
LC: Least Concern; EX: Exotic
• Expected Odonata (dragonflies) Species
Approximately 58 Odonata species are expected to occur in the study area. All of the 58
species are listed as LC according to the IUCN database (IUCN, 2012).
• Expected Mollusca (snails, limpets) Species
A total of 10 mollusc species are expected to occur in the study area, of which 9 species are
listed as LC. Only one species, namely Burnupia caffra, is listed as Data Deficient (DD) due
to taxonomic uncertainty. Burnupia caffra are frequently unobserved during sampling

Lidwala Consulting Engineers (SA) (Pty) Ltd
___________________________________________________________________________________________________ 6-46
Majuba Continuous Ashing: Final EIA Report November 2014 Chapter 6: Description of the receiving Environment DEA Reference Number: 14/12/16/3/3/3/53
NEAS Reference: DEA/EIA/0001417/2012
surveys due to their extremely small size (2 - 4 mm). The genus Burnupia needs taxonomic
revision as the numbers of species are extremely uncertain (Appleton et al., 2010).
Further detail can be obtained from the Surface Water Specialist Report in Appendix Q.
6.3.10 Groundwater
Groundwater storage and transport in the unweathered Volksrust Formation is likely to be
mainly via fractures, bedding planes, joints and other secondary discontinuities. The success
of a water supply borehole in these rocks depends on whether one or more of these
structures are intersected. In general the Volksrust Formation is considered to be a minor
aquifer, with some abstractions of local importance. A minor aquifer is a moderately-
yielding aquifer system of variable water quality. Although these aquifers seldom produce
large quantities of water, they are important for local supplies and in supplying base flow to
rivers. Figure 6.24 Illustrates the hydrogeology of the study area.
Figure 6.24: An overview of the hydrogeology of the study area.
Further detail can be obtained from the Groundwater Specialist Report in Appendix N.

Lidwala Consulting Engineers (SA) (Pty) Ltd
___________________________________________________________________________________________________ 6-47
Majuba Continuous Ashing: Final EIA Report November 2014 Chapter 6: Description of the receiving Environment DEA Reference Number: 14/12/16/3/3/3/53
NEAS Reference: DEA/EIA/0001417/2012
6.3.11 Sites of Archaeological, Historical and Cultural Interest
The cultural landscape qualities of the study area essentially consist of a rural setup. In this
setup the human occupation is made up of a pre-colonial element consisting of limited Stone
Age occupation and a Late Iron Age occupation, as well as a much later colonial (farmer)
component.
• Rural landscape
The rural landscape has always been sparsely populated and it was only during the last
couple of hundred years that people, through the application of specific economic strategies,
succeeded to occupy a section of the region for any length of time.
• Archaeological sites
Archaeological sites in this area predominantly date to the Late Iron Age, although some
sites dating to the Stone Age are also found in the larger area.
Human occupation of the larger geographical region took place since Early Stone Age (ESA)
times. This is evidenced by the scattered stone tools found in a secondary context (open
surface material), where they have been exposed in gravel terraces by rivers and streams.
Normally this material is viewed to have a low significance.
As this area was probably too cold and it does not have many rock shelters, occupation
during Stone Age times remained low, resulting in very few sites dating to this period
occurring in the area.
Iron Age people started to settle in southern Africa c. AD 300, with one of the oldest known
sites at Silver Leaves, south east of Tzaneen dating to AD 270. However, Iron Age
occupation of the eastern highveld area (including the study area) did not start much before
the 1500s. Some sites dating to the Late Iron Age is known to exist to the north west of the
study area.
As this was a period signified by high stress levels, people tended to settle in towns, usually
located on hill tops for protection. The villages were laid out in complex manner and different
areas were demarcated by stone walled enclosures.

Lidwala Consulting Engineers (SA) (Pty) Ltd
___________________________________________________________________________________________________ 6-48
Majuba Continuous Ashing: Final EIA Report November 2014 Chapter 6: Description of the receiving Environment DEA Reference Number: 14/12/16/3/3/3/53
NEAS Reference: DEA/EIA/0001417/2012
• Farmsteads
Farmsteads are complex features in the landscape, being made up of different yet
interconnected elements. Typically these consist of a main house, gardens, outbuildings,
sheds and barns, with some distance from the labourer housing and various cemeteries. In
addition roads and tracks, stock pens and wind mills complete the setup. An impact on one
element therefore impacts on the whole.
By the early 19th century white settlers took up farms. An investigation of the Title Deeds
of most of the farms in the region indicates that they were surveyed as early as the 1860s,
implying that they would have been occupied by colonists since then.
The town of Amersfoort was founded in 1876 and proclaimed in 1888. From its earliest days
it was well-known for its wealthy farmer community (Praagh 1906; Raper 2004).
Many farmsteads and even houses in Amersfoort were destroyed during the Anglo Boer
War. As a result most structures date to the period after that. The architecture of these
farmsteads can be described as eclectic as they were built and added to as required over a
period of time. In some cases outbuildings would be in the same style as the main house,
if they date to the same period. However, they tend to vary considerably in style and
materials used.
• Cemeteries
Apart from the formal cemeteries that occur in municipal areas (towns or villages), a number
of these cemeteries, some quite informal, i.e. without fencing, occur sporadically all over.
Many also seem to have been forgotten, making it very difficult to trace the descendants in
a case where the graves are to be relocated.
Most of these cemeteries, irrespective of the fact that they are for land owner or farm
labourers (with a few exceptions where they were integrated), are family orientated. They
therefore serve as important ‘documents’ linking people directly by name to the land.
• Infrastructure and industrial heritage
In many cases this aspect of heritage is left out of surveys, largely due to the fact that it is
taken for granted. However, the land and its resources could not be accessed and exploited
Lidwala Consulting Engineers (SA) (Pty) Ltd
___________________________________________________________________________________________________ 6-49
Majuba Continuous Ashing: Final EIA Report November 2014 Chapter 6: Description of the receiving Environment DEA Reference Number: 14/12/16/3/3/3/53
NEAS Reference: DEA/EIA/0001417/2012
without the development of features such as roads, bridges, railway lines, electricity lines
and telephone lines.
A variety of bridges, railway lines and other features that can be included in this category
occur within the study area.
Further detail can be obtained from the Heritage Specialist Report in Appendix O.
6.3.12 Visual Aspects
A number of farms and homesteads occur throughout the study area, and in close proximity
to the power station.
The visual character of the Majuba Power Station and its associated infrastructure is shaped
by a unique combination of the following features:
• Grassland;
• An undulating topography with isolated koppies and ridges;
• Perennial and non-perennial streams and isolated dams;
• Cultivated land;
• Majuba Power Station and associated infrastructure (being a visually dominant feature
in the area);
• Mining areas;
• Dispersed farmsteads, and
• Roads, including the N11 national road from Amersfoort to Volksrust, arterial routes
(R23, R35) and a number of access roads to farms in the region.
The closest towns are Amersfoort and Perdekop, both of which are further than
12 km from the power station, situated beyond the zone of visual influence of the proposed
continuous ash disposal facility.
The topography is an important form giving element of the landscape. On the one hand, it
opens up vast panoramic views of the landscape, and on the other hand it creates visual
barriers. The topography in the study area has a strong undulating character with hills and
koppies south and east. This is significant in terms of the location of the proposed
continuous ash disposal facility, since the topography will be the primary factor determining
the visibility and level of exposure thereof. In this regard, the screening effect of hills in
the south must be noted.

Lidwala Consulting Engineers (SA) (Pty) Ltd
___________________________________________________________________________________________________ 6-50
Majuba Continuous Ashing: Final EIA Report November 2014 Chapter 6: Description of the receiving Environment DEA Reference Number: 14/12/16/3/3/3/53
NEAS Reference: DEA/EIA/0001417/2012
Visibility of an object is one of the primary attributes by which visual impact can be
concluded. This is determined by a line of sight where nothing obscures the view of an
object. Exposure is defined by the degree of visibility, in other words “how much” or “which
part” of an object is visible to the observer. This is influenced by topography and the
incidence of objects such as trees and buildings that obscure the view partially or in total.
Visibility can be modelled by making use of a digital terrain model (DTM), created from
contour data, and performing a viewshed analysis using GIS software. It must be noted
that the viewshed analysis only accounts for topographical influences, and that the
screening effect of vegetation is not included. This indicates a worst-case scenario, where
the possibility of visual exposure is mapped, from which possible sensitive viewer locations
can be identified.
In addition to viewshed analyses as described above, a proximity analysis is required to
incorporate the effect of reduced visibility over distance. By integrating the two types of
analyses, an index of possible visual impact is generated, as shown on the map in Figure
6.25.
The map indicates a core area of high visibility and a high degree of visual exposure within
3km from the ash dam. The continuous disposal of ash in a southern direction from the
existing facility (i.e on the extended Alternative area A) is expected to impact on a number
of sensitive receptors within 3km from the site. Permanent residents within this zone have
been identified and requirements with regard to mitigation measures has been investigated.

Lidwala Consulting Engineers (SA) (Pty) Ltd
___________________________________________________________________________________________________ 6-51
Majuba Continuous Ashing: Final EIA Report November 2014 Chapter 6: Description of the receiving Environment DEA Reference Number: 14/12/16/3/3/3/53
NEAS Reference: DEA/EIA/0001417/2012
Figure 6.25: Visual exposure index for the proposed Alternative A
Further detail can be obtained from the Visual Impact Specialist Report in Appendix S.
6.3.13 Ambient Air Quality
Eskom manages an ambient air quality monitoring station near Majuba to assess impacts
on air quality from Majuba Power Station and other pollution sources in the area (data
provided with permission, for the current evaluation study, by Gerhardt de Beer, 2012-09-
06). The monitoring station is located 3 km east-south-east of the power station and is
equipped for continuous monitoring of ambient concentrations of sulphur dioxide (SO2),
nitrogen dioxide (NO2), and fine particulate matter of particulate size <10 μm in diameter
(PM10). The average daily PM10 concentrations for the period January 2009 to June 2012 are
presented in Figure 6.26.

Lidwala Consulting Engineers (SA) (Pty) Ltd
___________________________________________________________________________________________________ 6-52
Majuba Continuous Ashing: Final EIA Report November 2014
Chapter 6: Description of the receiving Environment DEA Reference Number: 14/12/16/3/3/3/53 NEAS Reference: DEA/EIA/0001417/2012
Figure 6.26: Daily measured PM10 ground level concentrations (µg/m³) at the Eskom Majuba
1 monitoring station (for the period January 2009 – June 2012)
The current National Ambient Air Quality limit value for PM10 daily concentrations
(120 µg/m3) was exceeded on two occasions during the period reported (once each in 2011
and 2012) (Table 6.13). The more stringent National Ambient Air Quality limit for PM10
daily concentrations effective from 1 January 2015 (75 µg/m3) would have been exceeded
once each in 2009 and 2010, and twice in 2011. In the first six months of 2012 the more
stringent 75 µg/m3 limit value was exceeded on six occasions resulting in non-compliance
with the PM10 2015 National Ambient Air Quality Standard (NAAQS), which allows for four
daily limit value exceedances. The more stringent standard is mentioned because the
operational phase of the proposed Majuba ash disposal facility will continue after the
standard becomes enforceable.

Lidwala Consulting Engineers (SA) (Pty) Ltd
___________________________________________________________________________________________________ 6-53
Majuba Continuous Ashing: Final EIA Report November 2014 Chapter 6: Description of the receiving Environment DEA Reference Number: 14/12/16/3/3/3/53
NEAS Reference: DEA/EIA/0001417/2012
Table 6.13: Measured daily ambient PM10 concentrations at Eskom’s Majuba 1 monitoring
station for the period 2009 to 2011
Monitorin
g Period
Data
Availability
(%)
Number of
Exceedances
of the NAAQ
limit of
120 µg/m³
(applicable
immediately)
Exceedance
of the NAAQS
(applicable
immediately)
(Y/N)
Number of
Exceedances
of the NAAQ
limit of
75 µg/m³
(applicable
2015)
Exceedance
of the NAAQS
(applicable
2015) (Y/N)
2009 86 0 N 1 N
2010 82 0 N 1 N
2011 30 1 N 2 N
High ambient particulate concentrations have been found to coincide with low ambient
temperatures and low rainfall (Burger, 1994). Increases in domestic coal burning and poor
atmospheric dispersion potentials, together with persistent industrial emissions, combine to
produce elevated ambient concentrations during winter months. High concentrations during
summer months are usually associated with increases in fugitive dust emissions. Rainfall
events result in a reduction of airborne concentrations due to reductions in the potential for
fugitive dust emissions and due to the removal of particulates in the atmosphere by
raindrops.
Further detail can be obtained from the Air Quality Specialist Report in Appendix I.
6.3.14 Social Environment
The town of Amersfoort was established in 1888 around a Dutch Reformed Church which
was built in 1876. The area was first settled in 1876 when two farmers of the area donated
land to the church, where Rev. Frans Lion Cachet proceeded to build a Dutch Reformed
church. The new village was named after the hometown (in the Netherlands) of the Dutch
farmers. When the area became too small for the growing village, more land was purchased
from one of the original donors and the town was proclaimed in 1888. The bridge over the
Vaal River was built in 1896 and is a national monument. The township of eZamokuhle lies
adjacent to the town and contributes greatly to its economy.
The history of Volksrust began in 1888 when the Transvaal government decided to establish
a town on the edge of the Drakensberg escarpment, on the border of Natal. A place was
chosen near where the Boers won a decisive battle in first Anglo-Boer War (December 1880
– March 1881) to regain their independence from the British. Several farms were bought for

Lidwala Consulting Engineers (SA) (Pty) Ltd
___________________________________________________________________________________________________ 6-54
Majuba Continuous Ashing: Final EIA Report November 2014 Chapter 6: Description of the receiving Environment DEA Reference Number: 14/12/16/3/3/3/53
NEAS Reference: DEA/EIA/0001417/2012
the purpose and named Volksrust (People’s Rest) presumably by Dorie de Jager (sister of
Dirk Uys) because the Transvaal forces rested there after the Battle of Majuba. Today the
town is a commercial centre of which the main products are maize, wool, sorghum,
sunflower seed, beef and dairy. The town is the junction for the main Johannesburg-Durban
railway line with other towns in the eastern part of Mpumalanga.
Perdekop was established due to an equine sickness epidemic during the second Anglo-Boer
war. The people realised that the higher altitude protected the animals from the epidemic
and a settlement was established there due to the fact that it was a safe haven from the
epidemic.
The socioeconomic analysis is specifically aimed at spatial related matters, i.e.
demographics, employment and income and economic profile. The 2006 Demarcation Board
Data have been utilised. It must be borne in mind that with the 2006 Municipal elections
certain ward changes came about. In the case of Pixley Ka Seme Local Municipality an extra
ward was created. The figures were appended by the Municipal Demarcation board in
conjunction with Statistics South Africa.
• Demographics
Table 6.14 below gives an indication of the different geographic areas within the Pixley Ka
Seme Local Municipality as well as the wards within which these areas are situated. The
number of households is also indicated.
Table 6.14: Ward Demographic areas and number of households
Demographic Area Ward Number of Households
Vukuzakhe 1-2 2600
Volksrust 3-4 3421
Wakkerstroom & eSizameleni 5 1832
Perdekop & Siyazenzela 6 2253
Amersfoort 7 1565
Ezamokuhle 8 1794
Daggakraal & Sinqobile 9-11 4946
TOTAL 18 412

Lidwala Consulting Engineers (SA) (Pty) Ltd
___________________________________________________________________________________________________ 6-55
Majuba Continuous Ashing: Final EIA Report November 2014 Chapter 6: Description of the receiving Environment DEA Reference Number: 14/12/16/3/3/3/53
NEAS Reference: DEA/EIA/0001417/2012
• Population Estimates
Population estimates for Pixley ka Seme Local Municipality are reflected in Table 6.15 below
and includes the total number of people.
Table 6.15: Population and Household Status Quo
Formal
Households
2006
Informal
Households
2006
Traditional
Household
2006
Population
Census
2001
Population
2% growth
2001-2008
Pixley ka
Seme LM 10 524 5 475 2 001 80 737 91 091
Table 6.16: Population Distribution per ward
Wards 2007 Black /
African Coloured
Indian /
Asian White
Total
Persons
1 7 454 8 0 106 7 568
2 4 996 23 0 0 5 019
3 7 425 221 131 1 927 9 704
4 3 901 20 182 1 603 5 706
5 8 442 22 37 466 8 967
6 11 323 49 25 722 12 119
7 4 261 0 95 452 4 808
8 8 675 29 4 181 8 882
9 7 095 0 0 13 7 100
10 10 983 19 5 146 11 153
11 10 020 19 0 16 10 055
Total 84 575 410 477 5 628 91 091
Table 6.17: Population Size and Number of Households
Population Number of Households (HH) HH
Density
(2007) 1996 2001 2007
Annual
Growth 1996 2001 2007
Pixley ka
Seme LM 71 653 77 565 91 091 2.5% 14 912 19 305 22 627 4.03
Gert
Sibande DM 823 973 856 214 981 569 1.7% 179 534 228 256 258 798 3.79
Mpumalanga 3 143
918
3 442
199
3 680
733 1.6% 674 875 832 070 969 997 3.79
National 41 780
470
45 145
618
47 963
626 1.3%
9 370
586
11 364
451
13 043
694 3.68

Lidwala Consulting Engineers (SA) (Pty) Ltd
___________________________________________________________________________________________________ 6-56
Majuba Continuous Ashing: Final EIA Report November 2014 Chapter 6: Description of the receiving Environment DEA Reference Number: 14/12/16/3/3/3/53
NEAS Reference: DEA/EIA/0001417/2012
• Level of Education
The level of education for the population in the study area is reflected in Table 6.18 below.
Table 6.18: Level of Education in Pixley Ka Seme Local Municipality
Level of Education Pixley Ka Seme Local
municipality
Gert Sibande District
Municipality
None 11.97% 25.39%
Grade 0-2 10.49% 32.89%
Grade 3-6 9.87% 31.07%
Grade 7-9 8.70% 27.80%
Grade 10-11 7.21% 26.91%
Less than Grade 12 8.25% % 22.78
Grade 12 only 6.53% 24.92%
Certificate/Diploma 7.19% 24.54%
Bachelor’s Degree 7.96% 24.02%
Postgraduate Degree 8.31% 25.22%
• Only 6,53% of the population has completed education up to the level of Grade 12 which
is better than that of the district municipality.
• 97% of the population has no qualification (it is noted that infants and children less than
5 years are excluded from this figure) which is a better situation than that of the district
municipality.
• Only 7.96% of the population has a bachelor’s degree which is much lower than the
percentage in the district municipality
• Economic:
o Employment
The analysis of employment levels in the study area are reflected as the economically active
part of the population, the inactive part, the unemployed and the people living in poverty
(total household monthly income < R 1 100-00).
The percentage of the economically active part of the total population for each year is also
indicated in brackets and the same with the inactive part of the population. The unemployed
part of the population and the people living in poverty is already included in the Inactive
part of the population and therefore the percentage represents the percentage of the
inactive population that is unemployed or living beneath the bread line.

Lidwala Consulting Engineers (SA) (Pty) Ltd
___________________________________________________________________________________________________ 6-57
Majuba Continuous Ashing: Final EIA Report November 2014 Chapter 6: Description of the receiving Environment DEA Reference Number: 14/12/16/3/3/3/53
NEAS Reference: DEA/EIA/0001417/2012
Table 6.19: Employment within the Pixley ka Seme Local Municipality
Area 2005 2006 2007 2008
Economically active
(% of population)
21 053
(23.7%)
21 314
(23.6%)
21 657
(23.7%)
22 455
(24.4%)
Inactive
(% of population)
67 857
(76.3%)
68 835
(76.4%)
69 560
(76.3%)
69 755
(75.6%)
Unemployed
(% of Inactive pop.)
5 053
(24%)
4 902
(23%)
4 981
(23%)
4 940
(22%)
People in poverty
(% of population)
52 314
(58.8%)
49 805
(55.3%)
49 209
(53.9%)
47 811
(51.9%)
Total population 88 910 90 149 91 216 92 210
The information above indicates that an alarming number of the population is inactive and
not contributing to the economy of the municipality. However, this figure also includes
infants and scholars which cannot contribute to the economy.
o Income
The distribution of the income in the municipal area is another indication of growth for
development. The levels of income under the bread line indicate the growth of poverty in
the municipal area and ultimately make a difference in the provision of housing and other
facilities.
A poor household can be defined as a household with no basic services or without a house
(a home) and with a total household monthly income of less than R 1 100-00. The following
table provides a breakdown of the monthly income groups in the municipal area for the year
2008 as defined by Global Insight Southern Africa.
Table 6.20: Monthly Income in Pixley ka Seme Local Municipality
Income Range
Households
Global
Insight 2008
%
R 0-200 109 0.5%
13.1% R 201- R 500 439 1.9%
R 501- R 1 000 2 443 10.7%
R 1001 – R 1 500 2 810 12.3% 41%
R 1 501 – R 3 500 6 571 28.7%
R 3 501 – R 6 000 4 050 17.7%
R 6 001 – R 11 000 2 646 11.6%
R 11 001 – R 30 000 2 489 10.9%

Lidwala Consulting Engineers (SA) (Pty) Ltd
___________________________________________________________________________________________________ 6-58
Majuba Continuous Ashing: Final EIA Report November 2014 Chapter 6: Description of the receiving Environment DEA Reference Number: 14/12/16/3/3/3/53
NEAS Reference: DEA/EIA/0001417/2012
R 30 001 – R 50 000 767 3.4%
R 50 001 – R 100 000 414 1.8%
R 100 001 – R 200 000 127 0.6%
R 200 001 and more 30 0.1%
TOTAL 22 895 100%
The above table indicates that 13.1% of the households in Pixley Ka Isaka Seme Local
Municipality fall within the income group earning less than R 1000-00 per month which can
be considered as poor households that will qualify for grants and housing subsidies. A further
41% of the households earn between R 1000-00 and R 3 500-00 per month which can also
be considered as a very low level of income and grants and subsidies will also apply to these
households. Therefore a total of 54.1% of the households falls within the lower income
group which indicates that more than half of the households in the municipal area are in
need of government support in some or other way. It further indicates that more than half
of the households will probably not be able to pay for basic services and needs to be
subsidised by the remaining households who will be able to afford basic services the
municipality provides.
o GVA Contribution to the Local Economy
The municipality has many different economic sectors that contribute to the economy of the
area and the district and ultimately the province and the country. These sectors include
agriculture, mining, manufacturing, electricity, construction, trade, transport, finance and
community services.
The following table provides a summary of the different economic sectors that contributes
towards the local economy.
Table 6.21: Economic sectors and contribution to the GVA of the municipality
Economic Sector GVA added(R 1000) Contribution to total
Agriculture R 176 647 18.85%
Mining R 8 656 0.92%
Manufacturing R 14 176 1.51%
Electricity R 100 610 10.74%
Construction R 66 027 7.05%
Trade R 152 990 16.33%
Transport R 144 773 15.45%
Finance R 106 148 11.33%
Community Services R 167 009 17.82%
Total R 937 036 100%

Lidwala Consulting Engineers (SA) (Pty) Ltd
___________________________________________________________________________________________________ 6-59
Majuba Continuous Ashing: Final EIA Report November 2014 Chapter 6: Description of the receiving Environment DEA Reference Number: 14/12/16/3/3/3/53
NEAS Reference: DEA/EIA/0001417/2012
The results from the above table indicate that the agricultural sector contributes the most
to the GVA of the municipal area with community services and trade as the second and third
highest contributors. The transport, finance and electricity sectors contributes between 10%
and 15% to the GVA of the municipal area with the mining sector contributing the least to
the economy of the municipal area.


![Application by Glencore Coal Pty Ltd [2016] ACompT 6 Web viewApplication by Glencore Coal Pty Ltd [2016] ACompT 6. Review from: THE DECISION BY THE COMMONWEALTH TREASURER UNDER SUBSECTION](https://img.pdfslide.net/doc/110x75/5a76d41f7f8b9a63638d8a52/application-by-glencore-coal-pty-ltd-2016-acompt-6-a-doc-fileaa-web.jpg)