Embed Size (px)
Citation preview
ARTS Transportation Vision 2040 179
6 Transportation System Needs Assessment 6.1 Introduction
Once every five years the Long Range Transportation Plan (LRTP) for the Augusta Regional
Transportation Study (ARTS) is updated. A major task of ARTS is the update of the LRTP through
the identification of existing transportation conditions, issues and needs; and recommending
strategies and system improvements (i.e., solutions) that enhance livability in the ARTS planning
area. The public was invited to become involved in this process during a series of Speaker Bureau
sessions and Community Meetings held throughout the ARTS planning area during February‐
March 2015; or participate in an online Community Transportation Survey (posted on the ARTS
website) during March‐April 2015.
This report presents the analysis results of transportation issues and needs (affecting both
motorized and non‐motorized transportation modes) identified through the: 1) Transportation
Vision 2040 public outreach campaign (February‐April 2015), Community Meetings and Speaker
Bureau sessions; 2) Online Community Transportation Survey; 3) Travel Demand Modeling of the
ARTS, planning a real transportation network; 4) Public Transit Surveys (Augusta Public Transit
and Best Friend Express); 5) Congestion Management Process; and the 6) incidence of traffic
crashes (at intersections and corridors) in the ARTS planning area.
The issues and needs identified have reduced potential levels of mobility and accessibility within
the ARTS planning area for pedestrians and non‐motorized, motorized and freight transportation
system users. If left unresolved, the economic vitality of the region may be negatively impacted.
The identification of critical transportation issues and potential solutions to address them (i.e.,
needs) was the heart of the ARTS public participation process.
ARTS Transportation Vision 2040 180
6.2 Methodology Identifying Issues and Needs
A summary of the six (6) methods used to identify transportation issues and needs are presented
below.
6.2.1 Community Meetings
ARTS actively conducted a series of 17 community meetings concerning the Transportation Vision
2040 LRTP update, which were held at strategically selected locations during the month of March
2015. The objectives of the community meetings were: 1) introduce ARTS, its role and functions
to the local community; 2) present the current status of the Transportation Vision 2040 LRTP; 3)
hear issues the public identify as transportation issues and needs in their communities; and 4)
solicit public input on regional transportation needs, projects and strategies in order to help
define and evaluate year 2040 LRTP projects. 102 persons attended these meetings.
6.2.2 Speakers Bureau Meetings
During the months of January through March 2015, ARTS staff addressed 12 Speaker Bureau
meetings. Speaker Bureau presentations were promoted to any community, business, faith
based or social service organization within the ARTS planning area. These sessions allowed ARTS
staff to speak directly to public or private organizations about the LRTP update or metropolitan
transportation planning process. An estimated 318 people attended these Speaker Bureau
sessions.
6.2.3 Community Meetings and Speaker Bureaus
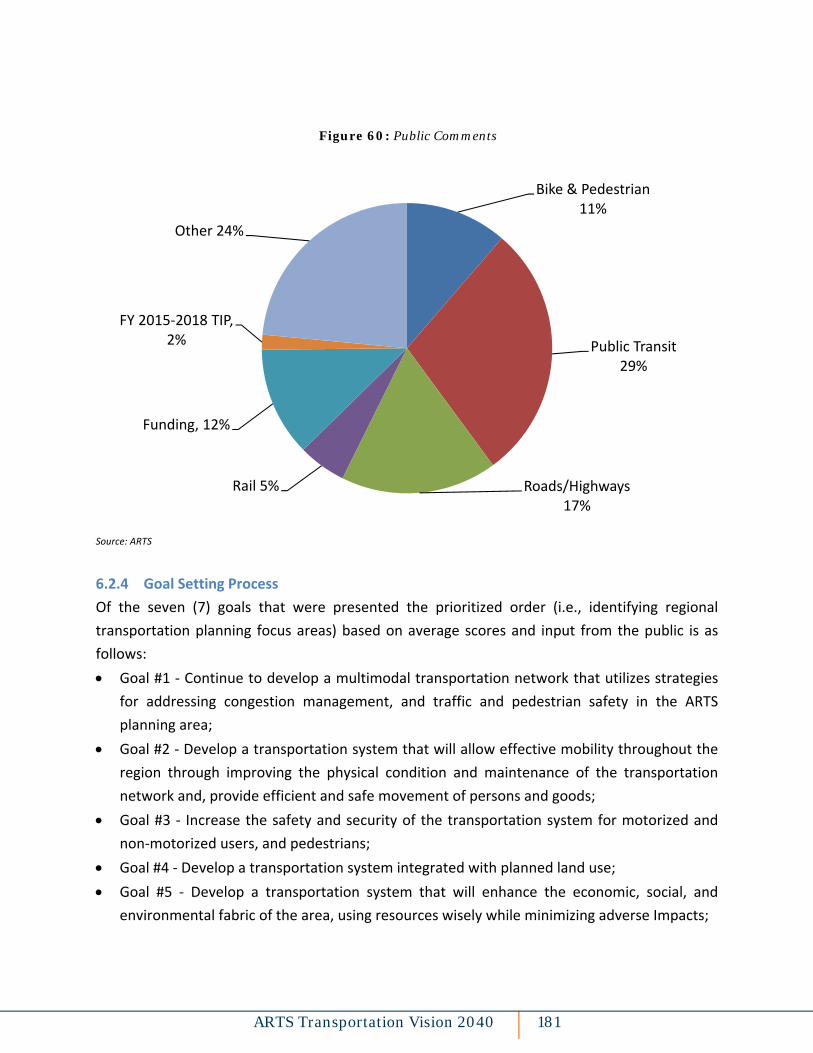
It became evident that the top three (3) key themes arising at the Community Meeting were: 1)
Funding transportation; 2) Roads/Highways; and, 3) Public Transit. Funding of transportation as
an indirect theme dominated many Community Meeting discussions. Attendees at Community
Meetings who put forward questions or comments relating to enhancing transportation and
mobility choices, e.g., transit, bike and pedestrian facilities; became aware that the availability of
local funds and willingness to fund by local residents, ultimately determines the choice of
transportation modes in communities. The questions are resulting from comments as referenced
in the Public Participation and Community Meeting Report (Figure 60).
ARTS Transportation Vision 2040 181
Source: ARTS
6.2.4 Goal Setting Process
Of the seven (7) goals that were presented the prioritized order (i.e., identifying regional
transportation planning focus areas) based on average scores and input from the public is as
follows:
Goal #1 ‐ Continue to develop a multimodal transportation network that utilizes strategies
for addressing congestion management, and traffic and pedestrian safety in the ARTS
planning area;
Goal #2 ‐ Develop a transportation system that will allow effective mobility throughout the
region through improving the physical condition and maintenance of the transportation
network and, provide efficient and safe movement of persons and goods;
Goal #3 ‐ Increase the safety and security of the transportation system for motorized and
non‐motorized users, and pedestrians;
Goal #4 ‐ Develop a transportation system integrated with planned land use;
Goal #5 ‐ Develop a transportation system that will enhance the economic, social, and
environmental fabric of the area, using resources wisely while minimizing adverse Impacts;
Bike & Pedestrian 11%
Public Transit 29%
Roads/Highways 17%
Rail 5%
Funding, 12%
FY 2015‐2018 TIP, 2%
Other 24%
Figure 60: Public Comments
ARTS Transportation Vision 2040 182
Goal #6 ‐ Promote efficient land use and development patterns to improve safety and
economic vitality to meet existing and future multimodal transportation needs; and
Goal #7 ‐ Develop a transportation system that is financially and politically feasible and has
broad support.
6.2.5 Online Community Transportation Survey
An online version of the ARTS Transportation Vision 2040 Travel Behavior Survey (Community
Transportation Survey) was uploaded on Monday March 9, 2015. The survey sought to obtain a
wide range of information relating to the perceptions of the regional transportation system,
issues and needs, from the public. Questions also sought to evaluate the respondent’s level of
agreement regarding a particular transportation issue. From the initial date of upload which was
from Monday, March 19, 2015, to April 30, 2015, approximately 689 responses were received.
The online survey closed on April 30, 2015.
6.2.6 Travel Demand Modeling
A Travel Demand Model (TDM) is a computer model used to assess current trip making and travel
behavior as well as predict future travel behavior and travel demand based on certain inputs and
assumptions. Required TDM inputs range from population, employment and school enrollment
data as well as current traffic flow levels on the highway network. The ARTS travel demand model
is built and managed by a consultant under contract to the Georgia Department of Transportation
(GDOT).
TDMs are highly complex and not only model demand for road trips (i.e., by car, motorcycle, van
or truck) and the routes they take between origin and destination, but are also capable of
modeling transit demand. The capability of ARTS TDM is to assess future traffic scenarios enabling
the identification of potential highway bottlenecks or links with high volume to capacity ratios.
The application of TDM in the Transportation Vision 2040 LRTP update process assists ARTS
stakeholders in making informed decisions about how best to address any transportation need
identified.
6.2.7 Public Transit Surveys
A survey of Augusta Public Transit (APT) passengers was conducted over a 9‐day period in March
and April 2015. Similarly, a survey of passenger riding Best Friend Express (BFE) was conducted
over a 5‐day period in April and May 2015. The objectives of the transit surveys were as follows:
1) Determine where and when customers use transit; 2) Define who uses transit; 3) Gauge how
satisfied customers are with the services provided; 4) Determine why customers use transit; and

ARTS Transportation Vision 2040 183
5) Gain insight to identify conditions, issues, needs and future improvements from the transit
user’s (i.e., transit customer) perspective. All 10 fixed routes of APT and 3 routes of BFE were
surveyed. Overall, a total of 662 riders (599 APT and 63 BFE) participated in the onboard transit
surveys.
Identified needs and challenges relating to Public Transit are listed as:
The majority of public transit riders, ride during the AM peak or morning period.
The majority of public transit riders come directly from home.
The majority of public transit riders in the ARTS planning area walk to the bus stop to
commence their transit trip.
The primary destination of transit riders in the ARTS planning area is work related.
The majority of riders in the ARTS planning area walk from the bus stop to their final
destination.
The majority of public transit riders surveyed do not have a car/truck/van available to
make trips.
The majority of public riders surveyed have trip travel times of 30 minutes or less.
The majority of APT and BFE riders wait for up to 15 minutes for a bus.
APT BFE ARTS Public Transit
Time waiting for the bus Time waiting for the bus Time waiting for the bus
Convenience of route On-time Performance Convenience of routes
On-time Performance Convenience of routes On-time Performance
Fifty percent or more of public transit riders in the ARTS planning area do not possess a
valid drivers’ license.
More than 40% of riders use fixed route public transit bus services five or more days per
week in the ARTS planning area.
The majority of public transit riders in the ARTS planning area have annual household
incomes of $10,000 or less.
In order of priority, the top issues for the 662 transit riders surveyed (based on the
number of comments received) were:
APT BFE ARTS Public Transit
Extended Operations Saturday/Sunday Operation Extended Operations
Higher Frequency, Bus Scheduling & Timing Increase Routes
Higher Frequency, Bus Scheduling & Timing
Increase Routes Higher Frequency, Bus Scheduling & Timing Increase Routes

ARTS Transportation Vision 2040 184
Respondents were asked to state the year they were born. Of the 599 APT respondents, 30%
declined to answer this question, compared to 29% of BFE respondents. The age breakdown for
the remaining 419 APT and 45 BFE respondents surveyed is presented in. The majority of APT
respondents (94%) were of working age, i.e., 18‐64, compared to 91% BFE respondents. Only 1%
of APT respondents surveyed were younger than 18 years, compared to zero percent of BFE
respondents. Elderly respondents 65 years and older accounted for 5% and 9% riding APT and
BFE.
Of the 599 APT respondents who completed the transit survey, 539 (or 90%) disclosed their
ethnicity, compared to 57 (90%) of the 63 BFE respondents. APT or BFE respondents could select
one of five (5) ethnic/racial categories; namely: American Indian/Alaskan Native; Asian;
Black/African American; Hispanic/Latino; or White. Blacks/African Americans were the majority
users of APT services (79%); followed by respondents who identified themselves as White at 9%.
Similarly Blacks/African Americans were the majority users of BFE services (56%); followed by
respondents who identified themselves as White at 28%.
6.2.8 CongestionManagementProcessSurveyManaging traffic congestion is a daily challenge in urban areas where the motorized vehicle is the
primary mode of transportation. The Congestion Management Process (CMP) seeks to improve
transportation system performance and reliability by reducing the adverse impacts of congestion
on the movement of people and goods. Identifying congested corridors, intersections, or road
segments, CMP can be used to assess alternative strategies reducing congestion that meet
community needs.
6.2.9 Traffic Crash Incidents Analysis
Identifying intersections and corridors within the ARTS planning area with a high incidence of
crashes necessitated the analysis and mapping of traffic crash data. Traffic crash data for the
years 2010 through 2013 were received from GDOT and the South Carolina Department of Public
Safety (SCDPS). According to the raw data, between 2010 and 2013 there were approximately
64,232 reported traffic crashes in the four‐county ARTS planning area. Of the total 64,232 crashes
approximately 260 (0.4%) were fatal (i.e., a crash resulting in the death of one or more persons
within 30 days of the crash).
ARTS Transportation Vision 2040 185
6.2.10 Traffic Safety Challenges
Safety has always been a vital component of the long range transportation planning process.
MAP‐21, Georgia’s 2013 Statewide Strategic Transportation Plan, and South Carolina’s 2040
Multimodal Transportation Plan influenced a key Transportation Vision 2040 goal to be focused
on safety. Public input received from Speaker’s Bureaus, Community Meetings, transit and online
surveys; crash data analysis and ongoing ARTS programs such as the Congestion Management
Process Surveys; all contributed to identify transportation safety deficiencies prevalent in the
ARTS planning area. Safety related issues, challenges and needs in the ARTS planning area are
listed as follows.
6.2.11 High Traffic Volumes
High traffic volumes on major roadways during morning or afternoon peak times make it a
challenge to cross streets safely for pedestrians and bicyclists. Principal arterials in the ARTS
planning area, high traffic volume routes connecting major activity centers (e.g., downtowns,
commercial centers) with the interstate system; are also routes with a high number of crash
incidence. High traffic volumes may also contribute to congestion, characterized by stop‐go
traffic which in turn may decrease the level of safety for road users. Gratuitous lane‐changing or
inattention in congested conditions increase the possibility of rear‐end crash. Slow moving traffic
may tempt pedestrians to cross in‐between vehicles rather than at crosswalks.
6.2.12 Bicycle and Pedestrian Crashes
Lack of sidewalks, marked bicycle lanes, connectivity and crosswalks all have influenced the level
of safety afforded to pedestrians and bicyclists in the ARTS planning area. According to Tables 15
and 16, 51 pedestrian crashes and 30 bicycle crashes occurred in 2013. During this same period
6 bicyclists and 6 pedestrians died as a result of these crashes. Pedestrian and bicycle crash
locations have occurred on arterials, collectors and local roads indicating that all routes should
accommodate to some level all road users. The promotion of walking and bicycling as a healthy
lifestyle choice and a viable mobility option to motor vehicle, providing a safe and secure
traveling environment will enhance community livability while meeting Transportation Vision
2040 goals.

ARTS Transportation Vision 2040 186
6.2.13 Inadequate Safety controls on major streets and railroad crossings
Major thoroughfares throughout the ARTS planning area lack safe crosswalk areas. At several
signalized intersections pedestrian phases are limited or non‐existent forcing pedestrians to cross
hurriedly against multiple lanes of traffic. At other locations wide roadways necessitate that
pedestrians cross in stages, from one sidewalk to a center refuge and from center refuge to the
opposite sidewalk. With the possibility of an extended wait at at‐grade rail crossings, impatient
drivers may try to outrun a train in order to cross or circumvent the barriers.
6.2.14 Pedestrian Accessibility and Safety
Strip malls, bus stops, office complexes and other activity centers lack adequate sidewalks forcing
pedestrians and bicyclists who need to access these developments to walk or bicycle in the
roadway. Crosswalks if available may be located at some distance from where the pedestrian
desires to cross; resulting in pedestrians and bicyclists taking unwarranted risks when crossing
roadways.
Limited Transportation Options in Growing Suburban Residential Developments Rapidly growing
suburban residential areas where many residents drive have influenced the high incidence of
traffic crashes on roads connecting these areas. Limited transportation options in these areas
have exacerbated the need to own a vehicle which in turn increases the numbers of multi‐vehicle
households. Access to several suburban residential developments in the ARTS planning area
often requires travel along CMP corridors some of which experience Seriously Congested (SC)
conditions. Example corridors used as access routes to/from suburban residential developments
include: Richland Avenue and Chesterfield Street (Richland Avenue CMP Corridor, Aiken County);
Washington Road and Davis Road (Washington Road CMP Corridor, Columbia County); and
Washington Road and Fury’s Ferry Road (Washington Road CMP Corridor, Richmond County).
With the car/truck or van continuing to be the dominant mode of transportation in the ARTS
planning area together with the drive towards accommodating multi‐modalism there will be a
constant need to provide more efficient and safer facilities for all users of the transportation
system. It therefore becomes necessary that our transportation system be made as safe,
accommodating, accessible and as efficient as possible.

ARTS Transportation Vision 2040 187
6.2.15 TravelBehaviorSurveyIdentified needs and challenges from more than 1,000 respondents who completed the Travel
Behavior Survey are listed as, Appendix F:
The lack of sidewalks and bike lanes are very important issues to survey respondents in
the ARTS planning area.
The car, truck or van is the dominant means of transportation for ARTS residents.
Very few people in the ARTS planning area used APT services.
Very few people in the ARTS planning area used BFE services.
Very few people in the ARTS planning area used APT services.
Majority of survey respondents expressed neutral satisfaction with the regional
transportation system.
“Do you agree with the following critical transportation issues in your community?”
Local traffic congestion;
Traffic safety;
Lack of sidewalks
“What transportation improvements do you think are needed in your community?”
Online At Meetings
Sidewalks Sidewalks
Road/highway widening Public transit service
Bike lanes Bike lanes
“ShouldthefollowingissuesbeimportantfortheARTStransportationsystem?”
Online At Meetings
Physical condition of major road streets and highways Access to sidewalks and crosswalk areas
Flow of traffic on major streets during morning or afternoon peak times Safety controls on major streets & railroad crossings
Safety controls on major streets & railroad crossings Availability of public transit services
ARTS Transportation Vision 2040 188
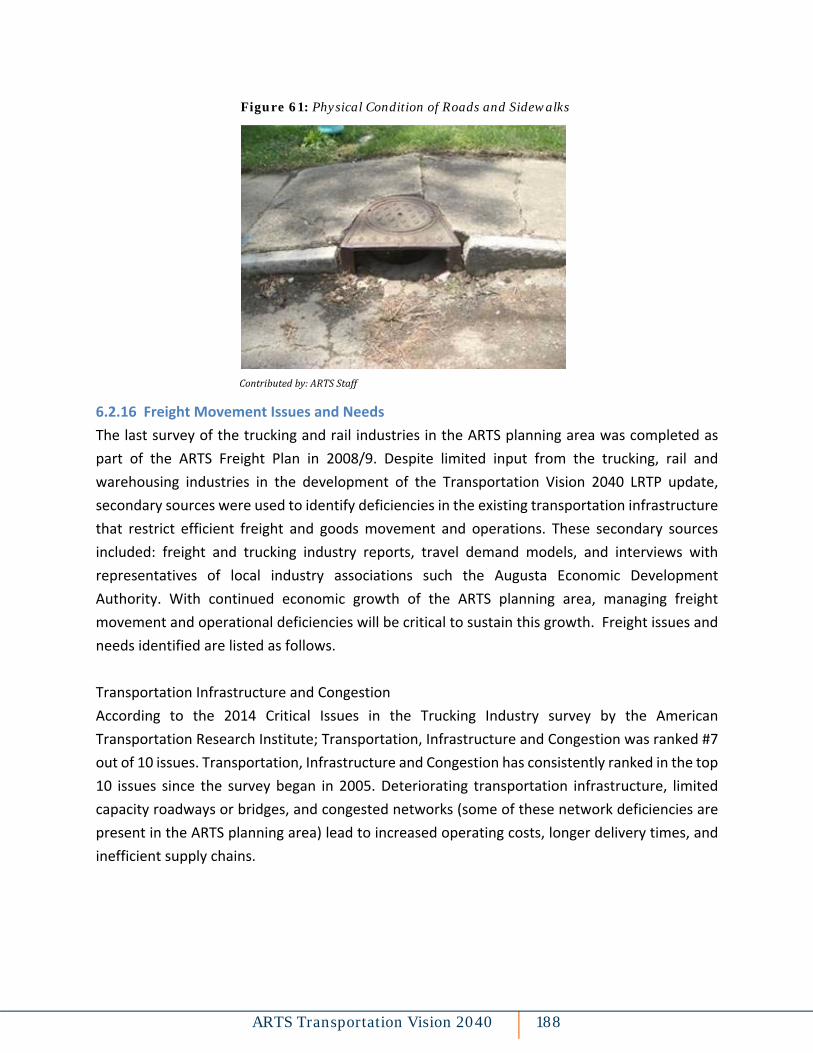
Contributedby:ARTSStaff
6.2.16 Freight Movement Issues and Needs
The last survey of the trucking and rail industries in the ARTS planning area was completed as
part of the ARTS Freight Plan in 2008/9. Despite limited input from the trucking, rail and
warehousing industries in the development of the Transportation Vision 2040 LRTP update,
secondary sources were used to identify deficiencies in the existing transportation infrastructure
that restrict efficient freight and goods movement and operations. These secondary sources
included: freight and trucking industry reports, travel demand models, and interviews with
representatives of local industry associations such the Augusta Economic Development
Authority. With continued economic growth of the ARTS planning area, managing freight
movement and operational deficiencies will be critical to sustain this growth. Freight issues and
needs identified are listed as follows.
Transportation Infrastructure and Congestion
According to the 2014 Critical Issues in the Trucking Industry survey by the American
Transportation Research Institute; Transportation, Infrastructure and Congestion was ranked #7
out of 10 issues. Transportation, Infrastructure and Congestion has consistently ranked in the top
10 issues since the survey began in 2005. Deteriorating transportation infrastructure, limited
capacity roadways or bridges, and congested networks (some of these network deficiencies are
present in the ARTS planning area) lead to increased operating costs, longer delivery times, and
inefficient supply chains.
Figure 61: Physical Condition of Roads and Sidewalks

ARTS Transportation Vision 2040 189
Demonstrating the linkage between freight movement and network deficiency Figure 5 illustrates
the Strategic Freight Highway Network/Designated Freight Corridors in relation to roadway LOS
(2010). Key points from Figure 5 are:
Sections of the I‐520 between Wrightsboro Road and Deans Bridge Road experience LOS
D, E & F. According to the 2010 base year counts, these sections are also the most highly
trafficked sections in the ARTS planning area.
• Only one section of the I‐20 experiences LOS D, E or F, and that is between Wheeler Road
and Belair Road. High levels of traffic and the change from a 6‐lane interstate (that is 3
lanes in each direction) to a 4‐lane interstate has degraded LOS on this section of the I‐
20.
• Interstate exit‐ and on‐ramps to and from the arterial road network are locations
experiencing LOS D, E or F. Most notably, I‐20/Belair Road, I‐20/Riverwatch Parkway, I‐
20/W. Martintown Road, I‐520/Wrightsboro Road, I‐520/Gordon Highway and I‐
520/Mike Padgett Highway. The intersection of arterials and the interstate system are
also locations of high traffic crashes.
Connectivity and Safety
The lack of a direct interstate connection between the ARTS planning area and Macon GA,
Savannah GA, Charleston SC and Greenville SC; necessitates that freight movements between
these centers use the arterial highway network such as US 1 Georgia, US 25 Georgia, and US 278
South Carolina. Arterial roads accommodating these movements may experience an increase in
trucking volumes and congestion. The I‐20 and I‐520 are the designated interstate routes for
trucking operations to, from and within the ARTS planning area. The increased mixing of truck
and auto traffic from these designated interstate routes to arterials may also give rise to concerns
about traffic safety and noise pollution.
At‐Grade Rail Crossings and Traffic Delay
The ARTS planning area is crisscrossed by numerous at‐grade railroad crossings. According to
data from the FRA Office of Safety Analysis there are 221, 33, 70 and 238 at‐grade railroad
crossings in Aiken, Columbia, Edgefield and Richmond Counties respectively. Many of these at‐
grade railroad crossings are in non‐urban areas. However, freight trains using at‐grade crossings
intersecting high volume roadways in urbanized areas can cause substantial delays to traffic.
Extended traffic delays >10 minutes during the AM or PM peak periods are not uncommon
particularly at downtown at‐grade crossings.

ARTS Transportation Vision 2040 190
At‐Grade Rail Crossings and Traffic Safety
Inadequately maintained or poorly paved at‐grade crossings have been known to contribute to
vehicle damage. Members of the general public interviewed as part of the ARTS Freight Plan in
2008/9 expressed this complaint. With the possibility of an extended wait at at‐grade crossings,
impatient drivers may try to outrun the train in order to cross. Driver inattention, disregard of
rail crossing safety devices, or simply miscalculating the train’s speed or distance can result in a
crash at the at‐grade crossing. Several crashes of this type have occurred in the ARTS planning
area. The safety component of Transportation Vision 2040 goals includes safety improvements
at at‐grade rail crossings.
Limiting Rail Infrastructure
A current deficiency in some sections of the rail network in the ARTS planning area is the non‐
accommodation of double‐stack railcars, 286K railcars weighing up to 110 tons or railcars in
excess of 19 ft. in height. The current defined railcar height for fully unrestricted clearance is 22
ft. 6 inches.
6.3 Multimodal Transportation Strategies
Multimodal improvements recommended in the LRTP are developed from a variety of strategies
that are acknowledged to improve the multimodal transportation network. The following
chapters present recommended improvements based on the issues and needs that are found in
the general strategies identified below. In many instances, strategies have the ability to address
multiple issues and needs. These strategies are also meant to connect to the overarching goals
of ARTS.
The list below provides a brief description of the strategies used as a basis for the improvements.
A more detail discussion of the issues, needs and strategies are outlined in the Issues and Needs
Report.
6.3.1 Highway and Road
Since highways and roads facilitate travel by the predominant mode of vehicular traffic,
improvements on the road network have the potential to impact a larger amount of travelers.
An efficient and effective roadway network is critical to support the region’s economy, quality of
life, mobility, social equity, and promote livable communities. Roadways serve not only freight
and passenger vehicles, but also public transit, bicycling, and pedestrian networks.
ARTS Transportation Vision 2040 191
The projected growth in the region will undoubtedly lead to increase vehicle miles traveled (VMT)
throughout the network. This increase will lead to capacity constraints, increasing the deficiency
of the roadway. Improving the design of the roadway increases the ability of vehicles to move
freely and safely through a corridor. It is important to consider the context‐specific needs of a
corridor at the design phase to ensure the most efficient and effective mobility improvement.
6.3.1.1 Geometric Changes, Widening, or Capacity Improvements
Geometric Changes or Widening: Such strategies involve the physical change of the roadway in
terms of its horizontal or vertical alignment. Physical strategies mitigating congestion may include
the addition or reconfiguration of turning lanes, lane widening, and the realignment of
intersecting streets. Other strategies may include the removal of a physical constriction that
delays travel, e.g., widening the space between bridge abutments or eliminating a sight barrier.
Costs may vary but can be substantial depending on the extent of physical change required.
Capacity improvements serve to allow effective movement of persons and goods throughout the
region and can partially tackle congestion.
6.3.1.2 Traffic Operational Improvements
Traffic Operational Improvement involves a plethora of engineering based strategies that address
congestion. Traffic surveillance and control systems, motorist information systems, traffic control
centers, computerized signal systems are some of the tools used in mitigating congestion along
local roads. Other engineering strategies such as road widening, alternative route development,
channelization, bottleneck removal, variable speed limits and computerized signal systems are
implementation strategies local jurisdiction can use to relieve congestion.
Traffic operational improvements allow effective movement of persons and goods throughout
the region, increases the safety and security for users, and addresses congestion.
6.3.2 Airport Connectors
Planning for the future and constructing needed airside and landside improvements is important
for each of the three airports situated in the ARTS planning area. Ground access to each of these
airports will be critical to their continued success. Ground access improvements are also
dependent on the projected growth and subsequent increase in passenger landside traffic. The
draft Master Plan Update for Augusta Regional Airport was completed March 2015. Currently, at
Augusta Regional Airport there is an adequate amount of curb frontage with no constraints
restricting ground access improvements anticipated in the foreseeable future.
ARTS Transportation Vision 2040 192
6.3.2.1 Context Sensitive Solutions (CSS)
Context Sensitive Solutions or CSS is a collaborative, interdisciplinary approach that involves all
stakeholders in providing a transportation facility that fits its unique setting. An approach leads
to preserving and enhancing scenic, aesthetic, historic, community, and environmental
resources, while improving or maintaining safety, mobility, and infrastructure conditions. It is
part of the design of transportation projects from, programming, environmental studies, design,
construction, operation, and maintenance, including long range planning.
Context Sensitive Solutions enhances the economic, social, and environmental fabric of the area,
promotes efficient land use, and increases safety and security of users.

ARTS Transportation Vision 2040 193
Figure 62: Need for Context Sensitive Design Solution
Location:BayvaleElementarySchoolContributedby:WALCInstitute
6.3.3 Public Transit
The availability of public transportation adds additional mobility options to residents, workers,
and visitors. Many times, public transportation serves as the only available transportation mode
for citizens to commute large distances. Limiting the mobility of citizens hinders their economic
opportunity as well as personal and social activities. The sporadic and low‐density development
patterns throughout the ARTS planning area can make public transit planning difficult. Innovative
ways to improve service in a cost effective manner is necessary.
Public transportation strategies will provide everyone an opportunity to find employment,
improve mobility and access to transportation options as well as revitalize neighborhoods within
ARTS. In a presentation provided by USDOT titled Creating Ladders of Opportunity: USDOT’s
Efforts to Increase Access for the Future22F
23, improvements to local transportation provide three
invaluable benefits:
Connect: A multimodal transportation system provides people with reliable and
affordable connections to employment, education, and other critical services. Planning
transportation networks that provide low‐cost reliable options enables more people to
realize their economic potential and improves businesses’ access to a diverse workforce.
Work: Transportation projects create jobs, both in constructing projects and operating
them. Through thoughtful workforce programs— built in partnership with industry, and
232015DOTCivilRightsVirtualSymposium.SpeakingwithOneVoice:ConnectingtheDOTs

ARTS Transportation Vision 2040 194
with a focus on disadvantaged businesses— we can help more underserved people find
and keep good jobs in the transportation sector.
Revitalize: Transportation infrastructure can have a dramatic impact on neighborhoods
and regions. It can provide support for healthy main street centers and direct more
equitable business and residential developments designed to bring everyone closer to
opportunities.
Public transit is critical in the region, especially in ARTS Environmental Justice areas. The Unified
Planning Work Program (UPWP) is the primary implementation tool. It is used to ensure all
minorities and low‐income residents’ transportation needs are addressed. Regular activities
conducted through the UPWP include:
Collecting building permit data used to monitor changes in residential units and
occupancy.
Using Department of Labor information to develop annual estimates of employment by
place of work.
Conducting socioeconomic analysis at Traffic Analysis Zones (TAZ).
Documenting and improving upon community outreach and engagement for minority and
low‐income residents.
These activities are conducted regularly to ensure everyone is connected to transportation
options, opportunities for employment and improved mobility through revitalized
neighborhoods.
Public Transit allows for effective mobility through the region and provides efficient movement
of persons and goods, enhances the economic, social, environmental fabric of the area, and
addresses congestion and air quality issues.
6.3.4 AugustaPublicTransitTransit improvements and strategies proposed by APT for implementation can be listed as:
Expand weekday service to 10pm in 2016 and possibly Saturday. However, the
introduction of Sunday service currently is not a priority project.
Initiate a Comprehensive Operational Analysis (COA) during the first half of 2016. COA is
an in‐depth study of a transit system designed to identify strengths and weaknesses, and
develop recommendations for improvement.

ARTS Transportation Vision 2040 195
Expand APT bus fleet by ten (10) buses and reduce bus headway. With 10 new buses, APT
fleet will have 28 buses for regular mainline transit services. This will enable two (2) buses
on each route, reducing bus headway to 30 minutes from current 60 minutes.
Introduce one or two new routes with one of these routes serving South Augusta. This
initiative is consistent with the Augusta Public Transit Development Plan
recommendation in 2009.
Completely replace bus shelters. Average cost of bus shelter is approximately $4,000‐
$5,000 with an upwards cost of $10,000.
Proposed bus and transit stop amenities include:
ADA accessible
Trash cans
Advanced fare box technology
Sidewalk approaches
Solar powered
Rebranding of APT. Communication/marketing students at Georgia Regent’s University
(GRU) could be approached to assist with rebranding.
Develop the APT rural service to become a feeder service connecting with mainline APT
services. Although expansion of the paratransit bus network may be possibility, if the
realignment of mainline routes is successful there may not be a need for an increase in
the number of paratransit buses.
Form partnerships with local businesses and community agencies.
Explore how APT can positively impact blighted communities in Augusta. Providing transit
service to underserved areas may stimulate socio‐economic regeneration and
revitalization.
Upgrade of the Kmart transfer center through :
Replacement of shelter (this may take 4‐5 months)
Signage improvement (such as bus stops and wayfinding information) throughout
Richmond County
Security improvement
Beautification of immediate surroundings
Lighting improvement
Introduce a Travel Training Program that enables seniors to be able understand how to
use transit. Once seniors know how to get around using transit, more will use transit
services.
Engage in better data collection through working with the City of Augusta Information
Technology Department. This may also include upgrading the APT website.

ARTS Transportation Vision 2040 196
The downtown circulator project as recommend in the Transit Development Plan may
become a reality with the relocation of the Broad Street Transfer Center.
Investigate the relocation of the Broad Street Transit Center.
Upgrade the Kmart Transfer Center.
The Richmond County Emergency and Transit Vehicle Preemption System is a TIA funded project
that is set to be implemented during 2015‐2018. This system is a component of the Master Plan
for ATMS in Richmond County that will result in improved operational efficiency of the transit
system.
6.3.5 Best Friend Express
Transit improvements and strategies proposed by BFE (or programmed in the South Carolina
Statewide Plan for Lower Savannah) for implementation can be listed as:
Add 5 ADA compatible vehicles
Add 5 motor vehicles
Replace and Upgrade Technology
Upgrade Transit Facility
Upgrade Vehicle storage facility
Initiative replacement of 20 vehicles
Replace technology and invest in security software upgrade
Enhance safety and security of operations and facilities
Add 8 drivers
Add 2 dispatchers
Expand 5311 to 5 days of operation
Expand 5310
Extend bus operating hours
Enhance ADA offerings and riding experience
Expand to NE Aiken County
Restore Saturday service
ARTS Transportation Vision 2040 197
6.3.6 Bike Racks on Buses
Most buses operating in the ARTS planning area are equipped with bike racks, a strategy that
improves multimodal connectivity between all travel modes. Each bus is equipped a bike rack
carrying two bikes. Installing bike racks on buses enables travelers to consider transit as a viable
mobility option, potentially, increasing transit ridership. The availability of bike racks on buses
widens the transit catchment area, particularly in low density areas. For example, cyclists
traveling to and from a bus stop may reside or work more than a 1/4 mile, which is typically
maximum walking distance to a transit stop. Public transit may be used by cyclists to access
dedicated bike paths in community recreational areas. Bike racks on buses also permit one‐way
commuting for those workers traveling after bus operating hours. Improving multimodal mobility
options, the availability of bike racks on buses eliminates barriers, increasing accessibility and the
attractiveness of public transit for all travelers.
6.3.7 Regional Express Transit
Express transit across large regions provides citizens with an alternative mode of transportation
to the automobile. A highly utilized express system has the ability to decrease the amount of
vehicles on the roadway, increasing the overall efficiency. Many times these services are linked
to key commercial or residential clusters as well as large transportation hubs, such as park and
rides and public transit transfer facilities.
Regional express transit allows for effective mobility through the region and provides efficient
movement of persons and goods, enhances the economic, social, environmental fabric of the
area, and addresses congestion and air quality issues.
6.3.8 Bicycle and Pedestrian Improvements
Bicycle and Pedestrian Improvements are essential to address roadway traffic and congestion.
Allowing for and promoting non‐motorized travel alleviates demands placed on local road
networks by providing bicyclists and pedestrians a safe and secure means of travel along public
spaces. Augusta Regional Transportation Study (ARTS) currently has a Regional Bicycle and
Pedestrian Plan for the area in place.
Bicycle and Pedestrian Improvements can provide effective mobility through the region, enhance
the social and environmental fabric of the area, increase safety and security of users, and address
congestion and air quality issues.
ARTS Transportation Vision 2040 198
6.3.9 Congestion Management
6.3.9.1 ITS and ATMS
Intelligent Transportation Systems (ITS) or Advanced Traffic Management Systems (ATMS) use
the latest computerized technology to monitor and control traffic. Through use of cameras,
regulating traffic signals and speed sensors; local jurisdictions can manage emergency vehicle
response times to incidents that occur throughout their area, enhance traffic flow and reduce
congestion. This also involves the coordination of Law Enforcement, Fire, and Rescue, Medical
Services Transportation, Public Safety Communications, Emergency Management, and Traffic
Information Media. ITS and ATMS allow for effective and efficient movement of persons and
goods, increases the safety and security of users, and addresses congestion and air quality issues.
6.3.9.2 Transportation Demand Management
Transportation Demand Management or Travel Demand Management, commonly referred to as
TDM, are policies that reduce the demand placed on the transportation system using car or van
pooling strategies, and rideshare programs. Alternative approaches, such as telecommuting and
alternative work schedules are also incorporated into TDM strategies, as well as parking
management and employer paid transit passes. U.S. Department of Transportation, Federal
Highway Administration Office of Operations also recommends TDM as the preferred way of
addressing congestion as part of their 21st Century Operations using 21st Century Technology,
one lane in each direction.
TDM strategies may also include Educational Outreach programs. Such programs may target
population groups that may be incentivized to use alternative travel modes to the motor car.
Travel training programs targeted at seniors or persons with disabilities enable these groups
regain travel independence through the use of transit. From a regional perspective, all transit
buses that operate in the ARTS planning area are to be equipped with bike racks. Buses equipped
with bike racks allow cyclists to broaden their area of travel by accessing all transit buses
operating in the ARTS planning area. Benefits of this TDM strategy reduce commuting costs and
improves personal health when compared to travel by personal car.
Transportation Demand Management when integrated with planned land use, will allow for
effective mobility throughout the ARTS planning area, and addresses congestion and air quality
issues.
ARTS Transportation Vision 2040 199
6.3.10 High Occupancy Vehicle (HOV) lanes
High Occupancy Vehicle (HOV) lanes: are used throughout the federal highway system all across
the country. It reserves certain lanes along highways and expressways for vehicles with two or
more occupants, allowing them a separate lane from single vehicle occupants. This strategy is
presented as a high priority unfunded project for I‐20 between Louisville Road and Riverwatch
Parkway.
High Occupancy Vehicles allow for effective mobility through the region and provides efficient
movement of persons and goods, and addresses congestion.
6.3.11 Land Use and Transportation
Development of land and the growth in transportation demand are undeniably linked, affecting
one another. Coordinating land use and transportation planning can enhance the resources of
the area and lead to more sustainable communities. Land uses that tend to foster a balance of
mixed uses, such as commercial, housing, and recreational activities, have the ability to offer
citizens a greater amount of transportation options.
Land Use and Transportation connection promotes efficient land use and development patterns,
is financially and politically feasible, allows for effective mobility and efficient movement of
persons and goods, increases safety and security of users, and addresses congestion and air
quality issues.
6.3.11.1 Access Management
Access Management is best used on all manner of roadways to help manage access and egress
to and from property. This strategy applies to all local and major roadways including highways
and major arterials. Signal spacing, right‐of‐way access to highways, streetscapes, median
treatment and two‐way left turn lanes, driveway location, spacing, and design are some of the
techniques used to implement access management.
Access management strategies allow for effective movement of persons and goods throughout
the region, integrates with surrounding land uses, increases safety and security for users, and
addresses congestion.

ARTS Transportation Vision 2040 200
6.3.12 Age‐Friendly Design
The ARTS planning area, similar to many of the communities in the United States, has an
increasing life expectancy and a large portion of citizens reaching retirement age. Many of these
aging citizens continue to be active and engaged in the community‐ many times being the most
active members of a community. However, with increased age comes the demand for an urban
environment that meets the changing mobility needs of this growing population.
By focusing on an age‐friendly design of the transportation network that encompasses all ages,
ARTS can ensure citizens can maintain an active, safe, and healthy lifestyle throughout all
communities. Particular focus is spent on ensuring ADA compliance, not only through
transportation projects that enhance mobility such as public transit, bicycle and pedestrian
facilities, but also on development that ensures citizens can “age‐in‐place” through mobility in
homes, businesses, and recreational opportunities.
Age‐Friendly Design integrated with planned land use, allows for effective mobility of users,
increases the safety and security of users, and enhances the economic, social, and environmental
fabric of the area.
Figure 63: Need for Complete Streets
Location:EllisStreetdowntownAugusta,GA.Contributedby:ARTSStaff

ARTS Transportation Vision 2040 201
6.3.12.1 Complete Streets
Complete Streets is now a standard transportation planning practice. This strategy involves the
designing of local streets to incorporate all modes of travel and streetscapes that are designed
with bicycle, pedestrian, car, and public transit in mind. Many state Departments of
Transportation have formally adopted Complete Street Policies encouraging local jurisdictions to
do the same.
Complete Streets promotes efficient land uses and development patterns, increases safety and
security of users, enhances economic and environmental fabric of the area, and addresses
congestion and air quality issues.
Figure 64: Need for Complete Streets
Contributedby:ARTSStaff
6.4 Regional Transportation Improvements
6.4.1 Summary
The primary purpose of this report has been to provide a comprehensive understanding of
transportation needs within the ARTS planning area. This report also presents strategies and
transportation improvements that can address identified needs as well as support the
Transportation Vision 2040 goals. Through an extensive public outreach program, analysis of the
existing transportation system conditions, and the identification of current and programmed
projects; a series of recommended strategies and improvements have been put forward.
Anticipated growth in population and highway traffic in a financially constrained environment
will necessitate the need to consider alternative resources and efficient transportation options.
Transportation improvement projects presented in this plan will contribute to the fulfillment of
Transportation Vision 2040 goals while strengthening the economic vibrancy and livability of the
ARTS planning area (Table 39).
ARTS Transportation Vision 2040 202
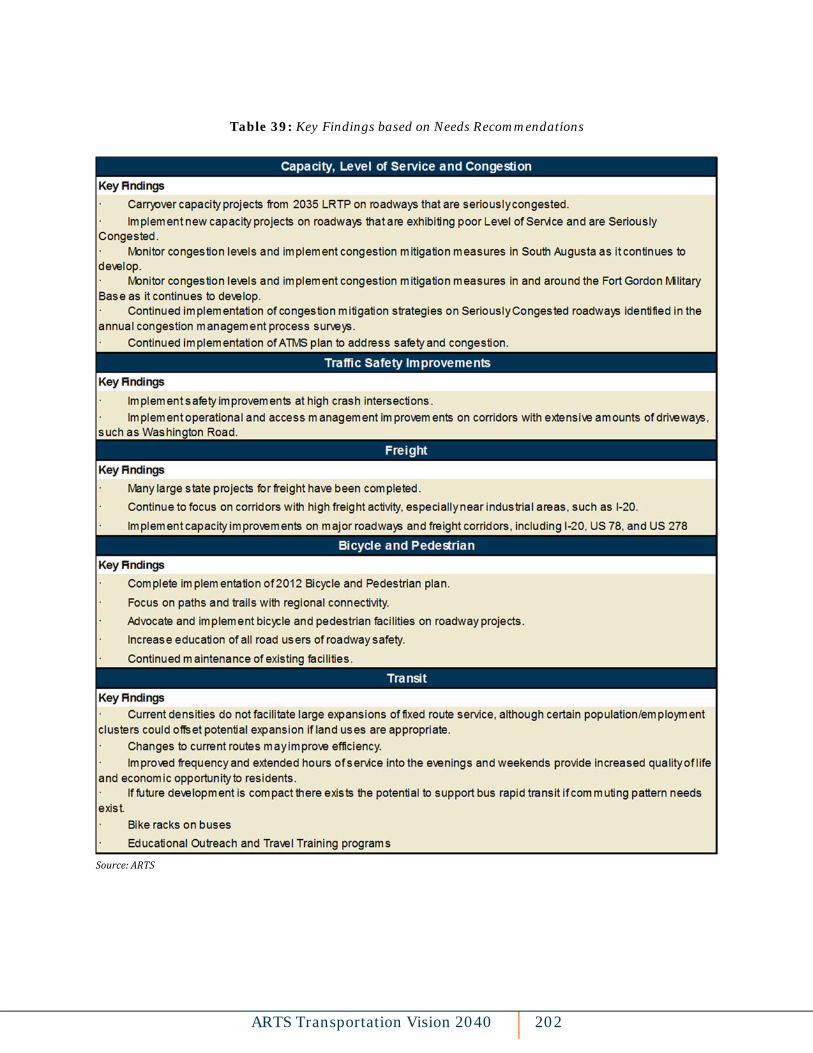
Table 39: Key Findings based on Needs Recommendations
Source:ARTS