Embed Size (px)
Citation preview
63
6. Travel Time and Trip Length
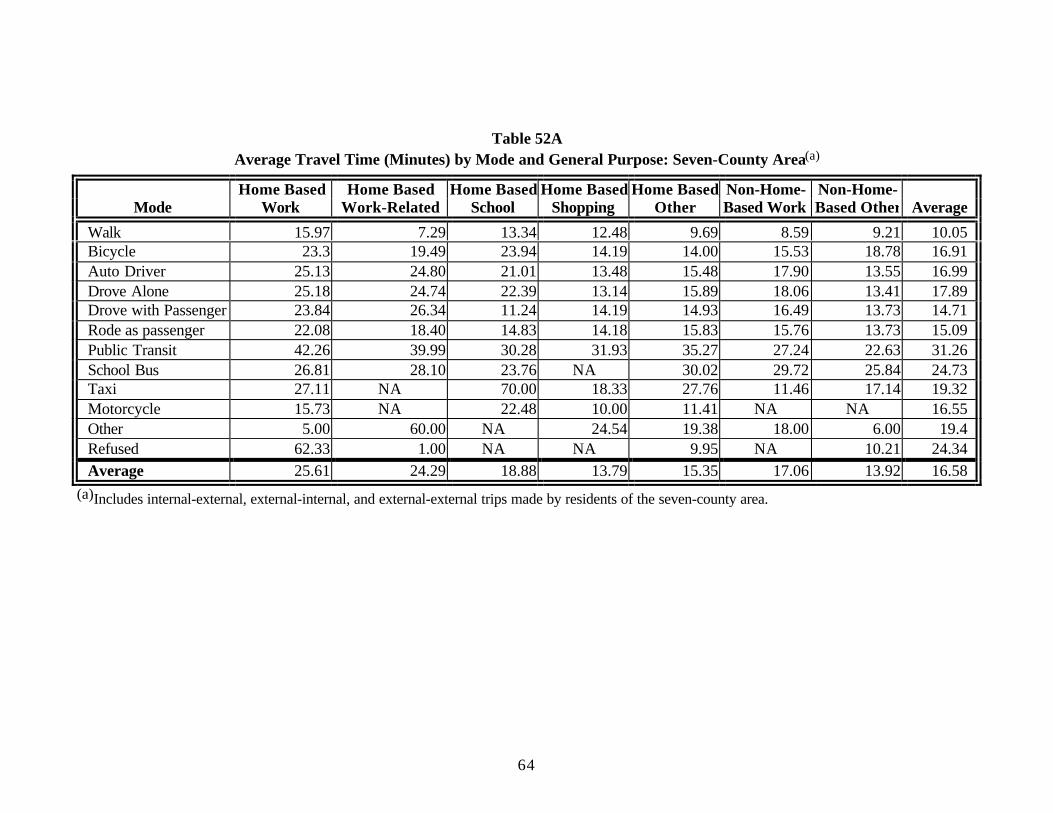
• The average travel time for all trips in the region is 16.6 minutes. Among the trip purposes, Home Based Work trips are the longest, at 25.6 minutesand Home Based Shopping are the shortest, at 15.4 minutes. (Table52A)
• Auto passenger trips are slightly shorter than auto driver trips (15.1 minutes versus 17 minutes.) Public transit trips are 31.3 minutes long. (Table52A.)
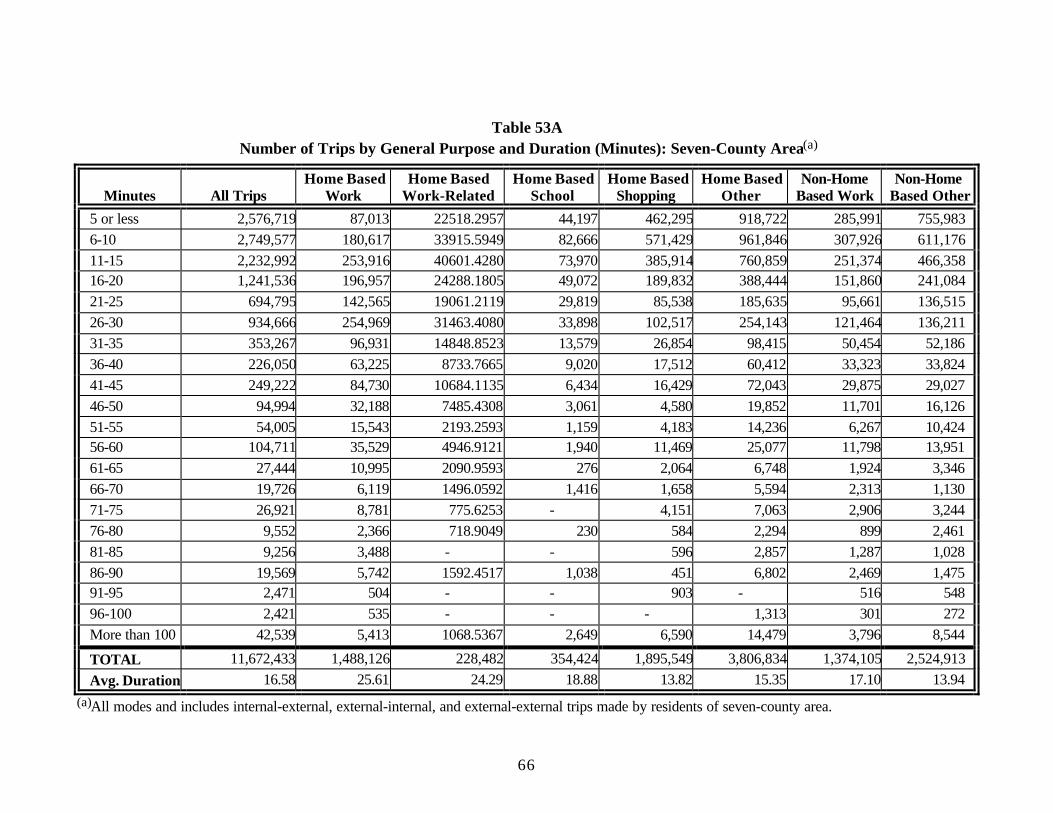
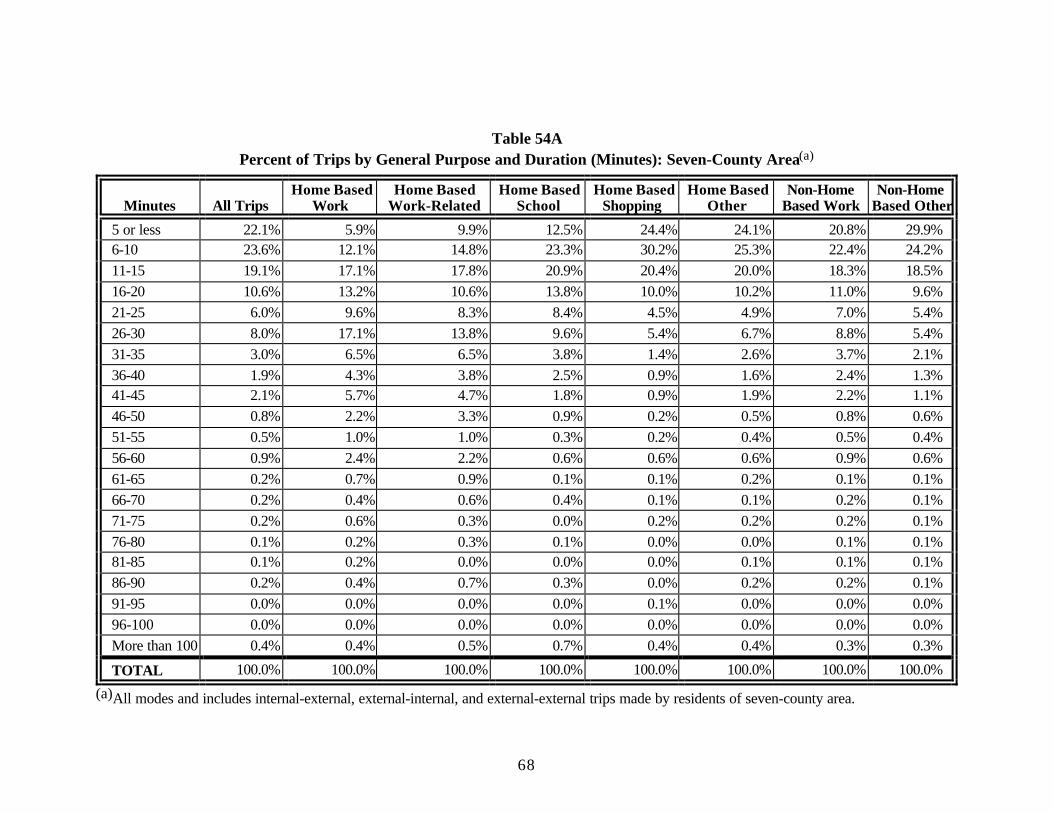
• A fifth of all trips (22.1%) are five minutes or less in length. These trips average 3.9 minutes in length. (Table 54A.)
• Nearly half of all trips (45.7%) are 10 minutes or less in length. These trips average 6.5 minutes in length. (Table 54A.)
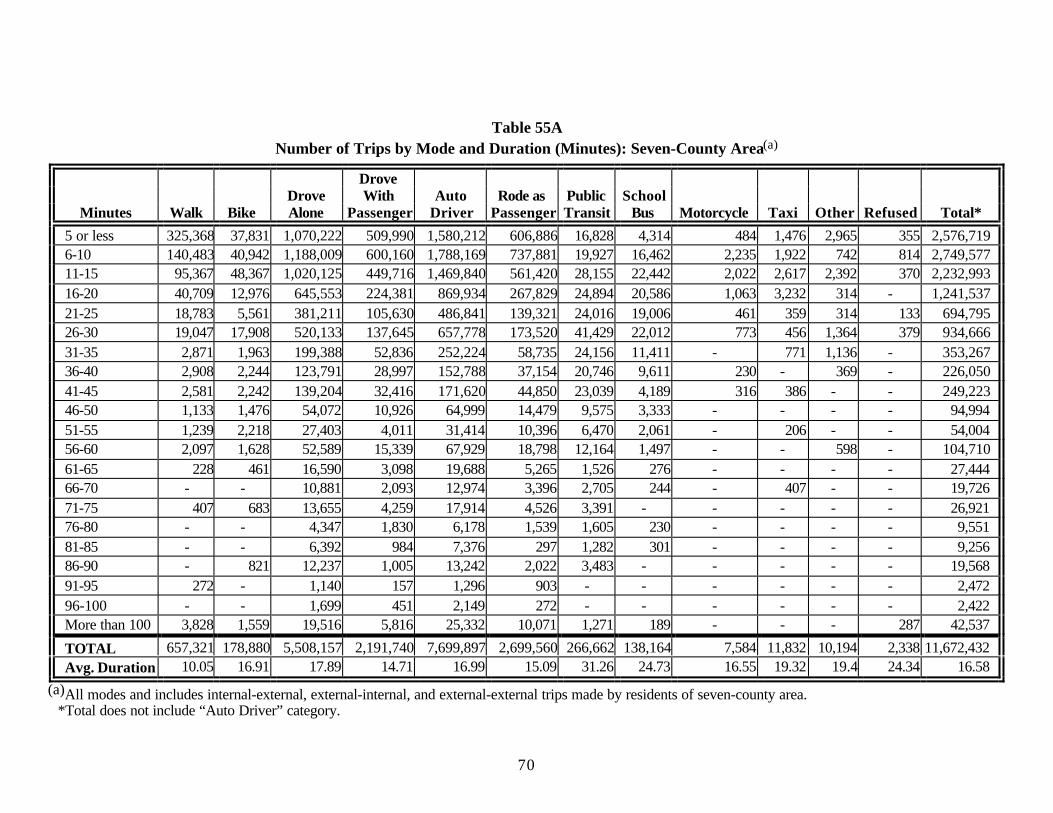
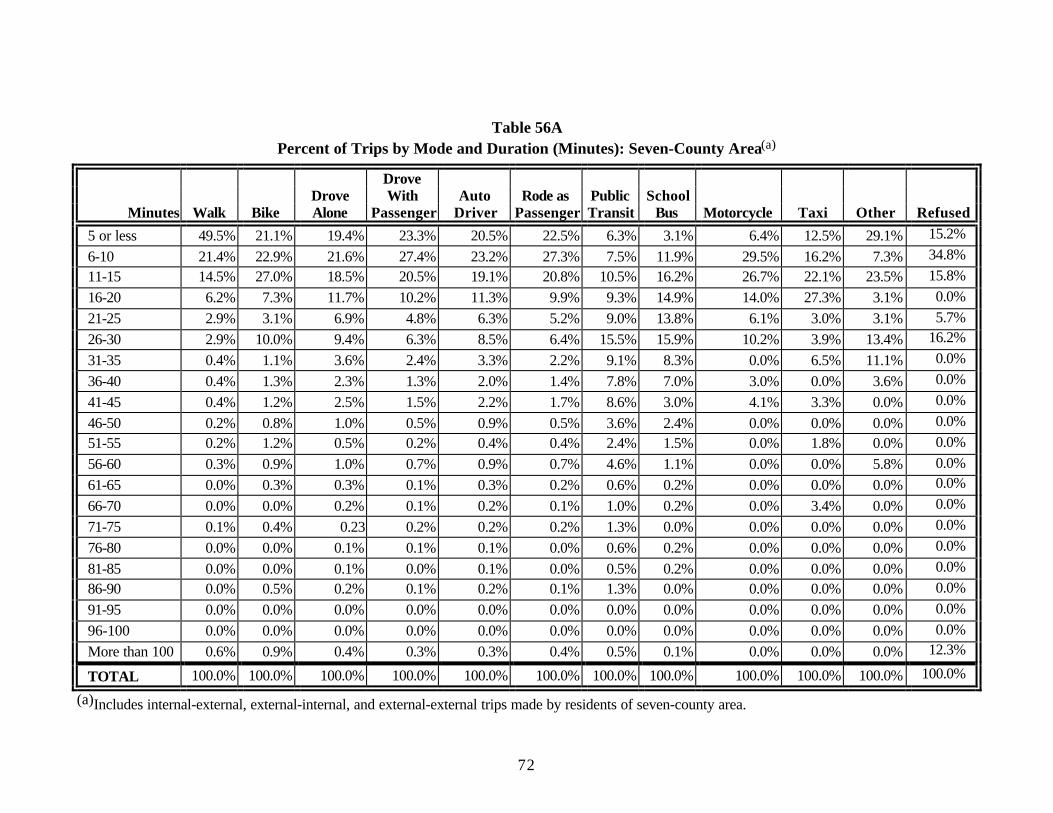
• Three-fourths of all trips (75.4%) are 20 minutes or less in length. One-third (33.6%) of transit trips are 20 minutes or less. (Table 54A and Table56A)
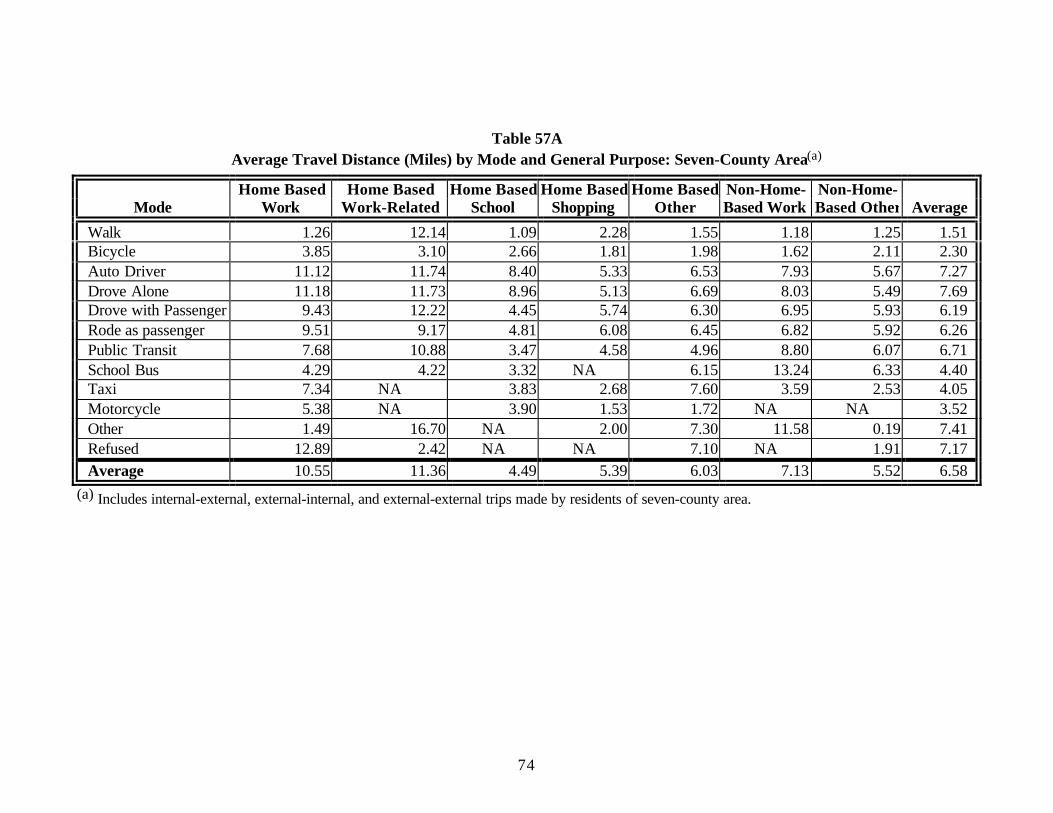
• The average travel distance for all trips made by residents of the region is 6.6 miles. Among the trip purposes, Home Based Work-Related are thelongest, at 11.4 miles and Home Based School trips are the shortest, at 4.5 miles. (Table 57A)
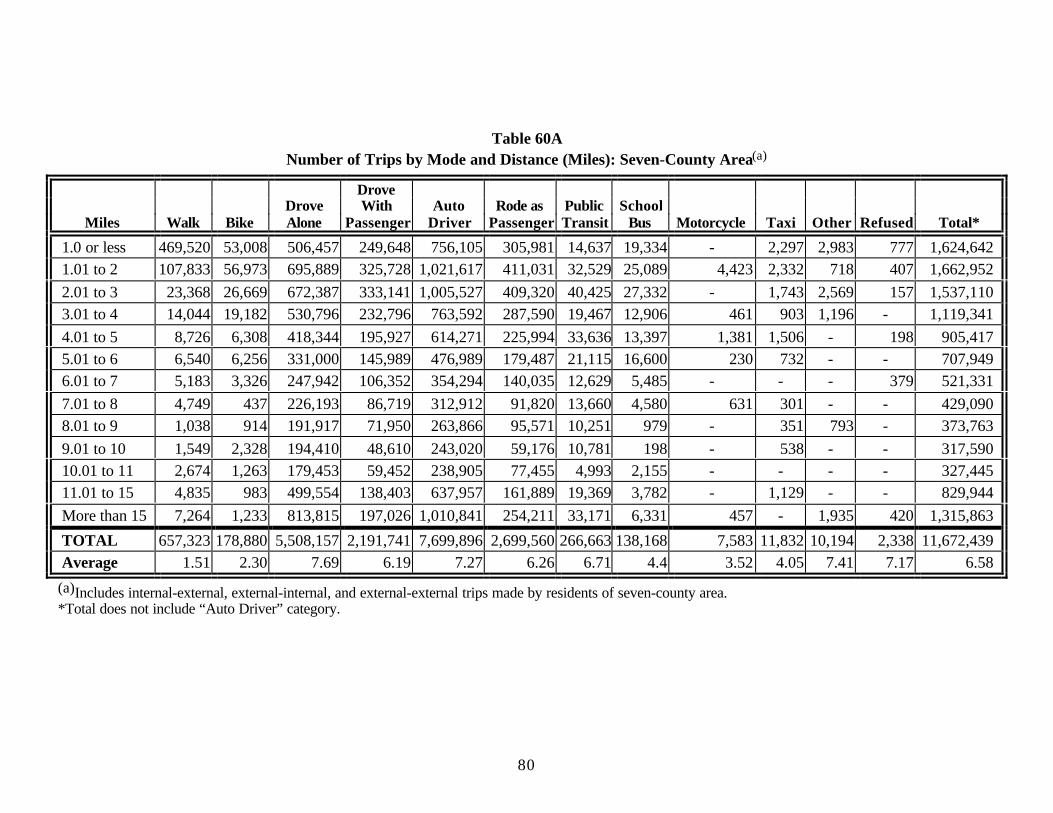
• Auto driver trips are longest, at 7.27 miles, and motorcycle trips are shortest, at 3.52 miles (Table 57A)
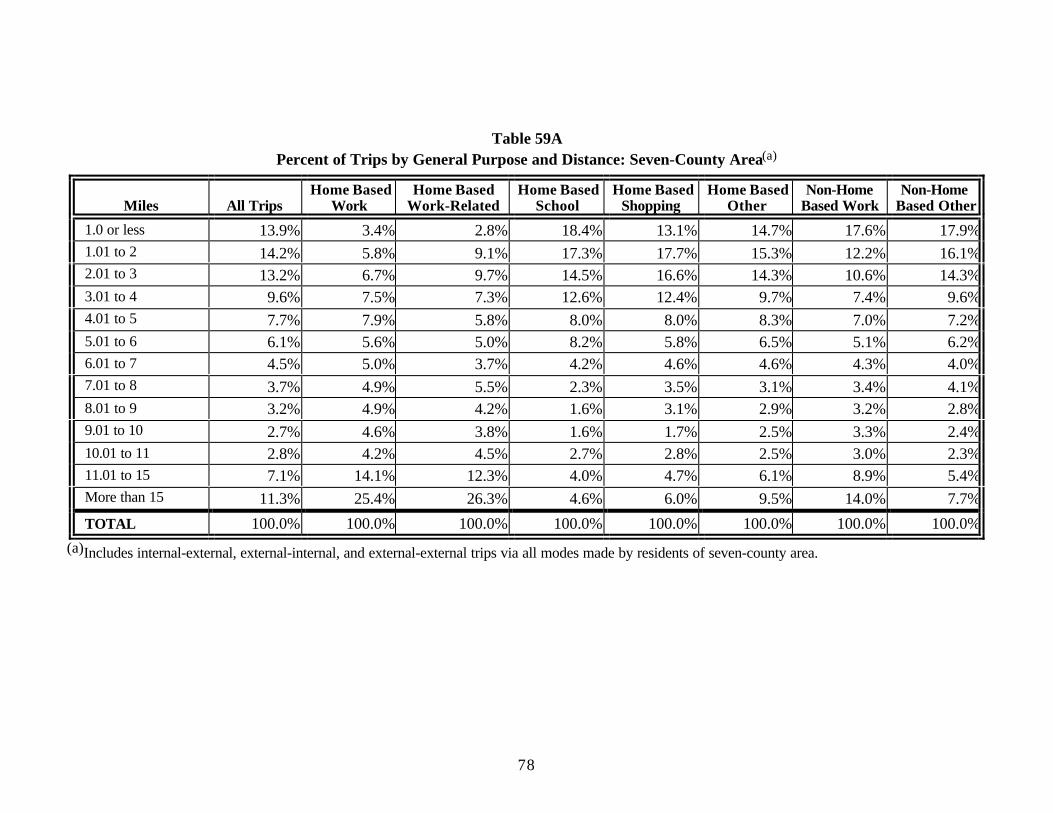
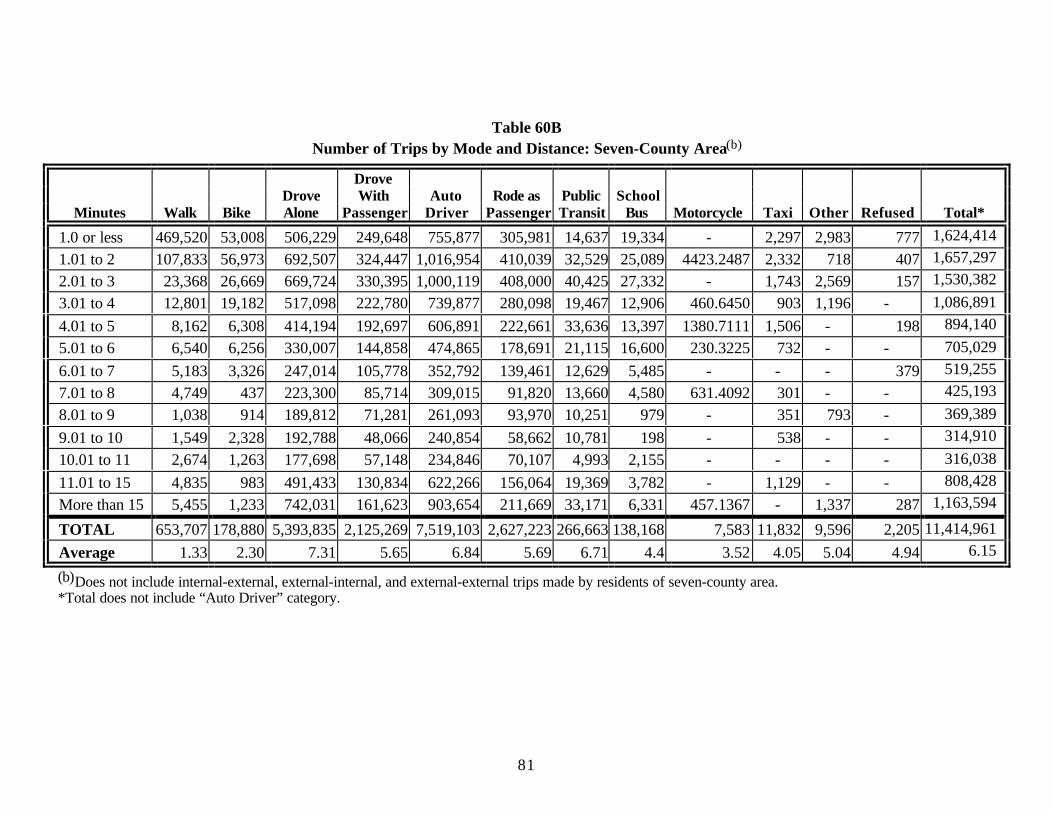
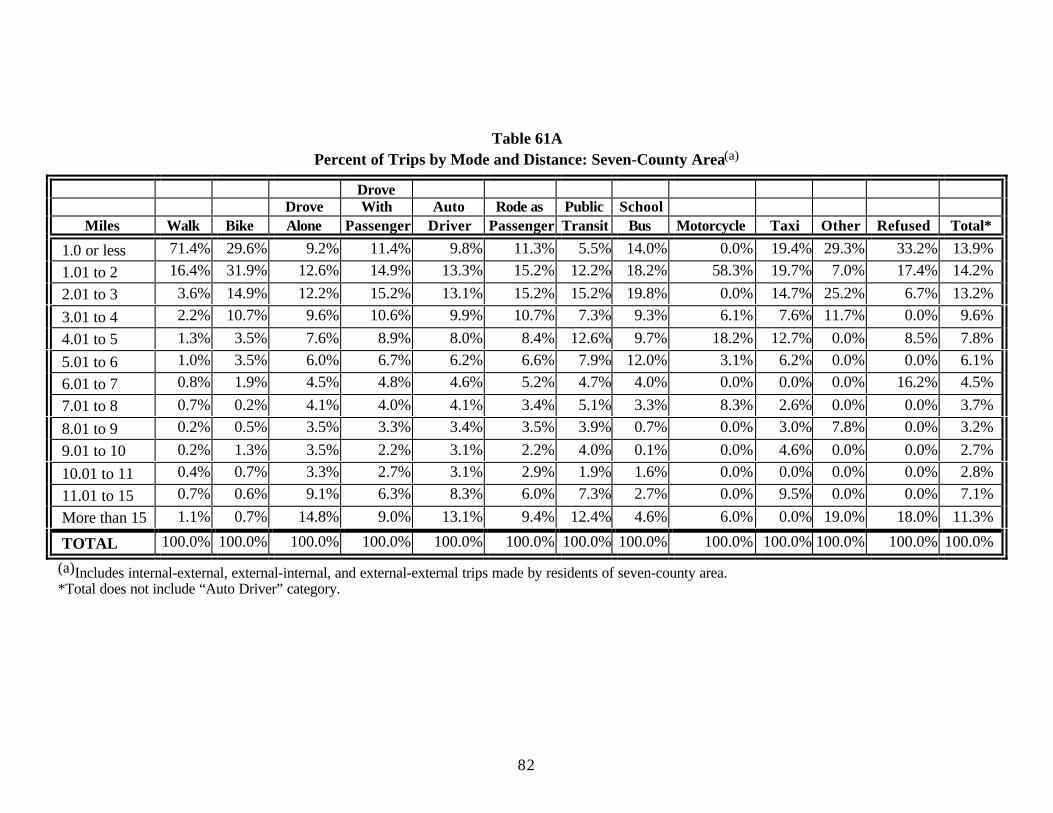
• Slightly more than one in 10 trips (13.9%) is 1.0 mile or less in length (Table 59A.)
64
Table 52AAverage Travel Time (Minutes) by Mode and General Purpose: Seven-County Area(a)
Home Based Home Based Home Based Home Based Home Based Non-Home- Non-Home-Mode Work Work-Related School Shopping Other Based Work Based Other Average
Walk 15.97 7.29 13.34 12.48 9.69 8.59 9.21 10.05Bicycle 23.3 19.49 23.94 14.19 14.00 15.53 18.78 16.91Auto Driver 25.13 24.80 21.01 13.48 15.48 17.90 13.55 16.99Drove Alone 25.18 24.74 22.39 13.14 15.89 18.06 13.41 17.89Drove with Passenger 23.84 26.34 11.24 14.19 14.93 16.49 13.73 14.71Rode as passenger 22.08 18.40 14.83 14.18 15.83 15.76 13.73 15.09Public Transit 42.26 39.99 30.28 31.93 35.27 27.24 22.63 31.26School Bus 26.81 28.10 23.76 NA 30.02 29.72 25.84 24.73Taxi 27.11 NA 70.00 18.33 27.76 11.46 17.14 19.32Motorcycle 15.73 NA 22.48 10.00 11.41 NA NA 16.55Other 5.00 60.00 NA 24.54 19.38 18.00 6.00 19.4Refused 62.33 1.00 NA NA 9.95 NA 10.21 24.34Average 25.61 24.29 18.88 13.79 15.35 17.06 13.92 16.58
(a)Includes internal-external, external-internal, and external-external trips made by residents of the seven-county area.
65
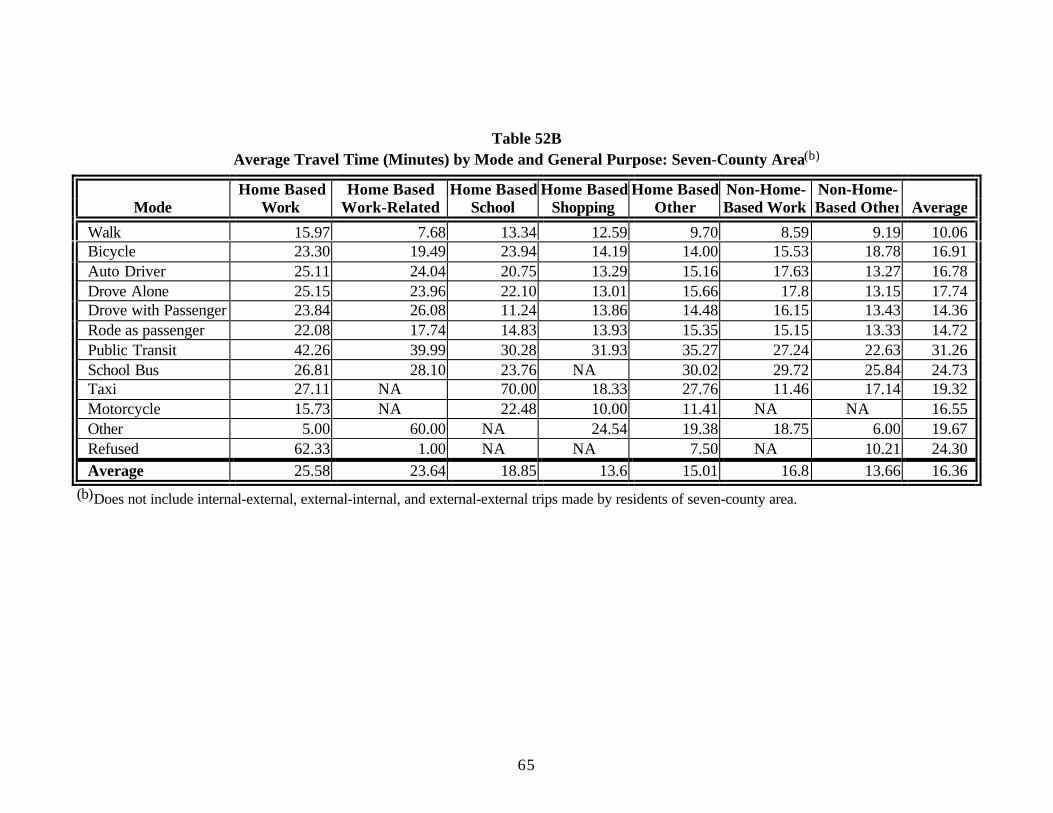
Table 52BAverage Travel Time (Minutes) by Mode and General Purpose: Seven-County Area(b)
Home Based Home Based Home Based Home Based Home Based Non-Home- Non-Home-Mode Work Work-Related School Shopping Other Based Work Based Other Average
Walk 15.97 7.68 13.34 12.59 9.70 8.59 9.19 10.06Bicycle 23.30 19.49 23.94 14.19 14.00 15.53 18.78 16.91Auto Driver 25.11 24.04 20.75 13.29 15.16 17.63 13.27 16.78Drove Alone 25.15 23.96 22.10 13.01 15.66 17.8 13.15 17.74Drove with Passenger 23.84 26.08 11.24 13.86 14.48 16.15 13.43 14.36Rode as passenger 22.08 17.74 14.83 13.93 15.35 15.15 13.33 14.72Public Transit 42.26 39.99 30.28 31.93 35.27 27.24 22.63 31.26School Bus 26.81 28.10 23.76 NA 30.02 29.72 25.84 24.73Taxi 27.11 NA 70.00 18.33 27.76 11.46 17.14 19.32Motorcycle 15.73 NA 22.48 10.00 11.41 NA NA 16.55Other 5.00 60.00 NA 24.54 19.38 18.75 6.00 19.67Refused 62.33 1.00 NA NA 7.50 NA 10.21 24.30Average 25.58 23.64 18.85 13.6 15.01 16.8 13.66 16.36
(b)Does not include internal-external, external-internal, and external-external trips made by residents of seven-county area.
66
Table 53A Number of Trips by General Purpose and Duration (Minutes): Seven-County Area(a)
Minutes All TripsHome Based
WorkHome Based
Work-RelatedHome Based
SchoolHome Based
ShoppingHome Based
OtherNon-Home
Based WorkNon-Home
Based Other
5 or less 2,576,719 87,013 22518.2957 44,197 462,295 918,722 285,991 755,9836-10 2,749,577 180,617 33915.5949 82,666 571,429 961,846 307,926 611,17611-15 2,232,992 253,916 40601.4280 73,970 385,914 760,859 251,374 466,35816-20 1,241,536 196,957 24288.1805 49,072 189,832 388,444 151,860 241,08421-25 694,795 142,565 19061.2119 29,819 85,538 185,635 95,661 136,51526-30 934,666 254,969 31463.4080 33,898 102,517 254,143 121,464 136,21131-35 353,267 96,931 14848.8523 13,579 26,854 98,415 50,454 52,18636-40 226,050 63,225 8733.7665 9,020 17,512 60,412 33,323 33,82441-45 249,222 84,730 10684.1135 6,434 16,429 72,043 29,875 29,02746-50 94,994 32,188 7485.4308 3,061 4,580 19,852 11,701 16,12651-55 54,005 15,543 2193.2593 1,159 4,183 14,236 6,267 10,42456-60 104,711 35,529 4946.9121 1,940 11,469 25,077 11,798 13,95161-65 27,444 10,995 2090.9593 276 2,064 6,748 1,924 3,34666-70 19,726 6,119 1496.0592 1,416 1,658 5,594 2,313 1,13071-75 26,921 8,781 775.6253 - 4,151 7,063 2,906 3,24476-80 9,552 2,366 718.9049 230 584 2,294 899 2,46181-85 9,256 3,488 - - 596 2,857 1,287 1,02886-90 19,569 5,742 1592.4517 1,038 451 6,802 2,469 1,47591-95 2,471 504 - - 903 - 516 54896-100 2,421 535 - - - 1,313 301 272More than 100 42,539 5,413 1068.5367 2,649 6,590 14,479 3,796 8,544
TOTAL 11,672,433 1,488,126 228,482 354,424 1,895,549 3,806,834 1,374,105 2,524,913Avg. Duration 16.58 25.61 24.29 18.88 13.82 15.35 17.10 13.94
(a)All modes and includes internal-external, external-internal, and external-external trips made by residents of seven-county area.
67
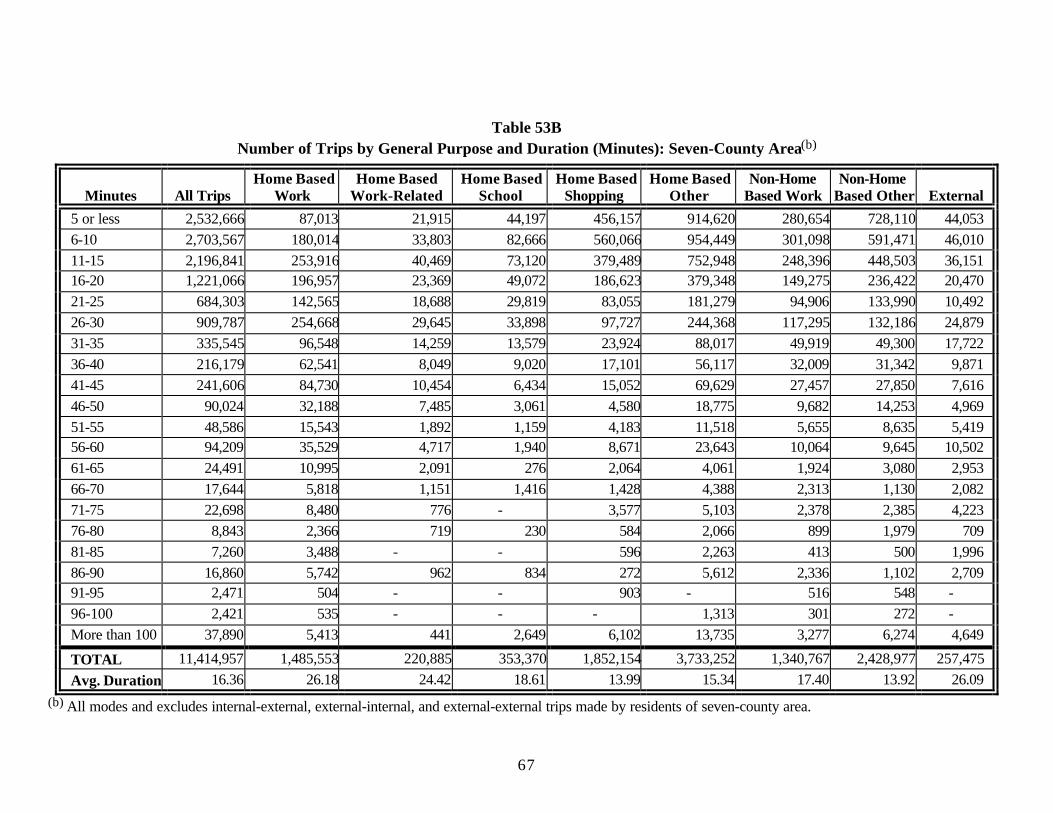
Table 53BNumber of Trips by General Purpose and Duration (Minutes): Seven-County Area(b)
Minutes All TripsHome Based
WorkHome Based
Work-RelatedHome Based
SchoolHome Based
ShoppingHome Based
OtherNon-Home
Based WorkNon-Home
Based Other External
5 or less 2,532,666 87,013 21,915 44,197 456,157 914,620 280,654 728,110 44,0536-10 2,703,567 180,014 33,803 82,666 560,066 954,449 301,098 591,471 46,01011-15 2,196,841 253,916 40,469 73,120 379,489 752,948 248,396 448,503 36,15116-20 1,221,066 196,957 23,369 49,072 186,623 379,348 149,275 236,422 20,47021-25 684,303 142,565 18,688 29,819 83,055 181,279 94,906 133,990 10,49226-30 909,787 254,668 29,645 33,898 97,727 244,368 117,295 132,186 24,87931-35 335,545 96,548 14,259 13,579 23,924 88,017 49,919 49,300 17,72236-40 216,179 62,541 8,049 9,020 17,101 56,117 32,009 31,342 9,87141-45 241,606 84,730 10,454 6,434 15,052 69,629 27,457 27,850 7,61646-50 90,024 32,188 7,485 3,061 4,580 18,775 9,682 14,253 4,96951-55 48,586 15,543 1,892 1,159 4,183 11,518 5,655 8,635 5,41956-60 94,209 35,529 4,717 1,940 8,671 23,643 10,064 9,645 10,50261-65 24,491 10,995 2,091 276 2,064 4,061 1,924 3,080 2,95366-70 17,644 5,818 1,151 1,416 1,428 4,388 2,313 1,130 2,08271-75 22,698 8,480 776 - 3,577 5,103 2,378 2,385 4,22376-80 8,843 2,366 719 230 584 2,066 899 1,979 70981-85 7,260 3,488 - - 596 2,263 413 500 1,99686-90 16,860 5,742 962 834 272 5,612 2,336 1,102 2,70991-95 2,471 504 - - 903 - 516 548 -96-100 2,421 535 - - - 1,313 301 272 -More than 100 37,890 5,413 441 2,649 6,102 13,735 3,277 6,274 4,649
TOTAL 11,414,957 1,485,553 220,885 353,370 1,852,154 3,733,252 1,340,767 2,428,977 257,475Avg. Duration 16.36 26.18 24.42 18.61 13.99 15.34 17.40 13.92 26.09
(b) All modes and excludes internal-external, external-internal, and external-external trips made by residents of seven-county area.
68
Table 54APercent of Trips by General Purpose and Duration (Minutes): Seven-County Area(a)
Minutes All TripsHome Based
WorkHome Based
Work-RelatedHome Based
SchoolHome Based
ShoppingHome Based
OtherNon-Home
Based WorkNon-Home
Based Other
5 or less 22.1% 5.9% 9.9% 12.5% 24.4% 24.1% 20.8% 29.9%6-10 23.6% 12.1% 14.8% 23.3% 30.2% 25.3% 22.4% 24.2%11-15 19.1% 17.1% 17.8% 20.9% 20.4% 20.0% 18.3% 18.5%16-20 10.6% 13.2% 10.6% 13.8% 10.0% 10.2% 11.0% 9.6%21-25 6.0% 9.6% 8.3% 8.4% 4.5% 4.9% 7.0% 5.4%26-30 8.0% 17.1% 13.8% 9.6% 5.4% 6.7% 8.8% 5.4%31-35 3.0% 6.5% 6.5% 3.8% 1.4% 2.6% 3.7% 2.1%36-40 1.9% 4.3% 3.8% 2.5% 0.9% 1.6% 2.4% 1.3%41-45 2.1% 5.7% 4.7% 1.8% 0.9% 1.9% 2.2% 1.1%46-50 0.8% 2.2% 3.3% 0.9% 0.2% 0.5% 0.8% 0.6%51-55 0.5% 1.0% 1.0% 0.3% 0.2% 0.4% 0.5% 0.4%56-60 0.9% 2.4% 2.2% 0.6% 0.6% 0.6% 0.9% 0.6%61-65 0.2% 0.7% 0.9% 0.1% 0.1% 0.2% 0.1% 0.1%66-70 0.2% 0.4% 0.6% 0.4% 0.1% 0.1% 0.2% 0.1%71-75 0.2% 0.6% 0.3% 0.0% 0.2% 0.2% 0.2% 0.1%76-80 0.1% 0.2% 0.3% 0.1% 0.0% 0.0% 0.1% 0.1%81-85 0.1% 0.2% 0.0% 0.0% 0.0% 0.1% 0.1% 0.1%86-90 0.2% 0.4% 0.7% 0.3% 0.0% 0.2% 0.2% 0.1%91-95 0.0% 0.0% 0.0% 0.0% 0.1% 0.0% 0.0% 0.0%96-100 0.0% 0.0% 0.0% 0.0% 0.0% 0.0% 0.0% 0.0%More than 100 0.4% 0.4% 0.5% 0.7% 0.4% 0.4% 0.3% 0.3%
TOTAL 100.0% 100.0% 100.0% 100.0% 100.0% 100.0% 100.0% 100.0%
(a)All modes and includes internal-external, external-internal, and external-external trips made by residents of seven-county area.
69
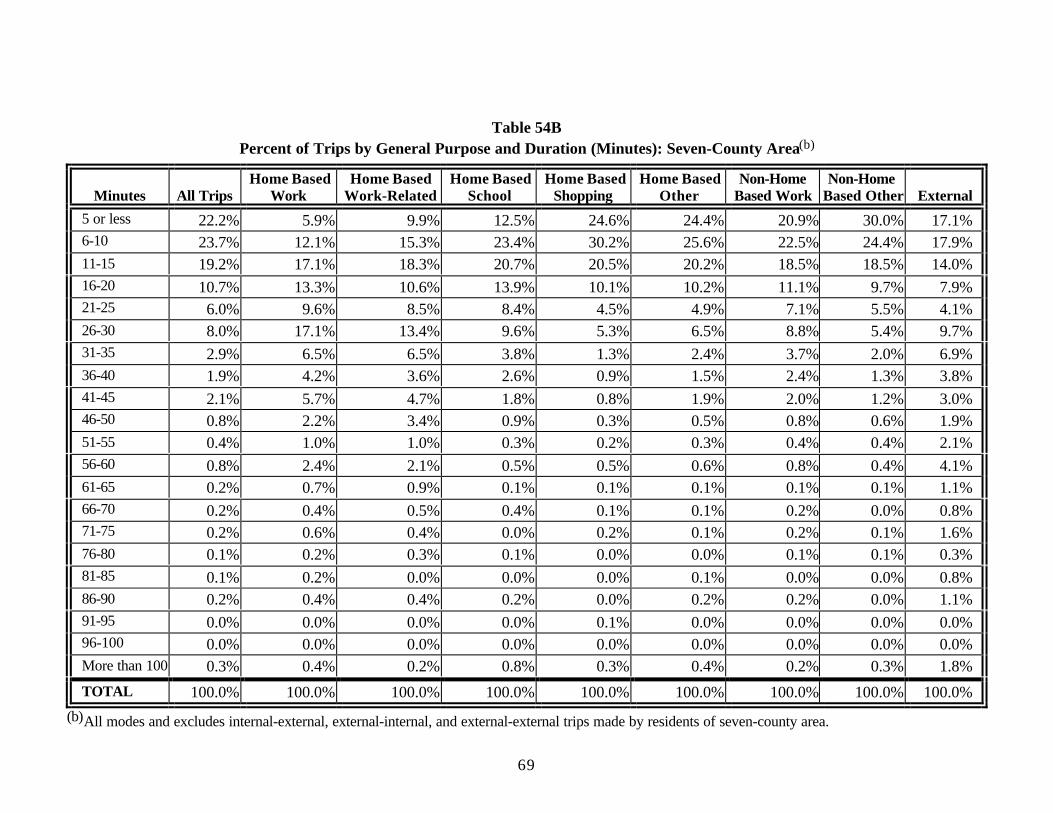
Table 54BPercent of Trips by General Purpose and Duration (Minutes): Seven-County Area(b)
Minutes All TripsHome Based
WorkHome Based
Work-RelatedHome Based
SchoolHome Based
ShoppingHome Based
OtherNon-Home
Based WorkNon-Home
Based Other External
5 or less 22.2% 5.9% 9.9% 12.5% 24.6% 24.4% 20.9% 30.0% 17.1%6-10 23.7% 12.1% 15.3% 23.4% 30.2% 25.6% 22.5% 24.4% 17.9%11-15 19.2% 17.1% 18.3% 20.7% 20.5% 20.2% 18.5% 18.5% 14.0%16-20 10.7% 13.3% 10.6% 13.9% 10.1% 10.2% 11.1% 9.7% 7.9%21-25 6.0% 9.6% 8.5% 8.4% 4.5% 4.9% 7.1% 5.5% 4.1%26-30 8.0% 17.1% 13.4% 9.6% 5.3% 6.5% 8.8% 5.4% 9.7%31-35 2.9% 6.5% 6.5% 3.8% 1.3% 2.4% 3.7% 2.0% 6.9%36-40 1.9% 4.2% 3.6% 2.6% 0.9% 1.5% 2.4% 1.3% 3.8%41-45 2.1% 5.7% 4.7% 1.8% 0.8% 1.9% 2.0% 1.2% 3.0%46-50 0.8% 2.2% 3.4% 0.9% 0.3% 0.5% 0.8% 0.6% 1.9%51-55 0.4% 1.0% 1.0% 0.3% 0.2% 0.3% 0.4% 0.4% 2.1%56-60 0.8% 2.4% 2.1% 0.5% 0.5% 0.6% 0.8% 0.4% 4.1%61-65 0.2% 0.7% 0.9% 0.1% 0.1% 0.1% 0.1% 0.1% 1.1%66-70 0.2% 0.4% 0.5% 0.4% 0.1% 0.1% 0.2% 0.0% 0.8%71-75 0.2% 0.6% 0.4% 0.0% 0.2% 0.1% 0.2% 0.1% 1.6%76-80 0.1% 0.2% 0.3% 0.1% 0.0% 0.0% 0.1% 0.1% 0.3%81-85 0.1% 0.2% 0.0% 0.0% 0.0% 0.1% 0.0% 0.0% 0.8%86-90 0.2% 0.4% 0.4% 0.2% 0.0% 0.2% 0.2% 0.0% 1.1%91-95 0.0% 0.0% 0.0% 0.0% 0.1% 0.0% 0.0% 0.0% 0.0%96-100 0.0% 0.0% 0.0% 0.0% 0.0% 0.0% 0.0% 0.0% 0.0%More than 100 0.3% 0.4% 0.2% 0.8% 0.3% 0.4% 0.2% 0.3% 1.8%
TOTAL 100.0% 100.0% 100.0% 100.0% 100.0% 100.0% 100.0% 100.0% 100.0%(b)All modes and excludes internal-external, external-internal, and external-external trips made by residents of seven-county area.
70
Table 55ANumber of Trips by Mode and Duration (Minutes): Seven-County Area(a)
DroveDrove With Auto Rode as Public School
Minutes Walk Bike Alone Passenger Driver Passenger Transit Bus Motorcycle Taxi Other Refused Total*
5 or less 325,368 37,831 1,070,222 509,990 1,580,212 606,886 16,828 4,314 484 1,476 2,965 355 2,576,7196-10 140,483 40,942 1,188,009 600,160 1,788,169 737,881 19,927 16,462 2,235 1,922 742 814 2,749,57711-15 95,367 48,367 1,020,125 449,716 1,469,840 561,420 28,155 22,442 2,022 2,617 2,392 370 2,232,99316-20 40,709 12,976 645,553 224,381 869,934 267,829 24,894 20,586 1,063 3,232 314 - 1,241,53721-25 18,783 5,561 381,211 105,630 486,841 139,321 24,016 19,006 461 359 314 133 694,79526-30 19,047 17,908 520,133 137,645 657,778 173,520 41,429 22,012 773 456 1,364 379 934,66631-35 2,871 1,963 199,388 52,836 252,224 58,735 24,156 11,411 - 771 1,136 - 353,26736-40 2,908 2,244 123,791 28,997 152,788 37,154 20,746 9,611 230 - 369 - 226,05041-45 2,581 2,242 139,204 32,416 171,620 44,850 23,039 4,189 316 386 - - 249,22346-50 1,133 1,476 54,072 10,926 64,999 14,479 9,575 3,333 - - - - 94,99451-55 1,239 2,218 27,403 4,011 31,414 10,396 6,470 2,061 - 206 - - 54,00456-60 2,097 1,628 52,589 15,339 67,929 18,798 12,164 1,497 - - 598 - 104,71061-65 228 461 16,590 3,098 19,688 5,265 1,526 276 - - - - 27,44466-70 - - 10,881 2,093 12,974 3,396 2,705 244 - 407 - - 19,72671-75 407 683 13,655 4,259 17,914 4,526 3,391 - - - - - 26,92176-80 - - 4,347 1,830 6,178 1,539 1,605 230 - - - - 9,55181-85 - - 6,392 984 7,376 297 1,282 301 - - - - 9,25686-90 - 821 12,237 1,005 13,242 2,022 3,483 - - - - - 19,56891-95 272 - 1,140 157 1,296 903 - - - - - - 2,47296-100 - - 1,699 451 2,149 272 - - - - - - 2,422More than 100 3,828 1,559 19,516 5,816 25,332 10,071 1,271 189 - - - 287 42,537
TOTAL 657,321 178,880 5,508,157 2,191,740 7,699,897 2,699,560 266,662 138,164 7,584 11,832 10,194 2,338 11,672,432Avg. Duration 10.05 16.91 17.89 14.71 16.99 15.09 31.26 24.73 16.55 19.32 19.4 24.34 16.58
(a)All modes and includes internal-external, external-internal, and external-external trips made by residents of seven-county area.*Total does not include “Auto Driver” category.
71
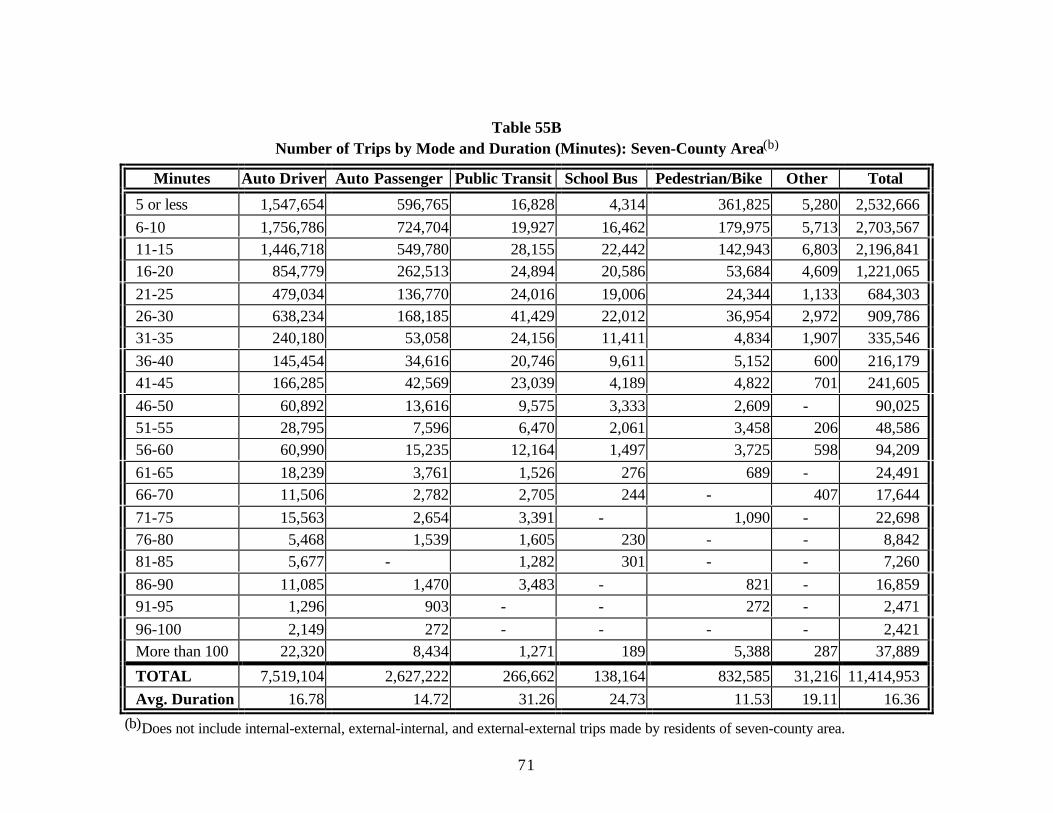
Table 55BNumber of Trips by Mode and Duration (Minutes): Seven-County Area(b)
Minutes Auto Driver Auto Passenger Public Transit School Bus Pedestrian/Bike Other Total
5 or less 1,547,654 596,765 16,828 4,314 361,825 5,280 2,532,6666-10 1,756,786 724,704 19,927 16,462 179,975 5,713 2,703,56711-15 1,446,718 549,780 28,155 22,442 142,943 6,803 2,196,84116-20 854,779 262,513 24,894 20,586 53,684 4,609 1,221,06521-25 479,034 136,770 24,016 19,006 24,344 1,133 684,30326-30 638,234 168,185 41,429 22,012 36,954 2,972 909,78631-35 240,180 53,058 24,156 11,411 4,834 1,907 335,54636-40 145,454 34,616 20,746 9,611 5,152 600 216,17941-45 166,285 42,569 23,039 4,189 4,822 701 241,60546-50 60,892 13,616 9,575 3,333 2,609 - 90,02551-55 28,795 7,596 6,470 2,061 3,458 206 48,58656-60 60,990 15,235 12,164 1,497 3,725 598 94,20961-65 18,239 3,761 1,526 276 689 - 24,49166-70 11,506 2,782 2,705 244 - 407 17,64471-75 15,563 2,654 3,391 - 1,090 - 22,69876-80 5,468 1,539 1,605 230 - - 8,84281-85 5,677 - 1,282 301 - - 7,26086-90 11,085 1,470 3,483 - 821 - 16,85991-95 1,296 903 - - 272 - 2,47196-100 2,149 272 - - - - 2,421More than 100 22,320 8,434 1,271 189 5,388 287 37,889
TOTAL 7,519,104 2,627,222 266,662 138,164 832,585 31,216 11,414,953Avg. Duration 16.78 14.72 31.26 24.73 11.53 19.11 16.36
(b)Does not include internal-external, external-internal, and external-external trips made by residents of seven-county area.
72
Table 56APercent of Trips by Mode and Duration (Minutes): Seven-County Area(a)
DroveDrove With Auto Rode as Public School
Minutes Walk Bike Alone Passenger Driver Passenger Transit Bus Motorcycle Taxi Other Refused
5 or less 49.5% 21.1% 19.4% 23.3% 20.5% 22.5% 6.3% 3.1% 6.4% 12.5% 29.1% 15.2%
6-10 21.4% 22.9% 21.6% 27.4% 23.2% 27.3% 7.5% 11.9% 29.5% 16.2% 7.3% 34.8%11-15 14.5% 27.0% 18.5% 20.5% 19.1% 20.8% 10.5% 16.2% 26.7% 22.1% 23.5% 15.8%16-20 6.2% 7.3% 11.7% 10.2% 11.3% 9.9% 9.3% 14.9% 14.0% 27.3% 3.1% 0.0%21-25 2.9% 3.1% 6.9% 4.8% 6.3% 5.2% 9.0% 13.8% 6.1% 3.0% 3.1% 5.7%26-30 2.9% 10.0% 9.4% 6.3% 8.5% 6.4% 15.5% 15.9% 10.2% 3.9% 13.4% 16.2%
31-35 0.4% 1.1% 3.6% 2.4% 3.3% 2.2% 9.1% 8.3% 0.0% 6.5% 11.1% 0.0%
36-40 0.4% 1.3% 2.3% 1.3% 2.0% 1.4% 7.8% 7.0% 3.0% 0.0% 3.6% 0.0%
41-45 0.4% 1.2% 2.5% 1.5% 2.2% 1.7% 8.6% 3.0% 4.1% 3.3% 0.0% 0.0%
46-50 0.2% 0.8% 1.0% 0.5% 0.9% 0.5% 3.6% 2.4% 0.0% 0.0% 0.0% 0.0%51-55 0.2% 1.2% 0.5% 0.2% 0.4% 0.4% 2.4% 1.5% 0.0% 1.8% 0.0% 0.0%56-60 0.3% 0.9% 1.0% 0.7% 0.9% 0.7% 4.6% 1.1% 0.0% 0.0% 5.8% 0.0%61-65 0.0% 0.3% 0.3% 0.1% 0.3% 0.2% 0.6% 0.2% 0.0% 0.0% 0.0% 0.0%
66-70 0.0% 0.0% 0.2% 0.1% 0.2% 0.1% 1.0% 0.2% 0.0% 3.4% 0.0% 0.0%
71-75 0.1% 0.4% 0.23 0.2% 0.2% 0.2% 1.3% 0.0% 0.0% 0.0% 0.0% 0.0%
76-80 0.0% 0.0% 0.1% 0.1% 0.1% 0.0% 0.6% 0.2% 0.0% 0.0% 0.0% 0.0%
81-85 0.0% 0.0% 0.1% 0.0% 0.1% 0.0% 0.5% 0.2% 0.0% 0.0% 0.0% 0.0%86-90 0.0% 0.5% 0.2% 0.1% 0.2% 0.1% 1.3% 0.0% 0.0% 0.0% 0.0% 0.0%91-95 0.0% 0.0% 0.0% 0.0% 0.0% 0.0% 0.0% 0.0% 0.0% 0.0% 0.0% 0.0%96-100 0.0% 0.0% 0.0% 0.0% 0.0% 0.0% 0.0% 0.0% 0.0% 0.0% 0.0% 0.0%More than 100 0.6% 0.9% 0.4% 0.3% 0.3% 0.4% 0.5% 0.1% 0.0% 0.0% 0.0% 12.3%
TOTAL 100.0% 100.0% 100.0% 100.0% 100.0% 100.0% 100.0% 100.0% 100.0% 100.0% 100.0% 100.0%
(a)Includes internal-external, external-internal, and external-external trips made by residents of seven-county area.
73
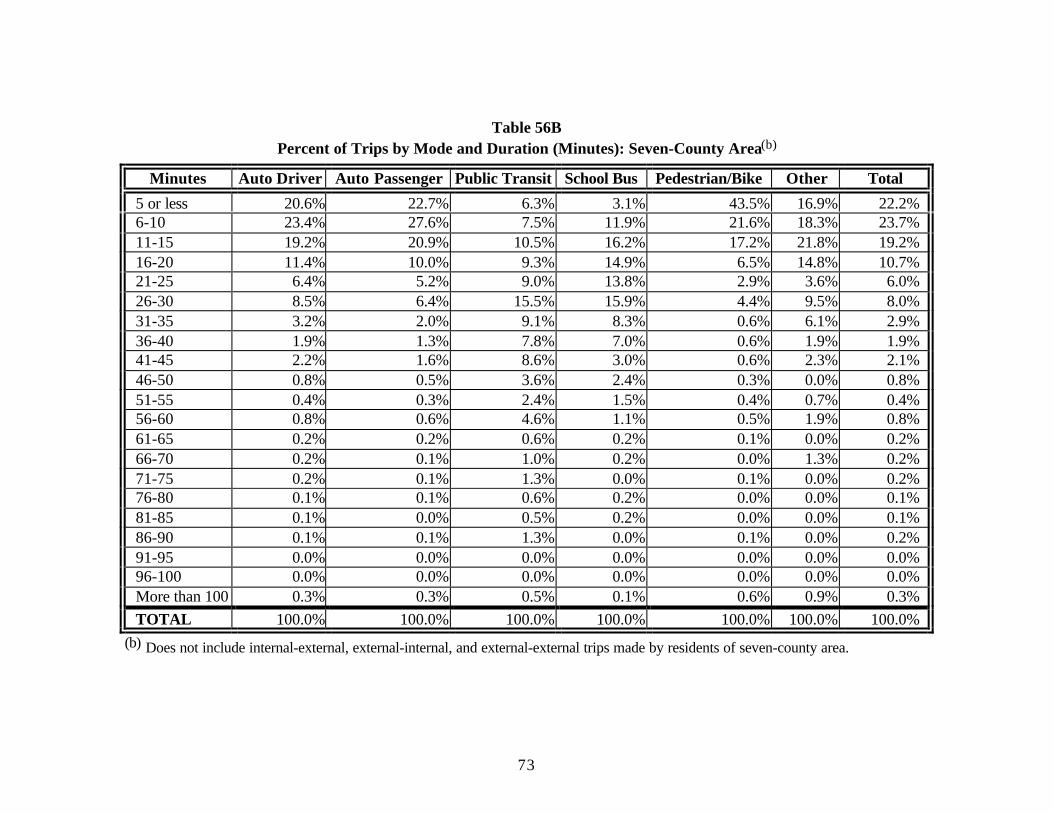
Table 56BPercent of Trips by Mode and Duration (Minutes): Seven-County Area(b)
Minutes Auto Driver Auto Passenger Public Transit School Bus Pedestrian/Bike Other Total
5 or less 20.6% 22.7% 6.3% 3.1% 43.5% 16.9% 22.2%6-10 23.4% 27.6% 7.5% 11.9% 21.6% 18.3% 23.7%11-15 19.2% 20.9% 10.5% 16.2% 17.2% 21.8% 19.2%16-20 11.4% 10.0% 9.3% 14.9% 6.5% 14.8% 10.7%21-25 6.4% 5.2% 9.0% 13.8% 2.9% 3.6% 6.0%26-30 8.5% 6.4% 15.5% 15.9% 4.4% 9.5% 8.0%31-35 3.2% 2.0% 9.1% 8.3% 0.6% 6.1% 2.9%36-40 1.9% 1.3% 7.8% 7.0% 0.6% 1.9% 1.9%41-45 2.2% 1.6% 8.6% 3.0% 0.6% 2.3% 2.1%46-50 0.8% 0.5% 3.6% 2.4% 0.3% 0.0% 0.8%51-55 0.4% 0.3% 2.4% 1.5% 0.4% 0.7% 0.4%56-60 0.8% 0.6% 4.6% 1.1% 0.5% 1.9% 0.8%61-65 0.2% 0.2% 0.6% 0.2% 0.1% 0.0% 0.2%66-70 0.2% 0.1% 1.0% 0.2% 0.0% 1.3% 0.2%71-75 0.2% 0.1% 1.3% 0.0% 0.1% 0.0% 0.2%76-80 0.1% 0.1% 0.6% 0.2% 0.0% 0.0% 0.1%81-85 0.1% 0.0% 0.5% 0.2% 0.0% 0.0% 0.1%86-90 0.1% 0.1% 1.3% 0.0% 0.1% 0.0% 0.2%91-95 0.0% 0.0% 0.0% 0.0% 0.0% 0.0% 0.0%96-100 0.0% 0.0% 0.0% 0.0% 0.0% 0.0% 0.0%More than 100 0.3% 0.3% 0.5% 0.1% 0.6% 0.9% 0.3%TOTAL 100.0% 100.0% 100.0% 100.0% 100.0% 100.0% 100.0%
(b) Does not include internal-external, external-internal, and external-external trips made by residents of seven-county area.
74
Table 57AAverage Travel Distance (Miles) by Mode and General Purpose: Seven-County Area(a)
Home Based Home Based Home Based Home Based Home Based Non-Home- Non-Home-Mode Work Work-Related School Shopping Other Based Work Based Other Average
Walk 1.26 12.14 1.09 2.28 1.55 1.18 1.25 1.51Bicycle 3.85 3.10 2.66 1.81 1.98 1.62 2.11 2.30Auto Driver 11.12 11.74 8.40 5.33 6.53 7.93 5.67 7.27Drove Alone 11.18 11.73 8.96 5.13 6.69 8.03 5.49 7.69Drove with Passenger 9.43 12.22 4.45 5.74 6.30 6.95 5.93 6.19Rode as passenger 9.51 9.17 4.81 6.08 6.45 6.82 5.92 6.26Public Transit 7.68 10.88 3.47 4.58 4.96 8.80 6.07 6.71School Bus 4.29 4.22 3.32 NA 6.15 13.24 6.33 4.40Taxi 7.34 NA 3.83 2.68 7.60 3.59 2.53 4.05Motorcycle 5.38 NA 3.90 1.53 1.72 NA NA 3.52Other 1.49 16.70 NA 2.00 7.30 11.58 0.19 7.41Refused 12.89 2.42 NA NA 7.10 NA 1.91 7.17Average 10.55 11.36 4.49 5.39 6.03 7.13 5.52 6.58
(a) Includes internal-external, external-internal, and external-external trips made by residents of seven-county area.

75
Table 57BAverage Travel Distance (Miles) by Mode and General Purpose: Seven-County Area(b)
Home Based Home Based Home Based Home Based Home Based Non-Home- Non-Home-Mode Work Work-Related School Shopping Other Based Work Based Other Average
Walk 1.26 2.55 1.09 0.96 1.55 1.18 1.22 1.33Bicycle 3.85 3.10 2.66 1.81 1.98 1.62 2.11 2.30Auto Driver 11.10 11.07 8.21 4.79 5.99 7.40 5.18 6.84Drove Alone 11.16 11.03 8.75 4.64 6.17 7.51 5.02 7.31Drove with Passenger 9.43 12.14 4.45 5.10 5.74 6.49 5.39 5.65Rode as passenger 9.51 7.77 4.61 5.33 5.95 6.00 5.27 5.69Public Transit 7.68 10.88 3.47 4.58 4.96 8.80 6.07 6.71School Bus 4.29 4.22 3.32 NA 6.15 13.24 6.33 4.40Taxi 7.34 NA 3.83 2.68 7.60 3.59 2.53 4.05Motorcycle 5.38 NA 3.90 1.53 1.72 NA NA 3.52Other 1.49 16.70 NA 2.00 7.30 3.15 0.19 5.04Refused 12.89 2.42 NA NA 1.02 NA 1.91 4.94Average 10.52 10.52 4.38 4.78 5.55 6.64 5.02 6.15
(b) Does not include internal-external, external-internal, and external-external trips made by residents of seven-county area.
76
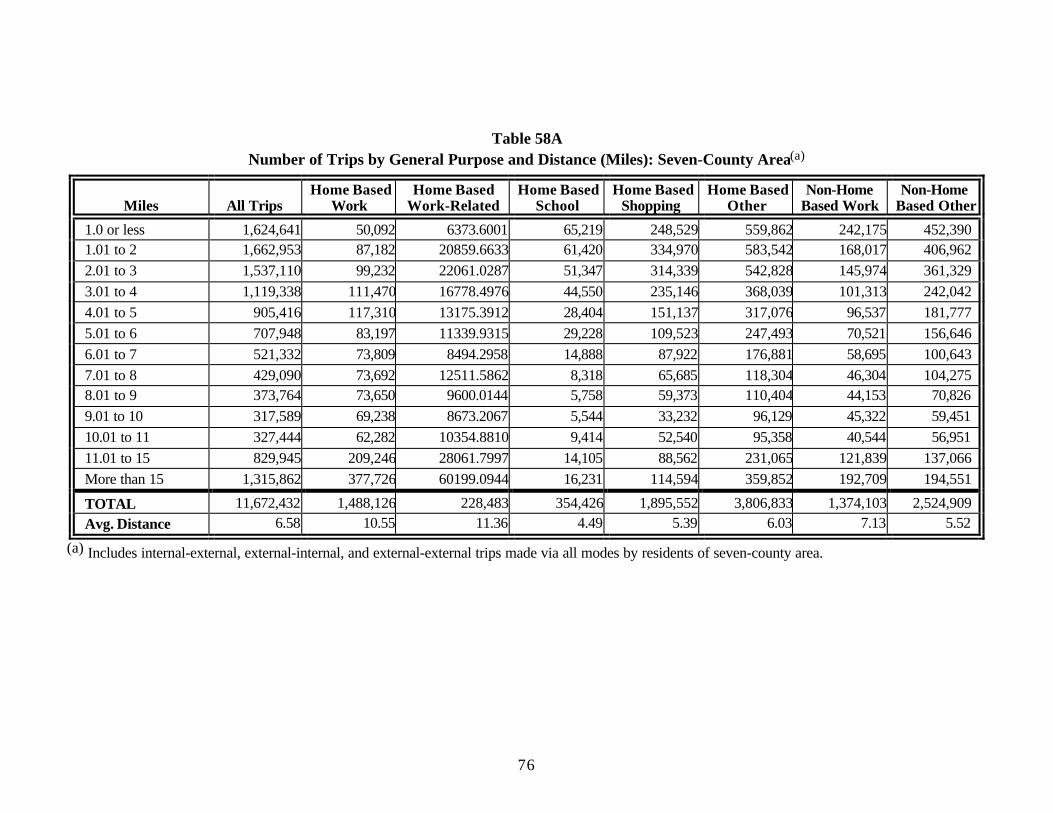
Table 58ANumber of Trips by General Purpose and Distance (Miles): Seven-County Area(a)
Miles All TripsHome Based
WorkHome Based
Work-RelatedHome Based
SchoolHome Based
ShoppingHome Based
OtherNon-Home
Based WorkNon-Home
Based Other
1.0 or less 1,624,641 50,092 6373.6001 65,219 248,529 559,862 242,175 452,3901.01 to 2 1,662,953 87,182 20859.6633 61,420 334,970 583,542 168,017 406,9622.01 to 3 1,537,110 99,232 22061.0287 51,347 314,339 542,828 145,974 361,3293.01 to 4 1,119,338 111,470 16778.4976 44,550 235,146 368,039 101,313 242,0424.01 to 5 905,416 117,310 13175.3912 28,404 151,137 317,076 96,537 181,7775.01 to 6 707,948 83,197 11339.9315 29,228 109,523 247,493 70,521 156,6466.01 to 7 521,332 73,809 8494.2958 14,888 87,922 176,881 58,695 100,6437.01 to 8 429,090 73,692 12511.5862 8,318 65,685 118,304 46,304 104,2758.01 to 9 373,764 73,650 9600.0144 5,758 59,373 110,404 44,153 70,8269.01 to 10 317,589 69,238 8673.2067 5,544 33,232 96,129 45,322 59,45110.01 to 11 327,444 62,282 10354.8810 9,414 52,540 95,358 40,544 56,95111.01 to 15 829,945 209,246 28061.7997 14,105 88,562 231,065 121,839 137,066More than 15 1,315,862 377,726 60199.0944 16,231 114,594 359,852 192,709 194,551
TOTAL 11,672,432 1,488,126 228,483 354,426 1,895,552 3,806,833 1,374,103 2,524,909Avg. Distance 6.58 10.55 11.36 4.49 5.39 6.03 7.13 5.52
(a) Includes internal-external, external-internal, and external-external trips made via all modes by residents of seven-county area.
77
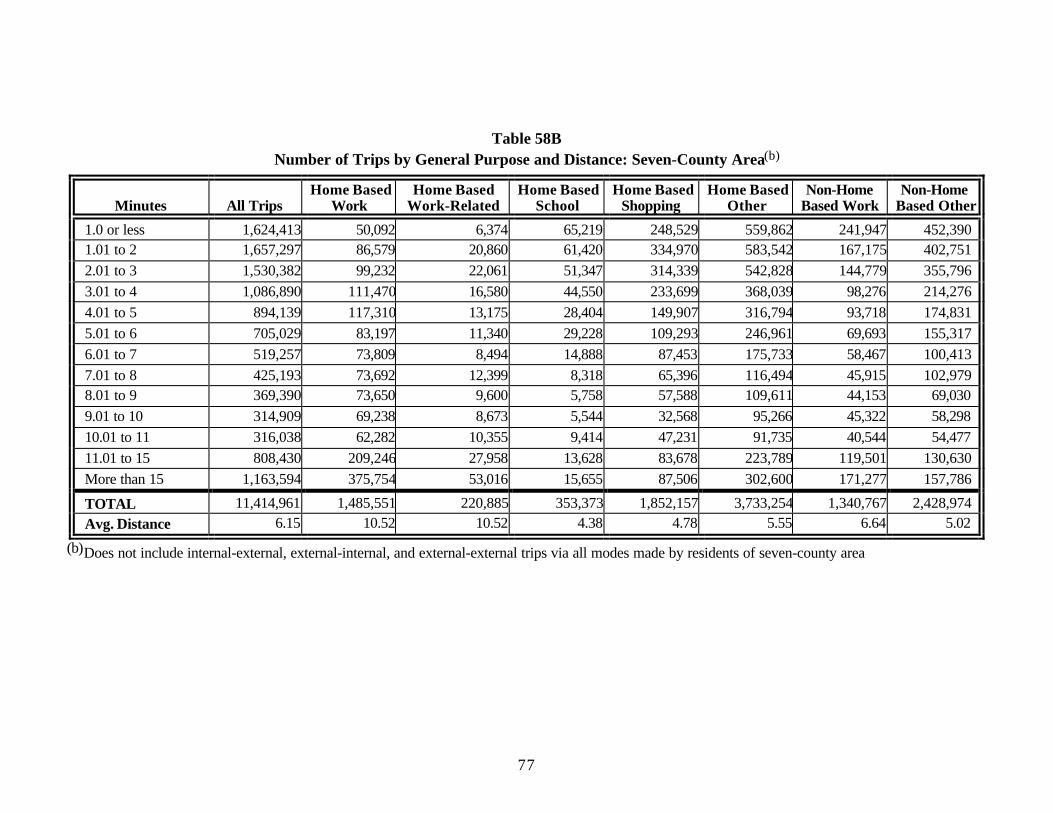
Table 58BNumber of Trips by General Purpose and Distance: Seven-County Area(b)
Minutes All TripsHome Based
WorkHome Based
Work-RelatedHome Based
SchoolHome Based
ShoppingHome Based
OtherNon-Home
Based WorkNon-Home
Based Other
1.0 or less 1,624,413 50,092 6,374 65,219 248,529 559,862 241,947 452,3901.01 to 2 1,657,297 86,579 20,860 61,420 334,970 583,542 167,175 402,7512.01 to 3 1,530,382 99,232 22,061 51,347 314,339 542,828 144,779 355,7963.01 to 4 1,086,890 111,470 16,580 44,550 233,699 368,039 98,276 214,2764.01 to 5 894,139 117,310 13,175 28,404 149,907 316,794 93,718 174,8315.01 to 6 705,029 83,197 11,340 29,228 109,293 246,961 69,693 155,3176.01 to 7 519,257 73,809 8,494 14,888 87,453 175,733 58,467 100,4137.01 to 8 425,193 73,692 12,399 8,318 65,396 116,494 45,915 102,9798.01 to 9 369,390 73,650 9,600 5,758 57,588 109,611 44,153 69,0309.01 to 10 314,909 69,238 8,673 5,544 32,568 95,266 45,322 58,29810.01 to 11 316,038 62,282 10,355 9,414 47,231 91,735 40,544 54,47711.01 to 15 808,430 209,246 27,958 13,628 83,678 223,789 119,501 130,630More than 15 1,163,594 375,754 53,016 15,655 87,506 302,600 171,277 157,786
TOTAL 11,414,961 1,485,551 220,885 353,373 1,852,157 3,733,254 1,340,767 2,428,974Avg. Distance 6.15 10.52 10.52 4.38 4.78 5.55 6.64 5.02
(b)Does not include internal-external, external-internal, and external-external trips via all modes made by residents of seven-county area
78
Table 59APercent of Trips by General Purpose and Distance: Seven-County Area(a)
Miles All TripsHome Based
WorkHome Based
Work-RelatedHome Based
SchoolHome Based
ShoppingHome Based
OtherNon-Home
Based WorkNon-Home
Based Other
1.0 or less 13.9% 3.4% 2.8% 18.4% 13.1% 14.7% 17.6% 17.9%1.01 to 2 14.2% 5.8% 9.1% 17.3% 17.7% 15.3% 12.2% 16.1%2.01 to 3 13.2% 6.7% 9.7% 14.5% 16.6% 14.3% 10.6% 14.3%3.01 to 4 9.6% 7.5% 7.3% 12.6% 12.4% 9.7% 7.4% 9.6%4.01 to 5 7.7% 7.9% 5.8% 8.0% 8.0% 8.3% 7.0% 7.2%5.01 to 6 6.1% 5.6% 5.0% 8.2% 5.8% 6.5% 5.1% 6.2%6.01 to 7 4.5% 5.0% 3.7% 4.2% 4.6% 4.6% 4.3% 4.0%7.01 to 8 3.7% 4.9% 5.5% 2.3% 3.5% 3.1% 3.4% 4.1%8.01 to 9 3.2% 4.9% 4.2% 1.6% 3.1% 2.9% 3.2% 2.8%9.01 to 10 2.7% 4.6% 3.8% 1.6% 1.7% 2.5% 3.3% 2.4%10.01 to 11 2.8% 4.2% 4.5% 2.7% 2.8% 2.5% 3.0% 2.3%11.01 to 15 7.1% 14.1% 12.3% 4.0% 4.7% 6.1% 8.9% 5.4%More than 15 11.3% 25.4% 26.3% 4.6% 6.0% 9.5% 14.0% 7.7%
TOTAL 100.0% 100.0% 100.0% 100.0% 100.0% 100.0% 100.0% 100.0%(a)Includes internal-external, external-internal, and external-external trips via all modes made by residents of seven-county area.
79
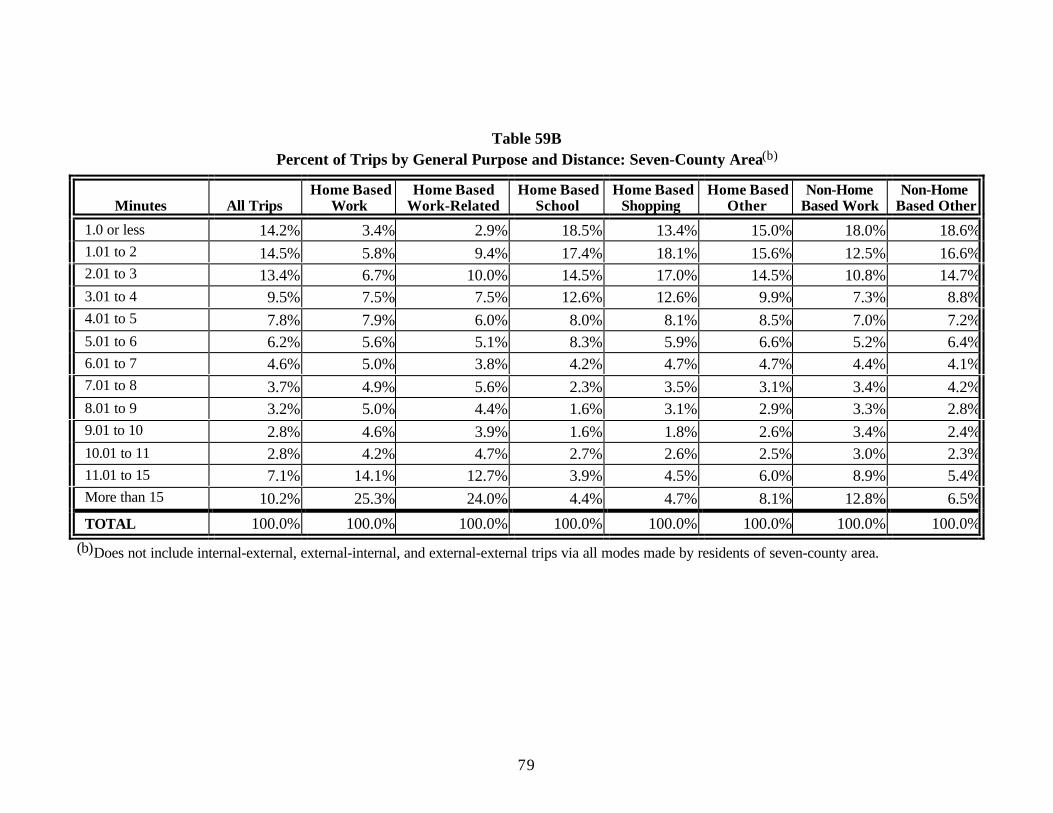
Table 59BPercent of Trips by General Purpose and Distance: Seven-County Area(b)
Minutes All TripsHome Based
WorkHome Based
Work-RelatedHome Based
SchoolHome Based
ShoppingHome Based
OtherNon-Home
Based WorkNon-Home
Based Other
1.0 or less 14.2% 3.4% 2.9% 18.5% 13.4% 15.0% 18.0% 18.6%1.01 to 2 14.5% 5.8% 9.4% 17.4% 18.1% 15.6% 12.5% 16.6%2.01 to 3 13.4% 6.7% 10.0% 14.5% 17.0% 14.5% 10.8% 14.7%3.01 to 4 9.5% 7.5% 7.5% 12.6% 12.6% 9.9% 7.3% 8.8%4.01 to 5 7.8% 7.9% 6.0% 8.0% 8.1% 8.5% 7.0% 7.2%5.01 to 6 6.2% 5.6% 5.1% 8.3% 5.9% 6.6% 5.2% 6.4%6.01 to 7 4.6% 5.0% 3.8% 4.2% 4.7% 4.7% 4.4% 4.1%7.01 to 8 3.7% 4.9% 5.6% 2.3% 3.5% 3.1% 3.4% 4.2%8.01 to 9 3.2% 5.0% 4.4% 1.6% 3.1% 2.9% 3.3% 2.8%9.01 to 10 2.8% 4.6% 3.9% 1.6% 1.8% 2.6% 3.4% 2.4%10.01 to 11 2.8% 4.2% 4.7% 2.7% 2.6% 2.5% 3.0% 2.3%11.01 to 15 7.1% 14.1% 12.7% 3.9% 4.5% 6.0% 8.9% 5.4%More than 15 10.2% 25.3% 24.0% 4.4% 4.7% 8.1% 12.8% 6.5%
TOTAL 100.0% 100.0% 100.0% 100.0% 100.0% 100.0% 100.0% 100.0%(b)Does not include internal-external, external-internal, and external-external trips via all modes made by residents of seven-county area.
80
Table 60ANumber of Trips by Mode and Distance (Miles): Seven-County Area(a)
DroveDrove With Auto Rode as Public School
Miles Walk Bike Alone Passenger Driver Passenger Transit Bus Motorcycle Taxi Other Refused Total*
1.0 or less 469,520 53,008 506,457 249,648 756,105 305,981 14,637 19,334 - 2,297 2,983 777 1,624,6421.01 to 2 107,833 56,973 695,889 325,728 1,021,617 411,031 32,529 25,089 4,423 2,332 718 407 1,662,9522.01 to 3 23,368 26,669 672,387 333,141 1,005,527 409,320 40,425 27,332 - 1,743 2,569 157 1,537,1103.01 to 4 14,044 19,182 530,796 232,796 763,592 287,590 19,467 12,906 461 903 1,196 - 1,119,3414.01 to 5 8,726 6,308 418,344 195,927 614,271 225,994 33,636 13,397 1,381 1,506 - 198 905,4175.01 to 6 6,540 6,256 331,000 145,989 476,989 179,487 21,115 16,600 230 732 - - 707,9496.01 to 7 5,183 3,326 247,942 106,352 354,294 140,035 12,629 5,485 - - - 379 521,3317.01 to 8 4,749 437 226,193 86,719 312,912 91,820 13,660 4,580 631 301 - - 429,0908.01 to 9 1,038 914 191,917 71,950 263,866 95,571 10,251 979 - 351 793 - 373,7639.01 to 10 1,549 2,328 194,410 48,610 243,020 59,176 10,781 198 - 538 - - 317,59010.01 to 11 2,674 1,263 179,453 59,452 238,905 77,455 4,993 2,155 - - - - 327,44511.01 to 15 4,835 983 499,554 138,403 637,957 161,889 19,369 3,782 - 1,129 - - 829,944More than 15 7,264 1,233 813,815 197,026 1,010,841 254,211 33,171 6,331 457 - 1,935 420 1,315,863
TOTAL 657,323 178,880 5,508,157 2,191,741 7,699,896 2,699,560 266,663 138,168 7,583 11,832 10,194 2,338 11,672,439Average 1.51 2.30 7.69 6.19 7.27 6.26 6.71 4.4 3.52 4.05 7.41 7.17 6.58
(a)Includes internal-external, external-internal, and external-external trips made by residents of seven-county area.*Total does not include “Auto Driver” category.
81
Table 60BNumber of Trips by Mode and Distance: Seven-County Area(b)
DroveDrove With Auto Rode as Public School
Minutes Walk Bike Alone Passenger Driver Passenger Transit Bus Motorcycle Taxi Other Refused Total*
1.0 or less 469,520 53,008 506,229 249,648 755,877 305,981 14,637 19,334 - 2,297 2,983 777 1,624,4141.01 to 2 107,833 56,973 692,507 324,447 1,016,954 410,039 32,529 25,089 4423.2487 2,332 718 407 1,657,2972.01 to 3 23,368 26,669 669,724 330,395 1,000,119 408,000 40,425 27,332 - 1,743 2,569 157 1,530,3823.01 to 4 12,801 19,182 517,098 222,780 739,877 280,098 19,467 12,906 460.6450 903 1,196 - 1,086,8914.01 to 5 8,162 6,308 414,194 192,697 606,891 222,661 33,636 13,397 1380.7111 1,506 - 198 894,1405.01 to 6 6,540 6,256 330,007 144,858 474,865 178,691 21,115 16,600 230.3225 732 - - 705,0296.01 to 7 5,183 3,326 247,014 105,778 352,792 139,461 12,629 5,485 - - - 379 519,2557.01 to 8 4,749 437 223,300 85,714 309,015 91,820 13,660 4,580 631.4092 301 - - 425,1938.01 to 9 1,038 914 189,812 71,281 261,093 93,970 10,251 979 - 351 793 - 369,3899.01 to 10 1,549 2,328 192,788 48,066 240,854 58,662 10,781 198 - 538 - - 314,91010.01 to 11 2,674 1,263 177,698 57,148 234,846 70,107 4,993 2,155 - - - - 316,03811.01 to 15 4,835 983 491,433 130,834 622,266 156,064 19,369 3,782 - 1,129 - - 808,428More than 15 5,455 1,233 742,031 161,623 903,654 211,669 33,171 6,331 457.1367 - 1,337 287 1,163,594
TOTAL 653,707 178,880 5,393,835 2,125,269 7,519,103 2,627,223 266,663 138,168 7,583 11,832 9,596 2,205 11,414,961Average 1.33 2.30 7.31 5.65 6.84 5.69 6.71 4.4 3.52 4.05 5.04 4.94 6.15
(b)Does not include internal-external, external-internal, and external-external trips made by residents of seven-county area.*Total does not include “Auto Driver” category.
82
Table 61APercent of Trips by Mode and Distance: Seven-County Area(a)
DroveDrove With Auto Rode as Public School
Miles Walk Bike Alone Passenger Driver Passenger Transit Bus Motorcycle Taxi Other Refused Total*
1.0 or less 71.4% 29.6% 9.2% 11.4% 9.8% 11.3% 5.5% 14.0% 0.0% 19.4% 29.3% 33.2% 13.9%1.01 to 2 16.4% 31.9% 12.6% 14.9% 13.3% 15.2% 12.2% 18.2% 58.3% 19.7% 7.0% 17.4% 14.2%2.01 to 3 3.6% 14.9% 12.2% 15.2% 13.1% 15.2% 15.2% 19.8% 0.0% 14.7% 25.2% 6.7% 13.2%3.01 to 4 2.2% 10.7% 9.6% 10.6% 9.9% 10.7% 7.3% 9.3% 6.1% 7.6% 11.7% 0.0% 9.6%4.01 to 5 1.3% 3.5% 7.6% 8.9% 8.0% 8.4% 12.6% 9.7% 18.2% 12.7% 0.0% 8.5% 7.8%5.01 to 6 1.0% 3.5% 6.0% 6.7% 6.2% 6.6% 7.9% 12.0% 3.1% 6.2% 0.0% 0.0% 6.1%6.01 to 7 0.8% 1.9% 4.5% 4.8% 4.6% 5.2% 4.7% 4.0% 0.0% 0.0% 0.0% 16.2% 4.5%7.01 to 8 0.7% 0.2% 4.1% 4.0% 4.1% 3.4% 5.1% 3.3% 8.3% 2.6% 0.0% 0.0% 3.7%8.01 to 9 0.2% 0.5% 3.5% 3.3% 3.4% 3.5% 3.9% 0.7% 0.0% 3.0% 7.8% 0.0% 3.2%9.01 to 10 0.2% 1.3% 3.5% 2.2% 3.1% 2.2% 4.0% 0.1% 0.0% 4.6% 0.0% 0.0% 2.7%10.01 to 11 0.4% 0.7% 3.3% 2.7% 3.1% 2.9% 1.9% 1.6% 0.0% 0.0% 0.0% 0.0% 2.8%11.01 to 15 0.7% 0.6% 9.1% 6.3% 8.3% 6.0% 7.3% 2.7% 0.0% 9.5% 0.0% 0.0% 7.1%More than 15 1.1% 0.7% 14.8% 9.0% 13.1% 9.4% 12.4% 4.6% 6.0% 0.0% 19.0% 18.0% 11.3%
TOTAL 100.0% 100.0% 100.0% 100.0% 100.0% 100.0% 100.0% 100.0% 100.0% 100.0% 100.0% 100.0% 100.0%
(a)Includes internal-external, external-internal, and external-external trips made by residents of seven-county area.*Total does not include “Auto Driver” category.
83
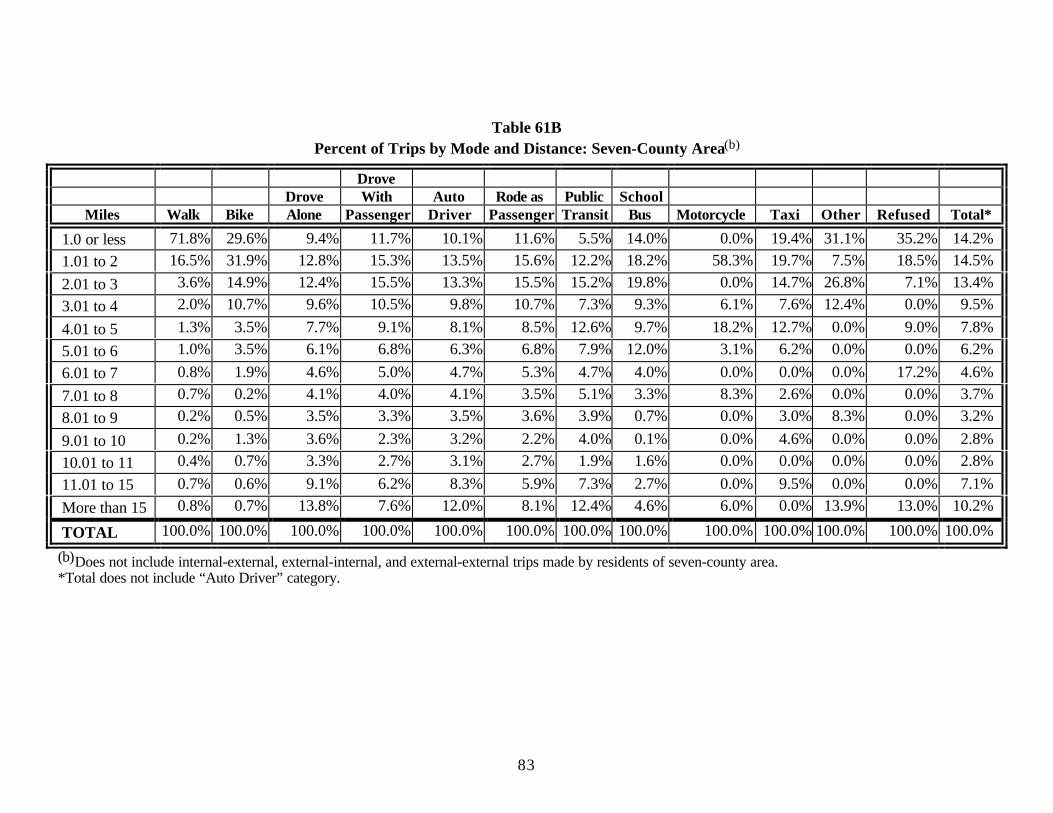
Table 61BPercent of Trips by Mode and Distance: Seven-County Area(b)
DroveDrove With Auto Rode as Public School
Miles Walk Bike Alone Passenger Driver Passenger Transit Bus Motorcycle Taxi Other Refused Total*
1.0 or less 71.8% 29.6% 9.4% 11.7% 10.1% 11.6% 5.5% 14.0% 0.0% 19.4% 31.1% 35.2% 14.2%1.01 to 2 16.5% 31.9% 12.8% 15.3% 13.5% 15.6% 12.2% 18.2% 58.3% 19.7% 7.5% 18.5% 14.5%2.01 to 3 3.6% 14.9% 12.4% 15.5% 13.3% 15.5% 15.2% 19.8% 0.0% 14.7% 26.8% 7.1% 13.4%3.01 to 4 2.0% 10.7% 9.6% 10.5% 9.8% 10.7% 7.3% 9.3% 6.1% 7.6% 12.4% 0.0% 9.5%
4.01 to 5 1.3% 3.5% 7.7% 9.1% 8.1% 8.5% 12.6% 9.7% 18.2% 12.7% 0.0% 9.0% 7.8%5.01 to 6 1.0% 3.5% 6.1% 6.8% 6.3% 6.8% 7.9% 12.0% 3.1% 6.2% 0.0% 0.0% 6.2%6.01 to 7 0.8% 1.9% 4.6% 5.0% 4.7% 5.3% 4.7% 4.0% 0.0% 0.0% 0.0% 17.2% 4.6%7.01 to 8 0.7% 0.2% 4.1% 4.0% 4.1% 3.5% 5.1% 3.3% 8.3% 2.6% 0.0% 0.0% 3.7%8.01 to 9 0.2% 0.5% 3.5% 3.3% 3.5% 3.6% 3.9% 0.7% 0.0% 3.0% 8.3% 0.0% 3.2%
9.01 to 10 0.2% 1.3% 3.6% 2.3% 3.2% 2.2% 4.0% 0.1% 0.0% 4.6% 0.0% 0.0% 2.8%10.01 to 11 0.4% 0.7% 3.3% 2.7% 3.1% 2.7% 1.9% 1.6% 0.0% 0.0% 0.0% 0.0% 2.8%11.01 to 15 0.7% 0.6% 9.1% 6.2% 8.3% 5.9% 7.3% 2.7% 0.0% 9.5% 0.0% 0.0% 7.1%More than 15 0.8% 0.7% 13.8% 7.6% 12.0% 8.1% 12.4% 4.6% 6.0% 0.0% 13.9% 13.0% 10.2%
TOTAL 100.0% 100.0% 100.0% 100.0% 100.0% 100.0% 100.0% 100.0% 100.0% 100.0% 100.0% 100.0% 100.0%
(b)Does not include internal-external, external-internal, and external-external trips made by residents of seven-county area.*Total does not include “Auto Driver” category.