Embed Size (px)
Citation preview

The ShoppeS of Murray600 N 12th Street
Murray, Kentucky 42071
offeriNg MeMoraNduM

This Offering Memorandum and any subsequent evaluation material you may be provided (collectively known as the “Offering Memorandum”) is intended solely for your limited use in considering whether to pursue negotiations to acquire The Shoppes of Murray (the “Property”) located in Murray, Kentucky. The Property is being marketed for sale by Ackerman & Co. (“Broker”).
The Offering Memorandum contains brief, selected information pertaining to the business and affairs of the Property and has been prepared by Broker. It does not, however, purport to be all-inclusive or to contain all of the information that a prospective purchaser may desire. Broker makes no representation or warranty, express or implied, as to the accuracy or completeness of the Offering Memorandum or any of its contents, and no legal liability is assumed to be implied with respect thereto.
By acknowledgment of your receipt of the Offering Memorandum you agree that the Offering Memorandum and its contents are confidential, that you will hold and treat it in the strictest of confidence, that you will not directly or indirectly disclose, or permit anyone else to disclose, the Offering Memorandum or its contents to any other person, firm, or entity (including, without limitation, any principal for whom you have been engaged), without prior written authorization of Owner or Broker and that you will not use or permit to be used the Offering Memorandum or its contents to be copied or used in any fashion or manner detrimental to the interest of Owner. Photocopy or other duplication is strictly prohibited.
THE OFFERING MEMORANDUM SHALL NOT BE DEEMED TO REPRESENT THAT STATE OF AFFAIRS OF THE PROPERTY OR CONSTITUTE AN INDICATION THAT THERE HAS BEEN NO CHANGE IN THE BUSINESS OR AFFAIRS OF THE PROPERTY SINCE THE DATE OF PREPARATION OF THE OFFERING MEMORANDUM.
The information provided in the Offering Memorandum has been gathered from sources that are deemed reliable, but the Broker does not warrant or represent that the information is true or correct. Prospective offerors are advised to verify information independently. The Offering Memorandum is not to be construed as an offer or as any part of a contract to sell the property.
Furthermore, the inclusion or exclusion in the Offering Memorandum of information relating to asbestos or any other hazardous, toxic or dangerous chemical item, waste or substance (hereinafter collectively referred to as “Waste”) relating to the Property shall in no way be construed as creating any warranties or representations, expressed or implied by the Broker as to the existence or nonexistence or nature of Waste in, under or on the Property, it may create significant legal and/or economic obligations upon the Owner, lessee and/or other holders of interest in the Property or a part thereof and you are hereby advised to obtain professional assistance such as from a consultant, engineer and/or attorney prior to taking an interest in the Property or a part thereof.
CONFIDENTIAL INFORMATIONINFORMATION NOT WARRANTED

01 EXECUTIVE SUMMARY Investment Summary Location and Demographics Property Photographs Property Aerials Property Overview
02 TENANT OVERVIEw Tenant Overview Rent Roll Site Plan
iNveSTMeNT SaleS TeaM
SeaN W. paTriCK vice president, investment Sales
ackerman & [email protected]
JaSoN poWell, CCiMvice president, investment Sales
ackerman & [email protected]
SpeNCer CoaN, CCiM, Caiavice president, investment Sales Ky re#73329
ackerman & [email protected]
Bill MiTChelldirector
iCap realty [email protected]
Table Of COnTenTsThe ShoppeS of Murray
03 MARkET OVERVIEw Murray, kentucky Detailed Demographics
04 fINANCIAL OVERVIEw Executive Summary Summary of financial Assumptions Cash flow Projections Existing Lease Projections In-Place Income Reconciliation

the shoppes of murray
EXECUTIVE SUMMARY Investment Summary Location and Demographics Property Photographs Property Aerials Property Overview
01

ThE ShOPPES OF MuRRAy 5
Redeveloped in 1999, The Shoppes of Murray is strategically located across the street from Murray State university. Over the years, the center has provided a stable tenant base with high occupancy and high historical tenant retention. Murray’s stable university environment, combined with one of the top eight certified retirement communities in Kentucky, gives an investor a safe investment opportunity.
The Shoppes of Murray offers an investor the opportunity to acquire a stabilized, well located center with strong national tenants for an attractive year one cash-on-cash return of 9.83%. Pursuant to the rent roll, over 68% of the gross leasable area is leased by creditworthy national retailers. The rent roll at The Shoppes of Murray currently includes the following national credit tenants; Office Depot, Tractor Supply, Goody’s, hibbett Sports, Sherwin Williams, uPS, Radio Shack, Rue 21, and Maurice’s.
Investment highlights:
� Stabilized shopping center with 98.12% occupancy � year 1 Leveraged cash-on-cash return of 9.83% � Stable location directly across from “Kentucky’s Public Ivy-League
university” Murray State university; student population of 10,623 � Anchors Tractor Supply and Goody’s currently in lease obligations thru 2020 � Built-In rent increases: Office Depot’s rent increases in Oct 2013 � historically successful track record with high tenant retention � Offered well below replacement costs at $71.82/SF
INVESTMENT SUMMARY
01 ExEcutivE Summary
Square Footage: 159,192 Sf
Land Area: 12.92 AC
Offering Price: $11,433,000 ($71.82/Sf)
Debt Structure: Assumable/Non Recourse
In-place Net Operating Income: $1,000,415
In-place Capitalization Rate: 8.75%
Year 1 Leveraged Cash-on-Cash Return: 9.85%
Lender: GE Capital
Loan Balance (as of 7/1/2012): $7,198,743
Original Principal Balance (1/1/2006): $8,000,000
Equity Required: $4,313,675
Interest Rate: 5.5%
Maturity Date: January 1, 2016
Monthly Payment: $45,423.12
Amortization Schedule: 30 years
Recourse: N
INVESTMENT DETAILS
LOAN SuMMARy
Ackerman & Co. is pleased to present for sale, The Shoppes of Murray, a 159,192 SF anchored shopping center located in Murray, Kentucky. With 98.12% occupancy, The Shoppes of Murray provides an investor with stable cash flow from an impressive lineup of national credit tenants and a strategic location across the street from Murray State university.

ThE ShOPPES OF MuRRAy 6
H
Murray State University
121
80
121
641
College Farm Rd Chestnut St
N 1
2th
St
S 1
2th
St
S 1
6th
St
Sycamore St
Glendale Rd
N 1
2th
St
N 1
6th
St
Wiswell Rd W
Rob
erts
on R
dS
tate
Hw
y 16
60
N 1
7th
St
S 1
8th
St
Murray CallowayCounty Hospital
shoppes of murray600 N 12th streetmurray, KeNtucKy 42071
source: 2011 mpsI systems Inc. d.b.a. Datametrix®
* Includes student poulation of murray state university
TRAffIC COUNTS
26,320 vEhICLES PER DAY ON N 12Th STREET (hwY 461)
13,931 vEhICLES PER DAY ON ChESTNUT STREET
DEMOGRAPhIC SuMMARy
The subject property, The Shoppes of Murray, located in Murray, Ky was completely renovated in 1999 and is in excellent physical condition. The shopping center is located on 12th Street (uS hwy 641) directly across from Murray State university. The center has a signalized intersection on 12th Street and multiple ingress/egress on Arcadia Circle and cross access with Chestnut hills Mall. In 2011, the total population in a 1-mile radius, including students, is 18,555.
LOCATION AND DEMOGRAPHICS
01 ExEcutivE Summary
1 Mile 3 MileS 5 MileS
Population 2011 18,555* 29,296* 33,887*
Total households 2,889 7,928 9,841
Average household $35,953 $43,338 $44,733

ThE ShOPPES OF MuRRAy 7
PROPERTY PHOTOGRAPHS
01 ExEcutivE Summary

ThE ShOPPES OF MuRRAy 8
PROPERTY PHOTOGRAPHS
01 ExEcutivE Summary

ThE ShOPPES OF MuRRAy 9
murraystate
university
potential outparcel
Arcadia Circle
N 1
2th
St
641
26,3
20 v
EhIC
LES
PER
DA
Y
shoppes of murray600 N 12th streetmurray, KeNtucKy 42071
PROPERTY AERIAL
01 ExEcutivE Summary

ThE ShOPPES OF MuRRAy 10
Chestnut St
N 1
3th
St
121
Wal
mar
t DrLowes Dr
murraystate
university
cfsB center 641
N 1
6th
St
N 1
2th
St
Arcadia Cir
26,3
20 v
EhIC
LES
PER
DA
Y
11,824 vEhICLES PER DAY
13,931 vEhICLES PER DAY
13,095 vEhICLES PER DAY
College Farm Rd
shoppes of murray600 N 12th streetmurray, KeNtucKy 42071
PROPERTY AERIAL
01 ExEcutivE Summary

ThE ShOPPES OF MuRRAy 11
PROPERTY OVERVIEW
Address: 600 N 12th Street Murray, kentucky 42071
County: Calloway
Municipality: City of Murray
Building Size: 159,192 Square feet
Land Area Lot A: (Shopping Center) 11.78 acres Lot D: (Outparcel) 1.14 acres Total: 12.92 acres
Parcel ID: 041-0-0192
Year Renovated: 1999
Construction: Masonry
Zoning: B-2 (highway Business)
Parking: 545 parking spaces; 517 regular, 28 handicap 4.27 / 1000 parking ratio
Signage: Large tenant monument sign off 12th Street
frontage: 982’ along North 12th Street
Traffic Count: 26,320 (N 12th Street)
01 ExEcutivE Summary

ThE ShOPPES OF MuRRAy 12
641
24
24
2440
65
65
65
69
69
57
155
Nashville
Murray
Martin
Greenfield
Huntingdon
Gleason
McKenzieNewbern
Dyer
TrentonDryersburg
Paris
Waverly
Camden
Erin
Cadiz
Eddyville
Princeton
Darlington
NortonvilleGreenville
Dickson
SpringfieldClarksville
Hopkinsville Russellville
Franklin
Scottsville
Hendersonville
Fairview
Centerville
BentonMayfield
KENTUCKY
TENNESSEE
Woodlawn
Metropolis
Union City
Jackson
Nashville, tennesee.......................120 miles
Key DIstaNces
shoppes of murray600 N 12th streetmurray, KeNtucKy 42071
AREA MAP
01 ExEcutivE Summary

the shoppes of murray
TENANT OVERVIEw Tenant Overview Rent Roll Site Plan
02

ThE ShOPPES OF MuRRAy 14
TENANT SUMMARY
SQUARE fOOTAGE21,179
LEASE EXPIRATION09/2015
SQUARE fOOTAGE24,490
LEASE EXPIRATION3/2020
Founded in 1986, Office Depot is a specialty retailer focused on providing office products and services to consumers. The company has three different core business divisions: North American Retail Division, North American Business Solutions Division, and The International Division. Within the three divisions, the company has three major product categories: office supplies, business related technology products, and office/business related furniture. Office Depot currently operates over 1,100 stores in 48 states. Office Depot’s international division sells products to consumers in over 51 countries through a network of internet retail sites, direct mail catalogs, contract sales forces, and other retail stores through franchise agreements, licensing, and joint ventures. Office Depot currently holds an S&P credit rating of B-.
Tractor Supply Company (TSC) originally opened in 1938 as mail order tractor parts business. One year later, in 1939, the first store opened in Minot, ND. Today, TSC operates as a specialty retailer supplying farming and maintenance needs to part and full time ranchers/farmers through their 1,100+ stores in 44 states. In 2004, TSC was named one of the fastest growing companies in the country by Fortune Magazine. In 2010 TSC’s revenues were broken down as follows: livestock and pet products (39%), tools and truck products (22%), seasonal/lawn and garden products (22%), clothing and footwear (10%), and agriculture (6%). TCS’s growth continues as they added 74 new stores in 2010 and recently identified over 800 potential markets for u.S. stores.
Office Depot, Inc. (NySE: ODP)S&P Rating: B- headquarters: Boca Raton, FL Store Locations: 1,129
year Founded: 1986Employees: 42,0002011 Revenue: $11.49Bwww.officedepot.com
Tractor Supply Company (NASDAQ: TSCO)S&P Rating: NAheadquarters: Brentwood, TN (Nashville) Store Locations: 1,100
year Founded: 1938Employees: 6,900 2011 Revenue: $4Bwww.tractorsupply.com
02 tenant overview

ThE ShOPPES OF MuRRAy 15
TENANT SUMMARY
SQUARE fOOTAGE17,000
LEASE EXPIRATION01/2020
SQUARE fOOTAGE5,000
LEASE EXPIRATION06/2016
Goody’s retail store operates under the parent company of Stage Stores, Inc. Stage Stores Inc. is a large retailer department store operator which, in addition to Goody’s, operates under the following retail banners: Bealls, Palais, Royal, Peebles, and Stage. In total, Stage Stores operates over 786 stores in 39 different states. The Stage Stores retailers mostly sell private label apparel, accessories, cosmetics, and footwear to men, women, and children.
Maurices retail store operates as a subsidiary of the Ascena Retail Group. The Ascena Retail Group is a large retailer department store operator that offers causal fashion apparel for women in the 30-50 year old demographic. Ascena operates over 2,500 stores in 48 u.S. states, the District of Columbia, Puerto Rico, and Canada. Ascena Retail Group operates under the following brands: Maurices, Dressbarn, and Justice Stores. According to Ford Equity Research, Ascena Retail Group has posted earnings increases for five consecutive quarters showing strong acceleration in quarterly growth rates.
Stage Stores, Inc. d/b/a Goody’s (NySE: SSI)S&P Rating: NA headquarters: houston, TX Store Locations: 786
year Founded: 1988www.stagestoresinc.comwww.goodysonline.com
Ascena Retail Group d/b/a Maurices (NASDAQ: ASNA)S&P Rating: NA headquarters: Suffern, Ny Store Locations: 2,516 (786 operated as Maurices)
2011 Revenue: $2.8B www.ascenaretail.comwww.maurices.com
02 tenant overview

ThE ShOPPES OF MuRRAy 16
TENANT SUMMARY
SQUARE fOOTAGE5,000
LEASE EXPIRATION01/2014
SQUARE fOOTAGE4,900
LEASE EXPIRATION06/2014
Founded in 1945, hibbett Sports operates over 800 sporting goods retail stores in 26 states. hibbett Sports focuses their business in small to mid size markets throughout the Southeast, Midwest, Southwest, and Mid-Atlantic. hibbett offers a full assortment of athletic apparel, equipment, and footwear. hibbett also emphasizes on selling team sports equipment to local athletic leagues within their respective markets. hibbett Sports typically occupies a 5,000-square-foot store footprint located in malls and large anchored shopping centers.
Originally founded in 1866, Sherwin Williams develops, manufactures, and sells paints, coatings, and other related products to professional, commercial, industrial, and retail customers throughout the world. Sherwin Williams’s revenues can be separated into three different categories: Retail Paint Store Segment (56% of 2010 revenues), The Consumer Segment (17%), and The Global Finishes Segment (27%). According to S&P, Sherwin Williams has consistently outperformed their peers in the Specialty Chemicals sector. Sherwin Williams currently holds an S&P credit rating of A and operates over 3,400 retail stores in North America.
hibbett Sports, Inc. (NASDAQ: hIBB)S&P Rating: NAheadquarters: Birmingham, AL Store Locations: 800
year Founded: 1945Employees: 6,700 2011 Revenue: $733Mwww.hibbett.com
Sherwin Williams (NySE: ShW)S&P Rating: A headquarters: Cleveland, Oh Store Locations: 3,400
year Founded: 1866Employees: 32,0002011 Revenue: $8.77Bwww.sherwin-williams.com
02 tenant overview

ThE ShOPPES OF MuRRAy 17
TENANT SUMMARY
SQUARE fOOTAGE5,000
LEASE EXPIRATION01/2014
SQUARE fOOTAGE1,804
LEASE EXPIRATION09/2016
Rue 21 is a specialty retailer focused on apparel for young men and women between the ages of 11-17. Apparel products include: graphic t-shirts, denim, dresses, shirts, belts, jewelry, handbags, and fragrances. The company sells several lines of their own brands through their network of over 600 retail stores in 44 states. According to Ford Equity Research, Rue 21 has posted positive earnings for five consecutive quarters with acceleration in quarterly growth rates.
Founded in 1984, Papa John’s is an international Pizza chain which operates over 3,600 locations worldwide. Over 2,500 of the locations are in the united States where the company was founded. Of the 3,646 locations, approximately 3,034 are franchised and 612 are corporately owned. Papa John’s is widely regarded as the third largest pizza chain in the united States behind Pizza hut and Domino’s. Over recent years, Papa John’s has shown steady growth and increased revenue. Their commitment to quality ingredients and customer service has been their formula for success.
Rue 21 (NASDAQ: RuE)S&P Rating: NAheadquarters: Warrendale, PA Store Locations: 638
year Founded: 1987Employees: 1,800www.rue21.com
Papa John’s International Inc. (NASDAQ: PZZA)S&P Rating: NA headquarters: Louisville, Ky Store Locations: 3,646
year Founded: 1984Employees: 16,0002011 Revenue: $1.13Bwww.papajohns.com
02 tenant overview

ThE ShOPPES OF MuRRAy 18
TENANT SUMMARY
SQUARE fOOTAGE4,000
LEASE EXPIRATION09/2015
SQUARE fOOTAGE2,100
LEASE EXPIRATION08/2015
GameStop Corp is the world’s largest retailer of video game and PC game products. The company sells games and game accessories in addition to running Game Informer Magazine the world’s largest publication for video games. Gamestop operates over 6,600 locations in the u.S., Canada, Australia, and Europe under the names Gamestop, EB Games, and Micromania. Gamestop has beaten the market in their industry and shown consistent growth over the past several years. According to S&P, Gamestop has posted a 3 year growth rate (Fy ’08 – Fy ’11) of 11%. The S&P growth rate for the Computer and Electronics Retail sub-sector was approximately 8% over this time period.
Originally founded in 1899, Radio Shack engages in the retail sale of consumer electronics and services through their retail store and non-Radio Shack operated kiosk network. The company operates throughout u.S., Puerto Rico, and the u.S. Virgin Islands. Their store locations carry a variety of named brand and Radio Shack brand electronic products. Their kiosk products are often found inside kiosk stations located in Target retail stores. Radio Shack also provides consumers access to third-party wireless telephone services. Radio Shack currently holds an S&P credit rating of B+.
GameStop Corp. (NySE: GME)S&P Rating: NA headquarters: Grapevine, TX Store Locations: 6,670
year Founded: 1994Employees: 68,0002011 Revenue: $9.47Bwww.gamestop.com
Radio Shack Corp. (NySE: RSh) S&P Rating: B+ headquarters: Fort Worth, TX Store Locations: 4,476
year Founded: 1899Employees: 34,0002011 Revenue: $4.37Bwww.radioshack.com
02 tenant overview

ThE ShOPPES OF MuRRAy 19
TENANT SUMMARY
02 tenant overview
SQUARE fOOTAGE1,520
LEASE EXPIRATION05/2015
Advance America, Cash Advance Centers, Inc. provides cash advance services throughout the u.S., u.K., and Canada. The company franchises stores abroad, but does not franchise any of its 2,767 centers (33 states) in the u.S. The company’s core focus is with providing unsecured short term loans which are typically required to be paid off out of the customer’s next pay check. Advance America does not provide any title lending or pawn services. The typical Advance America customer is a middle-income working individual looking for an advance on their next paycheck. Advance America typically operates out of retail shopping centers in middle-income demographic areas.
Advance America, Cash Advance Centers, Inc. (NySE:AEA) S&P Rating: NAheadquarters: Spartanburg, SC Store Locations: 2,790
year Founded: 1997Employees: 5,8002011 Revenue: $625M (estimate)www.advanceamerica.net
SQUARE fOOTAGE1,443
LEASE EXPIRATION06/2013
heights Finance is a privately held lending corporation providing consumer loans and services for items such as: Tuition Money, Bill Consolidation, Establishing Credit, Extra Cash, Personal Loans, Auto Loans, home Improvement Loans, and Refinancing. Founded in 1992, the company operates 87 locations across the following six states: Kentucky, Tennessee, Missouri, Indiana, Illinois, and Wisconsin.
heights Finance Corporation (Private)S&P Rating: NAheadquarters: Peoria, IL Store Locations: 87
year Founded: 1992Employees: NA2011 Revenue: NAwww.heightsfinance.com

ThE ShOPPES OF MuRRAy 20
TENANT SUMMARY
02 tenant overview
SQUARE fOOTAGE1,600
LEASE EXPIRATION04/2015
Originally founded in 1907, united Parcel Service, Inc. (uPS) is the world’s largest express and package delivery company. The company delivers more than 15 million packages per day throughout over 220 countries and territories around the world. Domestic package delivery services accounted for approximately 60% of uPS’ revenues in 2011. It is estimated that as much as 85% of the 15 million packages per day are shipped by the company’s ground delivery service. uPS has posted three straight years of positive revenue and net income. With an S&P Credit Rating of AA-, uPS has been widely regarded as one of the most financially sound originations in America.
united Parcel Service (uPS) (NySE: uPS)S&P Rating: AA+ headquarters: Atlanta, GA Store Locations: 4,323 (uPS Store Locations)
year Founded: 1907Employees: 250,0002011 Revenue: $53.10Bwww.ups.com
SQUARE fOOTAGE2,500
LEASE EXPIRATION09/2013
Bank of Cadiz operates five locations throughout the greater Cadiz, Ky area. The bank was originally chartered in 1970. The bank is estimated to hold over $100 Million in assets. According to www.depositaccounts.com, the bank has an overall institution health score of 5 out of 5 with a Texas Ratio of only 1.72%.
Bank of Cadiz & Trust Co. (Private) S&P Rating: NA headquarters: Cadiz, Ky Store Locations: 5
year Founded: 1970Employees: 35Total Assets: $104.59M (2011)www.bankofcadiz.com

ThE ShOPPES OF MuRRAy 21
TENANT SUMMARY
SQUARE fOOTAGE6,920
LEASE EXPIRATION08/2013
Nick’s Family Sports Bar is a local favorite hangout before Murray State university Games. There are plenty of menu options, including appetizers, beers and pizza.
www.nicksmurray.com
02 tenant overview

ThE ShOPPES OF MuRRAy 22
RENT ROLL
TENANT NAME TYPE & SUITE NUMBER LEASE
DATES & TERM
fLOOR Sf BLDG ShARE
RATE & AMOUNTPER YEAR
PER MONTh
ChANGES ON
ChANGESTO
CPI & CURRENTPORTERS’ wAGEMISCELLANEOUS
MONThSTO
ABATE
PCNTTO
ABATE
DESCRIPTION Of OPERATING
EXPENSEREIMBURSEMENTS
IMPRVMNTSRATE
AMOUNT
COMMSSNSRATE
AMOUNT
ASSUMPTION ABOUT
SUBSEQUENT TERMSfOR ThIS TENANT
COMMENTS
Office Depot Retail, Suite: A Jun-2000 to Sep-2015 184 Months
21,17913.29%
$5.19
$110,000 $0.43 $9,167
Oct-2013
$5.67
Office Depot Reimbursement
Market
Anchor >10K SF
Space is 21,179 SF, but reimbursements are calculated with 20,000 SF as floor area for
tenant. Pro-rata share is 16.94% and has been calculated as such
in model.
Sherwin-Williams Retail, Suite: B Jul-2001 to Jun-2014 156 Months
4,9003.08%
$10.35 $50,712 $0.86 $4,226
NNN
Market Shops < 5K SF
Two (2) x Five (5) year Options. 1st Option at $4,606/month; 2nd
Option at $5,202/month.
Express Tans Retail, Suite: C Feb-2006 to Feb-2016 121 Months
2,5001.57%
$13.00 $32,496 $1.08 $2,708
Full Service: Pays no expense reimbursement.
Market Shops < 5K SF
One (1) x Five (5) year Option at $3,125/month. Agreement made with tenant to keep rental rate at
$2,708/month.
Papa Johns Pizza Retail, Suite: D Oct-2001 to Sep-2016 180 Months
1,8041.13%
$14.00 $25,256 $1.17 $2,105
NNN Market
Shops < 5K SF
Gamestop Retail, Suite: E Nov-2010 to Sep-2015 59 Months
4,0002.51%
$9.00 $36,000 $0.75 $3,000
Gamestop Reimbursement
Market Shops < 5K SF
Two (2) x Five (5) year Options. 1st Option at $3,250/month; 2nd Option at $3,500/month. Space is 4,000 SF, but part of the space is suited primarily for storage, so owners consider the space
to be 2,660 SF for present tenant.
Radio Shack Retail, Suite: F Aug-2000 to Aug-2015 181 Months
2,1001.32%
$11.25 $23,625 $0.94 $1,969
NNNMarket
Shops < 5K SF Two (2) x Five (5) year Options.
1st Option at $2,056.25/month; 2nd Option at $2,143.75/month.
Fiesta Grill Retail, Suite: G Jul-2011 to Jul-2016 61 Months
3,2402.03%
$14.00 $45,360 $1.17 $3,780
Jul-2013 $14.43 Full Service:
Pays no expense reimbursement.
Market Shops < 5K SF
Two (2) x Five (5) year Options. 1st Option at $4,284.50/month for years
1-2, $4,712.95/month for years 3-4, $5,184.25/month for year 5;
2nd Option at $4,948.60/month for years 1-2, $5,443.46 for years 3-4,
$5,987.81 for year 5.
02 tenant overview

ThE ShOPPES OF MuRRAy 23
RENT ROLL
TENANT NAME TYPE & SUITE NUMBER LEASE
DATES & TERM
fLOOR Sf BLDG ShARE
RATE & AMOUNTPER YEAR
PER MONTh
ChANGES ON
ChANGESTO
CPI & CURRENTPORTERS’ wAGEMISCELLANEOUS
MONThSTO
ABATE
PCNTTO
ABATE
DESCRIPTION Of OPERATING
EXPENSEREIMBURSEMENTS
IMPRVMNTSRATE
AMOUNT
COMMSSNSRATE
AMOUNT
ASSUMPTION ABOUT
SUBSEQUENT TERMSfOR ThIS TENANT
COMMENTS
Advance America Retail, Suite: h May-2000 to May-2015 181 Months
1,5200.95%
$11.84 $18,000 $0.99 $1,500
NNN
Market Shops
< 5K SF One (1) x Three (3) year Option
at $1,550/month.
hibbett Sports Retail, Suite: I Jul-2000 to Jan-2014 163 Months
5,0003.14%
$9.50 $47,500 $0.79 $3,958
NNN
Market Jr. Anchor(5K - 10K SF)
Two (2) x Five (5) year Options. 1st Option at $4,375/month; 2nd
Option at $4,791.67/month.
heights Finance Retail, Suite: J Jul-2003 to Jun-2013| 120 Months
1,4490.91%
$13.75 $19,920 $1.15 $1,660
heights Finance Reimbursement
Market Shops < 5K SF
One (1) x Three (3) year Option at $1,743/month.
Nicks Family Sports BarRetail, Suite: K Dec-2003 to Aug-2013 117 Months
6,9204.34%
$9.82 $67,926 $0.82 $5,660
NNN
Market Jr. Anchor (5K - 10K SF)
uPS Retail, Suite: L May-2004 to Apr-2015 132 Months
1,6001.00%
$17.77 $28,428 $1.48 $2,369
Full Service: Pays no expense reimbursement.
Market Shops < 5K SF
Three (3) x Five (5) year Options. Option rent calculated utilizing
CPI over prior term.
Vacant Retail, Suite: M Sep-2012 to Aug-2017 60 Months
3,0001.88%
$12.00 $36,000 $1.00 $3,000
Sep-2013
Sep-2014 Sep-2015 Sep-2016
$12.24 $12.48 $12.73 $12.99
NNN$5.00 $15,000
$4.00 6.41%$12,000
Market Shops < 5K SF
happiness II Retail, Suite: N Jun-2012 to Sep-2014 28 Months
5,0003.14%
$10.80 $54,000 $0.90 $4,500
Full Service: Pays no expense reimbursement.
Market Jr. Anchor (5K - 10K SF)
Strawberry Frozen yogurt Retail, Suite: O Jun-2012 to Aug-2015 39 Months
1,8001.13%
$11.33 $20,400 $0.94 $1,700
Full Service:
Pays no expense reimbursement.
Market Shops
< 5K SF One (1) x Five (5) year Option at
$1,850/month.
02 tenant overview

ThE ShOPPES OF MuRRAy 24
RENT ROLL
TENANT NAME TYPE & SUITE NUMBER LEASE
DATES & TERM
fLOOR Sf BLDG ShARE
RATE & AMOUNTPER YEAR
PER MONTh
ChANGES ON
ChANGESTO
CPI & CURRENTPORTERS’ wAGEMISCELLANEOUS
MONThSTO
ABATE
PCNTTO
ABATE
DESCRIPTION Of OPERATING
EXPENSEREIMBURSEMENTS
IMPRVMNTSRATE
AMOUNT
COMMSSNSRATE
AMOUNT
ASSUMPTION ABOUT
SUBSEQUENT TERMSfOR ThIS TENANT
COMMENTS
LA Nails Retail, Suite: P Jun-2006 to May-2016 120 Months
650
0.41%
$16.62 $10,800 $1.38 $900
Full Service:
Pays no expense reimbursement.
Market Shops < 5K SF
Maurices, Inc. Retail, Suite: Q May-2006 to Jun-2016 122 Months
5,0003.14%
$9.45
$47,250 $0.79 $3,938
NNN
Market Jr. Anchor
(5K - 10K SF)
Two (2) x Five (5) year Options. 1st Option at $4,791.66/month; 2nd Option at $5,208.33/month.
Rue 21 Retail, Suite: R Jun-2008 to Jan-2014 68 Months
5,0003.14%
$13.50 $67,500 $1.13 $5,625
NNNMarket Jr. Anchor
(5K - 10K SF)
Three (3) x Five (5) year Options. 1st Option at $6,187.50/month;
2nd Option at $6,750/month; 3rd Option at $7,487.50/month.
Bank of Cadiz Retail, Suite: S Oct-2007 to Sep-2013 72 Months
2,5001.57%
$10.56 $26,400 $0.88 $2,200
NNNMarket Shops
< 5K SF
Tractor Supply Retail, Suite: T Apr-2010 to Mar-2020 120 Months
24,49015.37%
$6.60
$161,640 $0.55
$13,470
NNN
Market Anchor >10K SF
Four (4) x Five (5) year Options. 1st Option at $14,816/month; 2nd Option at $16,298/month; 3rd Option at $17,928/month; 4th Option at $21,971/month.
Goody’s Retail, Suite: u Jun-2009 to Jan-2020 128 Months
17,00010.67%
$5.50
$93,500 $0.46 $7,792
Full Service:
Pays no expense reimbursement.
Market Anchor >10K SF
Four (4) x Five (5) year Options. 1st Option at $9,208.33/month; 2nd Option at $10,625/month;
3rd Option at $12,041.67/month; 4th Option at $13,458.33/month.
Premier Mini Storage Retail, Suite: V Sep-2000 to Aug-2020 240 Months
38,54024.19%
$3.00
$115,620 $0.25 $9,635
Full Service: Pays no expense reimbursement.
Market
Storage Facility
TOTAL OCCuPIED SF 156,192 98.1%
TOTAL AvAILABLE 3,000 1.9%
TOTAL PROPERTY SF 159,192 100.0%
02 tenant overview
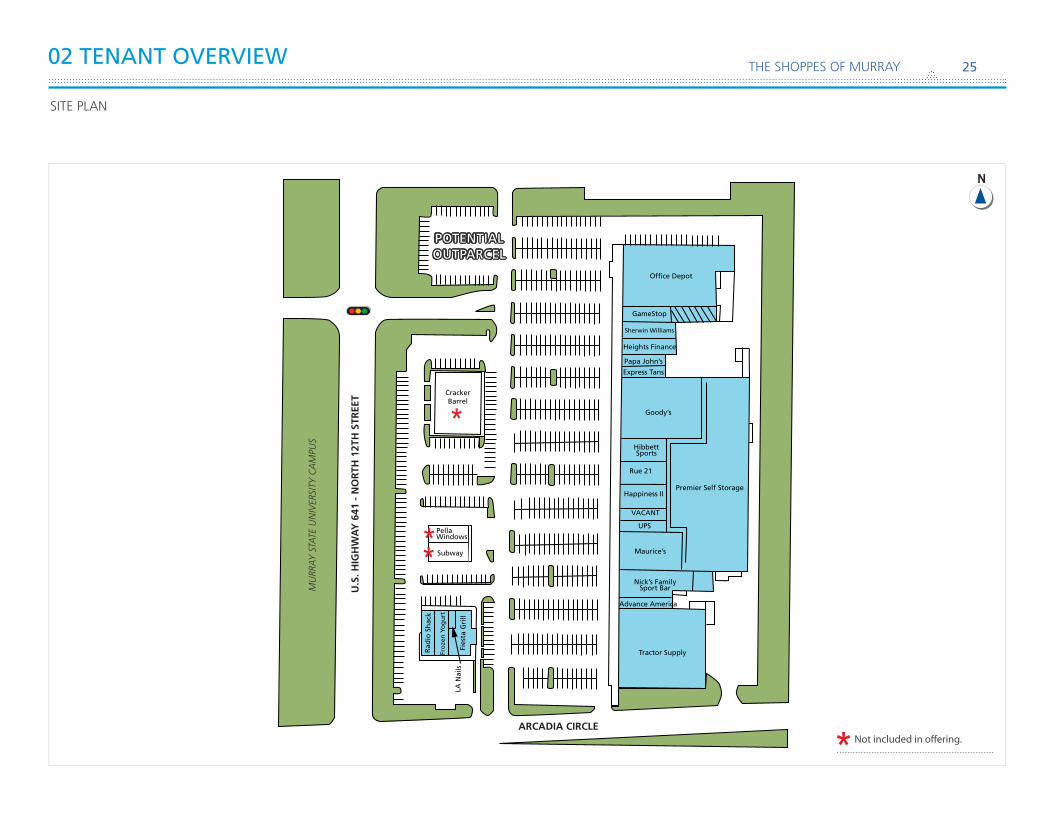
ThE ShOPPES OF MuRRAy 25
potential outparcel
site plan
U.S
. HIG
HW
AY
641
- N
OR
TH 1
2TH
STR
EET
MU
RRAY
STA
TE U
NIV
ERSI
TY C
AM
PUS
Cracker Barrel
*
Pella Windows
Subway
Fies
ta G
rill
Rad
io S
hac
k
LA N
ails
Tractor Supply
Advance America
Nick’s FamilySport Bar
Maurice’s
VACANT
UPS
Happiness IIPremier Self Storage
Rue 21
Hibbett Sports
Goody’s
Express Tans
Papa John’s
Heights Finance
Sherwin Williams
GameStop
Office Depot
ARCADIA CIRCLE
**
Fro
zen
Yo
gu
rt
02 tenant overview
* Not included in offering.

the shoppes of murray
MARkET OVERVIEw Murray, Kentucky Detailed Demographics
03

ThE ShOPPES OF MuRRAy 27
MuRRAy STATE uNIVERSITyENROLLMENT FACTS
undergraduate 8,664
Graduate 1,959
10,623
Average high School GPA: 3.30
Freshmen in Residential housing: 78%
Total Female/Male Enrollment (%): 60/40
Total International Enrollment: 583
undergrad Student/Faculty Ratio: 15 to 1
Average Age: 22 years
ENROLLMENT DEMOGRAPhICS - FALL 2011
murray, kentucky
03 Market overview
The local economy in Murray, Ky is primarily driven by two major segments: college students (Murray State university) and retirees relocating to the area.
College Students in Murray, Ky (Murray State university)
Murray State university (MSu) is a four year public university located in Murray, Kentucky. The school was originally established in 1922 and currently has a student enrollment of over 10,000 students with another 1,200 faculty and staff. Of the 10,000 students, over 8,000 are full time undergraduate students. The school offers over 10 associate, 60 bachelor, and 40 masters programs. In addition to majors and minors commonly found in public universities, MSu differentiates itself by offering a wide range of specialties that are not commonly found at similar institutions; these programs include: Engineering Physics, Pre-Veterinary, Equine Science, Occupational Safety and health. MSu has over 60,000 living alumni with an annual endowment of approximately $28 million. MSu also offers 17 varsity athletics programs including baseball, football, rifling and a top rated men’s basketball program.
MSu has also been recognized nationally by a number of the top college ranking agencies such as u.S. News and Forbes. Recently, MSu was
recognized by u.S. News as a top tier institution for the Southern region for an unprecedented 20th straight year. No other institution in Kentucky has received this honor consistently over the past 20 years. In 2009, MSu was ranked 10th in the nation for public institutions in the overall rating category by u.S. News.
Relocating Retirees in Murray, Ky
In recent years, Murray has become a popular destination for retirees in the region due to the low cost of living, favorable climate, and the proximity to larger markets. With access to Interstate 24 Murray is just a short drive from Nashville, St. Louis, Louisville, and Memphis. Murray, Ky is also located within a day’s drive of 60% of the nation’s population. In 2007, Where to Retire Magazine featured Murray in a cover story as a “low cost haven”. Murray’s low property taxes and home prices have attracted retirees from across the region. In 2008, the average price for a new home in Murray was only $125,050. Murray was also recognized in 2008 by Back home in Kentucky magazine as one of the top retirement communities in Kentucky. Murray’s favorable climate allows residents to partake in a number of outdoor activities throughout the year and the friendly “small town” atmosphere is a welcoming place for new residents looking to settle down.
Murray, Kentucky is located in Calloway County along the Southwestern part of Kentucky near the Kentucky-Tennessee border. According to the 2010 census, Murray, Ky has a population of 17,741 with a metropolitan area population of 37,191.
ThE ShOPPES OF MuRRAy 28
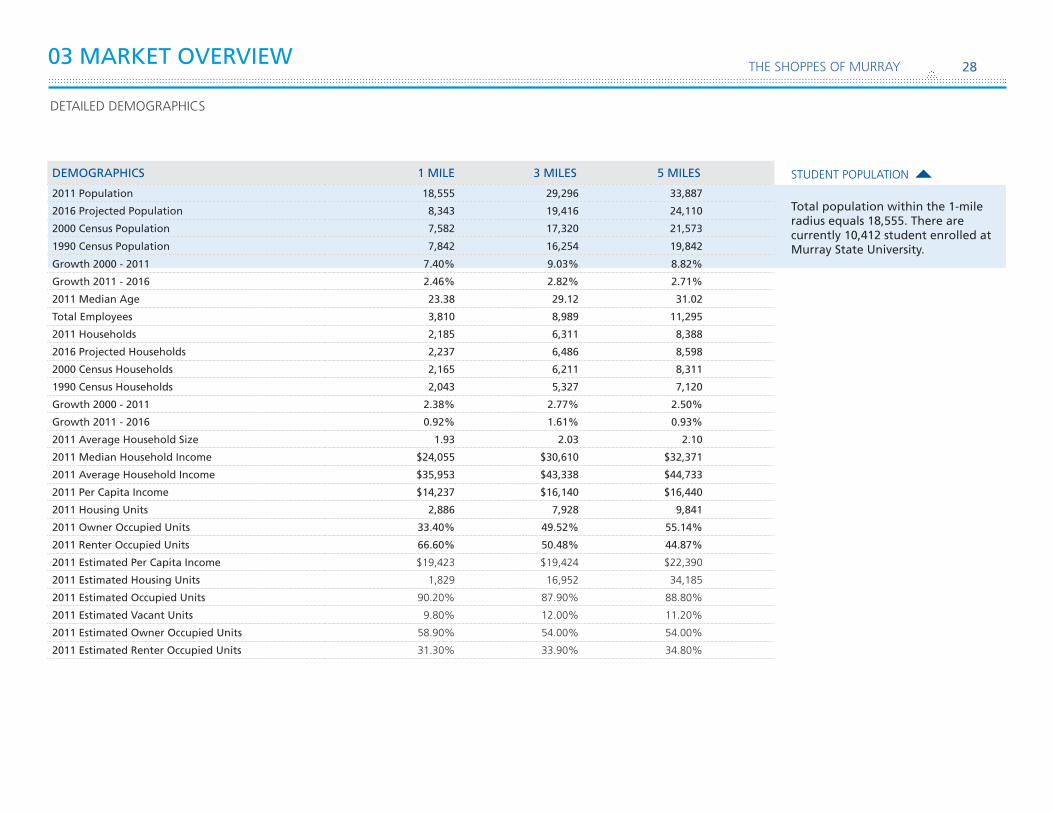
DETAILED DEMOGRAPHICS
STuDENT POPuLATION
Total population within the 1-mile radius equals 18,555. There are currently 10,412 student enrolled at Murray State University.
DEMOGRAPhICS 1 MILE 3 MILES 5 MILES
2011 Population 18,555 29,296 33,887
2016 Projected Population 8,343 19,416 24,110
2000 Census Population 7,582 17,320 21,573
1990 Census Population 7,842 16,254 19,842
Growth 2000 - 2011 7.40% 9.03% 8.82%
Growth 2011 - 2016 2.46% 2.82% 2.71%
2011 Median Age 23.38 29.12 31.02
Total Employees 3,810 8,989 11,295
2011 households 2,185 6,311 8,388
2016 Projected households 2,237 6,486 8,598
2000 Census households 2,165 6,211 8,311
1990 Census households 2,043 5,327 7,120
Growth 2000 - 2011 2.38% 2.77% 2.50%
Growth 2011 - 2016 0.92% 1.61% 0.93%
2011 Average household Size 1.93 2.03 2.10
2011 Median household Income $24,055 $30,610 $32,371
2011 Average household Income $35,953 $43,338 $44,733
2011 Per Capita Income $14,237 $16,140 $16,440
2011 housing Units 2,886 7,928 9,841
2011 Owner Occupied Units 33.40% 49.52% 55.14%
2011 Renter Occupied Units 66.60% 50.48% 44.87%
2011 Estimated Per Capita Income $19,423 $19,424 $22,390
2011 Estimated housing Units 1,829 16,952 34,185
2011 Estimated Occupied Units 90.20% 87.90% 88.80%
2011 Estimated Vacant Units 9.80% 12.00% 11.20%
2011 Estimated Owner Occupied Units 58.90% 54.00% 54.00%
2011 Estimated Renter Occupied Units 31.30% 33.90% 34.80%
03 Market overview

the shoppes of murray
fINANCIAL OVERVIEw Executive Summary
Summary of Financial Assumptions
Cash Flow Projections
Existing Lease Expirations
In-Place Income Reconciliation
04
ThE ShOPPES OF MuRRAy 30
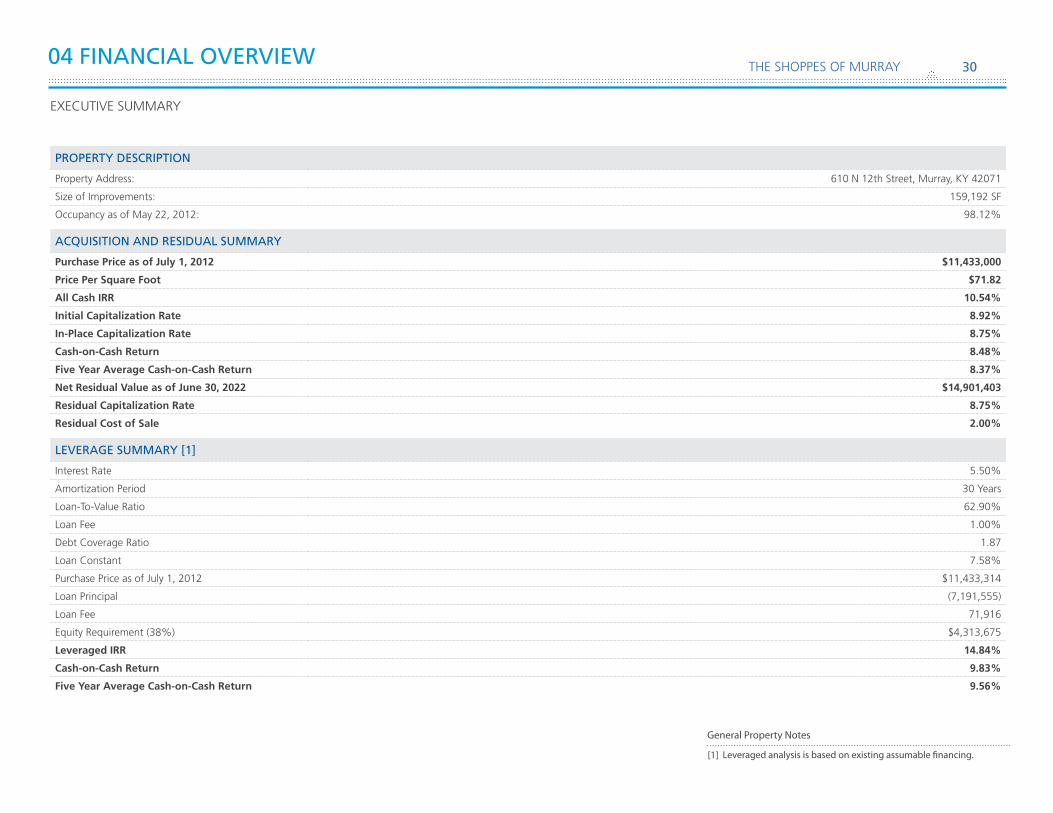
executive SuMMARY
PROPERTY DESCRIPTION
Property Address: 610 N 12th Street, Murray, Ky 42071
Size of Improvements: 159,192 SF
Occupancy as of May 22, 2012: 98.12%
ACQUISITION AND RESIDUAL SUMMARY
Purchase Price as of July 1, 2012 $11,433,000
Price Per Square Foot $71.82
All Cash IRR 10.54%
Initial Capitalization Rate 8.92%
In-Place Capitalization Rate 8.75%
Cash-on-Cash Return 8.48%
Five Year Average Cash-on-Cash Return 8.37%
Net Residual value as of June 30, 2022 $14,901,403
Residual Capitalization Rate 8.75%
Residual Cost of Sale 2.00%
LEVERAGE SUMMARY [1]
Interest Rate 5.50%
Amortization Period 30 years
Loan-To-Value Ratio 62.90%
Loan Fee 1.00%
Debt Coverage Ratio 1.87
Loan Constant 7.58%
Purchase Price as of July 1, 2012 $11,433,314
Loan Principal (7,191,555)
Loan Fee 71,916
Equity Requirement (38%) $4,313,675
Leveraged IRR 14.84%
Cash-on-Cash Return 9.83%
Five Year Average Cash-on-Cash Return 9.56%
[1] leveraged analysis is based on existing assumable financing.
General Property Notes
04 financial overview

ThE ShOPPES OF MuRRAy 31
SUMMARY of finAnciAl ASSUMptionS
GLOBAL
Analysis Period
Commencement Date July 1, 2012
End Date June 30, 2022
Term 10 years
Area Measures
Building Square Footage (RSF) 159,192 SF
Consumer Price Index (CPI) 2.00%
Vacancy Loss [1] 5.00%
REVENUE ASSUMPTIONS
Market Rent Growth
2013 - 0.00%2014 - 2.00%2015 - 2.00%2016 - 3.00%2017 - 3.00%
2018 - 3.00%2019 - 3.00%2020 - 3.00%2021 - 3.00%2022 - 3.00%
EXPENSE ASSUMPTIONS
Growth Rates
Operating Expenses 2.00%
Capital Reserves 2.00%
Property Taxes 2.00%
Property Taxes Reassessed No
Management Fee (% of EGR) 3.50%
Operating Expense Source [2] Cy 2011 P&L
2011 Capital Reserves $0.15 PSF
MARkET LEASING - 2ND GENERATION
Retention Ratio 75%
Lease Term
Anchor (>10,000 SF) 6 years
Jr. Anchor (5,000 - 10,000 SF) 6 years
Shops (< 5,000 SF) 4 years
Storage Facility 10 years
2011 Annual Market Rent
Anchor (>10,000 SF) $6.00 PSF
Jr. Anchor (5,000 - 10,000 SF) $8.50 PSF
Shops (< 5,000 SF) $12.00 PSF
Storage Facility $3.50 PSF
Rent Adjustment 2.00% Annually
Expense Recovery Type
Anchor, Jr. Anchor, Shops NNN
Storage Facility Gross
2012 Tenant Improvements
New $5.00 PSF
Renewal $0.00 PSF
Weighted Average - All Suites $1.25 PSF
Commissions
New $4.00 PSF
Renewal $0.00 PSF
Weighted Average $1.00 PSF
Downtime
Anchor 6 Month(s)
Jr. Anchor, Shops, Storage Facility 4 Month(s)
Weighted Average [3] 1 Month(s)
[1] A vacancy loss of 5.00% has been assumed for this analysis; Advance America, Gamestop, Goody’s, hibbett Sports, Maurices, Inc., Office Depot, Papa Johns Pizza, Radio Shack, Rue 21, Sher-win-Williams, Tractor Supply, and uPS have been excluded.
[2] Operating Expenses are based on Cy 2011 operating expenses. All entered expenses are expected to grow at 2.00% annually for the first three years of the holding period, and increase to 2.50% for the duration of the holding period.
[3] The weighted average downtime has been rounded to the nearest whole month.
*Please note that reimbursement calculations for the pertinent re-tail tenants are made with a GLA of 118,133 SF rather than the 159,192 SF listed above. The 41,059 SF that is not counted in the 118,133 SF figure is comprised of the Premier Storage space (38,540 SF) and portions of the Gamestop (1,340 SF - Storage) and Office Depot (1,179 SF) spaces.
General Property Notes
MARkET LEASING - VACANT LEASE-UP
Total Vacant as of May 22, 2012 3,000 SF
Absorption Period Start Date July 1,2012
Absorption Period 3 Month(s)
Lease Term 5 years
2011 Annual Market Rent $12.00 PSF
Rent Adjustment 2.00% Annually
2012 Tenant Improvements $5.00 PSF
Commissions $4.00 PSF
04 financial overview

ThE ShOPPES OF MuRRAy 32
CASH FLOW PROJECTIONS
Fiscal Year ending - june 30 2013 2014 2015 2016 2017 2018 2019 2020 2021 2022 2023FY 2013
Potential Gross Revenue $/SF/YR
Base Rental Revenue $7.15 $1,138,333 $1,127,894 $1,115,027 $1,135,094 $1,142,103 $1,156,962 $1,174,595 $1,212,739 $1,301,405 $1,343,887 $1,380,201
Absorption & Turnover Vacancy (0.04) (6,000) (15,935) (11,793) (33,532) (9,200) (7,669) (7,390) (76,576) (24,698) (34,944) (10,802)
Scheduled Base Rental Revenue 7.11 1,132,333 1,111,959 1,103,234 1,101,562 1,132,903 1,149,293 1,167,205 1,136,163 1,276,707 1,308,943 1,369,399
Expense Recoveries 1.04 165,354 167,756 181,320 211,569 246,520 253,688 259,577 261,522 318,905 320,005 337,328
Total Potential Gross Revenue 8.15 1,297,687 1,279,715 1,284,554 1,313,131 1,379,423 1,402,981 1,426,782 1,397,685 1,595,612 1,628,948 1,706,727 Vacancy Loss (0.10) (15,446) (12,323) (17,248) (15,805) (17,331) (13,444) (21,424) (11,113) (1,909) (16,833) (26,024)
Effective Gross Revenue 8.05 1,282,241 1,267,392 1,267,306 1,297,326 1,362,092 1,389,537 1,405,358 1,386,572 1,593,703 1,612,115 1,680,703
Operating Expenses
Disposal Service (0.08) (12,742) (12,997) (13,257) (13,522) (13,860) (14,207) (14,562) (14,926) (15,299) (15,681) (16,073)
Roof Repairs (0.00) (739) (754) (769) (785) (804) (824) (845) (866) (888) (910) (933)
HVAC Repairs (0.03) (5,074) (5,175) (5,279) (5,384) (5,519) (5,657) (5,798) (5,943) (6,092) (6,244) (6,400)
Plumbing Repairs (0.01) (2,054) (2,095) (2,137) (2,180) (2,234) (2,290) (2,347) (2,406) (2,466) (2,528) (2,591)
Common Area Maint. (0.01) (1,001) (1,021) (1,041) (1,062) (1,088) (1,116) (1,144) (1,172) (1,201) (1,232) (1,262)
Common Area Repairs (0.22) (35,156) (35,859) (36,577) (37,308) (38,241) (39,197) (40,177) (41,181) (42,211) (43,266) (44,348)
Lawn & Landscaping (0.03) (5,281) (5,387) (5,494) (5,604) (5,744) (5,888) (6,035) (6,186) (6,341) (6,499) (6,662)
Parking Lot Sweeping (0.07) (10,680) (10,894) (11,111) (11,334) (11,617) (11,907) (12,205) (12,510) (12,823) (13,144) (13,472)
Parking Lot Patching (0.01) (1,540) (1,570) (1,602) (1,634) (1,675) (1,717) (1,760) (1,804) (1,849) (1,895) (1,942)
Snow and Ice Removal (0.03) (4,434) (4,522) (4,613) (4,705) (4,823) (4,943) (5,067) (5,193) (5,323) (5,456) (5,593)
Lighting Repairs (0.00) (506) (516) (526) (537) (550) (564) (578) (592) (607) (622) (638)
Parking Lot Restriping (0.00) (730) (745) (760) (775) (794) (814) (834) (855) (877) (899) (921)
Supplies (0.00) (126) (129) (132) (134) (138) (141) (145) (148) (152) (156) (160)
Pest Control (0.01) (1,830) (1,867) (1,904) (1,942) (1,991) (2,040) (2,091) (2,144) (2,197) (2,252) (2,308)
Utilities (0.32) (51,674) (52,707) (53,761) (54,837) (56,208) (57,613) (59,053) (60,529) (62,043) (63,594) (65,183)
Property Taxes (0.29) (45,969) (46,888) (47,826) (48,782) (50,002) (51,252) (52,533) (53,846) (55,193) (56,572) (57,987)
Property Insurance (0.13) (20,467) (20,876) (21,294) (21,720) (22,263) (22,819) (23,390) (23,975) (24,574) (25,188) (25,818)
Liability Insurance (0.06) (8,799) (8,975) (9,154) (9,338) (9,571) (9,810) (10,056) (10,307) (10,565) (10,829) (11,099)
Property Management (0.28) (44,878) (44,359) (44,356) (45,406) (47,673) (48,634) (49,188) (48,530) (55,780) (56,424) (58,825)
Administration (0.05) (8,364) (8,531) (8,702) (8,876) (9,098) (9,325) (9,558) (9,797) (10,042) (10,293) (10,551)
Total Operating Expenses (1.65) (262,044) (265,867) (270,295) (275,865) (283,893) (290,758) (297,366) (302,910) (316,523) (323,684) (332,766)
Net Operating Income 6.41 1,020,197 1,001,525 997,011 1,021,461 1,078,199 1,098,779 1,107,992 1,083,662 1,277,180 1,288,431 1,347,937
04 financial overview

ThE ShOPPES OF MuRRAy 33
CASH FLOW PROJECTIONS, CONT’D.
Fiscal Year ending - june 30 2013 2014 2015 2016 2017 2018 2019 2020 2021 2022 2023
Leasing And Capital Costs
Tenant Improvements (0.09) (15,000) (26,608) (14,956) (43,906) (14,469) (9,590) (6,898) (103,281) (72,107) (42,021) (15,085)
Leasing Commissions (0.08) (12,000) (21,286) (11,965) (35,125) (11,576) (7,672) (5,518) (82,625) (57,686) (33,616) (12,068)
Capital Reserves (0.15) (23,879) (24,356) (24,844) (25,340) (25,847) (26,364) (26,891) (27,429) (27,978) (28,537) (29,108)
Operating Cash Flow 6.09 969,318 929,275 945,246 917,090 1,026,307 1,055,153 1,068,685 870,327 1,119,409 1,184,257 1,291,676
Acquisition/Residual
Acquisition Cost (11,433,314) 0 0 0 0 0 0 0 0 0 0 All Cash
Net Residual Value 0 0 0 0 0 0 0 0 0 0 14,901,403 IRR
Cash Flow Before Debt (11,433,314) 969,318 929,275 945,246 917,090 1,026,307 1,055,153 1,068,685 870,327 1,119,409 16,085,660 10.56%
Financing
Principal 7,191,555 0 0 0 0 0 0 0 0 0 (6,603,289) Leveraged
Loan Fees & Debt Service (71,916) (545,078) (545,078) (545,078) (545,078) (545,078) (545,078) (545,078) (545,078) (545,078) (545,078) IRR
Cash Flow After Debt ($4,313,675) $424,240 $384,197 $400,168 $372,012 $481,229 $510,075 $523,607 $325,249 $574,331 $8,937,292 14.90%
All Cash Summary
Cash-on-Cash Return 8.48% 8.13% 8.27% 8.02% 8.98% 9.23% 9.35% 7.61% 9.79% 10.36%
Cash-on-Cash Return (Cumulative Average) 8.48% 8.30% 8.29% 8.22% 8.37% 8.52% 8.64% 8.51% 8.65% 8.82%
Leverage Summary
Leveraged Cash-on-Cash Return 9.83% 8.91% 9.28% 8.62% 11.16% 11.82% 12.14% 7.54% 13.31% 14.82%
Leveraged Cash-on-Cash Return (Cumulative Average) 9.83% 9.37% 9.34% 9.16% 9.56% 9.94% 10.25% 9.91% 10.29% 10.74%
Debt Coverage Ratio 1.87 1.84 1.83 1.87 1.98 2.02 2.03 1.99 2.34 2.36
04 financial overview

ThE ShOPPES OF MuRRAy 34
EXISTING LEASE EXPIRATIONS
fISCAL YEAR NUMBER Of SUITES RENTABLE SQUARE fEET EXPIRING ANNUAL [1] CUMULATIVE [1]
2013 1 1,449 0.91% 0.91%
2014 5 24,320 15.26% 16.17%
2015 4 10,072 6.32% 22.49%
2016 6 35,429 22.23% 44.73%
2017 2 5,044 3.17% 47.89%
2018 0 0 0.00% 47.89%
2019 0 0 0.00% 47.89%
2020 2 41,490 26.04% 73.93%
2021 1 38,540 24.19% 98.12%
Beyond 0 0 0.00% 98.12%
Subtotal 21 156,192 98.12% 98.12%
Vacant 1 3,000 1.88% 100.00%
TOTAL 22 159,192 100.00% 100.00%
0
20,000
40,000
60,000
140,000
80,000
160,000
100,000
120,000
‘13 ‘15 ‘18 ‘21‘20‘14 ‘17 ‘19 ‘Beyond‘16
REN
TABL
E SQ
uA
RE F
EET
[1] Based on 159,192 Square Feet.
04 financial overview

ThE ShOPPES OF MuRRAy 35
TENANT SQUARE fEETLEASE
COMMENCE-MENT
LEASE TERMINATION
2013 BASE RENT PSf
2013 BASE RENT
2013 OPER. EXP RECOVERIES
2013 GROSS RENT
Office Depot 21,179 6/00 9/15 $5.19 $110,000 $20,469 $130,469
Sherwin-Williams 4,900 7/01 6/14 10.35 50,712 10,844 61,556
Express Tans 2,500 2/06 2/16 13.00 32,496 0 32,496
Papa Johns Pizza 1,804 10/01 9/16 14.00 25,256 3,993 29,249
Gamestop 4,000 11/10 9/15 9.00 36,000 7,072 43,072
Radio Shack 2,100 8/00 8/15 11.25 23,625 4,648 28,273
Fiesta Grill 3,240 7/11 7/16 14.00 45,360 0 45,360
Advance America 1,520 5/00 5/15 11.84 18,000 3,364 21,364
hibbett Sports 5,000 7/00 1/14 9.50 47,500 11,063 58,563
heights Finance 1,449 7/03 6/13 13.75 19,920 790 20,710
Nicks Family Sports Bar 6,920 12/03 8/13 9.82 67,926 15,313 83,239
uPS 1,600 5/04 4/15 17.77 28,428 0 28,428
happiness II 5,000 6/12 9/14 10.80 54,000 0 54,000
Strawberry Frozen yogurt 1,800 6/12 8/15 11.33 20,400 0 20,400
LA Nails 650 6/06 5/16 16.62 10,800 0 10,800
Maurices, Inc. 5,000 5/06 6/16 9.45 47,250 11,063 58,313
Rue 21 5,000 6/08 1/14 13.50 67,500 11,063 78,563
Bank of Cadiz 2,500 10/07 9/13 10.56 26,400 5,533 31,933
Tractor Supply 24,490 4/10 3/20 6.60 161,640 54,194 215,834
Goody's 17,000 6/09 1/20 5.50 93,500 0 93,500
Premier Mini Storage 38,540 9/00 8/20 3.00 115,620 0 115,620
156,192 $1,102,333 $159,409 $1,261,742
vacant 3,000 Other Income 0
Total Square Footage 159,192 Effective Gross Income $1,261,742
Total Expenses ($261,327)
Net Operating Income $1,000,415
IN-PLACE INCOME RECONCILIATION(Fiscal Year Ending June 30)
04 financial overview

ThE ShOPPES OF MuRRAy 36
IN-PLACE INCOME RECONCILIATION, CONT’D.(Fiscal Year Ending June 30)
ExpEnsEs
Disposal Service (12,742)
Roof Repairs (739)
HVAC Repairs (5,074)
Plumbing Repairs (2,054)
Common Area Maint. (1,001)
Common Area Repairs (35,156)
Lawn & Landscaping (5,281)
Parking Lot Sweeping (10,680)
Parking Lot Patching (1,540)
Snow and Ice Removal (4,434)
Lighting Repairs (506)
Parking Lot Restriping (730)
Supplies (126)
Pest Control (1,830)
Utilities (51,674)
Property Taxes (45,969)
Property Insurance (20,467)
Liability Insurance (8,799)
Property Management (44,161)
Administration (8,364)
Total Expenses ($261,327)
04 financial overview

© 2012 Ackerman & Co. All rights reserved.
for More iNforMaTioN, pleaSe CoNTaCT:
SEAN w. PATRICk Vice President, Investment Sales 770.913.3946 [email protected]
SPENCER COAN, CCIM, CAIA Vice President, Investment Sales 678.993.2927 [email protected]
JASON POwELL, CCIM Vice President, Investment Sales 770.913.3952 [email protected]
Marketed in association with Gant hill & Associates.