Embed Size (px)
Citation preview

7(CANADA) LIMITED
60th ANNUAL REPORTONE BILLION IN SALES81 YEARS 920 STORES

Celebrating 80 years of operations and 60 years as a public company, 2006 was certainly a landmark year for Reitmans (Canada)
Limited. It was a year in which we recorded sales in excess of $1,000,000,000 and net earnings in excess of $100,000,000
(before giving effect to the retroactive Québec income tax assessments).
We operate 920 stores under seven banners in highly competitive markets. Our banners experienced significant growth in sales,
gross margin and net operating margin as a result of a stronger Canadian dollar, effective cost containment at both store and
overhead levels and significant operating efficiencies in our supply chain and distribution processes. In fiscal 2007, we opened
74 new stores, remodelled 45 stores and closed 41 stores. In fiscal 2008, we expect to open 75 new stores and remodel 37 stores.
We are growing all areas of our business. Our stores are growing in number, size, sales and profitability. Dividends paid have
grown over 400% over the past 3 years. We continue to invest in stores, technology and people. Our cash resources and
infrastructure allow us to seek out new business opportunities through acquisition and development.
This is a very exciting time for your Company. We are proud of our achievements over the past 80 years and most confident
of our future. We believe that we have the very best specialty retailing assets in Canada. Our operations are led and staffed
by highly motivated, extremely competent professionals. I extend sincere thanks and appreciation to all our associates, suppliers,
customers and shareholders. These are the people who have made possible our many years of success and on whom we rely
for the continued success of the Company.
On behalf of the Board of Directors,
Jeremy H. Reitman
President
Montreal, April 2, 2007
TO OUR SHAREHOLDERS
Reitmans is Canada’s
leading specialty retailer.
We are customer driven, value
oriented and committed to excellence.
By promoting innovation, growth, development
and teamwork, we strive to serve our customers
the best quality/value proposition in the marketplace.
A preeminent force in the retail industry for over 80
years and a public company for 60 years, Reitmans
has evolved from a single chain of fashion retail
stores “where smart women shop” to a
920 store, multi-banner operation
where all women shop.
(signed)

$1,042,509,000 SALES + 8%$186,812,000 EBITDA1 + 20%$153,366,000 PRE-TAX EARNINGS + 23%$102,523,000 ADJUSTED NET EARNINGS1 + 21%
$1.46 ADJUSTED EPS1 + 20%$241,166,000 CASH AND INVESTMENTS + 23%
920 STORES + 4%
A LANDMARK YEAR
1 These highlights include reference to certain Non-GAAP financial measures such as operating earnings, which is defined as earnings before interest, taxes and investmentincome, EBITDA, which is defined as earnings before interest, taxes, depreciation and amortization and investment income, adjusted net earnings and adjusted earningsper share, which are defined as net earnings and earnings per share (EPS) excluding the impact of Québec income tax assessments of $20,054,000 ($0.29 per share).The Company believes such measures provide meaningful information on the Company’s performance and operating results. However, readers should know that suchNon-GAAP financial measures have no standardized meaning as prescribed by GAAP and may not be comparable to similar measures presented by other companies.Accordingly, they should not be considered in isolation.

THE 60th ANNUAL REPORT02
HIGHLIGHTSFor the years ended:(in thousands except per share amounts)(unaudited)
2007 2006 2005 2004 2003SALES
1st Quarter $ 222,969 $ 213,732 $ 193,420 $ 177,750 $ 126,0282nd Quarter 278,828 261,785 246,002 233,225 201,7303rd Quarter 258,602 238,613 236,281 215,683 207,3234th Quarter 282,110 255,128 236,770 224,976 217,413Total $1,042,509 $ 969,258 $ 912,473 $ 851,634 $ 752,494
OPERATING EARNINGS (LOSS)1st Quarter $ 27,564 $ 25,014 $ 14,547 $ 4,709 $ 4,8962nd Quarter 51,048 42,066 33,048 24,217 21,1563rd Quarter 33,781 27,200 24,118 17,252 11,6784th Quarter 29,473 22,766 16,801 4,720 (6,554)Total $ 141,866 $ 117,046 $ 88,514 $ 50,898 $ 31,176
ADJUSTED NET EARNINGS (LOSS)2
1st Quarter $ 21,674 $ 19,667 $ 13,038 $ 4,105 $ 5,1272nd Quarter 33,593 2 29,224 23,868 17,296 13,5903rd Quarter 23,823 2 19,238 17,638 12,654 8,2134th Quarter 23,433 2 16,760 12,363 5,980 (2,395)Total $ 102,523 2 $ 84,889 $ 66,907 $ 40,035 $ 24,535
ADJUSTED BASIC EARNINGS (LOSS)PER SHARE1,2
1st Quarter $ 0.31 $ 0.28 $ 0.19 $ 0.06 $ 0.082nd Quarter 0.48 2 0.42 0.35 0.25 0.203rd Quarter 0.34 2 0.28 0.25 0.19 0.124th Quarter 0.33 2 0.24 0.18 0.09 (0.04)Total $ 1.46 2 $ 1.22 $ 0.97 $ 0.59 $ 0.36
NET EARNINGS $ 82,469 $ 84,889 $ 66,907 $ 40,035 $ 24,535BASIC EARNINGS PER SHARE1 $ 1.17 $ 1.22 $ 0.97 $ 0.59 $ 0.36
SHAREHOLDERS’ EQUITY $ 436,119 $ 390,257 $ 331,524 $ 276,402 $ 243,521PER SHARE1 $ 6.12 $ 5.56 $ 4.77 $ 4.02 $ 3.54
NUMBER OF STORES 920 887 867 845 820
DIVIDENDS PAID $ 40,893 $ 29,345 $ 14,171 $ 7,573 $ 6,876
STOCK PRICE AT YEAR-END1
CLASS A NON-VOTING $ 23.05 $ 17.90 $ 13.75 $ 6.18 $ 4.88COMMON $ 23.30 $ 18.70 $ 14.00 $ 6.25 $ 4.75
1 Adjusted to account for 100% stock dividends paid in April 2004 and April 2005
2 Adjusted net earnings and adjusted basic earnings per share exclude the impact of the retroactive Québec income tax assessments in 2007.

AT A GLANCE
THE 60th ANNUAL REPORT 03
1200
1000
800
600
400
200
0
GROWING
20
03
20
04
20
05
20
06
20
07
SALES
in m
illio
ns o
f do
llars
160
140
120
100
80
60
40
20
0
20
03
20
04
20
05
20
06
20
07
OPERATING EARNINGS
in m
illio
ns o
f do
llars
120
100
80
60
40
20
0
20
03
20
04
20
05
20
06
20
07
ADJUSTED NET EARNINGS1
in m
illio
ns o
f do
llars
45
40
35
30
25
20
15
10
5
0
20
03
20
04
20
05
20
06
20
07
DIVIDENDS
in m
illio
ns o
f do
llars
500
450
400
350
300
250
200
150
100
50
0
20
03
20
04
20
05
20
06
20
07
SHAREHOLDERS’ EQUITY
in m
illio
ns o
f do
llars
30.0
25.0
20.0
15.0
10.0
5.0
0.0
20
03
20
04
20
05
20
06
20
07
RETURN ON EQUITY 1
perc
enta
ge
1 Adjusted net earnings and return on equity exclude the impact of the retroactive Québec income tax assessments in 2007.

THE 60th ANNUAL REPORT04
920 STORESACROSS CANADA
Newfoundland 14 3 - - - 4 2 23Prince Edward Island 3 3 - - - 2 - 8Nova Scotia 20 5 1 1 - 8 2 37New Brunswick 15 6 2 1 - 4 4 32Québec 87 36 12 18 3 26 36 218Ontario 110 63 18 26 7 57 44 325Manitoba 12 6 - 2 - 6 5 31Saskatchewan 9 3 - 2 - 8 3 25Alberta 47 18 3 10 - 21 13 112British Columbia 36 15 9 9 - 22 16 107Northwest Territories 1 - - - - - - 1Yukon 1 - - - - - - 1
355 158 45 69 10 158 125 920
REI
TM
AN
S
SMA
RT S
ET
RW&
CO
.
TH
YM
E
CA
SSIS
PEN
NIN
GTO
NS
AD
DIT
ION
ELL
E
TOTA
L

THE 60th ANNUAL REPORT 05
Operating 355 STORES averaging 4,400 sq. ft., Reitmans is Canada’s largest ladies
apparel specialty chain. Reitmans offers Canadian women affordable fashions "designed for real life" in
regular, plus and petite sizes. Through highly effective merchandising strategies, superior service and
insightful marketing programs, the Reitmans brand has developed powerful consumer relationships
and loyalty, steadily growing its base of 25-45 year old female customers.
r e i t m a n s . c o m
P e t i t e s E n c o r e C o n t r a s t J e a n s

THE 60th ANNUAL REPORT06
The Smart Set banner, with158 STORES averaging 3,300 sq. ft., is a major fashion
destination for junior customers offering 18 to 30 year old women a complete coordinated line of affordable
fashion and accessories at the best quality, price and value. All Smart Set clothing and accessories
are designed and manufactured specifically and exclusively for the chain and carry the Smart Set label.
s m a r t - s e t . c o m

THE 60th ANNUAL REPORT 07
Operating 45 STORES, which average 4,300 sq. ft., in major malls, RW & CO. caters
to junior (18 to 30) ladies and men, featuring fashionable, original and quality urban and casual wear at
moderate prices. A unique and comfortable store environment, genuine customer care and exceptional
marketing support distinguishes the RW & CO. lifestyle brand.
r w - c o . c o m

THE 60th ANNUAL REPORT08
Thyme Maternity, Canada’s largest specialty retailer of maternity clothing, operates69 STORESaveraging 2,200 sq. ft., in malls and power centres. Thyme Maternity sells clothing and accessories that are
designed to meet an expectant mother’s entire fashion needs including her career, casual, lingerie, special
occasion and nursing apparel needs, all at affordable prices.
t h y m e m a t e r n i t y . c o m

THE 60th ANNUAL REPORT 09
With10 STORES in operation averaging 3,700 sq. ft. in major
regional malls, Cassis offers a refreshing combination of novelty and proven
classic merchandise to the 45 to 60 year old mature baby boomer. Key focus
points for this new retail concept are fit, quality, atmosphere and customer service.
c a s s i s . c a

THE 60th ANNUAL REPORT10
With158 STORES from coast to coast, Penningtons is a destination store averaging 5,900 sq. ft.
located in strip plazas and power centre locations providing a broad assortment of career, casual, intimate
apparel and accessories for the plus-size woman of all ages at competitive prices. The Penningtons brand stands
for classic fashion, friendly warm service, quality and value. We expanded the junior plus-size product assortment
known as MXM that caters to the trendy, young value-conscious plus-size customer to all Penningtons stores.
p e n n i n g t o n s . c o m
m x m . b z

THE 60th ANNUAL REPORT 11
Operating125 STORES, Addition Elle is Canada’s fashion leader in ladies plus-sized
clothing, providing our customers with a contemporary collection of career, casual, intimate apparel
and accessories at affordable prices. Our stores average 5,800 sq. ft. and are located in malls and power
centre locations across Canada. The junior MXM assortment is available in 117 Addition Elle stores.
a d d i t i o n - e l l e . c o m

THE 60th ANNUAL REPORT12
The following Management’s Discussion and Analysis of Financial Condition and Results of Operations ("MD&A") of Reitmans (Canada)Limited (“Reitmans” or the “Company”) should be read in conjunction with the audited consolidated financial statements of Reitmans for the53 week fiscal period ended February 3, 2007 and the notes thereto which are available at www.sedar.com.This MD&A is dated March 28, 2007.
All financial information contained in this MD&A and Reitmans’ consolidated financial statements has been prepared in accordance withCanadian generally accepted accounting principles ("GAAP"), except for certain information referred to as Non-GAAP financial measuresdiscussed below. All amounts in this report are in Canadian dollars, unless otherwise noted. The consolidated financial statements andthis MD&A were reviewed by Reitmans’ Audit Committee and were approved by its Board of Directors on March 28, 2007.
Additional information about Reitmans, including the Company’s 2007 Annual Information Form, is available on the Company’s websiteat www.reitmans.ca, or on the SEDAR website at www.sedar.com.
FORWARD-LOOKING STATEMENTS
All of the statements contained herein, other than statements of fact that are independently verifiable at the date hereof, are forward-lookingstatements. Such statements, based as they are on the current expectations of management, inherently involve numerous risks anduncertainties, known and unknown, many of which are beyond the Company’s control. Such risks include but are not limited to: theimpact of general economic conditions, general conditions in the retail industry, seasonality, weather and other risks included in publicfilings of the Company. Consequently, actual future results may differ materially from the anticipated results expressed in forward-lookingstatements.The reader should not place undue reliance on the forward-looking statements included herein.These statements speak onlyas of the date made and the Company is under no obligation and disavows any intention to update or revise such statements as a resultof any event, circumstances or otherwise, except to the extent required under applicable securities law.
NON-GAAP FINANCIAL MEASURES
This MD&A includes reference to certain Non-GAAP financial measures such as operating earnings, which is defined as earnings beforeinterest, taxes and investment income. The Company believes such a measure provides meaningful information on the Company’sperformance and operating results. However, readers should know that such a Non-GAAP financial measure has no standardizedmeaning as prescribed by GAAP and may not be comparable to similar measures presented by other companies. Accordingly, it shouldnot be considered in isolation.
CORPORATE OVERVIEW
Reitmans is a Canadian ladieswear specialty apparel retailer. The Company operates under seven banners: Reitmans, Smart Set, RW & CO.,Thyme Maternity, Penningtons, Addition Elle and its newest banner, Cassis. Each banner is focused on a particular niche in the retailmarket place. The Company has several competitors in each such niche, including local, regional and national chains of specialty storesand department stores. As well, there is no barrier to entry into any one of these niches. Over the past few years, the Company haswitnessed a number of foreign based competitors commence operations in Canada in virtually every one of the market niches in whichthe Company operates. The Company’s stores are located in malls, strip plazas and retail power centres across Canada. The Companycontinues to grow all areas of its business by investing in stores, technology and people. The Company’s growth has been driven bycontinuing to offer Canadian consumers affordable fashions and accessories at the best value reflecting price and quality. In doing so,the Company continues to enhance its brands and strengthen its consumer loyalty.
On August 1, 2006, the Company opened the first store of its new ladies wear retail concept called Cassis. This constitutes the Company’sseventh banner and consists of mall-based stores of approximately 3,700 sq. ft. The target market for these stores is youth-orientedfashion-conscious women aged 45 to 60 and includes assortments of career, sportswear, casual and loungewear apparel. The Companyhas opened 10 Cassis stores as of February 3, 2007 and believes that there may be a market for approximately 80 Cassis stores in Canada.
1947 1948 1950 1951 1952 1953
MANAGEMENT’S DISCUSSION AND ANALYSIS OF FINANCIAL CONDITION AND RESULTS OF OPERATIONS
For the 53 week fiscal period ended February 3, 2007

THE 60th ANNUAL REPORT 13
SELECTED FINANCIAL INFORMATION
(in thousands, except per share amounts)
For the fiscal years endedFebruary 3, 2007* January 28, 2006 January 29, 2005
Sales $ 1,042,509 $ 969,258 $ 912,473Earnings before income taxes 153,366 125,011 96,234Net earnings 82,469 1 84,889 66,907Earnings per share (“EPS”)
Basic 1.17 1 1.22 0.97Diluted 1.15 1 1.19 0.95
Total assets 600,411 523,233 467,059Long-term debt2 15,097 16,173 17,183Dividends per share 0.580 0.420 0.205
* 53 week fiscal year1 Excluding the impact of the retroactive Québec income tax assessments (included as required by Canadian GAAP), net earnings for the year would have been $102,523,
Basic EPS $1.46 and Diluted EPS $1.43.2 Excluding current portion of long-term debt, deferred lease credits and accrued pension liability.
For more information concerning Sales, Operating Earnings, Net Earnings and Earnings Per Share for the last five fiscal years and theirrelevant quarterly components, the reader is directed to page 2 of the Company's printed annual report captioned “Highlights”.
CONSOLIDATED OPERATING RESULTS FOR THE 53 WEEK FISCAL YEAR ENDED FEBRUARY 3, 2007 AND COMPARISON TOCONSOLIDATED OPERATING RESULTS FOR THE 52 WEEK FISCAL YEAR ENDED JANUARY 28, 2006
The Company’s fiscal year ends on the Saturday closest to the end of January. All references to fiscal 2007 and fiscal 2006 represent thefiscal years ended February 3, 2007 and January 28, 2006, respectively. Fiscal 2007 includes 53 weeks instead of the normal 52 weeks.The inclusion of an extra week occurs every fifth or sixth fiscal year due to the Company’s floating year-end.
Sales for fiscal 2007 increased 7.6% to $1,042,509,000 as compared with $969,258,000 for the year ended January 28, 2006. Thisincrease in sales is due primarily to the net addition of 33 stores over the course of the year, a comparable store sales increase of 2.9%and an extra week in the fiscal year.
Operating earnings for fiscal 2007 increased 21.2% to $141,866,000 as compared with $117,046,000 for the prior year. The factorscontributing to such increase included improved gross margins, 225 basis points better than the comparable period last year, due in partto the Canadian dollar which continues to remain relatively strong. Spot prices for $1.00 US for the year have ranged between a highof Canadian $1.18 and a low of $1.09 ($1.27 and $1.14 respectively for fiscal 2006). As well, the Company continues to open stores inless expensive power centres and strip malls allowing the Company to build somewhat larger, more profitable stores. As a substantialamount of the Company’s non-merchandise operating expenses are fixed, store operating costs in several instances have decreased asa percentage of gross revenue as compared to the prior year.
Depreciation and amortization expense for the year was $44,946,000 compared to $38,564,000 for the prior year. This increase reflectsthe increased new store construction and store renovation activities of the Company. As well, it included $4,216,000 of write-offs as aresult of closed and renovated stores, compared to $2,187,000 in the prior year.
1954 1955 1956 1957 1958 1959
MANAGEMENT’S DISCUSSION AND ANALYSIS

THE 60th ANNUAL REPORT14
Investment income for fiscal 2007 increased 38.0% to $12,556,000 as compared to $9,097,000 in the prior year. Dividends and interestincome for fiscal 2007 were $10,267,000 as compared to $6,810,000 for fiscal 2006 while net capital gains for fiscal 2007 were$2,289,000 as compared to $2,287,000 for fiscal 2006. Interest income for the year was significantly higher than the prior year due tolarger cash balances earning higher rates of interest.
Interest expense on long-term debt decreased to $1,056,000 in fiscal 2007 from $1,132,000 in fiscal 2006. This decrease reflects thecontinued repayment of the mortgage on the Company’s distribution centre.
Net earnings and diluted EPS decreased 2.9% to $82,469,000 or $1.15 per share as compared with $84,889,000 or $1.19 per share lastyear.This decrease was a direct result of the unprecedented retroactive change in the Québec Taxation Act, introduced in May and passedinto law in June 2006.This change, which impacts the prior three fiscal years’ computation of income tax expense, required the Companyto recognize a one-time charge of $19,145,000 in computing its second quarter income tax expense, and a further amount of $909,000in respect of interest thereon incurred in the remainder of fiscal 2007. The Company has filed formal objection notices for the assessmentsit received in June giving rise to this one-time charge. At this time, management is not in a position to make a judgment about thelikelihood of success of the formal objection process.Without this retroactive change in the law, net earnings for fiscal 2007 would havebeen $102,523,000 or $1.43 diluted EPS, a 20.8% increase over the prior year.
The Company in its normal course of business makes long lead time commitments for a significant portion of its merchandise purchases,in some cases as long as eight months. Most of these purchases must be paid for in US dollars. In fiscal 2007, these merchandisepurchases exceeded $170,000,000 US. The Company uses a variety of defensive strategies designed to fix the cost of its continuing USdollar long-term commitments at the lowest possible cost, while at the same time allowing itself the opportunity to take advantage ofan increase in the value of the Canadian dollar vis-à-vis the US dollar. For fiscal 2007, these strategies helped the gross margin performanceas the Canadian dollar strengthened over the course of much of the year.
During fiscal 2007, the Company opened 74 stores comprised of 16 Reitmans, 8 Smart Set, 13 RW & CO., 5 Thyme Maternity, 10 Cassis,10 Penningtons and 12 Addition Elle; 41 stores were closed. Accordingly, at February 3, 2007, there were 920 stores in operation,consisting of 355 Reitmans, 158 Smart Set, 45 RW & CO., 69 Thyme Maternity, 10 Cassis, 158 Penningtons and 125 Addition Elle ascompared with a total of 887 stores last year.
Store closings take place for a variety of reasons as the viability of each store and its location is constantly monitored and assessed forcontinuing profitability. In most cases when a store is closed, merchandise at that location is sold off in the normal course of businessand any unsold merchandise remaining at the closing date is generally transferred to other stores operating under the same banner forsale in the normal course of business.
The Company experienced considerable delays in obtaining the requisite building permits in Ontario as a result of changes in theregulations governing all construction activity in that province. As a result, most of the Cassis stores planned to be opened early in thefiscal year were late, as much as 10 weeks in some cases. This had a negative impact on the sales in Cassis in that seasonal merchandisethat had been purchased in anticipation of the planned opening dates and would have been in the stores on a timely basis, had to beheld back in the distribution centre and subsequently liquidated at markdown prices as out of season goods once the delayed storeswere finally opened . This was an unfortunate set of circumstances which was beyond the Company’s control.
MANAGEMENT’S DISCUSSION AND ANALYSIS
1960 1961 1962 1963 1964 1965

THE 60th ANNUAL REPORT 15
CONSOLIDATED OPERATING RESULTS FOR THE 52 WEEK FISCAL YEAR ENDED JANUARY 28, 2006 AND COMPARISON TO
CONSOLIDATED OPERATING RESULTS FOR THE 52 WEEK FISCAL YEAR ENDED JANUARY 29, 2005 The Company’s fiscal year ends on the Saturday closest to the end of January. All references to fiscal 2006 and fiscal 2005 represent thefiscal years ended January 28, 2006 and January 29, 2005, respectively.
Sales for fiscal 2006 increased 6.2% to $969,258,000 as compared with $912,473,000 for the year ended January 29, 2005.This increasein sales is due primarily to the net addition of 20 stores over the course of the year and a comparable store sales increase of 2.9%.
Operating earnings for fiscal 2006 increased 32.2% to $117,046,000 as compared with $88,514,000 for the prior year. The factorscontributing to such increase included improved gross margins, 321 basis points better than the comparable period last year, due in partto the Canadian dollar which continued to remain relatively strong. Spot prices for $1.00 US for fiscal 2006 ranged between a high ofCanadian $1.27 and a low of $1.14 ($1.40 and $1.17 respectively for fiscal 2005). As well, the Company continued to open stores in lessexpensive power centres and strip malls allowing the Company to build somewhat larger, more profitable stores.As a substantial amountof the Company’s non-merchandise operating expenses are fixed, store operating costs in several instances decreased in fiscal 2006 asa percentage of gross revenue as compared to the prior year.
Depreciation and amortization expense for fiscal 2006 was $38,564,000 compared to $35,083,000 for the prior year. This increasereflects the increased new store construction and store renovation activities of the Company. As well, it included $2,187,000 of write-offsas a result of closed and renovated stores, compared to $1,786,000 in the prior year.
Investment income for fiscal 2006 amounted to $9,097,000 as compared to $9,639,000 in the prior year. Dividends and interest incomefor fiscal 2006 were $6,810,000 as compared to $5,988,000 for fiscal 2005 while net capital gains for fiscal 2006 were $2,287,000 ascompared to $3,651,000 for fiscal 2005. Interest income for fiscal 2006 was significantly higher than the prior year due to larger cashbalances earning higher rates of interest.
Interest expense on long-term debt decreased to $1,132,000 in fiscal 2006 from $1,919,000 in fiscal 2005. This decrease reflects thecontinued repayment of the mortgage on the Company’s distribution centre.
Net earnings and diluted EPS increased 26.9% to $84,889,000 or $1.19 per share in fiscal 2006 as compared with $66,907,000 or$0.95 per share in fiscal 2005.
The Company in its normal course of business makes long lead time commitments for a significant portion of its merchandise purchases,in some cases as long as eight months. Most of these purchases must be paid for in US dollars. In fiscal 2006, these merchandisepurchases exceeded $150,000,000 US. The Company uses a variety of defensive strategies designed to fix the cost of its continuingUS dollar long-term commitments at the lowest possible cost, while at the same time allowing itself the opportunity to take advantageof an increase in the value of the Canadian dollar vis-à-vis the US dollar. For fiscal 2006, these strategies helped the gross marginperformance as the Canadian dollar strengthened over the course of much of the year.
During fiscal 2006, the Company opened 46 stores comprised of 16 Reitmans, 3 Smart Set, 2 RW & CO., 4 Thyme Maternity, 11 Penningtons,and 10 Addition Elle; 26 stores were closed. Accordingly, at January 28, 2006, there were 887 stores in operation, consisting of355 Reitmans, 162 Smart Set, 32 RW & CO., 69 Thyme Maternity, 150 Penningtons and 119 Addition Elle as compared with a totalof 867 stores in the prior year.
Store closings take place for a variety of reasons as the viability of each store and its location is constantly monitored and assessed forcontinuing profitability. In most cases when a store is closed, merchandise at that location is sold off in the normal course of businessand any unsold merchandise remaining at the closing date is generally transferred to other stores operating under the same banner forsale in the normal course of business.
MANAGEMENT’S DISCUSSION AND ANALYSIS
1966 1967 1968 1969 1970 1971

THE 60th ANNUAL REPORT16
MANAGEMENT’S DISCUSSION AND ANALYSIS
1972 1973 1974 1975 1976 1977
SUMMARY OF QUARTERLY RESULTS
The table below sets forth selected consolidated financial data for the eight most recently completed quarters. This unaudited quarterlyinformation has been prepared on the same basis as the annual consolidated financial statements. The operating results for any quarterare not necessarily indicative of the results to be expected for any future period.
(in thousands, except per share amounts)
Sales* Net Earnings* Earnings per share (“EPS”)Basic Diluted
February 3, 2007 $ 282,110 $ 22,957 1 $ 0.32 1 $ 0.32 1
October 28, 2006 258,602 23,390 2 0.33 2 0.33 2
July 29, 2006 278,828 14,448 3 0.21 3 0.20 3
April 29, 2006 222,969 21,674 0.31 0.30January 28, 2006 255,128 16,760 0.24 0.23October 29, 2005 238,613 19,238 0.28 0.27July 30, 2005 261,785 29,224 0.42 0.41April 30, 2005 213,732 19,667 0.28 0.28
*Results for the fourth quarter ended February 3, 2007 include 14 weeks instead of the normal 13 weeks.1 Excluding the impact of the retroactive Québec income tax assessments, net earnings for the fourth quarter would have been $23,433, Basic EPS $0.33 and Diluted EPS $0.33.2 Excluding the impact of the retroactive Québec income tax assessments, net earnings for the third quarter would have been $23,823, Basic EPS $0.34 and Diluted EPS $0.33.3 Excluding the impact of the retroactive Québec income tax assessments, net earnings for the second quarter would have been $33,593, Basic EPS $0.48 and Diluted EPS $0.47.
The retail business is seasonal and due to the geographical diversity of the Company’s stores and product offerings, the Company hasexperienced quarterly fluctuations in operating results. Sales have traditionally been higher in the fourth quarter compared to otherquarterly periods due to consumer holiday buying patterns. However, with the growth of the Company’s plus-size and maternitybusinesses, second and third quarters’ merchandise sales have been positively impacted resulting in higher sales revenues relative to thefourth quarter. Management anticipates and assumes that this trend will continue in the future. The fourth quarter of fiscal 2007benefited from increased sales due to the additional week.
FOURTH QUARTER RESULTS
Results for the fourth quarter ended February 3, 2007 include 14 weeks instead of the normal 13 weeks. The inclusion of an extra weekoccurs every fifth or sixth fiscal year due to the Company’s floating year-end.
Sales for the fourth quarter increased 10.6% to $282,110,000 as compared with $255,128,000 for the three month period endedJanuary 28, 2006. This increase in sales is due primarily to the increased number of stores, an additional week of sales and a comparablestore sales increase of 1.1%.
Operating earnings for the fourth quarter increased 29.5% to $29,473,000 as compared with $22,766,000 for the comparable periodlast year. The factors contributing to such increase included improved gross margins, up in excess of 294 basis points for the fourthquarter as compared to the same period last year, due in part to the Canadian dollar which continued to remain relatively strong.Spot prices for $1.00 US for the fourth quarter have ranged between a high of Canadian $1.18 and a low of $1.12 ($1.19 and $1.14respectively for the same period last year). As well, the Company continues to open stores in less expensive power centres and strip mallsallowing the Company to build somewhat larger, more profitable stores. As a substantial amount of the Company’s non-merchandiseoperating expenses are fixed, store operating costs in several instances have decreased as a percentage of gross revenue as compared tothe same period last year.

THE 60th ANNUAL REPORT 17
Depreciation and amortization expense for the fourth quarter was $12,448,000 compared to $10,012,000 for the comparable periodlast year. This increase reflects the increased new store construction and store renovation activities of the Company. As well it included$1,467,000 of write-offs as a result of closed and renovated stores, compared to $367,000 in the comparable period last year. Duringthe fourth quarter, the Company opened 19 new stores and closed 18 stores.
Investment income for the fourth quarter increased 93.0% to $3,178,000 as compared to $1,647,000 in the comparable period lastyear. Dividends and interest income for the fourth quarter were $3,169,000 as compared to $2,018,000 for the same period last year,while net capital gains for the fourth quarter were $9,000 as compared to the net capital losses for the same period last year of $371,000.Interest income for the quarter was significantly higher than the prior year due to larger cash balances earning higher rates of interest.
Interest expense on long-term debt decreased to $258,000 in the fourth quarter of 2007 from $281,000 in 2006. This decrease reflectsthe continued repayment of the mortgage on the Company’s distribution centre.
Net earnings and diluted EPS increased 37.0% to $22,957,000 or $0.32 per share as compared with $16,760,000 or $0.23 per share forthe comparable period last year. Without the retroactive change in the Québec tax law, the net earnings for the fourth quarter wouldhave been $23,433,000 or $0.33 per share.
BALANCE SHEET
Cash and cash equivalents amounted to $188,491,000 or 39.2% higher than $135,399,000 last year reflecting the very strong positivecash flow generated from operations of the Company. Merchandise inventories this year are $61,834,000 or $4,611,000 lower than lastyear. This decrease reflects the very strong sell through of seasonal merchandise, the continuation of the effect of a strong Canadiandollar and the tight control of inventories in general. Accounts receivable are $3,439,000 or $304,000 more than last year. The Company’saccounts receivable are essentially the debit and credit card sales from the last day of the fiscal year. Prepaid expenses are $21,405,000or approximately $13,934,000 more than last year, principally due to February 2007 rent that was paid and classified as a prepaid item.
Investments consist of marketable securities, primarily high quality preferred shares and units of income trusts. At February 3, 2007, marketablesecurities amounted to $52,675,000 (market value $56,081,000) as compared with $60,132,000 (market value $66,346,000) last year.The Company has been gradually reducing the size of its investment portfolio and managing the resulting cash on a short-term basis,and in particular, reducing the percentage of its funds invested in income trusts in relation to the overall funds in its investment portfolio.
The Company invested $63,152,000 and $58,669,000 in additions to capital assets in fiscal 2007 and fiscal 2006, respectively. Thisincluded $50,275,000 in new store construction and existing store renovation costs ($37,716,000 in fiscal 2006) and $12,877,000 inhead office and distribution centre asset additions (2006 - $12,784,000). In fiscal 2006, the Company purchased its previously leasedoffice premises for $8,169,000.
Accounts payable and accrued items are $85,317,000 or approximately $3,533,000 more than last year. The Company’s accountspayable consist largely of trade payables, liabilities for unredeemed gift certificates and credit vouchers and amounts payable under theCompany performance incentive plan.
Income taxes payable of $40,289,000 includes $20,054,000 for taxes and interest related to the retroactively imposed Québec incometax assessments received in June 2006 with respect to the three previous taxation years.
In addition to its defined benefit plan, the Company sponsors a Supplemental Executive Retirement Plan for certain senior executives.An actuarial calculation was made to determine the estimated liability the Company incurred with respect to the provisions of the planfor fiscal 2007. An amount of $1,884,000 (fiscal 2006 - $68,000) was expensed in the year ended February 3, 2007 with respect to thisplan. The plan is unfunded. The expensed amount is accrued as a liability on the Company’s balance sheet. When the obligation arises tomake any payment called for under the plan (e.g. when an eligible plan member retires and begins receiving payments under the plan),the payments will reduce the accrual amount as the payments are actually made. No payments were made in 2006 and 2007 fiscal yearsand management does not expect that any payments will be made under the plan in the 2008 fiscal year.
MANAGEMENT’S DISCUSSION AND ANALYSIS
1978 1979 1980 1981 1982 1983

THE 60th ANNUAL REPORT18
MANAGEMENT’S DISCUSSION AND ANALYSIS
1984 1985 1986 1987 1988 1989
LIQUIDITY, CASH FLOWS AND CAPITAL RESOURCES
Shareholders’ equity at February 3, 2007 amounted to $436,119,000 or $6.12 per share as compared to $390,257,000 or $5.56 pershare last year. The Company continues to be in a strong financial position. The Company’s principal sources of liquidity are its cash, cashequivalents and investments in marketable securities of $241,166,000 (market value of $244,572,000) at February 3, 2007, comparedwith $195,531,000 (market value of $201,745,000) at January 28, 2006. The Company has borrowing and working capital credit facilities(unsecured) available of $125,000,000. As at February 3, 2007, $68,830,000 (January 28, 2006 - $58,066,000) of the operating line ofcredit was committed for documentary and standby letters of credit. These credit facilities are used principally for US dollar letters ofcredit to satisfy offshore third party vendors who require such backing before confirming purchase orders issued by the Company.The Company rarely uses such credit facilities for other purposes.
The Company has granted irrevocable standby letters of credit, issued by highly-rated financial institutions, to third parties to indemnifythem in the event the Company does not perform its contractual obligations. As at February 3, 2007, the maximum potential liabilityunder these guarantees was $4,249,000. The standby letters of credit mature at various dates during fiscal 2008. The Company hasrecorded no liability with respect to these guarantees, as the Company does not expect to make any payments for these items.
Major financing activities in fiscal 2007 included paying down $1,010,000 of long-term debt, consisting of the mortgage on thedistribution centre. The Company paid dividends amounting to $40,893,000 in fiscal 2007 compared to $29,345,000 in fiscal 2006.
On January 25, 2006, the Company purchased its previously leased office premises comprising 385,000 sq. ft. located at 250 SauvéStreet West in Montreal for $8,169,000.
In fiscal 2007, the Company invested $63,152,000 on new and renovated stores, the distribution centre, other office and related equipmentand the Sauvé Street office. The Company has committed $2,000,000 to complete certain equipment upgrades at the distribution centreand to complete the renovation of its Sauvé Street office. These expenditures, together with ongoing store construction and renovationprograms, the payment of cash dividends and the repayments related to the Company’s bank credit facility and long-term debt obligations,are expected to be funded by the Company’s existing financial resources and funds derived from its operations.
On May 30, 2003, the Company entered into a sale leaseback transaction with a third party financial institution for $10,000,000 of itsmerchandise handling equipment. The lease calls for 48 monthly payments of $193,000, following which the Company has an optionto extend the lease or buy back the equipment at market value. The Company intends to exercise its option to purchase the equipmentat the end of the lease for its estimated fair market value of $2,000,000.
FINANCIAL COMMITMENTSThe following table sets forth our financial commitments the details of which are described in the previous commentary.
Payments Due by PeriodWithin 2 to 4 5 years
Contractual Obligations Total 1 year years and overLong-term debt $ 16,173,000 $ 1,076,000 $ 3,665,000 $ 11,432,000Store leases and equipment 420,727,000 93,436,000 206,983,000 120,308,000Total contractual obligations $ 436,900,000 $ 94,512,000 $ 210,648,000 $ 131,740,000

THE 60th ANNUAL REPORT 19
MANAGEMENT’S DISCUSSION AND ANALYSIS
1990 1991 1992 1993 1994 1995
OFF-BALANCE SHEET ARRANGEMENTS
Derivative Financial InstrumentsThe Company in its normal course of business must make long lead-time commitments for a significant portion of its merchandisepurchases, in some cases as long as eight months. Most of these purchases must be paid for in US dollars. The Company uses a varietyof strategies, such as foreign exchange option contracts, designed to fix the cost of its continuing US dollar commitments at thelowest possible cost, while at the same time allowing itself the opportunity to take advantage of an increase in the value of the Canadiandollar vis-à-vis the US dollar.
A foreign exchange option contract represents an option to buy a foreign currency from a counterparty at a predetermined date. Creditrisks exist in the event of failure by a counterparty to fulfill its obligations. The Company reduces this risk by dealing only with higher-ratedcounterparties, normally Canadian chartered banks.
The Company does not use derivative financial instruments for speculative purposes. Foreign exchange option contracts are entered intowith maturities not exceeding three months. As at February 3, 2007, there were no outstanding foreign exchange option contracts.
Subsequent to the end of the 2007 fiscal year, the Company entered into a series of European call options which limit the Company’sexposure on future purchases during the first quarter of fiscal 2008 of $30,000,000 US at a rate of $1.19 Canadian.
Included in determination of the Company’s net earnings for fiscal 2007 is a foreign exchange loss of $915,000 (2006 - $315,000).
RELATED PARTY TRANSACTIONS
The Company leases two retail locations which are owned by a related party. The leases for such premises were entered into on commercialterms similar to those for leases entered into with third parties for similar premises. The annual rent payable under these leases is, inthe aggregate, approximately $188,000 (2006 - $177,000).
The Company incurred fees of $304,000 in fiscal 2007 (2006 - $338,000) with a firm, of which two of the Company’s outside directorsare partners, in conjunction with general legal advice. The Company believes that such remuneration was based on normal terms forbusiness transactions between unrelated parties.
These transactions are recorded at the exchange amount.
FINANCIAL INSTRUMENTS
The Company’s significant financial instruments consist of cash and cash equivalents along with investments. Financial instruments thatare exposed to concentrations of credit risk consist primarily of cash equivalents. The Company uses its cash resources to fund ongoingstore construction and renovations along with working capital needs. The Company reduces its credit risks by investing available cash inshort-term deposits with Canadian financial institutions and commercial paper with a rating not less than R1. Investments consist primarilyof preferred shares of various Canadian public companies. The Company has gradually been reducing the size of its portfolio andmanaging its cash on a short-term basis.
CRITICAL ACCOUNTING ESTIMATES
Inventory ValuationThe Company uses the retail inventory method in arriving at cost. Merchandise inventories are valued at the lower of cost and netrealizable value. Excess or slow moving items are identified and a provision is taken using management’s best estimate. In addition, aprovision for shrinkage and sales returns are also recorded using historical rates experienced. Given that inventory and cost of sales aresignificant components of the consolidated financial statements, any changes in assumptions and estimates could have a materialimpact on the Company’s financial position and results of operations.

THE 60th ANNUAL REPORT20
MANAGEMENT’S DISCUSSION AND ANALYSIS
1996 1997 1998 1999 2000 2001
Stock-Based CompensationThe Company accounts for stock-based compensation and other stock-based payments using the fair value method. Stock optionsgranted result in an expense over their vesting period based on their estimated fair values on the date of grant, determined using theBlack-Scholes option pricing model. In computing the compensation cost related to stock option awards granted during the year underthe fair value approach, various assumptions are used to determine the expected option life, risk-free interest rate, expected stock pricevolatility and average dividend yield. The use of different assumptions could result in a stock compensation expense that differs fromthat which the Company has recorded.
PensionsThe Company maintains a contributory, defined benefit plan and sponsors a supplemental executive retirement plan (“SERP”). The costof the defined benefit plan and SERP are determined periodically by independent actuaries. Pension expense is included annually inoperations. Assumptions used in developing the net pension expense and projected benefit obligation include a discount rate, rate ofincrease in salary levels and expected long-term rate of return on plan assets. The use of different assumptions could result in a pensionexpense that differs from that which the Company has recorded. The defined benefit plan is fully funded and solvent and the SERP is anunfunded pay as you go plan.
GoodwillGoodwill is not amortized but rather is tested for impairment annually or more frequently if events or changes in circumstances indicatethat the asset might be impaired. If the Company determines that in the future impairment has occurred, the Company would berequired to write-off the impaired portion of goodwill.
Gift Certificates and Credit VouchersGift certificates sold are recorded as a liability and revenue is recognized when the gift certificate is redeemed. Customers may receivea credit voucher in exchange for returned goods. Credit vouchers are recorded as a liability until redeemed. The Company, for eachreporting period, reviews the gift certificate and credit voucher liability and assesses its adequacy. In its review the Company estimatesexpected usages and evaluates specific trends and patterns which can result in an adjustment to the liability for gift certificates and/orcredit vouchers.
RECENT ACCOUNTING PRONOUNCEMENTS
The Company monitors all relevant Accounting Standards and Emerging Issue Committee pronouncements with a view to adoptingthem as necessary. Recent pronouncements include:
CICA Section 1530 – Comprehensive IncomeThis CICA handbook section introduces a statement of comprehensive income which will be included in the full set of interim and annualfinancial statements. Comprehensive income will represent the change in equity during a period from transactions and other events andcircumstances from non-owner sources and will include all changes in equity other than those resulting from investments by ownersand distributions to owners. The Company will be adopting this standard for the first quarter of the fiscal year ending February 2, 2008.
CICA Section 3855 – Financial InstrumentsThis CICA handbook section establishes standards for recognizing and measuring financial assets, financial liabilities and non-financialderivatives. All financial instruments must be classified into a defined category, namely, held-to-maturity investments, held for tradingor available-for-sale. This classification will determine how each instrument is measured and how gains and losses are recognized.In addition, the recommendations define derivatives to include non-financial derivatives and embedded derivatives which meet certaincriteria. All such derivatives must be classified as held for trading and therefore recorded at fair value. The Company will be adopting thisstandard for the first quarter of the fiscal year ending February 2, 2008.

THE 60th ANNUAL REPORT 21
MANAGEMENT’S DISCUSSION AND ANALYSIS
2002 2003 2004 2005 2006 2007
CICA Section 3865 – HedgesThe recommendations of this section are optional and are only required if the Company is applying hedge accounting. This sectionestablishes standards for the accounting treatment of qualifying hedge relationships and the necessary disclosures. The Company hasevaluated this standard and has determined that it will not be adopting hedge accounting.
OUTSTANDING SHARE DATA
At March 28, 2007, 13,440,000 Common shares of the Company and 57,817,106 Class A non-voting shares of the Company were issuedand outstanding. Each Common share entitles the holder thereof to one vote at meetings of shareholders of the Company.The Companyhas reserved 5,520,000 Class A non-voting shares for issuance under its Share Option Plan of which 1,811,750 options are outstandingat an average exercise price of $12.08. Each stock option entitles the holder to purchase one Class A non-voting share of the Companyat an exercise price established based on the market price of the shares at the date the option was granted.
The Company purchased for cancellation 40,800 Class A non-voting shares at prevailing market prices pursuant to its Share RepurchaseProgram (normal course issuer bid) for a total cash consideration of $735,000 in September 2006. The Company received, in November2006, approval from the Toronto Stock Exchange to proceed with a normal course issuer bid. Under the bid, the Company may purchaseup to 2,847,230 Class A non-voting shares of the Company, representing 5% of the issued and outstanding Class A non-voting sharesas at November 14, 2006. The bid commenced on November 28, 2006 and may continue to November 27, 2007.
DISCLOSURE CONTROLS AND PROCEDURES
Disclosure controls and procedures are designed to provide reasonable assurance that all relevant information is gathered and reported tosenior management, including the CEO and CFO, on a timely basis so that appropriate decisions can be made regarding public disclosure.
As of February 3, 2007, an evaluation was carried out of the effectiveness of the Company’s disclosure controls and procedures asdefined in Multilateral Instrument 52-109. Based on that evaluation, the Chief Executive Officer and Chief Financial Officer concludedthat the design and operation of those disclosure controls and procedures were effective. Also at February 3, 2007, an evaluation wascarried out of the design of internal controls over financial reporting to provide reasonable assurance regarding the reliability offinancial reporting. Based on that evaluation the Chief Executive Officer and Chief Financial Officer concluded that the design ofcontrols over financial reporting was effective. These evaluations were conducted in accordance with the standards set forth in InternalControl-Integrated Framework issued by the Committee of Sponsoring Organizations of the Treadway Commission ("COSO"), a recognizedcontrol model, and the requirements of Multilateral Instrument 52-109. There were no changes to the Company’s internal controls overfinancial reporting during the year ended February 3, 2007 that have materially affected, or are reasonably likely to materially affect,the Company’s internal control over financial reporting.
TRENDS, UNCERTAINTIES AND RISKSThe Company is principally engaged in the sale of women’s apparel through 920 leased retail outlets operating under seven differentbanners located across Canada. The Company’s business is seasonal and is also subject to a number of factors, which directly impactretail sales of apparel over which it has no control, namely fluctuations in weather patterns, swings in consumer confidence and buyinghabits and the potential of rapid changes in fashion preferences.

THE 60th ANNUAL REPORT22
MANAGEMENT’S DISCUSSION AND ANALYSIS
The Company depends on the efficient operation of its sole distribution centre such that any significant disruption in the operationthereof (e.g. natural disaster, system failures, destruction or major damage by fire) could delay or impair its ability to replenish its storeson a timely basis causing a loss of future sales which could have a significant effect on the Company’s results of operations. TheCompany is structured in a manner that management considers to be most effective to conduct its business in every Canadian provinceand territory and is therefore subject to all manner of material and adverse changes that can take place in any one or more of thesejurisdictions as they might impact income and sales, taxation, duties, quota impositions or re-impositions and other legislated orgovernment regulated matters. As well, there is no effective barrier to entry into the Canadian apparel retailing marketplace by anypotential competitor, foreign or domestic, and in fact the Company has witnessed the arrival over the past few years of a number offoreign-based competitors now operating in virtually all the Company’s Canadian retail sectors.As well, Canadian women have a significantnumber of e-commerce shopping alternatives available to them on a global basis.
The Company depends on information systems to manage its operations, including a full range of retail, financial, merchandising andinventory control, planning, forecasting, reporting and distribution systems. The Company regularly invests to upgrade, enhance, maintainand replace these systems. Any significant disruptions in the performance of these systems could have a material adverse impact on theCompany’s operations and financial results.
The Company has introduced a new banner, Cassis, designed to meet another specific apparel market niche in Canada. There can be noassurance that this new concept will be successful or that the Company’s overall profitability will increase as a result of introducing thisnew concept.
To mitigate these risk exposures, each banner is directed to and focused on a different niche in the Canadian women’s apparel market.Virtually all the Company’s merchandise is private label. During fiscal 2007, no supplier represented more than 9% of the Company’spurchases (in dollars and/or units) and there are a variety of alternative sources (both domestic and offshore) for virtually all theCompany’s merchandise.When merchandise is sourced offshore and must be paid for in US dollars, the Company uses a variety of defensivestrategies to fix the cost of US dollars to ensure it is protected against any material adverse fluctuations in the value of the Canadiandollar between the time the relevant merchandise is ordered and when it must be paid for.
Geographically, the Company’s stores are located generally according to Canada’s female population. About 30% of RW & CO.’smerchandise is young men’s. Menswear sales account for approximately 2% of all apparel sales made by the Company.
The Company has good relationships with its landlords and suppliers and has no reason to believe that it is exposed to any material riskthat would operate to prevent the Company from acquiring, distributing and/or selling merchandise on an ongoing basis.
While the Company has experienced significantly improved sales and operating margins in fiscal 2007, the Company cautions that pastfinancial performance is not necessarily indicative of future results.
OUTLOOK
The Company believes that it is well positioned for the future. The Reitmans banner has continued to successfully expand its offeringsin off-mall, lower cost locations, while serving its target market in larger stores with a deeper merchandise assortment. The Company’smore youth-oriented banners, namely Smart Set and RW & CO. are positioned for further growth. The Company also believes that theCassis banner will be successful. The Company continues to close marginal or unprofitable stores as appropriate.
The Company’s Hong Kong office continues to serve the Company well, with over 100 full-time employees dedicated to seeking out thehighest quality, affordable and fashionable apparel for all our banners.A branch of the Hong Kong office was opened in Shanghai to allowa closer point of contact in that area of China where a number of the Company’s larger vendors are located. On an annual basis, theCompany directly imports approximately 70% of its merchandise, largely from China.
The Company has a strong balance sheet, with excellent liquidity and borrowing capacity should it need to avail itself thereof. Itssystems, including merchandise procurement, inventory control, planning, allocation and distribution, distribution centre management,point-of-sale, financial management and information technology, are fully integrated. The Company is committed to continue to investin training for all levels of its employees.

REITMANS (CANADA) LIMITED 23
The accompanying consolidated financial statements and all the information in this annual report are the responsibility of managementand have been approved by the Board of Directors of Reitmans (Canada) Limited.
These consolidated financial statements have been prepared by management in conformity with Canadian generally accepted accountingprinciples and include amounts that are based on best estimates and judgments. The financial information used elsewhere in the annualreport is consistent with that in the consolidated financial statements.
Management of the Company has developed and maintains a system of internal accounting controls. Management believes that thissystem of internal accounting controls provides reasonable assurances that financial records are reliable and form a proper basis for thepreparation of the consolidated financial statements and that assets are properly accounted for and safeguarded.
The Board of Directors carries out its responsibility for the consolidated financial statements in this annual report principally through itsAudit Committee, consisting of all outside directors. The Audit Committee reviews the Company's annual consolidated financialstatements and recommends their approval to the Board of Directors. The auditors appointed by the shareholders have full access tothe Audit Committee, with and without management being present.
These consolidated financial statements have been examined by the auditors appointed by the shareholders, KPMG LLP, CharteredAccountants and their report is presented hereafter.
Jeremy H. Reitman Eric Williams, CAPresident Vice-President - Treasurer
March 22, 2007
MANAGEMENT’S RESPONSIBILITY FOR FINANCIAL STATEMENTS
AUDITORS’ REPORT
To the Shareholders of Reitmans (Canada) Limited
We have audited the Consolidated Balance Sheets of Reitmans (Canada) Limited as at February 3, 2007 and January 28, 2006 and theConsolidated Statements of Earnings, Retained Earnings and Cash Flows for the years then ended. These financial statements are theresponsibility of the Company's management. Our responsibility is to express an opinion on these financial statements based on our audits.
We conducted our audits in accordance with Canadian generally accepted auditing standards. Those standards require that we plan andperform an audit to obtain reasonable assurance whether the financial statements are free of material misstatement. An audit includesexamining, on a test basis, evidence supporting the amounts and disclosures in the financial statements. An audit also includes assessing theaccounting principles used and significant estimates made by management, as well as evaluating the overall financial statement presentation.
In our opinion, these consolidated financial statements present fairly, in all material respects, the financial position of the Company asat February 3, 2007 and January 28, 2006, and the results of its operations and its cash flows for the years then ended in accordancewith Canadian generally accepted accounting principles.
Chartered Accountants
Montreal, CanadaMarch 22, 2007
(signed) (signed)

REITMANS (CANADA) LIMITED24
CONSOLIDATED BALANCE SHEETS
As at February 3, 2007 and January 28, 2006(in thousands)
2007 2006
ASSETSCURRENT ASSETS
Cash and cash equivalents $ 188,491 $ 135,399Accounts receivable 3,439 3,135Merchandise inventories 61,834 66,445Prepaid expenses 21,405 7,471
Total Current Assets 275,169 212,450
INVESTMENTS (note 2) 52,675 60,132CAPITAL ASSETS (note 3) 226,734 206,184GOODWILL 42,426 42,426FUTURE INCOME TAXES (note 6) 3,407 1,536ACCRUED PENSION ASSET (note 4) - 505
$ 600,411 $ 523,233
LIABILITIES AND SHAREHOLDERS' EQUITYCURRENT LIABILITIES
Accounts payable and accrued items $ 85,317 $ 81,784Income taxes payable 40,289 14,645Future income taxes (note 6) 248 -Current portion of long-term debt (note 5) 1,076 1,010
Total Current Liabilities 126,930 97,439
DEFERRED LEASE CREDITS 20,858 19,025LONG-TERM DEBT (note 5) 15,097 16,173FUTURE INCOME TAXES (note 6) 112 339ACCRUED PENSION LIABILITY (note 4) 1,295 -
SHAREHOLDERS' EQUITYShare capital (note 7) 21,323 17,374Contributed surplus (note 8) 3,583 2,523Retained earnings 411,213 370,360
Total Shareholders' Equity 436,119 390,257Commitments (note 10)
$ 600,411 $ 523,233
The accompanying notes are an integral part of these consolidated financial statements.
On behalf of the Board,
JEREMY H. REITMAN STEPHEN J. KAUSER Director Director
(signed) (signed)

REITMANS (CANADA) LIMITED 25
CONSOLIDATED STATEMENTS OF EARNINGS
For the years ended February 3, 2007 and January 28, 2006(in thousands except per share amounts)
2007 2006
Sales $1,042,509 $ 969,258Cost of goods sold and selling, general and
administrative expenses 855,697 813,648186,812 155,610
Depreciation and amortization 44,946 38,564Operating earnings before the undernoted 141,866 117,046
Investment income 12,556 9,097Interest on long-term debt 1,056 1,132Earnings before income taxes 153,366 125,011
Income taxes (note 6):Current 52,693 40,830Future (1,850) (708)
50,843 40,122Québec tax assessments - current 20,054 -
70,897 40,122Net earnings $ 82,469 $ 84,889
Earnings per share (note 9):Basic $ 1.17 $ 1.22Diluted 1.15 1.19
CONSOLIDATED STATEMENTS OF RETAINED EARNINGS
For the years ended February 3, 2007 and January 28, 2006(in thousands)
2007 2006
Balance at beginning of year $ 370,360 $ 316,191Net earnings 82,469 84,889
452,829 401,080Deduct:
Dividends 40,893 29,345Premium on purchase of Class A non-voting shares (note 7) 723 1,375
Balance at end of year $ 411,213 $ 370,360
The accompanying notes are an integral part of these consolidated financial statements.

REITMANS (CANADA) LIMITED26
2007 2006
CASH FLOWS FROM OPERATING ACTIVITIESNet earnings $ 82,469 $ 84,889Adjustments for:
Depreciation and amortization 44,946 38,564Future income taxes (1,850) (708)Stock-based compensation 1,314 2,100Amortization of deferred licensing revenue - (167)Amortization of deferred lease credits (4,042) (3,652)Deferred lease credits 5,875 4,941Pension expense 1,800 997Pension contribution - (133)Gain on sale of marketable securities (2,289) (2,287)
Changes in non-cash working capital items relating to operations 17,206 (11,385)145,429 113,159
CASH FLOWS USED IN INVESTING ACTIVITIESPurchases of marketable securities (4,170) (12,632)Proceeds on sale of marketable securities 13,916 20,982Additions to capital assets (63,152) (58,669)
(53,406) (50,319)
CASH FLOWS USED IN FINANCING ACTIVITIESDividends paid (40,893) (29,345)Purchase of Class A non-voting shares for cancellation (735) (1,401)Repayment of long-term debt (1,010) (1,124)Proceeds from issue of share capital 3,707 2,490
(38,931) (29,380)
NET INCREASE IN CASH AND CASH EQUIVALENTS 53,092 33,460CASH AND CASH EQUIVALENTS, BEGINNING OF YEAR 135,399 101,939CASH AND CASH EQUIVALENTS, END OF YEAR $ 188,491 $ 135,399
Supplemental disclosure of cash flow information (note 13)
Cash and cash equivalents consist of cash balances with banks and investments in short-term deposits.
The accompanying notes are an integral part of these consolidated financial statements.
CONSOLIDATED STATEMENTS OF CASH FLOWS
For the years ended February 3, 2007 and January 28, 2006(in thousands)

REITMANS (CANADA) LIMITED 27
NOTES TO CONSOLIDATED FINANCIAL STATEMENTS
For the years ended February 3, 2007 and January 28, 2006(all amounts in thousands except per share amounts)
Reitmans (Canada) Limited (“the Company”) is incorporated under the Canada Business Corporations Act and its principal businessactivity is the sale of women’s wear at retail.
1. SUMMARY OF SIGNIFICANT ACCOUNTING POLICIES
a) Basis of PresentationThe financial statements and accompanying notes have been prepared on a consolidated basis and reflect the consolidatedfinancial position of the Company and its wholly-owned subsidiaries. All significant intercompany balances and transactions havebeen eliminated from these financial statements. The Company’s fiscal year ends on the Saturday closest to the end of January.All references to 2007 and 2006 represent the fiscal years ended February 3, 2007 and January 28, 2006, respectively. Fiscal 2007includes 53 weeks instead of the normal 52 weeks. The inclusion of an extra week occurs every fifth or sixth fiscal year due to theCompany’s floating year-end date.
b) Revenue RecognitionSales are recognized when a customer purchases and takes delivery of the product. Reported sales are net of returns and anestimated allowance for returns and excludes sales taxes. Gift certificates sold are recorded as a liability and revenue is recognizedwhen the gift certificate is redeemed. Customers may receive a credit voucher in exchange for returned goods. Credit vouchers arerecorded as a liability until redeemed.
c) Cash and Cash EquivalentsCash and cash equivalents consist of cash and short-term deposits with original maturities of three months or less.
d) InventoriesMerchandise inventories are valued at the lower of cost, determined principally on an average basis using the retail inventorymethod and net realizable value.
e) InvestmentsMarketable securities are carried at cost. Income is recorded on the accrual basis.
f) Capital AssetsCapital assets are recorded at cost and are depreciated at the following annual rates applied to their cost, commencing with theyear of acquisition:
Buildings and improvements 4% to 15%Fixtures and equipment 10% to 331/3%
Leasehold interests 15%
Leasehold improvements are depreciated at the lesser of the estimated useful life of the asset and the lease term.Tenant allowancesare recorded as deferred lease credits and amortized as a reduction of rent expense over the term of the related leases.
Expenditures associated with the opening of new stores, other than fixtures, equipment and leasehold improvements, are expensedas incurred.
The Company carries on its operations in premises under leases of varying terms, which are accounted for as operating leases.
Depreciation and amortization expense includes the write-off of assets associated with store closings and renovations.
Long-lived assets are reviewed for recoverability whenever events indicate an impairment may exist. An impairment loss ismeasured as the amount by which the carrying value of an asset or a group of assets exceeds its fair value. If such assets or groupof assets are considered impaired, an impairment loss is recognized and the carrying value of the long-lived asset is adjusted.

REITMANS (CANADA) LIMITED28
g) GoodwillGoodwill is not amortized but is tested for impairment annually, or more frequently if events or changes in circumstances indicatethat the asset might be impaired. The impairment test is carried out in two steps. In the first step, the carrying amount of thereporting unit is compared with its fair value. When the fair value of a reporting unit exceeds its carrying amount, goodwill of thereporting unit is considered not to be impaired and the second step of the impairment test is unnecessary. The second step iscarried out when the carrying amount of a reporting unit exceeds its fair value, in which case the implied fair value of thereporting unit’s goodwill is compared with its carrying amount to measure the amount of the impairment loss, if any.
The Company conducted the annual impairment test on February 3, 2007 and concluded that there was no impairment in thecarrying value of goodwill.
h) Income TaxesThe Company uses the asset and liability method when accounting for income taxes. Under this method, future income taxes arerecognized for the future income tax consequences attributable to differences between the financial statement carrying values andtheir respective income tax basis (temporary differences). Future income tax assets and liabilities are measured using enacted orsubstantively enacted income tax rates expected to apply to taxable income in the years in which temporary differences are expectedto be recovered or settled. The effect on future income tax assets and liabilities of a change in tax rates is included in income inthe period that includes the enactment or substantively enacted date. Future income tax assets are evaluated and if realization isnot considered to be more likely than not, a valuation allowance is provided.
i) PensionsThe Company maintains a contributory defined benefit plan, the Reitmans Executive Retirement Pension Plan (“Plan”). The Planprovides for pensions based on length of service and average earnings in the best five consecutive years.
The Company also sponsors a Supplemental Executive Retirement Plan (“SERP”), which is neither registered nor pre-funded.
The costs of the pension plans are determined periodically by independent actuaries. Pension expense/income is included annuallyin operations.
The Company records its pension costs according to the following policies:
• The cost of pensions is actuarially determined using the projected benefit method prorated on service.
• For the purpose of calculating expected return on plan assets, the valuation of those assets are based on quoted market values.
• Past service costs from plan amendments are amortized on a straight-line basis over the average remaining service period ofemployees active at the date of the amendment.
• Experience gains or losses arising on accrued benefit obligations and plan assets are recognized in the period in which they occur.
The difference between the cumulative amounts expensed and the funding contributions is recorded on the balance sheet as anaccrued pension asset or an accrued pension liability as the case may be.
j) Stock-Based CompensationThe Company accounts for stock-based compensation and other stock-based payments using the fair value based method.Compensation cost is measured at the fair value at the date of grant and is expensed over the vesting period, which is normallyfive years. The Company accounts for forfeitures as they occur.
k) Earnings per ShareBasic earnings per share is determined using the weighted average number of Class A non-voting and Common shares outstandingduring the year. The treasury stock method is used for calculating diluted earnings per share. In calculating diluted earnings pershare, the weighted average number of shares outstanding are increased to include additional shares issued from the assumedexercise of options, if dilutive. The number of additional shares is calculated by assuming that the proceeds from such exercises, aswell as the amount of unrecognized stock-based compensation, are used to purchase Class A non-voting shares at the averagemarket share price during the reporting period.
NOTES TO CONSOLIDATED FINANCIAL STATEMENTS

REITMANS (CANADA) LIMITED 29
l) Foreign Currency TranslationMonetary assets and liabilities denominated in foreign currencies are translated into Canadian dollars at the year-end exchangerate. Other balance sheet items denominated in foreign currencies are translated into Canadian dollars at the exchange ratesprevailing at the respective transaction date. Revenues and expenses denominated in foreign currencies are translated intoCanadian dollars at the average rate of exchange for the year. The resulting gains or losses on translation are included in thedetermination of net earnings.
m) Financial InstrumentsThe Company makes use of foreign exchange option contracts to manage its US dollar exposure. These derivative financialinstruments are not used for trading or speculative purposes and are reported on a mark-to-market basis. The related gains andlosses are included in the determination of net earnings.
n) Use of EstimatesIn preparing the Company’s financial statements, management is required to make estimates and assumptions that affect thereported amounts of assets and liabilities, the disclosure of contingent assets and liabilities at the date of the financial statementsand reported amounts of revenues and expenses during the period. Financial results as determined by actual events may differ fromthese estimates.
Significant areas requiring the use of management estimates and assumptions include the key assumptions used in determiningthe useful life and recoverability of capital assets, stock-based compensation costs, future income tax assets and liabilities,inventory valuation, sales returns provision and gift certificate and credit voucher liabilities.
o) GuaranteesIn the normal course of business, the Company enters into various agreements that may contain guarantees. A liability is recordedwhen the Company considers it probable that a payment relating to the guarantee has to be made to the other party.
2. INVESTMENTS
The Company’s marketable securities portfolio consists primarily of preferred shares of Canadian public companies. Income frommarketable securities and short-term deposits is included in investment income. The market value of the portfolio at February 3, 2007was $56,081 (2006 - $66,346).
3. CAPITAL ASSETS
2007 2006Accumulated AccumulatedDepreciation Depreciation
and Net Book and Net BookCost Amortization Value Cost Amortization Value
Land $ 4,615 $ - $ 4,615 $ 4,615 $ - $ 4,615Buildings and improvements 46,671 8,256 38,415 42,147 5,364 36,783Fixtures and equipment 166,739 68,799 97,940 157,372 66,823 90,549Leasehold improvements 151,245 66,097 85,148 132,155 58,365 73,790Leasehold interests 890 274 616 621 174 447
$370,160 $143,426 $226,734 $ 336,910 $ 130,726 $ 206,184
During the year, due to various store closings and renovations, the Company wrote-off assets with a net book value of $4,216(2006 - $2,187). The write-offs are included in depreciation and amortization expense.
NOTES TO CONSOLIDATED FINANCIAL STATEMENTS

REITMANS (CANADA) LIMITED30
4. PENSIONS
The Company’s contributory defined benefit plan was actuarially valued as at December 31, 2004 and the obligation was projected toDecember 31, 2006. The next actuarial valuation is scheduled for December 2007.
Assumptions, based upon data as of December 31, 2006, used in developing the net pension expense (income) and projected benefitobligation are as follows:
2007 2006
Discount rate 4.95% 4.94%Rate of increase in salary levels 3.00% 3.00%Expected long-term rate of return on plan assets 7.50% 7.50%
In addition, the Company sponsors a Supplemental Executive Retirement Plan (“SERP”) covering certain pension plan members. Thisspecial plan is subject to the same actuarial assumptions and methods as the Reitmans Executive Retirement Pension Plan (“Plan”).
The following tables present reconciliations of the pension obligations, the plan assets and the funded status of the benefit plans:
2007 2006Plan SERP Total Plan SERP Total
Pension ObligationPension obligation,
beginning of year $ 10,104 $ 8,508 $ 18,612 $ 8,326 $ - $ 8,326Employee contributions 130 - 130 95 - 95Current service cost 465 180 645 196 12 208Interest cost 517 429 946 488 - 488Benefits paid (470) - (470) (421) - (421)Plan amendments - - - - 8,496 8,496Actuarial losses (12) 600 588 1,420 - 1,420Pension obligation, end of year $ 10,734 $ 9,717 $ 20,451 $ 10,104 $ 8,508 $ 18,612
Plan AssetsMarket value of plan assets,
beginning of year $ 10,677 $ - $ 10,677 $ 9,695 $ - $ 9,695Employer contributions - - - 133 - 133Employee contributions 130 - 130 95 - 95Actual return on plan assets 1,054 - 1,054 1,175 - 1,175Benefits paid (470) - (470) (421) - (421)Market value of plan assets,
end of year $ 11,391 $ - $ 11,391 $ 10,677 $ - $ 10,677
Plan (deficit) surplus 657 (9,717) (9,060) 573 (8,508) (7,935)Unamortized past service cost - 7,765 7,765 - 8,440 8,440Pension asset (liability),
end of year $ 657 $ (1,952) $ (1,295) $ 573 $ (68) $ 505
NOTES TO CONSOLIDATED FINANCIAL STATEMENTS

REITMANS (CANADA) LIMITED 31
The Company’s net annual benefit plans expense consists of the following:
2007 2006Plan SERP Total Plan SERP Total
Pension ExpenseCurrent service cost $ 465 $ 180 $ 645 $ 196 $ 12 $ 208Past service cost - 675 675 - 56 56Interest cost 517 429 946 488 - 488Actual return on plan assets (1,054) - (1,054) (1,175) - (1,175)Actuarial losses (12) 600 588 1,420 - 1,420Net pension (income) expense $ (84) $ 1,884 $ 1,800 $ 929 $ 68 $ 997
The asset allocation of the major asset categories as at December 31, 2006 is as follows:
Asset Category Allocation
Equity securities 67%Debt securities 32%
Cash 1%100%
5. LONG-TERM DEBT
2007 2006Mortgage bearing interest at 6.40%, payable in monthly instalments
of principal and interest of $172, due November 2017 and secured by the Company’s distribution centre $ 16,173 $ 17,183
Less current portion 1,076 1,010$ 15,097 $ 16,173
Principal repayments on long-term debt are as follows:
Fiscal years ending2008 $ 1,0762009 1,1462010 1,2202011 1,2992012 1,384
Subsequent years 10,048$ 16,173
6. INCOME TAXES
a) During the year, the Québec National Assembly enacted legislation (Bill 15) that retroactively changed certain tax laws thatsubject the Company to additional taxes and interest for the 2003, 2004 and 2005 years. In accordance with Canadian generallyaccepted accounting principles, as a result of Québec income tax assessments received, amounts of $20,054 for retroactive taxesand interest have been expensed in the year.
The Company has filed formal objection notices for these unpaid assessments and will pursue all avenues to mitigate the taxliability. However, the Company is unable to judge the likelihood of success.
NOTES TO CONSOLIDATED FINANCIAL STATEMENTS
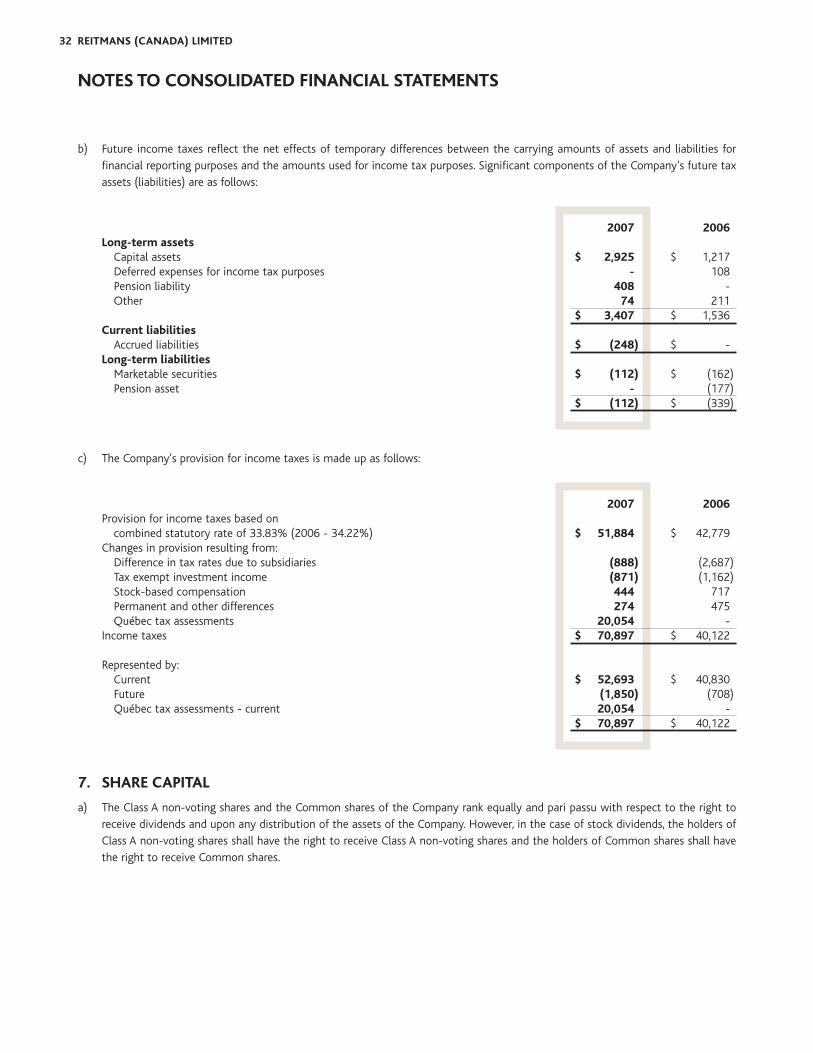
REITMANS (CANADA) LIMITED32
b) Future income taxes reflect the net effects of temporary differences between the carrying amounts of assets and liabilities forfinancial reporting purposes and the amounts used for income tax purposes. Significant components of the Company’s future taxassets (liabilities) are as follows:
2007 2006Long-term assets
Capital assets $ 2,925 $ 1,217Deferred expenses for income tax purposes - 108Pension liability 408 -Other 74 211
$ 3,407 $ 1,536Current liabilities
Accrued liabilities $ (248) $ -Long-term liabilities
Marketable securities $ (112) $ (162)Pension asset - (177)
$ (112) $ (339)
c) The Company's provision for income taxes is made up as follows:
2007 2006Provision for income taxes based on
combined statutory rate of 33.83% (2006 - 34.22%) $ 51,884 $ 42,779Changes in provision resulting from:
Difference in tax rates due to subsidiaries (888) (2,687)Tax exempt investment income (871) (1,162)Stock-based compensation 444 717Permanent and other differences 274 475Québec tax assessments 20,054 -
Income taxes $ 70,897 $ 40,122
Represented by:Current $ 52,693 $ 40,830Future (1,850) (708)Québec tax assessments - current 20,054 -
$ 70,897 $ 40,122
7. SHARE CAPITAL
a) The Class A non-voting shares and the Common shares of the Company rank equally and pari passu with respect to the right toreceive dividends and upon any distribution of the assets of the Company. However, in the case of stock dividends, the holders ofClass A non-voting shares shall have the right to receive Class A non-voting shares and the holders of Common shares shall havethe right to receive Common shares.
NOTES TO CONSOLIDATED FINANCIAL STATEMENTS

REITMANS (CANADA) LIMITED 33
b) The Company has authorized an unlimited number of Class A non-voting shares.
The following table summarizes Class A non-voting shares issued for each of the years listed:
Class ANumber Book
of Shares ValueBalance January 29, 2005 56,108 $ 14,230Shares issued pursuant to exercise of stock options 730 2,688Shares purchased under issuer bid (91) (26)Balance January 28, 2006 56,747 16,892Shares issued pursuant to exercise of stock options 1,111 3,961Shares purchased under issuer bid (41) (12)Balance February 3, 2007 57,817 $ 20,841
The amounts credited to share capital from the exercise of stock options include a cash consideration of $3,707 (2006 - $2,490)as well as an ascribed value from contributed surplus of $254 (2006 - $198).
The Company has authorized an unlimited number of Common shares. At February 3, 2007, there were 13,440 common sharesissued (2006 - 13,440) with a value of $482 (2006 - $482).
c) The Company has reserved 5,520 Class A non-voting shares for issuance under its Share Option Plan of which 1,812 options areoutstanding as at February 3, 2007. The granting of options and the related vesting period are at the discretion of the Board ofDirectors and have a maximum term of 10 years. The exercise price payable for each Class A non-voting share covered by a stockoption is determined by the Board of Directors at the date of grant, but may not be less than the closing price of the Company’sshares on the trading day immediately preceding the effective date of the grant.
The Company granted 105 stock options during 2007 (2006 - 80), which will be expensed over their vesting period based on theirestimated fair values on the date of grant, determined using the Black-Scholes option-pricing model, while 40 (2006 - 20) stockoptions were cancelled.
Compensation cost related to stock option awards granted during the year under the fair value based approach was calculated usingthe following assumptions:
95 Options Granted 10 Options GrantedAugust 24, 2006 November 22, 2006
Expected option life 4.8 years 4.6 yearsRisk-free interest rate 3.87% 3.88%Expected stock price volatility 29.67% 29.67%Average dividend yield 2.77% 2.91%Weighted average fair value of options granted $4.79 $5.15
Changes in outstanding stock options were as follows:
2007 2006Weighted Weighted
Average Average Options Exercise Price Options Exercise Price
Outstanding at beginning of year 2,858 $ 8.33 3,528 $ 7.09Granted 105 20.37 80 19.23Exercised (1,111) 3.34 (730) 3.41Forfeited (40) 9.04 (20) 12.23Outstanding at end of year 1,812 $ 12.08 2,858 $ 8.33Options exercisable at end of year 555 $ 12.24 894 $ 5.72
NOTES TO CONSOLIDATED FINANCIAL STATEMENTS

REITMANS (CANADA) LIMITED34
The following table summarizes information about share options outstanding at February 3, 2007:
Options Outstanding Options Exercisable
WeightedAverage Weighted Weighted
Range of Number Remaining Average Number AverageExercise Prices Outstanding Contractual Life Exercise Price Exercisable Exercise Price
$ 4.25 - $ 5.68 215 3.00 years $ 4.41 15 $ 5.01$12.23 1,412 5.00 12.23 524 12.23$19.23 - $ 22.02 185 5.57 19.88 16 19.23
1,812 4.82 years $ 12.08 555 $ 12.24
For the year ended February 3, 2007, the Company recognized compensation cost of $1,314 (2006 - $2,100) with an offsettingcredit to contributed surplus.
d) The Company purchased, under the prior year’s normal course issuer bid, 41 Class A non-voting shares having a book value of $12under its stock repurchase program for a total cash consideration of $735. The excess of the purchase price over book value of theshares in the amount of $723 was charged to retained earnings.
e) The Company received, in November 2006, approval from the Toronto Stock Exchange to proceed with a normal course issuer bid.Under the bid, the Company may purchase up to 2,847 Class A non-voting shares of the Company, representing 5% of the issuedand outstanding Class A non-voting shares as at November 14, 2006. The bid commenced on November 28, 2006 and maycontinue to November 27, 2007.
8. CONTRIBUTED SURPLUS
The following table summarizes the changes in contributed surplus for each of the years listed:
Balance January 29, 2005 $ 621Stock option compensation costs 2,100Ascribed value credited to share capital from exercise of stock options (198)Balance January 28, 2006 2,523Stock option compensation costs 1,314Ascribed value credited to share capital from exercise of stock options (254)Balance February 3, 2007 $ 3,583
9. EARNINGS PER SHARE
The number of shares used in the earnings per share calculation is as follows:
2007 2006Weighted average number of shares for basic earnings
per share calculations 70,442 69,801Effect of dilutive options outstanding 1,359 1,544Weighted average number of shares for diluted earnings
per share calculations 71,801 71,345
NOTES TO CONSOLIDATED FINANCIAL STATEMENTS

REITMANS (CANADA) LIMITED 35
10. COMMITMENTS
Minimum lease payments under operating leases for retail stores, offices, distribution centre equipment, automobiles and equipment,exclusive of additional amounts based on sales, taxes and other costs are payable as follows:
Fiscal years ending2008 $ 93,4362009 82,7852010 69,9992011 54,1992012 38,142
Subsequent years 82,166$ 420,727
11. CREDIT FACILITY
At February 3, 2007, the Company had an unsecured operating line of credit available with Canadian chartered banks to a maximum of$125,000 or its US dollar equivalent. As at February 3, 2007, $68,830 (January 28, 2006 - $58,066) of the operating line of credit wascommitted for documentary and standby letters of credit.
12. GUARANTEES
The Company has granted irrevocable standby letters of credit, issued by highly-rated financial institutions, to third parties toindemnify them in the event the Company does not perform its contractual obligations. As at February 3, 2007, the maximumpotential liability under these guarantees was $4,249. The standby letters of credit mature at various dates during fiscal 2008.The Company has recorded no liability with respect to these guarantees, as the Company does not expect to make any payments forthese items.
13. OTHER INFORMATION
a) Included in determination of the Company’s net earnings is a foreign exchange loss of $915 (2006 - $315).
b) Supplementary cash flow information:
2007 2006
Balances with banks (overdraft) $ 6,239 $ (2,971)Short-term deposits, bearing interest at 4.3% (2006 - 3.5%) 182,252 138,370
$ 188,491 $ 135,399Cash paid during the year for:
Income taxes $ 48,730 $ 44,834Interest 1,339 1,262
Non-cash transactions:Capital asset additions included in accounts payable 3,404 1,060
NOTES TO CONSOLIDATED FINANCIAL STATEMENTS

REITMANS (CANADA) LIMITED36
14. RELATED PARTY TRANSACTIONS
The Company leases two retail locations which are owned by a related party. The leases for such premises were entered into oncommercial terms similar to those for leases entered into with third parties for similar premises. The annual rent payable under theseleases is, in the aggregate, approximately $188 (2006 - $177).
The Company incurred fees of $304 in fiscal 2007 (2006 - $338) with a firm connected to outside directors of the Company in conjunctionwith general legal advice. The Company believes that such remuneration was based on normal terms for business transactions betweenunrelated parties.
These transactions are recorded at the exchange amount.
15. FINANCIAL INSTRUMENTS
a) Fair Value DisclosureFair value estimates are made at a specific point in time, using available information about the financial instrument. These estimatesare subjective in nature and often cannot be determined with precision.
The Company has determined that the carrying value of its short-term financial assets and liabilities approximates fair value at theyear-end dates due to the short-term maturity of these instruments. The fair values of the marketable securities are based onpublished market prices at year-end.
The fair value of long-term debt is not significantly different from its carrying value.
The fair value of the Company’s long-term debt bearing interest at a fixed rate was calculated using the present value of futurepayments of principal and interest discounted at the current market rates of interest available to the Company, for the same orsimilar debt instruments with the same remaining maturities.
b) Foreign Currency Risk ManagementThe Company purchases a significant amount of its goods with US dollars. The Company uses a combination of foreign exchangeoption contracts and spot purchases to hedge its foreign exchange exposure on cash flows related to these purchases. These optioncontracts generally do not exceed three months. A foreign exchange option contract represents an option to buy a foreign currencyfrom a counterparty to meet its obligations. The Company reduces this risk by dealing only with highly-rated counterparties, normallymajor Canadian financial institutions.
As at February 3, 2007 and January 28, 2006 there were no outstanding foreign exchange option contracts.
c) Credit RiskThe Company’s financial instruments that are exposed to concentrations of credit risk consist primarily of cash equivalents.
The Company invests available cash in short-term deposits with Canadian financial institutions and commercial paper with arating not less than R1.
16. COMPARATIVE FIGURES
Certain comparative figures have been reclassified to conform with the presentation adopted in the current year. In particular,investment income, which had been previously classified as part of cash flows from investing activities, is now included in cash flowsfrom operating activities.
NOTES TO CONSOLIDATED FINANCIAL STATEMENTS

Jeremy H. Reitman PresidentStephen F. Reitman Executive Vice-PresidentDiane Archibald Vice-President - Store PlanningDouglas M. Deruchie, CA Vice-President - FinanceClaude Martineau Vice-President - Information TechnologyIsabelle Oliva Vice-President - Human ResourcesCyril Reitman Vice-PresidentAllen F. Rubin Vice-President - OperationsAllan Salomon Vice-President - Real Estate Saul Schipper Vice-President - Secretary Richard Wait, CGA Vice-President - ComptrollerJay Weiss Vice-President - Distribution and LogisticsEric Williams, CA Vice-President - Treasurer
REITMANS (CANADA) LIMITEDAdministration Office:250 Sauvé Street West Montreal, QC H3L 1Z2
Telephone: (514) 384-1140Fax: (514) 385-2669e-mail: [email protected] Website: www.reitmans.ca
Registered Office:3300 Highway #7 West, Suite 702Vaughan, ON L4K 4M3
Telephone: (905) 761-2830Fax: (905) 761-8922
TRANSFER AGENT AND REGISTRARComputershare Trust Company of CanadaMontreal, Toronto, Calgary, Vancouver
STOCK SYMBOLSTHE TORONTO STOCK EXCHANGECommon RETClass A non-voting RET. A
Une version française de ce rapport peut être obtenue en écrivant au secrétaire de Reitmans (Canada) Limitée, 250, rue Sauvé ouest, Montréal, QC H3L 1Z2
OFFICERSHenry Fiederer President - ReitmansStephanie Bleau Vice-President - ReitmansNadia Cerantola Vice-President - ReitmansDonna Flynn Vice-President - ReitmansBruce MacKeracher Vice-President - ReitmansStefanie Ravenda Vice-President - ReitmansJacqueline Tardif Vice-President - ReitmansLesya McQueen President - Smart Set Cathy Cockerton Vice-President - Smart Set Sylvain Forest Vice-President - Smart Set Stéphane Renauld Vice-President - Smart Set Danielle Vallières Vice-President - Smart Set
H. Jonathan BirksStephen J. KauserMax Konigsberg
Samuel MinzbergCyril ReitmanJeremy H. Reitman
Stephen F. ReitmanHoward StotlandRobert S. Vineberg
DIRECTORS
Reitmans Distribution Centre, Montreal, Québec
Suzana Vovko President - RW & CO.Cathryn Adeluca Vice-President - RW & CO.Isabelle Taschereau President - Thyme MaternityWilliam Penney Vice-President - Thyme MaternityKimberly Schumpert President - CassisLeah Daley Vice-President - CassisKerry Mitchell President - Penningtons / Addition ElleTrudy Crane Vice-President - Penningtons / Addition ElleDoug Edwards Vice-President - Penningtons / Addition ElleJonathan Plens Vice-President - Penningtons / Addition ElleSally Firth Vice-President - PenningtonsRhonda Sandler Vice-President - Addition Elle
CORPORATE INFORMATION

REITMANS
SMART SET
RW & CO.
THYME
CASSIS
PENNINGTONS
ADDITION ELLE
DESIGN AND PRODUCTION:COMMUNICATIONS MARILYN GELFAND INC.