Embed Size (px)
DESCRIPTION
6/28/2010 Hurst Market Report
Citation preview
MARKET UPDATETamara Keilberg's
· Current Real Estate Market Conditions for Single Family Homes· Trends in Pricing· Current Levels of Supply and Demand· Value Metrics
· Report for the week ofJune 28, 2010
· Presented by Tamara KeilbergTamara Keilberg Luxury Real Estatewww.LuxuryHomesDFW.com - [email protected]
HURST, TX
Powered by Altos Research LLC | www.altosresearch.com | Copyright © 2005-2010 Altos Research LLC
Median List Price
Median Lot Size
18.2
Percent Relisted (reset DOM)
1958
2.0
4 %
Median Number of Bathrooms
102
Inventory of Properties Listed
$ 84
Percent Flip (price increased)
8,001 - 10,000 sqft
Median House Size (sq ft)
$ 157,000
47 %
3.0
Market Action Index
Median Number of Bedrooms
Asking Price Per Square Foot
10 %
Percent of Properties with Price Decrease
Strong Buyer's
==
≠≠
≠≠
==
≠≠
Altos Research Value Statistics
Most Expensive Listing
Average Days on Market (DoM)
Bottom/Fourth
Lower/Third
Upper/Second
Top/First
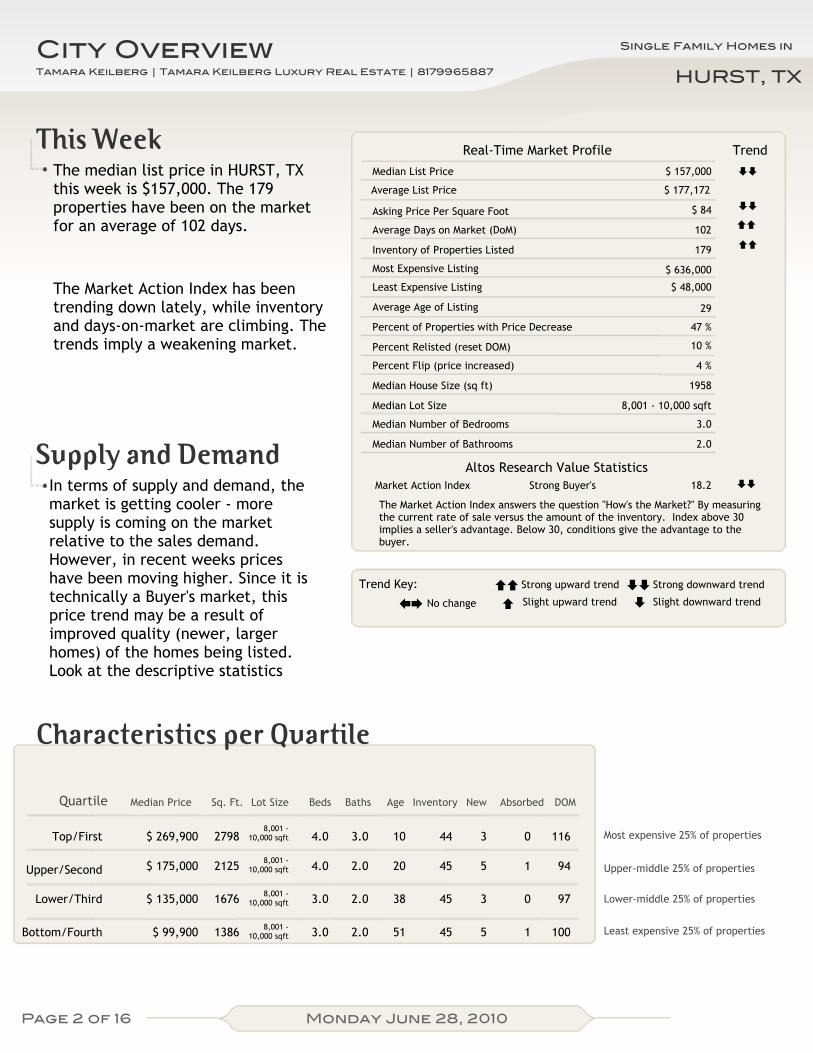
This Week Real-Time Market Profile Trend
The Market Action Index answers the question "How's the Market?" By measuringthe current rate of sale versus the amount of the inventory. Index above 30implies a seller's advantage. Below 30, conditions give the advantage to thebuyer.
Supply and Demand
Characteristics per Quartile
10 02798
972.0 38
3.0
3
94
3.0 45
100
5
0
8,001 -10,000 sqft
51
$ 135,000
5
3
45
3.0
8,001 -10,000 sqft
12.0
1386 8,001 -10,000 sqft
45
$ 99,900
4.0
116
8,001 -10,000 sqft$ 175,000
4.0$ 269,900
20
1
2125
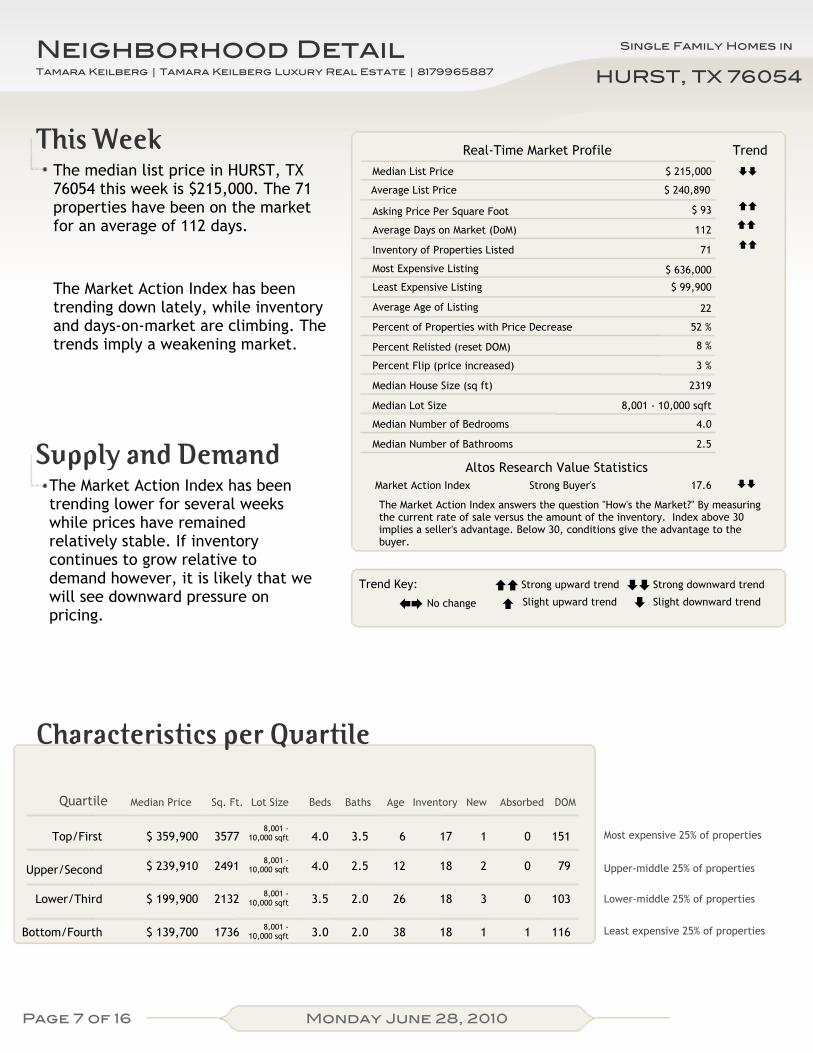
The Market Action Index has beentrending down lately, while inventoryand days-on-market are climbing. Thetrends imply a weakening market.
Monday June 28, 2010
Tamara Keilberg | Tamara Keilberg Luxury Real Estate | 8179965887
44
1676
2.0
The median list price in HURST, TXthis week is $157,000. The 179properties have been on the marketfor an average of 102 days.
Most expensive 25% of properties
Upper-middle 25% of properties
Lower-middle 25% of properties
Least expensive 25% of properties
Quartile Median Price Lot Size Beds Baths Age Inventory New Absorbed DOMSq. Ft.
No change
Strong upward trend Strong downward trend
Slight upward trend Slight downward trend±+
== ≠≠
≠=
HURST, TXCity Overview
Least Expensive Listing
Average List Price
Average Age of Listing
179
$ 636,000
$ 48,000
$ 177,172
29
Trend Key:
In terms of supply and demand, themarket is getting cooler - moresupply is coming on the marketrelative to the sales demand.However, in recent weeks priceshave been moving higher. Since it istechnically a Buyer's market, thisprice trend may be a result ofimproved quality (newer, largerhomes) of the homes being listed.Look at the descriptive statistics
Page 2 of 16
Single Family Homes in
Tamara Keilberg | Tamara Keilberg Luxury Real Estate | 8179965887
City OverviewHURST, TX
Monday June 28, 2010
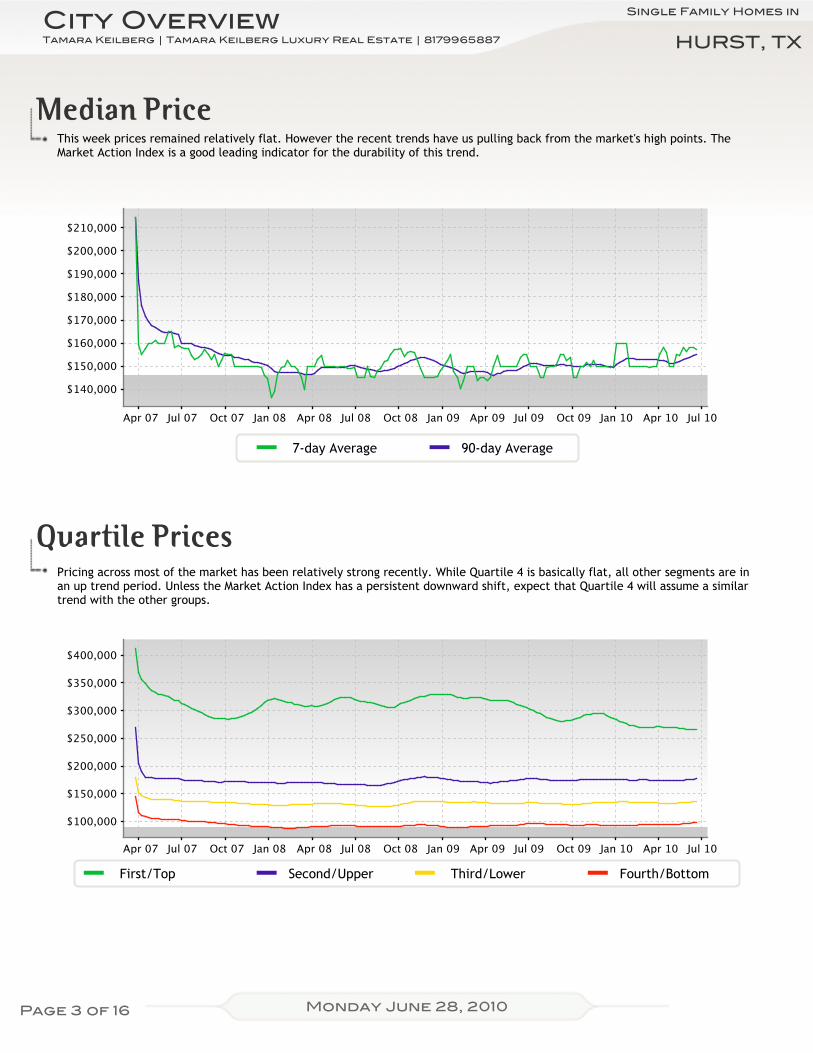
Median PriceThis week prices remained relatively flat. However the recent trends have us pulling back from the market's high points. TheMarket Action Index is a good leading indicator for the durability of this trend.
90-day Average7-day Average
Quartile PricesPricing across most of the market has been relatively strong recently. While Quartile 4 is basically flat, all other segments are inan up trend period. Unless the Market Action Index has a persistent downward shift, expect that Quartile 4 will assume a similartrend with the other groups.
First/Top Second/Upper Third/Lower Fourth/Bottom
Page 3 of 16
Single Family Homes in
Tamara Keilberg | Tamara Keilberg Luxury Real Estate | 8179965887
City OverviewHURST, TX
Monday June 28, 2010
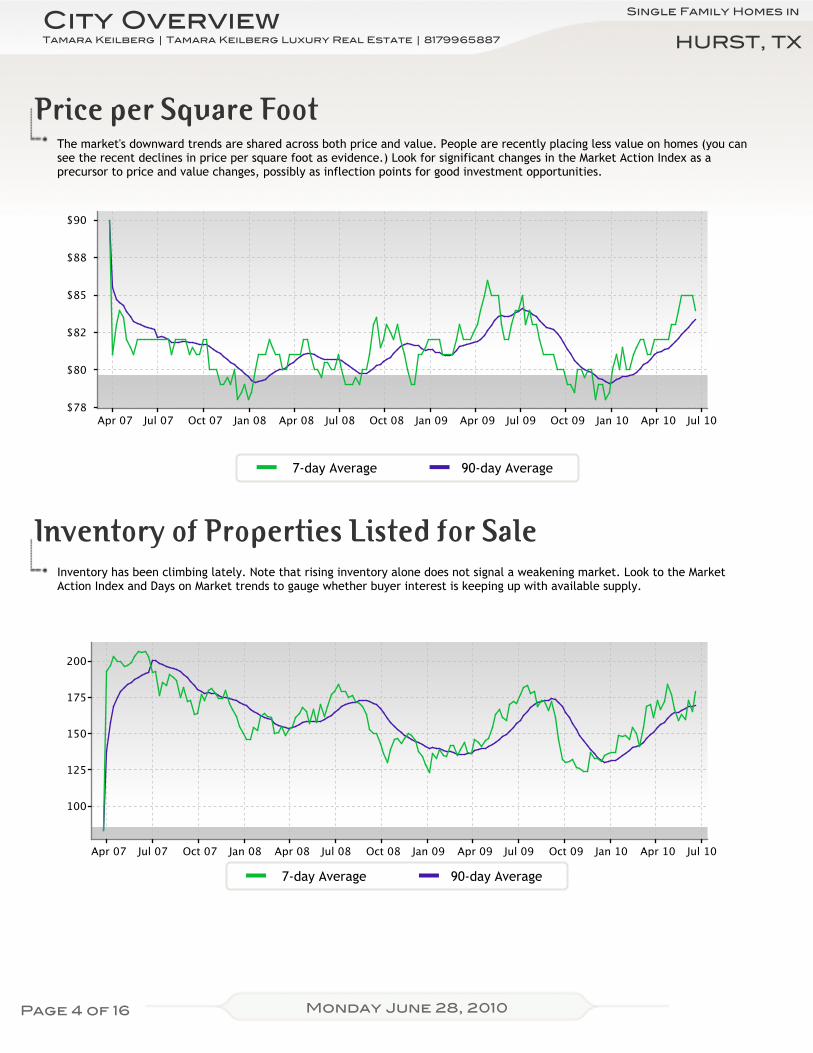
Price per Square FootThe market's downward trends are shared across both price and value. People are recently placing less value on homes (you cansee the recent declines in price per square foot as evidence.) Look for significant changes in the Market Action Index as aprecursor to price and value changes, possibly as inflection points for good investment opportunities.
90-day Average7-day Average
Inventory of Properties Listed for SaleInventory has been climbing lately. Note that rising inventory alone does not signal a weakening market. Look to the MarketAction Index and Days on Market trends to gauge whether buyer interest is keeping up with available supply.
90-day Average7-day Average
Page 4 of 16
Single Family Homes in
Tamara Keilberg | Tamara Keilberg Luxury Real Estate | 8179965887
City OverviewHURST, TX
Monday June 28, 2010
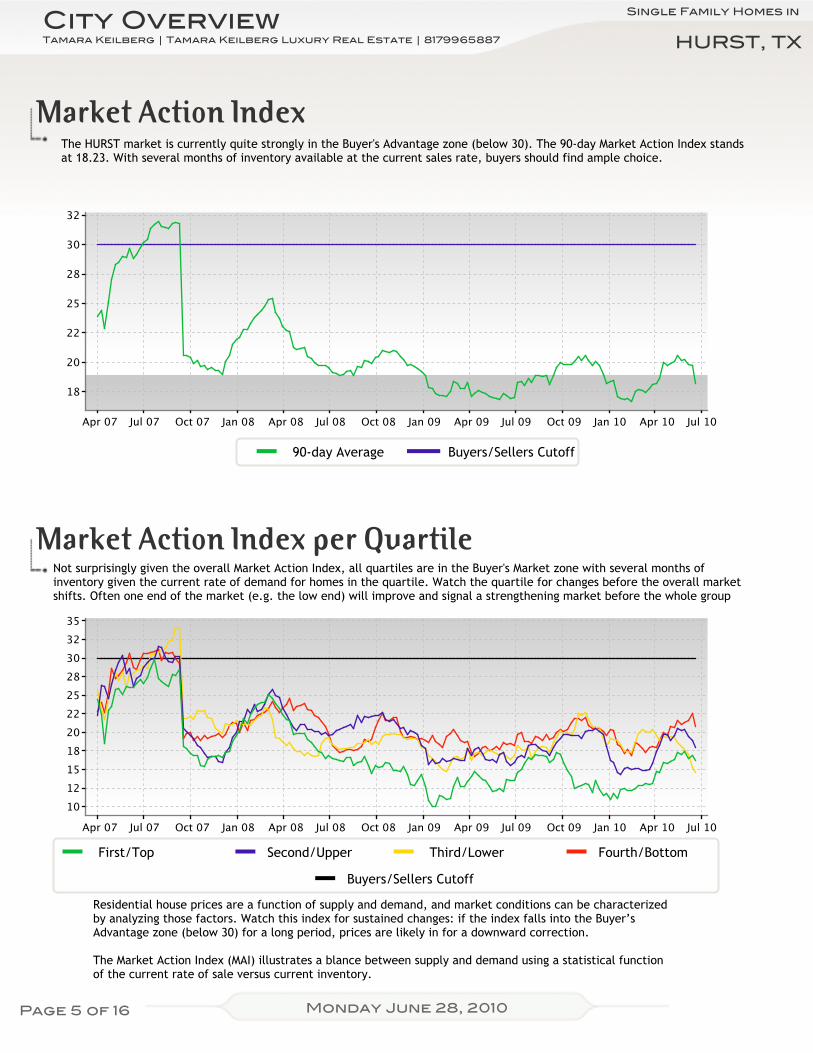
Market Action IndexThe HURST market is currently quite strongly in the Buyer's Advantage zone (below 30). The 90-day Market Action Index standsat 18.23. With several months of inventory available at the current sales rate, buyers should find ample choice.
Buyers/Sellers Cutoff90-day Average
Market Action Index per QuartileNot surprisingly given the overall Market Action Index, all quartiles are in the Buyer's Market zone with several months ofinventory given the current rate of demand for homes in the quartile. Watch the quartile for changes before the overall marketshifts. Often one end of the market (e.g. the low end) will improve and signal a strengthening market before the whole group
First/Top Second/Upper Third/Lower Fourth/Bottom
Buyers/Sellers Cutoff
Residential house prices are a function of supply and demand, and market conditions can be characterizedby analyzing those factors. Watch this index for sustained changes: if the index falls into the Buyer’sAdvantage zone (below 30) for a long period, prices are likely in for a downward correction.
The Market Action Index (MAI) illustrates a blance between supply and demand using a statistical functionof the current rate of sale versus current inventory.
Page 5 of 16
Single Family Homes in
Tamara Keilberg | Tamara Keilberg Luxury Real Estate | 8179965887
City OverviewHURST, TX
Monday June 28, 2010
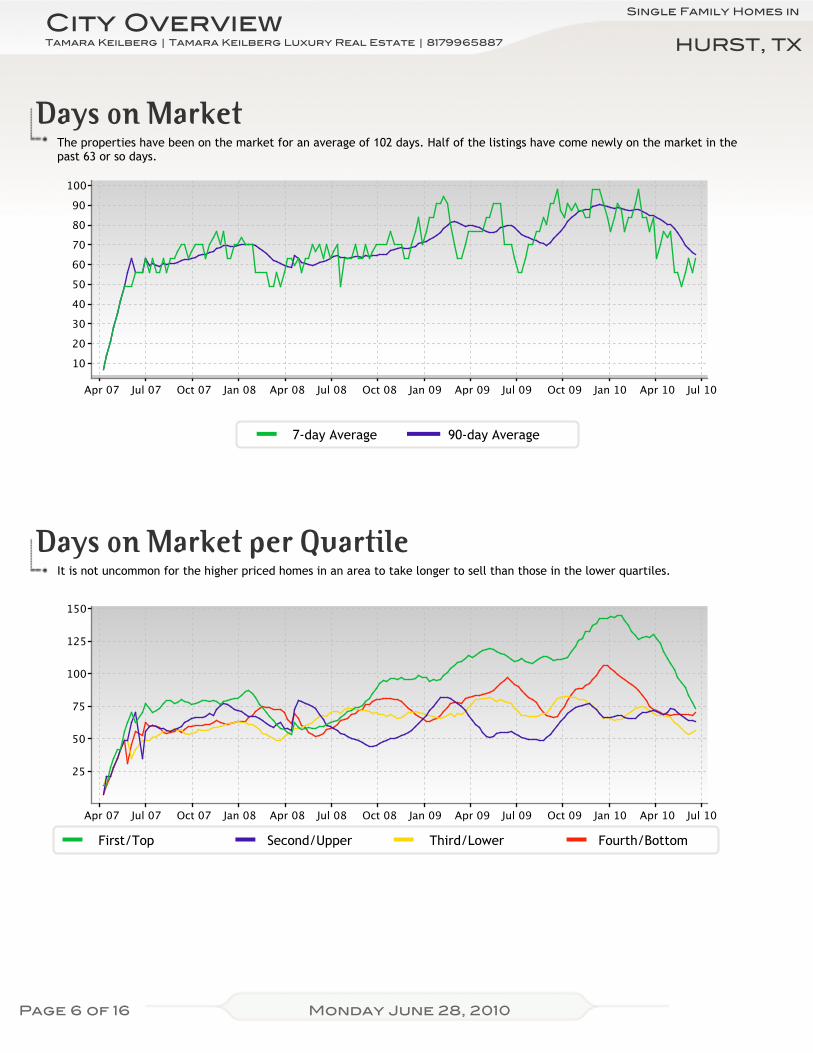
Days on MarketThe properties have been on the market for an average of 102 days. Half of the listings have come newly on the market in thepast 63 or so days.
90-day Average7-day Average
Days on Market per QuartileIt is not uncommon for the higher priced homes in an area to take longer to sell than those in the lower quartiles.
First/Top Second/Upper Third/Lower Fourth/Bottom
Page 6 of 16
Single Family Homes in
Median List Price
Median Lot Size
17.6
Percent Relisted (reset DOM)
2319
2.5
3 %
Median Number of Bathrooms
112
Inventory of Properties Listed
$ 93
Percent Flip (price increased)
8,001 - 10,000 sqft
Median House Size (sq ft)
$ 215,000
52 %
4.0
Market Action Index
Median Number of Bedrooms
Asking Price Per Square Foot
8 %
Percent of Properties with Price Decrease
Strong Buyer's
==
≠≠
==
==
≠≠
Altos Research Value Statistics
Most Expensive Listing
Average Days on Market (DoM)
Bottom/Fourth
Lower/Third
Upper/Second
Top/First
This Week Real-Time Market Profile Trend
The Market Action Index answers the question "How's the Market?" By measuringthe current rate of sale versus the amount of the inventory. Index above 30implies a seller's advantage. Below 30, conditions give the advantage to thebuyer.
Supply and Demand
Characteristics per Quartile
6 03577
1032.0 26
3.0
3
79
3.5 18
116
2
0
8,001 -10,000 sqft
38
$ 199,900
1
1
18
3.5
8,001 -10,000 sqft
02.5
1736 8,001 -10,000 sqft
18
$ 139,700
4.0
151
8,001 -10,000 sqft$ 239,910
4.0$ 359,900
12
1
2491
The Market Action Index has beentrending down lately, while inventoryand days-on-market are climbing. Thetrends imply a weakening market.
Monday June 28, 2010
Tamara Keilberg | Tamara Keilberg Luxury Real Estate | 8179965887
17
2132
2.0
The median list price in HURST, TX76054 this week is $215,000. The 71properties have been on the marketfor an average of 112 days.
Most expensive 25% of properties
Upper-middle 25% of properties
Lower-middle 25% of properties
Least expensive 25% of properties
Quartile Median Price Lot Size Beds Baths Age Inventory New Absorbed DOMSq. Ft.
No change
Strong upward trend Strong downward trend
Slight upward trend Slight downward trend±+
== ≠≠
≠=
HURST, TX 76054Neighborhood Detail
Least Expensive Listing
Average List Price
Average Age of Listing
71
$ 636,000
$ 99,900
$ 240,890
22
Trend Key:
The Market Action Index has beentrending lower for several weekswhile prices have remainedrelatively stable. If inventorycontinues to grow relative todemand however, it is likely that wewill see downward pressure onpricing.
Page 7 of 16
Single Family Homes in
Tamara Keilberg | Tamara Keilberg Luxury Real Estate | 8179965887
Neighborhood DetailHURST, TX 76054
Monday June 28, 2010
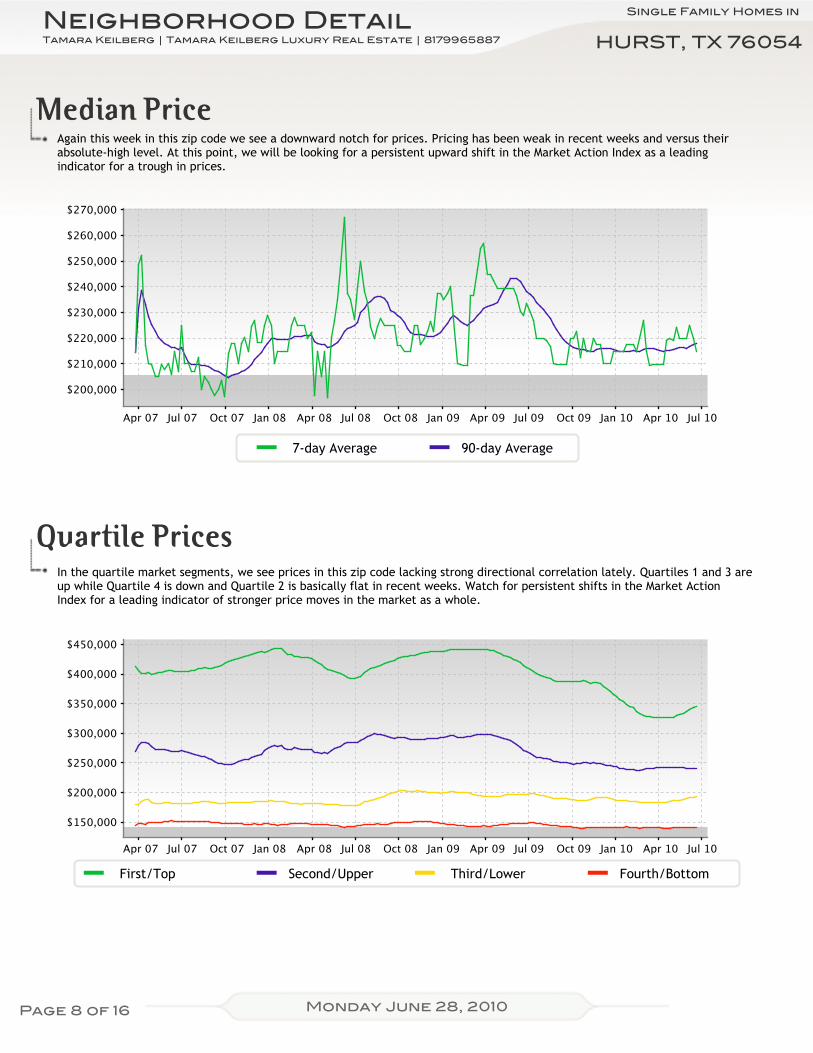
Median PriceAgain this week in this zip code we see a downward notch for prices. Pricing has been weak in recent weeks and versus theirabsolute-high level. At this point, we will be looking for a persistent upward shift in the Market Action Index as a leadingindicator for a trough in prices.
90-day Average7-day Average
Quartile PricesIn the quartile market segments, we see prices in this zip code lacking strong directional correlation lately. Quartiles 1 and 3 areup while Quartile 4 is down and Quartile 2 is basically flat in recent weeks. Watch for persistent shifts in the Market ActionIndex for a leading indicator of stronger price moves in the market as a whole.
First/Top Second/Upper Third/Lower Fourth/Bottom
Page 8 of 16
Single Family Homes in
Tamara Keilberg | Tamara Keilberg Luxury Real Estate | 8179965887
Neighborhood DetailHURST, TX 76054
Monday June 28, 2010
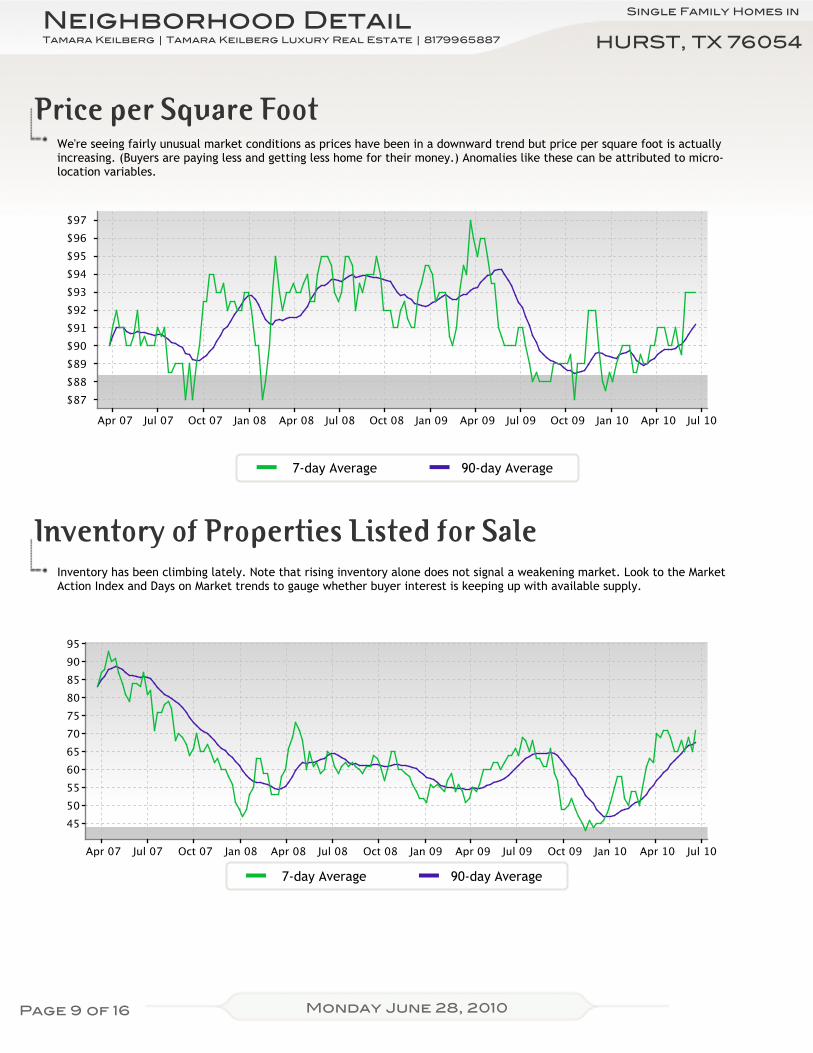
Price per Square FootWe're seeing fairly unusual market conditions as prices have been in a downward trend but price per square foot is actuallyincreasing. (Buyers are paying less and getting less home for their money.) Anomalies like these can be attributed to micro-location variables.
90-day Average7-day Average
Inventory of Properties Listed for SaleInventory has been climbing lately. Note that rising inventory alone does not signal a weakening market. Look to the MarketAction Index and Days on Market trends to gauge whether buyer interest is keeping up with available supply.
90-day Average7-day Average
Page 9 of 16
Single Family Homes in
Tamara Keilberg | Tamara Keilberg Luxury Real Estate | 8179965887
Neighborhood DetailHURST, TX 76054
Monday June 28, 2010
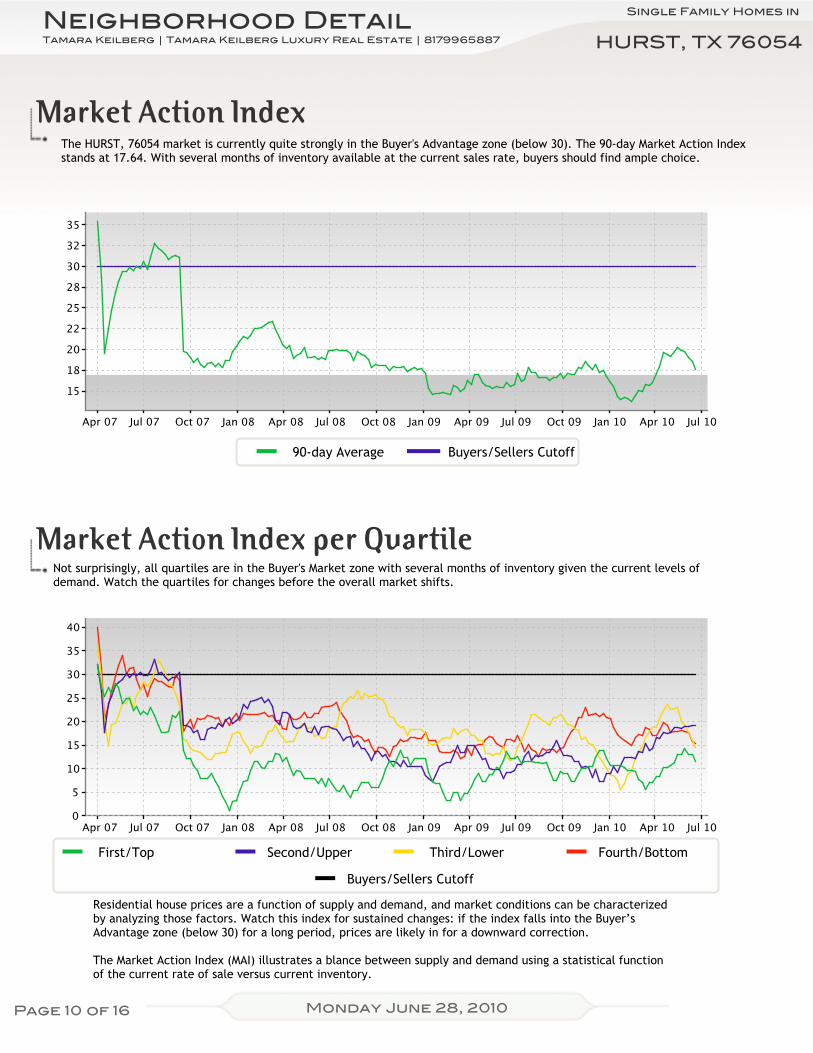
Market Action IndexThe HURST, 76054 market is currently quite strongly in the Buyer's Advantage zone (below 30). The 90-day Market Action Indexstands at 17.64. With several months of inventory available at the current sales rate, buyers should find ample choice.
Buyers/Sellers Cutoff90-day Average
Market Action Index per QuartileNot surprisingly, all quartiles are in the Buyer's Market zone with several months of inventory given the current levels ofdemand. Watch the quartiles for changes before the overall market shifts.
First/Top Second/Upper Third/Lower Fourth/Bottom
Buyers/Sellers Cutoff
Residential house prices are a function of supply and demand, and market conditions can be characterizedby analyzing those factors. Watch this index for sustained changes: if the index falls into the Buyer’sAdvantage zone (below 30) for a long period, prices are likely in for a downward correction.
The Market Action Index (MAI) illustrates a blance between supply and demand using a statistical functionof the current rate of sale versus current inventory.
Page 10 of 16
Single Family Homes in
Tamara Keilberg | Tamara Keilberg Luxury Real Estate | 8179965887
Neighborhood DetailHURST, TX 76054
Monday June 28, 2010
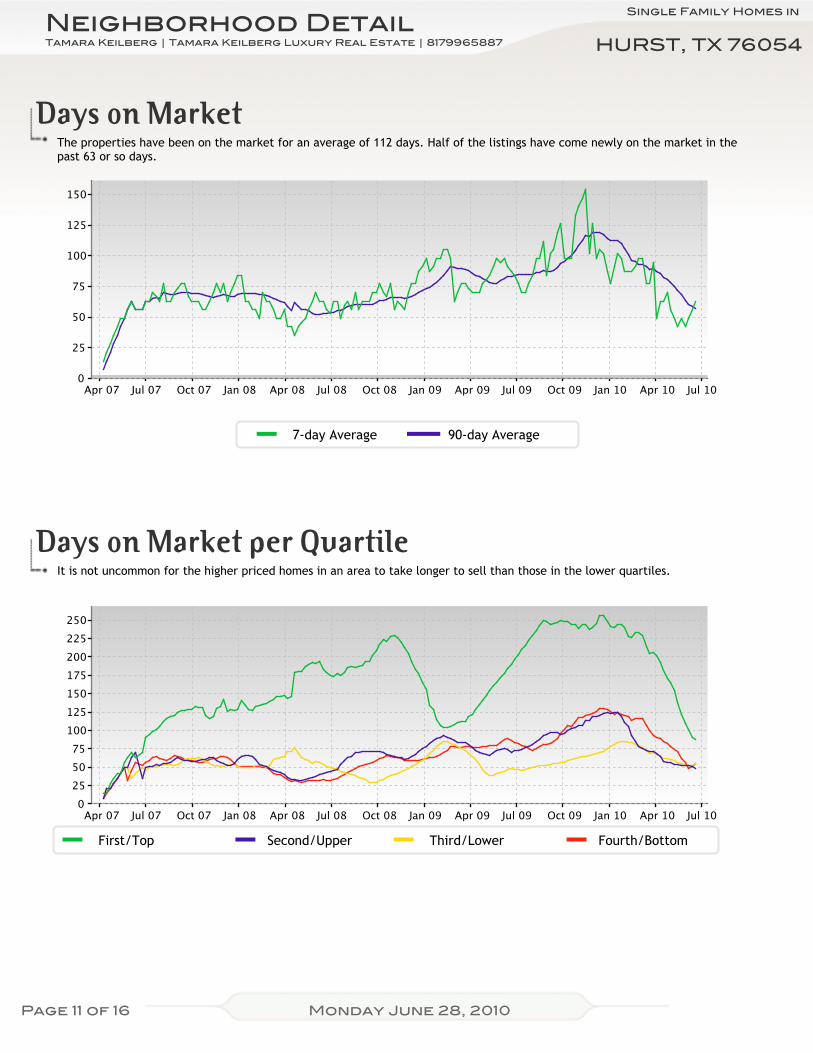
Days on MarketThe properties have been on the market for an average of 112 days. Half of the listings have come newly on the market in thepast 63 or so days.
90-day Average7-day Average
Days on Market per QuartileIt is not uncommon for the higher priced homes in an area to take longer to sell than those in the lower quartiles.
First/Top Second/Upper Third/Lower Fourth/Bottom
Page 11 of 16
Single Family Homes in
Median List Price
Median Lot Size
18.2
Percent Relisted (reset DOM)
1729
2.0
5 %
Median Number of Bathrooms
95
Inventory of Properties Listed
$ 78
Percent Flip (price increased)
8,001 - 10,000 sqft
Median House Size (sq ft)
$ 129,900
44 %
3.0
Market Action Index
Median Number of Bedrooms
Asking Price Per Square Foot
11 %
Percent of Properties with Price Decrease
Strong Buyer's
==
±+
==
±+
±+
Altos Research Value Statistics
Most Expensive Listing
Average Days on Market (DoM)
Bottom/Fourth
Lower/Third
Upper/Second
Top/First
This Week Real-Time Market Profile Trend
The Market Action Index answers the question "How's the Market?" By measuringthe current rate of sale versus the amount of the inventory. Index above 30implies a seller's advantage. Below 30, conditions give the advantage to thebuyer.
Supply and Demand
Characteristics per Quartile
7 12487
912.0 49
3.0
2
97
3.0 27
96
2
0
8,001 -10,000 sqft
52
$ 115,000
3
2
27
2.0
6,501 -8,000 sqft
02.0
1320 8,001 -10,000 sqft
27
$ 84,900
3.0
97
4,501 -6,500 sqft$ 142,500
4.0$ 184,900
9
0
1826
With inventory trending up but days-on-market and the Market ActionIndex essentially flat recently,conditions do not seem to have strongup or down pull.
Monday June 28, 2010
Tamara Keilberg | Tamara Keilberg Luxury Real Estate | 8179965887
27
1529
2.0
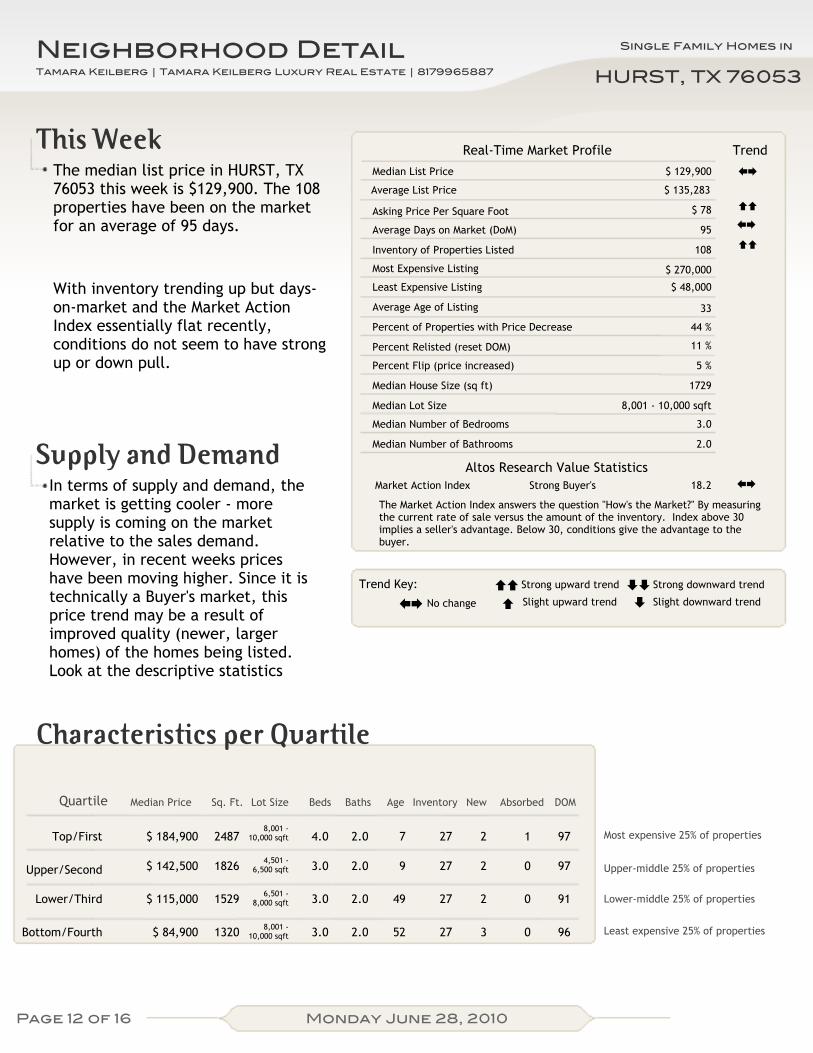
The median list price in HURST, TX76053 this week is $129,900. The 108properties have been on the marketfor an average of 95 days.
Most expensive 25% of properties
Upper-middle 25% of properties
Lower-middle 25% of properties
Least expensive 25% of properties
Quartile Median Price Lot Size Beds Baths Age Inventory New Absorbed DOMSq. Ft.
No change
Strong upward trend Strong downward trend
Slight upward trend Slight downward trend±+
== ≠≠
≠=
HURST, TX 76053Neighborhood Detail
Least Expensive Listing
Average List Price
Average Age of Listing
108
$ 270,000
$ 48,000
$ 135,283
33
Trend Key:
In terms of supply and demand, themarket is getting cooler - moresupply is coming on the marketrelative to the sales demand.However, in recent weeks priceshave been moving higher. Since it istechnically a Buyer's market, thisprice trend may be a result ofimproved quality (newer, largerhomes) of the homes being listed.Look at the descriptive statistics
Page 12 of 16
Single Family Homes in
Tamara Keilberg | Tamara Keilberg Luxury Real Estate | 8179965887
Neighborhood DetailHURST, TX 76053
Monday June 28, 2010
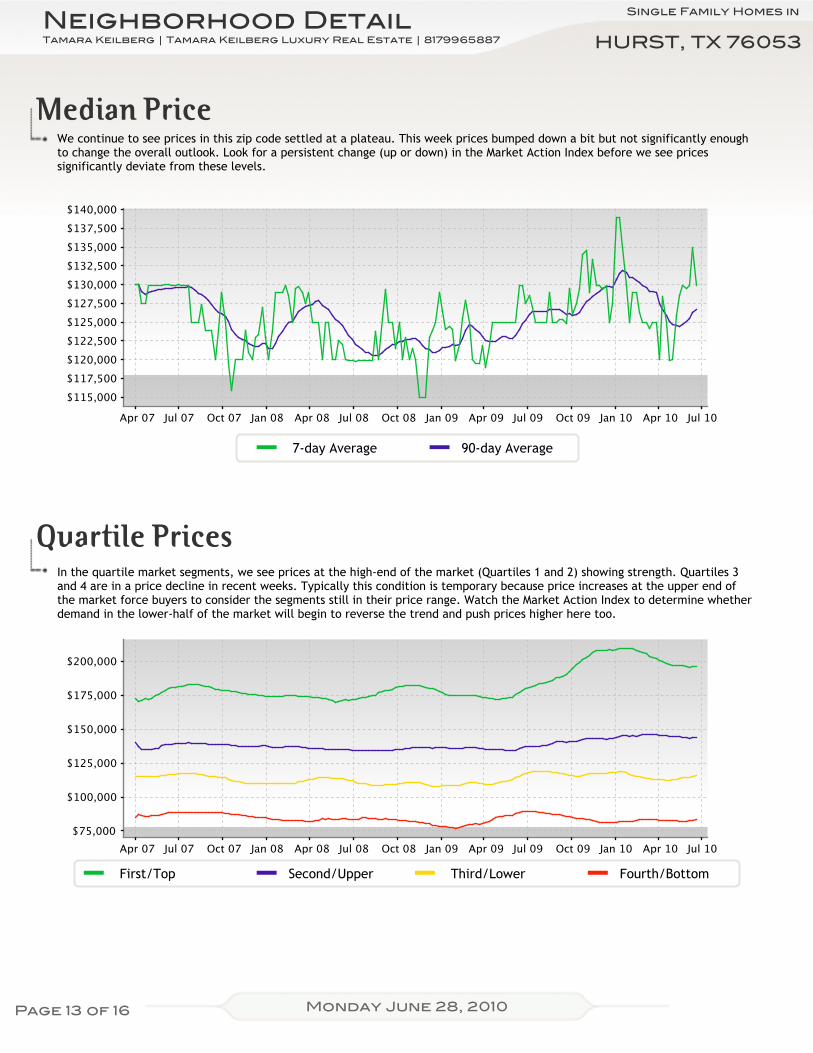
Median PriceWe continue to see prices in this zip code settled at a plateau. This week prices bumped down a bit but not significantly enoughto change the overall outlook. Look for a persistent change (up or down) in the Market Action Index before we see pricessignificantly deviate from these levels.
90-day Average7-day Average
Quartile PricesIn the quartile market segments, we see prices at the high-end of the market (Quartiles 1 and 2) showing strength. Quartiles 3and 4 are in a price decline in recent weeks. Typically this condition is temporary because price increases at the upper end ofthe market force buyers to consider the segments still in their price range. Watch the Market Action Index to determine whetherdemand in the lower-half of the market will begin to reverse the trend and push prices higher here too.
First/Top Second/Upper Third/Lower Fourth/Bottom
Page 13 of 16
Single Family Homes in

Tamara Keilberg | Tamara Keilberg Luxury Real Estate | 8179965887
Neighborhood DetailHURST, TX 76053
Monday June 28, 2010
Price per Square FootThe value placed on homes continues to increase, despite the fact that prices in general have been basically flat recently.These conditions can arise when inventory is light and more, smaller homes have more influence on overall prices.
90-day Average7-day Average
Inventory of Properties Listed for SaleInventory has been climbing lately. Note that rising inventory alone does not signal a weakening market. Look to the MarketAction Index and Days on Market trends to gauge whether buyer interest is keeping up with available supply.
90-day Average7-day Average
Page 14 of 16
Single Family Homes in
Tamara Keilberg | Tamara Keilberg Luxury Real Estate | 8179965887
Neighborhood DetailHURST, TX 76053
Monday June 28, 2010
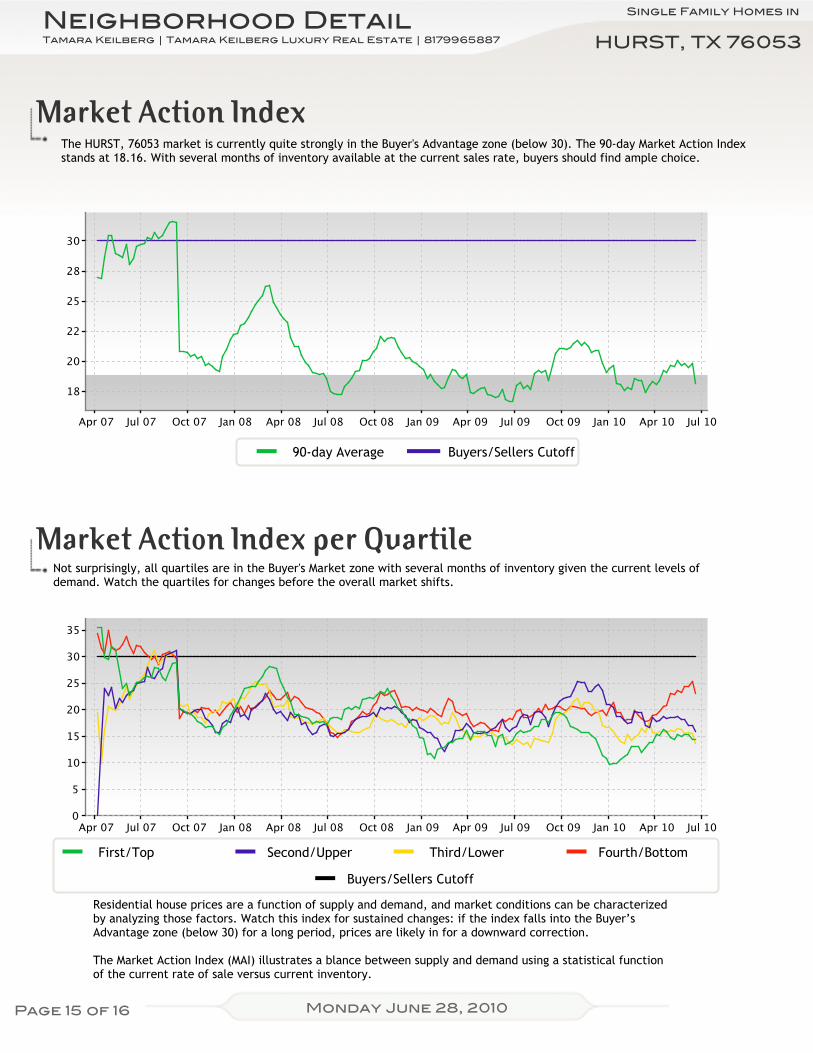
Market Action IndexThe HURST, 76053 market is currently quite strongly in the Buyer's Advantage zone (below 30). The 90-day Market Action Indexstands at 18.16. With several months of inventory available at the current sales rate, buyers should find ample choice.
Buyers/Sellers Cutoff90-day Average
Market Action Index per QuartileNot surprisingly, all quartiles are in the Buyer's Market zone with several months of inventory given the current levels ofdemand. Watch the quartiles for changes before the overall market shifts.
First/Top Second/Upper Third/Lower Fourth/Bottom
Buyers/Sellers Cutoff
Residential house prices are a function of supply and demand, and market conditions can be characterizedby analyzing those factors. Watch this index for sustained changes: if the index falls into the Buyer’sAdvantage zone (below 30) for a long period, prices are likely in for a downward correction.
The Market Action Index (MAI) illustrates a blance between supply and demand using a statistical functionof the current rate of sale versus current inventory.
Page 15 of 16
Single Family Homes in
Tamara Keilberg | Tamara Keilberg Luxury Real Estate | 8179965887
Neighborhood DetailHURST, TX 76053
Monday June 28, 2010
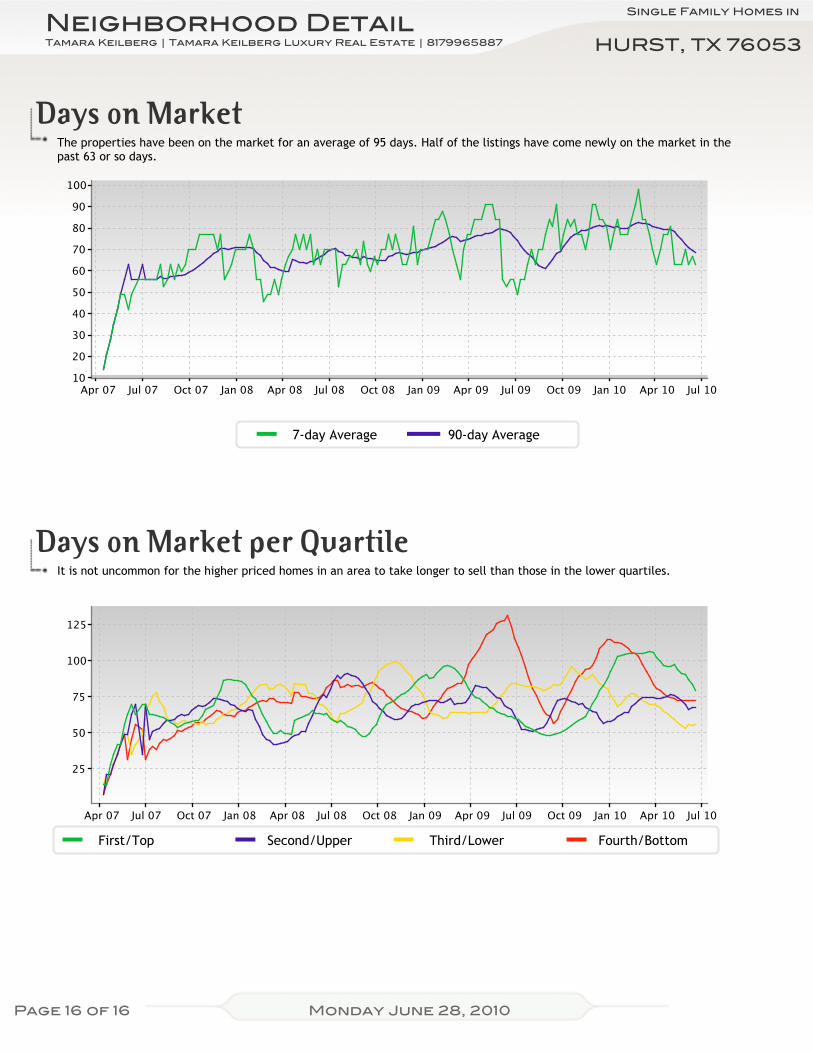
Days on MarketThe properties have been on the market for an average of 95 days. Half of the listings have come newly on the market in thepast 63 or so days.
90-day Average7-day Average
Days on Market per QuartileIt is not uncommon for the higher priced homes in an area to take longer to sell than those in the lower quartiles.
First/Top Second/Upper Third/Lower Fourth/Bottom
Page 16 of 16
Single Family Homes in