Embed Size (px)
Citation preview
Treasury Operations Basics 1
BAS-BN202
Treasury Operations Basics
Treasury Operations Basics 2
Table of Contents
Basic – Treasury Operations.................................................................................................. 4 1. Introduction to Treasury Operations .................................................................................. 4
1.1 Understanding Treasury Operations .................................................................................. 4
1.2 Structure and Functions of Treasury Management ........................................................... 8
1.3 Role and Functions of Front, Mid and Back Office of Integrated Treasury Department . 9
1.4 Treasury Control Framework ........................................................................................... 12
2. Macroeconomic Policy ...................................................................................................... 17
2.1 GDP / GNP ......................................................................................................................... 17
2.2 Inflation ............................................................................................................................. 18
2.3 Interest Rates .................................................................................................................... 19
2.4 Exchange Rate: .................................................................................................................. 20
2.5 Macroeconomic Policies – Monetary and Fiscal Policies ................................................ 20
2.6 Monetary and Fiscal Policies ............................................................................................ 22
2.7 Monetary policy and interest rates.................................................................................. 24
3. Treasury markets and instruments ................................................................................... 26
3.1 Money Market Instruments ............................................................................................. 26
3.2 Coupon Bearing Instruments ............................................................................................ 27
3.3 Discount Instruments ....................................................................................................... 27
3.4 Fixed income instruments ................................................................................................ 28
3.5 Participants in fixed income markets .............................................................................. 29
3.6 Government Securities ..................................................................................................... 30
3.7 Corporate Debt Markets ................................................................................................... 31
3.8 Credit Rating and its importance ..................................................................................... 31
3.9 Trading in fixed income securities ................................................................................... 33
3.10 Bond Mathematics – Yield, Duration, Convexity, Bond Prices and Interest Rates ........ 33
3.11 Cost of Funds ..................................................................................................................... 48
3.12 Managing Investment Portfolio and Trading Portfolio ................................................... 49
3.13 Derivatives in Fixed Income Markets – Forwards, Futures, Options and Swaps ........... 50
4. Foreign Exchange Markets – Introduction ........................................................................ 59
4.1 Overview of Global Forex Markets .................................................................................. 59
4.2 Products and Participants in Foreign Exchange Markets ................................................ 60
Treasury Operations Basics 3
4.3 Spot and forward markets................................................................................................ 61
4.4 Foreign Exchange Arithmetic – Rate Computations ........................................................ 65
4.5 Factors affecting Foreign Exchange Market ..................................................................... 69
5. Asset Liability Management – Overview ........................................................................... 71
5.1 Product Pricing and Performance Management, Interest Rate Risk for Asset Liability
Management ..................................................................................................................... 71
5.2 Liquidity Risk in Asset Liability Management, Transfer Pricing ...................................... 73
6. Cash Management............................................................................................................. 84
6.1 Cash Flow Dynamics, Forecasting and Valuation ............................................................ 85
6.2 Short-Term Funding Investments ..................................................................................... 87
6.3 Cash Management Techniques ........................................................................................ 88
6.4 Sales Cash Conversion Cycle (SCCC) ................................................................................. 89
6.5 Cash Budget ...................................................................................................................... 89
Treasury Operations Basics 4
Basic – Treasury Operations
1. Introduction to Treasury Operations
Chapter objectives:
1. To introduce the concept of treasury operations
2. To understand the structure and functions of treasury management
3. To comprehend the role and functions of front, mid and back office of integrated
treasury department
4. To understand the framework of treasury control
Treasury operations refer to all activities related to management of cash inflows and
outflows of all organizations. Treasury is a special term within a compass of the broader
term finance. The basis of treasury operations is money and near-money assets such as
money market instruments, derivatives, bonds and securities. The money in terms of
foreign currencies is traded in the forex or foreign exchange market.
1.1 Understanding Treasury Operations
Treasury operations include management of an organization‟s investible surpluses,
which in turn include trading in bonds, currencies, derivatives and associated risk
management. Treasury operations are prevalent across all types of organizations, e.g.,
corporations, banks, financial institutions, insurance companies, asset management
companies, etc. Typically, in a bank or financial institutions, the person in charge of the
treasury is called Treasurer and in a non-financial organization or corporations, the Chief
Financial Officer or Director – Finance is typically in charge of the treasury and he/she
also manages the finance department.
Treasury Operations Basics 5
In a bank, treasury operations typically comprise the following business lines:
Proprietary Trading – Proprietary trading comprises trading in financial instruments
such as equities, bonds, currencies and the derivatives thereof for the bank‟s own
portfolio within regulatory restrictions.
Balance Sheet Management – Balance sheet management comprises trading and
investments in financial instruments keeping in mind the objective of asset liability
management for the bank, i.e., managing the interest rate and liquidity risks.
Corporate Sales – Corporate sales, as the name suggests, comprises all the treasury
financial transactions, e.g., buying and selling of currencies, bonds and derivatives
with the bank‟s institutional clients (typically corporations), based on their specific
trade, commerce and treasury requirements.
Inter-Bank dealings – Inter-Bank dealings are typically dealings with banks and
financial institutions with the main objective of trading or hedging corporate sales
transactions either back-to-back or otherwise.
Treasury Operations Basics 6
In a corporation, treasury operations would typically comprise the following business
lines:
Banking and Cash Management – Banking and cash management includes
management of bank accounts including account administration and user
authorization, negotiation of contracts for various products and services based on the
corporation‟s industry and ongoing monitoring of activity to ensure optimal pricing
and consistent service levels. It also includes review and validation of daily bank
transactions, initiation of wire transfers and transactions as necessary and long-term
and daily cash forecasting, including daily evaluation of cash positions to ensure
appropriate investment of funds.
Investments – Managing and monitoring investments of surplus investible funds
based on working capital requirement or operating funds based on short-term,
medium-term and long-term objectives. Investments to comply with all policies
adopted by the board and all other regulatory compliances. They also need to adhere
to all generally accepted accounting principles.
Debt servicing – Debt servicing includes managing or monitoring servicing of all
existing or future debts of the corporation including managing or monitoring all
registration, payment and transfer activities.
Treasury Operations Basics 7
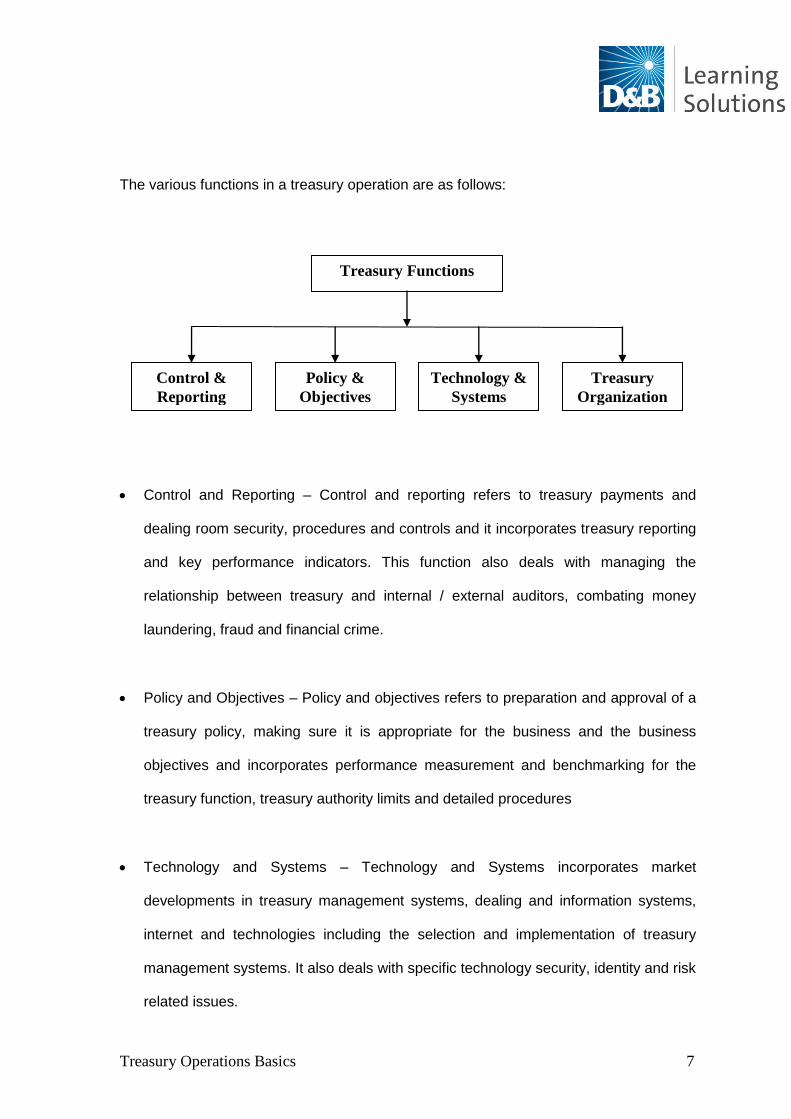
The various functions in a treasury operation are as follows:
Control and Reporting – Control and reporting refers to treasury payments and
dealing room security, procedures and controls and it incorporates treasury reporting
and key performance indicators. This function also deals with managing the
relationship between treasury and internal / external auditors, combating money
laundering, fraud and financial crime.
Policy and Objectives – Policy and objectives refers to preparation and approval of a
treasury policy, making sure it is appropriate for the business and the business
objectives and incorporates performance measurement and benchmarking for the
treasury function, treasury authority limits and detailed procedures
Technology and Systems – Technology and Systems incorporates market
developments in treasury management systems, dealing and information systems,
internet and technologies including the selection and implementation of treasury
management systems. It also deals with specific technology security, identity and risk
related issues.
Treasury Functions
Control &
Reporting
Policy &
Objectives
Technology &
Systems
Treasury
Organization
Treasury Operations Basics 8
Treasury Organization – Treasury organization deals with the overall set-up of
treasury. It addresses issues such as decentralized or centralized treasury, and
treasury as profit center etc.
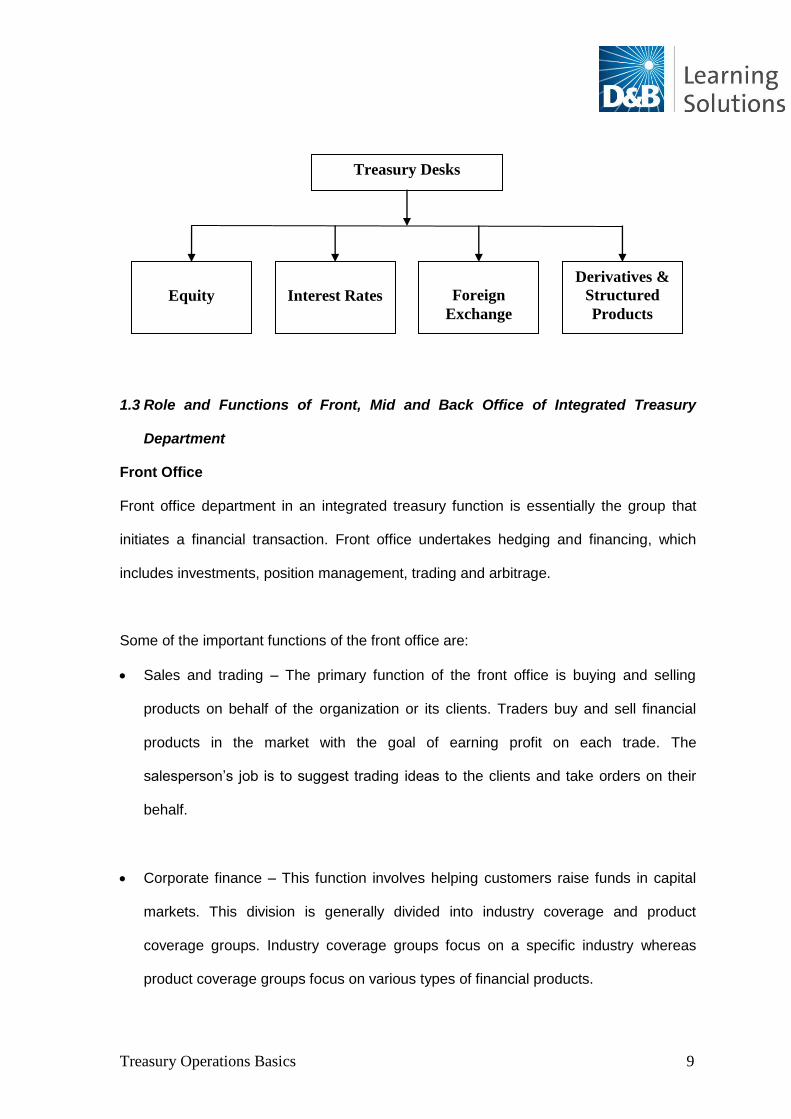
1.2 Structure and Functions of Treasury Management
As far as the asset classes are considered, bank treasuries would typically comprise the
following desks:
Equity desk – The Equities desk would typically deal in listed stocks in the market
and derivatives thereof to the extent permissible by regulators.
Interest rate desk – Interest rate desk deals with all interest rate products in money
(short-term) and bond (long-term) markets.
Foreign exchange desk – Foreign exchange desk deals with buying and selling
currencies.
Derivatives and Structured Products desk – Derivatives and structured products desk
deals with trading in derivatives in interest rates, currencies, credit and the
combination of them.
Treasury Operations Basics 9
1.3 Role and Functions of Front, Mid and Back Office of Integrated Treasury
Department
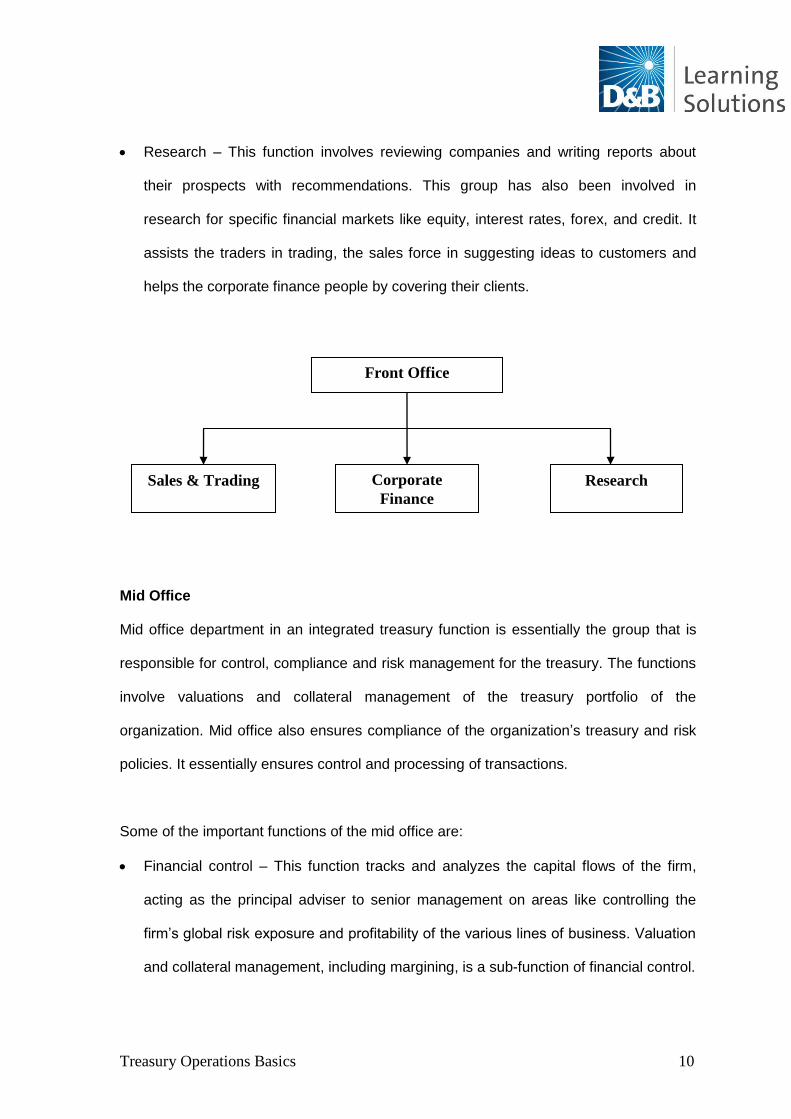
Front Office
Front office department in an integrated treasury function is essentially the group that
initiates a financial transaction. Front office undertakes hedging and financing, which
includes investments, position management, trading and arbitrage.
Some of the important functions of the front office are:
Sales and trading – The primary function of the front office is buying and selling
products on behalf of the organization or its clients. Traders buy and sell financial
products in the market with the goal of earning profit on each trade. The
salesperson‟s job is to suggest trading ideas to the clients and take orders on their
behalf.
Corporate finance – This function involves helping customers raise funds in capital
markets. This division is generally divided into industry coverage and product
coverage groups. Industry coverage groups focus on a specific industry whereas
product coverage groups focus on various types of financial products.
Treasury Desks
Equity
Interest Rates
Foreign
Exchange
Derivatives &
Structured
Products
Treasury Operations Basics 10
Research – This function involves reviewing companies and writing reports about
their prospects with recommendations. This group has also been involved in
research for specific financial markets like equity, interest rates, forex, and credit. It
assists the traders in trading, the sales force in suggesting ideas to customers and
helps the corporate finance people by covering their clients.
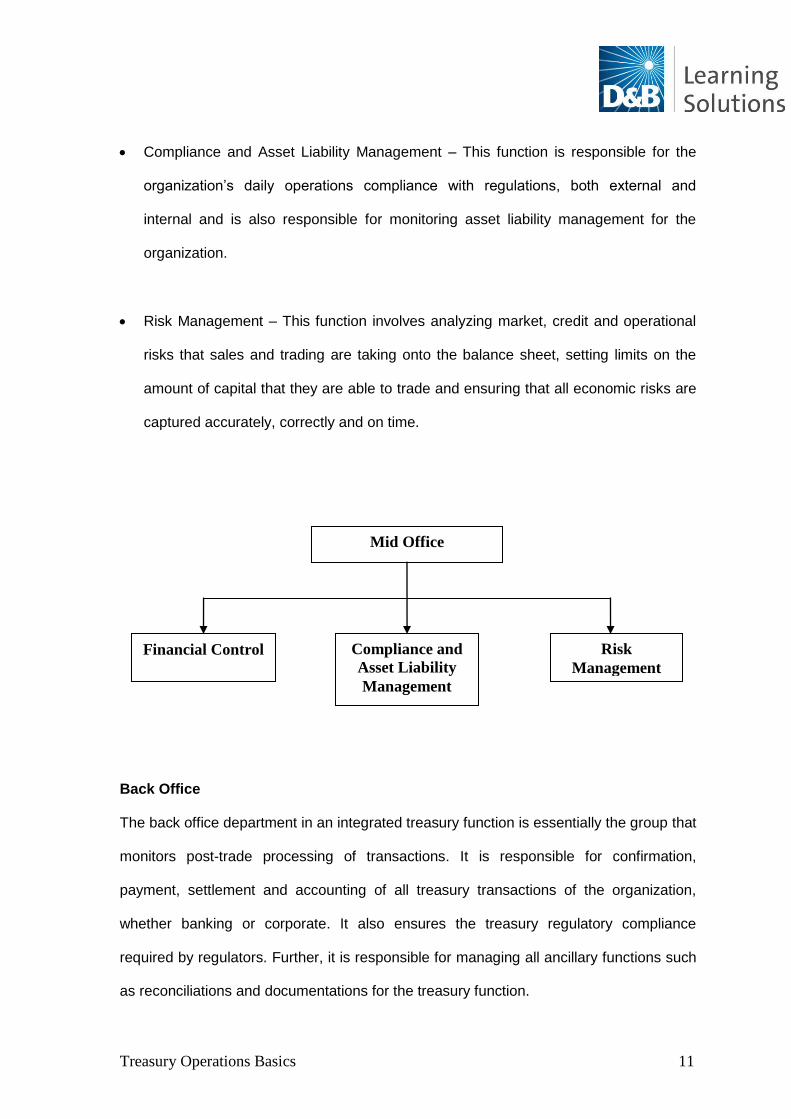
Mid Office
Mid office department in an integrated treasury function is essentially the group that is
responsible for control, compliance and risk management for the treasury. The functions
involve valuations and collateral management of the treasury portfolio of the
organization. Mid office also ensures compliance of the organization‟s treasury and risk
policies. It essentially ensures control and processing of transactions.
Some of the important functions of the mid office are:
Financial control – This function tracks and analyzes the capital flows of the firm,
acting as the principal adviser to senior management on areas like controlling the
firm‟s global risk exposure and profitability of the various lines of business. Valuation
and collateral management, including margining, is a sub-function of financial control.
Front Office
Sales & Trading Corporate
Finance
Research
Treasury Operations Basics 11
Compliance and Asset Liability Management – This function is responsible for the
organization‟s daily operations compliance with regulations, both external and
internal and is also responsible for monitoring asset liability management for the
organization.
Risk Management – This function involves analyzing market, credit and operational
risks that sales and trading are taking onto the balance sheet, setting limits on the
amount of capital that they are able to trade and ensuring that all economic risks are
captured accurately, correctly and on time.
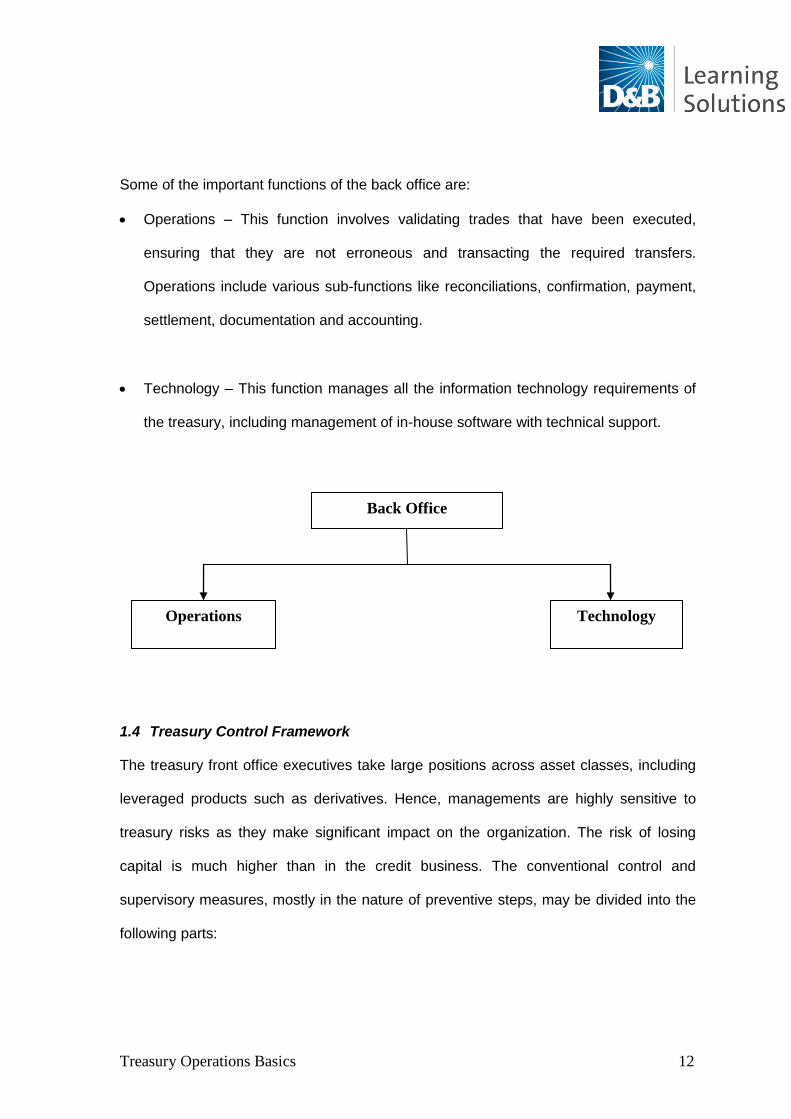
Back Office
The back office department in an integrated treasury function is essentially the group that
monitors post-trade processing of transactions. It is responsible for confirmation,
payment, settlement and accounting of all treasury transactions of the organization,
whether banking or corporate. It also ensures the treasury regulatory compliance
required by regulators. Further, it is responsible for managing all ancillary functions such
as reconciliations and documentations for the treasury function.
Mid Office
Financial Control Compliance and
Asset Liability
Management
Risk
Management
Treasury Operations Basics 12
Some of the important functions of the back office are:
Operations – This function involves validating trades that have been executed,
ensuring that they are not erroneous and transacting the required transfers.
Operations include various sub-functions like reconciliations, confirmation, payment,
settlement, documentation and accounting.
Technology – This function manages all the information technology requirements of
the treasury, including management of in-house software with technical support.
1.4 Treasury Control Framework
The treasury front office executives take large positions across asset classes, including
leveraged products such as derivatives. Hence, managements are highly sensitive to
treasury risks as they make significant impact on the organization. The risk of losing
capital is much higher than in the credit business. The conventional control and
supervisory measures, mostly in the nature of preventive steps, may be divided into the
following parts:
Back Office
Operations Technology
Treasury Operations Basics 13
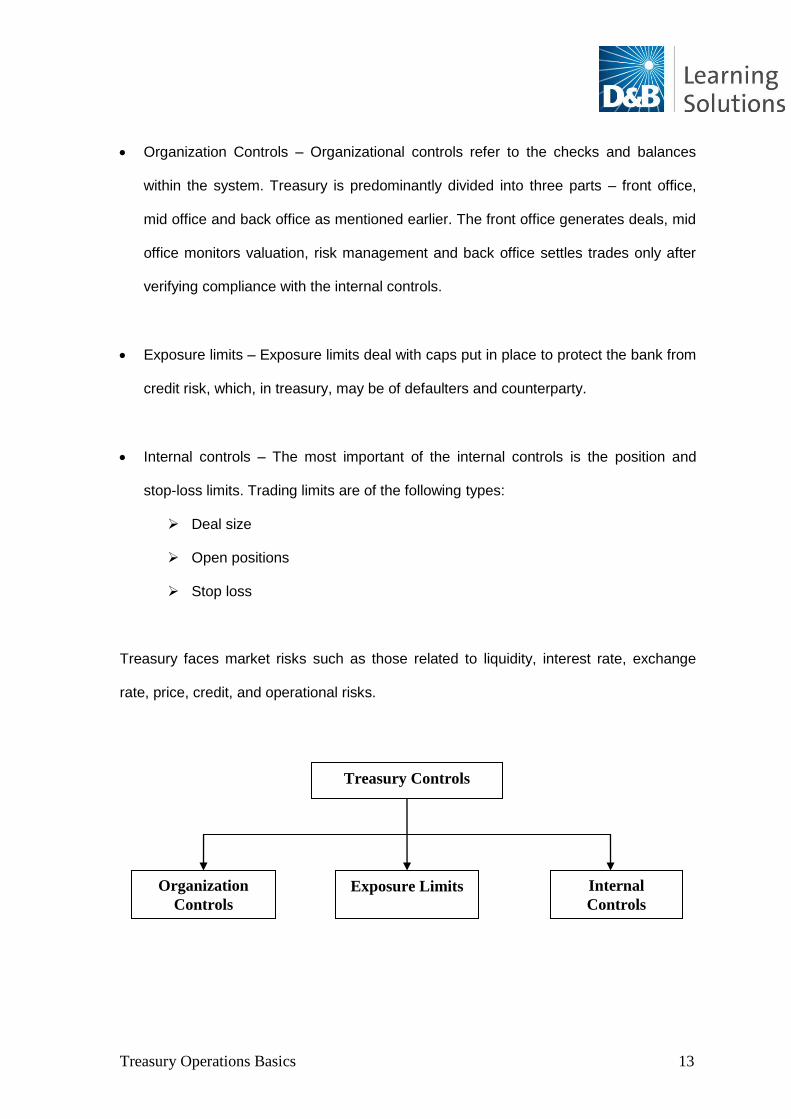
Organization Controls – Organizational controls refer to the checks and balances
within the system. Treasury is predominantly divided into three parts – front office,
mid office and back office as mentioned earlier. The front office generates deals, mid
office monitors valuation, risk management and back office settles trades only after
verifying compliance with the internal controls.
Exposure limits – Exposure limits deal with caps put in place to protect the bank from
credit risk, which, in treasury, may be of defaulters and counterparty.
Internal controls – The most important of the internal controls is the position and
stop-loss limits. Trading limits are of the following types:
Deal size
Open positions
Stop loss
Treasury faces market risks such as those related to liquidity, interest rate, exchange
rate, price, credit, and operational risks.
Treasury Controls
Organization
Controls
Exposure Limits Internal
Controls
Treasury Operations Basics 14
Salient features of the treasury control framework are:
Risk Appetite – An organization‟s risk appetite needs to be decided before designing
an efficient treasury control framework. A tighter control framework is expected to be
around a business that runs a profit centre treasury to make returns rather than a
simpler transaction-based treasury. Differentiation needs to be also made for a
treasury that runs a more manual process compared with a greater level of straight-
through processing.
Governance – The ultimate responsibility for ensuring that an adequate system of
internal controls is established and maintained lies with the board of directors. The
risks the business is facing needs to be understood by senior management. Policies
and procedures need to be developed that reflect that position, articulating the risk
appetite. A policy covering identification, measurement, management, monitoring and
control of financial risk should be approved by the board.
Operating Controls – Following are some of the operating controls that are ideal for
an efficient treasury control function:
o Segregation of duties - Segregation of duties pertaining to front, mid, and back
office is a key element for proper treasury controls. Some of the key duties that
should be properly segregated in a treasury are:
Identification of opportunities and trades
Deal authorization
Confirmations
Settlement authorization
Settlement release
Accounting
Treasury Operations Basics 15
o Dealing - Competitive quotes should be sought in a dealing function. Records of
banks contacted and rates quoted need to be maintained. No one bank or broker
is favored over another and it needs to be ensured that the best returns are being
achieved. The dealer should immediately input deal details into the treasury
management system as soon a deal is struck.
o Access to the front office - Physical access to the dealing room within a treasury
environment is debatable. In a banking environment, it is common to have staff
from the front and back offices physically separated.
o System security - Regular checking of passwords for systems and locking of
computers of unattended personnel is essential. Time-out locks should be
installed, which flag alerts if a machine is not touched for a period of time.
o Confirmations - Back office has the responsibility of confirming details of all
treasury transactions before the settlement is made, to minimize the risk of error
or fraud. An exception report should ideally generate, to show transactions not
being confirmed.
Treasury Operations Basics 16
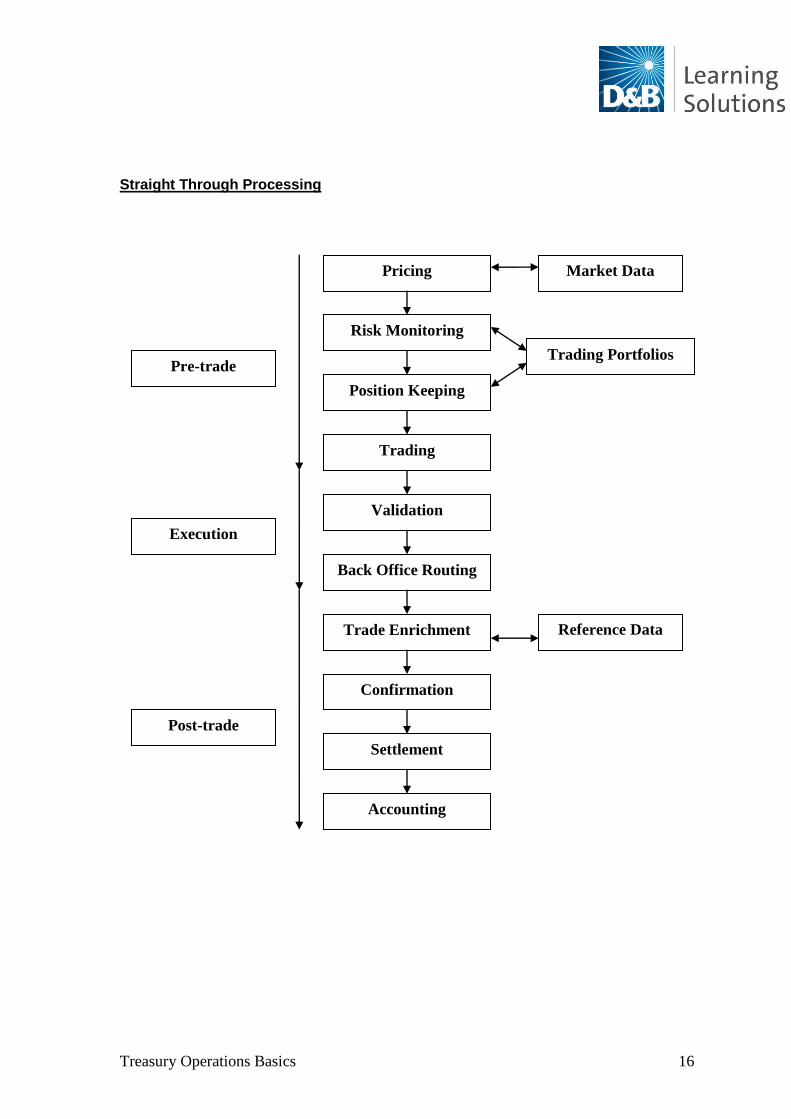
Straight Through Processing
Confirmation
Post-trade
Pre-trade
Position Keeping
Trading
Validation
Back Office Routing
Trade Enrichment
Risk Monitoring
Pricing
Settlement
Accounting
Execution
Market Data
Trading Portfolios
Reference Data
Treasury Operations Basics 17
2. Macroeconomic Policy
Chapter Objective:
1. To understand macroeconomic aggregates
2. To identify the various monetary and fiscal policies
3. To comprehend the macroeconomics and treasury operations
2.1 GDP / GNP
Gross Domestic Product (GDP) is the money value of all final goods and services
produced in a country during a given time period, generally during a year. In estimating
the GDP, we do not differentiate between production carried out by nationals of a given
economy and those of foreign nationals/ firms having manufacturing facilities and service
organizations operating in a country.
Nominal and Real GDP: GDP measured in current market prices is called Nominal GDP.
Real GDP refers to nominal GDP minus inflation rate. In other words, the real GDP
measure provides the quantity of goods and services produced and valued at prices in
the base year rather than current market prices. Real GDP measures actual physical
volume of production.
Gross National Product (GNP) measures the value of output that can be attributed to the
nationals of an economy. It is estimated by deducting the value of the output produced
by foreign firms in that country from the GDP. To this, we add the value of the output the
local firms produced during the same time period in the rest of the world. Such
Treasury Operations Basics 18
information is continuously obtained by the government departments from major
countries of the world.
2.2 Inflation
Inflation basically refers to a rise in general price level. In other words, if the price of one
of the items we are purchasing goes up sharply, we cannot say that there is inflation
present in the economy. We need to, therefore, differentiate between price rise in
individual good and rise in price level of an identified basket of important goods. There
could also be some goods whose prices may be on the decline.
Inflation is sensitive to day-to-day changes that take place in the economy. All changes
would invariably have to be classified into factors that either affect cost of production or
influence demand. The part of inflation resulting from changes that influence cost of
production is known as cost-push inflation. Examples include:
Rise in fuel cost
Increase in input tax rate
Upward revision in duties
Rise in wages/ salaries
Increase in lending rates charged by banks
Increase in transportation costs
Increase in power tariffs and, rentals for office premises etc.
Demand pull inflation is due to the following factors:
Rise in money supply
Spurt in spending on infrastructure
Increase in Foreign Direct Investment
Treasury Operations Basics 19
Rise in income levels of individuals
Panic buying
Artificial supply bottlenecks
Anticipated shortage of essential goods
Deflation: Deflation is a situation in which prices of most goods and services fall over
time so that inflation is negative.
2.3 Interest Rates
Interest rates decide the level of investment activity in the country. Nominal
interest rate is the contractual rate of interest when a business firm/ individual
borrows money from a bank or financial institution. Real interest rate is the
inflation adjusted interest rate (real interest rate = nominal interest rate - inflation).
As the Indian firms are made to compete with the global players as part of our
globalization exercise, interest rates in India need to be lowered in line with cost
of funds for firms abroad.
Investment is of two types: autonomous and induced. Autonomous investment is
interest-independent and income-independent. This type of investment takes
places largely as public investment. Induced investment, on the other hand, is
interest-sensitive investment that rises when there is a decline in interest rate
(lending rate) and vice versa.
Treasury Operations Basics 20
2.4 Exchange Rate:
Price of one currency expressed in terms of another currency. It depends on the trade
and investment flows between countries.
Balance of Payments
Balance of payments is a systematic record of transactions made by one country
with the rest of the world during a given time period, normally a year. This record
helps us understand the value of merchandise exports and imports and the
services transacted as well as the long-term capital-related transactions taking
place.
The balance of payments has two accounts: the current account and the capital
account. When we talk about the position of the balance of payments, we are
taking into account the cumulative value of the two accounts. It may give us a
negative or positive value as the “overall value”. It has to be offset by an
equivalent amount to have neither a surplus nor a deficit. In other words, balance
of payments should always remain balanced.
2.5 Macroeconomic Policies – Monetary and Fiscal Policies
The goal of macroeconomic policy is to achieve high and stable growth rate of the
economy with low and stable inflation. It is to be noted that monetary, fiscal and external
trade policies play a critical role in the management of an economy. Monetary policy
aims at influencing the performance of an economy in terms of price stability, output
growth, and employment. Depending on the phase of the business cycle an economy is
undergoing, it tries to affect consumption and, spending decisions of firms and
individuals. Monetary policy is a much better stabilization tool. Using monetary policy,
Treasury Operations Basics 21
unlike most government actions (tax and expenditure policies), interest rates can be
changed literally overnight. Fiscal policy focuses on building solid foundations for long-
term growth. Stabilizing prices requires estimates of sustainable or potential growth rate
of the economy. The potential output depends on three factors: growth in labor force,
capital investment and technological progress. External policy focuses on exchange rate
movements and their impact on capital inflows and outflows, tariffs to be imposed on
imports, and issues relating to the country‟s balance of payments situation.
Fluctuations in real economic growth measured by real GDP over a long period can be
analyzed in terms of business cycle. Business cycle has four phases. These phases are:
Expansion or boom
Recession
Depression
Recovery
The business cycle is the periodic but irregular up-and-down movements in economic
activity, measured by fluctuations in real GDP and other macroeconomic variables. A
business cycle is not a regular, predictable, or repeating phenomenon like the swing of
the pendulum of a clock. Its timing is random and, to a large extent, unpredictable.
Currently, policymakers worldwide are seriously involved in formulating and fine-tuning
macroeconomic policies to address issues relating to the recent 2008 financial crisis. If
we look keenly into their efforts, we can see that all these policy makers are trying to
revive economic growth rate, stabilize inflation, and handle large scale unemployment
that had resulted due to the financial crisis. By inducing liquidity into the system and
Treasury Operations Basics 22
reducing interest rates, policy makers are trying for the recovery in their respective
economies.
2.6 Monetary and Fiscal Policies
Monetary Policy
Monetary Policy is formulated by the respective central banks of the countries. Its
objective is to determine money supply and assess its impact on output, inflation,
unemployment. It has various policy tools like quantitative and qualitative measures that
help fine-tune policy making as per the situation warranted.
In the US context, the Federal Reserve is the central bank that formulates US monetary
policies and is the authority to affect changes in policy interest rates. It uses open market
operations, changes in reserve requirements, and Fed fund rate as policy instruments to
affect money supply, credit availability and liquidity in the system.
Money Supply measures
In the US, the following two money supply measures are used:
M1 - Currency, demand deposits, other checkable deposits and travelers checks
M2 - M1 plus savings deposits, small denominated time deposits and money market
mutual funds
Treasury Operations Basics 23
Monetary policy and business cycles
During the boom time a contractionary monetary policy is used to cool down the
economy from overheating. During recessions, an expansionary monetary policy is used
to bring back the economy on to the growth path.
To tighten or ease credit availability, central banks generally influence short-term interest
rates. These changes are gradually transmitted to longer-term rates. Central banks
influence rates largely by buying and selling government securities in the market, an
activity referred to as open market operations. Buying and selling activity influences bank
reserves and lending power. For example, monetary ease is achieved by buying
government securities and expanding bank reserves. Monetary restraint is achieved
through sale of government securities. To a large extent, the central banks can affect
interest rates by adjusting the level of reserves required to back bank deposits (reserve
requirements) and adjusting the rate at which it will lend money to banks (discount rate).
Monetary policy and inflation – In the long run, rate of growth of money supply and rate
of growth of inflation are closely related. A larger money supply in circulation will cause
people to increase prices of existing goods and services. Velocity of money supply refers
to the relation between money supply prices and output.
Monetary Policy and exchange rates: In a flexible exchange rate regime, monetary policy
(by raising real interest rate) increases demand for currency and causes it to appreciate.
The stronger currency reinforces the effects of tight monetary policy on aggregate
demand by reducing net exports. Easy monetary policy, on the other hand, lowers real
interest rates and weakens the currency, which stimulates exports.
Treasury Operations Basics 24
2.7 Monetary policy and interest rates
A central bank operates Monetary Policy by controlling money supply, media and
financial markets focus on the central bank‟s announcements on interest rates. The
central bank‟s ability to control money supply is the source of its ability to control interest
rates. Nominal money supply is determined by demand and supply forces. Demand for
money is determined by comparison of costs and benefits of holding money. The
nominal interest rate measures the opportunity cost of holding money. Increases in GDP,
price level, and volume of transactions, result in increased demand for money. The
central bank determines supply of money through use of open market operations,
changes in reserve ratios, and changes in short-term policy rates.
Fiscal Policies
Levying and collection of various types of taxes, purchase of goods and services, and
spending on transfer payments, constitute major functions of the government. The
policies that govern these aspects are termed Fiscal Policies. The government uses
different tools to influence economic activity.
Taxes and expenditure are the two major components of fiscal policies. Charges of
public goods/services are other aspect of public finance. Taxes are levied on incomes
(personal, corporate) and goods and services (customs, excise). These taxes provide
resources to the government to carry out its functions of national security and public
expenditure. It reduces the disposable incomes of individuals and companies by levying
taxes on their earned income. The tax system is also used to give a direction to
economic activities. For instance, tax incentives encourage investments into certain
Treasury Operations Basics 25
productive activities (housing loan incentives) and high level of taxes discourages certain
activities like smoking of cigarettes.
Expenditure is made on public goods such as roads, education, public protection along
with the social security (pensions, public healthcare subsidies, unemployment doles,
relief and ex-gratia payments are termed as transfer payments) by the government to
individuals. These help in building infrastructure of a country and in improving quality of
life of individuals.
The concept of fiscal deficit refers to the overall borrowing requirement of the
government; it is the gap between aggregate expenditure (revenue and capital) and
aggregate receipts (net of non-debt receipts).
The higher the fiscal deficit, the greater is the pressure on interest rates to rise. This is
because the government is now raising loans from the market. Thus, given limited
availability of funds at the disposal of institutions, a rise in demand for credit would make
interest rates rise, discouraging the private sector from borrowing at rising interest rates.
Government policies have a strong effect on the performance of industries and other
sectors of the economy. Business firms can represent their concerns to the appropriate
department/ ministry to influence public policies in their favor, although public policies are
considered to be exogenous or something beyond the control of firms. Removal of
restrictions on the movement of some goods between states or regions, fix prices (e.g.
statutory minimum price), retrenchment of workers, tax-related policies and subsidies,
etc., go a long way in deciding the overall performance of firms.
Treasury Operations Basics 26
3. Treasury markets and instruments
Chapter objectives:
1. To understand the various money market and fixed income market instruments
2. To identify the participants of fixed income markets
3. To understand the role of credit rating
4. To comprehend various concepts of bond mathematics
5. To identify the derivatives instruments used in fixed income markets
6. To analyze the cost of funds and manage investment and trading portfolio
The entire treasury desk is basically divided into two groups: Forex market desk, and
home currency desk and ALM. Details about forex market desk and ALM are taken in
chapter 4 and 5 and this chapter deals with home currency desk operations.
Treasury markets on the home currency desk can be classified into money market and
bond market, depending on the maturity of instruments that are traded in these markets.
The money market is where short-term instruments for borrowing and lending (less than
one year of original maturity) are traded. The bond market, on the other hand, is the
financial market where participants buy and sell long-term debt securities.
3.1 Money Market Instruments
Inter Bank Markets It is a market where banks borrow and lend to each other for
short-term purposes such as meeting reserve requirements.
Term Money It is an inter-bank borrowing and lending money for short period of
Treasury Operations Basics 27
time, usually up to one year.
Repo Repo or repurchase agreement is a transaction where one party
buys securities from another party, only to sell it back to the same
party after a short period of time. Repo is used by central banks as
a liquidity management tool.
Banker‟s
Acceptance
Banker‟s acceptance is a short-term money market instrument
where a bank guarantees payment to a counterparty if the buyer
defaults on a trade transaction.
Euro Dollar
Deposits
Euro dollars are short-term (up to one year) USD denominated
institutional deposits held with banks outside the US
3.2 Coupon Bearing Instruments
Treasury notes and bonds –Treasury notes and bonds are issued by various
governments. These instruments have longer maturities (greater than one year)
and they pay coupon periodically.
Corporate bonds – Corporate bonds are long-term instruments used to borrow
funds by corporations.
3.3 Discount Instruments
Treasury bills – Treasury bills are short-term (up to one year) discount papers
issued by governments to meet short-term borrowing requirements. They are
issued at less than face value and redeemed at face value on maturity.
Treasury Bills are usually issued at regular intervals for a particular issue size and
may have multiple maturities, e.g., fortnight, month, 3-month, 6-month, and 1
year. These bills are liquid instruments and banks, financial institutions and
investment funds are the major traders, investors in these instruments. They are
Treasury Operations Basics 28
considered risk free securities since they are issued by governments and hence
are believed to have no default risk.
Commercial papers – Commercial papers are short-term (up to one year)
discount papers issued by corporations to meet their short-term financing
requirements. They are issued at less than face value and redeemed at face
value on maturity.
Treasury markets and instruments and fixed income markets
3.4 Fixed income instruments
Capital can be raised in two forms: equity and debt. Equity capital is contributed by
owners (i.e., shareholders) of the company and represents owned funds. Debt capital is
raised from outside lenders such as banks and hence constitutes borrowed funds.
Financial market instruments that are used to raise borrowed funds are typically called
debt or fixed income instruments. As already mentioned, the debt market is divided into
money market and bond market. Some of the bond market instruments are government
securities and corporate bonds.
Bonds can also be differentiated based on:
Taxability : Taxable and tax-free bonds
Issuers: Banks, Financial Institutions, Agencies, Corporates, Special Purpose
Entities
Convertibility: Fully, partially, and non-convertible
Apart from debt instruments that are cash market instruments, we also have fixed
income derivative instruments. Some of the interest rate derivative instruments are
Treasury Operations Basics 29
forward rate agreements, interest rate futures, interest rate swaps, currency swaps, and
interest rate options and swaptions.
3.5 Participants in fixed income markets
Some of the participants in the fixed income markets are:
Governments – Governments are typically the largest players in the fixed income
markets since they borrow large quantum of funds in a year to meet their
budgetary requirements. Short-term borrowings of the government are through
treasury bills while long-term borrowings by governments are through
government securities.
Regulators – The central bank of a country is the banker to the government and
typically regulates the banking industry and as a result, it predominantly regulates
the fixed income markets. Apart from central banks, other regulators (regulating
the capital markets or insurance sector etc.) may regulate certain aspects of fixed
income markets.
Banks –. Banks participate in various capacities such as issuers, dealers,
investors and brokers.
Financial Institutions – Apart from banks, financial institutions are also important
players in fixed income markets. These institutions raise substantial capital in the
form of debt. Many of these are active investors in debt instruments.
Primary dealers – Primary Dealers are a special type of fixed income market
participants who act as underwriters for government security issuances by
Treasury Operations Basics 30
accepting underwriting commission from the government. They have a
responsibility towards development of this market by readily providing two-way
quotes for securities being traded in the market. As a result, they provide the
required liquidity to the market.
Corporations – Corporations take part in the fixed income market as issuers or
investors. Large amount of funds are raised in the form of debt and corporates
also invest surplus funds in debt instruments.
Asset Management Companies – Asset Management Companies manage
mutual funds which pool investors‟ money. These mutual funds invest the
proceeds in debt and fixed income markets.
Insurance companies – Insurance companies, both life and non-life, invest in the
fixed income markets to provide returns to the policy holders. Maturity profiles of
insurance companies are typically much longer than other investors.
Broker dealers – Broker dealers predominantly act as intermediaries in the fixed
income markets and as facilitators to major players in the market. They do so by
acting as a bridge between the buyer and seller. Many a times, however, they
invest or trade for their own proprietary portfolio positions in the market.
3.6 Government Securities
As mentioned earlier, government securities are instruments through which governments
raise funds for longer tenors to meet their budgetary requirements. A government pays
periodic coupon payments, usually semi-annually, to the holder of the bonds until
Treasury Operations Basics 31
maturity of the bonds. Maturity of the bonds can be as long as 50 years. Rather than
paying regular fixed coupons, government may even pay floating rate coupons to bond
holders and link it to any industry approved benchmarks, which would be reset at regular
intervals, typically during periodic cash flow dates.
3.7 Corporate Debt Markets
As mentioned earlier, corporate debt markets are the market for corporations to raise
funds, both short-term and long-term. Commercial papers are short-term money market
instruments with maturity of up to one year are used by corporations to raise short-term
funds to meet their working capital requirements. Corporate bonds are long-term bond
market instruments for maturity beyond a year and are used by corporations to raise
funds to meet their demands for long-term capital for business, expansions,
infrastructure funding etc.
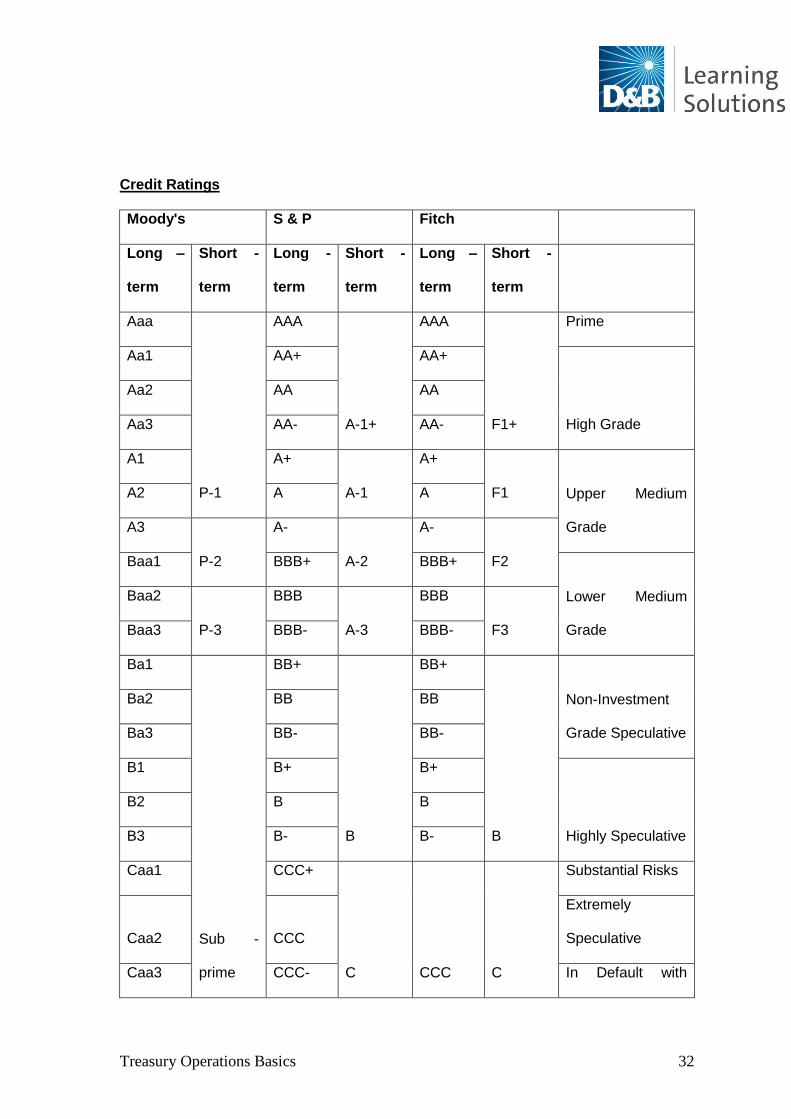
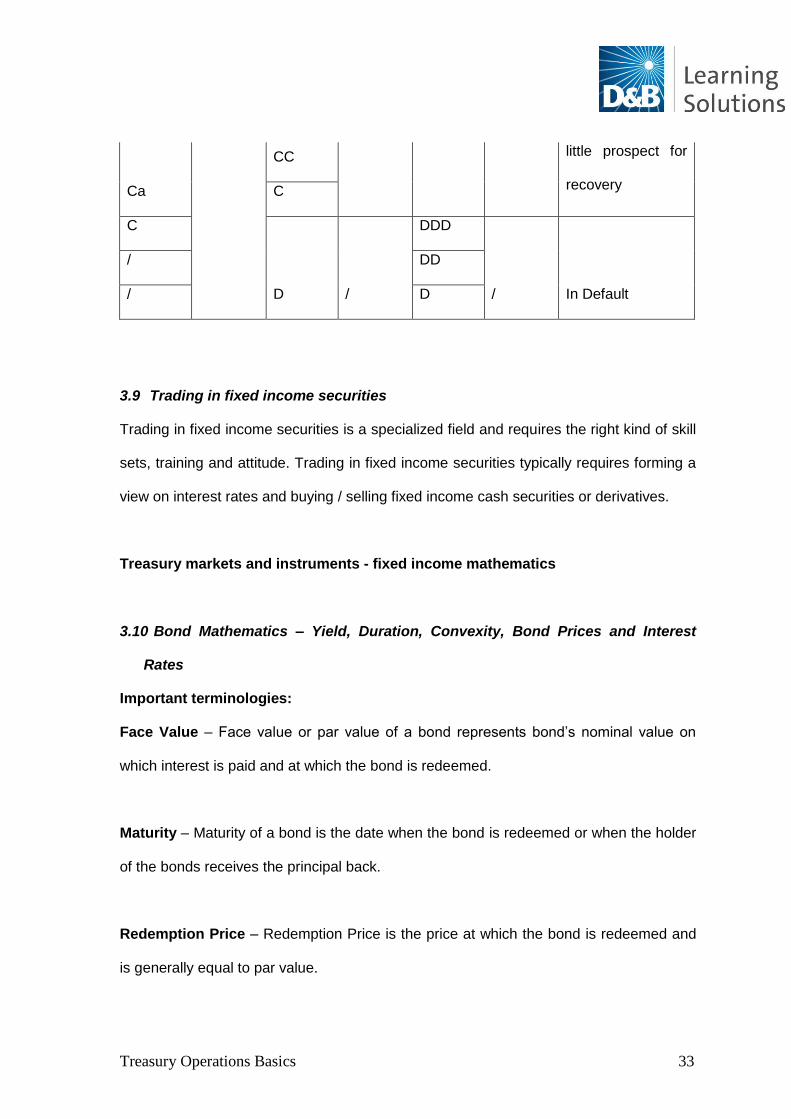
3.8 Credit Rating and its importance
Credit rating is a mechanism by which issuers and issuances with different credit-
worthiness are differentiated from each other both for short-term and long-term. There
are specialized global credit rating agencies such as Moody‟s, S&P and Fitch, which
provide credit ratings to organizations, issuances and even countries, based on their
past performance and projected cash flows. Most credit worthy organizations and
issuances are awarded the highest credit rating, viz., Aaa from Moody‟s, AAA from S&P
and Fitch and D is generally a default rating. Investment grade ratings are typically
higher than and up to Baa3 from Moody‟s and BBB from S&P and Fitch.
Treasury Operations Basics 32
Credit Ratings
Moody's S & P Fitch
Long –
term
Short -
term
Long -
term
Short -
term
Long –
term
Short -
term
Aaa
P-1
AAA
A-1+
AAA
F1+
Prime
Aa1 AA+ AA+
High Grade
Aa2 AA AA
Aa3 AA- AA-
A1 A+
A-1
A+
F1 Upper Medium
Grade
A2 A A
A3
P-2
A-
A-2
A-
F2 Baa1 BBB+ BBB+
Lower Medium
Grade
Baa2
P-3
BBB
A-3
BBB
F3 Baa3 BBB- BBB-
Ba1
Sub -
prime
BB+
B
BB+
B
Non-Investment
Grade Speculative
Ba2 BB BB
Ba3 BB- BB-
B1 B+ B+
Highly Speculative
B2 B B
B3 B- B-
Caa1 CCC+
C CCC C
Substantial Risks
Caa2 CCC
Extremely
Speculative
Caa3 CCC- In Default with
Treasury Operations Basics 33
Ca
CC little prospect for
recovery C
C
D /
DDD
/ In Default
/ DD
/ D
3.9 Trading in fixed income securities
Trading in fixed income securities is a specialized field and requires the right kind of skill
sets, training and attitude. Trading in fixed income securities typically requires forming a
view on interest rates and buying / selling fixed income cash securities or derivatives.
Treasury markets and instruments - fixed income mathematics
3.10 Bond Mathematics – Yield, Duration, Convexity, Bond Prices and Interest
Rates
Important terminologies:
Face Value – Face value or par value of a bond represents bond‟s nominal value on
which interest is paid and at which the bond is redeemed.
Maturity – Maturity of a bond is the date when the bond is redeemed or when the holder
of the bonds receives the principal back.
Redemption Price – Redemption Price is the price at which the bond is redeemed and
is generally equal to par value.
Treasury Operations Basics 34
Coupon frequency – Coupon Frequency refers to the number of times in a year coupon
is received by the holder of the bond.
Coupon on bond – It is the rate at which interest is paid to bond holders.
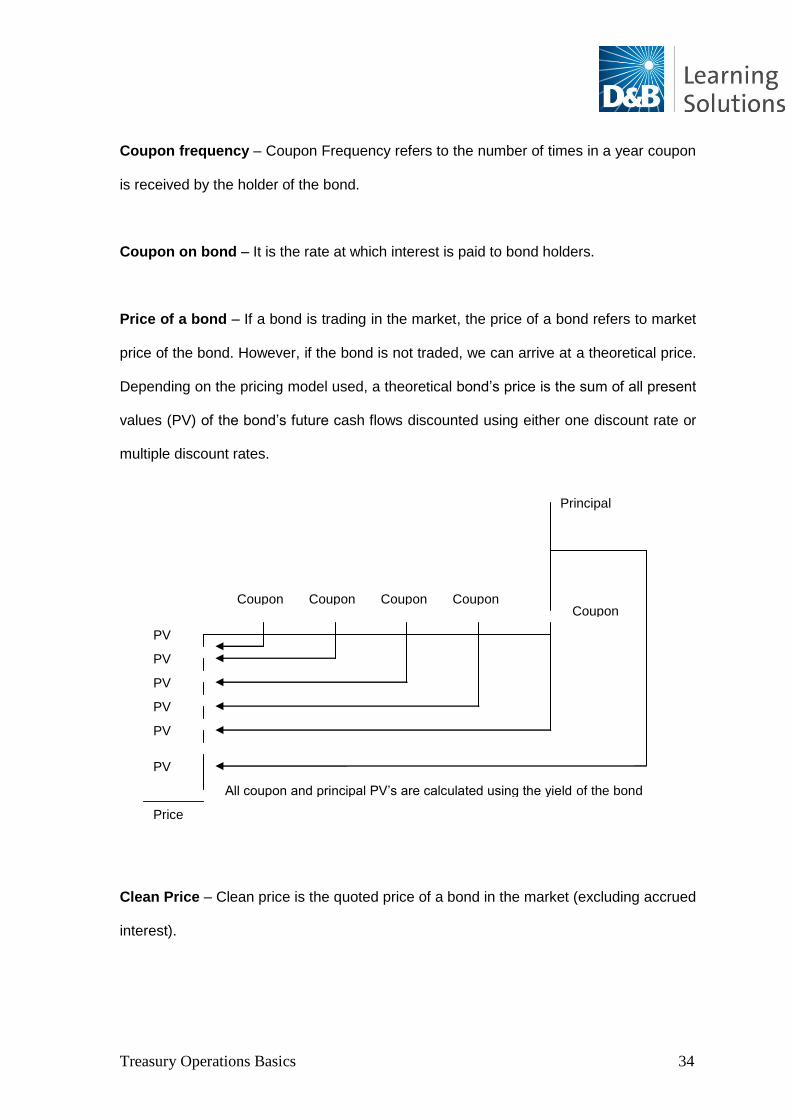
Price of a bond – If a bond is trading in the market, the price of a bond refers to market
price of the bond. However, if the bond is not traded, we can arrive at a theoretical price.
Depending on the pricing model used, a theoretical bond‟s price is the sum of all present
values (PV) of the bond‟s future cash flows discounted using either one discount rate or
multiple discount rates.
Clean Price – Clean price is the quoted price of a bond in the market (excluding accrued
interest).
Principal
Coupon Coupon Coupon Coupon Coupon
PV
PV
PV
PV
PV
PV
Price
All coupon and principal PV‟s are calculated using the yield of the bond
Treasury Operations Basics 35
Accrued Interest – Accrued interest is the interest due on a bond since the last coupon
payment.
Yield – Yield of a bond is the effective return from the bond; Yield to Maturity (YTM) is
the return provided by a bond when it is purchased at a particular price and expected to
be held till maturity, assuming that all the cash flows from the bond are reinvested at a
rate equal to YTM of the bond until maturity.
Dirty Price – Dirty Price is the sum of clean price and accrued interest.
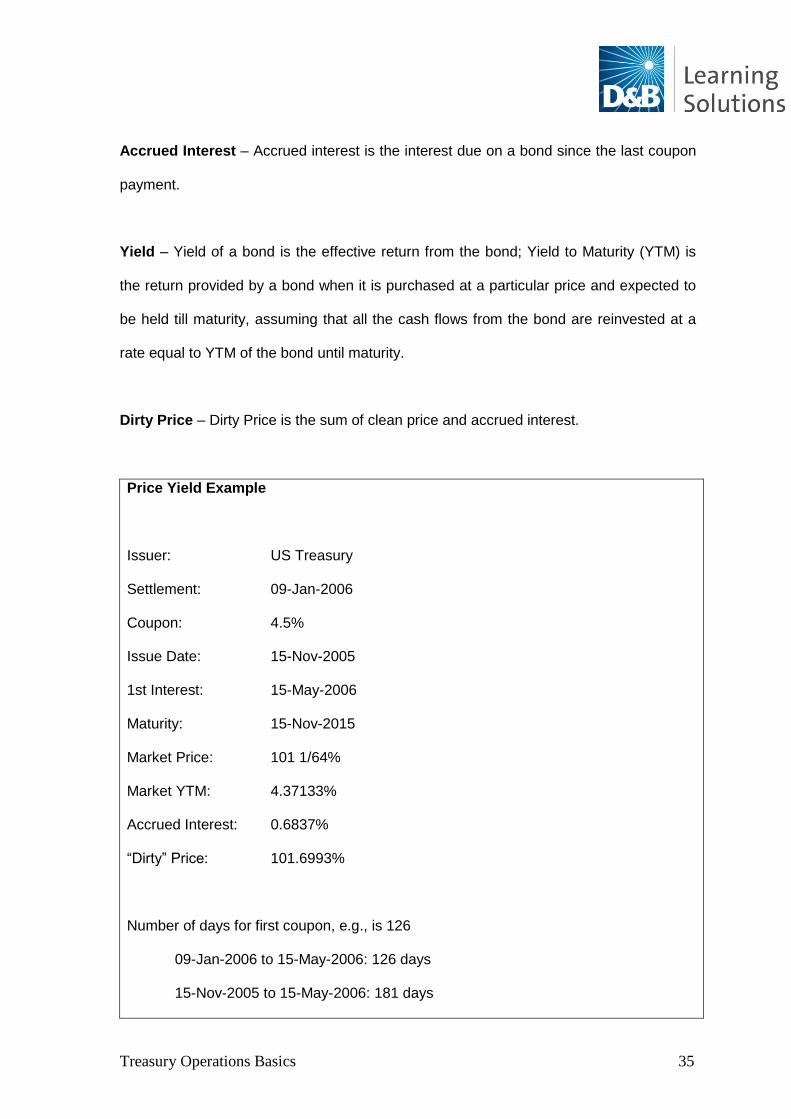
Price Yield Example
Issuer: US Treasury
Settlement: 09-Jan-2006
Coupon: 4.5%
Issue Date: 15-Nov-2005
1st Interest: 15-May-2006
Maturity: 15-Nov-2015
Market Price: 101 1/64%
Market YTM: 4.37133%
Accrued Interest: 0.6837%
“Dirty” Price: 101.6993%
Number of days for first coupon, e.g., is 126
09-Jan-2006 to 15-May-2006: 126 days
15-Nov-2005 to 15-May-2006: 181 days
Treasury Operations Basics 36
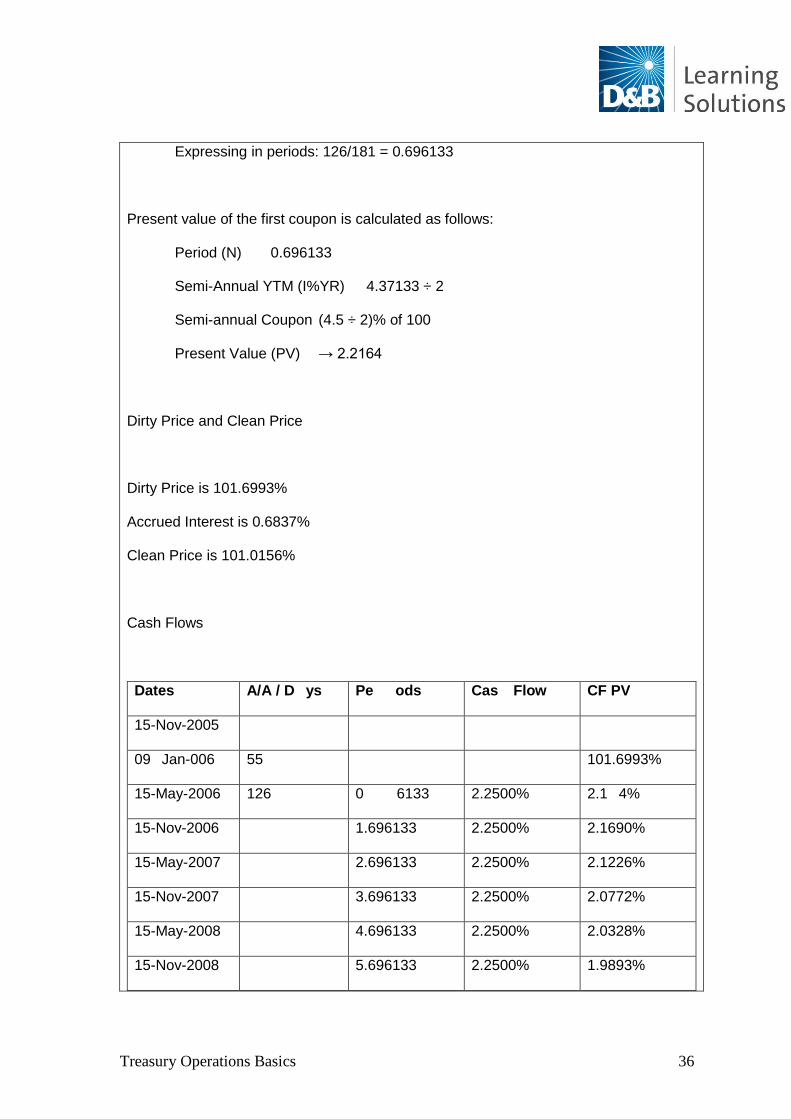
Expressing in periods: 126/181 = 0.696133
Present value of the first coupon is calculated as follows:
Period (N) 0.696133
Semi-Annual YTM (I%YR) 4.37133 ÷ 2
Semi-annual Coupon (4.5 ÷ 2)% of 100
Present Value (PV) → 2.2164
Dirty Price and Clean Price
Dirty Price is 101.6993%
Accrued Interest is 0.6837%
Clean Price is 101.0156%
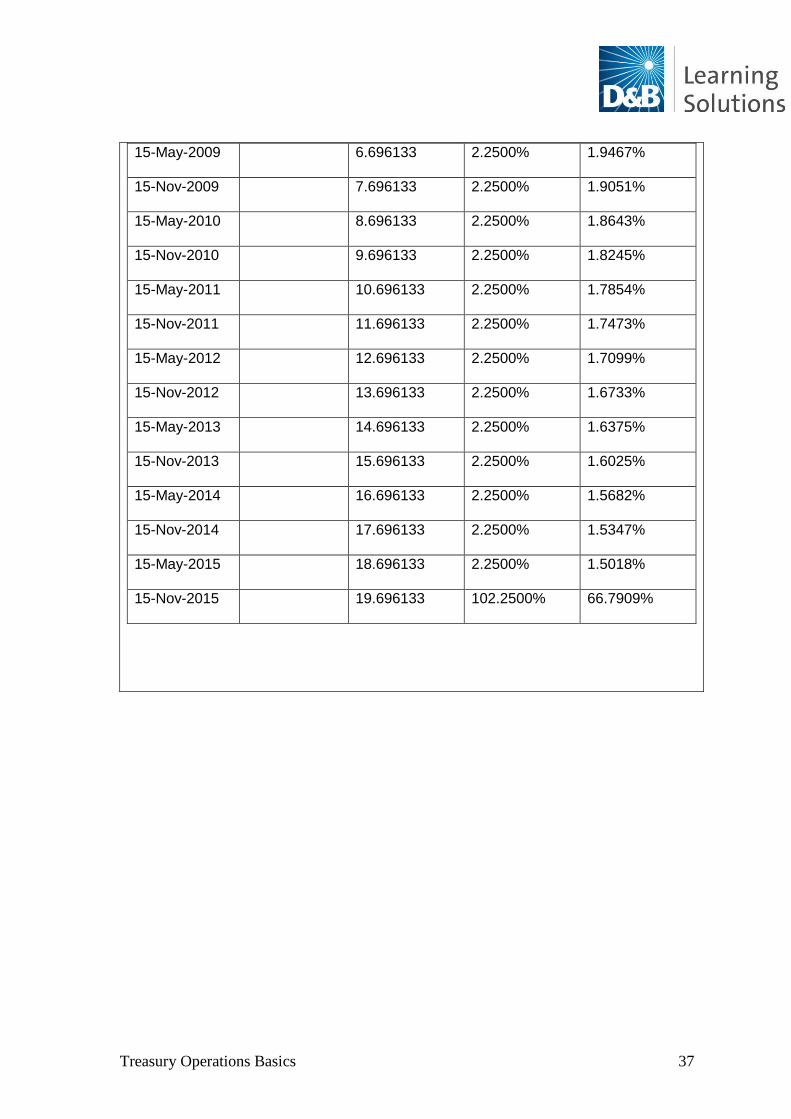
Cash Flows
Dates A/A / D ys Pe ods Cas Flow CF PV
15-Nov-2005
09 Jan-006 55 101.6993%
15-May-2006 126 0 6133 2.2500% 2.1 4%
15-Nov-2006 1.696133 2.2500% 2.1690%
15-May-2007 2.696133 2.2500% 2.1226%
15-Nov-2007 3.696133 2.2500% 2.0772%
15-May-2008 4.696133 2.2500% 2.0328%
15-Nov-2008 5.696133 2.2500% 1.9893%
Treasury Operations Basics 37
15-May-2009 6.696133 2.2500% 1.9467%
15-Nov-2009 7.696133 2.2500% 1.9051%
15-May-2010 8.696133 2.2500% 1.8643%
15-Nov-2010 9.696133 2.2500% 1.8245%
15-May-2011 10.696133 2.2500% 1.7854%
15-Nov-2011 11.696133 2.2500% 1.7473%
15-May-2012 12.696133 2.2500% 1.7099%
15-Nov-2012 13.696133 2.2500% 1.6733%
15-May-2013 14.696133 2.2500% 1.6375%
15-Nov-2013 15.696133 2.2500% 1.6025%
15-May-2014 16.696133 2.2500% 1.5682%
15-Nov-2014 17.696133 2.2500% 1.5347%
15-May-2015 18.696133 2.2500% 1.5018%
15-Nov-2015 19.696133 102.2500% 66.7909%
Treasury Operations Basics 38
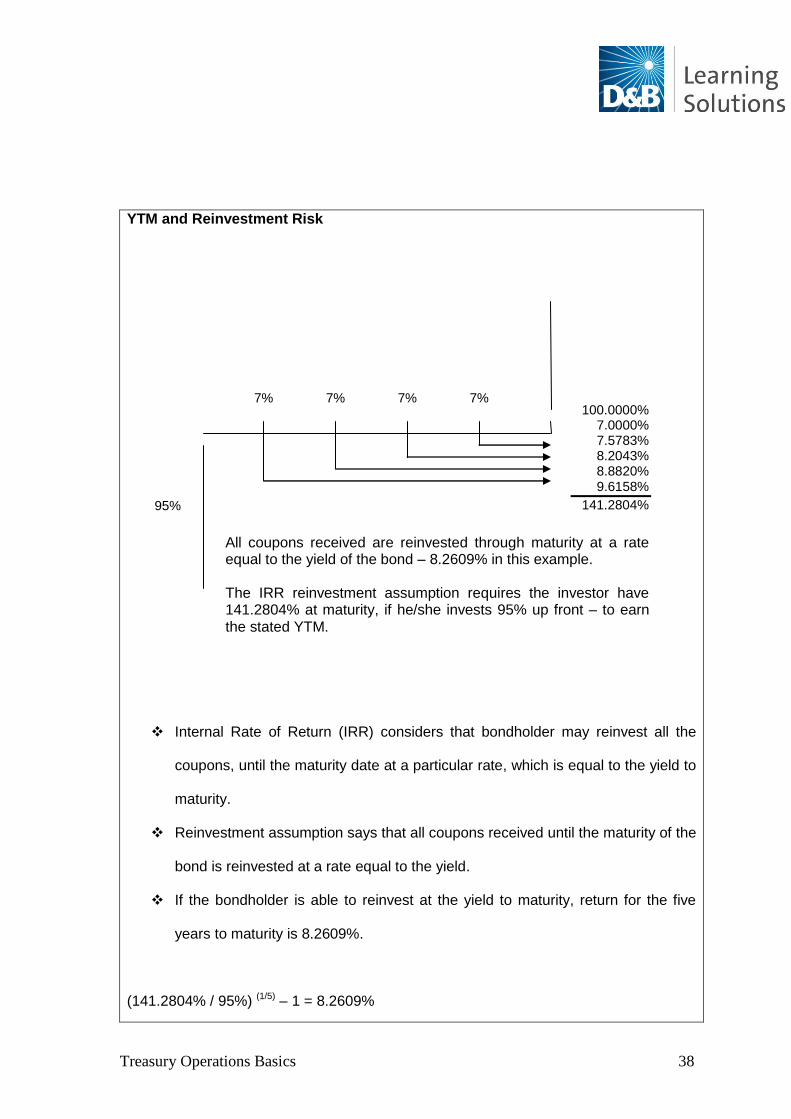
YTM and Reinvestment Risk
Internal Rate of Return (IRR) considers that bondholder may reinvest all the
coupons, until the maturity date at a particular rate, which is equal to the yield to
maturity.
Reinvestment assumption says that all coupons received until the maturity of the
bond is reinvested at a rate equal to the yield.
If the bondholder is able to reinvest at the yield to maturity, return for the five
years to maturity is 8.2609%.
(141.2804% / 95%) (1/5) – 1 = 8.2609%
100.0000% 7.0000% 7.5783% 8.2043% 8.8820% 9.6158%
141.2804%
7% 7% 7% 7%
95%
All coupons received are reinvested through maturity at a rate equal to the yield of the bond – 8.2609% in this example. The IRR reinvestment assumption requires the investor have 141.2804% at maturity, if he/she invests 95% up front – to earn the stated YTM.
Treasury Operations Basics 39
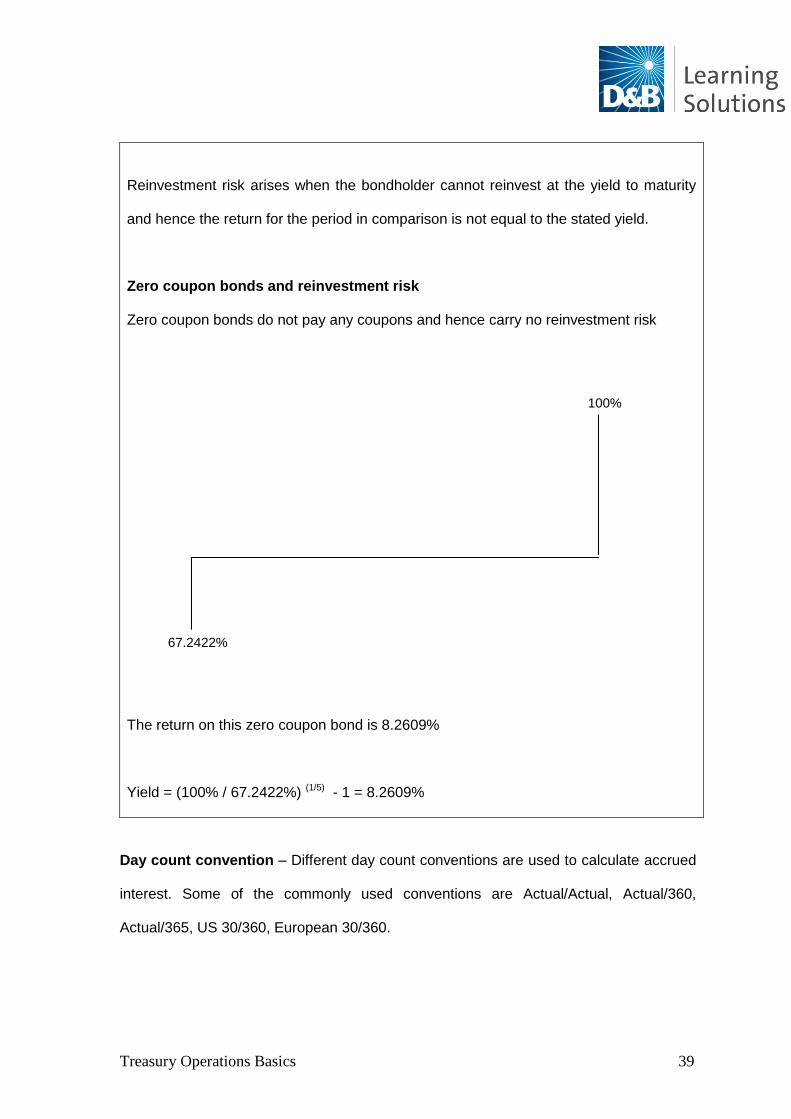
Reinvestment risk arises when the bondholder cannot reinvest at the yield to maturity
and hence the return for the period in comparison is not equal to the stated yield.
Zero coupon bonds and reinvestment risk
Zero coupon bonds do not pay any coupons and hence carry no reinvestment risk
The return on this zero coupon bond is 8.2609%
Yield = (100% / 67.2422%) (1/5) - 1 = 8.2609%
Day count convention – Different day count conventions are used to calculate accrued
interest. Some of the commonly used conventions are Actual/Actual, Actual/360,
Actual/365, US 30/360, European 30/360.
100%
67.2422%
Treasury Operations Basics 40
Valuation of bonds using Zero Coupon Yield Curve
As explained earlier, bonds can be valued using YTM as the discounting factor.
However, YTM suffers from reinvestment rate assumption. Hence bonds can be valued
using alternate methodology i.e. by deriving zero coupon yield curve. A zero coupon
yield applicable to particular maturity is called a spot rate.
Determining Spot Rates
Spot rates are used to discount a single cash flow to be received at some specific
date in the future.
Hence all cash flows received at t=1 must be discounted at the same rate,
assuming that the issuer for all bonds is same.
The one-year zero coupon bond has only one cash flow, we can use its YTM as
the discount factor for other t=1 cash flows (again assuming same issuer or same
credit quality of issuer), i.e. use the YTM as the one-year spot rate Z1.
The approach that we are employing to create a theoretical spot rate curve is
called bootstrapping.
Zero Coupon Cash Flow Approach
To avoid the problems of comparability caused by differing cash flow patterns among on-
the-run Treasuries, we can realize that each coupon bond is really a package of single
payment bonds.
Treasury Operations Basics 41
For example, a 2-year 10% coupon bond is really a package of five single-payment
bonds:
four for the semi-annual coupon payments and
one for the repayment of the corpus
Zeroes
A single-payment bond is called a “zero”
A coupon bond can be thought of as a package of zeroes,
one for each of the coupon payments and
one for the principal
In principle, any coupon bond can be “stripped” or “unbundled” into its constituent
zeroes. STRIPS are unbundled coupon bonds.
Spot Yields
A “spot yield” is the current YTM on a zero coupon bond.
For example, the one-year spot yield is the yield to maturity on a one-year zero.
The price of an n-year zero is related to the n-year spot rate by the formula:
0Pn = 1 / (1 + in/2)2n
0Pn = Price of n-year zero
in = n-year spot rate
Treasury Operations Basics 42
Forward Rates
These are used for valuing, borrowing, or lending, which can happen at some future
date. The spot rate for a six-month tenor, one-year from now is known as the “six-month
forward rate one-year from now”. This rate will be applicable on a sum of money
borrowed for a period between 1-year and 1.5 years from now. This rate can be derived
from the zero-coupon spot rate curve as follows. A spot bond is issued at $ 100 on date
0 and gets repaid on date t2 (say after 2 years). In a forward contract, one agrees on
date 0 to lend $ 100 on date t1 (say after 1 year) and gets repaid on date t2. As with all
forward contracts, there is no optionality, and it is a locked-in contract. The interest rate
rt2 (contracted at time 0 for a period between t1 to t2) is known as “a forward interest rate”.
The spot yield curve directly shows all the rt values.
Case 1: When one buys a bond for $100, it yields 100(1+r02)2 after two years.
Case 2: When one buys a one–year bond and enters into a following one–year forward
contract, we get the following:
100 (1+r0
2)2 = 100(1+r0
1)(1+r1
2)
(1+r1
2) = (1+r0
2)2
(1+r0
1)
Measuring bond price sensitivity
An investor in fixed income is worried about bond price fluctuations. Since bond prices
fluctuate mainly in response to change in interest rates an interesting question to be
answered is how sensitive are bond prices to changes in interest rates? The concept of
duration helps us to arrive at approximate changes in bond prices due to changes in
interest rates as follows.
Treasury Operations Basics 43
Duration
Duration is the weighted average maturity of a bond, where the present values of
cash flows are used as weights.
In computing duration, we consider both the timing and magnitude of all cash
flows associated with the security.
Duration is a measure of the price volatility of a bond.
The concept of duration is used for a single asset, a portfolio of assets, or the
entire balance sheet.
(Macaulay) Duration Formula
D = Σ(t x PV(t)) / ΣPV(t)
D = Duration
t = Period
PV (t) = Present Value of Cash Flow in Period t
Modified duration:
It is a price sensitivity measure. It measures the change in market value of a bond
resulting from a small change in interest rates.
Modified duration = Duration / (1 + YTM)
YTM = Yield to Maturity
Treasury Operations Basics 44
Percent change in bond price = - Modified duration x Change in yield
Steps in Computing Duration
1. Calculate the timing and magnitude of cash flows associated with the instrument.
2. Find the present value of each cash flow.
3. Find the total of all PVs.
4. Find the time-weighted PV of each cash flow.
5. Find the total of all time-weighted PVs.
6. Duration: Divide the total in Step 5 by the total in Step 3.
7. Find the modified duration as Duration / (1 + Yield).
Duration and modified duration
Problem 1: 5-year 12% Coupon Bond selling at Rs.100 par
Problem 2: 5-year 10% Coupon Bond selling at Rs.100 par
Problem 3: 5-year 6% Coupon Bond selling at Rs.100 par
Problem 4: 10-year 10% Coupon Bond selling at Rs.100 par
Treasury Operations Basics 45
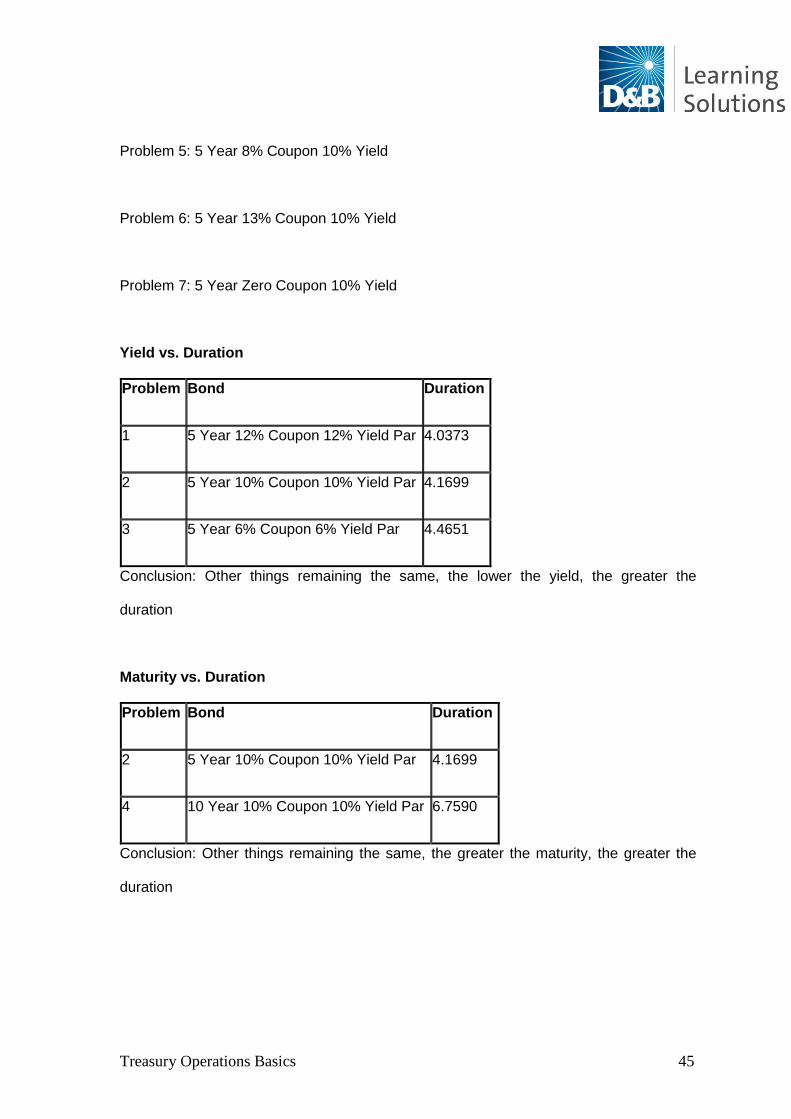
Problem 5: 5 Year 8% Coupon 10% Yield
Problem 6: 5 Year 13% Coupon 10% Yield
Problem 7: 5 Year Zero Coupon 10% Yield
Yield vs. Duration
Problem Bond Duration
1 5 Year 12% Coupon 12% Yield Par 4.0373
2 5 Year 10% Coupon 10% Yield Par 4.1699
3 5 Year 6% Coupon 6% Yield Par 4.4651
Conclusion: Other things remaining the same, the lower the yield, the greater the
duration
Maturity vs. Duration
Problem Bond Duration
2 5 Year 10% Coupon 10% Yield Par 4.1699
4 10 Year 10% Coupon 10% Yield Par 6.7590
Conclusion: Other things remaining the same, the greater the maturity, the greater the
duration
Treasury Operations Basics 46
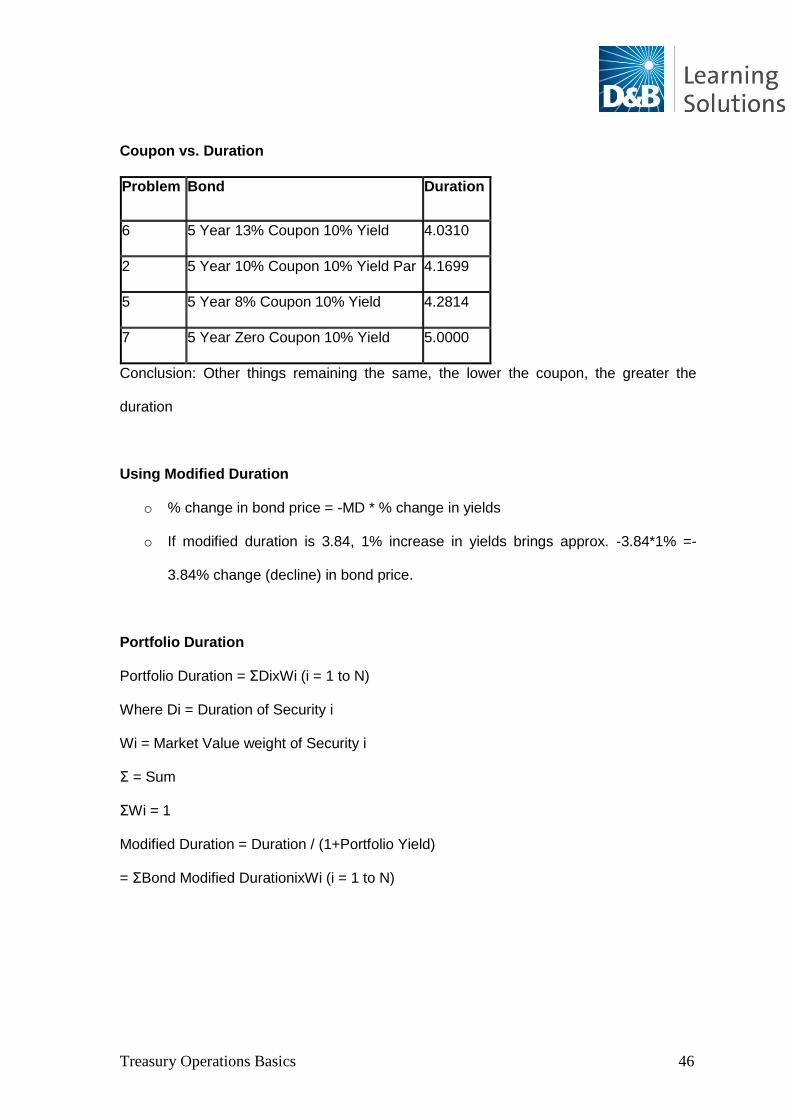
Coupon vs. Duration
Problem Bond Duration
6 5 Year 13% Coupon 10% Yield 4.0310
2 5 Year 10% Coupon 10% Yield Par 4.1699
5 5 Year 8% Coupon 10% Yield 4.2814
7 5 Year Zero Coupon 10% Yield 5.0000
Conclusion: Other things remaining the same, the lower the coupon, the greater the
duration
Using Modified Duration
o % change in bond price = -MD * % change in yields
o If modified duration is 3.84, 1% increase in yields brings approx. -3.84*1% =-
3.84% change (decline) in bond price.
Portfolio Duration
Portfolio Duration = ΣDixWi (i = 1 to N)
Where Di = Duration of Security i
Wi = Market Value weight of Security i
Σ = Sum
ΣWi = 1
Modified Duration = Duration / (1+Portfolio Yield)
= ΣBond Modified DurationixWi (i = 1 to N)
Treasury Operations Basics 47
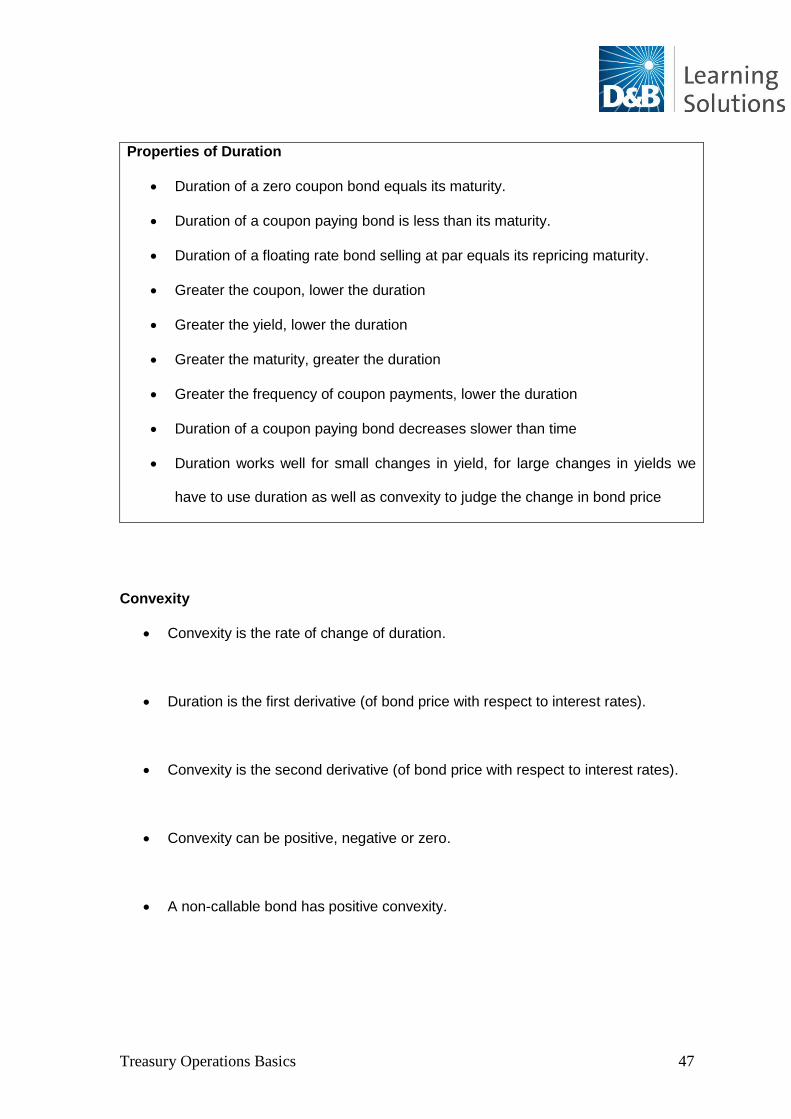
Properties of Duration
Duration of a zero coupon bond equals its maturity.
Duration of a coupon paying bond is less than its maturity.
Duration of a floating rate bond selling at par equals its repricing maturity.
Greater the coupon, lower the duration
Greater the yield, lower the duration
Greater the maturity, greater the duration
Greater the frequency of coupon payments, lower the duration
Duration of a coupon paying bond decreases slower than time
Duration works well for small changes in yield, for large changes in yields we
have to use duration as well as convexity to judge the change in bond price
Convexity
Convexity is the rate of change of duration.
Duration is the first derivative (of bond price with respect to interest rates).
Convexity is the second derivative (of bond price with respect to interest rates).
Convexity can be positive, negative or zero.
A non-callable bond has positive convexity.
Treasury Operations Basics 48
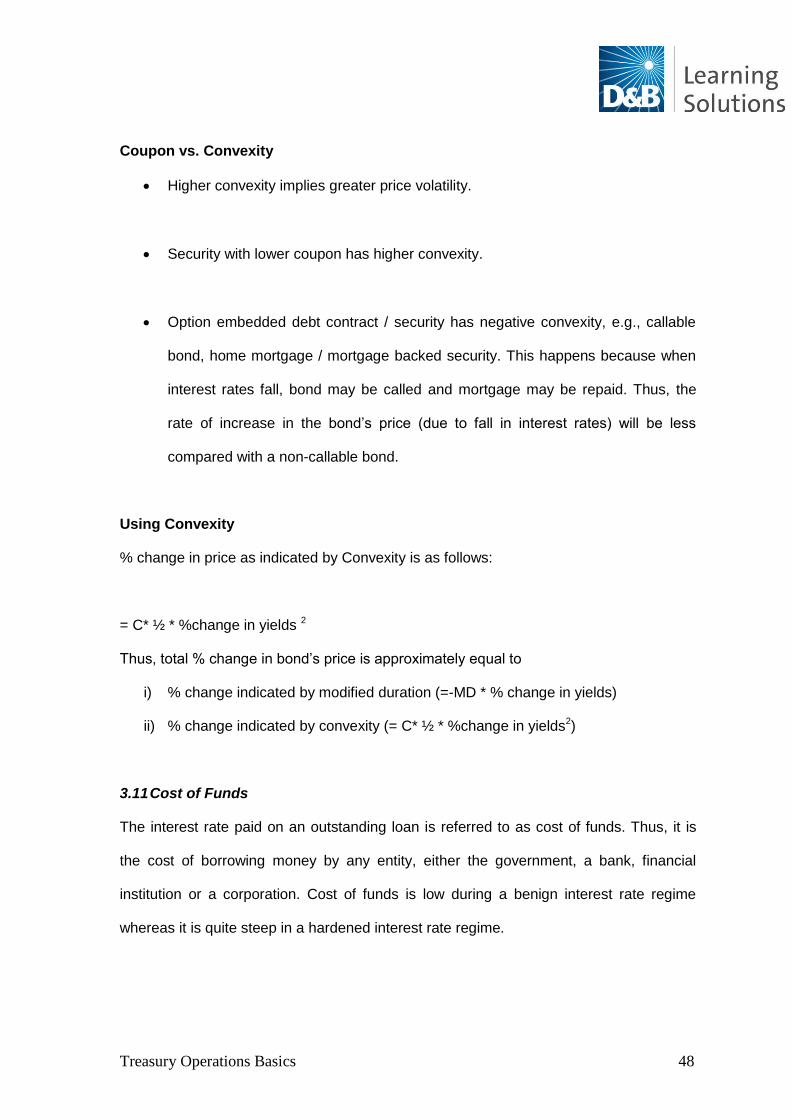
Coupon vs. Convexity
Higher convexity implies greater price volatility.
Security with lower coupon has higher convexity.
Option embedded debt contract / security has negative convexity, e.g., callable
bond, home mortgage / mortgage backed security. This happens because when
interest rates fall, bond may be called and mortgage may be repaid. Thus, the
rate of increase in the bond‟s price (due to fall in interest rates) will be less
compared with a non-callable bond.
Using Convexity
% change in price as indicated by Convexity is as follows:
= C* ½ * %change in yields 2
Thus, total % change in bond‟s price is approximately equal to
i) % change indicated by modified duration (=-MD * % change in yields)
ii) % change indicated by convexity (= C* ½ * %change in yields2)
3.11 Cost of Funds
The interest rate paid on an outstanding loan is referred to as cost of funds. Thus, it is
the cost of borrowing money by any entity, either the government, a bank, financial
institution or a corporation. Cost of funds is low during a benign interest rate regime
whereas it is quite steep in a hardened interest rate regime.
Treasury Operations Basics 49
3.12 Managing Investment Portfolio and Trading Portfolio
Portfolios are of different types. Typically, a portfolio in a bank is classified as a trading
portfolio, an available-for-sale portfolio, and a held-to-maturity portfolio. The trading
portfolio is the portfolio where securities are traded very frequently to make profits; an
available–for-sale portfolio is one where securities are bought and sold for a
comparatively longer period of time and a held-to-maturity portfolio is one where
securities are bought to be held until maturity of the security.
Different strategies are used for management of trading portfolio and investment
portfolios. Bullet, barbell and ladder strategies (mentioned below) are some of the
strategies used for trading portfolios. Investment strategies include immunization, cash
flow matching, horizon matching, yield curve strategies and yield spread strategies.
Bond Portfolio Management (Trading) Strategies
Bullet Strategy – the portfolio is constructed so that maturity of securities in the
portfolio is highly concentrated at one point on the yield curve.
Barbell Strategy – the maturity of securities included in portfolio is concentrated at
two extreme maturities.
Ladder Strategy – the portfolio is constructed to have approximately equal
amounts of each maturity.
Bond Portfolio Management (Investment) Strategies
Immunization – This strategy involves matching the duration of assets with the
investment horizon of the institution. This immunizes the portfolio from interest
rate risks.
Treasury Operations Basics 50
Cash flow matching – This strategy involves matching of cash flow arising from
bond investment to liabilities. For example, if a liability is maturing after five years,
we can match the cash outflow (since the liability is to be repaid) with cash inflow
from a bond that matures after five years.
Horizon matching – This is a combination of the above two strategies. In this
case, cash flow matching is done for next few years and duration matching is
done for rest of the years.
Yield curve strategies – These are based on interest rate anticipation. For
example, if interest rates are expected to fall, portfolio duration can be increased
and vice versa.
Yield spread analysis – In this case, portfolio management strategies are
designed by taking into account expected yield curve changes.
3.13 Derivatives in Fixed Income Markets – Forwards, Futures, Options and Swaps
The meaning of the word “derivative” according to Chamber‟s dictionary is “derived from
something else, not original”. In the financial world also, derivatives are instruments,
which derive value from an underlying asset. Derivatives are used for trading, arbitrage
and hedging. The underlying assets from which derivatives derive their value are equity
prices, equity indices, interest rates, currencies, and commodities, etc.
Characteristics
Options, forwards, futures and swaps are derivative instruments. Forwards and swaps
are over-the-counter (OTC) instruments whereas futures are exchange-traded ones.
Options can both be exchange traded and OTC. OTC instruments refer to those
Treasury Operations Basics 51
instruments that are tailor-made as per the requirements of the parties to the contract.
These are not standardized products like exchange-traded instruments.
Applications of derivatives
Risk Transfer
Derivatives are used for hedging risks. For example, an investor who is worried about fall
in value of his investment portfolio may use derivatives for risk management. He/she will
be able to hedge the risk since the value of derivatives fluctuates directly or inversely
with the underlying and hence a suitable position in derivatives will ensure price risk is
hedged.
Leverage Effect
A position in the derivative instrument can be created at nil or fraction of cost of the
asset. For example, in case of forwards and swaps, no upfront cost needs to be incurred
while in case of options there is a premium to be paid, which generally is a fraction of the
asset cost. Hence, with the same amount of capital, a trader can take a large position in
derivatives compared with outright trading of an underlying asset. This creates a
leverage effect, magnifying the trader‟s gains as well as losses.
Liquidity
The tradability of derivatives raises the interest and number of market participants, which
in turn improves their liquidity. This means, large volumes can be traded at any time,
without influencing the prices.
Treasury Operations Basics 52
Derivative products
Forward Rate Agreements
A Forward Rate Agreement (FRA) is an agreement whereby the seller of the FRA agrees
to pay to the buyer the value of the difference between a pre-agreed interest rate and the
final settlement rate, based on an agreed Notional principal for a notional period. It is
basically to hedge the interest rate risk. The seller of the FRA will not take deposit or
make an advance to the Buyer of the FRA. The buyer of the FRA will either place a
deposit in the market or borrow from the market. If market rate is adverse in comparison
to the FRA rate, then the seller of the FRA will have to compensate the buyer of the
FRA. The difference of interest is calculated at the FRA contract rate and the market rate
and is payable at the start of the period at discounted interest rate i.e. at market rate. On
the other hand, if the market rate is favourable than the FRA contract rate, then the
buyer will have to pay the seller of the FRA the difference of interest calculated @ FRA
rate and the market rate. This is also payable at the start of the period and hence
discounted @ market rate of interest.
The settlement rate is determined by an agreed reference rate. Settlement is discounted
to the start of the period.
Example: On 11 Jan 2006, a customer asks for a quote from bank for USD 10mn for
3x6 months.The bank‟s quote will be: USD 10mn 3x6 5.90/6.00, which means bank is
ready to lend @ 6% or take deposit @ 5.90% , USD 10mn on 11-Apr-2006 for a period
of 3 months effectively 91 days period. The buyer of FRA will continue to place deposit/
borrow from the market only. The difference of interest for notional period (in the preset
example it is for 91 days) for a notional principal (in the present example it is USD 10mn)
Treasury Operations Basics 53
will be exchanged between the buyer of the FRA and the seller of the FRA on the fixing
date normally 2 days earlier to the settlement date (in the present case on 09-Apr-2006).
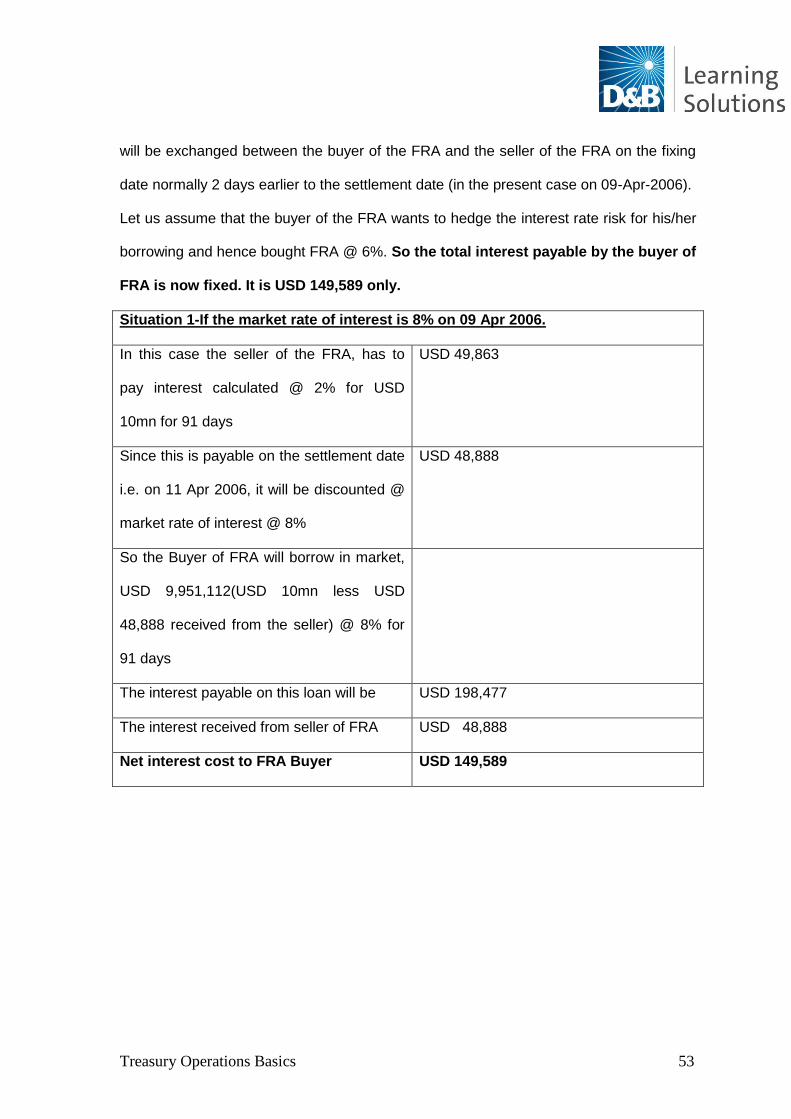
Let us assume that the buyer of the FRA wants to hedge the interest rate risk for his/her
borrowing and hence bought FRA @ 6%. So the total interest payable by the buyer of
FRA is now fixed. It is USD 149,589 only.
Situation 1-If the market rate of interest is 8% on 09 Apr 2006.
In this case the seller of the FRA, has to
pay interest calculated @ 2% for USD
10mn for 91 days
USD 49,863
Since this is payable on the settlement date
i.e. on 11 Apr 2006, it will be discounted @
market rate of interest @ 8%
USD 48,888
So the Buyer of FRA will borrow in market,
USD 9,951,112(USD 10mn less USD
48,888 received from the seller) @ 8% for
91 days
The interest payable on this loan will be USD 198,477
The interest received from seller of FRA USD 48,888
Net interest cost to FRA Buyer USD 149,589
Treasury Operations Basics 54
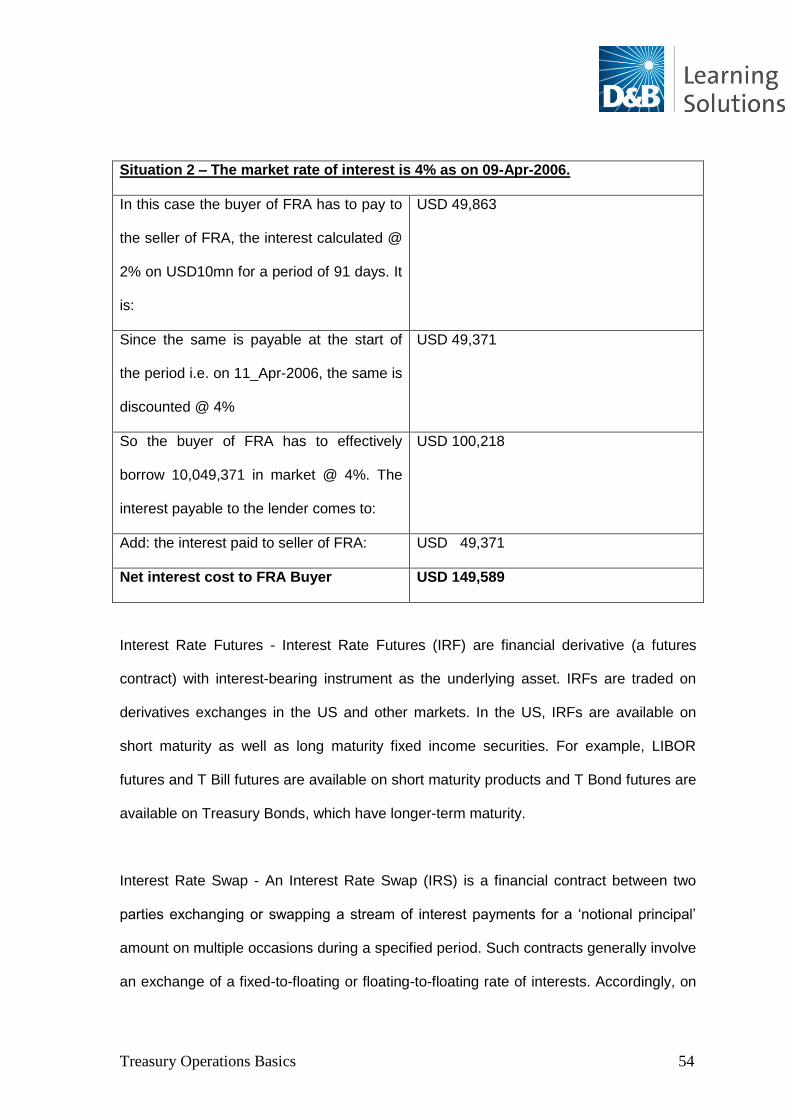
Situation 2 – The market rate of interest is 4% as on 09-Apr-2006.
In this case the buyer of FRA has to pay to
the seller of FRA, the interest calculated @
2% on USD10mn for a period of 91 days. It
is:
USD 49,863
Since the same is payable at the start of
the period i.e. on 11_Apr-2006, the same is
discounted @ 4%
USD 49,371
So the buyer of FRA has to effectively
borrow 10,049,371 in market @ 4%. The
interest payable to the lender comes to:
USD 100,218
Add: the interest paid to seller of FRA: USD 49,371
Net interest cost to FRA Buyer USD 149,589
Interest Rate Futures - Interest Rate Futures (IRF) are financial derivative (a futures
contract) with interest-bearing instrument as the underlying asset. IRFs are traded on
derivatives exchanges in the US and other markets. In the US, IRFs are available on
short maturity as well as long maturity fixed income securities. For example, LIBOR
futures and T Bill futures are available on short maturity products and T Bond futures are
available on Treasury Bonds, which have longer-term maturity.
Interest Rate Swap - An Interest Rate Swap (IRS) is a financial contract between two
parties exchanging or swapping a stream of interest payments for a „notional principal‟
amount on multiple occasions during a specified period. Such contracts generally involve
an exchange of a fixed-to-floating or floating-to-floating rate of interests. Accordingly, on
Treasury Operations Basics 55
each payment date that occurs during the swap period, parties make cash payments to
one another based on fixed/floating and floating rates.
Features of IRS
An IRS involves exchange of interest obligations between two parties at regular
intervals over the life of IRS.
Debt is denominated in the same currency.
There is no transfer of principal. It is only notional.
Typically floating/fixed swaps are done.
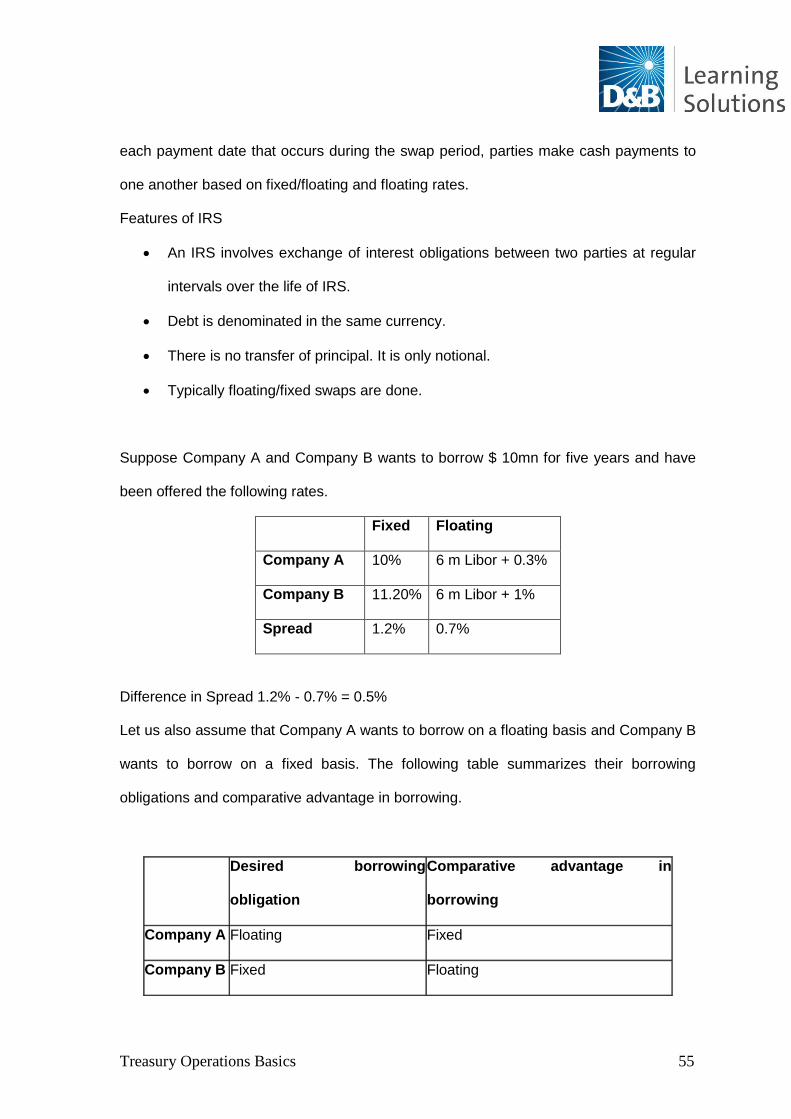
Suppose Company A and Company B wants to borrow $ 10mn for five years and have
been offered the following rates.
Fixed Floating
Company A 10% 6 m Libor + 0.3%
Company B 11.20% 6 m Libor + 1%
Spread 1.2% 0.7%
Difference in Spread 1.2% - 0.7% = 0.5%
Let us also assume that Company A wants to borrow on a floating basis and Company B
wants to borrow on a fixed basis. The following table summarizes their borrowing
obligations and comparative advantage in borrowing.
Desired borrowing
obligation
Comparative advantage in
borrowing
Company A Floating Fixed
Company B Fixed Floating
Treasury Operations Basics 56
The spread of 1.2% - 0.7% = 0.5% can be shared between Company A and B
to lower their costs of borrowing.
Generally this arrangement is worked out by a bank, which may find two
counterparties or enter into a transaction as a counterparty.
Let us assume in this case, the spread of 0.5% is shared by Company A –
0.2%, Company B – 0.2% and bank 0.1%.
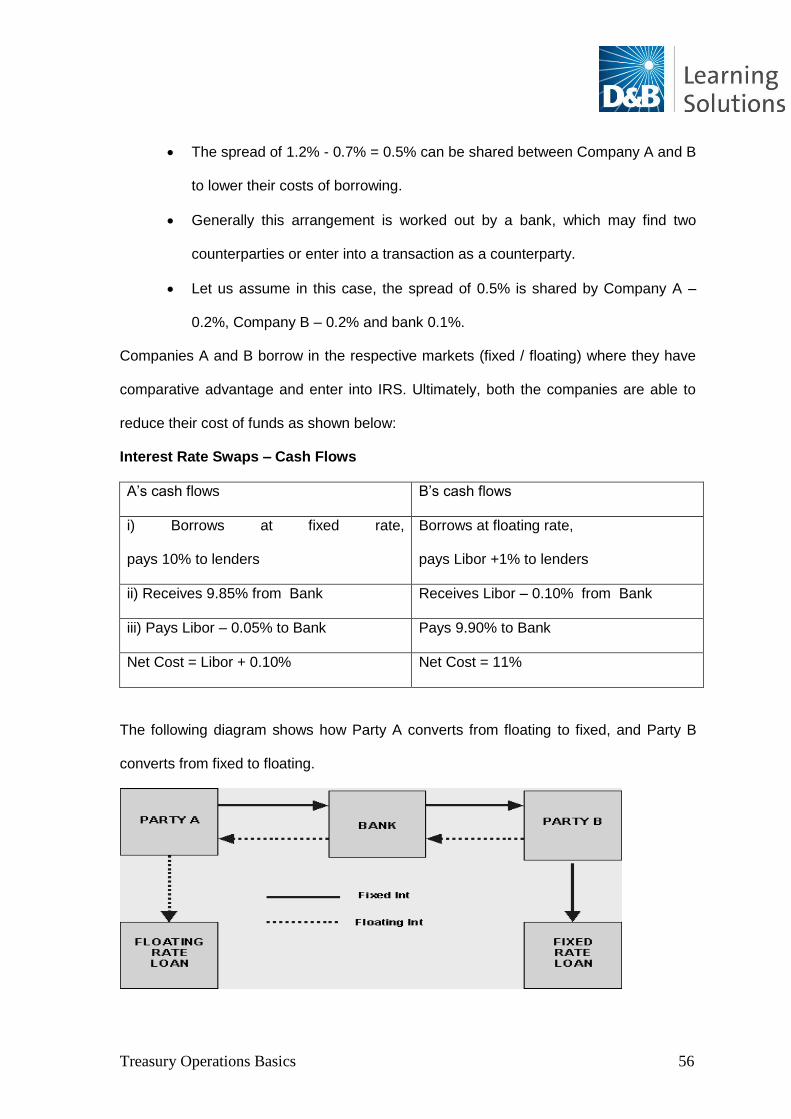
Companies A and B borrow in the respective markets (fixed / floating) where they have
comparative advantage and enter into IRS. Ultimately, both the companies are able to
reduce their cost of funds as shown below:
Interest Rate Swaps – Cash Flows
A‟s cash flows B‟s cash flows
i) Borrows at fixed rate,
pays 10% to lenders
Borrows at floating rate,
pays Libor +1% to lenders
ii) Receives 9.85% from Bank Receives Libor – 0.10% from Bank
iii) Pays Libor – 0.05% to Bank Pays 9.90% to Bank
Net Cost = Libor + 0.10% Net Cost = 11%
The following diagram shows how Party A converts from floating to fixed, and Party B
converts from fixed to floating.
Treasury Operations Basics 57
Another form of interest rate swap is the “Basis Swap” or floating-to-floating swap. Here,
two floating rate obligations are exchanged where the two obligations are based on
different benchmark rates. For example, the benchmark rate can be LIBOR or T-Bill rate.
Interest Rate Options
Interest rate options represent the right to make a fixed interest payment and receive a
floating interest payment or to make a floating interest payment and receive a fixed
interest payment. These interest rate options will have exercise rate or strike rate. They
are available for both European and American versions. Interest rate options are widely
used to hedge an interest rate exposure on a specific date.
Interest Rate Cap
An interest rate cap is defined as a combination of interest rate calls designed to protect
a borrower in a floating rate loan against increases in interest rates. Each component call
is referred to as a caplet. A combination of interest rate puts designed to protect a lender
in a floating rate loan against decreases in interest rate is known as interest rate floor.
Each component put is referred to as a floorlet. A combination of long cap and short floor
is known as an interest rate collar. This is most often used by a borrower and consists of
a long position in a cap, financed by selling a short position in a floor.
An interest rate cap, also known as a ceiling, is a call option on interest rates. It is a
contract that guarantees a maximum level of a floating rate benchmark. A Cap can serve
as a guarantee for one particular period, known as a Caplet. A series of Caplets or Caps
can extend for many years. The maximum loss on a Cap transaction is the premium paid
by the buyer.
Treasury Operations Basics 58
Interest Rate Floor
This is a put option on interest rates. Floors guarantee a maximum level of the fixed rate
benchmark, and they comprise a series of floorlets, each of which is a put option at a
given future date.
Interest Rate Floors are used typically by lenders in a floating rate loan when they wish
to counter falling rates. A floor contains a series of interest rate put options, each of
which is known as a floorlet.
An Interest Rate Collar
A collar is a combination of buying a cap and simultaneously selling a floor. The strike
levels are generally decided such that the net premia outflow is zero.
Collar = Cap - Floor
Swaptions
Swaptions are options on Interest Rate Swaps. The payer of a Swaption has an option
to enter into a payer swap (pay a Fixed Rate and receive a Floating Rate). The receiver
of a Swaption has the Option to enter into a receiver swap (receive a Fixed Rate and pay
a Floating Rate).
Treasury Operations Basics 59
4. Foreign Exchange Markets – Introduction
Chapter objectives:
1. To identify the products and participants of foreign exchange markets
2. To understand the important terminologies and mechanism of spot and derivative
markets
3. To recognize the factors that affect foreign exchange markets
4.1 Overview of Global Forex Markets
The market that facilitates exchange of currencies is the Foreign Exchange Market. The
world is emerging as a global economy because of flow of goods, services and capital.
For each transaction of goods and services, there is a corresponding currency
transaction, which forms a part of international network of payments. The foreign
exchange market is that in which currencies are bought and sold against each other.
The foreign exchange market is largely an OTC market. This means that there is no
single market place or an organized exchange, electronic or physical (like stock
exchange) where all trades are executed between exchange members. The traders sit in
the offices (foreign exchange dealing rooms) of major commercial banks around the
world and communicate with each other through telephones, telexes and other electronic
means of communication.
The market spans all time zones of the world and functions virtually round-the-clock,
enabling a trader to offset a position created in one market using another market. The
major market centers are London, New York and Tokyo. Other important centers are
Zurich, Frankfurt, Hong Kong and Singapore.
Treasury Operations Basics 60
4.2 Products and Participants in Foreign Exchange Markets
The participants in the foreign market can be classified under three broad categories:
Non-bank Entities who wish to exchange currencies to meet or hedge contractual
commitments (arising out of, for e.g., import or export contracts in foreign
currencies). Many multinational firms engage themselves in forward contracts to
protect the home currency values of foreign currency denominated assets and
liabilities on their balance sheet. These companies also hedge receivables and
payables.
Banks that exchange currencies to meet client requirements.
Central banks participate in foreign exchange markets whenever there is a need
to stabilize exchange rates.
These participants can assume the following roles while transacting in foreign exchange
markets.
Hedging: Participants who have foreign exchange exposures due to various
transactions that they undertake, such as exports or imports, may like to hedge
themselves from currency fluctuations. Hence they participate in foreign currency
derivatives markets and take positions in currency forwards, futures, swaps and
options to minimize the risk.
Trading: Traders / dealers buy or sell currencies in the hope of profiting from price
movements. In fact, speculative transactions are by far the largest proportion of
the total activity in the market. The big speculators in currencies include large
commercial and investments banks, multinational, and so-called hedge funds.
Profiting from arbitrage: Participants who take advantage of price disparities on a
fully hedged basis are called arbitragers. They have a limited role to play in the
Treasury Operations Basics 61
currency market since communication systems have made the market too
efficient to allow any arbitrage opportunities.
4.3 Spot and forward markets
Quotations in the Foreign Exchange Market
A quotation is the amount of one currency to buy or sell a unit of another currency. When
it is expressed in currency terms it is called an outright rate. For example, 1 EUR =
1.3810 USD is an outright rate. The quotes are usually made in the form of „buy‟ and
„sell‟ or „bid‟ and „ask‟ rates. The „buy‟ quotes are the price at which the exchange dealer
is ready to buy the currency and the „sell‟ quotes indicate the price at which the dealer is
ready to sell the currency. „Bid‟ and „ask‟ are alternative terms for the above two quotes.
Sometimes „ask‟ is also referred as „offer‟ price.
Direct Quotations
While quoting the exchange rate for a currency, if the unit of foreign currency is kept
constant and its value is expressed in terms of variable home currency, the method of
quoting the exchange rate is direct quotation. In this case, the unit of home currency will
vary for every unit of foreign currency.
e.g., USD 1 = Rs.45.80 (USD is base currency and INR is offered currency)
Indirect Quotations
When the unit of home currency is kept constant and the unit of home currency is
expressed in terms of variable units of foreign currency, this method of quoting exchange
rate is called indirect quotation.
E.g., Rs.100 = USD 2.18
Treasury Operations Basics 62
Also, the point to be noted is, in market parlance except for EUR, GBP, NZD and AUD all
other currencies are quoted with USD as base currency.
Example: 1 USD=x CHF, or 1 USD = y CAD
But, 1 EUR= xyz USD or 1 NZD = abc USD
Relationship between bid and ask prices of currencies
One important thing to know about bid and offer rates is that when a bank quotes for a
currency, it simultaneously offers another currency in lieu i.e., when it buys euros for
dollars, it is simultaneously offering dollars for euros. Thus there are two sides of all
quotes.
Two-way quotes
In other commercial transactions, whenever we enquire the price of the commodity, the
seller immediately quotes his/her selling price. But in a foreign exchange market,
exchange rates are quoted for buying and selling i.e., one rate for buying and another
rate for selling. For example, if Bank X calls for the rate from Bank Y for GBP / USD
Bank Y will quote:
GBP 1 = USD 1.6150 / 60 This way banks act as market makers.
It means that Bank Y is prepared to buy GBP at USD 1.6150 and sell at 1.6160. This
method of quoting both buying and selling rates is known as a two-way quotation. For all
practical purposes, if we treat foreign exchange as a commodity, the logic and
application of a two-way quotation can be understood easily i.e., a trader will always be
willing to buy a commodity at a lesser price and sell at a higher price. This is called a bid-
ask spread.
Treasury Operations Basics 63
As there is no specific exchange for dealing in FX, only those participants have access to
market rates who are dealing directly and act as market makers. There are quotes (bid
/ask) available at all the time by authorized dealers (market makers) through e-trading
screens etc.
In a spot two way price Right Hand Side is always greater than Left Hand Side
Spread / Cost of Transaction
Ask and Bid differential is called the spread.
The spread is always in favour of the party making the price and against the party facing
the price. The maker of price will take more (and give less) of variable currency for each
unit currency. The facer of price will take less (and give more) of variable currency for
each unit currency.
The main determinants of spread are:
If the currency is fairly traded, (i.e. trading volumes are high and are traded
against number of currencies in a free environment), the spread will be smaller
than the currency that is rarely traded. For dollar, the spread is smaller than that
for Danish Krone.
If the volume of the currency traded is large, the authorized dealer (market
maker) tends to quote lower spreads. This is because the cost of the service
required per unit of the currency traded falls.
The spread of the quote also depends on the nature of the organization making
the quotation. If a bank is making a quote, spread will be smaller compared with a
money changer who has obtained a license to deal in foreign exchange.
Treasury Operations Basics 64
If the forex dealer perceives larger fluctuations in the economic conditions in the
near future and thinks that risk is going to increase, the dealer starts expanding
spread. However, if the opposite perception prevails, the usual spreads continue.
Value Dates
Because of technicalities involved in expressing the time when a cash flow is to take
place, we will discuss the concept of value dates. As we know, there are two major time
dimensions in the foreign exchange markets:
1. Spot transactions are for a value date, usually two business days following the
day when the transaction is closed.
2. Forward transactions are for value dates in future, usually computed as a number
of months from the spot value date at the time of transaction.
Value dates as of today (called Cash) and one business day following the transaction
(called Tom), are also possible. However, these will not be genuine spot transactions
and the spot rate will not apply despite its resemblance to spot transactions. If we deal
with value date today or tomorrow, an adjustment of the spot rate may be necessary to
reflect interest rates of the two days between today and the value date of the spot
transaction.
Eligible value dates
To be an eligible value date, a value date must be a business day in the home country of
the currency involved in the transaction.
Treasury Operations Basics 65
4.4 Foreign Exchange Arithmetic – Rate Computations
Foreign exchange rate computations involve a number of calculations which can be best
understood by examples. The following example explains the calculations required to
arrive at specific foreign exchange rates.
Example 1: Understanding two way quotes
Suppose a quotation is given as USD/CHF 0.9340 / 42:
a) The two currencies involved are: US dollars and Swiss Franc. In the above
case, USD is the base currency and CHF is variable currency. Concept of base
currency is very important in foreign exchange market since all quotes are for
base currency.
b) The rate is being stated as CHF per USD or CHF price of 1 USD.
c) A bank will buy 1 USD for 0.9340 CHF.
d) A bank will sell 1 USD for 0.9342 CHF.
e) The bid-offer spread is 2 points or .0002 CHF.
Example 2: Arriving at two way cross currency rates
The market quotes:
GBP/USD Spot: 1.6180 / 90
USD/JPY Spot: 81.45 / 50
USD/INR Spot: 45.80 / 85
Please calculate two-way, cross currency Spot rates for the following pairs.
a. JPY / INR
b. GBP / INR
a) JPY / INR: This quote is derived from USD/JPY and USD/INR quotes. In both
Treasury Operations Basics 66
these cases, the base currency is USD. Hence, the rule is to divide one quote by
another while arriving at a cross currency rate. We assume JPY / INR, JPY is
the base currency in a cross currency quote. Hence, USD/JPY becomes the
denominator and USD / INR the numerator.
b) Cross currency bid rate = USD/INR bid / USD/JPY ask = 45.80/81.50 = 0.5620
c) Cross currency ask rate = USD/INR ask / USD/JPY bid = 45.85 / 81.45 =
0.5629
d) GBP / INR: This quote is derived from GBP/USD (base currency GBP) and
USD/INR quotes (base currency USD). Since base currencies are different,
cross currency calculations are straightforward. Multiply both bid rates and ask
rates to arrive at cross currency bid and ask rates respectively.
Cross currency bid rate = GBP/USD bid * USD/INR bid = 1.6180 * 45.80 = 74.10
Cross currency ask rate = GBP/USD ask * USD/INR ask = 1.6190 * 45.85 = 74.23
Forward Market
This segment of the market is an important part, which makes the foreign exchange
market vibrant. In this market, contracts are bought and sold at forward exchange rates
and hence cash flow happens at a future date (agreed on the date of entering the
transaction). Hedging and speculation are main activities, which pertain to forward
markets. For example, an exporter who is expecting USD 1mn after 3 months can book
a three-month forward ( sell expected USD , where actual cash flow will happen after
three months ,once the dollars are received) and know the exchange rate of his/her
receivables well in advance and mitigate exchange risks.
Treasury Operations Basics 67
Swap Margins and Quotations
While banks quote and do outright forward deals with their non-bank customers, in the
interbank market, forwards are done in the form of swaps. Thus, suppose a bank buys
pounds one-month forward against dollars from a customer, it has created a long
position in pounds (short in dollars) for one-month forward. If it wants to square this in
the interbank market, it will do so as follows:
A swap in which it buys pounds spot and sells one month forward, thus creating
an offsetting short pound position one month forward.
Coupled with a spot sale of pounds to offset the long pound position in spot
created in the above swap.
This is because it is difficult to find counterparties with matching opposite needs to cover
the original position by an opposite outright forward whereas accumulation of various
customer transactions in a bank‟s books can be easily managed by squaring the spot
and swap positions separately or can be easily offset by dealing in the euro deposit
markets.
FX Swap can be structured in two ways. If a currency is bought in the spot and
simultaneously sold in a forward market, it is called Buy–Sell swap. In the reverse case it
will be a Sell–Buy swap.
Receipt and Payment of Swap Points
If the currency is in Discount in Future then a swap where the currency is bought is spot
and sold in forward will result in gain of the swap points. This is simply because the
currency is being sold costly and bought cheap. Further, in a currency pair, the currency
Treasury Operations Basics 68
with a lesser interest rate is at premium and hence the currency having higher interest
rate is at discount. We can summarize the rule as given below:
1. A Sell / Buy Swap in Discount currency results in Gain of Swap Points. And it
logically follows that.
2. A Buy / Sell swap in Discount currency results in Loss of Swap Points.
3. A Buy / Sell swap in Premium currency results in Gain of Swap Points.
4. A Sell / Buy swap in Premium currency results in Loss of Swap Points.
Some Applications of Swaps
Banks use swaps among themselves to offset positions created in outright forwards
done with customers. You may have noticed that swap deals alter the timings of cash
flows.
For instance, suppose a firm bought CHF against dollar three-month forward on August
30.The delivery date is December 1. By late November, it realizes that it does not need
the CHF on December 1 but on December 14. On November 29, it can do a swap,
selling CHF spot and buying it for delivery on December 14. The CHF received from the
original forward contract is used to deliver against the spot leg of the swap.
Another variant of swaps is in so called “Roll-over Forward contracts‟. Forward quotes
may not exist or lack liquidity beyond certain maturities. Consider the case of a firm in
India that has contracted a foreign currency loan of $1,000,000. The principal has to be
repaid in 10 six-monthly installments starting six months from today. Ignoring the interest
payments (which can be easily figured into the calculation), the firm has definite outflows
of $10,000 every six months for the next five years. The firm would like to know the
Treasury Operations Basics 69
rupee value of its entire liability at all times. Assume that forward markets are not liquid
beyond six months.
The firm can use swaps as follows:
Buy USD 1,000,000 six-month forward at a rate known today.
Six months later, take delivery, use USD 100,000 to repay the first installment.
For the remaining USD 900,000 do a six-month swap i.e., sell in the spot market,
and buy six months forward. Rupee outflow six months later is again known with
certainty.
Repeat this operation every six months until till the loan is repaid.
4.5 Factors affecting Foreign Exchange Market
Short-term factors – Short-term factors that affect the foreign exchange market are those
that have an immediate effect on exchange rates between a pair of currencies. Some of
them are liquidity, interest rates, inflation, money supply, capital market performance,
etc. Tight liquidity for a particular currency results in an adverse movement in exchange
rate pertaining to that currency. Typically, high interest rates in a particular currency
results in more fund inflows into that currency, thereby making that currency dearer.
Similarly, high inflation rates and excess money supply in a particular currency regime
pushes exchange rates adversely for the currency. Buoyancy in capital markets also
attracts foreign institutional investors into the market, making the exchange rate
appreciate for the currency.
Long-term factors – Long-term factors that affect the foreign exchange market are those
that have long lasting effect on the exchange rates between a pair of currencies. Some
of them are government policies, central bank regulations, political scenario, structural
market reforms, long-term economic growth, etc. Rigid government policies and central
Treasury Operations Basics 70
bank regulations have a depreciating effect on the exchange rate of a currency. An
unstable political scenario and lack of structural market reforms also have an adverse
long-term effect on exchange rates. Countries boasting of substantial long-term
economic growth attract foreign investments, causing exchange rates to appreciate on a
longer-term horizon.
Economic factors – Economic factors play a vital role in affecting the foreign exchange
market. Currencies of countries with upbeat economies usually appreciate compared
with countries with distressed economies. Countries with burgeoning economies attract
more foreign investments, both direct and indirect, thereby increasing the value of the
currency and the foreign exchange market.
Political factors – Political factors influence the foreign exchange markets in a major way.
An unstable political scenario in a country has a negative effect on its currency and
hence depreciates the currency compared with other currencies. Investors put their trust
in economies where the political scenario is stable and conducive to business and
industrial growth, thereby making the currency of the country valuable.
Treasury Operations Basics 71
5. Asset Liability Management – Overview
Chapter objectives:
1. To understand the concept of asset liability management
2. To comprehend product pricing and performance management and risk
management
5.1 Product Pricing and Performance Management, Interest Rate Risk for Asset
Liability Management
As we appreciate, for a bank, a disbursing loan is an asset and accepting deposits is a
liability. The Asset Liability Management (ALM) desk manages these basic
asset/liabilities, along with investments and other on-balance sheet and off-balance
sheet items.
The ALM function involves planning, directing and controlling the flow, level, mix, cost
and yield of the consolidated funds of the bank. These responsibilities are interwoven
with the overall objectives of achieving the bank‟s financial goals (of achieving risk
adjusted return for shareholders)
ALM is concerned with strategic management of the banks‟ balance sheet by giving due
weightings to liquidity risk, interest rate risk and currency risk. It is the process of making
decisions of the composition of bank‟s assets and liabilities.
Interest Rate Risk
Interest rate risk is the exposure of the banks‟ earnings and capital to adverse changes
in interest rates. For all practical purposes, we are aware that interest rates keep
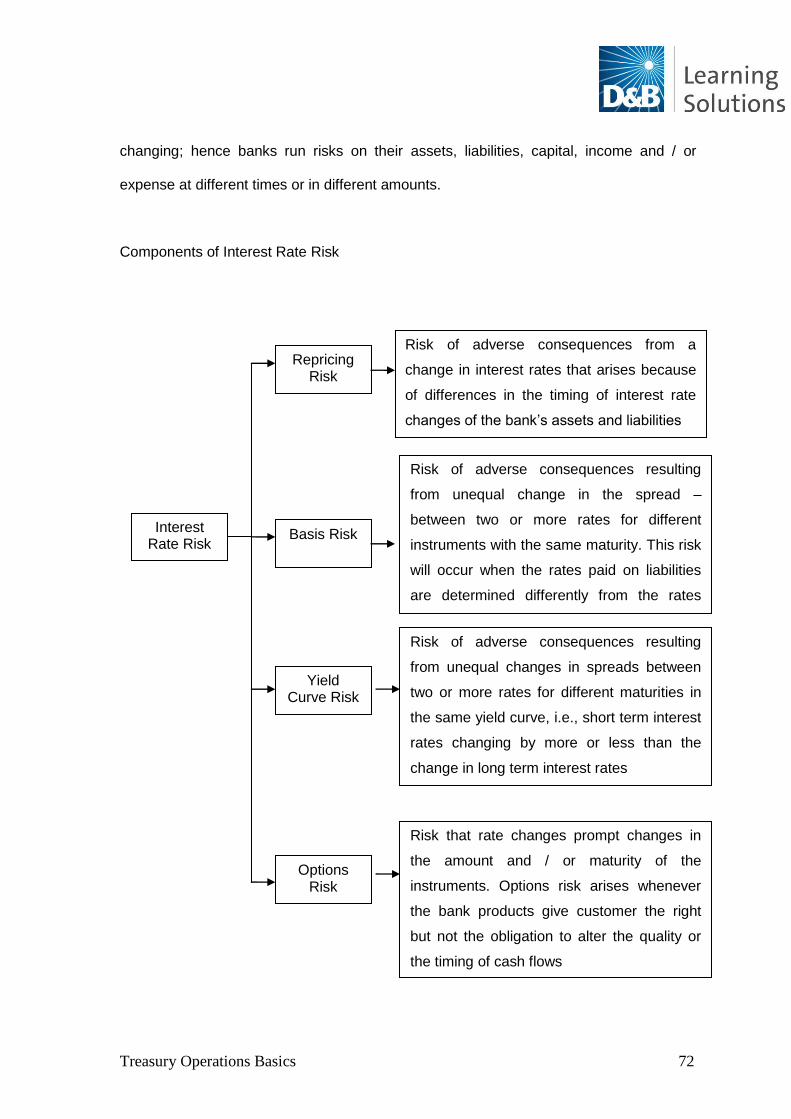
Treasury Operations Basics 72
changing; hence banks run risks on their assets, liabilities, capital, income and / or
expense at different times or in different amounts.
Components of Interest Rate Risk
Interest Rate Risk
Repricing Risk
Basis Risk
Yield Curve Risk
Options Risk
Risk of adverse consequences from a
change in interest rates that arises because
of differences in the timing of interest rate
changes of the bank‟s assets and liabilities
Risk of adverse consequences resulting
from unequal change in the spread –
between two or more rates for different
instruments with the same maturity. This risk
will occur when the rates paid on liabilities
are determined differently from the rates
received from the assets
Risk of adverse consequences resulting
from unequal changes in spreads between
two or more rates for different maturities in
the same yield curve, i.e., short term interest
rates changing by more or less than the
change in long term interest rates
Risk that rate changes prompt changes in
the amount and / or maturity of the
instruments. Options risk arises whenever
the bank products give customer the right
but not the obligation to alter the quality or
the timing of cash flows
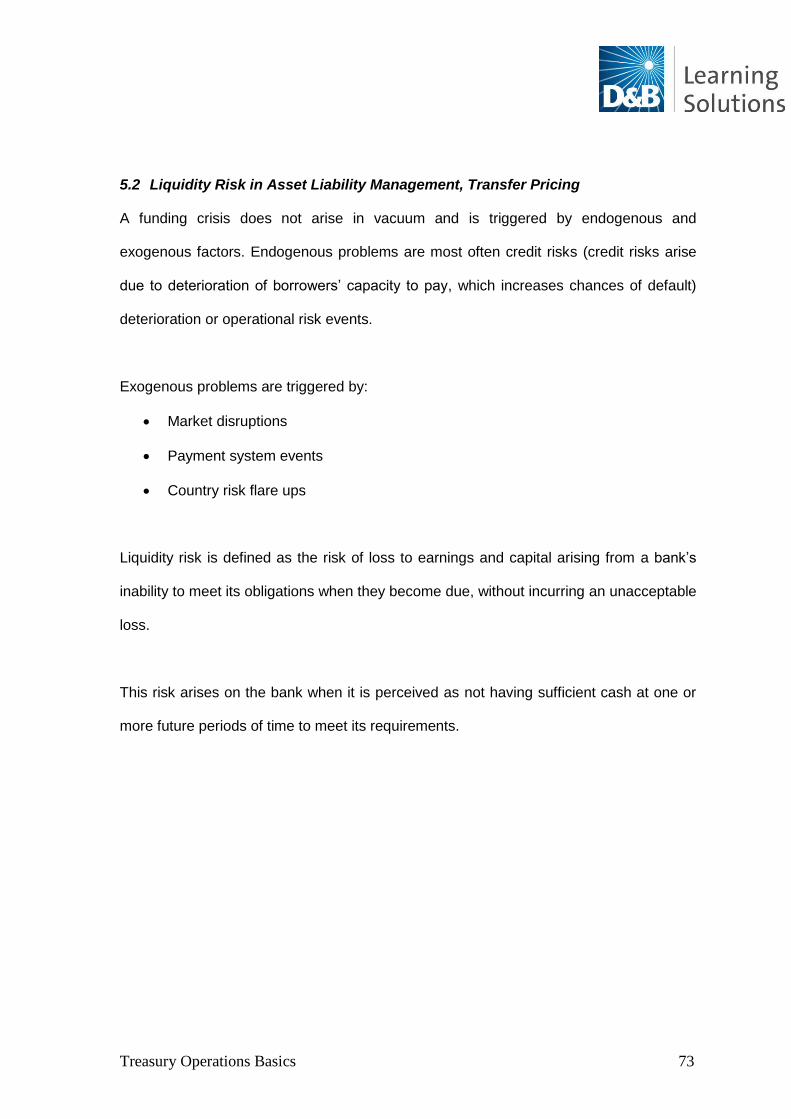
Treasury Operations Basics 73
5.2 Liquidity Risk in Asset Liability Management, Transfer Pricing
A funding crisis does not arise in vacuum and is triggered by endogenous and
exogenous factors. Endogenous problems are most often credit risks (credit risks arise
due to deterioration of borrowers‟ capacity to pay, which increases chances of default)
deterioration or operational risk events.
Exogenous problems are triggered by:
Market disruptions
Payment system events
Country risk flare ups
Liquidity risk is defined as the risk of loss to earnings and capital arising from a bank‟s
inability to meet its obligations when they become due, without incurring an unacceptable
loss.
This risk arises on the bank when it is perceived as not having sufficient cash at one or
more future periods of time to meet its requirements.
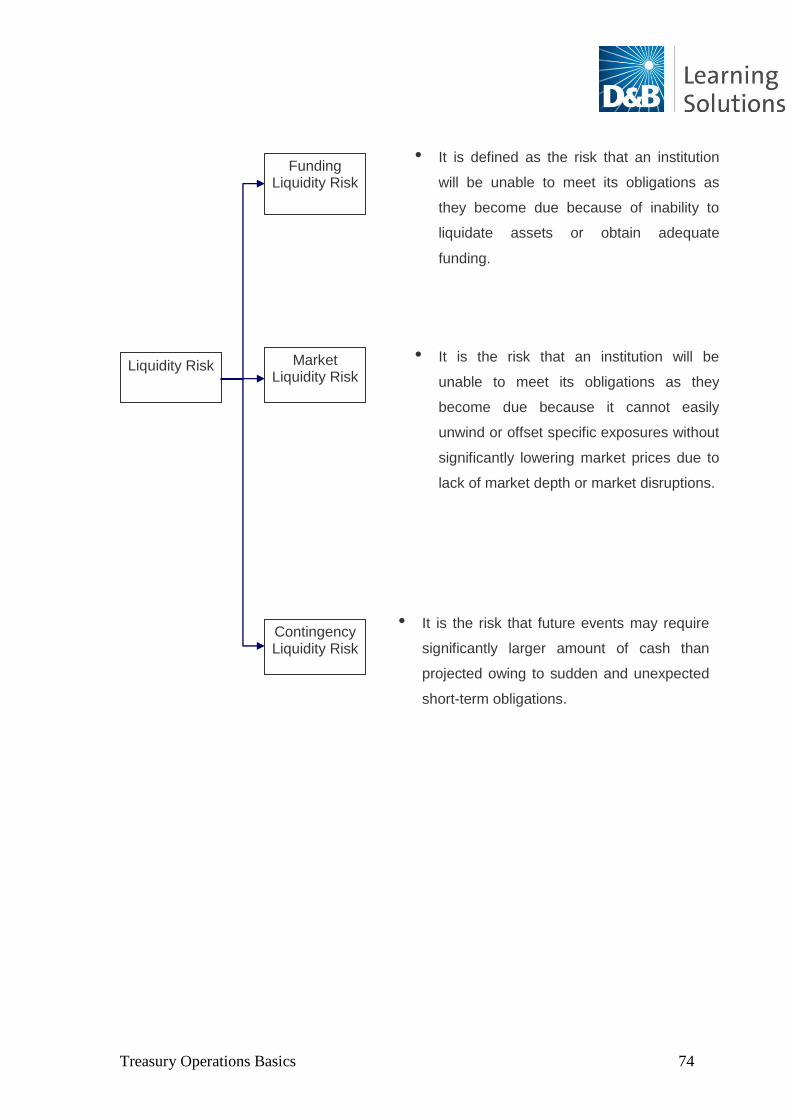
Treasury Operations Basics 74
• It is defined as the risk that an institution
will be unable to meet its obligations as
they become due because of inability to
liquidate assets or obtain adequate
funding.
Liquidity Risk
Funding Liquidity Risk
Market Liquidity Risk
Contingency Liquidity Risk
• It is the risk that an institution will be
unable to meet its obligations as they
become due because it cannot easily
unwind or offset specific exposures without
significantly lowering market prices due to
lack of market depth or market disruptions.
• It is the risk that future events may require
significantly larger amount of cash than
projected owing to sudden and unexpected
short-term obligations.
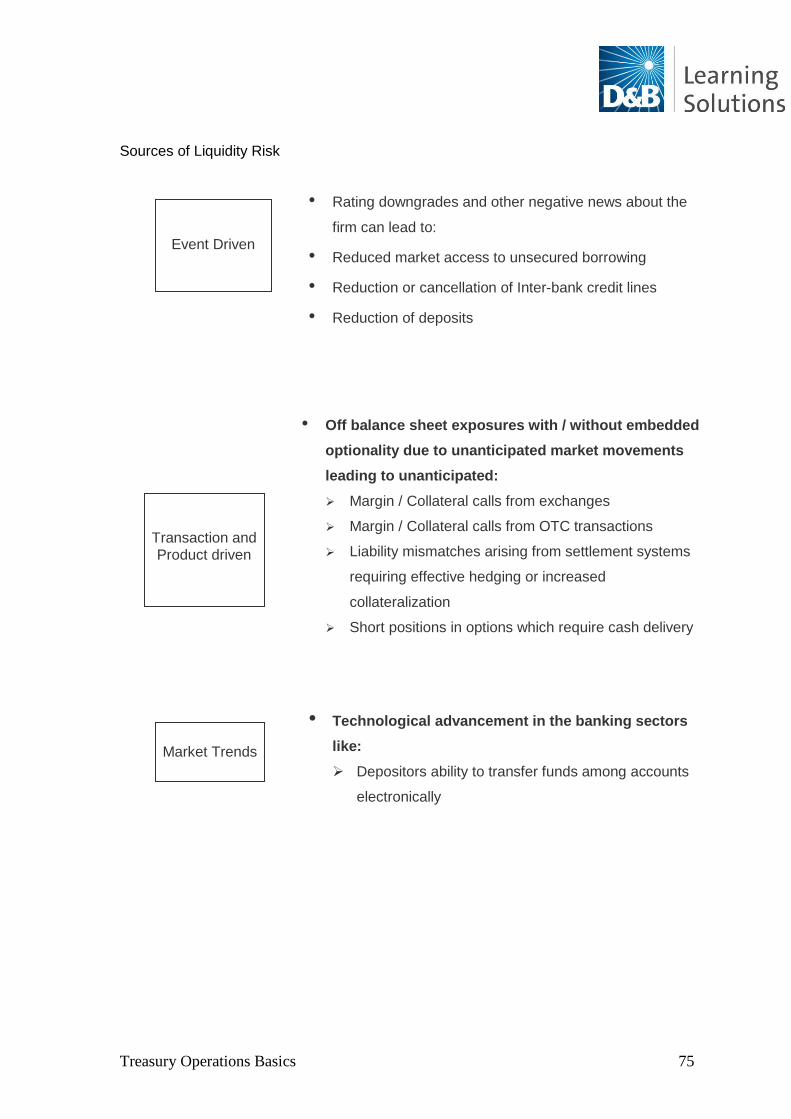
Treasury Operations Basics 75
Sources of Liquidity Risk
• Rating downgrades and other negative news about the
firm can lead to:
• Reduced market access to unsecured borrowing
• Reduction or cancellation of Inter-bank credit lines
• Reduction of deposits
Event Driven
Transaction and Product driven
Market Trends
• Off balance sheet exposures with / without embedded
optionality due to unanticipated market movements
leading to unanticipated:
Margin / Collateral calls from exchanges
Margin / Collateral calls from OTC transactions
Liability mismatches arising from settlement systems
requiring effective hedging or increased
collateralization
Short positions in options which require cash delivery
• Technological advancement in the banking sectors
like:
Depositors ability to transfer funds among accounts
electronically
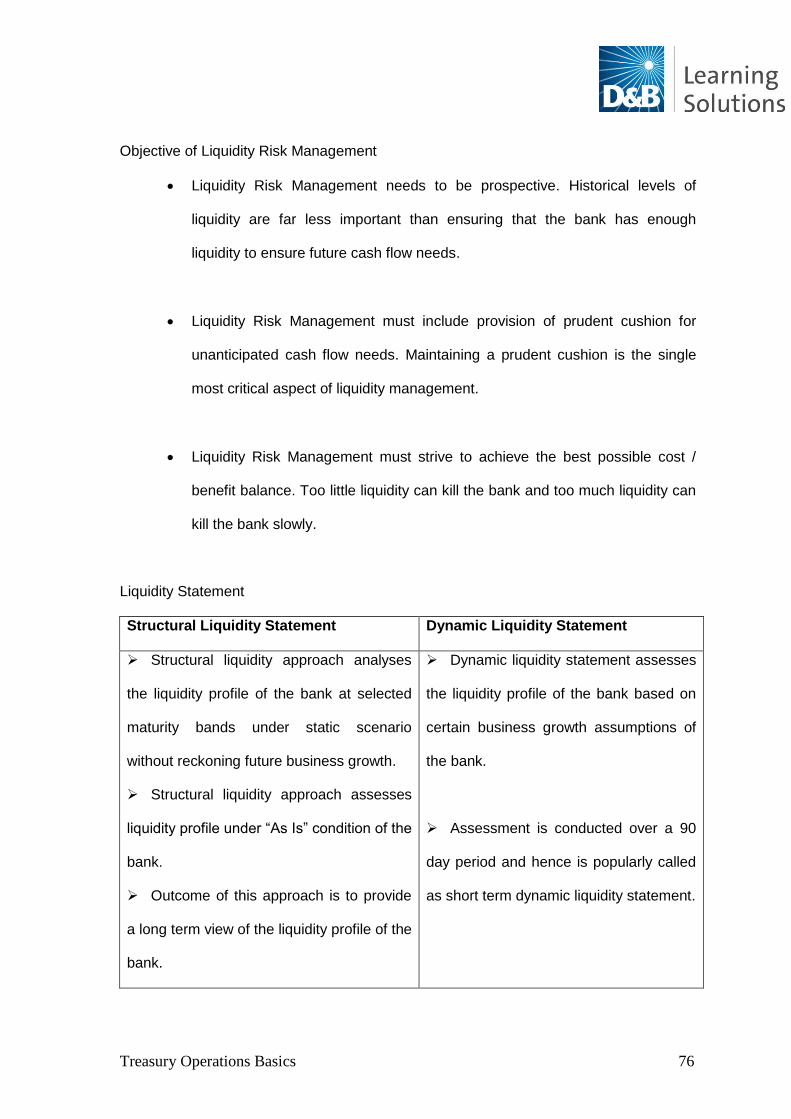
Treasury Operations Basics 76
Objective of Liquidity Risk Management
Liquidity Risk Management needs to be prospective. Historical levels of
liquidity are far less important than ensuring that the bank has enough
liquidity to ensure future cash flow needs.
Liquidity Risk Management must include provision of prudent cushion for
unanticipated cash flow needs. Maintaining a prudent cushion is the single
most critical aspect of liquidity management.
Liquidity Risk Management must strive to achieve the best possible cost /
benefit balance. Too little liquidity can kill the bank and too much liquidity can
kill the bank slowly.
Liquidity Statement
Structural Liquidity Statement Dynamic Liquidity Statement
Structural liquidity approach analyses
the liquidity profile of the bank at selected
maturity bands under static scenario
without reckoning future business growth.
Structural liquidity approach assesses
liquidity profile under “As Is” condition of the
bank.
Outcome of this approach is to provide
a long term view of the liquidity profile of the
bank.
Dynamic liquidity statement assesses
the liquidity profile of the bank based on
certain business growth assumptions of
the bank.
Assessment is conducted over a 90
day period and hence is popularly called
as short term dynamic liquidity statement.
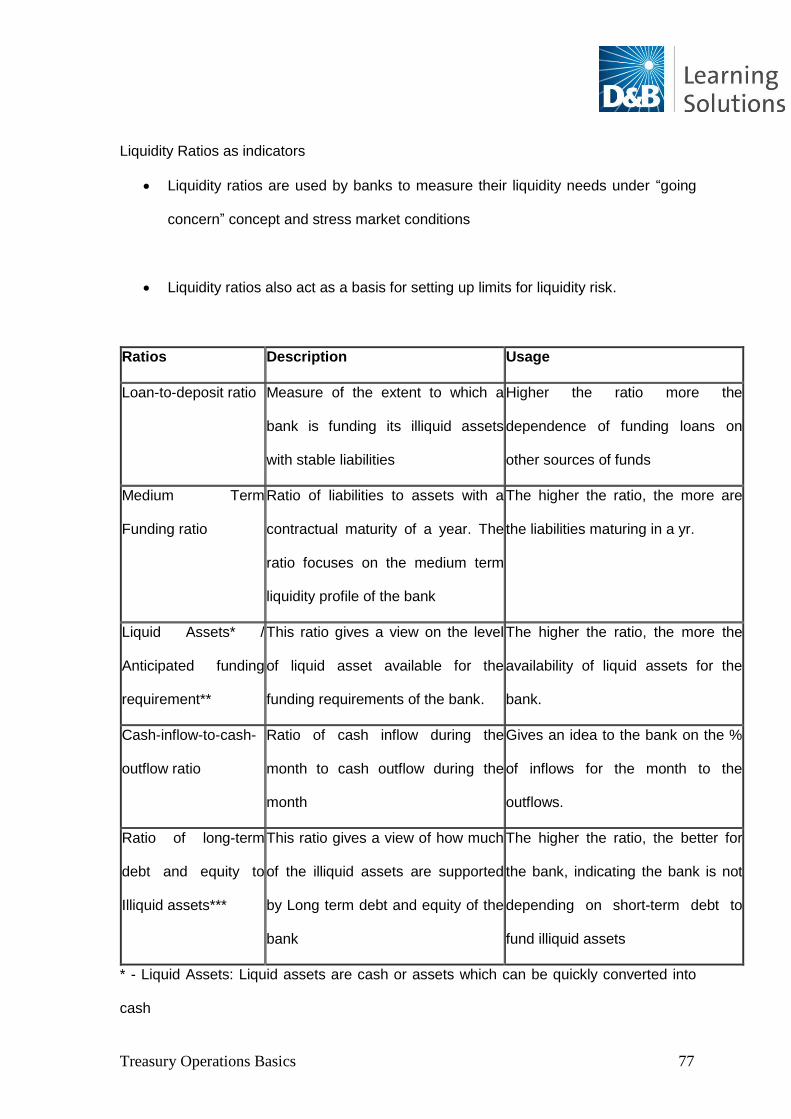
Treasury Operations Basics 77
Liquidity Ratios as indicators
Liquidity ratios are used by banks to measure their liquidity needs under “going
concern” concept and stress market conditions
Liquidity ratios also act as a basis for setting up limits for liquidity risk.
Ratios Description Usage
Loan-to-deposit ratio Measure of the extent to which a
bank is funding its illiquid assets
with stable liabilities
Higher the ratio more the
dependence of funding loans on
other sources of funds
Medium Term
Funding ratio
Ratio of liabilities to assets with a
contractual maturity of a year. The
ratio focuses on the medium term
liquidity profile of the bank
The higher the ratio, the more are
the liabilities maturing in a yr.
Liquid Assets* /
Anticipated funding
requirement**
This ratio gives a view on the level
of liquid asset available for the
funding requirements of the bank.
The higher the ratio, the more the
availability of liquid assets for the
bank.
Cash-inflow-to-cash-
outflow ratio
Ratio of cash inflow during the
month to cash outflow during the
month
Gives an idea to the bank on the %
of inflows for the month to the
outflows.
Ratio of long-term
debt and equity to
Illiquid assets***
This ratio gives a view of how much
of the illiquid assets are supported
by Long term debt and equity of the
bank
The higher the ratio, the better for
the bank, indicating the bank is not
depending on short-term debt to
fund illiquid assets
* - Liquid Assets: Liquid assets are cash or assets which can be quickly converted into
cash
Treasury Operations Basics 78
** - Anticipated funding requirement: Future requirements of cash resources for business
expansion and other tactical and strategic planning, mostly strategic
*** - Illiquid assets – Illiquid assets are those assets that cannot be readily converted into
cash by selling them in the market like illiquid corporate bonds or junk bonds, private
equity investments or venture capital investments that cannot be easily exited.
Fund Transfer Pricing
FTP is a management accounting technique used to calculate the true net interest
component of profitability of business units, products, portfolios and customers.
FTP helps build income statement for each of these views by calculating the cost of
funding assets and the credit for funds provided in the form of deposits.
FTP rates are asset and liability rates generated by the funding centre (or treasury) of a
bank to charge deploying units and to credit the sourcing units in accordance with re-
pricing, maturity and optionality associated with asset and liability. This is done in such a
way that:
Financial revenue and expense are allocated to business units that are involved
in funding and sourcing.
Interest rate risk and liquidity risk are removed from funding and deploying units
to be mapped at bank level.
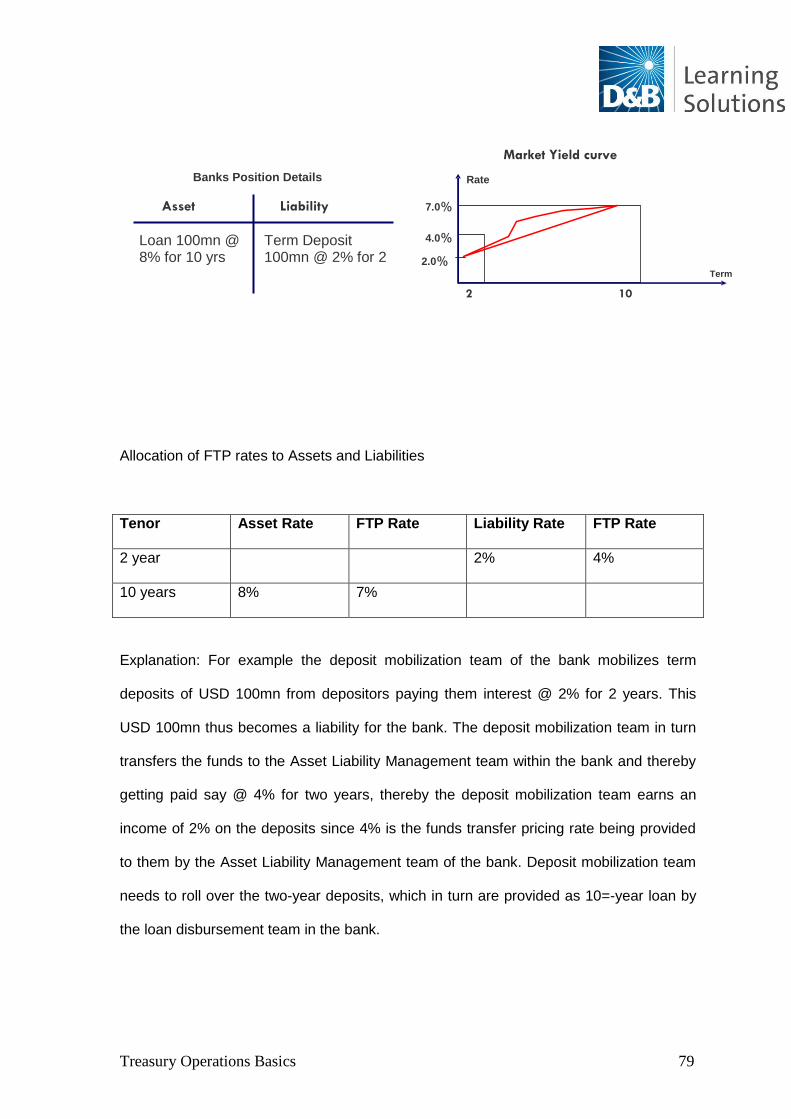
Treasury Operations Basics 79
Allocation of FTP rates to Assets and Liabilities
Tenor Asset Rate FTP Rate Liability Rate FTP Rate
2 year 2% 4%
10 years 8% 7%
Explanation: For example the deposit mobilization team of the bank mobilizes term
deposits of USD 100mn from depositors paying them interest @ 2% for 2 years. This
USD 100mn thus becomes a liability for the bank. The deposit mobilization team in turn
transfers the funds to the Asset Liability Management team within the bank and thereby
getting paid say @ 4% for two years, thereby the deposit mobilization team earns an
income of 2% on the deposits since 4% is the funds transfer pricing rate being provided
to them by the Asset Liability Management team of the bank. Deposit mobilization team
needs to roll over the two-year deposits, which in turn are provided as 10=-year loan by
the loan disbursement team in the bank.
Asset Liability
Loan 100mn @ 8% for 10 yrs
Term Deposit 100mn @ 2% for 2 yrs
Banks Position Details
Rate
s
7.0%
4.0%
Term
m 2 year
10 years
2.0%
Market Yield curve
Treasury Operations Basics 80
Asset Liability Management team in turn passes on the funds to the loan disbursement
team say @ 7%, which extends loans to the tune of USD 100 @ 8% for a 10-year tenor.
The Asset Liability Management team in turn hedges the rates with the outside market
thus acting as a central focus group managing both the assets and the liabilities of the
bank, thereby managing a 3% spread between assets and liabilities.
Objectives of FTP
Allocate funds within the bank
Transfer Liquidity and interest rate risk to the ALM unit to make the performance
of business lines independent of market movements that are beyond the control
of business units
Bifurcate the total interest earned into various components attributable to various
businesses within the bank in such as way that contributions to bank-level
margins are explained properly
Define economic benchmarks for pricing and performance measurement
Drive pricing policies of business units in line with the market practices
Provide incentives or penalties to trigger expected performance from business
units to bring them in line with commercial policy
FTP System
Treasury or a designated unit within treasury brings out rates for assets and liabilities
for various tenor periodically through yield curves for various currencies.
These rates serve as „transfer rates‟ for sourcing and deploying units at which they
lend and borrow respectively:
Gross margin for a lending unit = Customer rate – Transfer Rate of FTP
Gross margin for a sourcing unit = Transfer rate of FTP – Customer rate
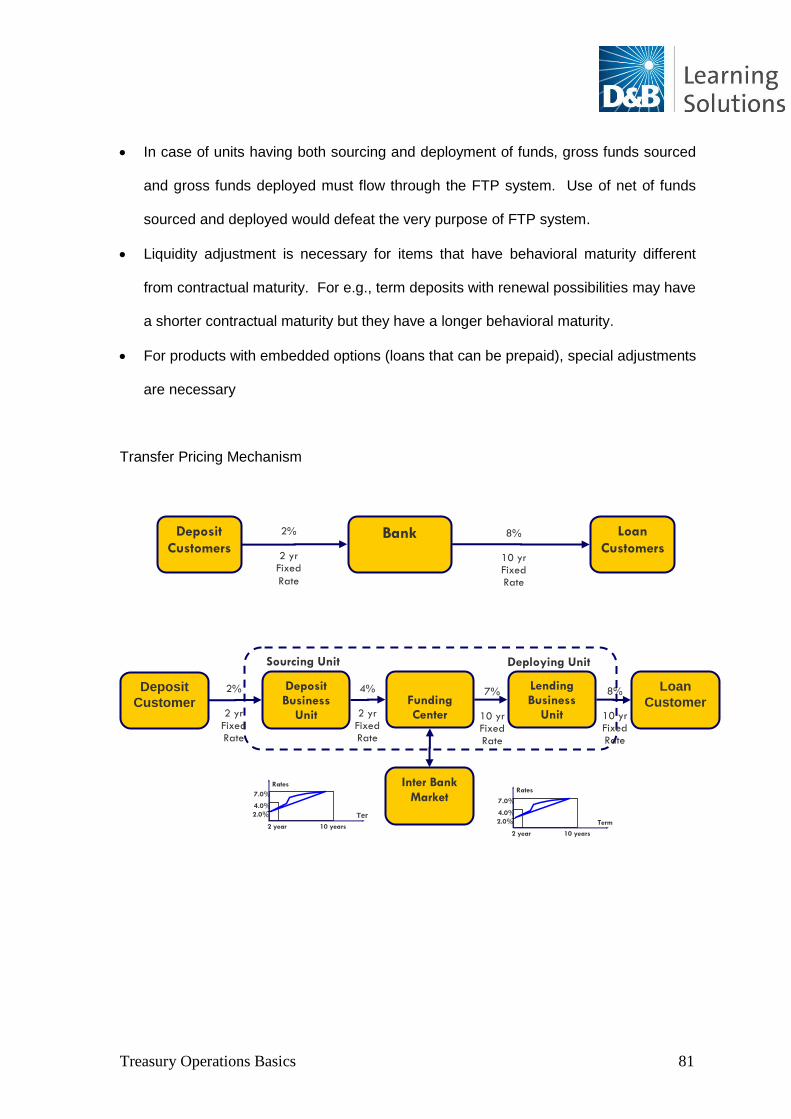
Treasury Operations Basics 81
In case of units having both sourcing and deployment of funds, gross funds sourced
and gross funds deployed must flow through the FTP system. Use of net of funds
sourced and deployed would defeat the very purpose of FTP system.
Liquidity adjustment is necessary for items that have behavioral maturity different
from contractual maturity. For e.g., term deposits with renewal possibilities may have
a shorter contractual maturity but they have a longer behavioral maturity.
For products with embedded options (loans that can be prepaid), special adjustments
are necessary
Transfer Pricing Mechanism
Deposit
Customers Bank Loan
Customers
2%
2 yr Fixed
Rate
Deposit
Customer
Deposit Business
Unit of the Bank
Funding Center
Lending Business
Unit of the Bank
Loan
Customer
Inter Bank
Market
4%
2 yr Fixed Rate
2%
2 yr Fixed Rate
7%
10 yr Fixed Rate
8%
10 yr Fixed Rate
Sourcing Unit Deploying Unit
Rates
7.0%
4.0%
Term 2 year 10 years
2.0%
Rates
7.0%
4.0%
Term
2 year 10 years
2.0%
8%
10 yr Fixed Rate
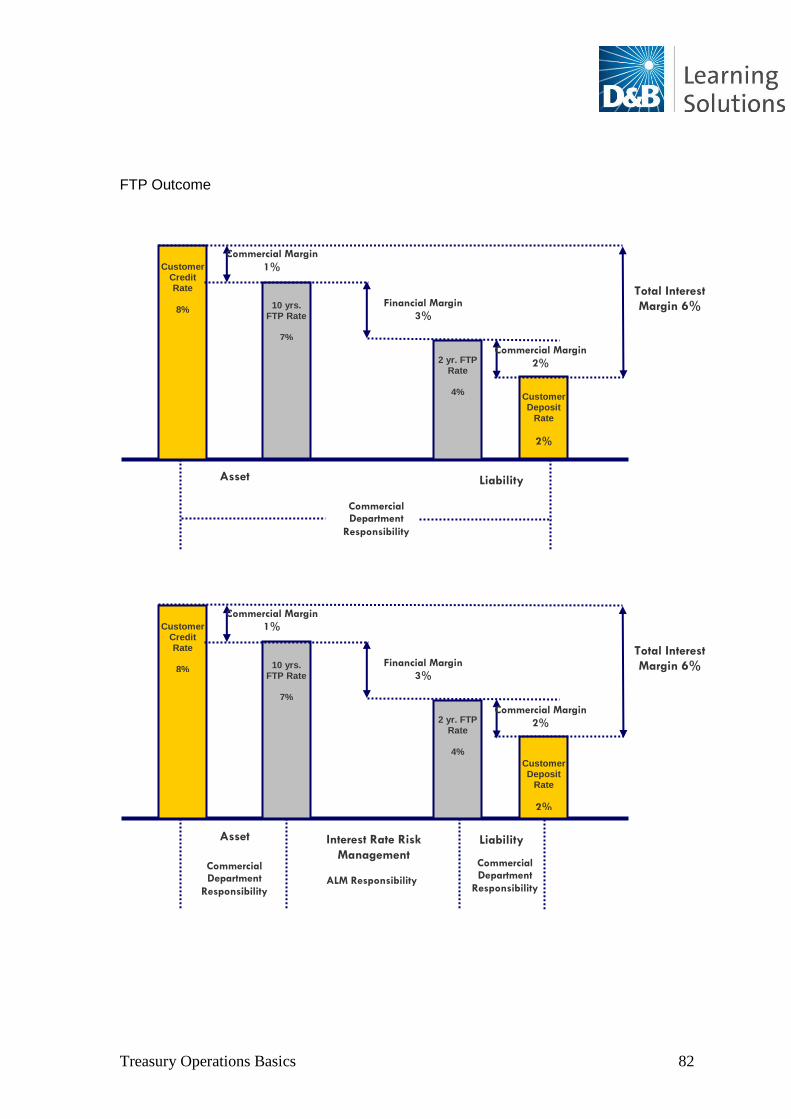
Treasury Operations Basics 82
FTP Outcome
Customer Credit Rate
8%
Customer Deposit
Rate
2%
Asset Liability
Total Interest
Margin 6%
10 yrs. FTP Rate
7%
Commercial Margin
1%
2 yr. FTP Rate
4%
Commercial Margin
2%
Financial Margin
3%
Commercial Department
Responsibility
Commercial Department
Responsibility ALM Responsibility
Interest Rate Risk
Management
Customer Credit Rate
8%
Customer Deposit
Rate
2%
Asset Liability
Total Interest
Margin 6%
10 yrs. FTP Rate
7%
Commercial Margin
1%
2 yr. FTP Rate
4%
Commercial Margin
2%
Financial Margin
3%
Commercial Department
Responsibility
Treasury Operations Basics 83
Outcome of an Effective FTP
Enables the Asset Liability Management unit to have a powerful leverage on
business
Decision making process, customer pricing and commercial policy are based on
the FTP system
Helps increase the bottom line
Enables true performance of business units to be reflected in the P&L
Applications of FTP
FTP is a tool for:
Implementing ALCOs decisions
Pricing Decisions
Comparative evaluation of business lines
Views of profitability
Product Profitability
Business line Profitability
Customer Profitability
Market Segment Profitability
Branch Profitability
Region Profitability
Delivery Channel Profitability
FTP – Basic Components for Computation
Gross Balance of Asset (to be funded) or Liability (to be sourced) – FTP Balance
Rate applicable on the balance amount – FTP rate
Time period for which the charge needs to be calculated – FTP Period
FTP Charge = FTP Balance * FTP Rate * FTP Period
Treasury Operations Basics 84
6. Cash Management
Chapter objectives:
1. To understand the dynamics, forecasting and valuation of cash flow
2. To identify short term funding investments
3. To comprehend sales cash conversion cycle
4. To prepare the cash budget
The expression “cash is king” has taken on a new meaning in banks these days.
Leveraging balance sheets with complex structured investments turned out to be a losing
bet during financial crisis witnessed recently. But cash management departments at
multinational banks continued to bring in income. Similarly, corporations that had their
cash management procedures well thought out were better placed to weather the storm.
Cash Management:
Banking perspective – Cash management from the banking perspective is a low–
margin, high-volume business with a low risk factor. Cash management in the banking
sector is generally considered as a value added service provided to clients. But the
income generated from float money in the process is substantial as volume of
transaction increases, which make the business a profitable proposition for banks.
Corporate perspective – Cash management from a corporation perspective is a vital
and essential component in the entire financial management activities of the corporation.
It goes a long way in streamlining working capital funds flow for a business by utilizing
the potential of surplus cash and limiting the time between receivables and payables, by
trying to bridge the two functions.
Treasury Operations Basics 85
6.1 Cash Flow Dynamics, Forecasting and Valuation
Corporate Cash Management Objectives
An efficient process for collections and remittances
Enhance velocity of money, which calls for speed, accuracy and efficiency of high
order in the banking system
Manage cash flows, boost liquidity, and ensure reduction in costs
Clearing
Clearing is the process by which obligations of banks to pay (or receive) with the
central bank are arrived at. Clearing is also required to be done for arriving at
obligations of market participants with a designated clearing bank on the
exchange of instruments such as equities, bonds etc. Thus, clearing makes
transactions ready for settlement, which actually involves transfer of funds and or
securities.
Types of clearing
High value clearing
Normal check clearing
Interbank clearing
Return clearing
Non instrument based clearing
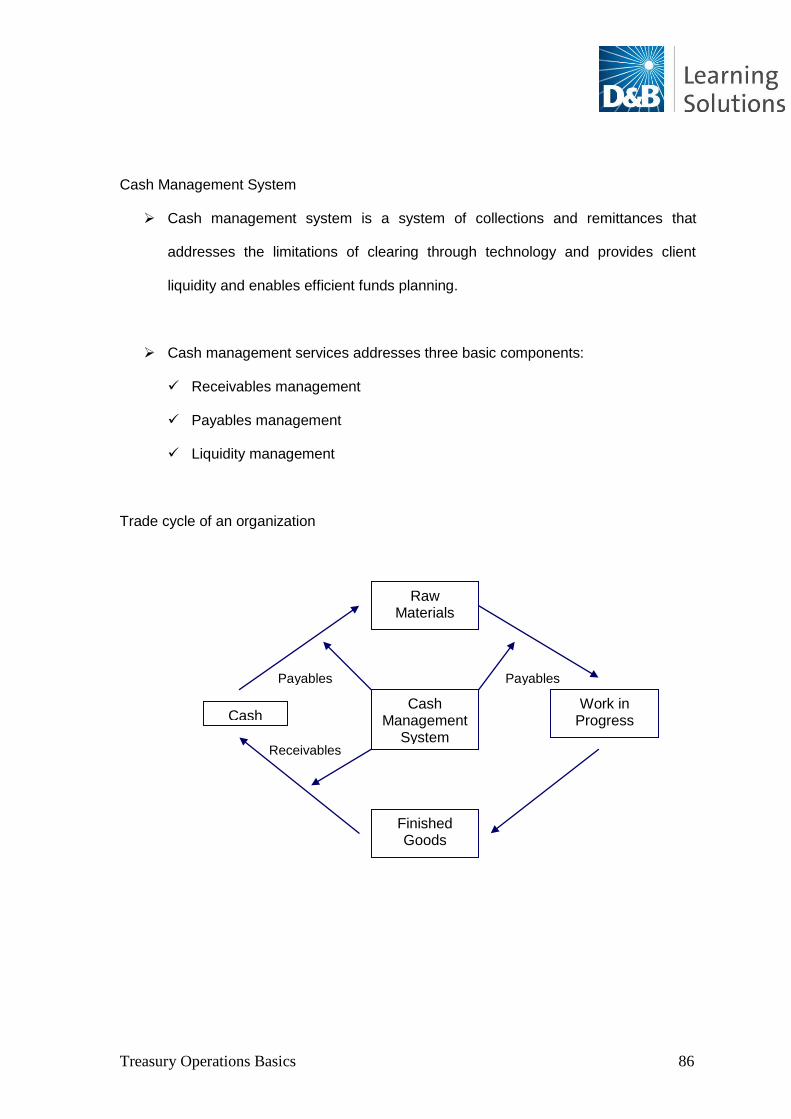
Treasury Operations Basics 86
Cash Management System
Cash management system is a system of collections and remittances that
addresses the limitations of clearing through technology and provides client
liquidity and enables efficient funds planning.
Cash management services addresses three basic components:
Receivables management
Payables management
Liquidity management
Trade cycle of an organization
Cash Management
System
Finished Goods
Cash Work in
Progress
Raw Materials
Payables
Receivables
Payables
Treasury Operations Basics 87
Conventional banking channels
Locks up funds in transit, strains liquidity
As a result the consequences are as follows.
Borrowing to bridge funds gap
Reduce profitability due to interest outgo
Adversely affects return on investment
Lowers returns to shareholders
Importance of cash management system
Optimal usage of available funds
Minimization of idle balances
Minimization of borrowings to save costs
Increase in investment opportunities available
Control over funds
Lower administrative burden and cost of monitoring cash transmission
Effective oversight and management of counterparty risks
Assured liquidity
6.2 Short-Term Funding Investments
Short-term funding investments preferred by cash management clients include:
Money market mutual funds – Money market mutual funds are mutual funds that
invest in short-term or money market instruments like Treasury bills, commercial
paper, certificate of deposit, repo, and the like. Characteristics of such
investments are low risk and low returns but greater liquidity.
Treasury Operations Basics 88
Direct investments in money market – Many banks provide their cash
management clients an option to directly invest in money markets through the
bank rather than through a mutual fund. This saves the client on distributorship
and investment management fees, although it misses out on specific fund
management expertise which the fund house might possess.
6.3 Cash Management Techniques
Accounts Receivables Tracking – Accounts receivables tracking goes a long way
in helping build an efficient cash management technique, since it helps a
corporation to efficiently manage receivables.
Expense Tracking – Expense tracking helps an organization to have control on its
expenses and in analyzing expense patterns.
Establishment of Credit Lines – Establishment of credit lines with banks goes a
long way in doing away with short-term funding mismatches and requirements.
Cash Pooling – the cash pooling concept connects all accounts of a corporation
with a particular bank into a single repository, to effectively manage funds and
any requirement from any divisions of the corporation can be centrally managed.
Netting – Netting refers to adjustment of cash receivables and cash payables
between parties, leaving only incremental cash payments to be effected from one
party to another.
Electronic Data Interchange – Electronic Data Interchange here refers to
electronic transfer of funds, and messages and instructions to reduce delivery
time of physical movement of instruments.
Treasury Operations Basics 89
6.4 Sales Cash Conversion Cycle (SCCC)
Sales Cash Conversion Cycle is considered as the total time taken since when a
corporation purchases raw material, converts into finished goods, sells goods and
realizes cash.
Intuitively, Sales Cash Conversion Cycle (in days) = Inventory Conversion Period +
Receivables Conversion Period - Payables Conversion Period
Explanation of the ratios are as follows:
Inventory conversion period 365/inventory turnover ratio
Where inventory turnover ratio Cost of goods sold/average inventory
Receivables conversion period 365/debtors turnover ratio
Where debtors turnover ratio Credit sales/average debtors + average
bills receivables
Payables conversion period 365/creditors turnover ratio
Where creditors turnover ratio Credit purchases/average creditors +
average bills payables
6.5 Cash Budget
Cash budget signifies estimation of short-term cash inflows and cash outflows in an
organization to plan out its working capital requirements. It includes cash receipts and
cash disbursements for that specific period of time.
Cash Receipts – Cash Disbursements = Change in Cash
Change in Cash + Beginning Cash + Borrowings – Repayments = Ending Cash Balance
Treasury Operations Basics 90
Example:
XYZ Inc. needs a cash budget for December 2010. The following information is
available:
Cash balance on 1st December 2010 is $6,000.
November 2010 sales are $80,000 and December 2010 sales are $60,000. Cash
collections on sales are 30% in the month of sale, 65% in the following month,
and 5% are uncollectable.
December 2010 General expenses (budgeted) are $25,000 (depreciation $2,000)
November 2010 and December 2010 Inventory purchases are $30,000 and
$40,000 respectively. Half of the inventory purchases are always paid for in the
month of purchase and the balance is paid in the following month.
December 2010 Office furniture cash purchase is $4,000.
December 2010 Sales Commission (budgeted) is $12,000.
Minimum ending cash balance is $4,000.
Bank borrowings are in multiples of $100.
Loans are repaid after 60 days.
Cash budget for XYZ Inc. for December 2010
XYZ Inc. Cash Budget December 2010 (figures in USD)
Cash receipts (30% of December 2010 Sales) 18,000
(65% of November 2010 Sales) 52,000
Total Cash Receipts 70,000
Cash Payments:
General Expenses (25,000 – 2,000) 23,000
Purchases (Nov 2010 15,000 + Dec 2010 20,000) 35,000
Office Furniture 4,000
Treasury Operations Basics 91
Sales Commissions 12,000
Total Cash Payments 74,000
Change in Cash (4,000)
Beginning Cash 6,000
Borrowing 2,000
Repayments -
Ending Cash 4,000
Treasury Operations Basics 92
End of Document