Embed Size (px)
Citation preview
HAL Id: hal-02090203https://hal-univ-tlse2.archives-ouvertes.fr/hal-02090203
Submitted on 4 Apr 2019
HAL is a multi-disciplinary open accessarchive for the deposit and dissemination of sci-entific research documents, whether they are pub-lished or not. The documents may come fromteaching and research institutions in France orabroad, or from public or private research centers.
L’archive ouverte pluridisciplinaire HAL, estdestinée au dépôt et à la diffusion de documentsscientifiques de niveau recherche, publiés ou non,émanant des établissements d’enseignement et derecherche français ou étrangers, des laboratoirespublics ou privés.
6600 years of earthquake record in the Julian Alps (LakeBohinj, Slovenia)
William Rapuc, Pierre Sabatier, Maja Andrič, Christian Crouzet, FabienArnaud, Emmanuel Chapron, Andrej Šmuc, Anne-Lise Develle, Bruno
Wilhelm, François Demory, et al.
To cite this version:William Rapuc, Pierre Sabatier, Maja Andrič, Christian Crouzet, Fabien Arnaud, et al.. 6600 years ofearthquake record in the Julian Alps (Lake Bohinj, Slovenia). Sedimentology, Blackwell Publishing,2018, 65 (5), pp.1777-1799. �10.1111/sed.12446�. �hal-02090203�
This is an Accepted Article that has been peer-reviewed and approved for publication in the Sedimentology, but has yet to undergo copy-editing and proof correction. Please cite this article as an “Accepted Article”; doi: 10.1111/sed.12444 This article is protected by copyright. All rights reserved.
MR. WILLIAM RAPUC (Orcid ID : 0000-0001-8258-4545)
Article type : Original Manuscript
6600 years of earthquake record in the Julian Alps
(Lake Bohinj, Slovenia)
William Rapuc1,∗, Pierre Sabatier1, Maja Andrič 2, Christian Crouzet3, Fabien Arnaud1,
Emmanuel Chapron4, Andrej Šmuc5, Anne-Lise Develle1, Bruno Wilhelm6, François Demory
7, Jean-Louis Reyss8, Edouard Régnier8, Gerhard Daut9 & Ulrich Von Grafenstein8
1 : EDYTEM, Université Savoie Mont Blanc, CNRS, 7337 Le Bourget du Lac, France. (Email: [email protected]).
2 : ZRC SAZU, Institute of Archaeology, Novi trg 2, 1000 Ljubljana, Slovenia.
3 : ISTerre, Université de Savoie, CNRS, bat. Belledonne, 73376 Le Bourget-du-Lac, France.
4 : GEODE, Université Jean Jaurès, Maison de la Recherche, 31058 Toulouse cedex, France.
5 : Department of Geology, University of Ljubljana, Privoz 11, 1000 Ljubljana, Slovenia
6 : LTHE, Université Grenoble Alpes, 38000 Grenoble, France.
7 : CEREGE, Université Aix-Marseille, CNRS, IRD, Collège de France, Europôle de l'Arbois, BP 80 13545 Aix en Provence,
France.
8 : LSCE, Université de Versailles Saint-Quentin, Commissariat à l’Energie Atomique–CNRS, 91198 Gif-sur-Yvette, France.
9 : Institut für Geographie, Lehrstuhl Physische Geographie, Löbdergraben 32 07743 Jena, Germany.
Associate Editor – Vern Manville
Short Title – Earthquake record in the Julian Alps
This article is protected by copyright. All rights reserved.
ABSTRACT
Sequences of lake sediments often form long and continuous records that may be sensitive
recorders of seismic shaking. A multi-proxy analysis of Lake Bohinj sediments associated with a well-
constrained chronology was conducted to reconstruct Holocene seismic activity in the Julian Alps
(Slovenia). A seismic reflection survey and sedimentological analyses identified 29 homogenite-type
deposits related to mass wasting deposits. The most recent homogenites can be linked to historical
regional earthquakes (i.e. 1348 AD, 1511 AD and 1690 AD) with strong epicentral intensity [greater
than ‘damaging’ (VIII) on the Medvedev–Sponheuer–Karnik scale]. The correlation between the
historic earthquake dataset and the homogenites identified in a core isolated from local stream
inputs, allows interpretation of all similar deposits as earthquake related. This work extends the
earthquake chronicle of the last 6600 years in this area with a total of 29 events recorded. The early
Holocene sedimentary record is disturbed by a seismic event (6617 ± 94 yr cal BP) that reworked
previously deposited sediment and led to a thick sediment deposit identified in the seismic survey.
The period between 3500 to 2000 yr cal BP is characterized by a major destabilization in the
watershed by human activities that led to increases in erosion and sedimentation rates. This change
increased the lake’s sensitivity to recording an earthquake (earthquake-sensitivity threshold index)
with the occurrence of 72 turbidite-type deposits over this period. The high turbidite frequency
identified could be the consequence of this change in lake earthquake sensitivity and thus these
turbidites could be triggered by earthquake shaking, as other origins are discarded. This study
illustrates why it is not acceptable to propose a return period for seismic activity recorded in lake
sediment if the sedimentation rate varies significantly.
This article is protected by copyright. All rights reserved.
KEYWORDS
Earthquake chronicle, Holocene, Julian Alps, lake sediment, lake sensitivity.
INTRODUCTION
The Alps are experiencing the active convergence between the European and African plates at an
average rate of 5.9 mm.yr-1 (Moulin et al., 2014). The associated deformation is localized on active
faults in several regions such as the Julian Alps, which present a set of mostly dextral north-
west/south-east-oriented strike-slip faults (Camassi et al., 2011). This deformation is associated with
north-western Slovenia’s moderate to high seismic activity (European Seismic Hazard Map; Rovida et
al., 2016) that has included several destructive earthquakes, such as the 1511 AD ‘Idrija’ earthquake
(epicentral MSK intensity of X;Fitzko et al., 2005) with a macroseismic epicentral Medvedev–
Sponheur–Karnik (MSK; Medvedev et al. 1964) intensity of X (hereafter Io for epicentral intensity).
Consequently, an accurate assessment of the seismic hazard is required to reduce the high
vulnerability of this region.
The long-term probabilistic seismic hazard can be assessed by using a well-dated and quantitative
earthquake history (Gürpinar, 2005; Mugnier et al., 2013). This is particularly relevant in moderately
active seismic regions, where the instrumental and historical records are too short to cover the
recurrence interval of strong earthquakes (Michetti et al., 2005). The historical seismicity of the
Julian Alps was summarized in the ‘Catalogo Parametrico dei Terremoti Italiani’ (CPTI15; Rovida et
al., 2016), which includes 371 earthquakes since AD 778. However, historical data may be incomplete
to study the tectonic movements at multi-millennial scale to be studied, whereas lake sediments can
provide a continuous record of past earthquakes over several millennia, as shown for instance in
Quebec (Doig, 1990; Doig, 1998), the Andes (Arnaud et al., 2006; Chapron et al., 2007; Moernaut et
al., 2014) and the Alps (Beck, 2009; Chapron et al., 2016; Kremer et al., 2017; Strasser et al., 2013;
This article is protected by copyright. All rights reserved.
Wilhelm et al., 2016). Earthquake shaking may destabilise previously deposited sediment, which
slides to the bottom of the lake in a turbid flow, a cohesive mass flow or a debris flow. These
seismically induced mass wasting deposits (MWD), such as turbidites or homogenites, can be easily
identified and dated to provide a well-documented earthquake chronicle (e.g., Chapron et al., 2016;
Strasser et al., 2006).
Lake Bohinj lies in the centre of the Julian Alps. During the Quaternary, this area was affected by
major north-west/south-east striking faults (Camassi et al., 2011). To reconstruct the earthquake
chronicle, Lake Bohinj sediments were mapped with a seismic reflection survey and cored in 2012 to
provide a 12 m long sedimentary record. A multi-proxy analysis was performed to reconstruct the
long-term earthquake record.
STUDY AREA AND SETTING
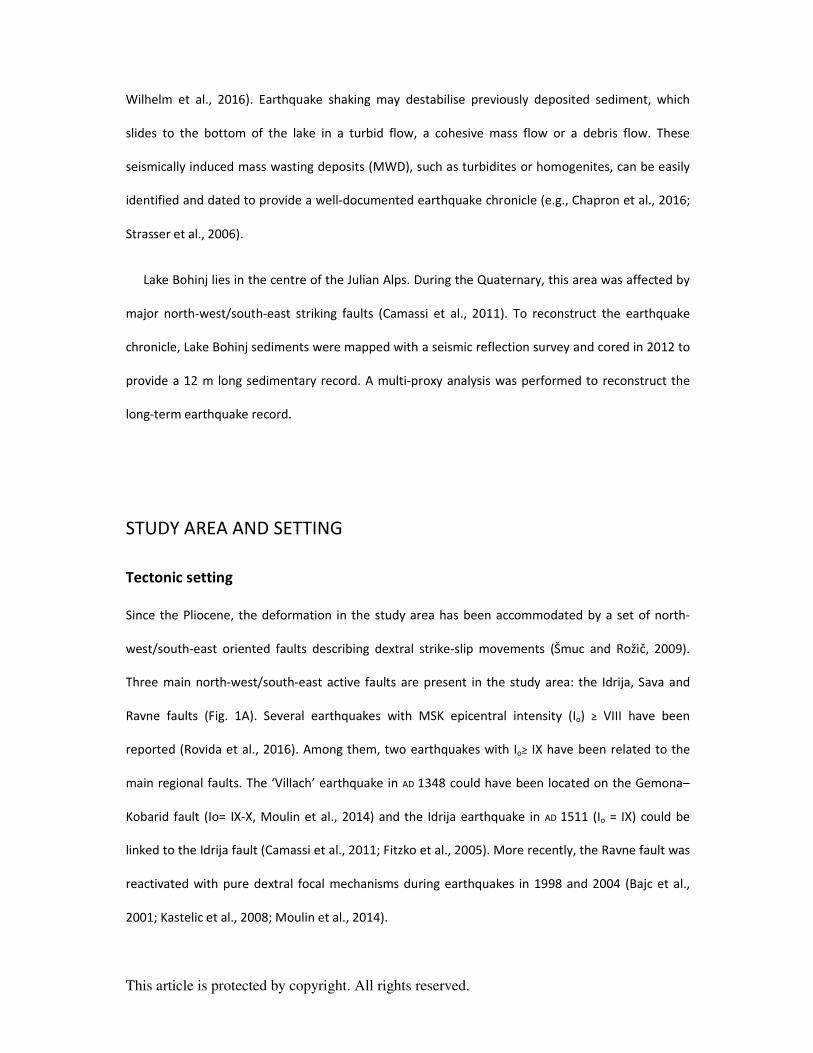
Tectonic setting
Since the Pliocene, the deformation in the study area has been accommodated by a set of north-
west/south-east oriented faults describing dextral strike-slip movements (Šmuc and Rožič, 2009).
Three main north-west/south-east active faults are present in the study area: the Idrija, Sava and
Ravne faults (Fig. 1A). Several earthquakes with MSK epicentral intensity (Io) ≥ VIII have been
reported (Rovida et al., 2016). Among them, two earthquakes with Io≥ IX have been related to the
main regional faults. The ‘Villach’ earthquake in AD 1348 could have been located on the Gemona–
Kobarid fault (Io= IX-X, Moulin et al., 2014) and the Idrija earthquake in AD 1511 (Io = IX) could be
linked to the Idrija fault (Camassi et al., 2011; Fitzko et al., 2005). More recently, the Ravne fault was
reactivated with pure dextral focal mechanisms during earthquakes in 1998 and 2004 (Bajc et al.,
2001; Kastelic et al., 2008; Moulin et al., 2014).
This article is protected by copyright. All rights reserved.
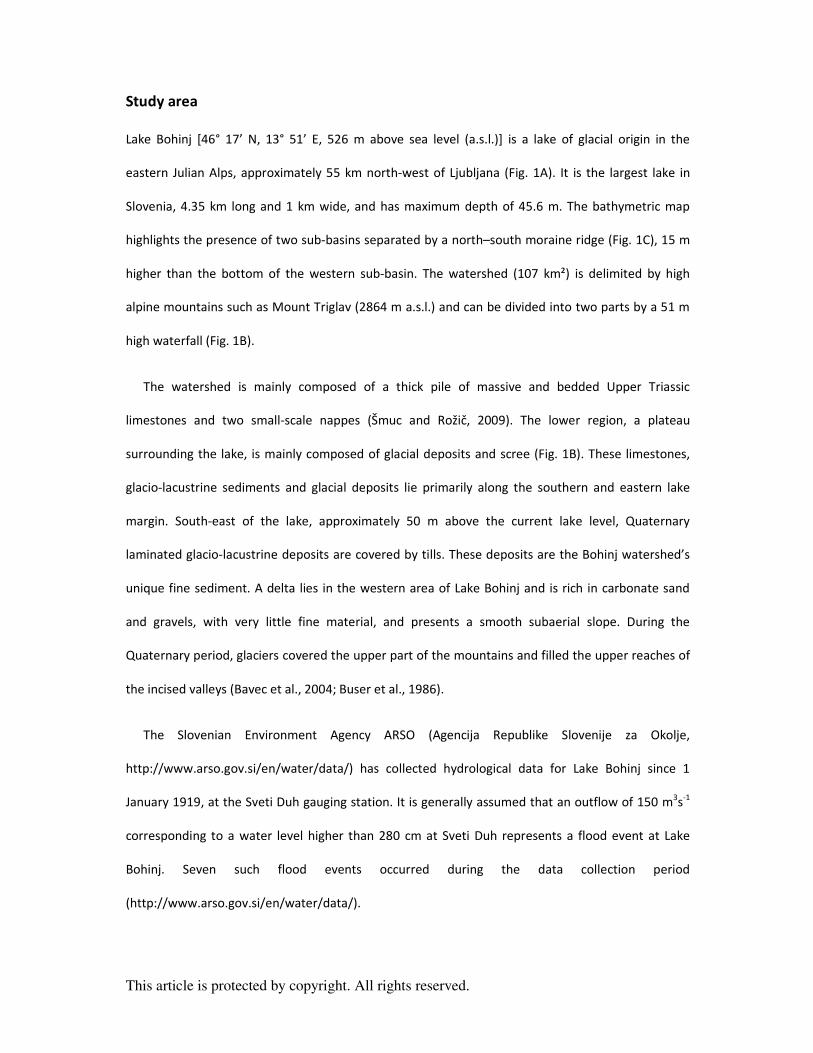
Study area
Lake Bohinj [46° 17’ N, 13° 51’ E, 526 m above sea level (a.s.l.)] is a lake of glacial origin in the
eastern Julian Alps, approximately 55 km north-west of Ljubljana (Fig. 1A). It is the largest lake in
Slovenia, 4.35 km long and 1 km wide, and has maximum depth of 45.6 m. The bathymetric map
highlights the presence of two sub-basins separated by a north–south moraine ridge (Fig. 1C), 15 m
higher than the bottom of the western sub-basin. The watershed (107 km²) is delimited by high
alpine mountains such as Mount Triglav (2864 m a.s.l.) and can be divided into two parts by a 51 m
high waterfall (Fig. 1B).
The watershed is mainly composed of a thick pile of massive and bedded Upper Triassic
limestones and two small-scale nappes (Šmuc and Rožič, 2009). The lower region, a plateau
surrounding the lake, is mainly composed of glacial deposits and scree (Fig. 1B). These limestones,
glacio-lacustrine sediments and glacial deposits lie primarily along the southern and eastern lake
margin. South-east of the lake, approximately 50 m above the current lake level, Quaternary
laminated glacio-lacustrine deposits are covered by tills. These deposits are the Bohinj watershed’s
unique fine sediment. A delta lies in the western area of Lake Bohinj and is rich in carbonate sand
and gravels, with very little fine material, and presents a smooth subaerial slope. During the
Quaternary period, glaciers covered the upper part of the mountains and filled the upper reaches of
the incised valleys (Bavec et al., 2004; Buser et al., 1986).
The Slovenian Environment Agency ARSO (Agencija Republike Slovenije za Okolje,
http://www.arso.gov.si/en/water/data/) has collected hydrological data for Lake Bohinj since 1
January 1919, at the Sveti Duh gauging station. It is generally assumed that an outflow of 150 m3s-1
corresponding to a water level higher than 280 cm at Sveti Duh represents a flood event at Lake
Bohinj. Seven such flood events occurred during the data collection period
(http://www.arso.gov.si/en/water/data/).
This article is protected by copyright. All rights reserved.
MATERIALS AND METHODS
Seismic survey, coring and lithological description In April 2012, a high-resolution seismic reflection survey was conducted on Lake Bohinj, using a
parametric echo-sounder INNOMAR SES-2000 Compact system (Innomar Technologie GmbH,
Rostock, Germany), to define the geometry of the basin fill and optimize the coring site location. A
dense grid of approximately 30 km of profiles (Supporting Fig. 1) was acquired across the lake with a
maximum theoretical resolution of 6 cm using a frequency between 5 kHz and 15 kHz. The wave
speed was defined at 1450 m/s in the water and 1500 m/s in the sediment. Profile positions were
recorded with a GPS device coupled with the seismic acquisition system and seismic data were
digitally recorded (SEG-Y format). In May 2012, a 12 m long sediment core (BO12) was extracted
near the deepest point of Lake Bohinj at a water depth of approximately 44 m (N46° 17’06.8” E13°
51’ 82.6”) using a 90 mm diameter piston corer on a Uwitec coring platform
(EDYTEM/LSCE/CLIMCORE; Uwitec, Mondsee, Austria). This coring site in the eastern basin was
chosen because the seismic profiles showed up to approximately 30 m thick sedimentary deposits
with stratified reflections. In the laboratory, the cores were split, photographed at high resolution
(20 pixels.mm-1) and logged in detail, using the Munsell colour chart, to characterize the different
sedimentary units. A composite profile was constructed using clearly identifiable stratigraphic
marker layers from the overlapping sections of both series, providing a 12.36 m long continuous
sediment profile.
Grain-size analysis Grain-size analyses were performed at the EDYTEM laboratory using a Malvern MasterSizerTM S
(Malvern Instruments Ltd, Worcestershire, UK) with a size range between 0.06 µm and 800 µm. This
analysis was performed with a 5 mm sampling step throughout the uppermost 1.5 m and with the
same sampling step for several sedimentary layers below the first 1.5 m. The sorting values
presented hereafter are equivalent to a standard deviation of the logarithmic method of moments.
This article is protected by copyright. All rights reserved.
Loss on ignition Loss on ignition (LOI) analysis was performed following the protocol of Heiri et al. (2001) on the first
4.6 m of the BO12 sequence with a mean 6 cm sampling step to quantify the organic matter and
carbonate content.
Geochemical properties Geochemical analyses were conducted by X-ray fluorescence (XRF) on the EDYTEM laboratory’s
AVAATECH Core Scanner (Avaatech XRF Technology, Alkmaar, The Netherlands) with a rhodium
anode. To characterize the main variations throughout the BO12 sequence, a 5 mm sampling step
was applied over the whole sequence. The settings used for this analysis were a run at 10 kV and
0.75 mA for 15 s to detect lightweight elements such as Al, Si, K, Ti, Mn and Fe, and a second run at
30 kV and 0.5 mA for 45 s to detect Br, Rb, Sr, Zr and Pb. To describe sedimentary deposits thinner
than 5 mm, a second analysis was executed on the first 3.9 m of the BO12 sequence at 1 mm
resolution with the following settings: a run at 10 kV and 1.2 mA for 10 s and a second run at 30 kV
and 0.75 mA for 45 s. The XRF results were submitted to Principal Component Analysis (PCA) to
determine correlations between the different measured elements and identify principal sediment
end-members (Sabatier et al., 2010a).
At a sub-lamina scale, an energy dispersive spectroscopy method (EDX) was used to investigate
the elementary composition of the sediment. This method is ideal to determine elemental
distributions at a microscopic scale, using a Quantax EDX probe (Bruker, Billerica, MA, USA)
associated with a LEO Stereoscan 440 (Leica Cambridge Ltd, Cambridge, UK) scanning electron
microscope (SEM) with 20 kV tension on resin-embedded slabs. The slabs were sampled on two
cores from the top of the BO12 sequence (BO12_01A, BO12_02A). Each different type of sediment
deposit was observed and described using mapping profiles (59x to 650x magnification) and isolated
acquisition.
This article is protected by copyright. All rights reserved.
Pollen analysis For pollen analysis, a 1 cm3 portion of sediment was subsampled from selected levels of the core
(with sampling resolution of approximately 4 cm) using a metal volumetric subsampler. A standard
laboratory procedure was used – HCl, NaOH, HF, acetolysis, staining with safranine, mounting in
silicone oil (Bennett and Willis, 2002) and the pollen concentration was determined by adding
Lycopodium spores (Stockmarr, 1971). The pollen was identified using a Nikon Eclipse E400 light
microscope (Nikon Instruments, Tokyo, Japan) at 400x magnification using the pollen reference
collection at the Institute of Archaeology ZRC SAZU in Ljubljana and pollen keys (Moore et al., 1991;
Reille, 1992; Reille, 1995). A minimum of 500 pollen grains of terrestrial taxa and spores (= pollen
sum) was counted in each sample, except for silty and sandy layers with very low pollen
concentrations in which the pollen sum was lower. The pollen data were analyzed and plotted using
PSIMPOLL 3.00 software (Bennett, 1998).
Magnetic properties Anisotropy of magnetic susceptibility (AMS) measurements were also conducted on the sediment
core. U-channels were prepared on two cores (BO12_P1; BO12_01C) and sampled with non-
magnetic 2*2*2 cm plastic cubes. Seventy-seven cubes were sampled following this method and 36
cubes were sampled directly from different core sections (BO12_02A; BO12_03C; BO12_01D;
BO12_01E). Measurements were made at the CEREGE laboratory using an AGICO MFK1-FA
Kappabridge (Advanced Geoscience Instruments Company, Brno, Czech Republic). The results of this
analysis are sensitive determinations of the anisotropic component of the susceptibility tensor that
can be represented by a tri-axial ellipsoid with three eigenvectors (Kmax, Kint and Kmin). According to
Jelinek (1981), several different magnetic properties can be extracted from the AMS ellipsoid shape.
As in Campos et al. (2013); Petersen et al. (2014), the four following parameters were used:
This article is protected by copyright. All rights reserved.
(i) Magnetic foliation: F = Kint/Kmin
(ii) Magnetic lineation: L = Kmax/Kint
(iii) Anisotropy degree: P = Kmax/Kmin
(iv) Average susceptibility: Km
The AMS ellipsoid is assumed to reflect the preferred orientation of the magnetic grains in the
sediment. Under normal conditions in sediments, the foliation is parallel to the bedding and the
inclination of Kmin is vertical. The maximum-susceptibility axis, Kmax, and the minimum-susceptibility
axis, Kmin, represent the average orientation of the longest and shortest magnetic grain axes,
respectively (Dall'Olio et al., 2013).
Dating The age–depth model of Lake Bohinj is based on short-lived radionuclides (210Pb, 137Cs and 241Am)
and 14C. Short-lived radionuclide measurements were performed using the well-type germanium
detectors at the Laboratoire Souterrain de Modane (Reyss et al., 1995) on the upper 12 cm of the
BO12 sequence, (BO12_P1) which corresponded to 21 samples following a non-regular 5 mm
sampling step to match the lithography. The 14C measurements were performed on 22 vegetal
macro-organic remains (tree leaves or twigs) at the Poznan Radiocarbon and LMC14 laboratories
(CNRS). The dates were calibrated at 2 sigma using the Intcal13 calibration curve (Reimer et al.,
2013). The age–depth model was performed using the R code package ‘clam’ in R software (Blaauw,
2010).
This article is protected by copyright. All rights reserved.
RESULTS
Seismic stratigraphy
The Lake Bohinj seismic profiles are characterized by a limited penetration of acoustic waves due to
gas-rich sediments (Fig. 1D and Supporting Fig. 1B) approximately 3.0 m and 4.5 m below the lake
floor (blf) in the western and eastern sub-basins, respectively. Only one limited acoustic window
down to approximately 30 m blf (Fig. 1D) was found in the eastern basin and was selected as the
coring location. The coring sites does not lie directly on a profile line and a constant Pwave velocity of
1.5 m.s-1 in water and sediments was applied, so caution is used in interpreting the seismic
stratigraphic results.
Several continuous and high-amplitude reflections within the upper metres of the basin fill are
locally interrupted by transparent to chaotic deposits typical of MWD (cf. Chapron et al., 2007;
Chapron et al., 2016; Strasser et al., 2013). Up to four generations of MWDs are clearly identified
across the eastern sub-basin (labelled ‘A’ to ‘D’ in Fig. 1D) at the edges of the northern, southern and
eastern subaqueous slopes. Unit MWD-A is locally identified at the foot of the northern slopes of the
eastern basin (Fig. 1D) but it essentially reworked the eastern slopes of this sub-basin (Supporting
Fig. 1B) and laterally evolved towards the deepest part of the lake into a transparent acoustic facies
developing onlaps, i.e. a typical acoustic signature for large muddy turbidites or homogenites
(Chapron et al., 1999; Chapron et al., 2016). This MWD-A occurs approximately 50 to 75 cm below
lake floor (blf) near the BO12 coring site. Unit MWD-B is only identified locally at the foot of the
northern slopes of the eastern basin (Fig. 1D) at approximately 90 cm and 115 cm blf near the BO12
coring site. As shown in Fig. 1D, the MWD-C is characterized by two small correlated deposits
(approximately 235 cm blf near BO12) identified at the foot of the northern slopes and in the
eastern basin axis. Unit MWD-D is the largest, approximately 425 to 450 cm blf near BO12 (Fig. 1D)
at a depth corresponding to the top of the largest deposit recorded in the BO12 sedimentary
sequence. The acoustic signal is largely absorbed within the upper part of the MWD-D and thus it is
This article is protected by copyright. All rights reserved.
not possible to map the base or the thickness of this major event deposit across the eastern basin.
All of the identified units appear to originate from the steep northern, southern and eastern slopes
(Fig 1D; Supporting Fig 1B).
Sedimentology
Sedimentary units
The Lake Bohinj sediment core can be subdivided into seven different sedimentary units. Unit I (0
to 119 cm and 330.5 to 440 cm) is mainly composed of very dark grey clay interrupted by a few
white clayey laminae and graded beds. Unit II is a dark grey to bluish grey clayey deposit. Unit III
(132 to 330.5 cm) is characterized by clayey to silty grey graded layers.
The majority of the sedimentary record of Lake Bohinj is Unit IV (443 to 998 cm, Fig. 2, Supporting
Fig. 2) which is composed of several different facies. This Unit starts with an 8.1 cm coarse to very
coarse sandy thick erosive base overlain by a 30 cm thick facies composed of quite homogeneous
coarse silt to very fine grey sand. This facies progressively evolves upward into a heterogeneous pale
yellow facies from 961.3 to 741.3 cm, with a base rich in coarse sand. This 2 m long facies is
interrupted by numerous greyish brown patches rich in organic matter and in silt associated with
some gravels. The transitions between the sandy matrix and the organic patches are chaotic and
widespread. This facies is overlaid by a homogenous silty to clayey facies with a thin erosive base
(741.3 to 446.3 cm). This homogeneous facies is pale yellow until 680 cm and light olive brown after.
A white clayey 3 cm thick cap covers the top of Unit IV (Fig. 2, Supporting Fig. 2).
The lowest portion of the sequence (998 to 1234.3 cm) is composed of several units: a greenish
grey clay Unit V (998.3 to 1034.4 cm) with one grey graded bed, Unit VI (1034.4 to 1170 cm) with
dark grey clayey laminations, and a light grey clay Unit VII (1170 to 1234.3 cm). Except for Unit VII,
the lowest portion of the sedimentary record (Units V and VI) is rarely disturbed by graded beds (Fig.
This article is protected by copyright. All rights reserved.
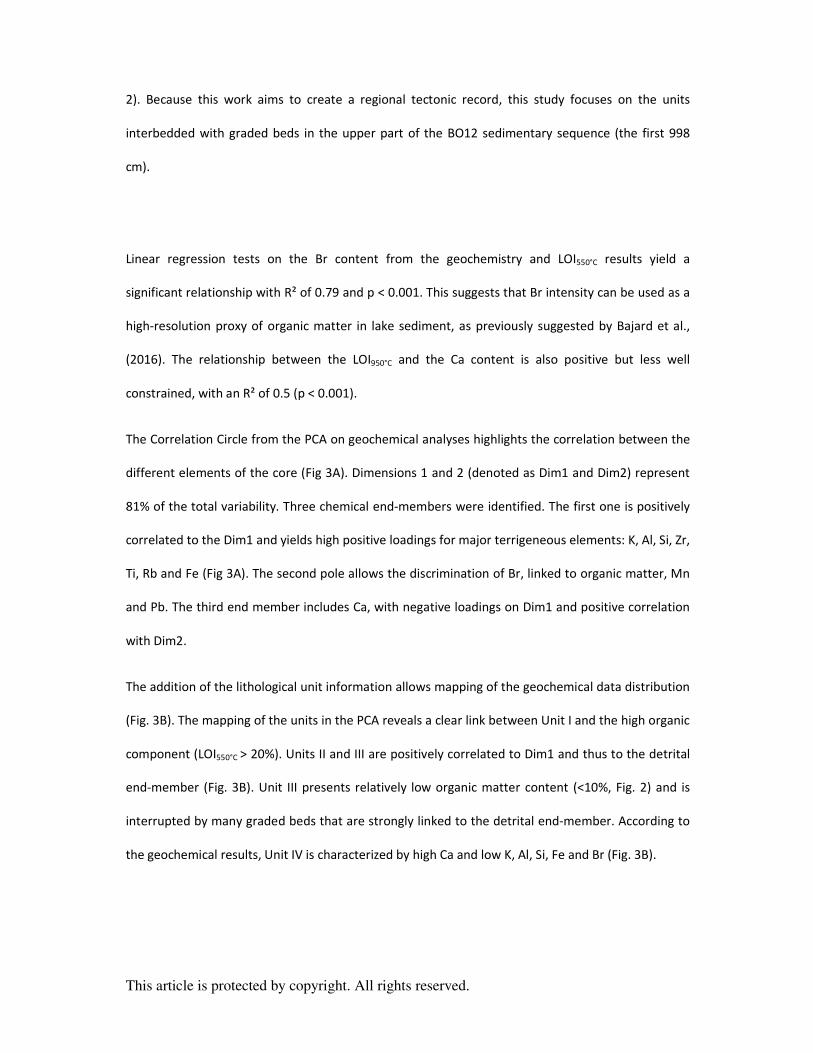
2). Because this work aims to create a regional tectonic record, this study focuses on the units
interbedded with graded beds in the upper part of the BO12 sedimentary sequence (the first 998
cm).
Linear regression tests on the Br content from the geochemistry and LOI550°C results yield a
significant relationship with R² of 0.79 and p < 0.001. This suggests that Br intensity can be used as a
high-resolution proxy of organic matter in lake sediment, as previously suggested by Bajard et al.,
(2016). The relationship between the LOI950°C and the Ca content is also positive but less well
constrained, with an R² of 0.5 (p < 0.001).
The Correlation Circle from the PCA on geochemical analyses highlights the correlation between the
different elements of the core (Fig 3A). Dimensions 1 and 2 (denoted as Dim1 and Dim2) represent
81% of the total variability. Three chemical end-members were identified. The first one is positively
correlated to the Dim1 and yields high positive loadings for major terrigeneous elements: K, Al, Si, Zr,
Ti, Rb and Fe (Fig 3A). The second pole allows the discrimination of Br, linked to organic matter, Mn
and Pb. The third end member includes Ca, with negative loadings on Dim1 and positive correlation
with Dim2.
The addition of the lithological unit information allows mapping of the geochemical data distribution
(Fig. 3B). The mapping of the units in the PCA reveals a clear link between Unit I and the high organic
component (LOI550°C > 20%). Units II and III are positively correlated to Dim1 and thus to the detrital
end-member (Fig. 3B). Unit III presents relatively low organic matter content (<10%, Fig. 2) and is
interrupted by many graded beds that are strongly linked to the detrital end-member. According to
the geochemical results, Unit IV is characterized by high Ca and low K, Al, Si, Fe and Br (Fig. 3B).
This article is protected by copyright. All rights reserved.
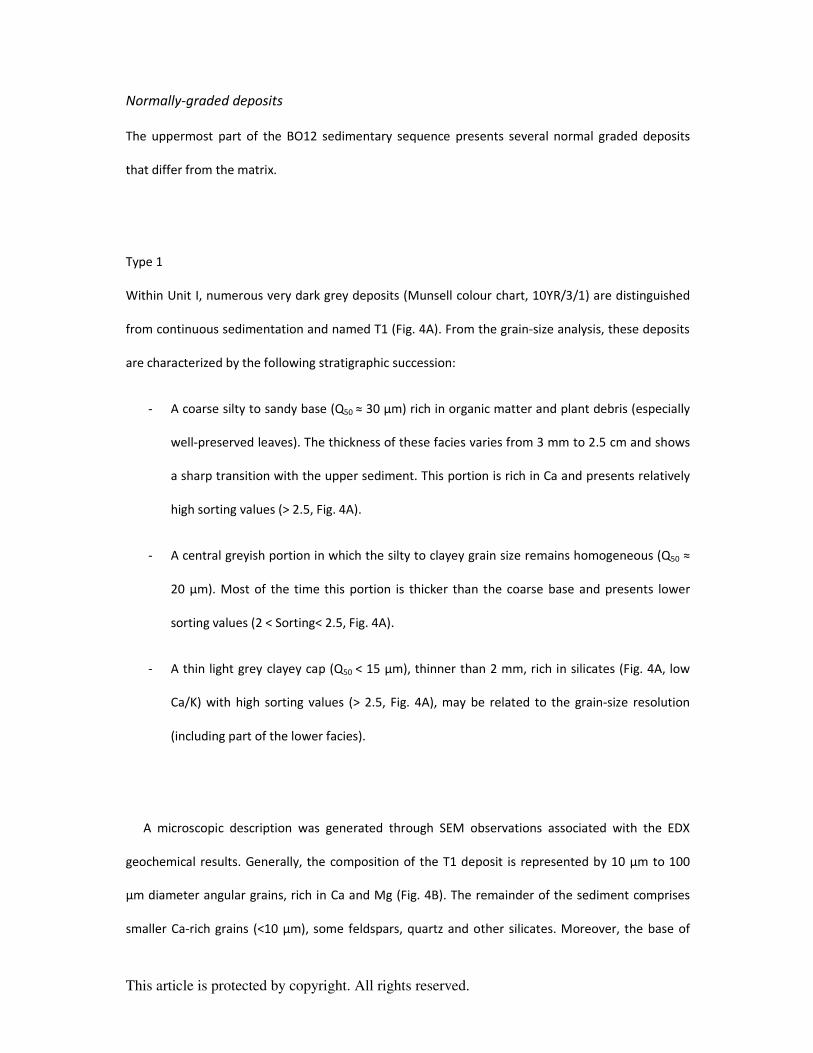
Normally-graded deposits
The uppermost part of the BO12 sedimentary sequence presents several normal graded deposits
that differ from the matrix.
Type 1
Within Unit I, numerous very dark grey deposits (Munsell colour chart, 10YR/3/1) are distinguished
from continuous sedimentation and named T1 (Fig. 4A). From the grain-size analysis, these deposits
are characterized by the following stratigraphic succession:
- A coarse silty to sandy base (Q50 ≈ 30 µm) rich in organic matter and plant debris (especially
well-preserved leaves). The thickness of these facies varies from 3 mm to 2.5 cm and shows
a sharp transition with the upper sediment. This portion is rich in Ca and presents relatively
high sorting values (> 2.5, Fig. 4A).
- A central greyish portion in which the silty to clayey grain size remains homogeneous (Q50 ≈
20 µm). Most of the time this portion is thicker than the coarse base and presents lower
sorting values (2 < Sorting< 2.5, Fig. 4A).
- A thin light grey clayey cap (Q50 < 15 µm), thinner than 2 mm, rich in silicates (Fig. 4A, low
Ca/K) with high sorting values (> 2.5, Fig. 4A), may be related to the grain-size resolution
(including part of the lower facies).
A microscopic description was generated through SEM observations associated with the EDX
geochemical results. Generally, the composition of the T1 deposit is represented by 10 µm to 100
µm diameter angular grains, rich in Ca and Mg (Fig. 4B). The remainder of the sediment comprises
smaller Ca-rich grains (<10 µm), some feldspars, quartz and other silicates. Moreover, the base of
This article is protected by copyright. All rights reserved.
these deposits is erosive. Observations on the continuous sedimentation interval reveal a nearly
identical geochemical composition but with smaller silicates (Fig. 4C). Anisotropy of magnetic
susceptibility (AMS) results show a clear difference in the foliation values observed in these deposits,
F > 1.02 compared with the background sedimentation (F < 1.005). For both cases, the Kmin axis is
quite sub-vertical (75° < Kmin < 90°) and the magnetic lineation does not exceed 1%.
Twenty-eight T1 deposits, with a mean thickness of 27.3 ± 42.5 mm, were identified over the first
443 cm of the sedimentary record and represent 76.3 cm of cumulative depth. Only one such
deposit occurs in Unit III and the others are in Unit I.
Type 2
Type 2 (T2) deposits are characterized by a grey (5Y/5/1) graded bed. These deposits are composed
of a coarse and erosive base composed of silt (Q50 ≈ 30µm) becoming slightly finer until a white
clayey cap (Q50 < 10µm, Fig. 5A). The base of these deposits presents relatively high sorting values (>
2.5, Fig. 5A) comparable to those of T1 deposits bases. Sorting values generally decrease from the
base to the top of T2 deposits.
Detailed SEM observation shows that most of Unit III corresponds to a succession of T2 deposits
with different thicknesses and occasionally interbedded carbonate mud. The T2 deposits are mainly
composed of 10 to 50 µm angular grains, rich in Ca or Ca and Mg with some feldspar and quartz (Fig.
5B). Except for the organic matter content with an LOI550°C < 10%, versus an average of 15% for T1
deposits, the T2 mineralogical composition is similar to that of T1 deposits, indicating the same
sediment sources. The AMS results show a clear fluctuation of foliation values within the deposit
that differentiate them from background sedimentation (Fig. 5A). However, these values remain
close to 1.02 and vary less than previously described for T1, which is probably related to a limited
presence of background sedimentation that narrows the comparison.
This article is protected by copyright. All rights reserved.
Despite the lack of other types of deposits within Unit III, properly listing the entire T2 deposit is
difficult. A minimum thickness of 3 mm was taken to narrow the analysis. Thus, 72 T2 deposits were
identified within the uppermost portion (0 to 436 cm) of the Lake Bohinj sedimentary record, and
only two deposits did not belong to Unit III. The identified T2 deposits present a mean thickness of
11.5 ± 10.7 mm and represents 83.5 cm of cumulative depth. These deposits vary from T1 deposits
by their lighter colour, their graded-bedding and their smaller thickness.
Pollen
The pollen analysis results (Fig. 6) indicate that sediment in Unit I (0 to 119 cm) contains
approximately 60 to 90% tree pollen [beech (Fagus), fir (Abies), and spruce (Picea)] and 9 to 27%
herbs (for example, grasses [Poaceae), cereals (Cerealia), ribwort plantain (Plantago l.), and
goosefoot (Chenopodiaceae)]. The main characteristics of Unit II (119 to 132 cm) and the upper part
of Unit III (132 to 240 cm) are a low pollen concentration (3500 to 5000 grains.cm-3 in most samples)
and a very low percentage of tree taxa (especially Fagus and Quercus at 208 cm). In the lower
portion of Unit III (240 to 330.5 cm), the sediment contains more tree pollen (73 to 95%, mostly
Fagus) and the pollen concentration exceeds 22,000 grains.cm-3. The sediment at 330.5 to 440 cm
contains 81 to 91% tree pollen, with a higher percentage of Picea and a lower percentage of Fagus
than in Unit III (Fig. 6).
Chronology
Short-lived radionuclides
The upper portion of the BO12 sequence (0 to 12 cm) was measured using gamma spectrometry to
build an age depth model based on short-lived radionuclides. The 210Pb excess profile shows a
regular decrease (Fig. 7A) from 1500 mBq.g-1 to low activities (<50 mBq.g-1). The use of a logarithmic
This article is protected by copyright. All rights reserved.
scale to plot these data underscores a well-constrained single-point alignment that shows a constant
sedimentation rate of 0.43±0.013 mm.yr-1 (R² = 0.99) for the upper 5.5 cm. The 137Cs profile shows a
clear peak between 0.5 cm and 1.0 cm with very high activity (>1500 mBq.g-1); this peak is widely
attributed in the literature to nuclear fallout from the 1986 Chernobyl accident (Appleby et al.,
1991). The 241Am profile presents a peak between 1.5 cm and 2.0 cm with moderate 137Cs activity
that can be associated with the maximum nuclear weapon tests in 1963 (Appleby et al., 1991).
Because these two peaks are in agreement with the sedimentation rate derived from the 210Pb
excess profile, they were added to the age–depth model to improve it for the upper portion of the
sedimentary record (Fig. 7B and C).
14C ages and age–depth model
After calibration, seven of the 21 samples 14C ages (Table 1) were not used (in red, Fig. 7B and C) to
build the BO12 sequence age–depth model for the following different reasons: (i) Four of these
outliers were taken into Unit IV and present age inversions (Fig. 7C). This information associated
with the sedimentological description was used to interpret this unit as instantaneous event
reworking of previously deposited sediments (see Discussion section). However, the youngest 14C
date sampled in this deposit was dated to 6544 ± 90 yr cal BP, comparable to the last 14C age
obtained in the background sedimentation at 8 cm from the top of Unit IV (6473 ± 71 yr cal BP). Thus,
the age of 6544 ± 90 yr cal BP was used as the minimum age of Unit IV in the input parameters of the
model. (ii) The two other outliers gave calibrated ages that were obviously too old (at 53.0 cm and
1037.5 cm). The outlier at 53 cm is located in a T1 deposit, and both were probably reworked from
old material. Before generating the age–depth model with the remaining 15 calibrated ages and the
short-lived radionuclide ages, the BO12 sequence sediment depth was corrected by subtracting all of
the deposits, considered to have been deposited instantaneously (i.e. T1 and T2 beds >3 mm thick,
and Unit IV) to build an event-free depth (e.g., Wilhelm et al., 2012). Due to the erosive-base of Unit
This article is protected by copyright. All rights reserved.
IV (9.98 m) a hiatus split the sedimentary sequence in two halves. The upper portion starts from Unit
IV to the top of the sequence. The age of this sequence is forced by the youngest 14C date of Unit IV.
To build a relevant age model, we applied a smooth spline model for this portion (Fig. 7B). In order
to remove any bias from the hiatus, another model was run for the lower part of the sequence, from
the bottom of the core to the base of Unit IV. As this part only hosts two 14C dates, a linear
interpolation model is used here. The global age–depth model is used to date all instantaneous
deposits. The vertical bars represent the age of events thicker than 3 mm and uncertainties (2σ)
resulting from the 14C ages (Fig. 7C).
The first 12 m of the Lake Bohinj sedimentary record covers at least 11,000 years (Fig. 7C). The
polling of the two previous models reveals an erosional hiatus of 3000 years at the bottom of Unit
IV. The sedimentation rate reveals three different periods of sedimentation in the upper part of the
sedimentary record (0 to 443 cm, Fig. 7B): (i) a low sedimentation rate (0.3 to 0.5 mm.yr-1) between
6600 yr and 2900 yr cal BP. Within this interval the sedimentation rate rises slightly towards younger
ages; (ii) the sedimentation rate increases suddenly between 2800 yr and 2100 yr cal BP, reaching
two maxima of 3.2 mm.yr-1 at approximately 2600 yr cal BP and 2.2 mm.yr-1 at 2300 yr cal BP
associated with a decrease to 0.9 mm.yr-1 at approximately 2400 yr cal BP; (c) finally, over the last
2100 years, the sedimentation rate has remained very low and quite stable at approximately 0.5
mm.yr-1. In the period from 2800 to 2100 yr cal BP, the high variability of the sedimentation rate
could be a result of a 14C age plateau (Sabatier et al., 2010b). Between 2350 yr and 2700 yr cal BP, the
calibration curve presents a 14C age plateau caused by a strong increase of 14C production in the
atmosphere at 2750 yr cal BP (Reimer et al., 2013), known as the ‘Hallstatt disaster’. Thus, over this
period, the sedimentation rate obviously increases to the highest of the Bohinj sediment sequence;
however, in the Discussion below, the high sedimentation rate variability in this period was taken
with caution.
This article is protected by copyright. All rights reserved.
DISCUSSION
Identification and triggering mechanisms for sedimentary units and layers
T1 Deposits
For T1 deposits, the grain-size analysis and lithological observation results reveal an internal
depositional structure organized in three distinct parts: a coarse sandy base, a well-developed
homogeneous part, and a clayey top. This stratigraphic succession is characteristic of a ‘homogenite’
type deposits previously defined by (Chapron et al., 1999; Chapron et al., 2016) “as thick
homogeneous mud layers starting with few sand layers”. The thickest T1 deposit (36.1 to 58.5 cm) is
identified on the seismic profile, where it develops a transparent acoustic facies and is laterally
associated with a mass wasting deposit linked to slides on the eastern and northern slopes of Lake
Bohinj (MWD-A, Fig. 1D, Supporting Fig. 1B).
The interpretation of a mass movement origin for T1 deposits is strengthened by: (i) the
observation of well-preserved leaves in the coarse base of these deposits, certainly deposited earlier
on the banks of the lake; (ii) the EDX results that gave an identical composition for these deposits
and the continuous sedimentation with the presence of authigenic carbonate; (iii) the presence of a
too-old 14C age (53 cm, Fig. 7C) in the T1 deposit illustrated in Fig. 4, suggesting reworking of
previously deposited sediment; and (iv) the AMS results with high foliation in T1 deposits compared
to that of continuous sedimentation (Fig. 4) that imply a strong initial segregation from gravity-
reworked sediments associated with the resuspension of fine fraction linked to a seiche effect
(Campos et al., 2013; Chapron, 1999; St-Onge et al., 2008).
Different mechanisms can trigger subaquatic landslides such as MWDs: for example,
earthquakes, spontaneous delta collapses and considerable lake-level changes (Sauerbrey et al.,
2013). The coring site is located in the eastern basin, separated from the western basin and the delta
by a north–south moraine ridge 15 m higher than the bottom of the western basin. This elevation is
This article is protected by copyright. All rights reserved.
supposed high enough to prevent from hyperpycnal flow from the delta and sediment contribution
during delta collapses from entering the eastern basin. Surface water data recorded on Lake Bohinj
show several recent lake level variations greater than 250 cm (Agencija Republike Slovenije Za
Okolje) without any specific deposit in this well-dated period (for example, 10 November 1927, 14
November 1969 and 25 December 2009). This lack of sediment deposition during intense
precipitation events in the watershed confirms that the eastern basin and the coring site are not
influenced by hyperpycnal flows during flood events. As suggested by the rock watershed
composition, no or very few fine sediments (glacio-lacustrine sediments along the southern and
eastern sides of the lake margin) could be mobilized during flood events and trigger flood deposits in
the modern lake system. Here, a slide triggered by earthquake shaking of the lake area is more likely
to produce T1 deposits.
To test the seismic trigger hypothesis for T1 deposits, historical earthquake dates were compared
with the T1 ages. The ages of the three most recent T1, derived from the age–depth model,
correspond to three strong historic earthquakes (Rovida et al., 2016; Supporting Table 1):
(i) The 1348 ‘Villach’ earthquake (MSK IO of IX to X) with an estimated epicentral distance of
76 km, corresponding to a 22.4 cm thick T1 deposit with an estimated age of 1315 ± 52
AD at 36.1 to 58.5 cm depth (Supporting Table 1)
(ii) The 1511 ‘Idrija’ earthquake (MSK IO of X) with an estimated epicentral distance of 35
km. This earthquake corresponds to a 9.8 cm T1 deposit with an estimated age of 1471 ±
42 AD at 20.8 to 30.7 cm depth (Supporting Table 1)
(iii) The 1690 ‘Kaernten’ earthquake (MSK IO of VII to IX) with an estimated epicentral
distance of 39 km, corresponding to a 1 cm T1 deposit (at 15.5 to 16.1 cm depth,
Supporting Table 1) with a less consistent age of 1596 ± 30 AD, probably linked to the
transition between the radionuclides age-model and the 14C dates
This article is protected by copyright. All rights reserved.
Considering these arguments, T1 deposits are interpreted as instantaneous deposits derived from
earthquake-induced mass movements reworking previously deposited sediments.
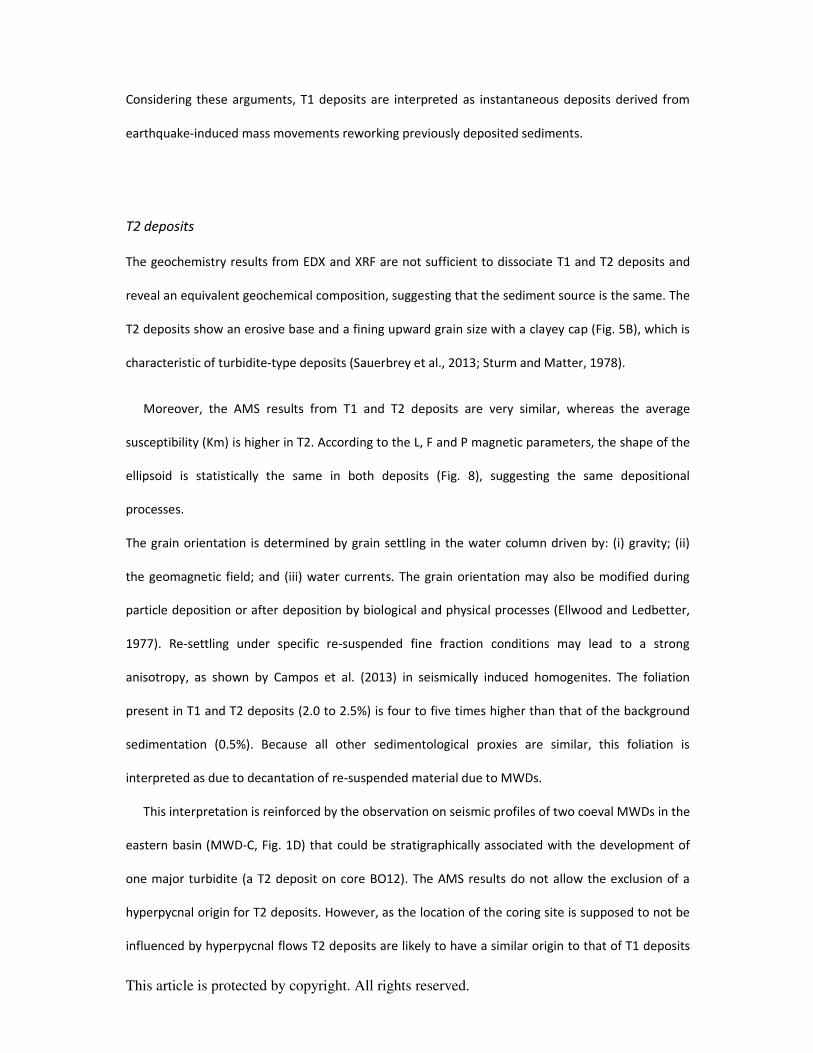
T2 deposits
The geochemistry results from EDX and XRF are not sufficient to dissociate T1 and T2 deposits and
reveal an equivalent geochemical composition, suggesting that the sediment source is the same. The
T2 deposits show an erosive base and a fining upward grain size with a clayey cap (Fig. 5B), which is
characteristic of turbidite-type deposits (Sauerbrey et al., 2013; Sturm and Matter, 1978).
Moreover, the AMS results from T1 and T2 deposits are very similar, whereas the average
susceptibility (Km) is higher in T2. According to the L, F and P magnetic parameters, the shape of the
ellipsoid is statistically the same in both deposits (Fig. 8), suggesting the same depositional
processes.
The grain orientation is determined by grain settling in the water column driven by: (i) gravity; (ii)
the geomagnetic field; and (iii) water currents. The grain orientation may also be modified during
particle deposition or after deposition by biological and physical processes (Ellwood and Ledbetter,
1977). Re-settling under specific re-suspended fine fraction conditions may lead to a strong
anisotropy, as shown by Campos et al. (2013) in seismically induced homogenites. The foliation
present in T1 and T2 deposits (2.0 to 2.5%) is four to five times higher than that of the background
sedimentation (0.5%). Because all other sedimentological proxies are similar, this foliation is
interpreted as due to decantation of re-suspended material due to MWDs.
This interpretation is reinforced by the observation on seismic profiles of two coeval MWDs in the
eastern basin (MWD-C, Fig. 1D) that could be stratigraphically associated with the development of
one major turbidite (a T2 deposit on core BO12). The AMS results do not allow the exclusion of a
hyperpycnal origin for T2 deposits. However, as the location of the coring site is supposed to not be
influenced by hyperpycnal flows T2 deposits are likely to have a similar origin to that of T1 deposits
This article is protected by copyright. All rights reserved.
and to be induced by earthquake shaking. Yet, the high frequency of occurrence of T2 deposits
during a period of lack of T1 deposits appears as a change in sedimentological processes for the
same triggering mechanism. Thus, the origin of these deposits will be discussed separately, and T2
deposits will not be used to reconstruct the evolution of local seismicity.
Unit IV
The different facies of Unit IV are: (i) a coarse sandy base; (ii) a coarse sandy facies interrupted by
patches that are rich in organic matter; (iii) a directly overlying homogenous silty to clayey facies;
and (iv) a thin clayey cap (Fig. 2, Supporting Fig. 2). This sequence presents similarities to the T1
deposits. The lower coarse and erosive facies could correspond to a mass-flow deposit directly
overlain by a homogenite type deposit similar to T1 deposits. The clayey cap is probably linked to a
co-genetic turbid flow. Thus, Unit IV can be considered as a single deposit triggered by a slip of
previously deposited sediment leading to one or several mass-wasting deposits accompanied by a
turbidity flow. Seismic profiles reinforced this interpretation by identifying the top of a main mass
wasting deposit at approximately 450 cm blf at the coring site (MWD-D, Fig. 1D). From lithographic
description and the AMS results (Supporting Fig. 2) the homogeneous portion of Unit IV is
considered to be triggered by a seiche effect. Indeed, this portion shows high and constant foliation
values (comparable to T1 deposits), implying resuspension of the fine fraction linked to a seiche
effect (Campos et al., 2013; Chapron, 1999; St-Onge et al., 2008). The location of the coring site
allows the exclusion of a delta collapse origin for this unit.
Similarities between Unit IV and T1 deposits, associated with the dating results that showed five
age inversions in this unit (Fig. 7C), lead the authors to conclude that Unit IV is an instantaneous
event induced by a nearby and/or high intensity earthquake.
This article is protected by copyright. All rights reserved.
6600 years of sedimentary record
Between 6617 ± 94 yr and 3450 ± 75 yr cal BP, the Lake Bohinj record presents good evidence of a
well-developed mixed forest of Picea, Abies, Fagus and Quercus (443 to 332 cm in Fig. 6) that limited
erosion processes in the watershed and led to low sediment accumulation (Fig. 9). Sediment
deposited on the slope of the lake could easily be reworked by an earthquake. Over this period, 19
T1 deposits occurred, representing a significant portion of the sedimentation (32.2%). At
approximately 3450 ± 75 yr cal BP, an increase in sedimentation rate coupled with a change in forest
composition suggest a modification in the erosion pattern that induced a sharp modification of the
sedimentation and the appearance of the first T2 deposit in Lake Bohinj. This quick transition was
accompanied by a sharp decrease of organic matter input into the lake (Fig. 9) and a change of forest
composition: an increase of Fagus and decrease of Picea and Abies (332 cm; Fig. 6). Between 2900 yr
and 2100 yr cal BP, the sedimentation rate increased suddenly to a maximum of 3.2 mm.yr-1 (2600 yr
cal BP, Fig. 9). Furthermore, pollen results show a decrease of arboreal taxa since 3500 yr cal BP to a
minimum from 2800 to 2400 yr cal BP in the Iron Age, when forest cutting was probably associated
with metallurgical activities (210-73 cm; Fig. 6; Horvat and Stele, 2006; Mohorič, 1969; Ogrin, 2006).
These changes in the watershed imply that the wooded vegetation around the lake decreased (Fig.
9) and that the soil became more easily erodible, resulting in a sedimentation rate increase (Arnaud
et al., 2016; Bajard et al., 2016). The sedimentation rate subsequently decreases until 2050 yr cal BP.
The period since 2050 yr cal BP corresponds to the return of Unit I deposition associated with a sharp
increase of organic matter content (OM > 10%) and a return to a more forested environment (Fig. 9).
During this time, there is a strong decrease in T2 deposits and a return of earthquake recording by
T1 deposits. Thus, the main change induced by human activity in the watershed produced different
instantaneous deposit signatures in the lake sediment (T1 and T2, Fig. 9).
This article is protected by copyright. All rights reserved.
Earthquake record
The Lake Bohinj chronicle starts with the Unit IV deposit (Fig. 7C). With 5.5 m of sediment deposited,
the Unit IV deposit corresponds to the main earthquake-triggered deposit of the Lake Bohinj record.
This earthquake probably led to major geomorphological changes such as rock falls and landslides in
the Lake Bohinj vicinity. For instance, 25 km away, the Bovec Terrace (Fig. 1A) has a base composed
of sub-angular and angular boulders atop palaeo-lake sediments (Bavec et al., 2004; Marjanac et al.,
2001). The sharp transition between lacustrine sediments and the Bovec Terrace is dated at 6590 to
6910 yr cal BP and could coincide with geomorphological aftereffects of the 6617 ± 94 yr cal BP
earthquake recorded in Lake Bohinj sediment.
Although this study allows the analysis of past earthquakes, regional seismicity is not entirely
recorded in Lake Bohinj sediment. Completeness of the earthquake record by earthquake-triggered
mass movement deposits depends on: (i) the distance between the earthquake epicenter and the
lake; (ii) the energy released by the co-seismic rupture; and (iii) lake sediment parameters such as
sediment texture and sedimentation rate (Beck, 2009). These three factors define the sensitivity of a
lake to recording a seismic event. To characterize the sensitivity of Lake Bohinj, the earthquake-
sensitivity threshold index (ESTI) method was applied (Fig. 10A; Wilhelm et al., 2016). Using a
detailed historical record of regional earthquakes (Rovida et al., 2016), epicentral intensity (MSK)
was plotted against the epicentral distance of each regional historic earthquake to the lake (Fig.
10A). As shown above, three historic earthquakes were correlated to the first three T1 deposits.
To calculate the ESTI, an empirical limit was defined that separates recorded from non-recorded
earthquakes in Lake Bohinj sediment (Fig. 10A). For future correlation with previous analogous
studies in the Alps, the same input parameters were used for the sensitivity threshold slope [i.e. a =
1.13 in y = aLn(x)+b]. The ESTI was calculated using the inverse of the intercept of the threshold lines
with the intensity axis at 10 km from the lake (Wilhelm et al., 2016). This index increases with the
lake’s sensitivity to recording an earthquake. The ESTI for Lake Bohinj is estimated at 0.13 ± 0.01 in
This article is protected by copyright. All rights reserved.
agreement with observed trends in Alpine lakes (Fig. 10B; Wilhelm et al., 2016). However, it should
be noted that the ESTI is known to be highly dependent on the sedimentation rate and mode
(Chapron et al., 2016; Wilhelm et al., 2016). The higher the sedimentation rate is, the higher the ESTI
should be; thus, more earthquakes could be recorded. Considering the high variation of the
sedimentation rate along the record (Fig. 9), the sensitivity of Lake Bohinj should change over time,
and thus, the earthquake record should be taken with great caution. Only three out of five historical
seismic events are recorded by Lake Bohinj sediments (Fig. 10A). This could be due to the seismic
historical dataset itself: earthquakes with medium to high epicentral intensities (VI < I0) are defined
by a large rupture area (Wells and Coppersmith, 1994) and not by a single point epicentre. For
instance, if the 1942 earthquake is located some kilometres away from the current position it will be
under the record limit defined by the ESTI (Fig. 10A). Moreover, the lack of deposits triggered by
earthquake shaking between 1690 AD and 2012 AD, despite the 1976 and 1942 earthquakes (Fig.
10A), cannot be explained by a decrease in the sedimentation rate (increase from 0.32 to 0.44
mm.yr-1) but may also be the result of anthropization of the banks of Lake Bohinj, decreasing the
ESTI by stabilizing the shores.
From the 6600 years of sedimentary record, 29 earthquakes were identified and dated through
T1 deposits and Unit IV (Supporting Table 1). This chronicle provides a 224 year ± 257 mean return
period for large earthquakes. However, most of these earthquakes (20 of 29) are recorded before
3500 yr cal BP (Fig. 9). The chronicle shows several time intervals in which local seismic activity was
not recorded in the Lake Bohinj sedimentary sequence (Fig. 9 and Supporting Table 1): (a) between
5150 yr and 4400 yr cal BP; (b) between 3500 yr and 2000 yr cal BP, in which only one T1 deposit is
identified; (c) between 1950 yr and 1400 yr cal BP; and (d) between 1400 yr and 750 yr cal BP. These
low seismic activity intervals can only be explained by a low ESTI or by a period of no earthquake
occurrence.
This article is protected by copyright. All rights reserved.
The lack of T1 deposits between 3500 yr and 2000 yr cal BP (time interval ‘b’, Fig 9) appears while
the sedimentation rate is the highest (maximum value of 3.2 mm.yr-1, mean value of 1.45 mm.yr-1);
thus, earthquakes should be more easily recorded in the sediment sequence. During this period, only
one earthquake is registered by T1 deposits whereas a new type of instantaneous deposit appears
(T2 deposit). A possible explanation is that these T2 deposits, representing the same triggering
processes (see Identification and triggering mechanisms for sedimentary units and layers), could also
be induced by earthquakes during this period of high environmental change. Here, T2 deposits occur
simultaneously with an increase in sedimentation rate and 70 of them are recorded along the
highest sedimentation rate period. As the sedimentation rate increased between 3500 yr and 2000
yr cal BP, there was more sediment deposition on the slopes of the lake that increased Lake Bohinj’s
ESTI, thus more earthquakes could have been recorded.
To test the seismic trigger for T2 deposits, a new ESTI was tested here of approximately 0.18 from
the relation between sedimentation rate and ESTI index (Fig. 10B) over the period between 3500 yr
and 2000 yr cal BP with an average sedimentation rate of 1.45 mm.yr-1. A new threshold line, based
on the ESTI for the period of T2 deposit occurrence was drawn (Fig. 10A). The comparison of this
threshold with the historical dataset highlights the number of seismic events that could have been
recorded in this condition: 22 for approximately 800 years (Fig. 10A), thus an earthquake every 36
years. However, the present authors can consider that the available dataset is better documented
for the last 350 years (Rovida et al., 2016). For this period, 18 events are above the ESTI threshold
line, providing a mean return period of 19 years. Over the period between 3500 yr and 2000 yr cal BP,
72 T2 deposits are recorded in Lake Bohinj sediments, thus an earthquake every 21 years. If it is
hypothesised that the seismic activity remains constant between the last 350 years and the 3500 to
2000 yr cal BP period, the number of T2 deposits is equivalent to the number of historical earthquake
which can theoretically be registered in the lake sediment. Therefore, the increased sensitivity of
Lake Bohinj to record earthquakes due to a sedimentation rate increase could be at the origin of T2
deposits. This strictly hypothetical assumption illustrates well the effect of an ESTI modification:
This article is protected by copyright. All rights reserved.
when an ESTI is increased even slightly, due to a sedimentation rate change, the number of seismic
events recorded by Lake Bohinj increases considerably. Thus, it is not acceptable to propose a return
period for seismic activity recorded in lake sediment if the sedimentation rate significantly varies
along the record.
Over the period between 3500 yr and 2000 yr cal BP, the pollen diagram (Fig 6) indicates that
grassland increased despite forest cover (Fig. 9), which increased the soil’s erodibility (Arnaud et al.,
2016; Bajard et al., 2016). Because the soils are less protected by vegetation cover, they are more
sensitive to erosion and sediment could be carried into the lake and easily reworked during a seismic
event. Thus, T2 deposits or at least a major portion of T2 deposits are probably linked to
earthquakes; however, because the modification of deposit type for the same triggering mechanism
is not well understood, T2 deposits are not included in the earthquake chronicle. If T2 deposits are
not triggered by an earthquake, the lack of earthquake recording in Lake Bohinj sediment during this
1500 year long period must be linked to a gap of regional earthquakes and appears difficult to
explain.
For the three other low local seismic activity intervals (‘a’, ‘c’ and ‘d’), no sedimentological
argument was found that could explain a decrease in the lake’s sensitivity to recording earthquakes.
Although the sedimentation rate is low (>0.5 mm.yr-1) in these time periods, it is comparable with
the rate during periods of high seismic activity recorded in Lake Bohinj sediment (Fig. 9). Moreover,
there is no remarkable change in either the sedimentation processes or the pollen diagram. Thus,
these intervals could be due to the absence of major earthquakes in the Lake Bohinj vicinity.
This article is protected by copyright. All rights reserved.
Finally, it should be noted that this record does not allow calculation of past earthquake intensity
using the T1 deposit thickness. For instance, the 1348 ‘Villach’ and 1511 ‘Idrija’ earthquakes are 22.4
cm and 9.9 cm thick, respectively, with an equivalent epicentral intensity and an estimated distance
of 76 km and 35 km, respectively. The period between earthquakes is probably too short to allow a
reloading of sediment on slopes and shores of Lake Bohinj to provide a sufficient amount of
sediment to feed the second earthquake-induced sediment deposit.
Thus, this earthquake chronicle is not exhaustive and probably does not record earthquakes of
the same intensity over time due to sedimentation rate changes. However, it is the first Holocene
earthquake calendar in this area and should be correlated to other lake sediment records in this area
to: (i) improve the location precision; (ii) record more regional earthquakes without lake-specific
sediment process dynamics; and (iii) estimate the intensity of past seismic events.
CONCLUSION
This study is the first detailed earthquake chronicle over the last 6600 years in the Julian Alps.
Twenty-nine earthquakes are recorded by homogenite-type deposits in Lake Bohinj sediments and
the last three deposits are linked to three main historic regional earthquakes (1348 AD, 1511 AD and
1690 AD). The chronicle begins with a potential seismic event that occurred at approximately 6617 ±
94 yr cal BP and led to a 5.55 m thick mass wasting deposit at the coring site. This major event
probably induced important geomorphological changes at a local scale.
The regional seismic activity recorded by a lake is highly connected to earthquake settings,
distance and the lake’s sensitivity to recording a seismic event (ESTI), which is related to the
sedimentation rate. The Bohinj earthquake chronicle presents several time intervals with no local
seismic activity recorded by homogenite-type deposits. One such interval (3500 to 2000 yr cal BP) is
also characterized by a major destabilization in the watershed by human activities that led to
This article is protected by copyright. All rights reserved.
increases in erosion and the sedimentation rate. This period coincides with the appearance of
turbidite-type deposits, presenting the same geochemical and magnetic properties as homogenite-
type deposits. The increasing sedimentation rate led to an increase in the ESTI, which suggests that
more earthquakes should have been recorded. The high turbidite rate identified could be the
consequence of this sensitivity increase and thus these turbidites could be triggered by earthquakes.
Between 1690 AD and 2012 AD, human activity in the watershed probably decreased the lake’s
sensitivity and prevented the recording of seismic events. For the three other intervals (5150 to
4400 yr cal BP; 1950 to 1400 yr cal BP; 1400 to 750 yr cal BP) there is no argument in favour of
environmental changes in the watershed that may have led to changes in the sedimentation rate or
sedimentation processes. Therefore, these periods could be linked to the lack of major seismic
events during this time. Due to the regional tectonic regime, determining a specific link between
earthquakes and faults is very difficult, but this lake-based palaeoseismological study could improve
the long-term regional tectonic knowledge of this high seismic activity region of the Alps. However, if
a sedimentary sequence presents a variable sedimentation rate, and thus variable ESTI, it is
impossible to present a mean return period for seismic activity recorded by the lake system.
ACKNOWLEDGEMENTS
We thank the Laboratoire Souterrain de Modane (France) for the gamma spectrometry
measurements and EDYTEM (Environnement, Dynamique et Territoires de Montagne, France) for
the X-ray fluorescence analyses. We are grateful to ARSO (Slovenian Environmental Agency) for
permission (No. 35620-1078/2012-6) to core Lake Bohinj and to Robert Jensterle for help with the
seismic reflection survey. D. Valoh, J. Dirjec, S. von Grafenstein, S. Kuharič and M. Zaplatil helped
with coring. R. Trček (ARSO) helped with interpreting hydrological data collected at Sveti Duh
gauging station. Coring was funded by INSU (Institut National des sciences de l’Univers, CNRS,
France) and CEA (Commissariat à l’Energie Atomique et aux Energies Altérnatives) through Mistrals
(Paleomex). The pollen analysis was funded by the Slovenian Research Agency (ARRS, Research
This article is protected by copyright. All rights reserved.
programme P6-0064, Archaeological research 2015-2021). The authors wish to thank the Chief
Editor Dr. Nigel Mountney, the Associate Editor Dr. Vern Manville and the two anonymous reviewers
for their comments which greatly improved the original manuscript.
REFERENCES
Agencija Republike Slovenije za okolje, http://www.arso.gov.si/en/water/data/
Appleby, P.G., Richardson, N. and Nolan, P.J. (1991) 241Am dating of lake sediments. In: Environmental History and Palaeolimnology (Eds J.P. Smith, P.G. Appleby, R.W. Battarbee, J.A. Dearing, R. Flower, E.Y. Haworth, F. Oldfield and P.E. O’Sullivan), Developments in Hydrobiology, pp. 35-42. Springer Netherlands. Arnaud, F., Magand, O., Chapron, E., Bertrand, S., Boës, X., Charlet, F. and Mélières, M.-A. (2006) Radionuclide dating (210Pb, 137Cs, 241Am) of recent lake sediments in a highly active geodynamic setting (Lakes Puyehue and Icalma—Chilean Lake District). Science of The Total Environment, 366, 837-850. Arnaud, F., Poulenard, J., Giguet-Covex, C., Wilhelm, B., Révillon, S., Jenny, J.-P., Revel, M., Enters, D., Bajard, M., Fouinat, L., Doyen, E., Simonneau, A., Pignol, C., Chapron, E., Vannière, B. and Sabatier, P. (2016) Erosion under climate and human pressures: An alpine lake sediment perspective. Quaternary Science Reviews, 152, 1-18. Bajard, M., Sabatier, P., David, F., Develle, A.-L., Reyss, J.-L., Fanget, B., Malet, E., Arnaud, D., Augustin, L., Crouzet, C., Poulenard, J. and Arnaud, F. (2016) Erosion record in Lake La Thuile sediments (Prealps, France): Evidence of montane landscape dynamics throughout the Holocene. The Holocene, 26, 350-364. Bajc, J., Aoudia, A., Saraò, A. and Suhadolc, P. (2001) The 1998 Bovec-Krn Mountain (Slovenia) Earthquake Sequence. Geophysical Research Letters, 28, 1839-1842. Bavec, M., Tulaczyk, S.M., Mahan, S.A. and Stock, G.M. (2004) Late Quaternary glaciation of the Upper Soča River Region (Southern Julian Alps, NW Slovenia). Sedimentary Geology, 165, 265-283. Beck, C. (2009) “Late Quaternary lacustrine paleo-seismic archives in north-western Alps: Examples of earthquake-origin assessment of sedimentary disturbances”. Earth-Science Reviews, 96, 327-344. Bennett, K.D. (1998) Documentation for psimpoll 3.01 and pscomb 1.03. University of Cambridge, Cambridge, UK. Bennett, K.D. and Willis, K.J. (2002) Pollen. In: Tracking environmental change using lake sediments, pp. 5–32. Springer. Blaauw, M. (2010) Methods and code for ‘classical’age-modelling of radiocarbon sequences. quaternary geochronology, 5, 512–518. Buser, S., Aničić, B., Cajhen, J., Ciglar, K., Ferjančič, L., Jurkovšek, B., Mlakar, I., Novak, D., Petrica, R. and Toman, M. (1986) Osnovna geološka karta SFRJ, list Tolmin, 1: 100 000. Zvezni geološki zavod., Beograd. Camassi, R., Caracciolo, C.H., Castelli, V. and Slejko, D. (2011) The 1511 Eastern Alps earthquakes: a critical update and comparison of existing macroseismic datasets. Journal of Seismology, 15, 191–213. Campos, C., Beck, C., Crouzet, C., Demory, F., Van Welden, A. and Eris, K. (2013) Deciphering hemipelagites from homogenites through anisotropy of magnetic susceptibility. Paleoseismic implications (Sea of Marmara and Gulf of Corinth). Sedimentary Geology, 292, 1-14.
This article is protected by copyright. All rights reserved.
Chapron, E. (1999) Contrôles climatique et sismo-tectonique de la sédimentation lacustre dans l'Avant-Pays Alpin (lac du Bourget, Léman) durant le Quaternaire récent, Laboratoire de géologie de l'Université Joseph Fourier. Chapron, E., Beck, C., Pourchet, M. and Deconinck, J.-F. (1999) 1822 earthquake-triggered homogenite in Lake Le Bourget (NW Alps). Terra Nova, 11, 86-92. Chapron, E., Juvigné, E., Mulsow, S., Ariztegui, D., Magand, O., Bertrand, S., Pino, M. and Chapron, O. (2007) Recent clastic sedimentation processes in Lake Puyehue (Chilean Lake District, 40.5 S). Sedimentary Geology, 201, 365–385. Chapron, E., Simonneau, A., Ledoux, G., Arnaud, F., Lajeunesse, P. and Albéric, P. (2016) French Alpine Foreland Holocene Paleoseismicity Revealed by Coeval Mass Wasting Deposits in Glacial Lakes. In: Submarine Mass Movements and their Consequences, pp. 341–349. Springer. Dall'Olio, E., Felletti, F. and Muttoni, G. (2013) Magnetic-fabric analysis as a tool to constrain mechanisms of deep-water mudstone deposition in the Marnoso Arenacea Formation (Miocene, Italy). Journal of Sedimentary Research, 83, 170–182. Doig, R. (1990) 2300 yr history of seismicity from silting events, in Lake Tadoussac, Charlevoix, Quebec. Geology, 18, 820–823. Doig, R. (1998) 3000-year paleoseismological record from the region of the 1988 Saguenay, Quebec, earthquake. Bulletin of the Seismological Society of America, 88, 1198–1203. Ellwood, B.B. and Ledbetter, M.T. (1977) Antarctic bottom water fluctuations in the Vema Channel: effects of velocity changes on particle alignment and size. Earth and Planetary Science Letters, 35, 189–198. Fitzko, F., Suhadolc, P., Aoudia, A. and Panza, G.F. (2005) Constraints on the location and mechanism of the 1511 Western-Slovenia earthquake from active tectonics and modeling of macroseismic data. Tectonophysics, 404, 77–90. Gürpinar, A. (2005) The importance of paleoseismology in seismic hazard studies for critical facilities. Tectonophysics, 408, 23–28. Heiri, O., Lotter, A.F. and Lemcke, G. (2001) Loss on ignition as a method for estimating organic and carbonate content in sediments: reproducibility and comparability of results. Journal of paleolimnology, 25, 101–110. Horvat, J. and Stele, F. (2006) Arheološki sledovi v slovenskem visokogorju. Človek v Alpah, 21-40. Jelinek, V. (1981) Characterization of the magnetic fabric of rocks. Tectonophysics, 79, T63–T67. Kastelic, V., Vrabec, M., Cunningham, D. and Gosar, A. (2008) Neo-Alpine structural evolution and present-day tectonic activity of the eastern Southern Alps: the case of the Ravne Fault, NW Slovenia. Journal of structural geology, 30, 963–975. Kremer, K., Wirth, S.B., Reusch, A., Fäh, D., Bellwald, B., Anselmetti, F.S., Girardclos, S., Strasser, M. (2017). Lake-sediment based paleoseismology: Limitations and perspectives from the Swiss Alps. Quat. Sci. Rev., 168, 1–18. Marjanac, T., Marjanac, L., Poljak, M., Živčič, M. and Bavec, M. (2001) Srpenica seismites indicators of paleoseismicity in the Upper Soča valley, NW Slovenia. Geologija, 44, 341–350. Michetti, A.M., Marco, S. and others (2005) Future trends in paleoseismology: Integrated study of the seismic landscape as a vital tool in seismic hazard analyses. Tectonophysics, 408, 3–21. Moernaut, J., Daele, M.V., Heirman, K., Fontijn, K., Strasser, M., Pino, M., Urrutia, R. and De Batist, M. (2014) Lacustrine turbidites as a tool for quantitative earthquake reconstruction: New evidence for a variable rupture mode in south central Chile. Journal of Geophysical Research: Solid Earth, 119, 1607–1633. Mohorič, I.I. (1969) Dva tisoč let železarstva na Gorenjskem. Mladinska knjiga. Moore, P.D., Webb, J.A., Collison, M.E. and others (1991) Pollen analysis. Blackwell scientific publications. Moulin, A., Benedetti, L., Gosar, A., Rupnik, P.J., Rizza, M., Bourlès, D. and Ritz, J.-F. (2014) Determining the present-day kinematics of the Idrija fault (Slovenia) from airborne LiDAR topography. Tectonophysics, 628, 188–205.
This article is protected by copyright. All rights reserved.
Mugnier, J.-L., Gajurel, A., Huyghe, P., Jayangondaperumal, R., Jouanne, F. and Upreti, B. (2013) Structural interpretation of the great earthquakes of the last millennium in the central Himalaya. Earth-Science Reviews, 127, 30–47. Ogrin, M. (2006) Arheološke raziskave v Julijskih Alpah: Bohinj in Blejski kot (Archaeological research in the Julian Alps: Bohinj and Bled area.) In: Cevc T (ed.) Človek v Alpah. Der Mensch in den Alpen, 96–110. Petersen, J., Wilhelm, B., Revel, M., Rolland, Y., Crouzet, C., Arnaud, F., Brisset, E., Chaumillon, E. and Magand, O. (2014) Sediments of Lake Vens (SW European Alps, France) record large-magnitude earthquake events. Journal of paleolimnology, 51, 343–355. Reille, M. (1992) Pollen et spores d’Europe et d’Afrique du nord: Laboratoire de botanique historique et palynologie. URA CNRS, Marseille, France. Reille, M. (1995) Pollen et spores d'Europe et d'Afrique du Nord: supplement 1. Marseille: Laboratoire de Botanique Historique et Palynologie 274p.-illus.. ISBN 2950717519 Fr Icones. Palynology (KR, 199504196). Reimer, P.J., Bard, E., Bayliss, A., Beck, J.W., Blackwell, P.G., Bronk Ramsey, C., Buck, C.E., Cheng, H., Edwards, R.L., Friedrich, M. and others (2013) IntCal13 and Marine13 radiocarbon age calibration curves 0-50,000 years cal BP. Reyss, J.-L., Schmidt, S., Legeleux, F. and Bonté, P. (1995) Large, low background well-type detectors for measurements of environmental radioactivity. Nuclear Instruments and Methods in Physics Research Section A: Accelerators, Spectrometers, Detectors and Associated Equipment, 357, 391–397. Rovida, A., Locati, M., Camassi, R., Lolli, B. and Gasperini, P. (2016) Catalogo Parametrico dei Terremoti Italiani, versione CPTI15. Istituto Nazionale di Geofisica e Vulcanologia (INGV). Sabatier, P., Dezileau, L., Briqueu, L., Colin, C. and Siani, G. (2010a). Clay minerals and geochemistry record from Northwestern Mediterranean coastal lagoon sequence : Implications for paleostorm reconstruction. Sedimentary Geology. 228, 205-217. Sabatier, P., Dezileau, L., Blanchemanche, P., Siant, G., Condomines, M., Bentaleb, I. and Piquès, G. (2010b) Holocene variations of radiocarbon reservoir ages in a Mediterranean lagoonal system. Radiocarbon, 52, 91. Sauerbrey, M.A., Juschus, O., Gebhardt, A.C., Wennrich, V., Nowaczyk, N.R. and Melles, M. (2013) Mass movement deposits in the 3.6 Ma sediment record of Lake El’gygytgyn, Far East Russian Arctic. Climate of the Past, 9, 1949–1967. Šmuc, A. and Rožič, B. (2009) Tectonic geomorphology of the Triglav Lakes Valley (easternmost Southern Alps, NW Slovenia). Geomorphology, 103, 597–604. St-Onge, G., Chapron, E., Guyard, H., Rochon, A., Lajeunesse, P., Locat, J., Scott, D., Stoner, J.S. and Hillaire-Marcel, C. (2008) High-resolution physical and magnetic properties of rapidly deposited layers associated with landslides, earthquakes and floods. Locat, J.(Éd.) Geohazards. Presses de l’Université Laval, Québec, Canada. Stockmarr, J. (1971) Tablets with spores used in absolute pollen analysis. Pollen et spores. Strasser, M., Anselmetti, F.S., Fäh, D., Giardini, D. and Schnellmann, M. (2006) Magnitudes and source areas of large prehistoric northern Alpine earthquakes revealed by slope failures in lakes. Geology, 34, 1005–1008. Strasser, M., Monecke, K., Schnellmann, M. and Anselmetti, F.S. (2013) Lake sediments as natural seismographs: A compiled record of Late Quaternary earthquakes in Central Switzerland and its implication for Alpine deformation. Sedimentology, 60, 319–341. Sturm, M. and Matter, A. (1978) Turbidites and varves in Lake Brienz (Switzerland): deposition of clastic detritus by density currents. Wiley Online Library. Wilhelm, B., Arnaud, F., Sabatier, P., Crouzet, C., Brisset, E., Chaumillon, E., Disnar, J.-R., Guiter, F., Malet, E., Reyss, J.-L. and others (2012) 1400years of extreme precipitation patterns over the Mediterranean French Alps and possible forcing mechanisms. Quaternary Research, 78, 1–12. Wilhelm, B., Nomade, J., Crouzet, C., Litty, C., Sabatier, P., Belle, S., Rolland, Y., Revel, M.,
This article is protected by copyright. All rights reserved.
Courboulex, F., Arnaud, F. and others (2016) Quantified sensitivity of small lake sediments to record historic earthquakes: implications for paleoseismology. Journal of Geophysical Research: Earth Surface, 121,2–16. Wilhelm, B., Vogel, H., Anselmetti, F.S., (2017). A multi-centennial record of past floods and earthquakes in Valle d’Aosta, Mediterranean Italian Alps. Nat. Hazards Earth Syst. Sci. 17, 613.
FIGURE CAPTIONS
Fig. 1- General presentation of the study site. (A) Location of the study area with the major strike-slip
faults and major historical earthquakes, modified from Moulin et al., 2014. (B) Geological map of the
Lake Bohinj watershed. (C) Bathymetric map of Lake Bohinj. (D) Seismic profile oriented across the
eastern basin showing the coring site location and four generations of mass wasting deposits (MWD,
red shading). The depth of the seismic profile is expressed in metres below lake surface (m bls),
assuming a mean Pwave velocity of 1.5 m.s-1 in water and sediments.
Fig. 2- Main sedimentological and geochemical results. A close-up view of the seismic profile (Fig.
1D) section is compared with lithological and geochemical results (Ti, Br and Ca contents) associated
with the BO12 sequence LOI 550° (dark-grey dots) and LOI 950° (light-grey dots). The presented
stratigraphy is described in the lithological description of the sediment sequence (see Sedimentary
units section). The depth of the seismic section is expressed in metres below lake surface (m bls),
and is scaled approximately to fit with the length of the sediment core. The depth of MWDs
identified in the seismic profile (Fig. 1D) are reported against the lithological results using a black
line.
Fig. 3- Variable and Individual factor maps from the principal component analysis (PCA). (A) Variable
factor map with three endmembers (terrigeneous, organic matter and carbonates). (B) Individual
factor map with sedimentological units added as an illustrative variable.
This article is protected by copyright. All rights reserved.
Fig. 4- Detailed results for T1 deposits. (A) Anisotropy of magnetic susceptibility (AMS) results (Inc
Kmin, lineation, and foliation) with Ti content and grain size parameters for T1 deposit identification:
sorting, median (µm) and grain size matrix (µm, colour range in %). (B) Energy dispersive
spectroscopy (EDX) cartography of the elementary composition of the sediment in a T1 deposit. (C)
EDX cartography of the elementary composition of the sediment at the boundary of a T1 deposit and
the continuous sedimentation.
Fig. 5- Detailed results for T2 deposits. (A) T2 deposit identification within Unit III using anisotropy of
magnetic susceptibility (AMS) results (Inc Kmin, lineation and foliation), Ti content, sorting, median
(µm) and grain size (µm, colour range in %). (B) Energy dispersive spectroscopy method (EDX)
cartography of the elementary composition of the sediment at the boundary of a T2 deposit and the
continuous sedimentation.
Fig. 6- Pollen diagram. Lithological description of the upper 5 m of Lake Bohinj sedimentary
sequence associated with the results of the three main arboreal species, three human-linked
species, pollen concentration, charcoal concentration, and an area chart presenting the sum of trees
and shrubs, herbs, spores and aquatic species (less than 1%).
Fig. 7- Age–depth models. (A) Short-lived radionuclide data with the 210Pb excess in logarithmic scale
associated with the 241Am and 137Cs profiles. (B) Age–depth model in event-free depth with the mean
sedimentation rate. (C) Age–depth model from radiocarbon and short-lived radionuclide dates.
Fig. 8- Anisotropy of magnetic susceptibility (AMS) results. (A) Stereographic projection of the AMS
axes for the different deposits discussed. (B) Flinn diagram (L/F) showing the strong oblate shape of
the AMS ellipsoid for T1 and T2 deposits.
This article is protected by copyright. All rights reserved.
Fig. 9- Comparison between the organic input dynamic (Br), T2 and T1 frequency with major
historical earthquakes and the mean sedimentation rate. The anthropogenic impact and the
evolution of the watershed are interpreted from the pollen diagram (Fig. 6). Grey shading
corresponds to intervals with potential higher earthquake-sensitivity threshold index (ESTI).
Fig. 10- Earthquake-sensitivity threshold index (ESTI) estimation for Lake Bohinj. (A) Lake Bohinj
sequence results associated with CPTI15 data. Blue diamonds show earthquakes that did not
generate mass movements in the Lake Bohinj sequence, orange diamonds show earthquakes that
generated mass movement deposits. The green line represents the limit of Lake Bohinj sensitivity to
earthquakes calculated for the historical period. The red dotted line represents the hypothetical
limit of Lake Bohinj sensitivity with an ESTI of 0.18 calculated for the mean sedimentation rate over
the period of 3500 to 2000 yr cal BP, unique period with T2 deposits. (B) The ESTI versus
sedimentation rate for Lake Bohinj (green) over the last centuries with previous results (black) from
Wilhelm et al. (2016). The red cross corresponds to the ESTI and sedimentation rate for the period of
T2 deposits (3500 to 2000 yr cal BP). This diagram suggests that a significant increase (decrease) of
the sedimentation rate appears to be the dominant factor resulting in an increase (decrease) of the
ESTI. BAR: Lake Blanc Aiguilles Rouges, ANT: Lake Anterne, BRE: Lake Brévent, BLB: Lake Blanc
Belledonne, DOS: Lake Grand Doménon, LAF: Lake Laffrey, FOR: Lake Foréant, PET: Lake Petit and
BOH: Lake Bohinj (Wilhelm et al., 2016); LIL: Lake Inferiore de Laures (Wilhelm et al., 2017).
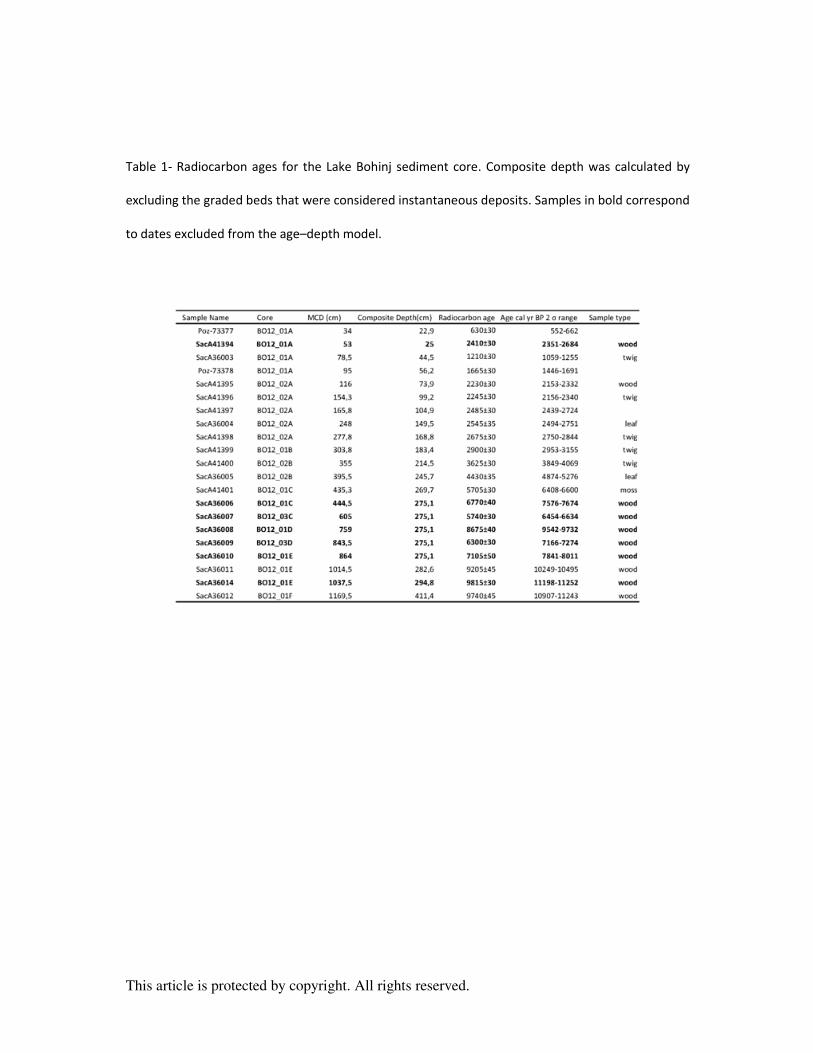
This article is protected by copyright. All rights reserved.
Table 1- Radiocarbon ages for the Lake Bohinj sediment core. Composite depth was calculated by
excluding the graded beds that were considered instantaneous deposits. Samples in bold correspond
to dates excluded from the age–depth model.
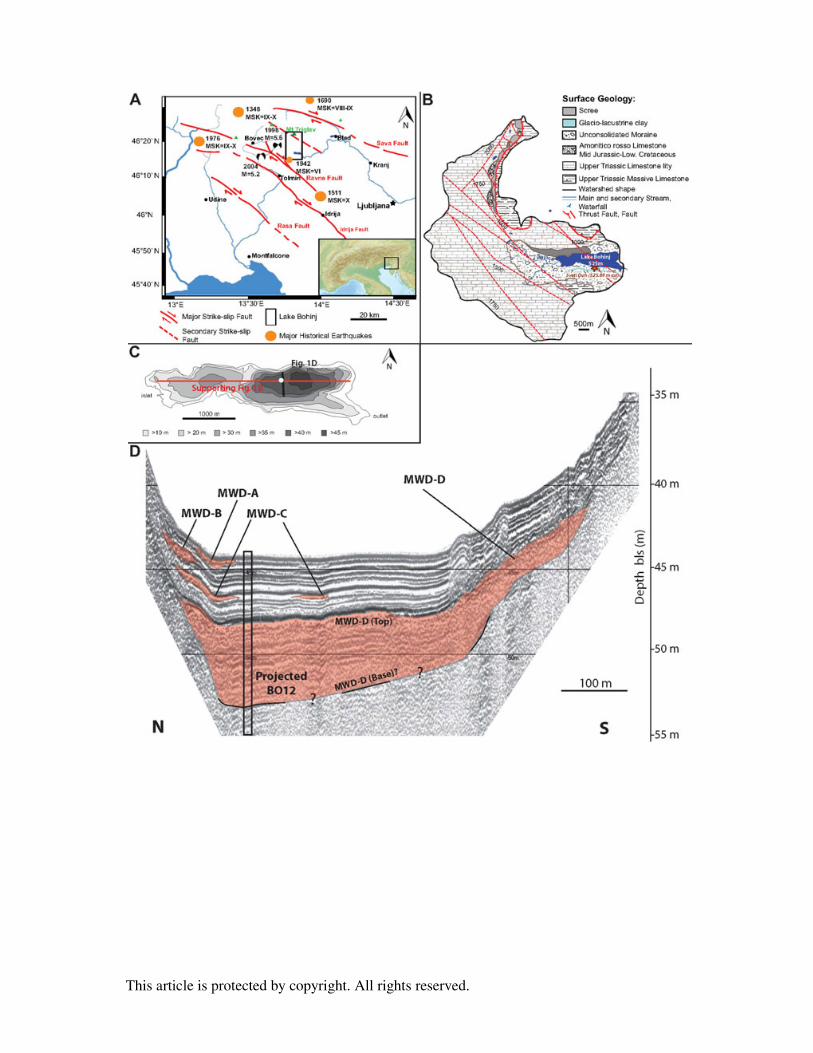
This article is protected by copyright. All rights reserved.
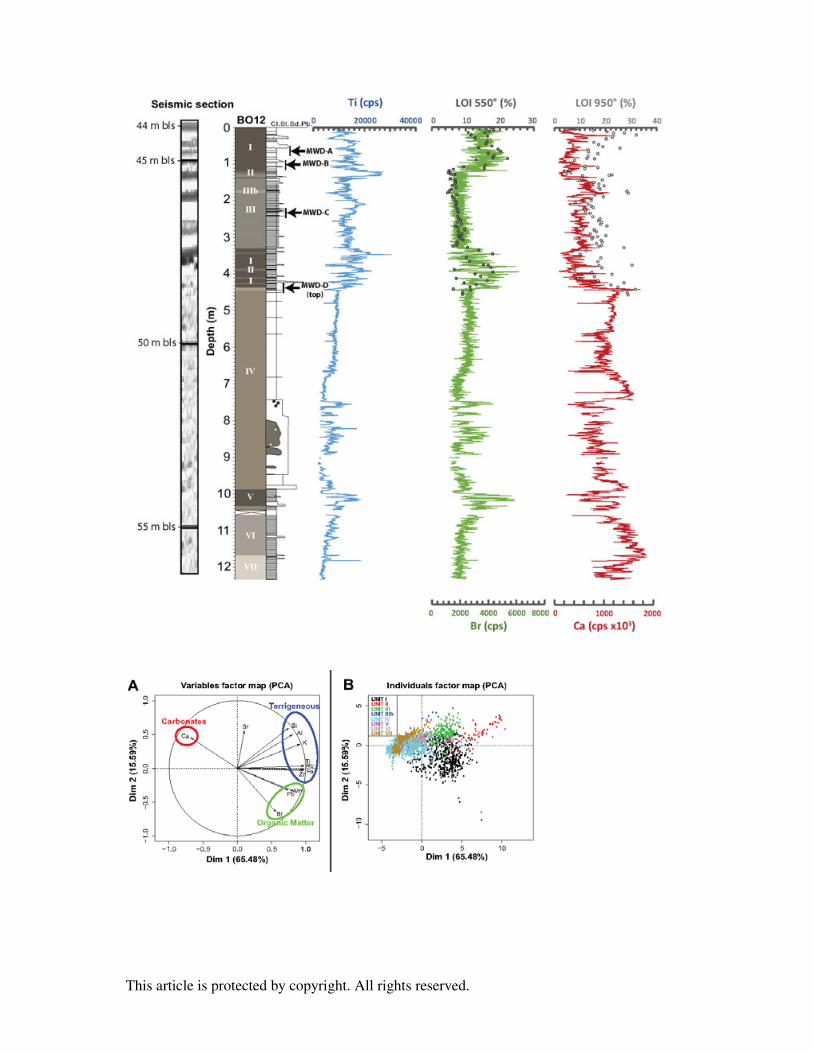
This article is protected by copyright. All rights reserved.
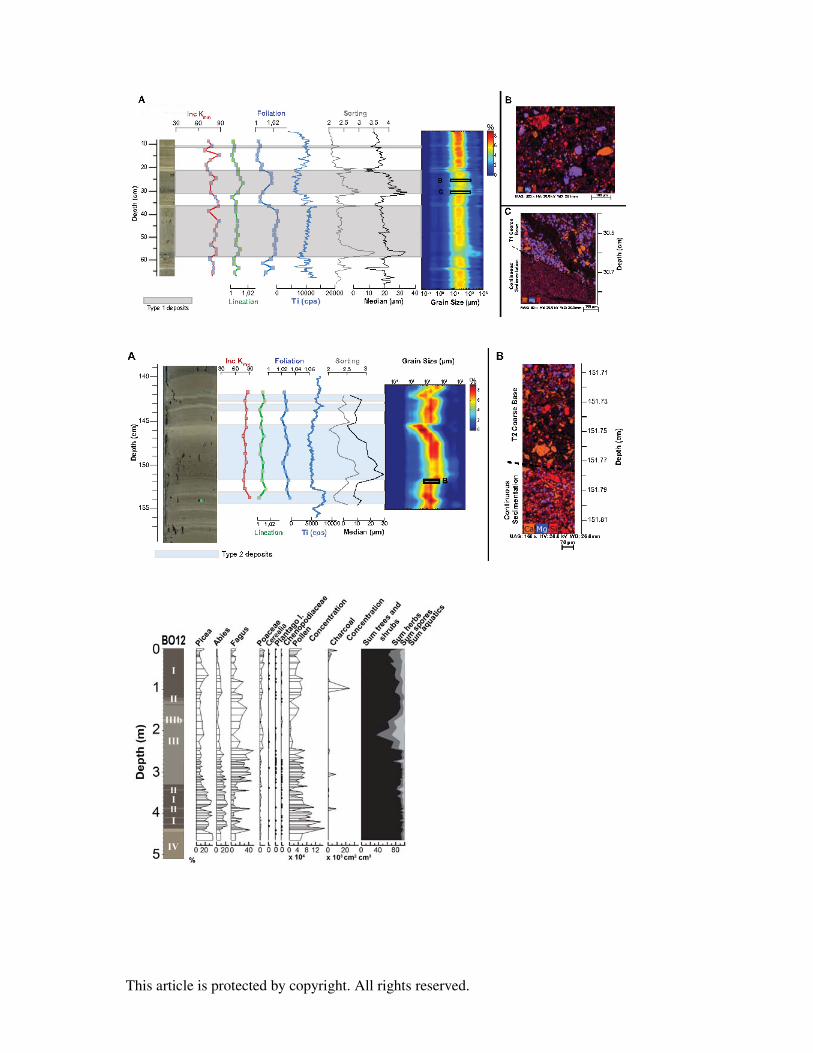
This article is protected by copyright. All rights reserved.
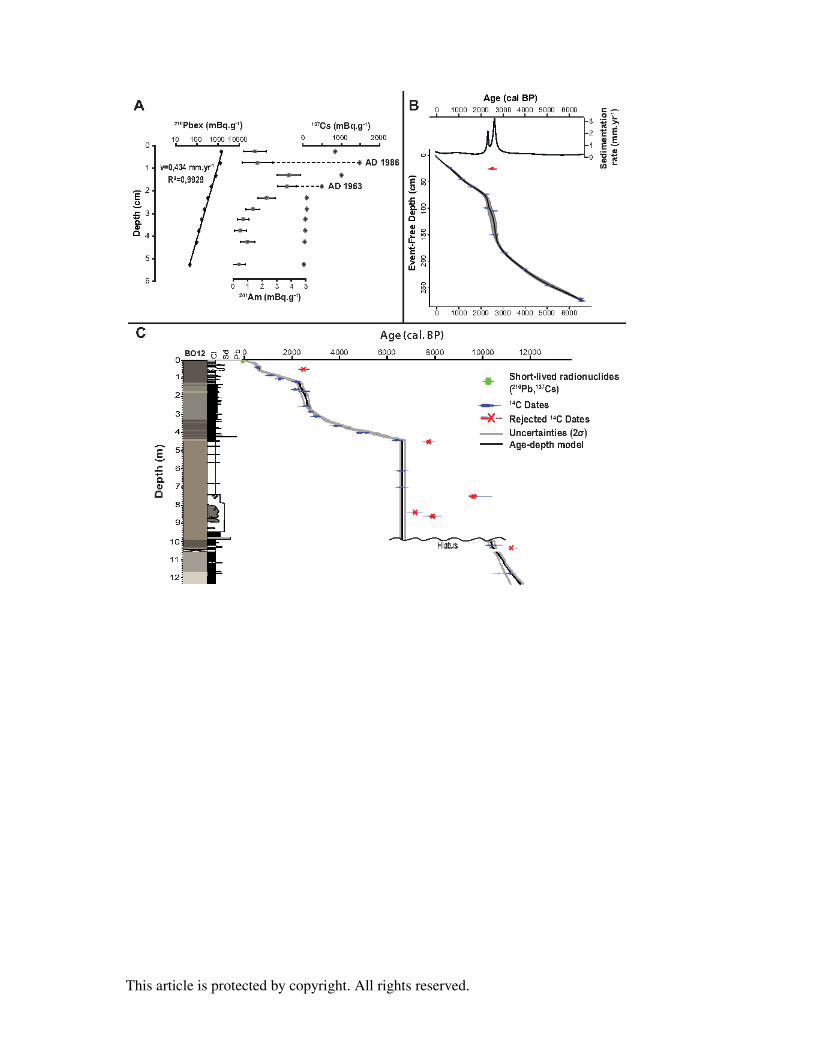
This article is protected by copyright. All rights reserved.
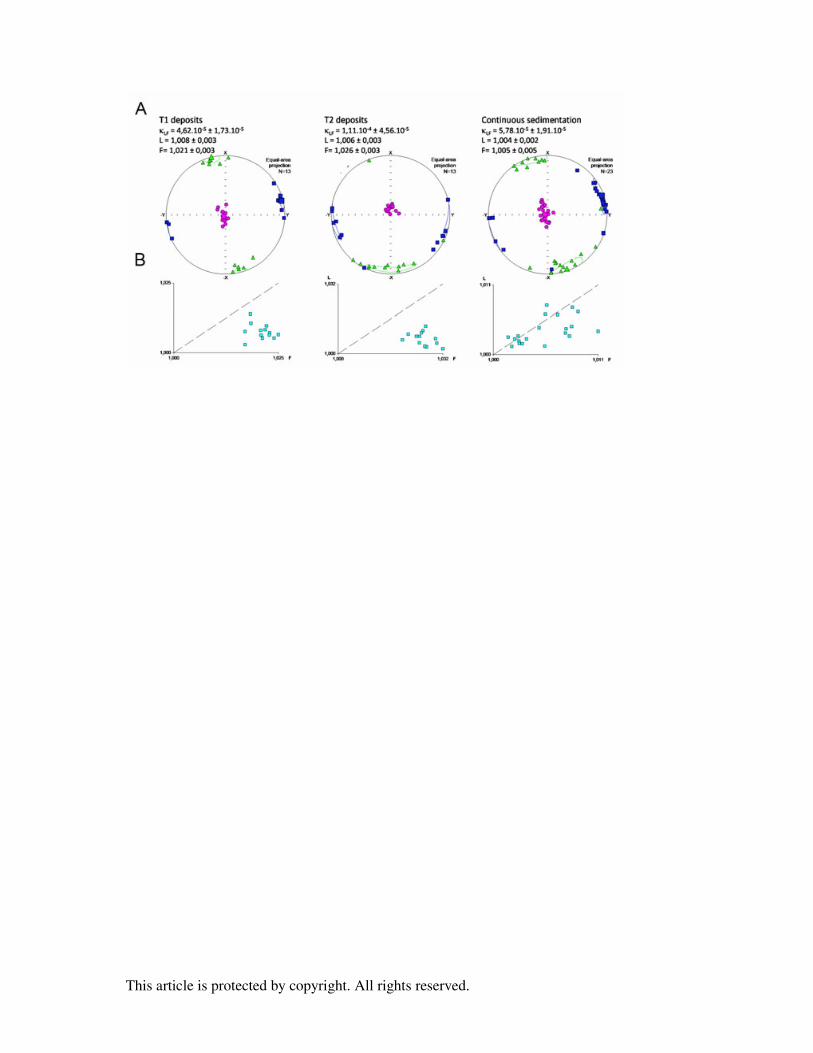
This article is protected by copyright. All rights reserved.
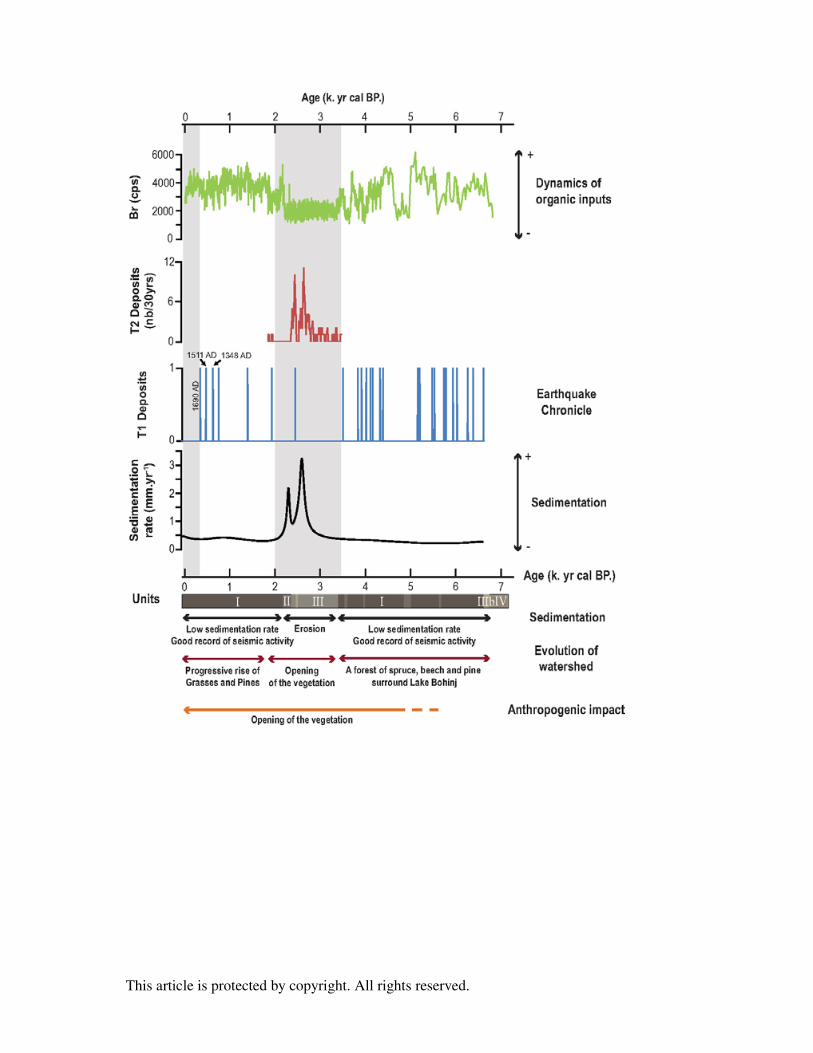
This article is protected by copyright. All rights reserved.
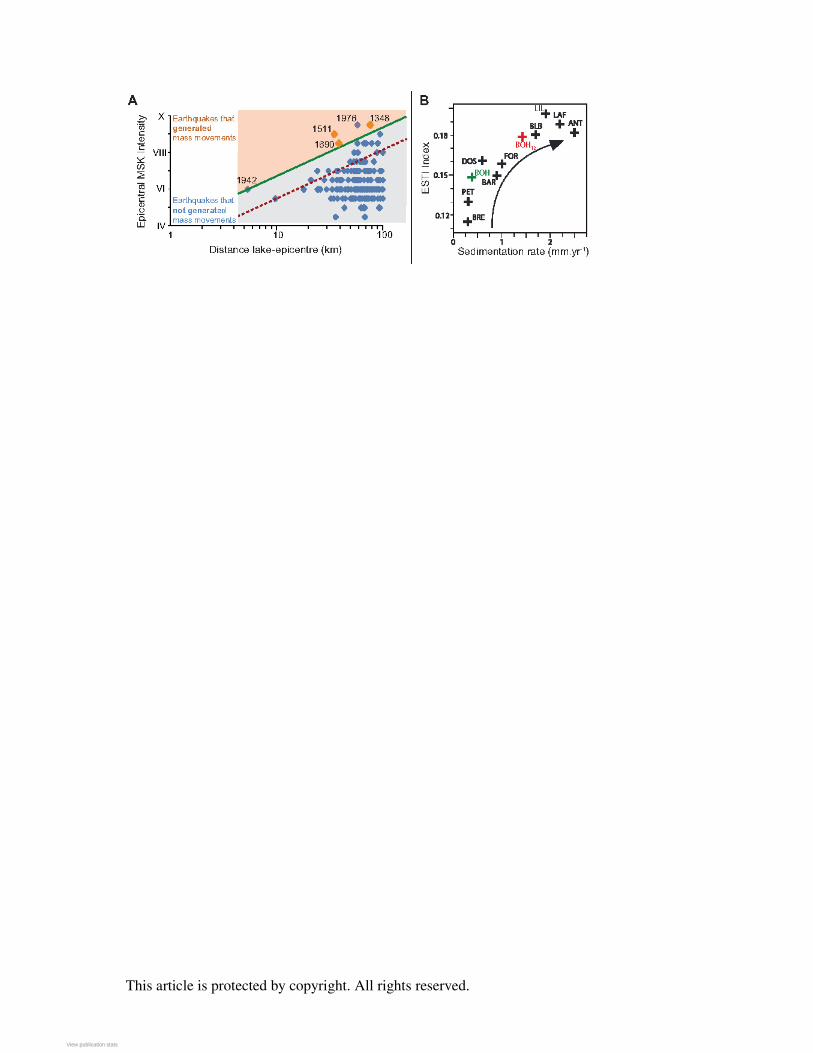
This article is protected by copyright. All rights reserved.
View publication statsView publication stats