Embed Size (px)
Citation preview


In accordance with Section 66D of the Constitution
of the Republic of Trinidad and Tobago as amended
by the Constitutional Amendment Act No. 29 of 1999,
Government Ministries are required to submit to the
President of the Republic of Trinidad and Tobago a
report on the exercise of their functions and powers.
In this regard, the Ministry of Energy and Energy
Industries is pleased to submit a report detailing its
operations and activities for the year 2003-2004.
Foreword

Ministry of Energy & Energy Industries Annual Administrative Report 2003-2004
The Ministry of Energy and Energy Industries
is in the business of ensuring the efficient
and effective management of the energy and
mineral sectors of the Republic of Trinidad
and Tobago for the benefit of the nation.
The Ministry of Energy and Energy Industries
will be a dynamic, client-oriented organisation
– the centre of excellence in the hydrocarbon
and mineral sector.
Mission
Vision
• To promote optimal growth and development
of the energy and mineral sectors in a safe and
environmentally sound manner;
• To promote the Republic of Trinidad and Tobago
as a viable location for exploration and production
opportunities;
• To promote optimal growth of downstream natural
gas-based investment opportunities;
• To establish and maintain the organisational
structure designed to achieve the Ministry’s
mission;
• To develop and implement policies that satisfy the
needs of the employees;
Strategic Objectives

Contents
I n c r e a s i n g L o c a l C o n t e n t
Frontispiece - Trinidad and Tobago Offshore Concession MapForewordMEEI Mission and VisionMEEI Strategic ObjectivesMEEI Services 4Executive Summary 5MEEI Stakeholder Relationships 6Organisational Structure 7
Operational Strategies 8Exploration and Production 10
Competitive Bid Round 2003 10Stimulation of Onshore Exploration and Production 10
Downstream Initiatives 11LNG Developments 11Local Content 13Minerals Sector 14Energy Data Hub 15
Finances 16Budget Allocation and Expenditure 18Administration of the Petroleum Levy and Payment Of Subsidy 18
Revenue 18Calculation and Reconciliation Of Royalty 19Auditing of Financial Reports re Production Sharing Contracts 19Fiscal Review of Oil and Gas Legislation for the Energy Sector 19
Current and Future Activities 20Crude Oil 22
Reserves 22Production 22Secondary and Enhanced Oil Recovery 22
Natural Gas 24Reserves 24Production 24Utilisation 25New Plants 25
Oil Refining 26Petrochemical Industry 28Marketing Activities 30Retail Marketing 30New and Renewable Energy 31
Solar Water-heating Project 31Caribbean Renewable Energy Development Project (CREDP) 31
MEEI Administrative Support Units 32Library Services 33HSE / Measurement Unit 34
International / Regional Activities 36Petrocaribe 38Eastern Caribbean Pipeline 38Cross-border Talks with Venezuela 39The Sixth Western Hemisphere Energy Ministers’ Meeting 40
MEEI Focus: Local Content and Local Capacity Building 44Appendices 47List of Abbreviations 74
List of Appendices
I. Summary of exploratory and semi-exploratory activities II. Annual statistics of production, refining, exports and imports III. Summary of development drilling IV. Monthly analysis of drilling and workover activity V. Monthly analysis of land and marine depth drilled VI. Crude oil production by fields, areas, or districts VII. Crude oil production by months and methods VIII. Analysis of crude oil production by operating companies IX. Total and daily average crude oil production by months for all companies X. Land and marine crude oil production XI. Average number of producing wells land and marine XII. Monthly crude oil production by lease XIII. Crude oil production by company lease XIV. Summary of fluid injection XV. Secondary and enhanced oil recovery operations XVI. Water injection summary by projects XVII. Steam injection summary by projects XVIII. Natural gas production by companies XIX. Natural gas utilisation XX. Annual statistics for natural gas production and utilisation XXI. Pitch lake asphalt extracts, products, usage and exports XXII. Destination of exports of crude and refined products from Trinidad and Tobago XXIII. Movements of refined products
List of Tables
List of Figures
I. MEEI Budget Allocation II. MEEI Actual Expenditure III. Revenue Collected by MEEI IV. Oil Reserves - 2003-2004 V. Natural Gas Reserves - 2003-2004 VI. Crude Oil Imports VII. Refinery Throughput VIII. Refinery Output IX. Product Sales - Local X. Product Sales - Export XI. Liquefied Natural Gas Production XII. Liquefied Natural Gas Sales XIII. Total Production and Export of Gas-based Petrochemicals
I. State Sector Roles II. Current MEEI Organisation Chart III. Percentage Utilisation by Sector Oct 2003 - Sep 2004

The Ministry of Energy and Energy Industries is the Government agency with responsibility
for managing and developing the petroleum and mineral resources of the Republic of
Trinidad and Tobago.
The major services of this Government Ministry include:
MEEI Services
1. The issue of leases and licences for Exploration and Production Sharing Contracts
2. Approval for the use of new drilling or production rigs
3. Approval for the use of drilling or production rigs
4. Approval for the use of drilling or production rigs after major modification and repairs
5. Approval for certified measuring storage facilities as well as for the construction and modification of Gathering Stations
6. Approval of petroleum product storage (in excess of 100 imperial gallons)
7. Approval of Liquefied Petroleum Gas (LPG) Bottling Plants
8. Approval of offshore installations and modification of these installations
9. Approval of chemicals for use in the energy industry.
10. Certification of Customs Duty-Free Entries for the use of offshore petroleum industries
11. Approval of Customs Licence for export of aggregate (crushed stone and other materials used in manufacture of concrete)
12. Issuing of leases and licences for mining activities in respect of quarries
13. The control/monitoring and assisting with the National Oil Spill Contingency Plan
14. Sale of data on energy and energy industries
15. Issuing and renewal of gas station retail marketing licences
16. Issuing and renewal of peddler’s licences
17. Provision of library information services on the local and international petroleum industry.
Ministry of Energy & Energy Industries Annual Administrative Report 2003-2004
I n c r e a s i n g L o c a l C o n t e n t
Executive SummaryDuring the period September 2003 to October 2004, the Ministry of Energy and Energy Industries continued to actively pursue the fulfilment of its mandate towards an effectively managed energy sector that was responsive to the evolving economic situation of Trinidad and Tobago.
Primary among its activities was the need to increase the local involvement in both the upstream and downstream sectors of the energy industry. To this end, Government sought to ensure maximum participation by locally owned firms and nationals at every stage of the value chain. To develop this process, the Cabinet in 2004 appointed a Permanent Local Content Committee whose mandate was to draft a Local Content and Local Participation Policy. Concurrent with this initiative was the inauguration of the first locally constructed offshore platform facility – Kairi I at the La Brea Industrial Estate. The MEEI focus at the end of this report captures the Minister’s presentation at the groundbreaking event of this major local content success story in the country’s upstream industry.
Government’s local content initiative was further enhanced by a shift in investment policy in the natural gas industry whereby the new Rules of Engagement required the inclusion of downstream and further downstream linkages for the processing of products. This meant that potential investors would be required to show a link between the primary product to be produced from natural gas to a second stage output. The major objective of this initiative was to enhance the linkages between the energy and non-energy sectors, thereby creating opportunities for spin-off industries for small and medium enterprises locally.
A priority area for the MEEI in this fiscal year was the updating of its 1998-2003 five-year strategic plan to a new period 2003-2010 to meet the needs of the dynamic and influential energy industry. One of the key outputs of the strategic planning exercise was the recommendation for the creation of a new MEEI organisational structure to more effectively cope with the industry-changing developments in the local and international energy sector over the last decade.
During the period under review, the MEEI continued to oversee the activities relating to the development and exploitation of the country’s energy and mineral resources. In this regard, a new Competitive Bid Round was launched in 2003 for 10 offshore exploration blocks. Following the evaluation process, six blocks were offered to Petro-Canada/Petrotrin, Kerr McGee/Primera and Canadian Superior Energy.
This Bid Round was important from the point of view of discovering new reserves of oil and gas. At the end of 2004, Trinidad and Tobago’s proven oil reserves stood at 621 million barrels of oil. The 3P (proven, probable and possible) oil reserves stood at 2,713 million barrels of oil. In the case of natural gas, at the beginning of 2004 natural gas 3P reserves stood at 33.32 trillion cubic feet.
Another important aspect of the energy sector that is covered under the operational strategies section of the report is the development and expansion of the LNG industry, in keeping with government’s initiatives to optimise its current market position and maximise revenues along the full value chain. To this end, Cabinet, in June 2003, approved the expansion of the LNG facility to a fourth train.
This year was also an active period for the Minerals Sector as the MEEI activities included the formulation of a policy paper and subsequent legislative arrangements to regulate the Quarry Industry. Steps were also taken to regularise quarries and washplants in an effort to deal with illegal quarry operators.
On the international front, the MEEI was involved in meetings at the level of the Energy Ministers of the Caribbean on the Petrocaribe agreement. In 2003 Venezuelan President Hugo Chavez visited Trinidad and Tobago. As part of this visit, a Memorandum of Understanding (MOU) was signed to establish the procedure for the unitisation of hydrocarbon reservoirs that extend between the delimitation line between both countries.
Also, in April 2004 Trinidad and Tobago was host to the Sixth Western Hemisphere Energy Ministers meeting. Some of the initiatives that came out of this meeting included the creation of a Western Hemisphere Energy Technology Cooperation Initiative and the drafting of a consensus statement on energy security in the Western Hemisphere for presentation to the Heads of State at the Summit of the Americas meeting to be held in 2005.
The year 2003/2004 was very eventful for the local energy sector. As this report will show, new ground was broken in energy sector administration, policy and legislation. Managing the transition from a sector dominated by oil to one where natural gas is the key player will throw up new challenges for the MEEI. Over the last year, the MEEI has taken steps towards reorienting and retooling itself to meet these challenges.

Ministry of Energy & Energy Industries Annual Administrative Report 2003-2004
The Ministry works with key stakeholders in the fulfilment of its portfolio of responsibilities for the governance and management of the energy industry. As shown in Figure I, the Cabinet-appointed Standing Committee on Energy serves as the advisory body for policy and plans for the overall development of the energy industry. Throughout the energy value chain, the MEEI accomplishes the work through strategic partnerships with the relevant state bodies and enterprises involved in the policy implementation and operations of the energy sector.
The Natural Gas Export Task Force is responsible for strategy development, strategy implementation and
MEEI Stakeholder Relationships
business development for the downstream energy sector. The State companies Petrotrin, the National Gas Company (NGC), the National Energy Corporation (NEC) and the National Petroleum Marketing Company (NPMC) are responsible for activities from strategy development to operations.
Other regulatory bodies that impact on the management of the energy sector are the Environmental Management Authority (EMA), the Work Permits Committee and the Permanent Local Content Committee (PLCC). The MEEI spans the entire range of activities of the value chain from the development of the regulatory framework governing the energy sector to operational aspects.
Figure I – State Sector Roles

Organisational StructureI n c r e a s i n g L o c a l C o n t e n t
Current MEEI Organisation Chart
Deputy Permanent Secretary*Director of Support Groups
COMMERCIALEVALUATION
ContractEvaluation• PSC• E&P Licences
BusinessDevelopment• Investments• Project Evaluation
Internal MEEI• Investments
Finance• PSCs, E&P
RESOURCEMANAGEMENT
Exploration &Planning
AcreageManagement
ResourceManagement
SubsurfaceAnalysis
D/STREAM RETAIL/MARKETING
Pricing
Monitoringe.g. refining
Levy andSubsidy
Policy andStrategy
ENERGYPLANNING
Research
Analysis
Strategy
Trend Analysis
Cabinet andMinisterBriefings
MINERALDIVISION
MineralsManagement
CONTRACTMANAGEMENT
Upstream• PSC• E&P
StakeholderRelations
ContractPerformanceReporting
LNG & GASEXPORTS
LNG/Petrochemical/Gas Exports
ContractManagement
TechnicalManagement
MINISTER
Permanent Secretary
Divisions:
Support Services:
Information Technology Accounts Legal Services Human Resources Admin HSE/Inspectorate & Risk Management Library Communications
Policy and Performance Management Unit
As part of the MEEI’s Strategy and Action Plan 2003-2010, a new organisational structure was developed. See Figure II. In arriving at the new structure, an assessment was done of the existing MEEI organisational structure. The assessment considered an organisational design that would be more conducive to internal capacity building. The old organisational structure was considered to be functional and hierarchical. This structure made it difficult to cooperate around projects and to create multidisciplinary teams with complementary skills. The new structure organises the MEEI around its strategically important and revenue-generating roles and also takes into consideration the changes in the profile of the energy sector over the last decade. The new organisational structure of the MEEI will include:
• A Deputy Permanent Secretary• Seven Divisions• One Unit • Eight Support Groups.
The Strategy and Action plan seeks to provide the MEEI with the necessary organisational infrastructure and human resource systems to strengthen as well as build its internal capability. The Human Resource Management Unit of the MEEI will play a central role in ensuring that the new plan is effectively implemented. Some of the main related activities to be undertaken by the Human Resource Management Unit will include:
• The development of a five-year succession plan;• The development of a skill competency model by
level;• Review staff compensation structure (including
allowances);• The building of development performance
templates;• The development of a People Management
Framework; and• The review and monitoring of the Performance
Management System.
Figure II – Current MEEI Organisation Chart

Operational Strategies

In keeping with the MEEI’s strategic objectives,
the Ministry formulated and aggressively pursued
strategies for the holistic development of the local
energy sector during the reporting period. These
included the following:
• Promotion of exploration and production
initiatives through the launch of a new
Competitive Bid Round in 2003 for offshore
areas and onshore developments in the
Southern Basin;
• Stimulation of Onshore Exploration and
Production
• Promotion of downstream and further
downstream initiatives for the economic
development of the country;
• Expansion to a fourth LNG Train;
• Creation and publication of a local content
policy;
• Strengthening of the legislative and policy
framework governing the extraction of minerals
in Trinidad and Tobago;
• Incorporating technology developments in the
creation of an Energy Data Hub.
Ministry of Energy & Energy Industries Annual Administrative Report 2003-2004
10
OPERATIONAL STRATEGIES
Competitive Bid Round 2003
The availability of new blocks for petroleum exploration is critical to the sustainability of the country’s energy sector since new discoveries are paramount to the replacement of produced existing reserves. In this regard, the Ministry launched a new Competitive Bid Round in 2003 for 10 offshore blocks comprising a mixture of shallow water shelf blocks and deep water blocks, located on the west, east and north coasts of Trinidad.
The Bid Round was opened on May 23, 2003 with the deadline for submission of bids being September 30, 2003. This was later extended to January 14, 2004. Bids were received in respect of all 10 blocks. The Bids were evaluated by the Cabinet-appointed Evaluation Committee and recommendations submitted accordingly.
Six blocks were officially awarded as follows:
Block 1(a) – Petro-Canada and PetrotrinBlock 1(b) – Petro-Canada and PetrotrinBlock 3(b) – Kerr-McGee/PrimeraBlock 4(a) – EOG Resources/PrimeraBlock 5(c) – Canadian Superior Energy Inc.Block 22 – Petro-Canada
An MEEI technical team including the Legal Unit of the MEEI was actively involved in the negotiation and execution of the Production Sharing Contracts relating to the award of the exploration blocks.
Exploration and Production
Stimulation of Onshore Exploration and Production
During this period, the Ministry in association with the Petroleum Company of Trinidad and Tobago (Petrotrin) embarked on a major project to stimulate on-land exploration in the southern basin of Trinidad with the ongoing goal of increasing the hydrocarbon reserves and production over the area. In this regard, Cabinet agreed to the following strategies:
a) Petrotrin be required to surrender all its existing onshore leases by individual Deeds of Surrender; the Minister of Energy to simultaneously award Petrotrin acreage of approximately 154,400 acres known as the Core Areas via new Exploration and Production Licences, incorporating new terms and conditions.
b) The Minister of Energy and Energy Industries take the necessary steps to establish a consortium of companies to conduct an integrated exploration and production programme over the southern basin.
c) Any participating interest acquired by the Government of Trinidad and Tobago be assigned to Petrotrin.
A dedicated work group comprising personnel from the MEEI and Petrotrin was established to implement the project, which is in progress and on target with the planned deadlines. Activities included agreement with Petrotrin on the areas to be surrendered; demarcation of the core areas; preparation of the data package and the showcase presentation. The Legal Unit of the MEEI was also involved in the drafting of a new Exploration and Production Licence to be used in the Southern Basin onshore exploration project.
Six offshore exploration blocks awarded in 2004

OPERATIONAL STRATEGIES
11
I n c r e a s i n g L o c a l C o n t e n t
The diversification of the energy sector through a mix of downstream and further downstream initiatives was a key strategic imperative of the Ministry’s operations in fiscal 2004. This deliberate shift in investment policy sought specifically to expand and deepen the opportunities for the overall economic development of the country through enhancing the linkages between the energy and non-energy sectors in stimulating spin-off industries.
In particular, the potential for expanding the natural gas industry from the production of primary products to second stage processing of products was being explored. Emphasis was being placed on the creation of business opportunities for small and medium enterprises that would allow the energy sector to have a more meaningful role in providing entrepreneurial development by a wider cross section of the population. The main focus of this new policy is to generate wider-ranging employment and income with the overall objective of alleviating poverty.
It became mandatory, therefore, through the Rules of Engagement that the approval of new investments require the inclusion of downstream linkages for the processing of products.
In this regard and during this reporting period, the MEEI in association with its key stakeholders was involved in the review of various project proposals for the development and expansion of the downstream industry, which included the identification of new industrial sites and the construction of the following industrial plants:• An ethane cracker/polyethylene complex • An Urea Ammonia Nitrate (UAN) plant and a
melamine plant • A syngas refinery• An aluminium smelter plant and an integrated
aluminium complex• An R&D Centre at the University of Trinidad and
Tobago in relation to the downstream activities of the proposed plants.
• The Nu Iron DRI plant
Downstream Initiatives LNG Developments
In the latter half of 2003, Cabinet approved the development and construction of a fourth LNG Train to be operated by the Atlantic LNG Company of Trinidad and Tobago. This project with an estimated cost of US$1.1 billion, involved the construction of an LNG facility to process some 800 million cubic feet (mcf) of natural gas daily for export. Production capacity would be 5.2 million metric tonnes per annum (mtpa) and with Train IV becoming fully operational, the overall production level of the LNG industry in Trinidad and Tobago would increase to about 15.6 million tonnes per annum (mtpa).
The initiatives of the Government to optimise its position in the LNG industry are geared toward revenue maximisation, extraction of full value along the chain, as well as securing market share.
The related aspects of the Ministry’s work with respect to this project included the legal agreements, compliance with local content stipulations, and the coordination of activities with other related and ancillary projects, such as the cross-island pipeline with the NGC and related upstream developments.
While the fourth LNG train was being constructed, the NGC upgraded its pipeline infrastructure to supply the natural gas through a 56-inch diameter pipeline. This pipeline is the largest natural gas pipeline ever built in the Western Hemisphere.
Steps have also been taken to ensure the participation of local companies in the construction of Train IV. To this end, targets for local content in terms of capital expenditure have been worked into the Train IV agreements and contracts.
The Atlantic LNG Train 4 Company shareholding comprises the following members:
BP (Barbados) Holding SRL (37.78%) British Gas Trinidad LNG Limited (28.89%) NGC LNG (Train 4) Limited (11.11%) Repsol Overzee Financien B.V. (22.22%)
Cabinet approves construction of a fourth LNG Train in 2003

OPERATIONAL STRATEGIES
13
I n c r e a s i n g L o c a l C o n t e n t
One of the defining issues that shaped the energy sector agenda and policy direction in the year 2003-2004 was local content. Local Content speaks to the fact that sustainable economic development and achieving developed nation status by 2020 requires Trinidad and Tobago-owned firms and nationals to play a larger role along the energy sector value chain.
The energy sector is a consumer of high-end skills, services and technologies. For Trinidad and Tobago firms and nationals to play a larger role in this sector there is a need for the transfer of technology and skills as they relate to the energy sector, with the ultimate aim being to increase the competitiveness of the Trinidad and Tobago economy.
From an economic perspective, increasing levels of local content is important to closing the gap between Gross National Product (GNP) and Gross Domestic Product (GDP). Currently, it is estimated that the value capture on upstream projects is approximately 10%. There is a need to increase this figure. To accomplish this, more of the “spend” on upstream projects will have to take place in Trinidad and Tobago.
In this regard, the Government in 2004, established the Permanent Local Content Committee (PLCC) which was mandated to produce a policy document on local content and local participation and to devise strategies to increase local content and participation in all energy sector projects. The PLCC is chaired by the
Local Content
Director of Energy Research and Planning Division of the MEEI. The MEEI’s Energy Research and Planning Division (ERPD) serves as the secretariat to the PLCC. The PLCC is currently in the process of finalising the Local Content and Local Participation Policy. Once completed it will be submitted to the Cabinet for approval. The Legal Unit of the MEEI worked closely with the ERPD in providing legal opinions and advice on the contracts and arrangements for the local content input.
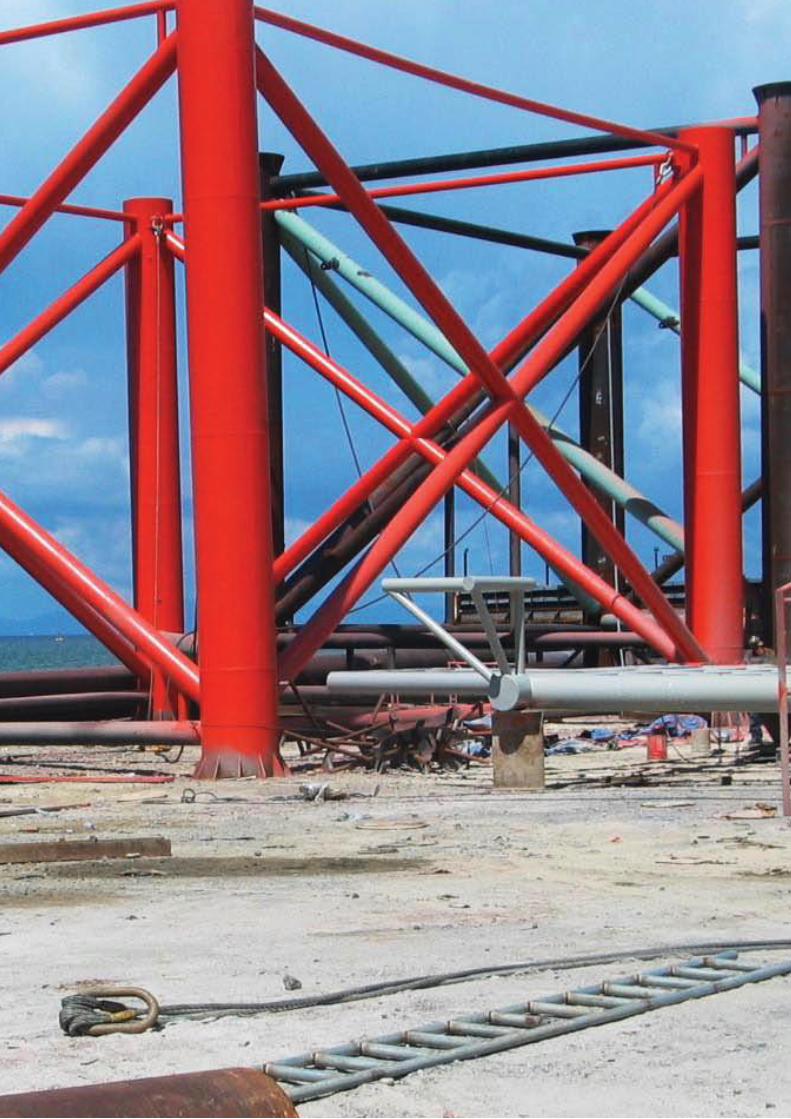
Meanwhile, however, significant progress was made in the contribution of local content inputs to the country’s development projects. A major milestone and an outstanding example of local content success in the energy sector was the creation and establishment of a fabrication yard at the La Brea Industrial Estate. The fabrication yard was set up to provide accommodation and infrastructural support for the construction of large offshore structures such as decks and jackets for offshore platforms and this has led to the establishment of a world-class offshore structure fabrication facility in Trinidad and Tobago.
In the last year, the Kairi-1 platform deck was completed. Work is currently in progress on the 850-tonne Cannonball gas platform. Both projects involve significant local input through local contractors and nationals of Trinidad and Tobago. Trinidad and Tobago has also made major local content inroads in the construction of the three LNG trains.
First offshore platform – Kairi 1 – constructedin Trinidad and Tobago at the La Brea Industrial Estate

Ministry of Energy & Energy Industries Annual Administrative Report 2003-2004
14
OPERATIONAL STRATEGIES
In 2003-2004 the Minerals Division took steps to strengthen the legislative and policy framework governing the extraction of minerals in Trinidad and Tobago. To this end, the Minerals Division worked closely with the Legal Unit of the MEEI in the formulation of a policy paper and related legislative arrangements on the Trinidad and Tobago quarry industry. In particular, proposals and amendments were made to the following legislative instruments:• The Minerals Act 2000• The Quarry Authority Act• Regulations governing the quarry industry• The Geological Survey Act• The Quarry Taxation Act
The policy paper and the legislative arrangements were completed and submitted to the Cabinet and the Finance and General Purposes Committee of Cabinet which requested that it be reformulated and the Minerals Act 61 of 2000 be amended.
In an effort to rid the landscape of illegal quarry operators, the MEEI undertook to issue interim licences to all bona fide operators on state and private lands. Cabinet approved this action and the legal department drafted the relevant interim licences. Further to this, a list of illegal operators with a map showing their location was sent to the Ministry of National Security for action to be taken.
The Minerals Division also conducted a resource evaluation with respect to the Tapana forest. Some 160 acres out of the 800 acres of virgin land under pine forest in Tapana were surveyed and a volumetric assessment of the sand and gravel was done of all the acreage previously surveyed.
Minerals Sector
A Green Paper on the quarry industry published for public comment

OPERATIONAL STRATEGIES
15
I n c r e a s i n g L o c a l C o n t e n t
The Information Technology Unit of the MEEI was involved in a major initiative for the improved delivery of data management services to its primary clientele. The Energy Data Hub project was officially launched in 2003, with the main objective to implement and organise an information system, for the collection, verification, management and dissemination of data that can be used for informed decision-making.
Data management is a primary business responsibility of the MEEI, which, over the years, has changed from manual systems to the use of relevant computer software programmes to fulfill its mandate. Rapid information technology advancements have provided the opportunity to transform and vastly improve this key area of the MEEI work into a major hub for the operation, reporting and seamless exchange of data among its key stakeholders in the local energy industry.
The need for this initiative was identified through a thorough examination of the current data management process. The expected output of this new system was that it would simplify the generation of reports, provide data to local and international organisations, as well as facilitate collecting, collating and forecasting of key statistical data on the energy and mineral sectors in Trinidad and Tobago. It is envisaged that the end result of this project will reap benefits such as a reduction in the decision-making cycle time, the creation of stronger partner relationship and enhanced interaction with stakeholders and accountability to the people and Government of Trinidad and Tobago.
Energy Data Hub
The overall efficiency and management of the key industry data on the local energy sector will be vastly improved through the implementation of the new system.
Simultaneous with the development of the Energy Data Hub Project, the Information Technology Unit of the MEEI also pursued the following supporting activities including:
• The upgrade and complete redesign of the MEEI website, which was completed and accepted;
• Support and integration of the MEEI network to the E-government Backbone;
• Upgrade of IT infrastructure to meet the growing demands - increasing bandwidth requirements necessitated an upgrade in the 256k Wide Area Network (WAN) between the Head Office at Riverside Plaza and the Ministry’s Operations (San Fernando) and Technical Divisions (Frederick Street). By the end of 2003, the WAN was initially upgraded to 2 Mbps fibre and then to 10Mbps fibre as the Energy Data Hub came on stream. The networking capabilities at all three LANs were also upgraded and expanded during 2003-2004 to meet the demands of increasing staff and the formation of new Administrative Units. Centralised enterprise-wide anti-virus protection was deployed.
The Energy Data Hub Project is launched in 2003

Finances

The financial administration of the MEEI is governed
by the Petroleum Act 62:01 and in particular the
petroleum impost, which is paid by “every licensee in
respect of all petroleum won and saved, at such rates
as the Minister may determine by issue of a Rating
Order.” Funds from the petroleum impost are used to
cover the recurrent expenditure of the MEEI and are
disbursed through the Ministry of Finance under the
various sub-heads.
The MEEI also collects revenue on behalf of the
Government of the Republic of Trinidad and Tobago,
through the administration of the related legislative
instruments including:
• The Petroleum Taxes Act
• The Petroleum Levy and Subsidy Act
• The related agreements stipulated in the various
Production Sharing Contracts.

Ministry of Energy & Energy Industries Annual Administrative Report 2003-2004
18
Budget allocation and expenditure
For the financial year ending September 30, 2004, the MEEI was allocated the sum of $765,204,374. The breakdown of the allocation is shown at Table I. Actual expenditure was $763,311,558 as shown at Table II.
40: MINISTRY OF ENERGY AND ENERGY INDUSTRIES
01: PERSONNEL EXPENDITURE 18,257,449.00
02: GOODS AND SERVICES 32,539,462.00
03: MINOR EQUIPMENT PURCHASES 1,288,150.00
04: CURRENT TRANSFERS AND SUBSIDIES 713,119,313.00
HEAD 40: MINISTRY OF ENERGY AND ENERGY INDUSTRIES
REVISED ACTUAL
SUB-HEAD ESTIMATES EXPENDITURE VARIANCE
01: PERSONNEL
EXPENDITURE 18,257,449.00 17,933,261.49 324,187.51
02: GOODS
AND SERVICES 32,539,462.00 31,580,740.78 958,721.22
03: MINOR
EQUIPMENT
PURCHASES 1,288,150.00 802,033.13 486,116.87
04: CURRENT
TRANSFERS AND
SUBSIDIES 713,119,313.00 712,995,522.79 123,790.21
TOTAL 765,204,374.00 763,311,558.19 1,892,815.81
A total of $712,641,123 accounted for the payment to NPMC for the shortfall in petroleum subsidy. This figure represents an increase of $512,641,123 from the 2003 figure of $200,000,000.
Finances
Administration of the Petroleum Levy and Payment of Subsidy
The Petroleum Production Levy and Subsidy Act of 1974 provides for the collection of a levy from oil producing companies and payment of a subsidy to wholesale marketing companies when the reference prices of petroleum products are higher than the wholesale prices. The Domestic Energy Market Section of the Energy, Research and Planning Division (ERPD) was involved in the determination of the ex-refinery price for all petroleum products, verification of the subsidy claims, levying of the amount of subsidy on oil-producing companies and advising the Ministry of Finance of amounts to be paid to the wholesale marketing companies.
REVENUE
The MEEI collects revenue on behalf of the Government of Trinidad and Tobago. The system of revenue collection under which the MEEI operates is governed by the Petroleum Act, the Petroleum Taxes Act, the Petroleum Levy and Subsidy Act and the conditions stipulated in the various Production Sharing Contracts.
The ERPD is responsible for the activities relating to the collection of the oil impost, the petroleum levy and the calculation and reconciliation of royalties. The Oil Impost Funds recover the expenses of the MEEI including salaries, pension contributions, maintenance and other expenses of/or incidental to the administration of the petroleum industry for the previous calendar year.
FINANCES
Table I MEEI Budget Allocation
Table II MEEI Actual Expenditure
TTD 1.2 billion collected in oil revenue in fiscal 2004

19
I n c r e a s i n g L o c a l C o n t e n t
Finances (continued)
Calculation and Reconciliation of Royalty
The MEEI collects royalty payments on behalf of the Government of Trinidad and Tobago. Royalty payments are related to the extraction of hydrocarbons and minerals. A breakdown of revenue collected is shown at Table III. Exploration and Production (E&P) licensees are required to pay royalties on their licensed area on the net petroleum won and saved from the area. The crude oil is valued on the basis of the field storage value. Royalty on gasoline is calculated as a percentage of the total gas sales to companies outside the petroleum producing and refining industry. During the period under review, the Ministry was engaged in the calculation and reconciliation of royalty for 13 companies.
2003/2004 2002/2003
Royalty Collected 1,096,402,931.62 1,007,951,502.56
Other Sources of
Revenue Collected 129,386,434.81 133,404,639.39
TOTAL REVENUE
COLLECTED 1,225,789,366.43 1,141,356,141.95
Royalties increased by approximately $90 million on account of increased production of oil and gas. Administrative fees and charges decreased approximately by $41 million, as the one-time charge of a Production Bonus made in 2003 was not applicable in 2004.
Auditing of Financial Reports re Production Sharing Contracts
The PSC Audit Unit falls under the purview of the ERPD which is responsible for auditing the financial reports of operators who hold Production Sharing Contracts in accordance with terms prescribed in the respective contracts. Three contracts were surrendered during the period 2003-2004, leaving nine contracts operative. Thirty cost recovery audits and seven revenue audits were completed for the year under review. Fiscal Review of Oil and Gas Legislation for the Energy Sector
Given the changes in the production and utilisation profile of hydrocarbons in Trinidad and Tobago in the last five years, it has become necessary to review the fiscal and legislative framework that governs the Trinidad and Tobago energy sector. The ERPD played a central role in this process. This role included meeting with oil and gas companies to discuss with them their operations and their views on the proposed fiscal changes. From a research perspective, the ERPD also undertook economic and fiscal simulation and modelling exercises to determine appropriate tax rates.
FINANCES
Table IIIRevenue Collected by MEEI
Government undertakes fiscal review of oil and gas legislation in 2004

Current and Future Activities

During the period under review, the MEEI continued to
monitor and manage the upstream and downstream
activities of the energy industry. This section highlights
the key areas of the energy industry operations for the
period 2003-2004, relating to:
• Crude Oil
• Natural Gas
• Petrochemicals
• Oil Refining
• Marketing
• New and Renewable Energy

Ministry of Energy & Energy Industries Annual Administrative Report 2003-2004
22
CURRENT AND FUTURE ACTIVITIES
Crude Oil
Reserves
The oil reserves of Trinidad and Tobago for the year 2004, stood at 621 million barrels of oil (proven). The 3P (proven, probable and possible) reserves were 2,713.6 million barrels of oil (mmbo). Table IV shows the oil reserves trend for the period 2000 to 2004.
Production
In 2003-2004 total oil production was 46,691,163 barrels of oil. In terms of barrels of oil per day (bopd), oil production was 127,571 bopd. This figure is a decline of 7.1% over the 2002-2003 oil production figure, which was 50,025,591 barrels of oil (or 137,056 bopd).
The decline in production in 2003-2004, when compared to 2002-2003, was mainly attributable to the decline in oil production at bpTT whose production slipped to 22,019,699 barrels of oil in 2003-2004 from 26,756,957 in 2002-2003, or a 19% decline.
Oil production in 2003-2004 came from an average of 3,995 wells, of which an average of 562 were from private leases and the majority (3,393) were from state leases. When these producing wells are appropriated between land and marine provinces, land wells account for 3,339 wells and marine wells account
for 616 wells. In 2003-2004, production of oil peaked in October 2003 when 4,260,623 barrels of oil were produced at an average of 137,439 bopd.
Land-based oil production in 2003-2004 accounted for 19.5% of total oil production or 9,133,153 barrels of oil while production from marine areas accounted for 80.5% of production or 37,557,650 barrels of oil. The Lease Operators and the Farm Outs continue to make an important contribution to oil production, accounting for 1,950,961 barrels of oil respectively, which was an increase of 14.4% over their production figures in 2002-2003.
Secondary and Enhanced Oil Recovery
Crude oil production from Secondary and Enhanced Oil Recovery (EOR) operations accounted for 8.8% of Trinidad and Tobago’s total oil production in 2003-2004. This was a decrease of 7% from the previous year. Altogether there were some 33 Secondary recovery schemes during the year that consisted of 13 water floods, 10 steam floods, five carbon dioxide floods and five Water Alternating Steam Projects (WASP).
The only sector to experience growth was thermal oil recovery operations. This is a direct result of the implementation of the Upper Morne L’Enfer (UMLE) pilot steam flood, which added 134 barrels of oil per day.
Overall, as in the previous four years, water floods continued to be the major contributors to secondary and EOR production.
TrinmarThe Trinmar 8011 water flood project is very significant in the context of secondary recovery in Trinidad and Tobago. This project alone accounted for almost 51% of oil contributed by water injection operations and has been in operation since February 1993.
Year Proven Probable Possible
2000 716.0 460.0 1924
2001 825.0 501.0 1954.0
2002 990.0 324.2 1852.8
2003 756.0 358.0 1644.0
2004 621.0 404.6 1688.0
Oil reserve figures are quoted as of the end of the year
Table IV Oil Reserves - 2000-2004 (mmbo)
Proven crude oil reserves in 2004 were 621 million barrels

23
I n c r e a s i n g L o c a l C o n t e n tCURRENT AND FUTURE ACTIVITIES
Crude Oil (continued)
bpTTWater injection into the Teak water flood decreased drastically from 14,700 barrels of water per day in September 2003 to less than 2,000 barrels per day in 2004. The MM-01/L sand project is the only active water injection project in the Teak field. With decreasing water injection, there was a sizeable reduction in oil production from 3,053 bopd in fiscal 2002-2003 to 2,068 bopd in the current year under review.
Petrotrin Petrotrin’s water flood operations suffered from high water cuts, averaging 63%. Water was injected in the Catshill and Trinity water floods. The other projects at Point Fortin, Galeota and Fyzabad were not under active injection.
EOR Performance Steam InjectionRelatively successful steam injection operations were conducted in the UMLE Pilot, Point Fortin Cruse E, Area IV and Parrylands Phase 1 Expansion steam floods where steam oil ratios were fewer than six.
Partial WASPThere are currently five projects identified as being partial WASP. Three of these projects were subject to both water and steam injection in 2004. Of these, there was concentrated water injection at Apex Quarry and steam injection was mostly applied at North Palo Seco and Central Los Bajos. Without much deviation, all five floods experience water cuts over 80%. An average 3,052 bopd were produced as a result of these operations.
Carbon Dioxide InjectionIn 2004, there were three active carbon dioxide injection projects in Forest Reserve. Carbon Dioxide injection rates are the lowest they have been in the past four years. Between 2003 and 2004 there has been a 60% cut in the volume of carbon dioxide injected.
Crude oil production in 2004 was 127,571 bopd

Ministry of Energy & Energy Industries Annual Administrative Report 2003-2004
24
Reserves
The 2004 reserves audit update conducted by the Ryder Scott Company (RSC) estimated the proven non-associated natural gas reserves of Trinidad and Tobago to be 18.809 trillion cubic feet (tcf) as of January 1, 2004. This figure marks a decline of 9.4% or 1.950 tcf over the proven unassociated reserve figure from the previous year. Gas production in 2003 accounted for 0.910 tcf of this change. The major revisions contributing to this decrease occurred with bpTT Amherstia (0.204 tcf) and Kapok fields (0.555 tcf) and BHP Billiton fields (0.526 tcf). The major positive revision occurred with British Gas Dolphin field (0.137 tcf).
Table V shows the natural gas reserves of Trinidad and Tobago for the period 2000-2004.
Major Discovery of New ResourcesChachalaca Well: The Chachalaca well that was spudded in August 2004 and drilled by bpTT encountered just over 700 feet of hydrocarbon-bearing Pleistocene-aged sands. The MEEI estimate of the resources accessed by this well is in the order of 1.4 tcf. bpTT estimates the entire complex to contain about 2.0 tcf of natural gas.
Production
For the year 2003-2004, Trinidad and Tobago’s average gas production was 2,865 million standard cubic feet per day (MMscf/d). This was an increase of 16.3% over the same period in 2002-2003.
The increase in natural gas production was as a result of an increase in production from bpTT of 12.1% and the BG NCMA field of 4.1%. These increases were due to the demand for natural gas related to ALNG Train III. The increase from bpTT came from the Kapok field, which also supplied gas to the new Atlas Methanol plant. Production from this field started during August 2003, and attained a maximum rate of 615 MMscf/d in September 2004 from five wells.
Another major natural gas producer, EOG Resources, also increased production from two fields, Osprey and Parula. Apart from supplying gas to the Caribbean Nitrogen Company (CNC), production from Osprey was increased to supply gas to the new ammonia plant, N2000. Production from Parula field began in February 2004 to maintain the current South-East Cost Consortium base contract of 135 MMscf/d.
Production ForecastProduction of natural gas is expected to continue its increase in the next year. For the latter half of 2004 the daily average gas production was about 3.05 billion cubic feet per day (bcf/d). This is expected to increase to 3.15 bcf/d in 2005 as two new plants, Methanol Holdings Trinidad Limited’s M5000 and ALNG’s Train IV are expected to be completed in the fourth quarter of 2005. These plants will require 150 MMscf/d and 750 MMscf/d, under normal plant operations, respectively. Both plants will be the largest of their kind in the world.
Natural Gas
Year Proven Probable Possible Total
2000 21.35 4.69 3.47 29.51
2001 19.67 7.30 5.60 32.60
2002 20.35 8.12 5.85 34.32
2003 20.80 8.10 5.90 34.80
2004 18.80 5.89 8.63 33.32
Natural gas reserves are quoted as of the beginning of the year
CURRENT AND FUTURE ACTIVITIES - INDUSTRY
Table V Natural Gas Reserves - 2000-2004 (Tcf)
Proven natural gas reserves in 2004 was 18.8 tcf

25
I n c r e a s i n g L o c a l C o n t e n t
Natural Gas (continued)
CURRENT AND FUTURE ACTIVITIES - INDUSTRY
Field DevelopmentParula Field (South East Coast Consortium): The Parula Field development continued in 2004 with the drilling of two new wells. This development will provide production assurance for the new contract signed in January 2004 to supply 100 MMscf/d of gas to the M5000 methanol plant in the second quarter of 2005 and to the maintain current South East Coast Consortium base contract of 135 MMscf/d.
Kapok Field: The first phase of this field development continued in 2004 and is expected to be completed by December 2004. Production commenced in August 2003 and attained a maximum rate of 615 MMscf/d the following month from five wells.
Utilisation
The increase in demand for natural gas was attributed to two new petrochemical plants and an increase in demand for natural gas from the Atlantic LNG complex. The increase in demand from the LNG complex was mainly due to the start-up of Train III in April 2003, for the full 2003-2004 period, as compared to half the time for the 2002-2003 period. Figure III shows the natural gas utilisation mix by sector for the period October 2003 to September 2004. The LNG industry accounted for 57.2% of the natural gas utilised in Trinidad and Tobago in this period. This was followed by ammonia and methanol with 17.0% and 10.9% respectively.
FIGURE IIIPercentage Utilisation by Sector Oct 2003 - Sep 2004
New Plants
The downstream sector continues to expand with the establishment of new plants such as the Atlas Methanol plant, which requires about 160 MMscf/d and is fully supplied by bpTT from the Kapok field. The other new plant, the N 2000, requires about 160 MMscf/d and is fully supplied by EOG Resources from the Osprey field. The average utilisation for the period October 2003 to September 2004 was 13 MMscf/d. However, the average utilisation since start-up date April 2004 was 25 MMscf/d.
Average gas production in 2004 was 2,865 MMscf/d

Ministry of Energy & Energy Industries Annual Administrative Report 2003-2004
26
CURRENT AND FUTURE ACTIVITIES
The Trinidad and Tobago oil refining sector consists of one oil refinery that is owned and operated by Petrotrin and located at Pointe-a-Pierre.
For the period October 2003 to September 2004 the Pointe-a-Pierre refinery processed a total of 49.9 million barrels of crude oil. This figure represents an 8.1% decrease over the previous year and a 5.7% decrease with respect to the budgeted figure. There was also a 15.9% decrease in the processing of purchased crude and an increase of 2.2% in indigenous crude processing while third party processing remained constant.
Petrotrin processes indigenous and purchased crude as well as crude under processing agreements. Purchased crudes include Cano Limon, Oguendjo, Saramacca, Vasconia, Marlim and Mesa. The Pointe-a-Pierre refinery also processes crude oil from Barbados under a processing agreement.
When compared against budgeted figures the refining of local crude oil decreased by 0.9 million barrels while purchased crude refined also decreased by 2 million barrels. This represented a decrease of 3.7% and of 7.2% respectively. Crude processing peaked at 153 mbpcd in January of 2004.
In terms of exports in 2003-2004, the refinery exported some 33.3 million barrels of refined products. This was a decline of 16.3% over the 2002-2003 figure which stood at 39.8 million barrels, while sales of refined products on the local market increased by 6.7% from 5.9 million barrels to 6.3 million barrels.
Oil Refining
49.9 million barrels of crude oil processed at the Pointe-a-Pierre refinery in fiscal 2004

CURRENT AND FUTURE ACTIVITIES
27
I n c r e a s i n g L o c a l C o n t e n t
Table VIII Refinery Output (bbl)
Product Quantity Quantity 2003/2004 2002/2003
LPG 1,053,455 1,258,725Mogas 9,683,432 10,902,646Avgas 13,954 13,040White Spirit (42) 23Kero/avjet 4,527,805 5,620,899Gas Oil 10,302,779 11,825,651Fuel Oil 20,278,816 20,847,315Lube Oil (11,393) (8,485)Petrochemicals (999) (1,108)Other 2,535,968 2,172,246Gas/loss 1,357,360 1,343,268Bitumen 130,939 160,818Sulphur 26,014 77,597Total 49,898,088 54,212,635
Table VI Crude Oil Imports (bbl)
Crude Type Quantity Quantity 2003/2004 2002/2003
Antan 3,975,836 2,106,587Barbados 208,312 345,206Bijupira 4,486,700 0Congo Composite 3,578,644 2,387,661Cuisiana 0 225,594Guafita 0 546,925Kole 0 873,864Mandji 840,130 2,340,638Marlim 472,120 4,534,330Mesa 3,103,345 9,703,565Oguendjo 3,020,855 3,906,373Oriente 853,564 0Rio Grande 4,151,339 661,002Saramacca 0 41,993Vasconia 1,535,876 2,841,017Total 26,226,721 30,514,755
Table IX Product Sales - Local (bbl)
Product Quantity Quantity 2003/2004 2002/2003
LPG 578,873 417,672Mogas 3,012,154 2,832,815Kero/avjet 750,974 753,025Gas/Diesel Oil 1,912,778 1,912,245Fuel Oil 774 1,476Bitumen 1,761 2,433Others 39,929 28,256
Total 6,297,243 5,947,922
Table X Product Sales - Export (bbl)
Product Quantity Quantity 2003/2004 2002/2003
LPG 230,396 271,956Mogas 5,859,962 8,489,303Kero/avjet 2,052,762 2,425,961Gas/Diesel 6,215,800 7,516,540Bitumen 129,157 172,704Fuel Oil 17,227,813 18,169,791Lubes & Waxes 1,402 10,816Sulphur 53,157 77,351Others 1,527,008 2,698,439Total 33,297,457 39,832,861
Table VII Refinery Throughput (bpcd)
Year Local Imported Total
2002/2003 63,287 85,205 148,4922003/2004 64,658 71,781 136,439
Oil Refining (continued)
Local petroleum product sales in fiscal 2004 was 6,297,243 bbl

28
CURRENT AND FUTURE ACTIVITIES
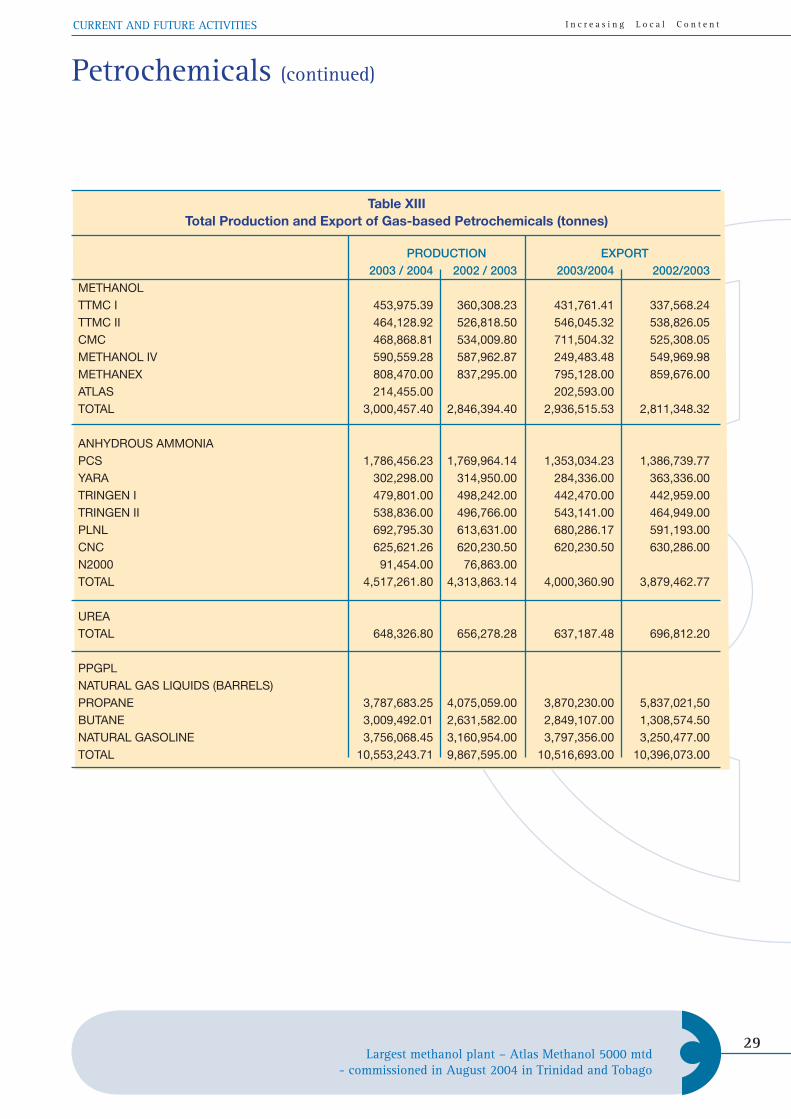
In the year 2003-2004 Trinidad and Tobago further enhanced its position as one of the leading natural gas processing countries in the world.
The petrochemicals sector continued to expand with new production coming on stream for both ammonia and methanol.
In 2003-2004, all petrochemical, LNG plants and Phoenix Park Gas Processors Limited (PPGPL) facilities were configured to operate at full production. Total production of methanol, ammonia, natural gas liquids (NGLs) and LNG rose in 2004 with only urea declining.
The increase in methanol production was due to improved performance from the Trinidad and Tobago Methanol Company (TTMC) II and Methanol IV plants and also new production capacity from the start up in September 2004 of the Atlas Methanol 5000 metric tons per day (mtd) plant.
The increase in ammonia production was due to better performance from the PCS plants, Tringen II and CNC plants and 1850 mtd of new ammonia production capacity from N2000, which began operations in September 2004.
NGL’s, Liquefied Petroleum Gas (LPG) and Natural Gasoline from PPGPL rose to another record high this year. The increase was due to the availability of more feedstock from ALNG Train III. As stated above, due to the advent of ALNG Train III coming on line in May 2003, overall LNG production and exports increased dramatically.
Plants under Construction/Start-upThe expansion of the downstream gas-based sector continued in 2003-2004 with some plants starting operations and others still under construction.
Two plants which started operations in August 2004 were the Nitrogen 2000 ammonia plant, with a capacity of 1850 mtd of anhydrous ammonia, and the Atlas Methanol plant with a capacity of 5000 mtd. Construction continued on ALNG’s Train IV, which is scheduled to start-up in November 2005 with a production of 5.2 million tons per annum (mtpa).
Site preparation began on the M5000 mtd plant. This plant will produce 5,400 mtd of methanol, making it the largest methanol plant in the world. The projected start date for the plant is June 30, 2005.
PPGPL’s final tie-in of its expansion unit took place in March 2004. This fractionation and storage expansion was designed to handle NGLs from ALNG’s Train II and III.
The ANSA McAL Urea Ammonia Nitrate (UAN) facility also started the permitting process with the Environmental Management Authority and Town and Country Planning.
Petrochemicals
Ministry of Energy & Energy Industries Annual Administrative Report 2003-2004
Table XILiquefied Natural Gas Production (m3)
2003/2004 2002/2003TRAIN 1 7,173,269.00 6,737,743.00TRAIN II 8,127,079.00 7,618,221.00TRAIN III 7,769,742.00 3,229,668.00TOTAL 23,070,090.00 17,585,632.00
Table XIILiquefied Natural Gas Sales (mmbtu)
2003/2004 2002/2003Train I 160,186,216.00 154,072,564.00Train II 182,193,571.00 172,515,229.00Train III 177,048,557.00 67,510.846.00LNG 519,428,344.00 394,098,639.00
Nitrogen 2000 ammonia plant commissioned in August 2004
CURRENT AND FUTURE ACTIVITIES
29
I n c r e a s i n g L o c a l C o n t e n t
PRODUCTION EXPORT 2003 / 2004 2002 / 2003 2003/2004 2002/2003METHANOLTTMC I 453,975.39 360,308.23 431,761.41 337,568.24TTMC II 464,128.92 526,818.50 546,045.32 538,826.05CMC 468,868.81 534,009.80 711,504.32 525,308.05METHANOL IV 590,559.28 587,962.87 249,483.48 549,969.98METHANEX 808,470.00 837,295.00 795,128.00 859,676.00ATLAS 214,455.00 202,593.00 TOTAL 3,000,457.40 2,846,394.40 2,936,515.53 2,811,348.32
ANHYDROUS AMMONIAPCS 1,786,456.23 1,769,964.14 1,353,034.23 1,386,739.77YARA 302,298.00 314,950.00 284,336.00 363,336.00TRINGEN I 479,801.00 498,242.00 442,470.00 442,959.00TRINGEN II 538,836.00 496,766.00 543,141.00 464,949.00 PLNL 692,795.30 613,631.00 680,286.17 591,193.00CNC 625,621.26 620,230.50 620,230.50 630,286.00N2000 91,454.00 76,863.00TOTAL 4,517,261.80 4,313,863.14 4,000,360.90 3,879,462.77
UREATOTAL 648,326.80 656,278.28 637,187.48 696,812.20
PPGPLNATURAL GAS LIQUIDS (BARRELS)PROPANE 3,787,683.25 4,075,059.00 3,870,230.00 5,837,021,50BUTANE 3,009,492.01 2,631,582.00 2,849,107.00 1,308,574.50 NATURAL GASOLINE 3,756,068.45 3,160,954.00 3,797,356.00 3,250,477.00TOTAL 10,553,243.71 9,867,595.00 10,516,693.00 10,396,073.00
Petrochemicals (continued)
Table XIII Total Production and Export of Gas-based Petrochemicals (tonnes)
Largest methanol plant – Atlas Methanol 5000 mtd- commissioned in August 2004 in Trinidad and Tobago

Ministry of Energy & Energy Industries Annual Administrative Report 2003-2004
30
CURRENT AND FUTURE ACTIVITIES
Marketing of the Government’s Share of Profit Crude Oil from Block 2C
The production of oil by BHP Billiton in Block 2C under a Production Sharing Contract was a historic moment for the Trinidad and Tobago oil industry. The MEEI, in collaboration with energy companies, BHP Billiton, Total and Talisman evaluated project economics for crude oil production negotiated crude oil valuation contracts; completed and executed valuation lifting and offtake agreements. The MEEI coordinated the arrangements for the monitoring of the quality and quantity of the Minister’s Share of Hydrocarbon from the fields in Block 2C. The MEEI also arrived at agreements with energy companies on marketing arrangements for the Minister’s Share of crude oil; and agreements among participating entities of joint marketing arrangements for the sale of initial cargoes. The price of crude oil and shipping rates were also monitored on the international market.
Marketing of Petrotrin’s and the Minister’s Share of Natural Gas from the North Coast Marine Area (NCMA)
The North Coast Marine Area (NCMA) as a unitised producing block includes the Minister’s Share of production from the gas fields in the area. The MEEI was involved in approving the commercial arrangements for the marketing of the natural gas as LNG. The process involved reviewing and approving all contracts and reviewing and monitoring all prices and expenditures.
Monitoring of Netback Prices for LNG Trains I, II and III.
Trinidad and Tobago is now a major exporter of LNG with three trains in operation. With regard to LNG, the role of the MEEI is to monitor netback prices and shipments of LNG. In keeping with this mandate the activities of the MEEI have focused on data compilation as it relates to Henry Hub prices, volumes, shipping rates, netback prices, destination distances, port charges, natural gas liquids, volumes, and re-gasification losses. In addition, the Train IV gas sales contract was reviewed and the MEEI is negotiating the terms for amendments to the contract.
Marketing Activities Retail Marketing
Issuing of Service Station Licences
The MEEI also has responsibility for the distribution of petroleum products and in 2003-2004 was involved in the following related activities:• The issuing of service station licenses;• Ensuring the inspection of service stations • Reviewing requests and making of
recommendations for transfer of ownership of service stations.
• Liaising with the wholesale marketing companies on matters of pricing and policy with respect to products.
• Approving renewal of 164 licences.
Phasing out of Leaded 95 and 83 and the Introduction of Unleaded 92
During 2003/2004, the MEEI monitored the activities associated with the phasing out of leaded 95 and 83 and the introduction of unleaded 92. This policy decision was taken to ensure that Trinidad and Tobago meets a higher environmental standard with respect to vehicle emissions. The implementation of this phasing out was done through collaboration with the National Petroleum Marketing Company, Petrotrin and Unipet.
The commissioning of Atlantic LNG III makes Trinidad and Tobagothe seventh largest LNG exporter in the world

CURRENT AND FUTURE ACTIVITIES
31
I n c r e a s i n g L o c a l C o n t e n t
New and Renewable Energy
Renewable energy is one of the most significant areas of development in the global energy sector as countries seek to diversify their energy supply mix. In 2003-2004 the MEEI through the Energy Research and Planning Division was actively involved in two main initiatives at the local and regional level in the promotion of renewable energy technologies and use.
Solar water-heating project
The MEEI in association with the bpTT, Tourism Industrial Development Company (TIDCO) and the United Nations Development Programme (UNDP) embarked on preparatory discussions for the introduction of a pilot project on solar water heating in Host Homes of Trinidad and Tobago. During 2003-2004 the Energy Research and Planning Division was involved in a round of stakeholder alliance meetings for the implementation of the solar water-heating project. This project was being developed and implemented mainly to provide first hand information and knowledge on system performance and efficiencies to be obtained from this solar energy application. It was also expected that the information will partly influence the formulation of a national renewable energy policy and programme for the country.
The greening of the tourism sector was selected as the target for the pilot project with emphasis being placed on the host home sub-sector.
In this reporting period the activities revolved around the groundwork and administrative arrangements for the relevant agreements among the project partners and cost sharing arrangements between the MEEI, bpTT, TIDCO and UNDP. The Project was expected to be officially launched in the new fiscal year.
Caribbean Renewable Energy Development Project (CREDP)
The Caribbean Renewable Energy Development Project (CREDP) was officially launched in May 2004 among 16 Caribbean countries including Trinidad and Tobago. The MEEI, through the ERPD, serves as the National Focal Point for CREDP and also as a member of the Project Steering Committee for the implementation of the programme of activities. The project addresses four main barriers relating to policy, financing, capacity building, and awareness.
The main objective of CREDP is to remove the barriers to the use of renewable energy in the Caribbean and thereby foster its development and commercialisa-tion. The project targets an estimated 5% in the share of renewable energy by 2015 due to the planned barrier removal activities. Currently, renewable energy provides less than 2% of the region’s commercial electricity. It is also anticipated that this increased use of renewable energy would imply annual reductions of carbon dioxide emissions by some 680,000 tonnes.
CREDP is funded by the United Nations Global Environmental Fund and a combination of funding support mechanisms from regional governments, private equity and loans. Total funding for the programme is $US 22.4 million. The Executing Agency for CREDP is CARICOM and the project management unit is housed at the CARICOM Secretariat.
During this period the MEEI participated in the regional network meetings for the full implementation of the project.
Pilot project on Solar Water Heating in Host Homesto be launched in Trinidad and Tobago

MEEI Administrative Support Units

As shown in Figure II of the current MEEI Organisation
Structure, eight Administrative Units were identified to
support the technical work of the MEEI, comprising:
• Accounts
• Communications
• General Administration
• Human Resources
• HSE/Inspectorate and Risk Management
• Information Technology
• Library
• Legal Services
As the new MEEI organisation structure evolves, the
details of the individual Support Groups are to be
developed accordingly in relation to the functions of
the Core Divisions.
The routine work of the Support Groups is incorporated
throughout this report, with this section highlighting
some of the more significant activities as follows:
• The creation of the Communications Unit
with the identification of two positions of
Communications Manager and Communications
Officer. Pending the addition of these positions
to the MEEI Establishment, a Communications
Officer was appointed on contract in 2003;
• The new administrative relationship of the MEEI
library within the National Library and Information
System (NALIS) and the related activities;
• The development of the HSE Inspectorate and
Risk Unit of the MEEI and the related proposal.

Ministry of Energy & Energy Industries Annual Administrative Report 2003-2004
34
Library Services
As part of the Ministry’s strategic planning process for 2003-2010, the library prepared proposals for the future development of its services in keeping with its institutional role and functioning during its 30-year existence in the Ministry and its new administrative relationship with the National Library and Information System Authority (NALIS).
NALIS was incorporated by Act No. 18 of 1998, “to provide for the development and coordination of all library and information services in Trinidad and Tobago and related matters”. In this regard the Ministry also reviewed and responded to a Draft Memorandum of Understanding, outlining the business relationship of NALIS to the Ministry.
Other major highlights of the library activities for fiscal 2004 revolved around the significant impact of technology developments on the business of information services delivery. These included market research of new information products and the following:
• Sourcing and acquisition of computer software programme for the management of the key library functions and provision of on line database services. The installation process is being undertaken with the requisite conversion and editing of the library records to facilitate enterprise wide user searching of the library catalogues.
• Sourcing and negotiating subscription licences for electronic publications and journals and databases for single, multiple and corporate access accordingly.
• Planning for the digitisation of key historical documents beginning with the Ministry’s annual administrative reports dating back to 1905.
In its role as the National Focal Point for the Caribbean Energy Information System (CEIS), a regional information network among 18 countries for the collation and exchange of energy data, the library participated in the following activities:
• A review of the CEIS business operations in keeping with the technology impact on its primary information products and identification of new services.
• Initial survey and research for the launch of a UNDP-sponsored programme relating to the identification of the major barriers to Caribbean Renewable Energy Development (CREDP) in the region.
Overall, during fiscal 2004 there was a noted increase in the use of the MEEI library collection by external clientele, especially local and overseas tertiary level students seeking economic and technical information on the Trinidad and Tobago energy sector.
MEEI ADMINISTRATIVE SUPPORT GROUPS
Cabinet approves new MEEI organisation structure
In fiscal period 2004, prior to the restructuring of the Operations Section, HSE and Measurement portfolios and job functions were being managed in relation to the MEEI Strategic Plan 2003-2010 and the requirements of the Petroleum Act and Regulations. The primary objectives of these two main portfolios were as follows:
1. Health, Safety and Environment portfolio Prevention and Control of HSE risks which
have the potential to cause harm, damage and undesirable consequences to people, property and the environment. Through this portfolio, economic
liabilities associated with facility downtime, pollution and accidents are assessed and evaluated.
2. Measurement portfolio Validation of the quality and quantity of produced
energy resources and retailed fuel products. On the crude oil production side, this portfolio ensures that the State derives a fair and equitable return on produced resources, while on the downstream side, this portfolio ensures that end consumers get the correct specification and quantity of petroleum by-product for which payment is made.
HSE / Measurement Division

35
I n c r e a s i n g L o c a l C o n t e n t
HSE / Measurement Division (continued)
MEEI ADMINISTRATIVE SUPPORT UNITS
Seven new administrative divisions created in the MEEI
These two portfolios dictate the MEEI’s regulatory framework for approving, inspecting and licensing of energy-based facilities which span the life cycle of the facility from development, through operation up until abandonment.
Roles and Responsibilities
a) HSE duties include but are not limited to:• Evaluation of new-built, modified and
repaired facilities for Approval purposes;• Research and Development of HSE
Guidelines, Codes and Standards;• Decommissioning/Abandonment;• Inspection/Audits;• Investigations into Accidents/Incidents
and matters of non-compliance;• Management of National and Bilateral Oil
Spill Contingency Plans;• Emergency Planning and Preparedness;
b) Measurement duties include but are not limited to:• Approval of measurement systems and
methods of measurement • Verification of tank strapping • Monitoring the fiscalisation of crude;• Calibrations of gas meters and crude oil
storage tanks• Service station pump calibration and fuel
specification verification (testing by Cariri Lab);
• Resolving any measurement discrepancies relating to energy installations (in current establishment the data supplied by HSE/Measurement Division is processed by the MEEI Divisions of Downstream and Retail Marketing and the Commercial Evaluation).
Regulatory Objectives
In executing the HSE/Measurement functions the following goals are to be realised:
1) Economic:a) Ensure no errors in determination of
quantity and quality of - Produced resources (fiscalisation)- Retailed products (taxation/quality
control); b) Ensure no unauthorised deviations
in Exploration, Development and Operational Plans;
c) Minimise cost overruns on projects being granted tax concessions;
d) Promote business continuity and sustainability.
2) HSE Loss Prevention and Control: Minimise the chances for serious HSE risks from
manifesting and becoming incidents, which carry the potential to: - Impact negatively on people, property
and the environment
Regulatory Coverage
Scope of MEEI’s regulatory coverage spans the facilities that make up the energy sector and includes:
1) Explorations:Drilling Rigs (land, jack-ups, semi-subs anddrill-ships); Workover Rigs
2) Production Facilities:Offshore Platforms; Onshore Gathering StationsSubsea Facilities; Floating Production Storageand Offloading (FPSO)
3) Transportation/Distribution: Pipelines; Road Tank Wagons; Crude Oil Shuttle
Tankers; Bunkering Barges 4) Conditioning/Refining: Crude Oil Refineries; Gas Treatment and
Conditioning 5) End Stream Manufacturing:
Petrochemicals; Gas Liquefaction6) Retail & Marketing:
LPG Bottling; Service Stations; Bunkering Facilities
Staffing
The HSE/Measurement Division is made up of a multidisciplinary group comprising Petroleum Inspectors; Mechanical Engineers, Chemical Engineers and a Petroleum Chemist. HSE functions are also supported by the Petroleum Engineers and the Geologists on related environmental matters, e.g. blowouts, natural hydrocarbon seepage, etc.
Impact of OSH Legislation on restructuring processThe enactment of the OSHA legislation in 2004 was influential to the start of a collaboration process between the relevant agencies in the re-organisation and work of the HSE/Measurement Division in the Ministry of Energy and Energy Industries.

International / Regional

During 2003-2004, the MEEI participated in the
following regional and international energy sector
developments:
• The initial discussions on the Petrocaribe
Initiative to Caribbean countries;
• The study and discussion on the supply of
natural gas to other Caribbean countries through
the Eastern Caribbean Gas Pipeline;
• Hosting of the Sixth Western Hemisphere
Energy Ministers meeting in Tobago.

Ministry of Energy & Energy Industries Annual Administrative Report 2003-2004
38
INTERNATIONAL / REGIONAL
The Petrocaribe initiative that was introduced in July 2003 was the subject of the second meeting of the Energy Ministers of the Caribbean and representatives of the Bolivarian Republic of Venezuela that was held in August 2004. This meeting was held in Montego Bay, Jamaica under the Chairmanship of the Honourable Phillip Paulwell, Minister of Commerce, Science and Technology (with Energy) of Jamaica. Also in attendance were representatives of the Cuban and Venezuelan governments and representatives of the Latin American Energy Organisation (OLADE). Trinidad and Tobago was represented by the Honourable Eric A. Williams, Minister of Energy and Energy Industries.
The Ministers in attendance discussed the impact of high oil prices on the economies of energy deficient Caribbean countries. Coming out of these discussions, it was determined that Petrocaribe should be a catalyst for the introduction of alternative approaches to market access, product distribution and retail, and correction of the various pricing inequities that prevail in some markets through creative business and financial arrangements and social programmes.
To fast track progress, the Ministers established a Technical Commission under the Chairmanship of the Bolivarian Republic of Venezuela to draft the Multilateral Agreement and consult with member states in order to present a draft of the Agreement for consideration and approval at the next Ministers Meeting, to be hosted by the Bahamas in November 2004.
Petrocaribe Eastern CaribbeanPipeline
In 2003-2004, the Government of Trinidad and Tobago announced a feasibility study for the establishment of an Eastern Caribbean gas pipeline. In early 2004 Guardian Holdings Ltd (GHL) and the AIC Financial Group Ltd joined Intra Caribbean Gas Pipeline Company and formed the Eastern Caribbean Gas Pipeline Company Ltd (ECGPC) to perform the feasibility study for the project. The project envisions the supply of natural gas from Trinidad and Tobago’s offshore fields to countries in the Eastern Caribbean including the French departments. If the project proceeds, it is expected to cost some $US550 million.
Feasibility study for an Eastern Caribbean natural gas pipeline announced
39
I n c r e a s i n g L o c a l C o n t e n tINTERNATIONAL / REGIONAL
Cross-border Talks with Venezuela
In August 2003, Venezuelan President Hugo Chavez visited Trinidad and Tobago. Coming out of this visit a Memorandum of Understanding was signed between Venezuela and Trinidad and Tobago to establish the procedure for the unitisation of hydrocarbon reservoirs that extend between the delimitation line between both countries.
The issues to be addressed in the MOU with respect to the unitisation process included:
a. The dates and places of meeting of the Steering Committee;
b. The creation of joint technical working groups;
c. The negotiation of agreements to facilitate the exchange of the data;
d. The joint determination of:• The extent to which a hydrocarbon reservoir
existing in the geographical area between the Bolivarian Republic of Venezuela and the Republic of Trinidad and Tobago is subject to Article VII of the delimitation treaty of 1990 and if such were the case, it was be declared;
• The boundaries, features and dimensions of each hydrocarbon reservoir;
• The hydrocarbons in place contained in the portion of each hydrocarbon reservoir belonging to the Bolivarian Republic of Venezuela and the Republic of Trinidad and Tobago respectively, as well as the establishment of the rules pursuant to which the hydrocarbon reservoir shall be re-assessed for future exploitation;
e. The appraisal and development of hydrocarbon reservoirs;
f. The negotiation of preliminary agreements, which may facilitate the advancement of the unitisation process.
In addition to the MOU there was also a Letter of Intent signed by both the Ministers of Energy for Trinidad and Tobago and Venezuela, the Honourable Eric A. Williams and Rafael Ramirez respectively. This Letter of Intent outlined a number of areas where there would be energy cooperation between both countries. These areas included:
a. Participation by Trinidad and Tobago State firms, in conjunction with PDVSA, in the development of the Platforma Deltana gas blocks;
b. Monetisation of volumes of natural gas from the Platforma Deltana in LNG trains in Trinidad and Tobago;
c. Joint refining and commercialisation of crude oil destined for CARICOM; Member States under a supply, refining and commercialisation agreement between both countries;.
d. Joint exploitation of new petroleum discoveries in Venezuela;
e. Participation by Venezuela in the development of and supply of gas to the Intra-Caribbean Natural Gas Pipeline Project;
f. Utilisation of the capacity of the Venezuelan steel industry to build a joint venture platform fabrication industry between Trinidad and Tobago and Venezuela.
Memorandum of Understanding to establish the procedure for the unitisationof hydrocarbon reservoirs signed between Venezuela and Trinidad and Tobago
Ministry of Energy & Energy Industries Annual Administrative Report 2003-2004
40
Trinidad and Tobago’s reputation as a leader in the Western Hemisphere with respect to energy matters was enhanced by hosting of the Sixth Western Hemisphere Energy Ministers Meeting in the sister isle of Tobago. The meeting was formally opened by the Prime Minister of Trinidad and Tobago, the Honourable Patrick Manning who also delivered the feature address.
The meeting lasted two days and consisted of sessions for private and public sector dialogue. The meeting concluded with a Ministerial Meeting on April 21, 2004.
Items discussed at the private/public sector dialogue included:
• Enhancing Western Hemisphere petroleum trade and cross-border natural gas trade;
• Addressing energy poverty (off-grid electric power applications and diversifying supply);
• Financing Western Hemisphere energy projects; and
• Special needs of Caribbean states (institutional and regulatory issues; dialogue).
The Minister of Energy, the Honourable Eric A. Williams, Minister of Energy and Energy Industries chaired the Ministerial Meeting on April 21, 2004. Minister Williams informed delegates of the need for co-operation among countries in the Western Hemisphere in order to ensure that the energy resources of the Hemisphere were properly managed.
The sentiments expressed by Minister Williams were echoed by the United States Secretary of Energy, Spencer Abraham, who further suggested the inauguration of a Western Hemisphere Energy Technology Initiative (WHETI) that would allow the nations of the Western Hemisphere to share technological advancements in the areas of exploration, processing and possible new sources of energy. At the conclusion of the Meeting of Ministers, there was consensus on two follow-up initiatives:
• The creation of a WHETI
• The drafting of a Consensus Statement on Energy Security in the Western Hemisphere for presentation to the Heads of State at the Summit of the Americas meeting in 2005.
It was agreed that the United States would lead the effort to follow up on the WHETI with Trinidad and Tobago as co-chair.
As regards to the drafting of the Consensus Statement on Energy Security for presentation at the Summit of the Americas meeting in Argentina, in 2005, it was agreed that Trinidad and Tobago will take the lead on this initiative with the United States serving as co-chair. The next step will be to convene a meeting of senior energy officials of Western Hemisphere energy countries to discuss their countries’ perspectives on energy security in the region. The Meeting also presented the opportunity for the Ministers to hold a number of bilateral meetings. In this regard, Trinidad and Tobago met with the United States of America, the
The Sixth Western HemisphereEnergy Ministers’ Meeting
INTERNATIONAL / REGIONAL
Sixth Western Hemisphere Energy Ministers Meeting held in April 2004 in Tobago

41
I n c r e a s i n g L o c a l C o n t e n t
Bolivarian Republic of Venezuela and Canada. Prime Minister Patrick Manning led a Trinidad and Tobago delegation in a private meeting with U.S. Secretary of Energy Spencer Abraham. At this meeting, issues surrounding the security of energy supply to the United States and Trinidad and Tobago’s desire for involvement along the entire LNG value chain in the United States market were discussed. The Ministers also discussed the issue of greater returns to the Government of Trinidad and Tobago as it relates to ensuring security of supplies to the United States and the issue of “Most Favoured Nation” status for Trinidad and Tobago.
The Ministers with responsibility for Energy for Trinidad and Tobago and Venezuela, the Honourable Eric A. Williams and the Honourable Rafael Ramirez also met to discuss the cross border unitisation of the hydrocarbon reserves of both countries. To this end, both states signed an agreement for the exchange of data to facilitate the current negotiations for the unitisation of hydrocarbon resources that straddle their respective borders.
Minister Williams also held discussions with the Canadian Minister of Energy, the Honourable John Efford, on matters surrounding the continued co-operation between both countries on issues relating to energy.
Overall the meeting was a tremendous success with significant headway being made on the critical issue of hemispheric energy security. The meeting also reinforced Trinidad and Tobago’s position as a leader in the hemispheric energy landscape from an industrial and technological perspective.
The Sixth Western HemisphereEnergy Ministers’ Meeting (continued)
INTERNATIONAL / REGIONAL
Inauguration of a Western Hemisphere Energy TechnologyInitiative (WHETI) launched at Ministers’ meeting
Left to right: The Hon. Spencer Abraham,US Secretary of Energy; The Hon. Patrick Manning, Prime Minister of Trinidad and Tobago;The Hon. Eric A. Williams, Minister of Energyand Energy Industries
Left to right at table: Minister Williams; Prime Minister Manning; Spencer Abraham; and Orville London, Chief Secretary,Tobago House of Assembly .

MEEI Focus

Local Content and Local Capacity Building
MEEI FOCUS I n c r e a s i n g L o c a l C o n t e n t
43
It’s indeed a pleasure for me to address you today on this significant occasion in the development of the upstream petroleum industry in Trinidad and Tobago. It seems like just yesterday, but it was in fact August of last year that we announced that the Kairi 1 platform would be fabricated at Labidco. This project is an historic one; in that it marks the first ever undertaking to construct an offshore operations structure at the Labidco facility. By means of this initiative, the Government is expecting further similar projects to be pioneered that will help to establish local capacity at the fabrication end of the petroleum industry.
Let me firstly congratulate BHP Billiton and their partners Total and Talisman for the confidence they have demonstrated in the ability of local contractors and suppliers to meet their fabrication needs.
In respect of the development of the Angostura field, I am aware that BHP has constructed the first two well-monitoring platforms and the central processing platform in the United States. This was because of the then constraints of local capacity here in Trinidad and Tobago and the BHP’s very aggressive project schedule for first oil by the end of 2004.
I am pleased to note that Damus a local supplier for this contract was able to work cooperatively with its joint venture partner, Gulf Island Fabricators, in order to complete this project.
It is no secret that one of the Government’s main goals in the energy sector is the increase of local content and local equity participation in major energy sector projects. My Ministry views such local capital “spend” and the resulting creation of such local expertise in the energy sector in areas such as project management, engineering design and project support resources, as critical to the building of the local human resource capacity of the nation.
The following is a feature address delivered in April 05 2004 by the Honourable. Eric A. Williams –Minister of Energy and Energy Industries on the occasion of the completion of the first offshore platform to be constructed at the La Brea Industrial Estate – the Kairi 1 Platform
Such skills and know-how benefit not just the energy sector but also the non-oil sectors of the economy, since such skills are easily transferable to other sectors of the economy.
I am pleased to note that this project has also resulted in significant transfer of technology for our local engineers and welders, as Damus engineers travelled to Gulf Island’s facility in the United States to observe the fabrication of ‘sister’ decks like K-2. Additionally, a significant investment has been made by BHP Billiton and its joint venture partners in new welding equipment, and in the training of Damus welders in flux-core welding techniques which will hopefully benefit other fabrication projects within Trinidad and Tobago. This is what it is about, partnership for success.
We are optimistic that other local contractors will benefit from such transfers of technology and knowledge in the long run and I expect that this BHP Billiton initiative will be the first of many more to come.
Eric A. Williams

Kairi Platform (continued)
MEEI FOCUSMinistry of Energy & Energy Industries Annual Administrative Report 2003-2004
44
To Damus and their overseas partners Gulf Island Fabrication, congratulations on your achievement. This partnership has provided a unique opportunity for the transfer of the relevant technologies towards the continuing strengthening of local capacity at the fabrication end of the energy sector. It is the view of the Government of Trinidad and Tobago that such partnerships are critical to its overall goal of sustainable development as the country moves towards realising developed nation status by the year 2020.
Ladies and Gentlemen, one of the key challenges facing the Government of Trinidad and Tobago is the equitable distribution of the country’s wealth to the benefit of the widest cross-section of its citizens. In our view, this must be done without the creation of uncontrolled inflation within the economic system and in a manner that will redound to the sustainable development of the country and its people.
It is interesting to note that the energy sector accounts for almost one-quarter of the Gross Domestic Product of Trinidad and Tobago, that is, $9.7 billion of a total $42.6 billion between 1996 and 2001. In comparing our GDP to our GNP, there is a large and growing gap between the two, currently in the order of TT$2.7 billion. This represents one of the key macroeconomic challenges which we face. Certainly, one key strategy to narrow this gap is to ensure that as much of the capital expenditure ‘spend’ on these types of projects as possible physically takes place here in Trinidad and Tobago, which again underlines my pride at seeing this project completed.
It would be remiss of me if I did not note that this ceremony would not be taking place today were it
not for the policy intervention of the Government in respect of its decision to build a fabrication yard at the Labidco industrial estate in La Brea. It is because of the Government’s position that greater value must be obtained from these large capital-intensive projects that we made the deliberate decision to provide infrastructural facilities to build offshore structures at La Brea.
Ladies and Gentlemen, the government’s local content visionis two-fold:• To maximise on the development
opportunity presented by the large and mainly foreign direct investments in the economy;
• To foster vibrant, dynamic, creative and economically productive local industries, which will initially support local activities, but which could later on be competitive on a global scale.
The adoption of these strategies is but one element of the Government’s plan to maximise local value added. In this way, the Government is working towards the achievement of our Vision 2020 development goals for the country driven by holistic and comprehensive policies. This project is but one example of what is possible when these strategies are matched by private sector effort, and translated in results for the energy sector and the nation.
Again, I congratulate BHP Billiton and its partners for their vote of confidence in our local contractors, and I especially thank Damus for gearing themselves up to undertake this historic project. Kudos also to Gulf Island Fabricators, joint venture partner of Damus, and Labidco for continuing to lay the pathway for increased local content.
Statistical Appendices


STATISTICAL APPENDICES
47
I n c r e a s i n g L o c a l C o n t e n t
SUMMARY OF EXPLORATORY AND SEMI-EXPLORATORY ACTIVITIES IN 2003/2004
Appendix I
Lahee Depth TD of
Exploratory Date Date Drilled Well
Operator Well Name Location Class Spudded Completed (feet) (feet) Result/Remarks
EOG RESOURCES U(B) 1 N 1114852.95 A2 8/11/04 09/19/04 17,246 17,246 PLUGGED & ABD
E 768576.51
OB-3X N 1115858.090 A1 10/04/03 11/05/03 18,536 18,536 TEMP ABD
E 763991.280
BHP BILLITON BIMURRABURRA 1ST N 1183797.04 A3 09/04/03 10/21/03 3,614 7,046 ABD (DRY)
E 779669.67
DELAWARE 1 N1190706.36 A3 10/26/03 12/11/03 6,900 5,951 COMPL (OTHER)
E 769866.97
PUNCHEON 1 N 1186487.79 A3 12/12/03 01/17/04 7,430 7,665 ABD AFTER TEST
E 767071.76
PUNCHEON 1X N 1186487.79 A3 01/17/04 02/19/04 8,660 7,500 ABD DRY
E 767071.76
ANGOSTURA 3 N 1181862.82 A1 02/21/04 04/07/04 9,554 8,383 ABD DRY
E 758178.69
TRINMAR SOLDADO 843 N 1129056.08 A2c 11/22/03 10/31/04 7,200 7,200 ABD AFTER TEST
E 621973.07
BPTT CHACHALACA 1 ST1 N 111283.03 A1 07/13/04 01/05/05 15,633 14,725 COMPL (STEAM INJECTOR)
E 802202.25

Ministry of Energy & Energy Industries Annual Administrative Report 2003-2004
48
STATISTICAL APPENDICES
% C
hang
eIte
m
Unite
20
04/2
003
2004
20
03
2002
20
01
2000
19
99
1998
19
97
1996
19
95
Crud
e Oi
l ‘0
00 b
bl
-8.5
6
44,9
80
49,1
91
47,6
84
41,3
74
43,5
93
45,6
17
44,7
59
45,1
66
47,1
13
47,5
84
Casi
ng H
ead
Gaso
line
(C.H
.P.S
.) ‘0
00 b
bl
– 0
0
0
0
0
0
0
0
0
0
Tota
l Cru
de O
il an
d Na
tura
l Gas
olen
e (1
+2)
‘0
00 b
bl
-8.5
6
44,9
80
49,1
91
47,6
84
41,3
74
43,5
93
45,6
17
44,7
59
45,1
66
47,1
13
47,5
84
Crud
e Oi
l Pro
duct
ion
- St
ate
Oil R
ight
s ‘0
00 b
bl
-8.5
3
43,9
28
48,0
24
46,3
92
39,9
45
42,0
25
43,9
84
43,0
93
43,4
50
45,3
52
45,6
57
Crud
e Oi
l Pro
duct
ion
- Pr
ivat
e Oi
l Rig
hts
‘000
bbl
-9
.85
1,
052
1,
167.
00
1,29
3
1,42
9
1,56
8
1,63
3
1,66
6
1,71
6
1,76
0
1,92
7
Tota
l Im
ports
‘0
00 b
bl
-22.
28
25,8
20
33,2
22
33,3
47
35,5
64
35,4
28
29,4
44
22,1
25
10,9
59
11,6
17
11,0
03
Impo
rts o
f Refi
ned
Prod
ucts
‘0
00 b
bl
54.9
8
3,34
6 2,
159
1,37
2 2,
166
23
3
1,70
2
1,89
4
2,88
0
3,09
4
3,88
3
Impo
rts o
f Cru
de O
il fo
r Refi
ning
‘0
00 b
bl
-27.
65
22,4
74
31,0
63
31,9
75
33,3
98
35,1
95
27,7
42
20,2
31
8,07
9
8,52
3
7,00
5
Impo
rts o
f Oth
er O
ils fo
r Refi
ning
and
Ble
ndin
g ‘0
00 b
bl
– 0
0 0
0
0
0
0
0
0
115
Tota
l Exp
orts
‘0
00 b
bl
-11.
02
72,9
78
82,0
13
79,1
94
113,
977
66
,022
72
,998
71
,107
72
,565
76
,360
51
,641
Expo
rt of
Cru
de O
il ‘0
00 b
bl
-21.
61
20,4
67
26,1
08
24,9
78
18,3
33
19,1
88
21,1
78
18,8
04
20,3
22
20,8
86
21,4
86
Expo
rts o
f Refi
ned
Prod
ucts
‘0
00 b
bl
-6.0
7
52,5
11
55,9
05
54,2
16
95,6
44
50,9
80
51,8
20
52,3
03
52,2
43
55,4
74
30,1
55
Runs
to S
tills
‘0
00 b
bl
-11.
55
47,8
38
54,0
86
54,9
29
55,9
78
58,9
59
54,7
45
50,3
38
34,2
64
33,7
31
35,7
05
Daily
Refi
nery
Cap
acity
Bb
l/day
0.
00
160,
000
160,
000
160,
000
160,
000
16
0,00
0
160,
000
17
5,00
0
175,
000
17
5,00
0
260,
000
Num
ber o
f Wel
ls S
pudd
ed
As S
tate
d -1
2.42
13
4 15
3 74
15
6
130
91
93
13
2
67
90
Tota
l Num
ber o
f Wel
ls C
ompl
eted
As
Sta
ted
2.03
15
1 14
8 76
11
4
125
87
94
99
87
61
Num
ber o
f Wel
ls C
ompl
eted
as
Oil W
ells
As
Sta
ted
-7.0
3
119
128
41
84
109
64
68
94
61
34
Num
ber o
f Wel
ls A
band
oned
As
Sta
ted
142.
86
17
7 15
16
9
13
17
19
16
24
Tota
l Dep
th D
rille
d
Feet
3.
12
524,
408
508,
546
510,
362
606,
329
46
8,78
6
445,
007
56
8,86
2
549,
806
40
0,57
7
488,
556
Dept
h Dr
illed
on
Stat
e Oi
l Rig
hts
Feet
3.
12
524,
408
508,
546
507,
055
572,
107
43
5,72
8
396,
089
56
3,07
7
532,
726
35
2,82
8
449,
416
Dept
h Dr
illed
on
Priv
ate
Oil R
ight
s Fe
et
– 0
0 3,
307
34,2
22
33,0
58
48,9
17
5,78
4
17,0
80
47,7
49
39,1
40
Aver
age
Dept
h of
Com
plet
ed W
ells
Fe
et
15.2
7
3,83
4
3,32
6
7,39
1
4,65
1
4,30
1
5,11
5
6,05
3
4,65
9
4,65
2
8,58
9
Aver
age
Num
ber o
f Wel
ls P
rodu
cing
As
Sta
ted
2.53
3,
967
3,
869
3,
808
3,
887
3,
998
3,
892
4,
121
4,
086
3,
941
3,
736
Aver
age
No. o
f Wel
ls P
rodu
ced
by F
low
ing
As
Sta
ted
0.97
31
1
308
30
8
356
42
6
396
39
8
356
29
4
281
Aver
age
No. o
f Wel
ls P
rodu
ced
by A
rtific
ial L
ift
As S
tate
d 2.
67
3,65
6
3,56
1
3,50
0
3,53
1
3,57
2
3,49
6
3,72
3
3,73
0
3,64
7
3,45
5
Aver
age
Daily
Pro
duct
ion
per P
rodu
cing
Wel
l Ba
rrel
-1
0.92
31
.0
34.8
34
.3
29.2
29
.8
32.1
29
.8
30.3
32
.7
34.9
Aver
age
Daily
Pro
duct
ion
per F
low
ing
Wel
l Ba
rrel
-2
1.29
14
9.4
189.
8 17
7.0
94.9
90
.3
110.
9
83.8
95
.8
118.
7
129.
8
Aver
age
Daily
Pro
duct
ion
per A
rtific
ial L
ift W
ell
Barr
el
-2.3
4
20.9
21
.4
21.8
22
.5
22.6
23
.2
23.9
24
.0
25.7
27
.2
Tota
l Val
ue o
f Dom
estic
Exp
orts
*
‘000
$ 25
.70
40,0
15,6
62
31,8
34,3
99
22,9
94,0
75
25,9
95,9
27
26,4
50,6
37
16,8
91,4
65
13,6
97,4
40
15,1
78,5
38
14,3
68,3
68
14,0
31,0
77
Tota
l Val
ue o
f Pet
role
um P
rodu
cts
(Item
29)
*
‘000
$ -4
3.82
5,
650,
825
10,0
57,6
73
7,24
0,48
5
9,37
1,72
5
10,4
67,6
75
5,74
8,41
4
4,33
8,40
8
4,14
2,18
7
4,64
6,65
8
661,
845
Tota
l Val
ue o
f Asp
halt
Prod
ucts
*
‘000
$ -9
3.65
2.
0 31
.5
51
6,65
7
14,9
11
21,4
25
13,1
11
15,4
08
19,7
29
21,1
72
Tota
l Nat
ural
Gas
Pro
duce
d
Mill
ion
M^
3 12
.63
30
,418
27
,007
19
,173
16
,599
15
,525
13
,240
10
,294
9,
137
9,
058
7,
762
Used
as
Fuel
M
illio
n M
^3
10.8
3
9,25
5
8,35
1
7,07
0
6,58
4
5,68
0
5,65
3
5,56
0
5,02
3
4,75
7
4,36
1
Repl
aced
in F
orm
atio
n M
illio
n M
^3
– 0
0
0
0
0
0
0
0
0
0
Loss
es, N
ot C
olle
cted
M
illio
n M
^3
0.42
23
8
237
22
7
279
16
6
165
19
1
155
14
5
103
Annu
al S
tatis
tics
of P
rodu
ctio
n, D
rillin
g, R
efini
ng, E
xpor
ts a
nd Im
port
s 19
95 -
200
4Appendix II
Sour
ce: C
entra
l Sta
tistic
al O
ffice
from
The
Ann
ual O
vers
eas
Trad
e Pa
rt A.

STATISTICAL APPENDICES
49
I n c r e a s i n g L o c a l C o n t e n t
Summary of Development Drilling in Trinidad and Tobago - 2004
No. of Oil & Gas Wells * Total Total Depth Drilled Drilling Rigs on Development
Area Producers Abandoned Completion ** (feet) Wells as at 31/12/04
1 7 0 7 32,308 1
2 20 0 20 27,454 0
4 13 1 14 47,200 2
5 6 0 6 15,442 0
6 61 1 62 34,724 0
9 2 5 7 6,039 0
11 11 2 13 130,000 0
15 12 2 14 135,890 1
TOTAL 132 11 143 429,057 4
AREA AREA
NUMBER
1 Soldado, North Marine, Couva Marine, Manicou
(Gulf of Paria Block 1).
2 Pt. Ligoure, F.O.S., Area IV and Guapo, Boodoosingh,
Point Fortin West and Central, Parrylands, Cruse, Guapo.
3 Brighton (Land and Marine), Vessigny, Merrimac.
4 Palo Seco, Los Bajos, Erin, Central Los Bajos, Mackenzie,
South Erin, Grand Ravine.
5 Forest Reserve, Fyzabad, Point Fortin East, New Dome,
San Francique, Apex Quarry, Roodal.
6 Quarry, Coora, Quinam, Morne Diablo.
7 Oropouche
8 Penal, Barrackpore, Wilson, Siparia, Puzzle Island Debe.
AREA AREA
NUMBER
9 Moruga North and West, Rock Dome, Inniss, Trinity, Catshill, Balata, Bovallius.
10 Marcelle/Beach, Guayaguayare, Moruga East, Maloney.
11 Pelican, Galeota, Teak, Samaan, Poui, Cassia, Kapok, Immortelle, Flamboyant, Banyan, Mahogany, Amherstia, Kiskadee, Ibis, Mora, South East Galeota, North West Teak, West Samaan, Dolphin (Block 6), ECMA Block 5a, Osprey, Parula, Starfish, Dolphin Deep, Manatee, Oilbird.
12 South Marine (South Coast), Mobil.
13 Tabaquite, Pointe-a-Pierre, Springvale.
14 Icacos, South West Peninsula, Bonasse.
15 Northern ECMA - Angostura, Aripo, Canteen, Kairi
16 NCMA - Hibiscus, Chaconia, Poinsetta, Ixora.
Key to Field, Area or District Number
Appendix III
Summary of Development Drilling in Trinidad and Tobago - October 2003 - September 2004
No. of Oil & Gas Wells * Total Total Depth Drilled Drilling Rigs on Development
Area Producers Abandoned Completion ** (feet) Wells as at 31/12/04
1 8 0 8 34812 0
2 27 0 27 23644 1
4 8 0 8 35021 0
5 6 0 6 31597 0
6 93 1 94 40247 3
9 2 5 7 10892 0
11 9 2 11 132376 1
15 8 2 10 106609 2
TOTAL 161 10 171 415198 7
* Includes oil, gas and abandoned wells ** feet = metres x .3048
Sour
ce: C
entra
l Sta
tistic
al O
ffice
from
The
Ann
ual O
vers
eas
Trad
e Pa
rt A.

Ministry of Energy & Energy Industries Annual Administrative Report 2003-2004
50
STATISTICAL APPENDICES
MON
THLY
ANA
LYSI
S OF
DRI
LLIN
G AN
D W
ORKO
VER
ACTI
VITY
- 2
004
(Dep
th d
rille
d in
feet
)
NE
W
OIL
& GA
S
AB
ANDO
NED
TOTA
L TO
TAL
AGGR
. RE
COM
- AB
AN-
W
ELLS
PR
ODUC
ERS
INJE
CTIO
N W
ELLS
Af
ter T
estin
g Dr
y Ho
les
Tech
nica
l Cau
ses
COM
PLET
ED O
THER
W
ELLS
AG
GR.
DEPT
H PL
ETED
DO
NED
ST
ARTE
D Nu
mbe
r Ag
greg
ate
Num
ber
Aggr
egat
e Nu
mbe
r Ag
greg
ate
Num
ber
Aggr
egat
e Nu
mbe
r Ag
greg
ate
Num
ber
Aggr
egat
e
DEPT
H PE
R W
ELL
WEL
LS
WEL
LS
of
Wel
ls
Dept
h of
Wel
ls
Dept
h of
Wel
ls
Dept
h of
Wel
ls
Dept
h of
Wel
ls
Dept
h of
Wel
ls
Dept
h
JANU
ARY
8
7
32,3
91
0
0
1
7,43
0
0
0
0
0
0
0
8
39,8
21
4,97
8
12
0 FE
BRUA
RY
8
9
36,0
10
0
0
1
0
1
10,1
91
0
0
0
0
11
46,2
01
4,20
0
4
0 M
ARCH
23
20
30
,849
0
0
0
0
0
0
0
0
0
0
20
30
,849
1,
542
4
0
APRI
L 19
17
25
,480
0
0
0
0
1
9,
554
1
16
,714
0
0
19
51
,748
2,
724
8
0
MAY
12
13
81
,013
0
0
3
3,
834
2
13
,369
0
0
0
0
18
98
,216
5,
456
1
22
JU
NE
12
11
13,9
86
1
8,06
1
0
3,09
0
1
0
0
0
0
0
13
25,1
37
1,93
4
0
0 JU
LY
12
12
45,2
65
0
0
0
0
0
0
1
14,2
74
0
0
13
59,5
39
4,58
0
10
14
AUGU
ST
10
12
49,1
50
0
0
1
2,05
0
0
0
0
0
0
0
13
51,2
00
3,93
8
6
9 SE
PTEM
BER
11
11
48,4
05
0
0
0
0
0
0
1
17,2
46
0
0
12
65,6
51
5,47
1
3
10
OCTO
BER
10
8
31,9
11
0
0
1
7,20
0
0
0
1
1,41
2
0
0
10
40,5
23
4,05
2
17
1 NO
VEM
BER
5
6
29,2
53
0
0
0
0
0
0
0
0
0
0
6
29,2
53
4,87
6
10
5 DE
CEM
BER
4
7
39,7
81
0
0
0
0
0
0
1
1,00
7
0
0
8
40,7
88
5,09
9
8
0
TO
TAL
2004
13
4
133
46
3,49
4
1
8,06
1
7
23,6
04
5
33,1
14
5
50,6
53
0
0
151
57
8,92
6
3,83
4
83
61
TOTA
L 20
03
153
13
8
402,
855
0
0
1
10
,391
6
55
,925
0
0
3
23
,145
14
8
492,
316
3,
326
15
7
23
NE
W
OIL
& GA
S
AB
ANDO
NED
TOTA
L TO
TAL
AGGR
. RE
COM
- AB
AN-
W
ELLS
PR
ODUC
ERS
INJE
CTIO
N W
ELLS
Af
ter T
estin
g Dr
y Ho
les
Tech
nica
l Cau
ses
COM
PLET
ED O
THER
W
ELLS
AG
GR.
DEPT
H PL
ETED
DO
NED
ST
ARTE
D Nu
mbe
r Ag
greg
ate
Num
ber
Aggr
egat
e Nu
mbe
r Ag
greg
ate
Num
ber
Aggr
egat
e Nu
mbe
r Ag
greg
ate
Num
ber
Aggr
egat
e
DEPT
H PE
R W
ELL
WEL
LS
WEL
LS
of
Wel
ls
Dept
h of
Wel
ls
Dept
h of
Wel
ls
Dept
h of
Wel
ls
Dept
h of
Wel
ls
Dept
h of
Wel
ls
Dept
h
OCTO
BER
‘03
20
8
1739
0
0
0
0
0
1
7250
0
0
0
0
9
24
640
27
38
14
1 NO
VEM
BER
21
25
1783
2
0
0
0
0
0
0
0
0
0
0
25
1783
2
713
9
2
DECE
MBE
R 17
17
14
648
0
0
0
0
0
0
0
0
2
15
165
19
29
813
15
69
5
0 JA
NUAR
Y ‘0
4 8
7
32
391
0
0
1
74
30
0
0
0
0
0
0
8
3982
1
4978
12
0
FEBR
UARY
8
9
36
010
0
0
1
0
1
10
191
0
0
0
0
11
46
201
42
00
4
0 M
ARCH
23
20
30
849
0
0
0
0
0
0
0
0
0
0
20
30
849
15
42
4
0 AP
RIL
19
17
2548
0
0
0
0
0
1
9554
1
16
714
0
0
19
51
748
27
24
8
0 M
AY
12
13
8101
3
0
0
3
3834
2
13
369
0
0
0
0
18
98
216
54
56
1
22
JUNE
12
11
13
986
1
80
61
0
3090
1
0
0
0
0
0
13
25
137
19
34
0
0 JU
LY
12
12
4526
5
0
0
0
0
0
0
1
1427
4
0
0
13
5953
9
4580
10
14
AU
GUST
10
12
49
150
0
0
1
20
50
0
0
0
0
0
0
13
5120
0
3938
6
9
SEPT
EMBE
R 11
11
48
405
0
0
0
0
0
0
1
17
246
0
0
12
65
651
54
71
3
10
TOTA
L OC
T ‘0
3-
SEPT
‘04
173
16
2
412,
419
1
80
61
6
16,4
04
6
40,3
64
3
48,2
34
2
1516
5
180
54
0,64
7
3,00
4
76
58
TOTA
L OC
T ‘0
2-
SEPT
‘03
105
85
42
5,72
3
0
0
1
10,3
91
5
48,6
75
0
0
7
5363
4
98
538,
423
5,
494
17
8
21
Appendix IV
MON
THLY
ANA
LYSI
S OF
DRI
LLIN
G AN
D W
ORKO
VER
ACTI
VITY
- O
CTOB
ER 2
003
- SE
PTEM
BER
2004
(Dep
th d
rille
d in
feet
)
NB: A
ggr.
Dept
h =
Fin
al d
epth
dril
led
for e
ach
wel
l

STATISTICAL APPENDICES
51
I n c r e a s i n g L o c a l C o n t e n t
MONTHLY ANALYSIS OF LAND AND MARINE DEPTH DRILLED - 2004 (Depth drilled in feet)
Month State Private Sub-total Sub-total Daily Avg. Daily Avg. Marine % of Land Land Land Marine State Total Rig Months Depth Depth/Rig Total Depth
JANUARY 12,677 0 12,677 30,289 42,966 42,966 5.12 1,386 270.9 70.5
FEBRUARY 6,663 0 6,663 17,345 24,008 24,008 5.47 828 151.3 72.2
MARCH 20,253 0 20,253 37,247 57,500 57,500 7.46 1,855 248.8 64.8
APRIL 14,863 0 14,863 27,374 42,237 42,237 7.28 1,408 193.4 64.8
MAY 14,137 0 14,137 31,726 45,863 45,863 7.54 1,479 196.2 69.2
JUNE 11,860 0 11,860 35,600 47,460 47,460 6.73 1,582 235.1 75.0
JULY 9,019 0 9,019 23,229 32,248 32,248 5.95 1,040 174.8 72.0
AUGUST 9,129 0 9,129 35,378 44,507 44,507 6.11 1,436 234.8 79.5
SEPTEMBER 7,447 0 7,447 34,201 41,648 41,648 7.47 1,388 185.9 82.1
OCTOBER 12,429 0 12,429 49,135 61,564 61,564 8.55 1,986 232.4 79.8
NOVEMBER 10,170 0 10,170 39,237 49,407 49,407 7.65 1,647 215.3 79.4
DECEMBER 2,212 0 2,212 32,788 35,000 35,000 6.65 1,129 169.9 93.7
TOTAL 130,859 0 130,859 393,549 524,408 524,408 81.96 1,437 210.3 75.0
Month State Private Sub-total Sub-total Daily Avg. Daily Avg. Marine % of Land Land Land Marine State Total Rig Months Depth Depth/Rig Total Depth
OCTOBER ‘03 10,716 0 10,716 33,290 44,006 44,006 5.61 1,420 252.9 75.6
NOVEMBER 9,689 0 9,689 31,085 40,774 40,774 6.32 1,359 215.2 76.2
DECEMBER 14,948 0 14,948 19,509 34,457 34,457 7.05 1,112 157.7 56.6
JANUARY ‘04 12,677 0 12,677 30,289 42,966 42,966 5.12 1,386 270.9 70.5
FEBRUARY 6,663 0 6,663 17,345 24,008 24,008 5.47 828 151.3 72.2
MARCH 20,253 0 20,253 37,247 57,500 57,500 7.46 1,855 248.8 64.8
APRIL 14,863 0 14,863 27,374 42,237 42,237 7.28 1,408 193.4 64.8
MAY 14,137 0 14,137 31,726 45,863 45,863 7.54 1,479 196.2 69.2
JUNE 11,860 0 11,860 35,600 47,460 47,460 6.73 1,582 235.1 75.0
JULY 9,019 0 9,019 23,229 32,248 32,248 5.95 1,040 174.8 72.0
AUGUST 9,129 0 9,129 35,378 44,507 44,507 6.11 1,436 234.8 79.5
SEPTEMBER 7,447 0 7,447 34,201 41,648 41,648 7.47 1,388 185.9 82.1
TOTAL 141,401 0 141,401 356,273 497,674 497,674 78.10 1,360 208.9 71.6
Appendix V
MONTHLY ANALYSIS OF LAND AND MARINE DEPTH DRILLED OCTOBER 2003 - SEPTEMBER 2004 (Depth drilled in feet)
NB: A
ggr.
Dept
h =
Fin
al d
epth
dril
led
for e
ach
wel
l
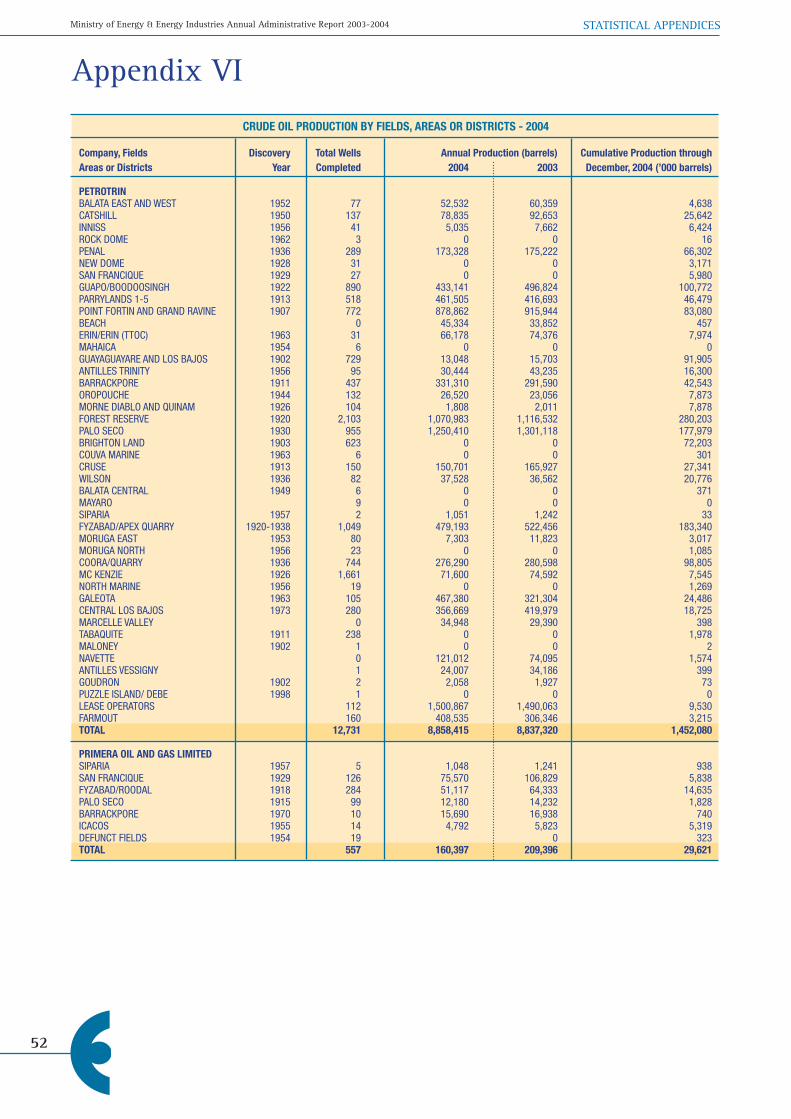
Ministry of Energy & Energy Industries Annual Administrative Report 2003-2004
52
STATISTICAL APPENDICES
Appendix VI
Company, Fields Discovery Total Wells Annual Production (barrels) Cumulative Production throughAreas or Districts Year Completed 2004 2003 December, 2004 (’000 barrels) PETROTRIN BALATA EAST AND WEST 1952 77 52,532 60,359 4,638 CATSHILL 1950 137 78,835 92,653 25,642 INNISS 1956 41 5,035 7,662 6,424 ROCK DOME 1962 3 0 0 16 PENAL 1936 289 173,328 175,222 66,302 NEW DOME 1928 31 0 0 3,171 SAN FRANCIQUE 1929 27 0 0 5,980 GUAPO/BOODOOSINGH 1922 890 433,141 496,824 100,772 PARRYLANDS 1-5 1913 518 461,505 416,693 46,479 POINT FORTIN AND GRAND RAVINE 1907 772 878,862 915,944 83,080 BEACH 0 45,334 33,852 457 ERIN/ERIN (TTOC) 1963 31 66,178 74,376 7,974 MAHAICA 1954 6 0 0 0 GUAYAGUAYARE AND LOS BAJOS 1902 729 13,048 15,703 91,905 ANTILLES TRINITY 1956 95 30,444 43,235 16,300 BARRACKPORE 1911 437 331,310 291,590 42,543 OROPOUCHE 1944 132 26,520 23,056 7,873 MORNE DIABLO AND QUINAM 1926 104 1,808 2,011 7,878 FOREST RESERVE 1920 2,103 1,070,983 1,116,532 280,203 PALO SECO 1930 955 1,250,410 1,301,118 177,979 BRIGHTON LAND 1903 623 0 0 72,203 COUVA MARINE 1963 6 0 0 301 CRUSE 1913 150 150,701 165,927 27,341 WILSON 1936 82 37,528 36,562 20,776 BALATA CENTRAL 1949 6 0 0 371 MAYARO 9 0 0 0 SIPARIA 1957 2 1,051 1,242 33 FYZABAD/APEX QUARRY 1920-1938 1,049 479,193 522,456 183,340 MORUGA EAST 1953 80 7,303 11,823 3,017 MORUGA NORTH 1956 23 0 0 1,085 COORA/QUARRY 1936 744 276,290 280,598 98,805 MC KENZIE 1926 1,661 71,600 74,592 7,545 NORTH MARINE 1956 19 0 0 1,269 GALEOTA 1963 105 467,380 321,304 24,486 CENTRAL LOS BAJOS 1973 280 356,669 419,979 18,725 MARCELLE VALLEY 0 34,948 29,390 398 TABAQUITE 1911 238 0 0 1,978 MALONEY 1902 1 0 0 2 NAVETTE 0 121,012 74,095 1,574 ANTILLES VESSIGNY 1 24,007 34,186 399 GOUDRON 1902 2 2,058 1,927 73 PUZZLE ISLAND/ DEBE 1998 1 0 0 0 LEASE OPERATORS 112 1,500,867 1,490,063 9,530 FARMOUT 160 408,535 306,346 3,215 TOTAL 12,731 8,858,415 8,837,320 1,452,080 PRIMERA OIL AND GAS LIMITED SIPARIA 1957 5 1,048 1,241 938 SAN FRANCIQUE 1929 126 75,570 106,829 5,838 FYZABAD/ROODAL 1918 284 51,117 64,333 14,635 PALO SECO 1915 99 12,180 14,232 1,828 BARRACKPORE 1970 10 15,690 16,938 740 ICACOS 1955 14 4,792 5,823 5,319 DEFUNCT FIELDS 1954 19 0 323 TOTAL 557 160,397 209,396 29,621
CRUDE OIL PRODUCTION BY FIELDS, AREAS OR DISTRICTS - 2004
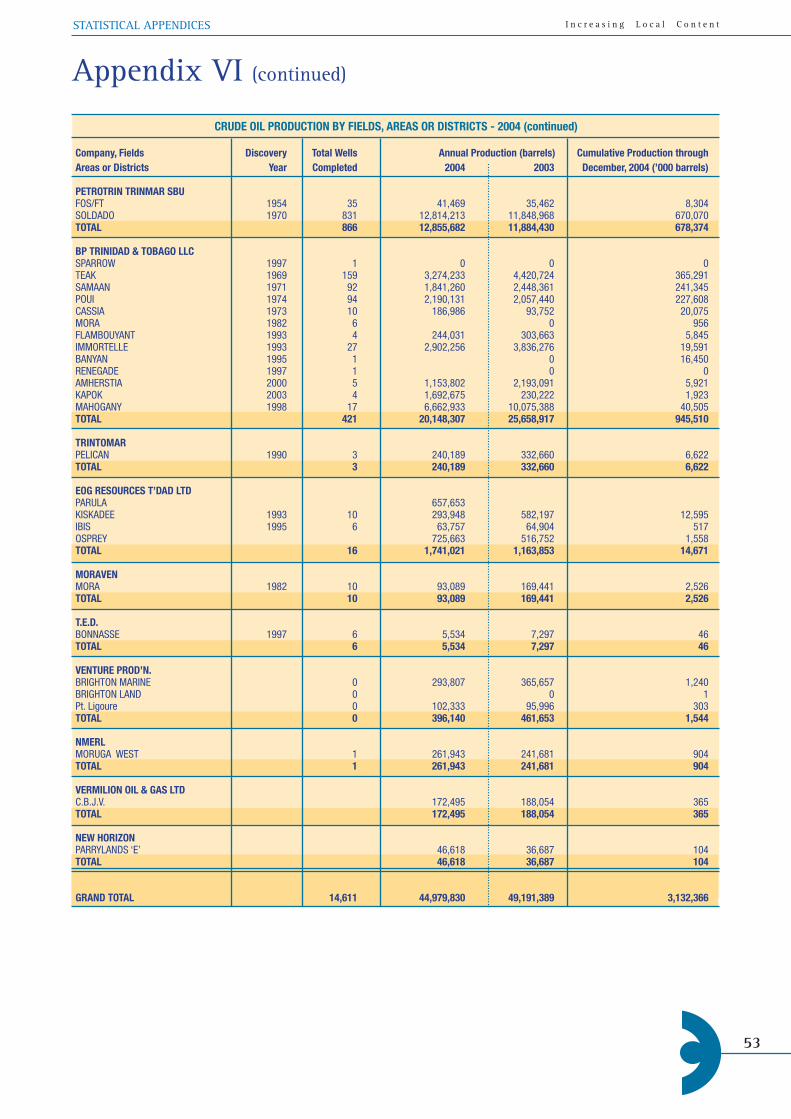
STATISTICAL APPENDICES
53
I n c r e a s i n g L o c a l C o n t e n t
Company, Fields Discovery Total Wells Annual Production (barrels) Cumulative Production throughAreas or Districts Year Completed 2004 2003 December, 2004 (’000 barrels) PETROTRIN TRINMAR SBU FOS/FT 1954 35 41,469 35,462 8,304 SOLDADO 1970 831 12,814,213 11,848,968 670,070 TOTAL 866 12,855,682 11,884,430 678,374 BP TRINIDAD & TOBAGO LLC SPARROW 1997 1 0 0 0 TEAK 1969 159 3,274,233 4,420,724 365,291 SAMAAN 1971 92 1,841,260 2,448,361 241,345 POUI 1974 94 2,190,131 2,057,440 227,608 CASSIA 1973 10 186,986 93,752 20,075 MORA 1982 6 0 956 FLAMBOUYANT 1993 4 244,031 303,663 5,845 IMMORTELLE 1993 27 2,902,256 3,836,276 19,591 BANYAN 1995 1 0 16,450 RENEGADE 1997 1 0 0 AMHERSTIA 2000 5 1,153,802 2,193,091 5,921 KAPOK 2003 4 1,692,675 230,222 1,923 MAHOGANY 1998 17 6,662,933 10,075,388 40,505 TOTAL 421 20,148,307 25,658,917 945,510 TRINTOMAR PELICAN 1990 3 240,189 332,660 6,622 TOTAL 3 240,189 332,660 6,622 EOG RESOURCES T’DAD LTD PARULA 657,653 KISKADEE 1993 10 293,948 582,197 12,595 IBIS 1995 6 63,757 64,904 517 OSPREY 725,663 516,752 1,558 TOTAL 16 1,741,021 1,163,853 14,671 MORAVEN MORA 1982 10 93,089 169,441 2,526 TOTAL 10 93,089 169,441 2,526 T.E.D. BONNASSE 1997 6 5,534 7,297 46 TOTAL 6 5,534 7,297 46 VENTURE PROD’N. BRIGHTON MARINE 0 293,807 365,657 1,240 BRIGHTON LAND 0 0 1 Pt. Ligoure 0 102,333 95,996 303 TOTAL 0 396,140 461,653 1,544 NMERL MORUGA WEST 1 261,943 241,681 904 TOTAL 1 261,943 241,681 904 VERMILION OIL & GAS LTD C.B.J.V. 172,495 188,054 365 TOTAL 172,495 188,054 365 NEW HORIZON PARRYLANDS ‘E’ 46,618 36,687 104 TOTAL 46,618 36,687 104 GRAND TOTAL 14,611 44,979,830 49,191,389 3,132,366
CRUDE OIL PRODUCTION BY FIELDS, AREAS OR DISTRICTS - 2004 (continued)
Appendix VI (continued)

Ministry of Energy & Energy Industries Annual Administrative Report 2003-2004
54
STATISTICAL APPENDICES
Appendix VI (continued)
Company, Fields Discovery Total Wells Annual Production (barrels) Cumulative Production throughAreas or Districts Year Completed Oct’03 - Sep’04 Oct’02 - Sep’03 September, 2001 (’000 barrels) PETROTRIN BALATA EAST AND WEST 1952 77 57,089 62,830 4,382 CATSHILL 1950 137 86,018 89,258 25,265 INNISS 1956 41 5,413 7,336 6,393 ROCK DOME 1962 3 16 PENAL 1936 289 172,164 179,279 65,505 NEW DOME 1928 31 3,171 SAN FRANCIQUE 1929 27 5,980 GUAPO/BOODOOSINGH 1922 892 441,768 504,130 98,728 PARRYLANDS 1-5 1913 519 445,189 426,373 44,815 POINT FORTIN AND GRAND RAVINE 1907 777 908,518 842,631 79,648 BEACH 0 42,431 34,795 279 ERIN/ERIN (TTOC) 1963 31 66,033 81,733 7,601 MAHAICA 1954 6 0 GUAYAGUAYARE AND LOS BAJOS 1902 729 13,974 16,034 91,833 ANTILLES TRINITY 1956 95 33,645 42,663 16,134 BARRACKPORE 1911 437 301,777 318,162 41,067 OROPOUCHE 1944 132 26,470 23,529 7,751 MORNE DIABLO AND QUINAM 1926 104 1,804 2,059 7,870 FOREST RESERVE 1920 2,115 1,064,762 1,149,687 275,406 PALO SECO 1930 955 1,257,068 1,336,221 172,136 BRIGHTON LAND 1903 623 72,203 PT. LIGOURE/BRIGHTON MARINE 1937 0 52,705 87,207 4,251 COUVA MARINE 1963 6 301 CRUSE 1913 150 174,487 130,554 27,031 WILSON 1936 82 40,193 33,992 20,620 BALATA CENTRAL 1949 6 371 MAYARO 9 0 SIPARIA 2 914 1,346 26 FYZABAD/APEX QUARRY 1920-1938 1,049 487,772 525,339 181,115 MORUGA EAST 1953 80 7,267 12,419 2,965 MORUGA NORTH 1956 23 1,085 MORUGA WEST 1957 0 103,763 97,768 9,815 COORA/QUARRY 1936 744 271,859 287,166 97,605 MC KENZIE 1926 1,661 73,627 70,599 7,278 NORTH MARINE 1956 19 1,269 GALEOTA 1963 105 466,909 276,014 23,076 CENTRAL LOS BAJOS 1973 280 369,372 433,564 17,031 MARCELLE VALLEY 0 33,076 29,226 259 TABAQUITE 1911 238 1,978 MALONEY 1902 1 2 NAVETTE 0 113,331 70,890 1,142 ANTILLES VESSIGNY 1 29,344 35,537 258 GOUDRON 1902 2 1,916 2,271 64 LEASE OPERATORS 108 1,535,826 1,431,812 6,442 FARMOUT 120 415,135 270,306 1,796 PUZZLE ISLAND/DEBE 1998 1 15 BG CENTRAL BLOCK 61,588 51,426 0 NEW HORIZON 11,555 7,941 0 TOTAL 12,707 9,174,762 8,972,097 1,431,978 PRIMERA OIL AND GAS LIMITED SIPARIA 1957 5 912 1,344 932 SAN FRANCIQUE 1929 135 81,085 114,905 5,312 FYZABAD/ROODAL 1918 284 53,039 64,849 14,342 PALO SECO 1915 99 12,144 15,630 1,755 BARRACKPORE 1970 10 15,756 17,511 668 ICACOS 1955 14 5,004 5,477 5,293 DEFUNCT FIELDS 1954 19 323 TOTAL 566 167,940 219,716 28,624
CRUDE OIL PRODUCTION BY FIELDS, AREAS OR DISTRICTS - OCTOBER 2003-SEPTEMBER 2004

STATISTICAL APPENDICES
55
I n c r e a s i n g L o c a l C o n t e n t
Company, Fields Discovery Total Wells Annual Production (Barrels) Cumulative Production throughAreas or Districts Year Completed Oct’03 - Sep’04 Oct’02 - Sep’03 September, 2001 (’000 barrels) TRINMAR FOS/FT 1954 35 37,926 34,242 8,137 SOLDADO 1955 847 12,791,601 11,709,573 618,586 TOTAL 882 12,829,527 11,743,815 626,723
BP TRINIDAD AND TOBAGO SPARROW 1997 1 0 0 0 TEAK 1969 160 3,398,650 4,903,633 346,975 SAMAAN 1971 94 1,833,146 2,618,089 230,032 POUI 1974 94 2,323,502 1,909,499 219,051 CASSIA 1973 10 169,355 87,020 19,556 MORA 1982 6 956 FLAMBOYANT 1993 3 349,046 205,524 4,906 IMMORTELLE 1993 25 2,878,593 4,063,097 6,725 BANYAN 1995 1 16,450 RENEGADE 1997 1 0 KAPOK 1,277,086 71,478 AMHERSTIA 2000 8 1,422,382 2,391,621 0 MAHOGANY 1998 21 8,367,939 10,506,996 7,280 TOTAL 424 22,019,699 26,756,957 851,931 TRINTOMAR PELICAN 1990 3 257,610 272,058 5,878 TOTAL 3 257,610 272,058 5,878 ENRON OSPREY 611,696 514,284 PARULA 431,538 KISKADEE 1993 10 373,243 618,289 9,825 IBIS 1995 6 64,231 74,099 1,248 TOTAL 16 1,480,708 692,388 11,073 MORAVEN MORA 1982 10 85,494 193,533 1,966 TOTAL 10 85,494 193,533 1,966 T.E.D. BONNASSE 1997 11 4,601 6,227 12 TOTAL 11 4,601 6,227 12 VENTURE PROD’N. BR. MARINE/PT. LIGOURE 16 314,198 42,861 130 BRIGHTON LAND 0 57,534 341,258 1 TOTAL 16 371,732 384,119 131 TRACMAC MORUGA WEST 140 164,878 146,653 61 TOTAL 140 164,878 146,653 61 VINTAGE PET. T’DAD LTD. C.B.J.V. 114,377 95,506 210 TOTAL 114,377 95,506 210 NEW HORIZON J.V. N.H.J.V. 34,663 23,818 58 TOTAL 34,663 23,818 58 GRAND TOTAL 14,775 46,705,991 49,506,887 2,958,587
CRUDE OIL PRODUCTION BY FIELDS, AREAS OR DISTRICTS - OCTOBER 2003-SEPTEMBER 2004 (continued)
Appendix VI (continued)

Ministry of Energy & Energy Industries Annual Administrative Report 2003-2004
56
STATISTICAL APPENDICES
Crud
e Oi
l Pro
duct
ion
by m
onth
s an
d m
etho
ds -
200
4 (b
arre
ls)
FL
OWIN
G GA
S LI
FT
PUM
PING
SW
AB
OTHE
R M
ETHO
DS
TOTA
L NO
.
DAILY
AV.
PER
SA
LT W
ATER
No
. of
Da
ily A
v. No
. of
Da
ily A
v. No
. of
Da
ily A
v. No
. of
Da
ily A
v. No
. of
Da
ily A
v. OF
WEL
LS
TOTA
L OI
L PR
ODUC
ING
% o
f Tot
al
Wel
ls
Prod
uctio
n Pe
r Wel
l W
ells
Pr
oduc
tion
Per W
ell
Wel
ls
Prod
uctio
n Pe
r Wel
l W
ells
Pr
oduc
tion
Per W
ell
Wel
ls
Prod
uctio
n Pe
r Wel
l PR
ODUC
ING
PROD
UCTI
ON
WEL
L B.
O.P.D
. Pr
oduc
tion
Flui
d
JANU
ARY
321
1,
843,
220
18
5.2
45
6
1,33
5,10
6
94.4
2,
882
92
9,08
7
10.4
27
4
27,3
82
3.2
26
57
6
0.7
3,
959
4,
135,
371
33
.7
133,
399
4,
850,
654
54
.0
FEBR
UARY
30
8
1,74
9,52
5
195.
9
411
1,
110,
679
93
.2
2,88
4
932,
200
11
.1
284
30
,129
3.
7
27
552
0.
7
3,91
4
3,82
3,08
5
33.7
13
1,83
1
4,02
8,75
3
51.3
M
ARCH
336
1,
725,
750
16
5.7
44
2
1,29
2,85
3
94.4
2,
921
1,
032,
163
11
.4
269
32
,516
3.
9
24
370
0.
5
3,99
2
4,08
3,65
2
33.0
13
1,73
1
4,81
4,93
4
54.1
AP
RIL
322
1,
651,
285
17
0.9
45
9
1,33
7,86
6
97.2
2,
933
99
3,29
8
11.3
29
3
28,9
81
3.3
33
61
8
0.6
4,
040
4,
012,
048
33
.1
133,
735
5,
387,
701
57
.3
MAY
31
5
1,42
3,04
1
145.
7
443
1,
269,
477
92
.4
2,90
2
1,04
1,67
2
11.6
29
6
26,2
58
2.9
32
58
7
0.6
3,
988
3,
761,
035
30
.4
121,
324
4,
892,
835
56
.5
JUNE
31
0
1,23
0,03
8
132.
3
439
1,
383,
400
10
5.0
2,
884
1,
021,
477
11
.8
253
18
,999
2.
5
30
545
0.
6
3,91
6
3,65
4,45
9
31.1
12
1,81
5
5,08
9,65
8
58.2
JU
LY
312
1,
221,
775
12
6.3
43
1
1,38
8,99
3
104.
0
2,90
6
1,06
0,60
0
11.8
31
6
17,8
03
1.8
32
69
8
0.7
3,
997
3,
689,
869
29
.8
119,
028
5,
025,
694
57
.7
AUGU
ST
309
1,
310,
602
13
6.8
45
0
1,36
6,90
8
98.0
2,
901
1,
045,
455
11
.6
292
20
,105
2.
2
26
558
0.
7
3,97
8
3,74
3,62
8
30.4
12
0,76
2
5,40
7,43
6
59.1
SE
PTEM
BER
318
1,
270,
049
13
3.1
44
0
1,16
2,69
8
88.1
2,
890
1,
002,
921
11
.6
346
21
,594
2.
1
28
651
0.
8
4,02
2
3,45
7,91
3
28.7
11
5,26
4
4,64
4,65
8
57.3
OC
TOBE
R 30
0
1,28
4,30
2
138.
1
431
1,
339,
927
10
0.3
2,
885
1,
028,
828
11
.5
342
20
,109
1.
9
34
629
0.
6
3,99
2
3,67
3,79
5
29.7
11
8,51
0
5,36
2,63
8
59.3
NO
VEM
BER
289
1,
078,
710
12
4.4
42
5
1,23
0,14
5
96.5
2,
885
1,
026,
470
11
.9
297
17
,662
2.
0
28
607
0.
7
3,92
4
3,35
3,59
4
28.5
11
1,78
6
5,21
4,01
8
60.9
DE
CEM
BER
292
1,
221,
787
13
5.0
41
6
1,34
6,43
3
104.
4
2,87
1
1,00
6,81
4
11.3
26
6
15,6
41
1.9
31
70
6
0.7
3,
876
3,
591,
381
29
.9
115,
851
5,
863,
265
62
.0
TOTA
L 20
04
17
,010
,084
15
,564
,485
12
,120
,985
27
7,17
9
7,09
7
44,9
79,8
30
60,5
82,2
44
AVER
AGE
311
46
,476
14
9.4
43
7
42,5
26
97.3
2,
895
33
,117
11
.4
294
75
7
2.6
29
19
0.
7
3,96
7 ??
31
.0
122,
896
16
5,52
5
57.4
Qtr-1
32
2
5,31
8,49
5
182
43
6
3,73
8,63
8
94
2,89
6
2,89
3,45
0
11.0
27
6
30,0
09
4
26
1,49
8
0.6
3,
955
12
,042
,108
33
.5
132,
320
13
,694
,341
53
.1
Qtr-2
31
6
4,30
4,36
4
150
44
7
3,99
0,74
3
98
2,90
6
3,05
6,44
7
11.6
28
1
24,7
46
3
32
1,75
0
0.6
3,
981
11
,427
,542
31
.5
125,
625
15
,370
,194
57
.4
Qtr-3
31
3
3,80
2,42
6
132
44
0
3,91
8,59
9
97
2,89
9
3,10
8,97
6
11.7
31
8
19,8
34
2
29
1,90
7
0.7
3,
999
10
,891
,410
29
.6
118,
351
15
,077
,788
58
.0
Qtr-4
29
4
3,58
4,79
9
132
42
4
3,91
6,50
5
100
2,
880
3,
062,
112
11
.6
302
17
,804
2
31
1,
942
0.
7
3,93
1
10,6
18,7
70
29.4
11
5,38
2
16,4
39,9
21
60.7
17,0
10,0
84
15,5
64,4
85
12,1
20,9
85
92,3
93
7,09
7
44,9
79,8
30
60,5
82,2
44
Crud
e Oi
l Pro
duct
ion
by m
onth
s an
d m
etho
ds -
Oct
ober
200
3 -
Sept
embe
r 200
4 (b
arre
ls)
FL
OWIN
G GA
S LI
FT
PUM
PING
SW
AB
OTHE
R M
ETHO
DS
TOTA
L NO
.
DAILY
AV.
PER
SA
LT W
ATER
No
. of
Da
ily A
v. No
. of
Da
ily A
v. No
. of
Da
ily A
v. No
. of
Da
ily A
v. No
. of
Da
ily A
v. OF
WEL
LS
TOTA
L OI
L PR
ODUC
ING
% o
f Tot
al
Wel
ls
Prod
uctio
n Pe
r Wel
l W
ells
Pr
oduc
tion
Per W
ell
Wel
ls
Prod
uctio
n Pe
r Wel
l W
ells
Pr
oduc
tion
Per W
ell
Wel
ls
Prod
uctio
n Pe
r Wel
l PR
ODUC
ING
PROD
UCTI
ON
WEL
L B.
O.P.D
. Pr
oduc
tion
Flui
d
OCTO
BER
’03
317
1,
870,
805
19
0.4
46
0
1,46
3,34
7
102.
6
2,86
2
899,
676
10
.1
262
26
,543
3.
3
19
252
0.
4
3,92
0
4,26
0,62
3
35.1
13
7,43
9
4,95
5,36
6
53.8
NO
VEM
BER
309
1,
562,
425
16
8.5
44
8
1,32
2,17
4
98.4
2,
864
83
1,57
3
9.7
20
8
24,6
84
4.0
7
14
1
0.7
3,
836
3,
740,
997
32
.5
124,
700
4,
036,
773
51
.9
DECE
MBE
R 31
6
1,94
4,07
0
198.
5
459
1,
477,
302
10
3.8
2,
865
87
6,60
0
9.9
24
5
30,2
22
4.0
14
28
9
0.7
3,
899
4,
328,
483
35
.8
139,
628
5,
397,
290
55
.5
JANU
ARY
’04
321
1,
843,
220
18
5.2
45
6
1,33
5,10
6
94.4
2,
882
92
9,08
7
10.4
27
4
27,3
82
3.2
26
57
6
0.7
3,
959
4,
135,
371
33
.7
133,
399
4,
850,
654
54
.0
FEBR
UARY
30
8
1,74
9,52
5
195.
9
411
1,
110,
679
93
.2
2,88
4
932,
200
11
.1
284
30
,129
3.
7
27
552
0.
7
3,91
4
3,82
3,08
5
33.7
13
1,83
1
4,02
8,75
3
51.3
M
ARCH
336
1,
725,
750
16
5.7
44
2
1,29
2,85
3
94.4
2,
921
1,
032,
163
11
.4
269
32
,516
3.
9
24
370
0.
5
3,99
2
4,08
3,65
2
33.0
13
1,73
1
4,81
4,93
4
54.1
AP
RIL
322
1,
651,
285
17
0.9
45
9
1,33
7,86
6
97.2
2,
933
99
3,29
8
11.3
29
3
28,9
81
3.3
33
61
8
0.6
4,
040
4,
012,
048
33
.1
133,
735
5,
387,
701
57
.3
MAY
31
5
1,42
3,04
1
145.
7
443
1,
269,
477
92
.4
2,90
2
1,04
1,67
2
11.6
29
6
26,2
58
2.9
32
58
7
0.6
3,
988
3,
761,
035
30
.4
121,
324
4,
892,
835
56
.5
JUNE
31
0
1,23
0,03
8
132.
3
439
1,
383,
400
10
5.0
2,
884
1,
021,
477
11
.8
253
18
,999
2.
5
30
545
0.
6
3,91
6
3,65
4,45
9
31.1
12
1,81
5
5,08
9,65
8
58.2
JU
LY
312
1,
221,
775
12
6.3
43
1
1,38
8,99
3
104.
0
2,90
6
1,06
0,60
0
11.8
31
6
17,8
03
1.8
32
69
8
0.7
3,
997
3,
689,
869
29
.8
119,
028
5,
025,
694
57
.7
AUGU
ST
309
1,
310,
602
13
6.8
45
0
1,36
6,90
8
98.0
2,
901
1,
045,
455
11
.6
292
20
,105
2.
2
26
558
0.
7
3,97
8
3,74
3,62
8
30.4
12
0,76
2
5,40
7,43
6
59.1
SE
PTEM
BER
318
1,
270,
049
13
3.1
44
0
1,16
2,69
8
88.1
2,
890
1,
002,
921
11
.6
346
21
,594
2.
1
28
651
0.
8
4,02
2
3,45
7,91
3
28.7
11
5,26
4
4,64
4,65
8
57.3
TOTA
L
18
,802
,585
15
,910
,803
11
,666
,722
30
5,21
6
5,83
7
46,6
91,1
63
58,5
31,7
52
AVER
AGE
31
6
51,3
73
162.
5
445
43
,472
97
.7
2,89
1
31,8
76
11.0
27
8
834
3.
0
25
16
0.6
3,
955
??
32
.3
127,
571
15
9,92
3
55.6
Appendix VII

STATISTICAL APPENDICES
57
I n c r e a s i n g L o c a l C o n t e n t
Anal
ysis
of C
rude
Oil
Prod
uctio
n by
Ope
ratin
g Co
mpa
nies
- 2
004
(bar
rel)
FL
OWIN
G GA
S LI
FTIN
G PU
MPI
NG
SWAB
OT
HER
MET
HODS
AV
. NO.
CO
’s PR
OD. A
S SA
LT W
ATER
Av
. No.
Daily
Av.
Av. N
o.
Da
ily A
v. Av
. No.
Daily
Av.
Av. N
o.
Da
ily A
v. Av
. No.
Daily
Av.
OF W
ELLS
TO
TAL
OIL
DAILY
AV.
A %
OF
TOTA
L
% o
f Tot
al
of W
ells
Pr
oduc
tion
Per W
ell
of W
ells
Pr
oduc
tion
Per W
ell
of W
ells
Pr
oduc
tion
Per W
ell
of W
ells
Pr
oduc
tion
Per W
ell
of W
ells
Pr
oduc
tion
Per W
ell
PROD
UCED
PR
ODUC
ED
PER
WEL
L PR
ODUC
TION
Pr
oduc
tion
Flui
d
BPTT
62
12
,325
,558
54
3.2
10
3
7,82
2,74
9
207.
5
0
0
0.0
0
0
0.
0
0
0
0.0
16
5
20,1
48,3
07
333.
6
44.8
38
,160
,087
65
.4
P.O.G
.L
1
229
0.
6
1
819
2.
2
83
152,
252
5.
0
0
0
0.0
29
7,
097
0.
7
114
16
0,39
7
3.8
0.
4
71,6
64
30.9
T.N
.A.
50
1,71
4,64
9
93.7
21
9
6,99
2,05
8
87.2
69
4,
148,
975
16
4.3
0
0
0.
0
0
0
0.0
33
8
12,8
55,6
82
103.
9
28.6
8,
543,
759
39
.9
PETR
OTRI
N 12
2
631,
316
14
.1
75
406,
744
14
.8
1,90
3
5,89
4,50
2
8.5
41
16,4
51
1.1
0
0
0.
0
2,14
1
6,94
9,01
3
8.9
15
.4
11,4
66,6
64
62
.3
TR
INTO
MAR
1
11
7,90
6
322.
1
2
122,
283
16
7.1
0
0
0.
0
0
0
0.0
0
0
0.
0
3
240,
189
21
8.8
0.
5
898,
968
78
.9
E.O.
G.R.
T.L.
13
1,74
1,02
1
365.
9
0
0
0.0
0
0
0.
0
0
0
0.0
0
0
0.
0
13
1,74
1,02
1
365.
9
3.9
58
0,52
8
25.0
M
ORAV
EN
0
0
0.0
5
93
,089
50
.9
0
0
0.0
0
0
0.
0
0
0
0.0
5
93
,089
50
.9
0.2
7,
219
7.
2 L.
O.
28
109,
476
10
.7
5
12,3
10
6.7
52
0
1,17
5,35
1
6.2
20
8
203,
730
2.
7
0
0
0.0
76
1
1,50
0,86
7
5.4
3.
3
454,
402
23
.2
F.O.
13
20,0
69
4.2
0
0
0.
0
206
37
7,15
2
5.0
10
11
,314
3.
1
0
0
0.0
22
9
408,
535
4.
9
0.9
13
7,45
2
25.2
T.E
.D.
0
0
0.0
0
0
0.
0
4
5,53
4
3.8
0
0
0.0
0
0
0.
0
4
5,53
4
3.8
0.
0
8,50
6
60.6
N.
M.E
.R.L
. 1
7,
875
21
.5
0
0
0.0
64
22
7,02
7
9.7
32
27
,041
2.
3
0
0
0.0
97
26
1,94
3
7.4
0.
6
148,
665
36
.2
V.P.T.
L. 21
16
9,49
0
22.1
28
11
4,43
3
11.2
3
93
,574
85
.2
2
18,6
43
25.5
0
0
0.
0
54
396,
140
20
.0
0.9
86
,245
17
.9
V.O.G
.T.L.
1
172,
495
47
1.3
0
0
0.
0
0
0
0.0
0
0
0.0
0
0
0.
0
1
172,
495
47
1.3
0.
4
3,65
7
2.1
N.H.
E.T.T
0
0
0.
0
0
0
0.0
44
46
,618
2.
9
0
0
0.0
0
0
0.
0
44
46,6
18
2.9
0.
1
14,4
28
23.6
TOTA
L 31
3
17,0
10,0
84
148.
5
438
15,
564,
485
97
.1
2,89
6 1
2,12
0,98
5
11.4
29
3
277,
179
2.
6
29
7,09
7
0.7
3,
969
44
,979
,830
31
.0
100.
0
60,5
82,2
44
57.4
TO
TAL*
30
8
21,3
35,6
50
189.
8
459
17,
876,
049
10
6.7
2,
822
9,
723,
224
9.
4
258
25
0,75
8
2.7
23
5,
708
0.
7
3,87
0
49,1
91,3
89
34.8
10
0.0
54
,802
,138
52
.7
Anal
ysis
of C
rude
Oil
Prod
uctio
n by
Ope
ratin
g Co
mpa
nies
- O
ctob
er 2
003
- Se
ptem
ber 2
004
(bar
rel)
FL
OWIN
G GA
S LI
FTIN
G PU
MPI
NG
SWAB
OT
HER
MET
HODS
AV
. NO.
CO
’s PR
OD. A
S SA
LT W
ATER
Av
. No.
Daily
Av.
Av. N
o.
Da
ily A
v. Av
. No.
Daily
Av.
Av. N
o.
Da
ily A
v. Av
. No.
Daily
Av.
OF W
ELLS
TO
TAL
OIL
DAILY
AV.
A %
OF
TOTA
L
% o
f Tot
al
of W
ells
Pr
oduc
tion
Per W
ell
of W
ells
Pr
oduc
tion
Per W
ell
of W
ells
Pr
oduc
tion
Per W
ell
of W
ells
Pr
oduc
tion
Per W
ell
of W
ells
Pr
oduc
tion
Per W
ell
PROD
UCED
PR
ODUC
ED
PER
WEL
L PR
ODUC
TION
Pr
oduc
tion
Flui
d
bpTT
63
14
,204
,440
61
6.0
10
2
7,81
5,25
9
209.
3
0
0
0.0
0
0
0.
0
0
0
0.0
16
5
22,0
19,6
99
364.
6
47.2
35
,951
,980
62
.0
P.O.G
.L
1
64
0.2
1
84
8
2.3
85
16
1,20
2
5.2
0
0
0.
0
25
5,83
7
0.6
11
2
167,
951
4.
1
0.4
73
,258
30
.4
T.N.A
. 53
1,
822,
705
94
.0
222
7,
387,
957
90
.9
64
3,61
8,86
5
154.
5
0
0
0.0
0
0
0.
0
339
12
,829
,527
10
3.4
27
.5
8,75
7,38
3
40.6
PE
TROT
RIN
122
61
3,22
3
13.7
76
40
7,10
4
14.6
1,
916
5,
961,
112
8.
5
32
12,7
51
1.1
0
0
0.
0
2,14
6
6,99
4,19
0
8.9
15
.0
11,2
58,5
11
61.7
TR
INTO
MAR
1
17
3,50
3
474.
1
2
84,1
07
114.
9
0
0
0.0
0
0
0.
0
0
0
0.0
3
25
7,61
0
234.
6
0.6
1,
061,
080
80
.5
E.O.
G.R.
T.L.
12
1,48
0,70
8
337.
1
0
0
0.0
0
0
0.
0 0
0
0.
0
0
0
0.0
12
1,
480,
708
33
7.1
3.
2
572,
351
27
.9
MOR
AVEN
0
0
0.
0
5
82,7
66
45.2
0
0
0.
0
0
0
0.0
0
0
0.
0
5
82,7
66
45.2
0.
2
7,08
4
7.9
L.O.
27
11
7,96
6
11.9
5
11
,635
6.
4
520
1,
184,
364
6.
2
198
22
1,86
1
3.1
0
0
0.
0
750
1,
535,
826
5.
6
3.3
46
0,07
1
23.1
F.O
. 13
21
,527
4.
5
0
0
0.0
19
4
381,
102
5.
4 11
12
,506
3.
1
0
0
0.0
21
8
415,
135
5.
2
0.9
12
9,07
2
23.7
T.E
.D.
0
0
0.0
0
0
0.
0
4
5,73
0
3.9
0
0
0.
0
0
0
0.0
4
5,
730
3.
9
0.0
9,
151
61
.5
N.M
.E.R
.L.
1
7,87
5
21.5
0
0
0.
0
63
215,
824
9.
4
35
35,7
08
2.8
0
0
0.
0
99
259,
407
7.
2
0.6
13
3,42
6
34.0
V.P
.T.L.
23
18
4,60
9
21.9
32
12
1,12
7
10.3
3
92
,305
84
.1
2
22,3
90
30.6
0
0
0.
0
60
420,
431
19
.1
0.9
10
2,86
7
19.7
V.O
.G.T.
L. 2
17
5,96
5
240.
4
0
0
0.0
0
0
0.
0
0
0
0.0
0
0
0.
0
2
175,
965
24
0.4
0.
4
3,63
9
2.0
N.H.
E.T.T
0
0
0.
0
0
0
0.0
43
46
,218
2.
9
0
0
0.0
0
0
0.
0
43
46,2
18
2.9
0.
1
11,8
79
20.4
TOT
AL
318
18
,802
,585
16
1.6
44
5 1
5,91
0,80
3
97.7
2,
892
11,
666,
722
11
.0
278
30
5,21
6
3.0
25
5,
837
0.
6
3,95
8
46,6
91,1
63
32.2
10
0.0
58
,531
,752
55
.6
TOTA
L**
307
22
,185
,899
19
8.0
45
9 1
8,18
2,65
4
108.
5
2,80
3
9,43
3,01
3
9.2
2
57
217,
804
2.
3
23
6,22
1
0.7
3,
849
50
,025
,591
35
.6
100.
0
56,2
98,8
49
53.0
Key
to C
ompa
ny N
ames
bpTT
- B
p Tr
inid
ad a
nd T
obag
oP.
O.G
.L. -
Prim
era
Oil
& G
as L
td.
T.N
.A. -
Trin
idad
Nor
ther
n Ar
eas
PETR
OTR
IN -
Pet
role
um C
ompa
ny o
f Trin
idad
and
Tob
ago
TRIN
TOM
AR -
E.
O.G
.R.T
.L -
EO
G R
esou
rces
MO
RAV
EN -
Mor
a O
il Ve
ntur
es L
imite
d
L.O
. - L
ease
Ope
rato
rsF.
O. -
Far
mou
tT.
E.D
. - T
rinid
ad E
xplo
ratio
n &
Dev
elop
men
t Ltd
.N
.M.E
.R.L
. - N
eal &
Mas
sy E
nerg
y R
esou
rces
Ltd
.V.
P.T.
L. -
Ven
ture
Pro
duct
ion
Trin
idad
Ltd
.V.
O.G
.T.L
. - V
erm
illio
n O
il &
Gas
(Trin
idad
) Ltd
. N
.H.E
.T.T
. - N
ew H
oriz
on E
xplo
ratio
n Tr
inid
ad L
td.
*Tot
al in
200
3
**
Tota
l Oct
ober
200
2 -
Sept
embe
r 200
3
Appendix VIII
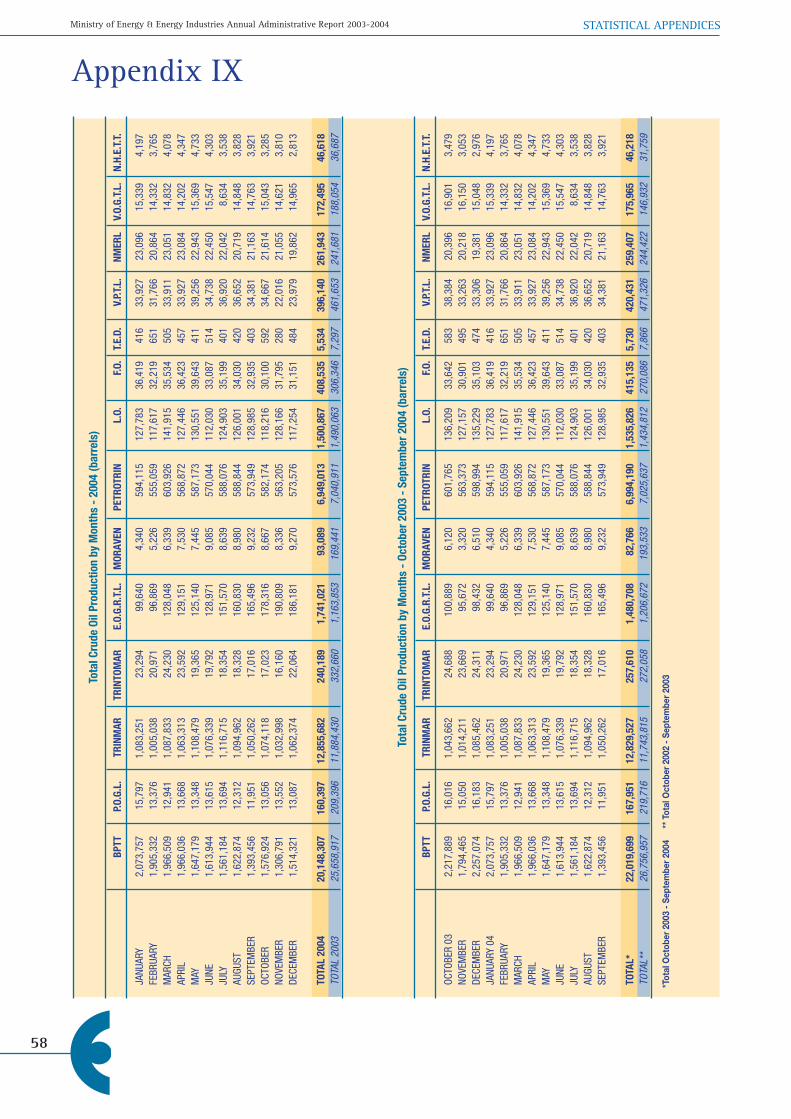
Ministry of Energy & Energy Industries Annual Administrative Report 2003-2004
58
STATISTICAL APPENDICES
Tota
l Cru
de O
il Pr
oduc
tion
by M
onth
s -
2004
(bar
rels
)
BP
TT
P.O.
G.L.
TR
INM
AR
TRIN
TOM
AR
E.O.
G.R.
T.L.
M
ORAV
EN
PETR
OTRI
N L.
O.
F.O.
T.E.
D.
V.P.
T.L.
NM
ERL
V.O.
G.T.
L.
N.H.
E.T.
T.
JANU
ARY
2,07
3,75
7
15,7
97
1,08
3,25
1
23,2
94
99,6
40
4,34
0
594,
115
12
7,78
3
36,4
19
416
33
,927
23
,096
15
,339
4,
197
FEBR
UARY
1,
905,
332
13
,376
1,
005,
038
20
,971
96
,869
5,
226
55
5,05
9
117,
617
32
,219
65
1
31,7
66
20,8
64
14,3
32
3,76
5M
ARCH
1,
966,
509
12
,941
1,
087,
833
24
,230
12
8,04
8
6,33
9
603,
926
14
1,91
5
35,5
34
505
33
,911
23
,051
14
,832
4,
078
APRI
L 1,
966,
036
13
,668
1,
063,
313
23
,592
12
9,15
1
7,53
0
568,
872
12
7,44
6
36,4
23
457
33
,927
23
,084
14
,202
4,
347
MAY
1,
647,
179
13
,348
1,
108,
479
19
,365
12
5,14
0
7,44
5
587,
173
13
0,55
1
39,6
43
411
39
,256
22
,943
15
,369
4,
733
JUNE
1,
613,
944
13
,615
1,
076,
339
19
,792
12
8,97
1
9,08
5
570,
044
11
2,03
0
33,0
87
514
34
,738
22
,450
15
,547
4,
303
JULY
1,
561,
184
13
,694
1,
116,
715
18
,354
15
1,57
0
8,63
9
588,
076
12
4,90
3
35,1
99
401
36
,920
22
,042
8,
634
3,
538
AUGU
ST
1,62
2,87
4
12,3
12
1,09
4,96
2
18,3
28
160,
830
8,
980
58
8,84
4
126,
001
34
,030
42
0
36,6
52
20,7
19
14,8
48
3,82
8SE
PTEM
BER
1,39
3,45
6
11,9
51
1,05
0,26
2
17,0
16
165,
496
9,
232
57
3,94
9
128,
985
32
,935
40
3
34,3
81
21,1
63
14,7
63
3,92
1OC
TOBE
R 1,
576,
924
13
,056
1,
074,
118
17
,023
17
8,31
6
8,66
7
582,
174
11
8,21
6
30,1
00
592
34
,667
21
,614
15
,043
3,
285
NOVE
MBE
R 1,
306,
791
13
,552
1,
032,
998
16
,160
19
0,80
9
8,33
6
563,
205
12
8,16
6
31,7
95
280
22
,016
21
,055
14
,621
3,
810
DECE
MBE
R 1,
514,
321
13
,087
1,
062,
374
22
,064
18
6,18
1
9,27
0
573,
576
11
7,25
4
31,1
51
484
23
,979
19
,862
14
,965
2,
813
TOTA
L 20
04
20,1
48,3
07
160,
397
12
,855
,682
24
0,18
9
1,74
1,02
1
93,0
89
6,94
9,01
3
1,50
0,86
7
408,
535
5,
534
39
6,14
0
261,
943
17
2,49
5
46,6
18TO
TAL
2003
25
,658
,917
20
9,39
6
11,8
84,4
30
332,
660
1,
163,
853
16
9,44
1
7,04
0,91
1
1,49
0,06
3
306,
346
7,
297
46
1,65
3
241,
681
18
8,05
4
36,6
87
Tota
l Cru
de O
il Pr
oduc
tion
by M
onth
s -
Octo
ber 2
003
- Se
ptem
ber 2
004
(bar
rels
)
BP
TT
P.O.
G.L.
TR
INM
AR
TRIN
TOM
AR
E.O.
G.R.
T.L.
M
ORAV
EN
PETR
OTRI
N L.
O.
F.O.
T.E.
D.
V.P.
T.L.
NM
ERL
V.O.
G.T.
L.
N.H.
E.T.
T.
OCTO
BER
03
2,21
7,88
9
16,0
16
1,04
3,66
2
24,6
88
100,
889
6,
120
60
1,76
5
136,
209
33
,642
58
3
38,3
84
20,3
96
16,9
01
3,47
9 NO
VEM
BER
1,79
4,46
5
15,0
50
1,01
4,21
1
23,6
69
95,6
72
3,32
0
563,
373
12
7,15
7
30,9
01
495
33
,263
20
,218
16
,150
3,
053
DECE
MBE
R 2,
257,
074
16
,183
1,
085,
462
24
,311
98
,432
6,
510
59
8,99
4
135,
229
35
,103
47
4
33,3
06
19,3
81
15,0
48
2,97
6 JA
NUAR
Y 04
2,
073,
757
15
,797
1,
083,
251
23
,294
99
,640
4,
340
59
4,11
5
127,
783
36
,419
41
6
33,9
27
23,0
96
15,3
39
4,19
7 FE
BRUA
RY
1,90
5,33
2
13,3
76
1,00
5,03
8
20,9
71
96,8
69
5,22
6
555,
059
11
7,61
7
32,2
19
651
31
,766
20
,864
14
,332
3,
765
MAR
CH
1,96
6,50
9
12,9
41
1,08
7,83
3
24,2
30
128,
048
6,
339
60
3,92
6
141,
915
35
,534
50
5
33,9
11
23,0
51
14,8
32
4,07
8 AP
RIL
1,96
6,03
6
13,6
68
1,06
3,31
3
23,5
92
129,
151
7,
530
56
8,87
2
127,
446
36
,423
45
7
33,9
27
23,0
84
14,2
02
4,34
7 M
AY
1,64
7,17
9
13,3
48
1,10
8,47
9
19,3
65
125,
140
7,
445
58
7,17
3
130,
551
39
,643
41
1
39,2
56
22,9
43
15,3
69
4,73
3 JU
NE
1,61
3,94
4
13,6
15
1,07
6,33
9
19,7
92
128,
971
9,
085
57
0,04
4
112,
030
33
,087
51
4
34,7
38
22,4
50
15,5
47
4,30
3 JU
LY
1,56
1,18
4
13,6
94
1,11
6,71
5
18,3
54
151,
570
8,
639
58
8,07
6
124,
903
35
,199
40
1
36,9
20
22,0
42
8,63
4
3,53
8 AU
GUST
1,
622,
874
12
,312
1,
094,
962
18
,328
16
0,83
0
8,98
0
588,
844
12
6,00
1
34,0
30
420
36
,652
20
,719
14
,848
3,
828
SEPT
EMBE
R 1,
393,
456
11
,951
1,
050,
262
17
,016
16
5,49
6
9,23
2
573,
949
12
8,98
5
32,9
35
403
34
,381
21
,163
14
,763
3,
921
TOTA
L*
22,0
19,6
99
167,
951
12
,829
,527
25
7,61
0
1,48
0,70
8
82,7
66
6,99
4,19
0
1,53
5,82
6
415,
135
5,
730
42
0,43
1
259,
407
17
5,96
5
46,2
18
TOTA
L**
26,7
56,9
57
219,
716
11
,743
,815
27
2,05
8
1,20
6,67
2
193,
533
7,
025,
637
1,
434,
812
27
0,08
6
7,86
6
471,
326
24
4,42
2
146,
932
31
,759
*Tot
al O
ctob
er 2
003
- Se
ptem
ber 2
004
*
* To
tal O
ctob
er 2
002
- Se
ptem
ber 2
003
Appendix IX

STATISTICAL APPENDICES
59
I n c r e a s i n g L o c a l C o n t e n t
MAR
INE
L
AND
TOTA
L
VENT
URE
VENT
URE
PETR
OTRI
N
EO
G RE
S.
TO
TAL
PETR
OTRI
N PE
TROT
RIN
TR
INM
AR
A.B.
M.
ALS
PT. L
IG
GALE
OTA
BPTT
TR
INTO
MAR
T’DA
D LT
D.
MOR
AVEN
M
ARIN
E A.
S.
GUAP
O
OCT
OBER
’03
1,04
3,66
2
29,3
08
9,07
6
36,9
74
2,21
7,88
9
24,6
88
100,
889
6,
120
3,
468,
606
0
84
0
791,
177
4,
260,
623
NOV
EMBE
R 1,
014,
211
24
,532
8,
731
35
,174
1,
794,
465
23
,669
95
,672
3,
320
2,
999,
774
0
89
1
740,
332
3,
740,
997
DEC
EMBE
R 1,
085,
462
24
,759
8,
547
37
,165
2,
257,
074
24
,311
98
,432
6,
510
3,
542,
260
0
1,
142
78
5,08
1
4,32
8,48
3
JAN
UARY
’04
1,08
3,25
1
24,8
35
9,09
2
39,0
56
2,07
3,75
7
23,2
94
99,6
40
4,34
0
3,35
7,26
5
0
498
77
7,60
8
4,13
5,37
1
FEB
RUAR
Y 1,
005,
038
23
,892
7,
874
32
,823
1,
905,
332
20
,971
96
,869
5,
226
3,
098,
025
0
39
6
724,
664
3,
823,
085
MAR
CH
1,
087,
833
25
,872
8,
039
41
,998
1,
966,
509
24
,230
12
8,04
8
6,33
9
3,28
8,86
8
0
466
79
4,31
8
4,08
3,65
2
APR
IL
1,06
3,31
3
25,4
94
8,43
3
41,7
33
1,96
6,03
6
23,5
92
129,
151
7,
530
3,
265,
282
0
35
0
746,
416
4,
012,
048
MAY
1,
108,
479
28
,582
10
,674
39
,558
1,
647,
179
19
,365
12
5,14
0
7,44
5
2,98
6,42
2
0
455
77
4,15
8
3,76
1,03
5
JUN
E 1,
076,
339
25
,466
9,
272
42
,032
1,
613,
944
19
,792
12
8,97
1
9,08
5
2,92
4,90
1
0
731
72
8,82
7
3,65
4,45
9
JUL
Y 1,
116,
715
28
,026
8,
894
41
,582
1,
561,
184
18
,354
15
1,57
0
8,63
9
2,93
4,96
4
0
663
75
4,24
2
3,68
9,86
9
AUG
UST
1,09
4,96
2
27,9
38
8,71
4
40,4
02
1,62
2,87
4
18,3
28
160,
830
8,
980
2,
983,
028
0
54
1
760,
059
3,
743,
628
SEP
TEM
BER
1,05
0,26
2
25,4
97
8,88
4
38,4
12
1,39
3,45
6
17,0
16
165,
496
9,
232
2,
708,
255
0
62
4
749,
034
3,
457,
913
TOT
AL
12,8
29,5
27
314,
201
10
6,23
0
466,
909
22
,019
,699
25
7,61
0
1,48
0,70
8
82,7
66
37,5
57,6
50
0
7,59
7
9,12
5,91
6
46,6
91,1
63
Land
and
Mar
ine
Crud
e Oi
l Pro
duct
ion
Octo
ber 2
003
- Se
ptem
ber 2
004
(bar
rels
)
MAR
INE
L
AND
TOTA
L
VENT
URE
VENT
URE
PETR
OTRI
N
EO
G RE
S.
TO
TAL
PETR
OTRI
N PE
TROT
RIN
TR
INM
AR
A.B.
M.
ALS
PT. L
IG
GALE
OTA
BPTT
TR
INTO
MAR
T’DA
D LT
D.
MOR
AVEN
M
ARIN
E A.
S.
GUAP
O
JAN
UARY
1,
083,
251
24
,835
9,
092
39
,056
2,
073,
757
23
,294
99
,640
4,
340
3,
357,
265
0
498
777,
608
4,
135,
371
FEB
RUAR
Y 1,
005,
038
23
,892
7,
874
32
,823
1,
905,
332
20
,971
96
,869
5,
226
3,
098,
025
0
396
724,
664
3,
823,
085
MAR
CH
1,
087,
833
25
,872
8,
039
41
,998
1,
966,
509
24
,230
12
8,04
8
6,33
9
3,28
8,86
8
0 46
6 79
4,31
8
4,08
3,65
2
APR
IL
1,06
3,31
3
25,4
94
8,43
3
41,7
33
1,96
6,03
6
23,5
92
129,
151
7,
530
3,
265,
282
0
350
746,
416
4,
012,
048
MAY
1,
108,
479
28
,582
10
,674
39
,558
1,
647,
179
19
,365
12
5,14
0
7,44
5
2,98
6,42
2
0 45
5 77
4,15
8
3,76
1,03
5
JUN
E 1,
076,
339
25
,466
9,
272
42
,032
1,
613,
944
19
,792
12
8,97
1
9,08
5
2,92
4,90
1
0 73
1 72
8,82
7
3,65
4,45
9
JUL
Y 1,
116,
715
28
,026
8,
894
41
,582
1,
561,
184
18
,354
15
1,57
0
8,63
9
2,93
4,96
4
0 66
3 75
4,24
2
3,68
9,86
9
AUG
UST
1,09
4,96
2
27,9
38
8,71
4
40,4
02
1,62
2,87
4
18,3
28
160,
830
8,
980
2,
983,
028
0
541
760,
059
3,
743,
628
SEP
TEM
BER
1,05
0,26
2
25,4
97
8,88
4
38,4
12
1,39
3,45
6
17,0
16
165,
496
9,
232
2,
708,
255
0
624
749,
034
3,
457,
913
OCT
OBER
1,
074,
118
27
,403
7,
264
36
,881
1,
576,
924
17
,023
17
8,31
6
8,66
7
2,92
6,59
6
0 61
4 74
6,58
5
3,67
3,79
5
NOV
EMBE
R 1,
032,
998
14
,688
7,
328
35
,583
1,
306,
791
16
,160
19
0,80
9
8,33
6
2,61
2,69
3
0 52
3 74
0,37
8
3,35
3,59
4
DEC
EMBE
R 1,
062,
374
16
,114
7,
865
37
,320
1,
514,
321
22
,064
18
6,18
1
9,27
0
2,85
5,50
9
0 56
5 73
5,30
7
3,59
1,38
1
TOT
AL
12,8
55,6
82
293,
807
10
2,33
3
467,
380
20
,148
,307
24
0,18
9
1,74
1,02
1
93,0
89
35,9
41,8
08
0
6,42
6
9,03
1,59
6
44,9
79,8
30
Land
and
Mar
ine
Crud
e Oi
l Pro
duct
ion
- 20
04 (b
arre
ls)
Appendix X

Ministry of Energy & Energy Industries Annual Administrative Report 2003-2004
60
STATISTICAL APPENDICES
Appendix XI
M
ARIN
E
LAN
D TO
TAL
VENT
URE
VENT
URE
PETR
OTRI
N
EO
G RE
S.
TO
TAL
PETR
OTRI
N PE
TROT
RIN
TR
INM
AR
A.B.
M.
ALS
PT. L
IG
GALE
OTA
BPTT
TR
INTO
MAR
T’DA
D LT
D.
MOR
AVEN
M
ARIN
E A.
S.
GUAP
O
OCT
OBER
‘03
336
62
3
29
16
8
3
11
4
616
0
7
3,
297
3,
920
NOV
EMBE
R 33
7
58
3
31
162
3
11
4
60
9
0
7
3,22
0
3,83
6
DEC
EMBE
R 34
4
56
2
31
169
3
11
4
62
0
0
6
3,27
3
3,89
9
JAN
UARY
‘04
341
62
2
32
17
3
3
11
5
629
0
7
3,
323
3,
959
FEB
RUAR
Y 33
6
52
2
32
139
3
12
5
58
1
0
5
3,32
8
3,91
4
MAR
CH
336
64
2
32
17
0
3
12
5
624
0
5
3,
363
3,
992
APR
IL
353
60
2
32
17
1
3
12
5
638
0
5
3,
397
4,
040
MAY
35
0
54
2
32
166
3
12
5
62
4
0
4
3,36
0
3,98
8
JUN
E 34
4
51
2
32
166
3
14
5
61
7
0
7
3,29
2
3,91
6
JUL
Y 33
1
54
2
32
164
3
12
5
60
3
0
6
3,38
8
3,99
7
AUG
UST
337
64
2
32
16
7
3
14
5
624
0
6
3,
348
3,
978
SEP
TEM
BER
330
51
2
32
16
5
4
15
5
604
0
6
3,
412
4,
022
AVE
RAGE
34
0
57
2
32
165
3
12
5
61
6
0
6
3,33
3
3,95
5
Aver
age
No o
f Pro
duci
ng W
ells
- O
ctob
er 2
003
- Se
ptem
ber 2
004

STATISTICAL APPENDICES
61
I n c r e a s i n g L o c a l C o n t e n t
Appendix XII
Crude Oil Production by Lease - 2004 (barrels)
STATE LEASE PRIVATE LEASE TOTAL
No.of Daily Av. No.of Daily Av. No.of
Wells Production Per Well Wells Production Per Well Wells Production
JANUARY 3,387 4,046,756 38.5 572 88,615 5.0 3,959 4,135,371
FEBRUARY 3,331 3,736,084 38.7 583 87,001 5.1 3,914 3,823,085
MARCH 3,428 3,992,573 37.6 564 91,079 5.2 3,992 4,083,652
APRIL 3,460 3,924,911 37.8 580 87,137 5.0 4,040 4,012,048
MAY 3,423 3,672,883 34.6 565 88,152 5.0 3,988 3,761,035
JUNE 3,377 3,566,735 35.2 539 87,724 5.4 3,916 3,654,459
JULY 3,439 3,602,727 33.8 558 87,142 5.0 3,997 3,689,869
AUGUST 3,428 3,654,923 34.4 550 88,705 5.2 3,978 3,743,628
SEPTEMBER 3,474 3,373,426 32.4 548 84,487 5.1 4,022 3,457,913
OCTOBER 3,429 3,586,246 33.7 563 87,549 5.0 3,992 3,673,795
NOVEMBER 3,362 3,267,878 32.4 562 85,716 5.1 3,924 3,353,594
DECEMBER 3,324 3,503,182 34.0 552 88,199 5.2 3,876 3,591,381
TOTAL 2004 43,928,324 1,051,506 44,979,830
AVERAGE 2004 3,405 120,023 35.2 561 2,873 5.1 3,967 122,896
Crude Oil Production by Lease - October 2003 - September 2004 (barrels)
STATE LEASE PRIVATE LEASE TOTAL
No.of Daily Av. No.of Daily Av. No.of
Wells Production Per Well Wells Production Per Well Wells Production
OCTOBER 3,344 4,168,024 40.2 576 92,599 5.2 3,920 4,260,623
NOVEMBER 3,287 3,654,651 37.1 549 86,346 5.2 3,836 3,740,997
DECEMBER 3,341 4,233,692 40.9 558 94,791 5.5 3,899 4,328,483
JANUARY 3,387 4,046,756 38.5 572 88,615 5.0 3,959 4,135,371
FEBRUARY 3,331 3,736,084 38.7 583 87,001 5.1 3,914 3,823,085
MARCH 3,428 3,992,573 37.6 564 91,079 5.2 3,992 4,083,652
APRIL 3,460 3,924,911 37.8 580 87,137 5.0 4,040 4,012,048
MAY 3,423 3,672,883 34.6 565 88,152 5.0 3,988 3,761,035
JUNE 3,377 3,566,735 35.2 539 87,724 5.4 3,916 3,654,459
JULY 3,439 3,602,727 33.8 558 87,142 5.0 3,997 3,689,869
AUGUST 3,428 3,654,923 34.4 550 88,705 5.2 3,978 3,743,628
SEPTEMBER 3,474 3,373,426 32.4 548 84,487 5.1 4,022 3,457,913
TOTAL OCT ‘03 - SEP ‘04 45,627,385 1,063,778 46,691,163
AVERAGE OCT ‘03 - SEP ‘04 3,393 124,665 36.7 562 2,906 5.2 3,955 127,571

Ministry of Energy & Energy Industries Annual Administrative Report 2003-2004
62
STATISTICAL APPENDICES
Appendix XIII
STATE LEASE PRIVATE LEASE
Production % of Total Production % of Total
Production Production
BPTT 20,148,307 100.0 0 0.0
P.O.G.L. 40,789 25.4 119,608 74.6
TRINMAR 12,855,682 100.0 0 0.0
PETROTRIN 6,161,906 88.7 787,107 11.3
TRINTOMAR 240,189 100.0 0 0.0
EOG RESOURCES 1,741,021 100.0 0 0.0
MORAVEN 93,089 100.0 0 0.0
LEASE OPERATORS 1,372,990 91.5 127,877 8.5
FARMOUT 397,155 97.2 11,380 2.8
TED 0 0.0 5,534 100.0
V.P.T.L 396,140 100.0 0 0.0
NMERL 261,943 100.0 0 0.0
VOGTL 172,495 100.0 0 0.0
NHETT 46,618 100.0 0 0.0
TOTAL 2004 43,928,324 97.7 1,051,506 2.3
TOTAL 2003 48,024,353 97.6 1,167,036 2.4
Crude Oil Production by Company Lease - 2004 (barrels)
Crude Oil Production by Company Lease - October 2003 - September 2004 (barrels)
BPTT 22,019,699 100.0 0 0.0
P.O.G.L. 41,951 25.0 126,000 75.0
TRINMAR 12,829,527 100.0 0 0.0
PETROTRIN 6,204,758 88.7 789,432 11.3
TRINTOMAR 257,610 100.0 0 0.0
E.O.G. RESOURCES 1,480,708 100.0 0 0.0
MORAVEN 82,766 100.0 0 0.0
LEASE OPERATORS 1,404,254 91.4 131,572 8.6
FARMOUT 404,091 97.3 11,044 2.7
TED 0 0.0 5,730 100.0
V.P.T.L. 420,431 100.0 0 0.0
N.M.E.R.L. 259,407 100.0 0 0.0
VOGTL 175,965 100.0 0 0.0
NHETT 46,218 100.0 0 0.0
TOTAL OCT 2003 - SEPT 2004 45,627,385 97.7 1,063,778 2.3
TOTAL OCT 2002 - SEPT 2003 48,812,095 97.6 1,213,496 2.4
STATE LEASE PRIVATE LEASE
Production % Of Total Production % of Total
Production Production

STATISTICAL APPENDICES
63
I n c r e a s i n g L o c a l C o n t e n t
BPTT 22,019,699 100.0 0 0.0
P.O.G.L. 41,951 25.0 126,000 75.0
TRINMAR 12,829,527 100.0 0 0.0
PETROTRIN 6,204,758 88.7 789,432 11.3
TRINTOMAR 257,610 100.0 0 0.0
E.O.G. RESOURCES 1,480,708 100.0 0 0.0
MORAVEN 82,766 100.0 0 0.0
LEASE OPERATORS 1,404,254 91.4 131,572 8.6
FARMOUT 404,091 97.3 11,044 2.7
TED 0 0.0 5,730 100.0
V.P.T.L. 420,431 100.0 0 0.0
N.M.E.R.L. 259,407 100.0 0 0.0
VOGTL 175,965 100.0 0 0.0
NHETT 46,218 100.0 0 0.0
TOTAL OCT 2003 - SEPT 2004 45,627,385 97.7 1,063,778 2.3
TOTAL OCT 2002 - SEPT 2003 48,812,095 97.6 1,213,496 2.4
Appendix XIVSu
mm
ary
of F
luid
Inje
ctio
n in
Trin
idad
and
Tob
ago
2000
- 2
004
NO
. OF
PROJ
ECTS
IN
OI
L PR
ODUC
ED B
Y
OPER
ATIO
N AT
END
OF
YEAR
IN
JECT
ION
VOLU
ME
WEL
LS U
NDER
PRO
JECT
INFL
UENC
E
Wat
er
Ther
mal
Ca
rbon
Oi
l Exp
ress
ed a
s
Carb
on
WAS
P Ca
rbon
W
ater
&
W
ASP
In
ject
ion
Reco
very
Di
oxid
e W
ASP
All
a %
of C
ount
ry’s
W
ater
St
eam
Di
oxid
e St
ream
/Wat
er
Diox
ide
Othe
r Flu
ids
Stea
m
Stea
m
Wat
er
Proj
ects
Pr
ojec
ts
Proj
ects
St
eam
/Wat
er
Proj
ects
To
tal P
rodu
ctio
n
(M
cf/d
) (b
wpd
) (
bspd
) (
bspd
) (b
wpd
) (b
opd)
(b
opd)
(b
opd)
(b
opd)
(b
opd)
2000
14
9
5
5
20
6
25,1
31
3,37
4
8,65
7
11,3
66
6,58
9
1,44
4
528
3,
961
12
,522
10
.5
2001
14
9
5
5
3,
238
4,
245
2,
335
9,
259
5,
296
5,
960
1,
261
62
1
3,62
2
11,4
64
10.1
2002
13
9
5
5
5,
547
19
,008
5,
665
9,
223
6,
264
6,
104
1,
084
56
9
3,47
6
11,2
33
8.6
2003
14
8
6
5
5,
408
10
,025
6,
740
8,
815
5,
149
6,
065
1,
728
49
6
3,28
9
11,5
78
8.6
2004
13
10
6
5
2,
135
13
,698
9,
449
11
,613
5,
686
5,
508
1,
947
32
4
3,05
2
10,8
31
8.8
Appendix XV
Secondary and Enhanced Oil Recovery Operations - 2004
WATER INJECTION
Active Water Oil Water Gas Water Projects Injected Produced Produced Produced Cut (bwpd) (bopd) (bwpd) (Mcf/d) %
BPTT 4 723 2,084 1,907 1,229 47.8
TNA 1 12,965 2,791 3,550 N.A. 56.0
PETROTRIN 8 10 633 1,059 99 62.6
ALL COS. 13 13,698 5,508 6,516 1,328 54.2
STEAM INJECTION
Active Steam Oil Water Oil/steam Projects Injected Produced Produced Ratio (bspd) (bopd) (bwpd)
PETROTRIN 10 9,449 1,947 5,738 0.21
ALL 10 9,449 1,947 5,738 0.21
CARBON DIOXIDE
Carbon Active Dioxide Oil Water Gas Projects Injected Produced Produced Produced G.O.R. (Mcf/d) (bopd) (bwpd) (Mcf/d)
PETROTRIN 6 2,135 324 284 231 713
ALL 6 2,135 324 284 231 713
PARTIAL WASP
Active Water Steam Oil Water Gas Water Projects Injected Injected Produced Produced Produced Cut (bwpd) (bwpd) (bopd) (bwpd) (Mcf/d) %
PETROTRIN 5 5,686 11,613 3,052 16,386 20 84.3
ALL 5 5,686 11,613 3,052 16,386 20 84.3

Ministry of Energy & Energy Industries Annual Administrative Report 2003-2004
64
STATISTICAL APPENDICES
Appendix XVI
Water Injection Summary by Projects - 2004
Field Project Water Oil Water Gas Water
Injection Produced Produced Produced Cut %
(bwpd) (bopd) (bwpd) (Mcf/d)
BPTT TEAK MM-01/L SAND 723 1,574 1,210 910 43.5
0-1UM SAND 0 122 101 96 45.3
0/2 SAND 0 118 71 18 37.6
O/1(UML) SAND 0 0 0 0 0.0
U SAND 0 270 525 205 66.0
ALL ALL 723 2,084 1,907 1,229 47.8
TNA MAIN FIELD 8011 WATERFLOOD 12,965 2,791 3,550 N.A. 56.0
ALL ALL 12,965 2,791 3,550 N.A. 56.0
PETROTRIN CATSHILL CO-30.BLK.24 1 42 5 11 10.6
N SAND 2 94 258 39 73.3
TRINITY SHALLOW HERRERA 7 91 210 30 69.8
PT. FORTIN CRUSE ‘G’ 0 66 45 19 40.5
GALEOTA PLATFORM “B” 0 134 30 0 18.3
PLATFORM “C” 0 77 322 0 80.7
FYZABAD FOREST 0 59 89 0 60.1
CRUSE 0 70 100 0 58.8
ALL ALL 10 633 1,059 99 62.6
TOTAL ALL ALL 13,698 5,508 6,516 1,328 54.2

STATISTICAL APPENDICES
65
I n c r e a s i n g L o c a l C o n t e n t
Field Projects Steam Oil Water Water Oil/steam
Injected Produced Produced Cut Ratio
(bspd) (bopd) (bwpd) %
PETROTRIN GUAPO 2,095 686 3,025 81.5 0.33
F.RESERVE Ph.1 West Ext.* 0 26 2 7.1 0.00
Cyclic Steamflood 0 39 5 11.4 0.00
UMLE Pilot Steamflood 797 134 137 50.6 0.17
P.LANDS’E’. Main Steamflood 1,431 70 382 84.5 0.05
Phase 1. Exp. 44 8 94 92.2 0.18
Phase 1a. Exp. 0 14 9 39.1 0.00
PT. FORTIN Cruse ‘E’ 666 183 353 65.9 0.27
PT. FORTIN CENTRAL Cruse ‘E’ 0 15 2 11.8 0.00
Cruse ‘E’ Area IV 4,416 772 1,729 69.1 0.17
ALL ALL 9,449 1,947 5,738 74.7 0.21
Field Project Injection Oil Water Gas G.O.R
(Mcf/d) (bopd) (bwpd) (Mcf/d)
PETROTRIN F. RESERVE Zone 5 Sds. 293 33 26 0 0
Middle Field 0 3 0 0 0
Exp.CO2 Cyclic 0 23 2 7 304
UCWE 745 140 154 48 343
Phase 1 East 1,097 109 102 6 55
OROPOUCHE CO2 Flood 0 16 0 170 10,625
ALL COMPANIES ALL ALL 2,135 324 284 231 713
Steam Injection Summary by Projects - 2004 (barrels)
Carbon Dioxide Injection Summary by Projects - 2004
Appendix XVII

Ministry of Energy & Energy Industries Annual Administrative Report 2003-2004
66
STATISTICAL APPENDICES
OCT’00 - SEP’01 OCT’01-SEP’02 OCT’02-SEP’03 OCT’03-SEP’04
BPTT 1,164,002 1,229,413 1,630,921 1,900,917
TRINMAR 46,324 58,268 53,319 62,167
PETROTRIN 16,081 14,104 14,198 12,917
PRIMERA 36 28 23 17
TRINTOMAR 66 65 72 218
EOG RESOURCES 138,712 148,126 181,697 200,000
COASTLINE 508 386 331 130
BRITISH GAS 239,790 239,932 568,459 668,333
MORAVEN 607 497 349 301
VERMILION - - 15,567 19,333
TOTAL 1,606,126 1,690,819 2,464,936 2,864,332
2001 2002 2003 2004
BPTT 1,162,897 1,317,966 1,737,212 1,954,893
TRINMAR 53,387 53,758 56,054 59,649
PETROTRIN 15,546 14,191 13,829 11,543
PRIMERA 34 27 21 20
TRINTOMAR 68 63 75 301
EOG RESOURCES 136,814 158,991 179,845 224,765
COASTLINE 501 342 337 45
BRITISH GAS 236,706 309,865 608,212 663,759
MORAVEN 636 447 334 316
VERMILION - 687 19,983 19,605
TOTAL 1,606,589 1,856,336 2,615,903 2,934,896
Natural Gas Production by Company 2001 - 2004 (MMcf/d)
Natural Gas Production by Company October 2000 - September 2004 (MMcf/d)
Appendix XVIII

STATISTICAL APPENDICES
67
I n c r e a s i n g L o c a l C o n t e n t
Appendix XIX
Natural Gas Utilisation 2000 - 2004 (MMcf/d)
COMPANY 2000 2001 2002 2003 2004
REFINERY (AS FUEL) Petrotrin (P-a-P) 46.26 37.79 31.43 33.70 15.60
Petrotrin (P/F) 0.71 0.71 0.71 0.82 0.84
Sub-Total 46.97 38.49 32.14 34.52 16.44
FIELD USE (AS FUEL) 34.61 30.37 25.43 45.89 44.01
ALNG FUEL 49.00 46.00 58.00 142.47 161.00
PRODUCTION USE * 204.83 206.24 216.48 195.61 179.44
TOTAL UTILISATION (OIL COMPANIES) 335.40 321.10 332.04 418.49 400.89
FERTILISER YARA TRINIDAD LTD. 39.20 34.96 37.79 39.43 38.18
MANUFACTURE PCS Nitrogen 01, 02 AND 03 79.10 132.08 133.84 130.12 135.62
PCS Nitrogen 04 61.80 66.04 59.33 62.82 63.49
POINT LISAS NITROGEN LTD 58.27 56.50 55.80 59.48 62.05
Tringen 1 54.38 52.27 51.21 55.48 54.22
Tringen 11 52.62 51.56 50.85 47.88 50.83
Tringen GTG 5.65 6.00 6.00 6.23 5.82
PCS Nitrogen Urea 10.24 8.48 11.30 11.69 11.15
CNC 58.59 59.95
Sub-Total 361.27 407.88 406.12 471.72 481.31
METHANOL Methanol - T&T I 44.85 42.73 37.43 37.74 45.42
MANUFACTURE CMC 45.20 49.44 48.03 47.68 46.28
Methanol - T&T II 53.68 50.15 50.50 49.62 46.04
Methanol IV 52.62 53.33 55.80 54.63 53.21
Methanex T’dad Unlimited 42.02 66.39 74.16 82.05 72.90
Atlas Methanol 72.68
Sub-Total 238.37 262.03 265.92 271.72 336.53
IRON AND STEEL Caribbean Ispat 19.07 36.02 39.20 41.38 43.35
MANUFACTURE ISG T’dad Unlimited 0.00 0.00 0.00 0.00 2.57
Cliffs & Associates Ltd 5.65 11.30 0.00 0.00 0.00
Caribbean Ispat Megamod 33.90 37.79 39.55 40.64 39.98
Sub-Total 58.62 85.11 78.75 82.02 85.90
POWER GENERATION T & TEC 186.46 193.52 213.65 230.37 239.44
LIQUIFIED NATURAL GAS ATLANTIC LNG 385.99 376.81 567.86 1,221.75 1,415.00
CEMENT MANUFACTURE Trinidad Cement Limited 12.36 12.01 13.07 11.82 12.97
GAS PROCESSING PPGPL 19.07 27.19 28.96 30.20 28.20
NITROGEN 2000 LTD 28.68
SMALL CONSUMERS 13.77 13.42 14.48 13.41 11.93
TOTAL 1,611.32 1,699.08 1,920.85 2,751.50 3,040.85
NB: includes recompressed gas used for gas lifting.

Ministry of Energy & Energy Industries Annual Administrative Report 2003-2004
68
STATISTICAL APPENDICES
Natural Gas Utilisation October 1999 - September 2004 (MMcf/d)
COMPANY OCT’99-SEP’00 OCT’00-SEP’01 OCT’01-SEP’02 OCT’02-SEP’03 OCT’03-SEP’04
REFINERY (AS FUEL) Petrotrin (P-a-P) 45.61 42.10 29.73 37.10 16.70
Petrotrin (P/F) 0.89 0.72 0.75 0.81 0.83
Sub-Total 46.50 42.82 30.48 37.91 17.53
FIELD USE (AS FUEL) 34.00 32.00 26.49 41.00 44.12
ALNG FUEL 45.00 45.00 54.00 124.00 162.00
PRODUCTION USE * 206.55 211.53 215.77 206.18 176.74
TOTAL UTILISATION (OIL COMPANIES) 332.05 331.35 326.74 409.09 400.39
FERTILISER Yara Trinidad Ltd 37.42 35.25 37.43 39.38 38.29
MANUFACTURE PCS Nitrogen Ammonia 78.50 129.37 135.96 132.43 130.17
PCS Nitrogen 04 60.04 66.60 59.68 61.91 63.85
Point Lisas Nitrogen Ltd 59.15 55.48 55.80 58.90 63.85
Tringen 1 54.41 54.19 48.73 55.49 55.12
Tringen 11 51.81 51.95 51.56 47.74 50.02
Tringen GTG 5.58 5.98 6.00 6.19 6.18
PCS Nitrogen Urea 9.93 8.64 10.95 11.58 11.83
CNC 58.74 56.52
Sub-Total 356.84 407.46 406.11 472.36 475.83
METHANOL Methanol - T&T I 43.48 43.61 38.85 38.20 43.81
MANUFACTURE CMC 43.83 49.84 48.03 49.48 38.02
Methanol - T&T II 53.46 51.91 49.44 49.48 45.33
Methanol IV 52.44 52.62 55.44 54.53 54.75
Methanex Trinidad Unlimited 24.84 67.10 73.81 79.16 77.66
Atlas Methanol 43.48
Sub-Total 218.05 265.08 265.57 270.85 303.05
IRON AND STEEL Ispat 19.00 34.26 35.31 42.35 42.83
MANUFACTURE Nucor 0.00 0.00 0.00 0.00 0.00
Cliffs & Associates Ltd 7.55 10.24 1.06 0.00 0.00
Caribbean Ispat Megamod 34.59 37.43 40.97 39.11 39.72
ISG Trinidad Unlimited 0.11
Sub-Total 61.14 81.93 77.34 81.46 82.66
POWER GENERATION T & TEC 185.30 193.88 204.12 230.03 233.23
LIQUIFIED NATURAL GAS ATLANTIC LNG 379.00 390.93 440.37 1,070.00 1,409.00
CEMENT MANUFACTURE Trinidad Cement Limited 12.67 12.01 12.36 11.92 12.65
GAS PROCESSING PPGPL 17.14 26.49 28.60 30.75 27.56
SMALL CONSUMERS 13.39 13.42 14.83 13.62 11.60
NITROGEN 2000 LTD 12.70
TOTAL 1,575.58 1,722.55 1,776.04 2,590.08 2,968.67
Appendix XIX (continued)
NB: includes recompressed gas used for gas lifting.

STATISTICAL APPENDICES
69
I n c r e a s i n g L o c a l C o n t e n t
Appendix XX
Annual Statistics for Natural Gas Production and Utilisation 2000 - 2004
2000 2001 2002 2003 2004
MMSCF/D % MMSCF/D % MMSCF/D % MMSCF/D % MMSCF/D %
PRODUCTION 1,498 100 1,607 100 1,855 100 2,607 100 2,938 100
GOR (M3/M3) 2,240 2,523 2,529 3,445 4,258
A. USED AS FUEL:
IN FIELDS 35 2.3 30 1.9 25 1.4 46 1.8 44 1.5
IN REFINERIES 47 3.2 38 2.4 32 1.7 35 1.3 37 1.3
BY NON OIL COMPANIES 466 31.1 523 32.6 569 30.6 585 22.4 651 22.2
ALNG FUEL 49 3.3 46 2.9 58 3.1 142 5.4 161 5.5
SUBTOTAL 597 39.9 637 39.8 684.3 36.76 808 30.9 893 30.5
B. OTHER COMPLETE UTILISATION:
USED AS PROCESS GAS 410 27.4 455 28.3 468 25.2 501 19.2 552 18.6
INJECTED INTO FORMATION 0 0.0 0.0 0.0 0.0 0.0 0.0 0.0 0.0 0.0
CONVERTED TO N.G.L. 14 0.9 23 1.4 21 1.1 25 1.0 22 0.8
CONVERTED TO L.N.G. 386 25.7 377 23.4 568 30.6 1,222 46.9 1,415 48.2
SUB TOTAL 810 54 855 53.1 1,057.3 56.9 1,748 67.1 1,989 67.6
C. VENTED
91 6.1 115 7.1 113 6.1 51.0 2.0 56.0 1.9
TOTAL 1,498 100 1,607 100 1,855 100 2,607 100 2,938 100
Annual Statistics for Natural Gas Production and Utilisation October 1999 - September 2004
OCT’99-SEP’00 OCT’00-SEP’01 OCT’01-SEP’02 OCT’02-SEP’03 OCT’03-SEP’04
MMSCF/D % MMSCF/D % MMSCF/D % MMSCF/D % MMSCF/D %
PRODUCTION 1,456 100 1,606 100 1,691 100 2,458 100 2,864 100
GOR (M3/M3) 2,065 2,539 2,417 3,194 3,998
A. USED AS FUEL:
IN FIELDS 34 2.3 32 2.0 26 1.5 41 1.7 44 1.5
IN REFINERIES 46 3.2 42 2.6 31 1.8 39 1.6 38 1.3
BY NON OIL COMPANIES 462 31.7 523 32.6 552 32.6 586 23.8 627 21.9
ALNG FUEL 45 3.1 45 2.8 54 3.2 124 5.0 162 5.7
SUBTOTAL 587 40.3 642 40.0 662 39 790 32.1 871 30.4
B. OTHER COMPLETE UTILISATION:
USED AS PROCESS GAS 390 26.8 456 28.4 458 27.1 489 19.9 510 17.8
INJECTED INTO FORMATION 0 0.0 0 0.0 0 0.0 0 0.0 0 0.0
CONVERTED TO N.G.L. 12 0.8 22 1.4 21 1.2 26 1.1 22 0.8
CONVERTED TO L.N.G. 379 26 391 24.3 440 26 1,070 43.5 1,409 49.2
SUBTOTAL 781 53.6 869 54.1 919 54.3 1,585 64.5 1,941 67.8
C. VENTED
88 95 5.9 110 6.5 83 3.4 53 1.9
TOTAL 1,456 94 1,606 100 1,691 100 2,458 100 2,864 100

Ministry of Energy & Energy Industries Annual Administrative Report 2003-2004
70
STATISTICAL APPENDICES
METRIC TONNES
NATURAL ASPHALT 2002 2003 2004
EXTRACTED BY MINISTRY OF WORKS FOR LOCAL USE 0 0 0
EXTRACTED BY TRINIDAD LAKE ASPHALT COMPANY 17,608 25,518 14,187
TOTAL 17,608 25,518 14,187
DERIVED PRODUCTS MANUFACTURED BY THE COMPANY
EXPORTS :-
CRUDE ASPHALT 0 0 0
DRIED ASPHALT 15,647 21,341 10,962
CEMENT ASPHALT 6 0 0
TOTAL 15,653 21,341 10,962
LOCAL SALES :-
CRUDE ASPHALT 0 0 0
DRIED ASPHALT 208 281 257
CEMENT ASPHALT 1,479 2,179 2,919
TOTAL 1,687 2,460 3,176
Pitch Lake Asphalt Extracts, Products, Usage and Exports 2002 - 2004
METRIC TONS
NATURAL ASPHALT OCT. 2003 - SEPT. 2004 OCT. 2002 - SEPT. 2003
EXTRACTED BY MINISTRY OF WORKS FOR LOCAL USE 0 0
EXTRACTED BY TRINIDAD LAKE ASPHALT COMPANY 13,999 25,555
TOTAL 13,999 25,555
DERIVED PRODUCTS MANUFACTURED BY THE COMPANY
EXPORTS :-
CRUDE ASPHALT 0 0
DRIED ASPHALT 9,500 23,094
CEMENT ASPHALT 0 0
TOTAL 9,500 23,094
LOCAL SALES :-
CRUDE ASPHALT 0 0
DRIED ASPHALT 237 298
CEMENT ASPHALT 3,708 1,440
TOTAL 3,945 1,738
Pitch Lake Asphalt Extracts, Products, Usage and Exports October 2002 - September 2004
Appendix XXI

STATISTICAL APPENDICES
71
I n c r e a s i n g L o c a l C o n t e n t
Dest
inat
ion
of E
xpor
ts o
f Cru
de a
nd R
efine
d Pr
oduc
ts fr
om T
rinid
ad a
nd T
obag
o -
2004
(bar
rels
)
COUN
TRY
TOTA
L %
OF
CRUD
E .
KERO
SENE
&
GAS
&
RE
FINE
D TO
TAL
PETR
OLEU
M
AV
IATI
ON
MOT
OR
AVIA
TION
DI
ESEL
PETR
O-
LU
BES
&
PR
ODUC
TS
EXPO
RTS
EXPO
RTS
L.P.
G.
GASO
LENE
GA
SOLE
NE
TURB
INE
FUEL
OI
LS
FUEL
OIL
CH
EMIC
ALS
ASPH
ALT
GREA
SES
OTHE
RNO
RTH
AMER
ICA
CAN
ADA
0
0
0
0
0
0
0
0
0
0
0
0
U
SA
10,8
96,7
11
42.9
7 20
,467
,215
0
0
23
9,68
6
0
639,
961
9,
054,
907
0
0
0
96
2,15
7 TO
TAL
N.A.
10
,896
,711
42
.97
20,4
67,2
15
0
0
239,
686
0
63
9,96
1
9,05
4,90
7
0
0
0
962,
157
CE
NTRA
L AM
ERIC
A
R
EPUB
LIC
OF P
ANAM
A 9,
342
0.
01
0
9,34
2
0
0
0
0
0
0
0
0
0
GUA
TEM
ALA
502,
512
0.
69
0
0
0
147,
947
82
,081
27
2,48
4
0
0
0
0
0
OTH
ER C
.A. (
a)
1,24
2,32
2
1.70
0
10
,021
0
19
8,14
1
58,3
94
739,
158
0
0
0
0
23
6,60
8 TO
TAL
C.A.
1,
754,
176
2.
40
0
19,3
63
0
346,
088
14
0,47
5
1,01
1,64
2
0
0
0
0
236,
608
SO
UTH
AMER
ICA
GUY
ANA
2,63
4,03
9
3.61
0
44
,176
4,
289
54
8,47
1
115,
718
1,
229,
211
69
2,17
4
0
0
0
0
SUR
INAM
E 2,
281,
161
3.
13
0
0
0
557,
048
19
2,46
9
1,04
2,77
6
488,
868
0
0
0
0
F
RENC
H GU
IANA
1,
450,
026
1.
99
0
15,6
04
0
218,
482
24
4,78
2
689,
220
28
1,93
8
0
0
0
0
OTH
ER S
.A. (
b)
0
0.00
0
0
0
0
0
0
0
0
0
0
0
TOTA
L S.
A.
6,36
5,22
6
8.73
0
59
,780
4,
289
1,
324,
001
55
2,96
9
2,96
1,20
7
1,46
2,98
0
0
0
0
0
WES
T IN
DIES
BRI
TISH
(c)
14,5
51,8
77
19.9
4 0
19
3,50
2
0
4,37
7,74
8
2,55
2,18
8
3,72
7,26
3
3,70
1,17
6
0
0
0
0
FRE
NCH
(d)
4,12
4,57
8
5.65
0
12
8,41
0
0
1,14
5,73
9
806,
927
66
9,76
8
1,37
3,73
4
0
0
0
0
NET
HERL
ANDS
(e)
4,50
0
0.01
0
0
0
0
0
4,
500
0
0
0
0
0
H
AITI
51
,505
0.
07
0
0
0
0
0
0
51,5
05
0
0
0
0 OT
HER
W.I.
(f)
3,65
6,79
6
5.01
0
4,
790
0
48
4,44
8
1,30
0
136,
163
3,
030,
095
0
0
0
0
TOTA
L W
.I.
22,3
89,2
56
30.6
8 0
32
6,70
2
0
6,00
7,93
5
3,36
0,41
5
4,53
7,69
4
8,15
6,51
0
0
0
0
0
EURO
PE
IT
ALY
0
0.00
0
0
0
0
0
0
0
0
0
0
0
E
NGLA
ND
0
0.00
0
0
0
0
0
0
0
0
0
0
0
O
THER
EUR
OPE
(g)
0
0.00
0
0
0
0
0
0
0
0
0
0
0
TOTA
L EU
ROPE
0
0.
00
0
0
0
0
0
0
0
0
0
0
0
OTHE
RS
J
APAN
0
0.
00
0
0
0
0
0
0
0
0
0
0
0
OTH
ERS*
0
0.
00
0
0
0
0
0
0
0
0
0
0
0 TO
TAL
OTHE
RS
0
0.00
0
0
0
0
0
0
0
0
0
0
0
TO
TAL
CARG
OES
41,4
05,3
69
84.7
8 20
,467
,215
40
5,84
5
4,28
9
7,91
7,71
0
4,05
3,85
9
9,15
0,50
4 1
8,67
4,39
7
0
0
0 1
,198
,765
FO
REIG
N BU
NKER
S 11
,105
,693
15
.22
0
159,
323
0
2,
333,
873
2,
275,
965
3,
374,
201
2,
952,
982
0
0
0
9,
349
TOTA
L EX
PORT
52
,511
,062
10
0.00
20
,467
,215
56
5,16
8
4,28
9
10,2
51,5
83
6,32
9,82
4 1
2,52
4,70
5 2
1,62
7,37
9
0
0
0 1
,208
,114
Appendix XXII
Note
: The
se fi
gure
s ar
e on
ly fo
r Trin
toc.
(a
) Oth
er C
.A. :
Ec
uado
r, Ni
cara
gua,
El S
alva
dor,
Hond
uras
, Cos
ta R
ica,
Mex
ico
(b
) Oth
er S
.A. :
Ur
agua
y, Co
lom
bia,
Bra
zil
(c
) Brit
ish
: An
tigua
, Ang
illa,
Bar
bado
s, B
equi
a, C
arria
cou,
Dom
inic
a, G
rena
da, J
amai
ca, M
onse
rrat
, Nev
is, S
t. Ki
tts, S
t. Lu
cia,
St.
Vinc
ent,
Berm
uda.
(d) F
renc
h
:
Guad
elou
pe, M
artin
ique
, St.
Barth
elm
y, St
. Bar
tgs,
St.
Maa
rten,
Sab
a, S
t Mar
tin, M
arie
Gal
ante
.(e
) Net
herla
nds:
St
. Eus
tatiu
s, A
ruba
, Cur
acao
(f)
Oth
er W
.I. Is
land
s:
Baha
mas
, Cub
a, T
orto
la, V
irgin
Gor
da, M
ustiq
ue, P
uerto
Ric
o, D
omin
ican
Rep
ublic
, U.S
. Virg
in Is
land
s
(g
) Oth
er E
urop
e:
Germ
any,
Belg
ium
*Cou
ntrie
s no
t det
aile
d

Ministry of Energy & Energy Industries Annual Administrative Report 2003-2004
72
STATISTICAL APPENDICES
Appendix XXII (continued)De
stin
atio
n of
Exp
orts
of C
rude
and
Refi
ned
Prod
ucts
from
Trin
idad
and
Tob
ago
- Oc
tobe
r 200
3 -
Sept
embe
r 200
4 (b
arre
ls)
COUN
TRY
TOTA
L %
OF
CRUD
E .
KERO
SENE
&
GAS
&
RE
FINE
D TO
TAL
PETR
OLEU
M
AV
IATI
ON
MOT
OR
AVIA
TION
DI
ESEL
PETR
O-
LU
BES
&
PR
ODUC
TS
EXPO
RTS
EXPO
RTS
L.P.
G.
GASO
LENE
GA
SOLE
NE
TURB
INE
FUEL
OI
LS
FUEL
OIL
CH
EMIC
ALS
ASPH
ALT
GREA
SES
OTHE
RNO
RTH
AMER
ICA
C
ANAD
A 0
0
0
0
0
0
0
0
0
0
0
0
USA
13
,067
,892
46
.67
22,2
43,1
25
0
0
239,
686
0
63
9,96
1 1
0,59
0,88
3
0
0
0 1
,597
,362
TO
TAL
N.A.
13
,067
,892
46
.67
22,2
43,1
25
0
0
239,
686
0
63
9,96
1 1
0,59
0,88
3
0
0
0 1
,597
,362
CENT
RAL
AMER
ICA
R
EPUB
LIC
OF P
ANAM
A 9,
342
0.
01
0
9,34
2
0
0
0
0
0
0
0
0
0
GUA
TEM
ALA
200,
682
0.
27
0
0
0
14,0
00
54,1
72
132,
510
0
0
0
0
0
O
THER
C.A
. (a)
1,
400,
776
1.
85
0
20,0
93
0
251,
556
83
,674
80
8,84
5
0
0
0
0
236,
608
TOTA
L C.
A.
1,61
0,80
0
2.13
0
29
,435
0
26
5,55
6
137,
846
94
1,35
5
0
0
0
0
236,
608
SO
UTH
AMER
ICA
G
UYAN
A 2,
518,
398
3.
33
0
58,2
39
4,28
9
507,
581
11
7,47
5
1,13
3,90
1
696,
913
0
0
0
0
S
URIN
AME
2,22
3,56
2
2.94
0
0
0
55
9,33
7
257,
562
1,
011,
284
39
5,37
9
0
0
0
0
FRE
NCH
GUIA
NA
1,48
7,18
0
1.96
0
25
,729
0
23
5,04
7
251,
136
70
3,93
8
271,
330
0
0
0
0
O
THER
S.A
. (b)
0
0.
00
0
0
0
0
0
0
0
0
0
0
0 TO
TAL
S.A.
6,
229,
140
8.
23
0
83,9
68
4,28
9
1,30
1,96
5
626,
173
2,
849,
123
1,
363,
622
0
0
0
0
W
EST
INDI
ES
B
RITI
SH (c
) 13
,816
,013
18
.26
0
195,
079
0
4,
129,
690
2,
532,
894
3,
581,
838
3,
376,
512
0
0
0
0
F
RENC
H (d
) 4,
202,
409
5.
55
0
131,
785
0
1,
073,
807
84
4,20
7
681,
056
1,
471,
554
0
0
0
0
N
ETHE
RLAN
DS (e
) 6,
400
0.
01
0
0
0
0
0
6,40
0
0
0
0
0
0
HAI
TI
68,4
10
0.09
0
0
0
0
0
0
68
,410
0
0
0
0
OTHE
R W
.I. (f
) 3,
357,
971
4.
44
0
5,32
0
0
490,
348
1,
700
12
8,47
6
2,73
2,12
7
0
0
0
0 TO
TAL
W.I.
21
,451
,203
28
.35
0
332,
184
0
5,
693,
845
3,
378,
801
4,
397,
770
7,
648,
603
0
0
0
0
EU
ROPE
-
IT
ALY
0
0.00
0
0
0
0
0
0
0
0
0
0
0
E
NGLA
ND
0
0.00
0
0
0
0
0
0
0
0
0
0
0
O
THER
EUR
OPE
(g)
0
0.00
0
0
0
0
0
0
0
0
0
0
0
TOTA
L EU
ROPE
0
0.
00
0
0
0
0
0
0
0
0
0
0
0
OTHE
RS
J
APAN
0
0.
00
0
0
0
0
0
0
0
0
0
0
0
OTH
ERS*
31
7,26
0
0.42
0
0
0
0
0
0
31
7,26
0
0
0
0
0 TO
TAL
OTHE
RS
317,
260
0.
42
0
0
0
0
0
0
317,
260
0
0
0
0
TOTA
L CA
RGOE
S 42
,676
,295
85
.80
22,2
43,1
25
445,
587
4,
289
7,
501,
052
4,
142,
820
8,
828,
209
19,
920,
368
0
0
0
1,8
33,9
70
FORE
IGN
BUNK
ERS
10,7
47,2
33
14.2
0 0
20
0,43
2
0
2,28
8,67
3
2,29
0,71
4
3,19
2,46
8
2,76
5,59
7
0
0
0
9,34
9 TO
TAL
EXPO
RT
53,4
23,5
28
100.
00
22,2
43,1
25
646,
019
4,
289
9,
789,
725
6,
433,
534
12,
020,
677
22,
685,
965
0
0
0
1,8
43,3
19
Note
: The
se fi
gure
s ar
e on
ly fo
r Trin
toc.
(a
) Oth
er C
.A. :
Ec
uado
r, Ni
cara
gua,
El S
alva
dor,
Hond
uras
, Cos
ta R
ica,
Mex
ico
(b
) Oth
er S
.A. :
Ur
agua
y, Co
lom
bia,
Bra
zil
(c
) Brit
ish
: An
tigua
, Ang
illa,
Bar
bado
s, B
equi
a, C
arria
cou,
Dom
inic
a, G
rena
da, J
amai
ca, M
onse
rrat
, Nev
is, S
t. Ki
tts, S
t. Lu
cia,
St.
Vinc
ent,
Berm
uda.
(d) F
renc
h
:
Guad
elou
pe, M
artin
ique
, St.
Barth
elm
y, St
. Bar
tgs,
St.
Maa
rten,
Sab
a, S
t Mar
tin, M
arie
Gal
ante
.(e
) Net
herla
nds:
St
. Eus
tatiu
s, A
ruba
, Cur
acao
(f)
Oth
er W
.I. Is
land
s:
Baha
mas
, Cub
a, T
orto
la, V
irgin
Gor
da, M
ustiq
ue, P
uerto
Ric
o, D
omin
ican
Rep
ublic
, U.S
. Virg
in Is
land
s
(g
) Oth
er E
urop
e:
Germ
any,
Belg
ium
*Cou
ntrie
s no
t det
aile
d

STATISTICAL APPENDICES
73
I n c r e a s i n g L o c a l C o n t e n t
Mov
emen
ts o
f Refi
ned
Prod
ucts
- 2
004
(bar
rels
)
Pu
rcha
ses
Tota
l Ope
ning
LO
CAL
CONS
UMPT
ION
Sale
s EX
PORT
S
Op
enin
g
From
the
Ot
her
Inve
ntor
y
Loca
l
Sa
les
to
to O
ther
Fore
ign
Tr
ansf
ers
Tran
sfer
s En
ding
To
tal C
losi
ng
In
vent
ory
Prod
uctio
n Re
finer
y Im
ports
Re
ceip
ts
and
Rece
ipts
Ow
n Us
e Bu
nker
s L.
A.T.T
. To
tal
NPM
C Co
mpa
nies
Ca
rgoe
s Bu
nker
s Re
finer
y Ot
her
Inve
ntor
ies
Inve
ntor
y
LPG
103,
645
870,
590
6,52
2 0
0 98
0,75
7 25
3 0
0 25
3 50
8,25
4 0
207,
108
159,
323
0 0
105,
819
980,
757
Mog
as -
Prem
ium
3,
703,
955
9,53
5,69
2 1,
547,
491
1,54
7,49
1 0
16,3
34,6
29
2,84
4 0
0 2,
844
2,96
1,26
8 0
5,28
4,03
7 2,
303,
910
0 0
5,78
2,57
0 16
,334
,629
Mog
as -
Regu
lar
107,
938
151,
255
0 0
0 25
9,19
3 0
0 0
0 10
9,05
0 0
5,23
2 29
,963
0
0 11
4,94
8 25
9,19
3
Mog
as -
Unfin
ished
1,
823,
029
224,
760
0 0
0 2,
047,
789
0 0
0 0
0 0
166,
390
0 0
0 1,
881,
399
2,04
7,78
9
Napt
ha
508,
720
435,
057
80,1
25
0 0
1,02
3,90
2 0
0 0
0 0
0 47
8,69
5 0
0 0
545,
207
1,02
3,90
2
Avia
tion
Gaso
line
196,
912
5,65
2 0
0 0
202,
564
0 0
0 0
1,70
3 0
8,03
1 0
0 0
192,
830
202,
564
Av. T
urbi
ne F
uel/K
eros
ene
1,75
4,12
5 4,
959,
601
317,
186
304,
886
0 7,
335,
798
610
0 0
610
859,
695
0 2,
000,
158
2,27
5,96
5 0
0 2,
199,
370
7,33
5,79
8
Mar
ine
Dies
el 0
202,
510
0 0
0 20
2,51
0 0
0 0
0 84
,196
0
106,
323
11,9
91
0 0
0 20
2,51
0
Whi
te S
pirit
79
4 16
0
0 0
810
0 0
0 0
0 0
0 0
0 0
810
810
Gas O
il 3,
526,
950
10,3
96,2
78
1,43
1,10
2 1,
431,
102
0 16
,785
,432
13
2,45
0 60
,616
0
193,
066
1,83
3,49
9 79
,690
6,
301,
928
3,36
2,21
0 25
4 0
5,01
4,78
5 16
,785
,432
Petro
chem
icals
62,0
99
-1,0
05
0 0
0 61
,094
0
0 0
0 0
0 3,
934
0 0
0 57
,160
61
,094
Lube
s 35
9,89
2 -1
,571
0
0 0
358,
321
0 0
0 0
0 0
708
0 0
0 35
7,61
3 35
8,32
1
Fuel
Oil
10,4
58,8
53
19,7
89,4
96
6,40
7 0
0 30
,254
,756
0
0 0
0 77
4 44
,552
17
,181
,011
2,
952,
982
0 0
10,0
75,4
37
30,2
54,7
56
Asph
altic
Prod
ucts
27
7,61
2 13
9,21
9 0
0 0
416,
831
0 0
0 0
2,10
5 0
146,
669
0 0
0 26
8,05
7 41
6,83
1
Othe
r Fin
ished
Pro
duct
s 15
,839
,079
-1
54,0
11
491,
492
62,0
98
0 16
,238
,658
0
0 0
0 0
0 50
4,18
7 0
0 0
15,7
34,4
71
16,2
38,6
58
Unfin
ished
Pro
duct
s 3,
304,
900
-58,
703
228,
948
0 0
3,47
5,14
5 0
0 0
0 10
7,86
4 0
620,
143
9,34
9 0
0 2,
737,
789
3,47
5,14
5
TOTA
L 42
,028
,503
46
,494
,836
4,
109,
273
3,34
5,57
7 0
95,9
78,1
89
136,
157
60,6
16
0 19
6,77
3 6,
468,
408
124,
242
33,0
14,5
54
11,1
05,6
93
254
0 45
,068
,265
95
,978
,189
REFIN
ERY
CRUD
E OI
L IN
PUT
47
,837
,750
REFIN
ERY
GAS
& LO
SS/(G
AIN)
1,34
2,91
4
% G
AS/L
OSS
TO R
EFIN
ERY
INPU
T
2.97
REFIN
ERY
GAS
1,
346,
715.
00
Appendix XXIII

Ministry of Energy & Energy Industries Annual Administrative Report 2003-2004
74
STATISTICAL APPENDICES
List of Abbreviations
BBL Barrel/s BOPD Barrels of Oil Per Day BPTT bp Trinidad and TobagoCARICOM Caribbean CommunityCEIS Caribbean Energy Information SystemCNC Caribbean Nitrogen Company CREDP Caribbean Renewable Energy Development Programme EMA Environmental Management AuthorityEOR Enhanced Oil RecoveryERPD Energy Research and Planning DivisionGDP Gross Domestic ProductGNP Gross National ProductLAN Local Area Network LNG Liquefied Natural Gas LPG Liquefied Petroleum GasM3 Cubic MetresMB Thousand BarrelsMBPCD Thousand Barrels per Calendar DayMCF Thousand Cubic FeetMEEI Ministry of Energy and Energy IndustriesMMBO Million Barrels of Oil MMBTU Million British Thermal UnitsMMSCF/D Million Standard Cubic Feet Per DayMOU Memorandum of UnderstandingMTD Metric Tons per DayMTPA Metric Tons per AnnumNALIS National Library and Information SystemNCMA North Coast Marine Area NEC National Energy CorporationNGC The National Gas Company of Trinidad and Tobago LtdNGL Natural Gas LiquidNPMC Trinidad and Tobago National Petroleum Marketing CompanyOLADE Latin American Energy Organisation PLCC Permanent Local Content CommitteePPGPL Phoenix Park Gas Processors LimitedPSC Production Sharing Contract SECC South East Coast Consortium TCF Trillion Cubic FeetTTMC Trinidad and Tobago Methanol Company UAN Urea Ammonia NitrateUMLE Upper Morne L’EnferUNDP United Nations Development Programme WAN Wide Area NetworkWASP Water Alternating Steam Projects

NOTES

NOTES