Embed Size (px)
Citation preview
RWANDA
Comprehensive Food Security and
Vulnerability Analysis and
Nutrition Survey
July 2009 (Data collected in February-March 2009)
Rwanda: Comprehensive Food Security and Vulnerability Analysis and Nutrition Survey July 2009 (Data collected in February-March 2009)
Prepared by Patrick Vinck , Chiara Brunelli, Kayo Takenoshita, Dan Chizelema
Reviewed by Alphonse Rukundo & Alphonse Murenzi of NISR; Jean Baptiste Uwizeyimana of MINAGRI; Dan Chizelema, Emmanuel Safari, Jean Baptiste Ntakirutimana & Benedict Mbeng of WFP; Christine Kaligirwa & Abiud Omwega of UNICEF; Agnes Mukamana & Precious Mlingo of World Vision.
Survey design and data processing done by the National Institute of Statistics of Rwanda. July 2009 © World Food Programme, VAM Food Security Analysis
Cover Photo: © World Food Programme
Financial support for this study was provided by the Bill and Melinda Gates Foundation (Gates) through WFP, UNICEF, World Vision and ONE UN Fund. The views expressed herein can in no way be taken to reflect the official opinion of the donors.
The 2009 Rwanda CFSVA & Nutrition Survey Report is available at http://www.wfp.org/food-security www.statistics.gov.rw
United Nations World Food Programme Headquarters: Via C.G. Viola 68, Parco de’ Medici, 00148, Rome, Italy. For information about the Food Security Analysis/VAM, contact [email protected]
For questions or comments concerning any aspect of the survey and this report please contact: National Institute of Statistics of Rwanda Yusuf Murangwa [email protected] Baudouin Ruterana [email protected] Alphonse Rukundo [email protected] Alphonse Murenzi [email protected] Ministry of Agriculture and Animal resources Jean-Baptiste Uwizeyimana [email protected] WFP Rwanda
Ahmed Zakaria [email protected] Dan Chizelema [email protected]
UNICEF Rwanda Abiud Omwega [email protected]
Christine Kaligirwa [email protected] World Vision Rwanda
Olufemi Owoeye [email protected] Agnes Mukamana [email protected]
WFP Regional Bureau Uganda Mark Gordon [email protected]
Andrea Berardo [email protected]
WFP HQ OMXF Service Arif Husain [email protected] Chiara Brunelli [email protected] Cinzia Papavero [email protected] Claudia AhPoe [email protected]
4
FOREWORD AND ACKNOWLEDGEMENT
The National Institute of Statistics of Rwanda has just completed the 2009 Comprehensive Food Security and Vulnerability Analysis & Nutrition Survey (CFSVA & NS) together with its partners. This baseline survey is a joint initiative and has been undertaken with the objective of analyzing trends over time in comparison with other more recent secondary data, measuring the extent and depth of food and nutrition insecurity and vulnerability, and identifying the underlying causes.
It is the second time that this type of survey has been conducted in Rwanda, the previous one taking place in 2006 also under the overall lead of National Institute of Statistics of Rwanda. The 2009 CFSVA & NS has collected indicators on human and social capital, natural capital, physical capital, economic capital and livelihood strategies, food consumption , and health and nutrition, not included in the 2006 study. In addition, the CFSVA & NS has integrated a risk and vulnerability context module thus determining the most commonly experienced shocks by the sampled households at the district level.
Understanding food and nutrition security and vulnerability has always been challenging. Yet the emergence of relatively new phenomena such as recent high food and fuel prices, the global financial crisis, and climate change, all highlight the need to better understand the lives and livelihoods of vulnerable population so that effective policies and actions can be implemented to save lives and address the root causes of food and nutrition insecurity.
This report, built on this experience, will guide readers, planners and decision makers to get snap-shot answers to the five key questions of who are the people currently facing food insecurity and malnutrition; how many are they; where do they live; why are they food insecure and/or malnourished and; how can food assistance and other interventions make a difference in reducing poverty, hunger and supporting livelihoods.
The CFSVA & NS was possible due to the generous support of the Ministry of Agriculture and Animal Resources, the Ministry of Health, the Ministry of Finance and Economic Planning and the Ministry of Local Government and Administration for their inputs during the preparation of the data collection tools and the participation in the field work.
We are highly indebted to the heads of households wherever the data collection was done. This work wouldn’t have been a reality without the generosity of the women and men who devoted their time and sat down with enumerators to answer all the questions. Again our profound gratitude to the NISR team who have conducted the survey design, translation of the questionnaires, field work implementation and data processing.
We would like to express our sincere thanks to the ONE UN in Rwanda, which provided about half of the total funding for the study. World Food Programme, UNICEF and World Vision also contributed in terms of funding and staff. The WFP team in HQ and the Regional Bureau who worked with the consultant to analyze these results also deserve special recognition.
Lastly, we appreciate the work done by the Technical Review Committee to proof-read and validate the report at the final stage of its production.
Yusuf MURANGWA Ag. Director General National Institute of Statistics of Rwanda
3

4
6
TABLE OF CONTENTS
Foreword ......................................................................................................................... 4Table of Contents .............................................................................................................6Acronyms .......................................................................................................................10Executive Summary ....................................................................................................... 111. Introduction .......................................................................................................... 172. CFSVA Objectives and Methodology ....................................................................... 18
Objectives ............................................................................................................... 18Conceptual Framework and Definitions ........................................................................ 18Methodology ............................................................................................................ 21Sampling Strategy ..................................................................................................... 21Instruments .............................................................................................................. 22Data Entry and Analysis ............................................................................................. 23Methodology: Food Consumption Score ........................................................................ 24Limitations ................................................................................................................ 24
2009 RWANDA CFSVA and Nutrition Survey Results ...................................................... 263. Human and Social Capital ...................................................................................... 26
Demographics .......................................................................................................... 26Education ................................................................................................................ 27Health ..................................................................................................................... 29Migration and Displacement ....................................................................................... 29
4. Natural Capital ....................................................................................................... 31Agricultural Production .............................................................................................. 31Climate .................................................................................................................... 31Productive Land ......................................................................................................... 31Crops ....................................................................................................................... 32Duration of Harvest ................................................................................................... 33Seeds and Agricultural Inputs ..................................................................................... 34Livestock Ownership ................................................................................................. 35
5. Physical Capital ..................................................................................................... 37Housing and Amenities .............................................................................................. 37Housing Structure, and Lighting and Cooking Energy Sources ......................................... 37Water and Sanitation ................................................................................................. 37Communication Infrastructures ................................................................................... 38Asset Ownership and Wealth Index ............................................................................. 38
6. ECONOMIC Capital and Livelihood Strategies ........................................................ 41Income and Activities ................................................................................................ 41Income and Activities ................................................................................................. 41Seasonality and Distribution of the Activities ................................................................. 42Temporary Migration, Transfer and Remittances ............................................................ 42Livelihood Strategies Profiles ...................................................................................... 44Expenditures ............................................................................................................ 50Food and Non-Food Expenditures ................................................................................ 50Expenditure Quintiles ................................................................................................. 52Credit, Cash and Exchange ......................................................................................... 53
7. Food Consumption ................................................................................................. 55Diet Diversity and Food Sources ................................................................................. 55
...9.5.3
5
67
Diet diversity ............................................................................................................ 55Food sources ............................................................................................................. 57Household Food Consumption Score ............................................................................ 58Food Consumption Score and Groups ........................................................................... 58Food Consumption Patterns ........................................................................................ 59Food Consumption Groups ......................................................................................... 60Geographic distribution of food consumption groups ...................................................... 60Changes in food consumption 2006-2009 ..................................................................... 61Food consumption groups and livelihood strategies ........................................................ 62Other characteristics associated with food consumption groups ....................................... 63
8. Health and Nutrition .............................................................................................. 65Hygiene and Child Care Practices ................................................................................ 65Water and Sanitation ................................................................................................. 65Child Breastfeeding and Care Practices ......................................................................... 67Women’s Nutritional Status ........................................................................................ 68Women’s Body Mass Index ......................................................................................... 68Children’s Health Status ............................................................................................ 70Children’s Nutritional Status ....................................................................................... 71
9. Risk and Vulnerability Context ............................................................................... 74Risk and Vulnerability Approach .................................................................................. 74Shocks .................................................................................................................... 74Reported Shocks ....................................................................................................... 74Droughts .................................................................................................................. 75Illnesses ................................................................................................................... 78Food Prices ............................................................................................................... 78Community level reported problems ............................................................................. 79Coping strategies ...................................................................................................... 80Assistance ............................................................................................................... 82Food Assistance ......................................................................................................... 82Non-Food Assistance .................................................................................................. 83
10. Underlying Causes of Food Insecurity and Malnutrition ......................................... 84Underlying causes of food insecurity ........................................................................... 84Underlying causes of malnutrition ............................................................................... 86
11. Conclusions and Recommendations ....................................................................... 89Food Security and Malnutrition Summary profiles ......................................................... 89Livelihood Strategy Priorities ....................................................................................... 89Geographic Priorities .................................................................................................. 91Other Priority Factors ................................................................................................. 94Population Estimates for the Highly Food Insecure and Vulnerable Groups ........................ 94Recommendations and Interventions........................................................................... 96
12. Annexes ................................................................................................................. 97
8
List of Tables
Table 1: Food Items, Groups and Weights for Calculation of the FCS ....................................... 24Table 2: Household Composition and Dependency Rate ......................................................... 27Table 3: Literacy and Education Levels ................................................................................ 28Table 4: Community level experience of migration/movement. ............................................... 30Table 5: Crop cultivated 2006-2009 .................................................................................... 33Table 6: Duration of harvest (months) by strata ................................................................... 34Table 7: Animal ownership (% of HH) .................................................................................. 36Table 8: Community level characteristics of temporary/seasonal migrations ............................. 43Table 9: Livelihood Groups ................................................................................................. 45Table 10: Characteristics of Livelihood Groups ...................................................................... 47Table 11: Characteristics of expenditure quintiles .................................................................. 53Table 12: Credit characteristics by livelihood groups .............................................................. 54Table 13: Food items consumption by food consumption groups ............................................. 58Table 14: Food consumption by food consumption patterns .................................................... 60Table 15: Household characteristics associated with food consumption .................................... 64Table 16: Water and Sanitation – Children Data .................................................................... 66Table 17: Child breastfeeding and care practices (% of children) ............................................ 67Table 18: Measles Vaccination and Vitamin A supplement, 2005-2009 ..................................... 68Table 19: Women’s malnutrition indicators by province .......................................................... 69Table 20: Child health ....................................................................................................... 70Table 21: Symptoms of Diarrhea 2005-2009 ........................................................................ 71Table 22: Children’s nutrition indicators, 2005-2009 .............................................................. 72Table 23: Child nutrition by livelihood, wealth index and FCS ................................................. 73Table 24: Exposure to shocks ............................................................................................. 75Table 25: Level of exposure to drought ................................................................................ 77Table 26: Vulnerability to food insecurity as a result of drought (% of HH) ............................... 77Table 27: Community level problems ................................................................................... 79Table 28: Coping Strategies and Reduced Coping Strategies Index.......................................... 80Table 29: Coping mechaNISRms in response to droughts ....................................................... 82Table 30: Coping mechaNISRms in response to illness ........................................................... 82Table 31: Adjusted food security regression coefficients for the strata ..................................... 84Table 32: Adjusted food security regression coefficients for livelihood profiles .......................... 85Table 33: Adjusted food security regression coefficients for other variables .............................. 85Table 34: Adjusted coefficient for wasting - Strata ................................................................ 86Table 35: Adjusted coefficient for wasting – Other variables ................................................... 87Table 36: Adjusted coefficient for stunting ........................................................................... 88Table 38: Relation of adjusted variables and food security and malnutrition ............................. 94
7
8
8
List of Tables
Table 1: Food Items, Groups and Weights for Calculation of the FCS ....................................... 24Table 2: Household Composition and Dependency Rate ......................................................... 27Table 3: Literacy and Education Levels ................................................................................ 28Table 4: Community level experience of migration/movement. ............................................... 30Table 5: Crop cultivated 2006-2009 .................................................................................... 33Table 6: Duration of harvest (months) by strata ................................................................... 34Table 7: Animal ownership (% of HH) .................................................................................. 36Table 8: Community level characteristics of temporary/seasonal migrations ............................. 43Table 9: Livelihood Groups ................................................................................................. 45Table 10: Characteristics of Livelihood Groups ...................................................................... 47Table 11: Characteristics of expenditure quintiles .................................................................. 53Table 12: Credit characteristics by livelihood groups .............................................................. 54Table 13: Food items consumption by food consumption groups ............................................. 58Table 14: Food consumption by food consumption patterns .................................................... 60Table 15: Household characteristics associated with food consumption .................................... 64Table 16: Water and Sanitation – Children Data .................................................................... 66Table 17: Child breastfeeding and care practices (% of children) ............................................ 67Table 18: Measles Vaccination and Vitamin A supplement, 2005-2009 ..................................... 68Table 19: Women’s malnutrition indicators by province .......................................................... 69Table 20: Child health ....................................................................................................... 70Table 21: Symptoms of Diarrhea 2005-2009 ........................................................................ 71Table 22: Children’s nutrition indicators, 2005-2009 .............................................................. 72Table 23: Child nutrition by livelihood, wealth index and FCS ................................................. 73Table 24: Exposure to shocks ............................................................................................. 75Table 25: Level of exposure to drought ................................................................................ 77Table 26: Vulnerability to food insecurity as a result of drought (% of HH) ............................... 77Table 27: Community level problems ................................................................................... 79Table 28: Coping Strategies and Reduced Coping Strategies Index.......................................... 80Table 29: Coping mechaNISRms in response to droughts ....................................................... 82Table 30: Coping mechaNISRms in response to illness ........................................................... 82Table 31: Adjusted food security regression coefficients for the strata ..................................... 84Table 32: Adjusted food security regression coefficients for livelihood profiles .......................... 85Table 33: Adjusted food security regression coefficients for other variables .............................. 85Table 34: Adjusted coefficient for wasting - Strata ................................................................ 86Table 35: Adjusted coefficient for wasting – Other variables ................................................... 87Table 36: Adjusted coefficient for stunting ........................................................................... 88Table 38: Relation of adjusted variables and food security and malnutrition ............................. 94
9
List of Figures
Figure 1: Food and Nutrition Security Conceptual Framework ................................................. 19Figure 2: Geographic distribution of the strata ...................................................................... 22Figure 3: Sample and Demographic Characteristics by Strata (CFSVA 2009) ............................ 26Figure 4: Frequency distribution of school attendance ............................................................ 28Figure 5: Climate and Cropping Seasons Calendar ................................................................. 31Figure 6: Proportion of households with access to <0.1 ha of land .......................................... 32Figure 7: Geographic Distribution of Major Crops (% of cultivating households) ........................ 33Figure 8: Proportion of households with stocks from their harvest, by months .......................... 34Figure 9: Average Household TLU per strata ......................................................................... 35Figure 10: Geographic Distribution of Wealth Quintiles (% of HH) ........................................... 38Figure 11: Physical Capital Indicators and Wealth Index Quintiles ........................................... 39Figure 12: Seasonality of Livelihood Activities ....................................................................... 42Figure 13: Activities Contribution to Livelihood (%) by Livelihood Groups ................................. 46Figure 14: Average Income (RWF) by Activity and Livelihood Groups ....................................... 46Figure 15: Geographic Distribution of the Main Livelihood Groups ........................................... 49Figure 16: Food and non-food expenditures by livelihood and wealth groups ............................ 51Figure 17: Composition of total and food expenditures .......................................................... 52Figure 18: Food items consumption ..................................................................................... 55Figure 19: Food items consumption by livelihood profiles ....................................................... 56Figure 20: Food items consumption by wealth quintiles ......................................................... 56Figure 21: Food items consumption by strata ....................................................................... 57Figure 22: Food sources ..................................................................................................... 58Figure 23: Food items consumption by food consumption score .............................................. 59Figure 24: Geographic distribution of food consumption groups (CFSVA 2006-2009) ................. 61Figure 25: Food consumption 2006-2009 ............................................................................. 61Figure 26: Food consumption groups and livelihood strategies ................................................ 62Figure 27: Food Consumption Groups by Wealth Quintiles ...................................................... 64Figure 28: Age-gender distribution of children ...................................................................... 65Figure 29: Women’s BMI by province ................................................................................... 69Figure 30: Children’s nutrition indicators by province ............................................................. 72Figure 31: Nutrition status by age groups ............................................................................ 73Figure 32: Seasonal distribution of drought .......................................................................... 76Figure 32: Drought Risk Analysis (WRSI for maize, 1996-2008) .............................................. 76Figure 33: Seasonal distribution of illnesses ......................................................................... 78Figure 34: Food prices over time ......................................................................................... 78
10
ACRONYMS
ADDAWIN Analisi dei Dati – Windows version (Data analysis software) BMI Body Mass Index CFSVA Comprehensive Food Security and Vulnerability Analysis CI Confidence Interval CSI Coping Strategy Index CsPRO Censuses and Surveys processing Package DHS Demographic and Health Survey DfID Department for International Development EDPRS Economic Development and Poverty Reduction Strategy 2008-2012 EICV Enquête Intégrale sur les Conditions de Vie des ménages FCS Food Consumption Score GDP Gross Domestic Product GoR Government of Rwanda HA Hectare HAZ Height for Age Z- Score HDI Human Development Index HH Household IMR Infant Mortality Rate MINAGRIMINALOC
Ministry of Agriculture and Animal Resources. Ministry of Local Governments and Administration
MINECOFIN MoH
Ministry of Finance and Economic Planning Ministry of Health
MUAC Mid Upper Arm Circumference NCHS National Center for Health Statistics (USA) NISR National Institute of Statistics of Rwanda ODAN Emergency Assessment Branch - WFP OMXF Food Security Analysis Service - WFP OR Odds Ratio PCARWF
Principal Component Analysis Rwandese Francs
SDA Secondary Data Analysis SPSS Statistical Package for Social Sciences TLU Tropical Livestock Unit UNICEF United Nations’ Children Fund VAM Vulnerability Analysis and Mapping WAZ Weight for Age Z- Score WFP World Food Programme WHO World Health Organization WHZ WRSI
Weight for Height Z- Score Water Resource Satisfaction Index
ZD Zones de Dénombrement (Enumeration Area)
9

10
10
ACRONYMS
ADDAWIN Analisi dei Dati – Windows version (Data analysis software) BMI Body Mass Index CFSVA Comprehensive Food Security and Vulnerability Analysis CI Confidence Interval CSI Coping Strategy Index CsPRO Censuses and Surveys processing Package DHS Demographic and Health Survey DfID Department for International Development EDPRS Economic Development and Poverty Reduction Strategy 2008-2012 EICV Enquête Intégrale sur les Conditions de Vie des ménages FCS Food Consumption Score GDP Gross Domestic Product GoR Government of Rwanda HA Hectare HAZ Height for Age Z- Score HDI Human Development Index HH Household IMR Infant Mortality Rate MINAGRIMINALOC
Ministry of Agriculture and Animal Resources. Ministry of Local Governments and Administration
MINECOFIN MoH
Ministry of Finance and Economic Planning Ministry of Health
MUAC Mid Upper Arm Circumference NCHS National Center for Health Statistics (USA) NISR National Institute of Statistics of Rwanda ODAN Emergency Assessment Branch - WFP OMXF Food Security Analysis Service - WFP OR Odds Ratio PCARWF
Principal Component Analysis Rwandese Francs
SDA Secondary Data Analysis SPSS Statistical Package for Social Sciences TLU Tropical Livestock Unit UNICEF United Nations’ Children Fund VAM Vulnerability Analysis and Mapping WAZ Weight for Age Z- Score WFP World Food Programme WHO World Health Organization WHZ WRSI
Weight for Height Z- Score Water Resource Satisfaction Index
ZD Zones de Dénombrement (Enumeration Area)
11
EXECUTIVE SUMMARY
Background
As significant progress continues to be made by the Rwandan economy following various recovery and growth strategies, certain elements remain crucial. The food and nutrition security of the population remains a key building block in not only consolidating the gains already made thus far but also further accelerating the rate of growth towards the realization of the Millennium Development Goals (MDGs).
The 2009 national Comprehensive Food Security and Vulnerability Analysis (CFSVA) and Nutrition survey was undertaken with the objective of analyzing trends over time in comparison with the 2006 CFSVA and the 2005 RDHS as well as with other more recent secondary data, measuring the extent and depth of food and nutrition insecurity and vulnerability, and identifying the underlying causes. The five key questions to a CFSVA and/or Nutrition Survey are: who are the people currently facing food insecurity and malnutrition; how many are they; where do they live; why are they food insecure and/or malnourished and; how can food assistance and other interventions make a difference in reducing poverty, hunger and supporting livelihoods? In order to provide answers to these questions, specifically, the assessment sought to:
Identify geographic and socio-economic groups that are food insecure or vulnerable to food insecurity; highlight the nature and causes of food insecurity among each group; Identify the major risks and constraints to improving food security; Evaluate assistance needs at the short, medium and long range; Support the development of an appropriate targeting system; Better define the role of GoR’s development partners including WFP in promoting food security strengthening programs; Determine the prevalence of nutritional status of vulnerable groups (children aged 6 - 59 months and non-pregnant women of reproductive age (15-49 years old); Determine the prevalence of exclusive breastfeeding as a key Infant and Young Child Feeding strategy; Establish the linkage between household food security and nutritional status of children in Rwanda.
Methodology
The 2009 Rwanda CFSVA and Nutrition Survey was designed to provide statistically representative information on households at the sub-provincial level. To facilitate comparison with existing studies, it was decided to define strata using administrative limits rather than food economy zones (as in 2006 CFSVA). The strata were either single districts or groups of districts. Thus a total of 16 strata were defined including 8 districts and 8 groups of districts excluding Kigali-Ville.
Household and community level data were collected. Within each stratum, the National Institute of Statistics of Rwanda (NISR) implemented a two-stage sampling procedure to select households using an approach that is standardized for statistical studies in Rwanda. Zones de dénombrement (ZD, enumeration zones) were selected first, followed by households using 2007 population estimates based on the 2002 census. A total of 450 ZD were selected for both household and
12
community level data collection. Altogether, 5400 households were visited and a total of 438 community key informants interviewed.
While the study was conducted in the most rigorous manner possible, some limitations must be acknowledged. The Sampling Frame only included rural ZDs and excluded Kigali (districts of Nyarugenge, Gasabo and Kicukiro) which accounts for 9.4% of the total population of Rwanda. Thus the results only represent rural population of Rwanda. In addition, because the 2009 CFSVA and Nutrition Survey focused on the link between food security and nutrition, only households with children aged 6 to 59 months old were included in the sample. While it is unknown how different households without children aged below 5 are compared to those with children in that age group, it would be expected that the patterns and characteristics associated with food insecurity and malnutrition among this group can be extrapolated to the entire rural population.
Results
Who are the people facing food insecurity and vulnerability?
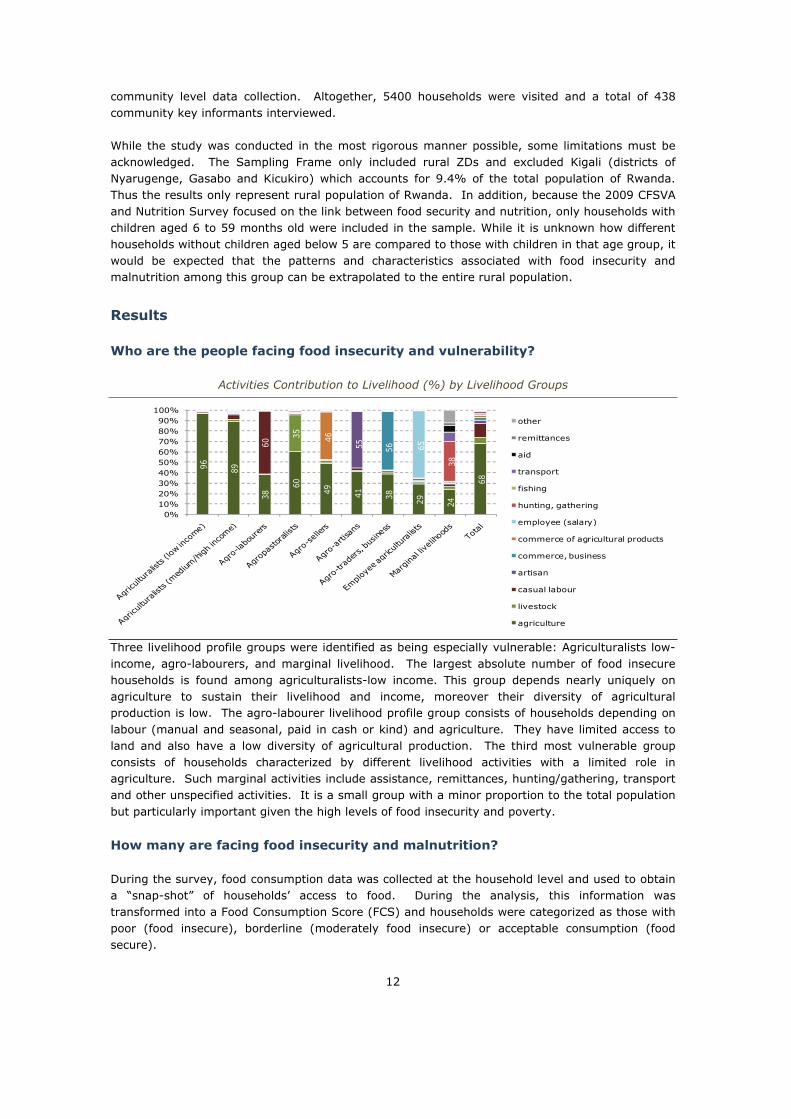
Activities Contribution to Livelihood (%) by Livelihood Groups
96 89
38
60
49 41 38 29 24
68
35 46
55 56 65
38
60
0%10%20%30%40%50%60%70%80%90%
100%other
remittances
aid
transport
fishing
hunting, gathering
employee (salary)
commerce of agricultural products
commerce, business
artisan
casual labour
livestock
agriculture
Three livelihood profile groups were identified as being especially vulnerable: Agriculturalists low-income, agro-labourers, and marginal livelihood. The largest absolute number of food insecure households is found among agriculturalists-low income. This group depends nearly uniquely on agriculture to sustain their livelihood and income, moreover their diversity of agricultural production is low. The agro-labourer livelihood profile group consists of households depending on labour (manual and seasonal, paid in cash or kind) and agriculture. They have limited access to land and also have a low diversity of agricultural production. The third most vulnerable group consists of households characterized by different livelihood activities with a limited role in agriculture. Such marginal activities include assistance, remittances, hunting/gathering, transport and other unspecified activities. It is a small group with a minor proportion to the total population but particularly important given the high levels of food insecurity and poverty.
How many are facing food insecurity and malnutrition?
During the survey, food consumption data was collected at the household level and used to obtain a “snap-shot” of households’ access to food. During the analysis, this information was transformed into a Food Consumption Score (FCS) and households were categorized as those with poor (food insecure), borderline (moderately food insecure) or acceptable consumption (food secure).
12
community level data collection. Altogether, 5400 households were visited and a total of 438 community key informants interviewed.
While the study was conducted in the most rigorous manner possible, some limitations must be acknowledged. The Sampling Frame only included rural ZDs and excluded Kigali (districts of Nyarugenge, Gasabo and Kicukiro) which accounts for 9.4% of the total population of Rwanda. Thus the results only represent rural population of Rwanda. In addition, because the 2009 CFSVA and Nutrition Survey focused on the link between food security and nutrition, only households with children aged 6 to 59 months old were included in the sample. While it is unknown how different households without children aged below 5 are compared to those with children in that age group, it would be expected that the patterns and characteristics associated with food insecurity and malnutrition among this group can be extrapolated to the entire rural population.
Results
Who are the people facing food insecurity and vulnerability?
Activities Contribution to Livelihood (%) by Livelihood Groups
96 89
38
60
49 41 38 29 24
68
35 46
55 56 65
38
60
0%10%20%30%40%50%60%70%80%90%
100%other
remittances
aid
transport
fishing
hunting, gathering
employee (salary)
commerce of agricultural products
commerce, business
artisan
casual labour
livestock
agriculture
Three livelihood profile groups were identified as being especially vulnerable: Agriculturalists low-income, agro-labourers, and marginal livelihood. The largest absolute number of food insecure households is found among agriculturalists-low income. This group depends nearly uniquely on agriculture to sustain their livelihood and income, moreover their diversity of agricultural production is low. The agro-labourer livelihood profile group consists of households depending on labour (manual and seasonal, paid in cash or kind) and agriculture. They have limited access to land and also have a low diversity of agricultural production. The third most vulnerable group consists of households characterized by different livelihood activities with a limited role in agriculture. Such marginal activities include assistance, remittances, hunting/gathering, transport and other unspecified activities. It is a small group with a minor proportion to the total population but particularly important given the high levels of food insecurity and poverty.
How many are facing food insecurity and malnutrition?
During the survey, food consumption data was collected at the household level and used to obtain a “snap-shot” of households’ access to food. During the analysis, this information was transformed into a Food Consumption Score (FCS) and households were categorized as those with poor (food insecure), borderline (moderately food insecure) or acceptable consumption (food secure).
13
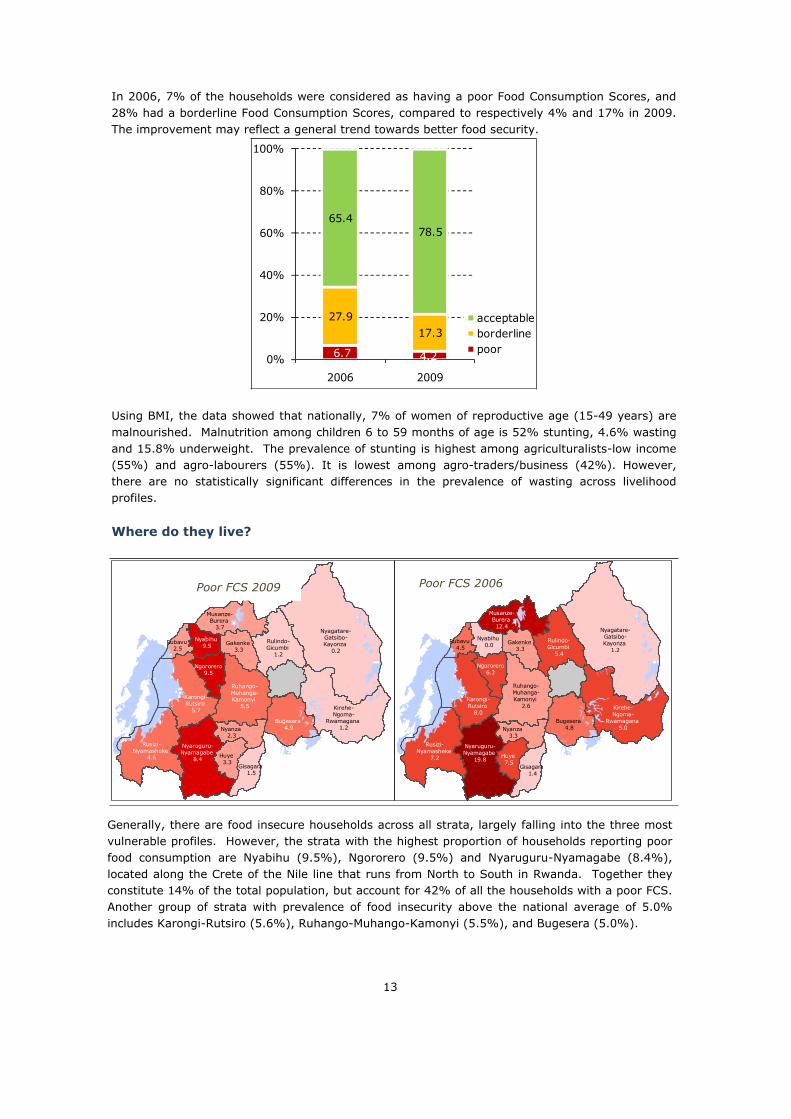
In 2006, 7% of the households were considered as having a poor Food Consumption Scores, and 28% had a borderline Food Consumption Scores, compared to respectively 4% and 17% in 2009. The improvement may reflect a general trend towards better food security.
6.7 4.2
27.917.3
65.478.5
0%
20%
40%
60%
80%
100%
2006 2009
acceptableborderlinepoor
Using BMI, the data showed that nationally, 7% of women of reproductive age (15-49 years) are malnourished. Malnutrition among children 6 to 59 months of age is 52% stunting, 4.6% wasting and 15.8% underweight. The prevalence of stunting is highest among agriculturalists-low income (55%) and agro-labourers (55%). It is lowest among agro-traders/business (42%). However, there are no statistically significant differences in the prevalence of wasting across livelihood profiles.
Where do they live?
Nyagatare-Gatsibo-Kayonza
0.2
Karongi-Rutsiro
5.7
Bugesera 4.9
Rusizi-Nyamasheke
4.6
Kirehe-Ngoma-
Rwamagana 1.2
Nyaruguru-Nyamagabe
8.4
Rulindo-Gicumbi
1.2
Huye 3.3
Nyanza 2.3
Musanze-Burera
3.7
Gakenke 3.3
Ngororero9.5
Nyabihu 9.5
Ruhango-Muhanga-Kamonyi
5.5
Gisagara 1.5
Rubavu 2.5
Nyagatare-Gatsibo-Kayonza
1.2
Karongi-Rutsiro
8.0Bugesera
4.8
Rusizi-Nyamasheke
7.2
Kirehe-Ngoma-
Rwamagana 5.0
Nyaruguru-Nyamagabe
19.8
Rulindo-Gicumbi
5.4
Huye 7.5
Nyanza 3.3
Musanze-Burera 12.4
Gakenke 3.3
Ngororero6.3
Nyabihu 0.0
Ruhango-Muhanga-Kamonyi
2.6
Gisagara 1.4
Rubavu 4.5
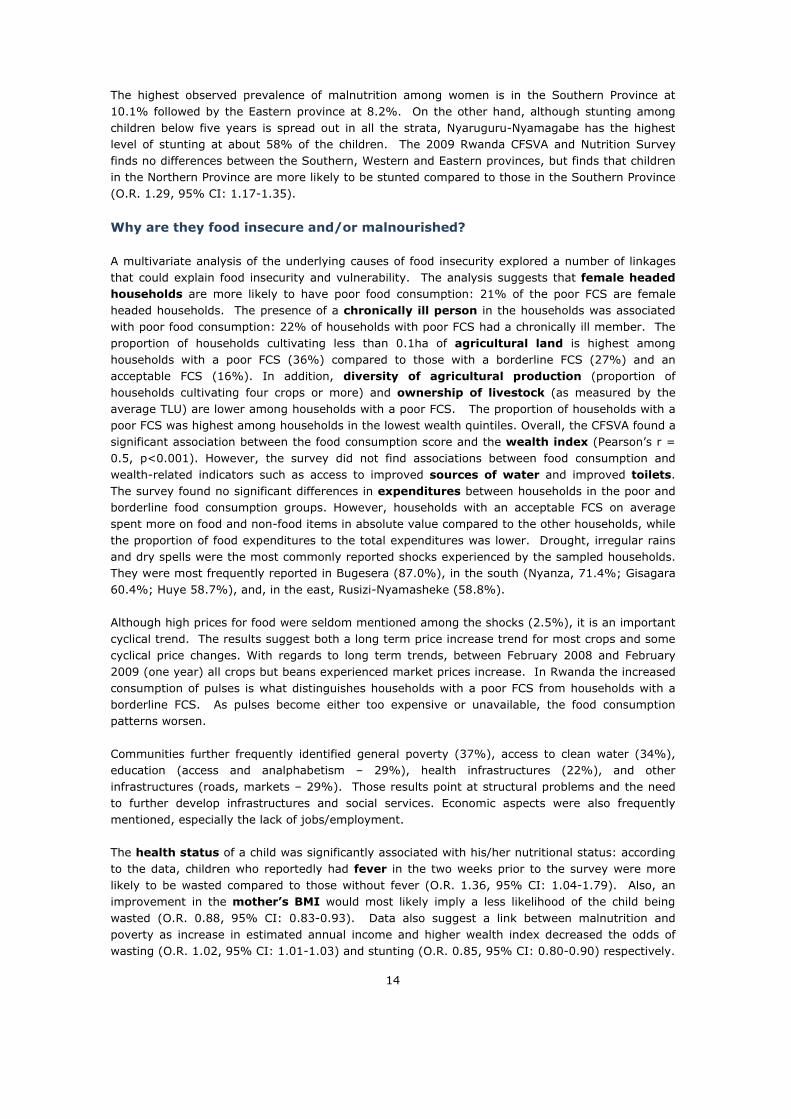
Generally, there are food insecure households across all strata, largely falling into the three most vulnerable profiles. However, the strata with the highest proportion of households reporting poor food consumption are Nyabihu (9.5%), Ngororero (9.5%) and Nyaruguru-Nyamagabe (8.4%), located along the Crete of the Nile line that runs from North to South in Rwanda. Together they constitute 14% of the total population, but account for 42% of all the households with a poor FCS. Another group of strata with prevalence of food insecurity above the national average of 5.0% includes Karongi-Rutsiro (5.6%), Ruhango-Muhango-Kamonyi (5.5%), and Bugesera (5.0%).
Poor FCS 2009 Poor FCS 2006
13
In 2006, 7% of the households were considered as having a poor Food Consumption Scores, and 28% had a borderline Food Consumption Scores, compared to respectively 4% and 17% in 2009. The improvement may reflect a general trend towards better food security.
6.7 4.2
27.917.3
65.478.5
0%
20%
40%
60%
80%
100%
2006 2009
acceptableborderlinepoor
Using BMI, the data showed that nationally, 7% of women of reproductive age (15-49 years) are malnourished. Malnutrition among children 6 to 59 months of age is 52% stunting, 4.6% wasting and 15.8% underweight. The prevalence of stunting is highest among agriculturalists-low income (55%) and agro-labourers (55%). It is lowest among agro-traders/business (42%). However, there are no statistically significant differences in the prevalence of wasting across livelihood profiles.
Where do they live?
Nyagatare-Gatsibo-Kayonza
0.2
Karongi-Rutsiro
5.7
Bugesera 4.9
Rusizi-Nyamasheke
4.6
Kirehe-Ngoma-
Rwamagana 1.2
Nyaruguru-Nyamagabe
8.4
Rulindo-Gicumbi
1.2
Huye 3.3
Nyanza 2.3
Musanze-Burera
3.7
Gakenke 3.3
Ngororero9.5
Nyabihu 9.5
Ruhango-Muhanga-Kamonyi
5.5
Gisagara 1.5
Rubavu 2.5
Nyagatare-Gatsibo-Kayonza
1.2
Karongi-Rutsiro
8.0Bugesera
4.8
Rusizi-Nyamasheke
7.2
Kirehe-Ngoma-
Rwamagana 5.0
Nyaruguru-Nyamagabe
19.8
Rulindo-Gicumbi
5.4
Huye 7.5
Nyanza 3.3
Musanze-Burera 12.4
Gakenke 3.3
Ngororero6.3
Nyabihu 0.0
Ruhango-Muhanga-Kamonyi
2.6
Gisagara 1.4
Rubavu 4.5
Generally, there are food insecure households across all strata, largely falling into the three most vulnerable profiles. However, the strata with the highest proportion of households reporting poor food consumption are Nyabihu (9.5%), Ngororero (9.5%) and Nyaruguru-Nyamagabe (8.4%), located along the Crete of the Nile line that runs from North to South in Rwanda. Together they constitute 14% of the total population, but account for 42% of all the households with a poor FCS. Another group of strata with prevalence of food insecurity above the national average of 5.0% includes Karongi-Rutsiro (5.6%), Ruhango-Muhango-Kamonyi (5.5%), and Bugesera (5.0%).
Poor FCS 2009 Poor FCS 2006
14
The highest observed prevalence of malnutrition among women is in the Southern Province at 10.1% followed by the Eastern province at 8.2%. On the other hand, although stunting among children below five years is spread out in all the strata, Nyaruguru-Nyamagabe has the highest level of stunting at about 58% of the children. The 2009 Rwanda CFSVA and Nutrition Survey finds no differences between the Southern, Western and Eastern provinces, but finds that children in the Northern Province are more likely to be stunted compared to those in the Southern Province (O.R. 1.29, 95% CI: 1.17-1.35).
Why are they food insecure and/or malnourished?
A multivariate analysis of the underlying causes of food insecurity explored a number of linkages that could explain food insecurity and vulnerability. The analysis suggests that female headed households are more likely to have poor food consumption: 21% of the poor FCS are female headed households. The presence of a chronically ill person in the households was associated with poor food consumption: 22% of households with poor FCS had a chronically ill member. The proportion of households cultivating less than 0.1ha of agricultural land is highest among households with a poor FCS (36%) compared to those with a borderline FCS (27%) and an acceptable FCS (16%). In addition, diversity of agricultural production (proportion of households cultivating four crops or more) and ownership of livestock (as measured by the average TLU) are lower among households with a poor FCS. The proportion of households with a poor FCS was highest among households in the lowest wealth quintiles. Overall, the CFSVA found a significant association between the food consumption score and the wealth index (Pearson’s r = 0.5, p<0.001). However, the survey did not find associations between food consumption and wealth-related indicators such as access to improved sources of water and improved toilets.The survey found no significant differences in expenditures between households in the poor and borderline food consumption groups. However, households with an acceptable FCS on average spent more on food and non-food items in absolute value compared to the other households, while the proportion of food expenditures to the total expenditures was lower. Drought, irregular rains and dry spells were the most commonly reported shocks experienced by the sampled households. They were most frequently reported in Bugesera (87.0%), in the south (Nyanza, 71.4%; Gisagara 60.4%; Huye 58.7%), and, in the east, Rusizi-Nyamasheke (58.8%).
Although high prices for food were seldom mentioned among the shocks (2.5%), it is an important cyclical trend. The results suggest both a long term price increase trend for most crops and some cyclical price changes. With regards to long term trends, between February 2008 and February 2009 (one year) all crops but beans experienced market prices increase. In Rwanda the increased consumption of pulses is what distinguishes households with a poor FCS from households with a borderline FCS. As pulses become either too expensive or unavailable, the food consumption patterns worsen.
Communities further frequently identified general poverty (37%), access to clean water (34%), education (access and analphabetism – 29%), health infrastructures (22%), and other infrastructures (roads, markets – 29%). Those results point at structural problems and the need to further develop infrastructures and social services. Economic aspects were also frequently mentioned, especially the lack of jobs/employment.
The health status of a child was significantly associated with his/her nutritional status: according to the data, children who reportedly had fever in the two weeks prior to the survey were more likely to be wasted compared to those without fever (O.R. 1.36, 95% CI: 1.04-1.79). Also, an improvement in the mother’s BMI would most likely imply a less likelihood of the child being wasted (O.R. 0.88, 95% CI: 0.83-0.93). Data also suggest a link between malnutrition and poverty as increase in estimated annual income and higher wealth index decreased the odds of wasting (O.R. 1.02, 95% CI: 1.01-1.03) and stunting (O.R. 0.85, 95% CI: 0.80-0.90) respectively.
15
What are the implications for food security and nutrition interventions?
Priorities
Four types of priorities were explored in analyzing geographic priorities: (1) Food security, (2) Poverty, (3) Malnutrition, and (4) Risks of Drought. Within each category several strata have been identified as being of priority, and each stratum, in turn, was shown to have different vulnerability characteristics that need to be taken into account when planning interventions.
Food Security Geographic Priorities
The 2009 Rwanda CFSVA and Nutrition Survey results highlight a total of six food security geographic priorities.
Nyabihu, Ngororero and Nyaruguru-Nyamagabe -along the Crete of the Nile line that runs from North to South in Rwanda. Karongi-Rutsiro, Ruhango-Muhanga-Kamonyi, and Bugesera.
Together these strata account for 36% of the population and 65% of all the food insecure.
Wealth Geographic Priorities Five strata have higher than average prevalence of households in the poorest wealth quintile. They account together for 25% of the population and 45% of all the households with a poor FCS. The strata are Nyaruguru-Nyamagabe (37%), Gisagara (32%), Karongi-Rutsiro (28%), Ngororero (28%), and Nyanza (23%). Three of these strata were also identified as geographic priorities for food security (Ngororero, Nyaruguru-Nyamagabe, and Karongi-Rutsiro).
Nutrition Geographic Priorities For wasting, the multivariate analysis indicates Nyanza as the single geographic priority. However, more generally, the Southern Province is identified as priority, with the highest prevalences found in Nyanza, Gisagara and Nyaruguru-Nyamagabe. For stunting, the multivariate analysis indicates the Northern Province as the priority. Looking at prevalence of stunting across strata suggest that in addition to Gakenke in the North, Rubavu and Ngororero in the West and Nyaruguru-Nyamagabe in the South should also be included. Those four strata again are located along the Crete of the Nile.
Drought Risk Geographic Priorities Drought is the most frequently reported shock. In the context of Rwanda’s agriculture, highly dependent on climatic conditions, drought is an important vulnerability factor. The geographic priority areas are identified as Bugesera in the Eastern Province, and, in the south, Nyanza, Gisagara, and Huye. In addition, Nyagatare-Gatsibo-Kayonza should be monitored.
Recommendations
1. Integrate food security, nutrition and disaster management programs with the national poverty reduction program to create a vulnerability reduction strategy. The analysis of the 2009 CFSVA and Nutrition Survey data indicates links between the four components that need to be addressed with a broad multi-sector approach that includes investments in infrastructures, in agricultural productivity and diversity, in the service sector, especially education and health.
16
2. Increase agricultural output Target livelihood groups: Agriculturalists Of all factors with the potential to increase agricultural productivity, the availability of adapted and improved seeds and other inputs, including fertilizers should be prioritized. Seed fairs and private (for-profit) seed distribution networks should be promoted. In addition, agriculture extension officers should promote the use of sustainable practices to control erosion and loss of fertility within a sustainable agriculture model. Model gardens and demonstration plots may be useful. Such programs must be developed locally to address specific local conditions.
3. Develop vocational skills and capacities Target livelihood groups: Labourers, Vulnerable Agriculturalists (e.g. limited access to land)Labourers typically have little access to land and depend on manual labour to sustain their livelihoods. Unskilled agricultural labour wages are and this translates into limited income for labourers. By developing skills and capacities, labourers will become more specialized workers which in turn can command higher income. Agriculturalists who have limited access to land similarly need to develop alternative livelihood strategies to supplement their own agricultural production. Such additional strategies could include skilled and unskilled labour. Interventions to consider include: vocational training, Food-for-Training, investment in adult training programs and school implementation.
4. Develop supplementary feeding and targeted-nutrition programs for under-five as well as school-aged children and women aged 15 to 49 years old. Target livelihood groups: ALLStunting and wasting continue to be highly prevalent in Rwanda. In the short-term, and in-line with the on-going GoR accelerated response to combat acute malnutrition, appropriate support should be provided to sensitize communities and community health workers on the presence of acute malnutrition, in particular oedematous malnutrition, and the possibility of referring these children for treatment at health facilities. For the medium and long-term, current community-based nutrition activities should be strengthened and scaled-up to cover the whole country to facilitate early detection of growth deterioration. Also, there is need for activation of appropriate age-specific interventions including facility-based outpatient therapeutic and community-based supplementary as well as school feeding programs.
Rwanda 2009 CFSVA and Nutrition Survey
17
1. INTRODUCTION
Since the 1994 Genocide and total collapse of Rwanda’s economy and social services, the country has embarked on rebuilding itself and improving the quality of life of its populatioin. Its Vision 2020 outlines development goals that include (1) good governance and a capable state, (2) human resource development, and a knowledge based economy, (3) a private sector-led economy, (4) infrastructure development, (5) productive and market oriented agriculture, and (6) regional and international economic integration. The vision also outlines three cross-cutting themes, (1) gender equality, (2) protection of the environment and sustainable natural resource management, and (3) science and technology, including ICT.
Economically significant progresses have been made. Since the end of 1998, annual growth (GDP) averaged 5.8% per annum. The recovery of the tourism industry and infrastructures has helped the emergence of a structural shift in the economy, with the service and industry sectors growing at an average 8%. Agriculture, which remains the most important economic sector, has grown from -0.4 in 2007 to 15% in 2008.
Despite the economic growth, many socio-economic indicators have remained stable or only slightly improved. At the national level the proportion of the Rwandan population identified as poor has fallen from 60.4% in 2000/01 to 56.9% in 2005/06 (EICV I and II data).1
Against this context of socio-economic progress mitigated by population growth, it was decided to undertake a national Comprehensive Food Security and Vulnerability Analysis (CFSVA) and Nutrition Survey with the objective of analyzing trends over time in comparison with a similar study conducted in 2006, measuring the extent and depth of food insecurity and vulnerability, and identifying the underlying causes. This report presents the results of this study.
1 Reports are available at: http://statistics.gov.rw
Rwanda 2009 CFSVA and Nutrition Survey
18
2. CFSVA OBJECTIVES AND METHODOLOGY
OBJECTIVES
The overall objective of the 2009 Comprehensive Food Security and Vulnerability Analysis (CFSVA) and Nutrition Survey is to analyze the food security, nutrition situation and vulnerability conditions of population groups and communities in rural Rwanda, and to provide baseline information to actors focusing on food and nutrition insecurity.
The specific objectives of the 2009 Rwanda CFSVA and Nutrition Survey were to:
Identify geographic and socio-economic groups that are food insecure or vulnerable to food insecurity; Identify the nature and causes of food insecurity among each group; Identify the major risks and constraints to improving food security; Evaluate assistance needs at the short, medium and long range; Support the development of an appropriate targeting system; Better define the role of GoR’s development partners including WFP in promoting food security strengthening programs; Determine the prevalence of nutritional status of vulnerable groups (children aged 6 - 59 months and non-pregnant women of reproductive age (15-49 years old)); Determine the prevalence of exclusive breastfeeding as a key Infant and Young Child Feeding strategy; Establish the linkage between household food security and nutritional status of children in Rwanda.
The study seeks to answer five questions:
Who are the people at risk of food insecurity and malnutrition? How many are they? Where do they live? Why are they food insecure and/or malnourished? How can food assistance and other interventions make a difference in reducing poverty, hunger and supporting livelihoods?
CONCEPTUAL FRAMEWORK AND DEFINITIONS
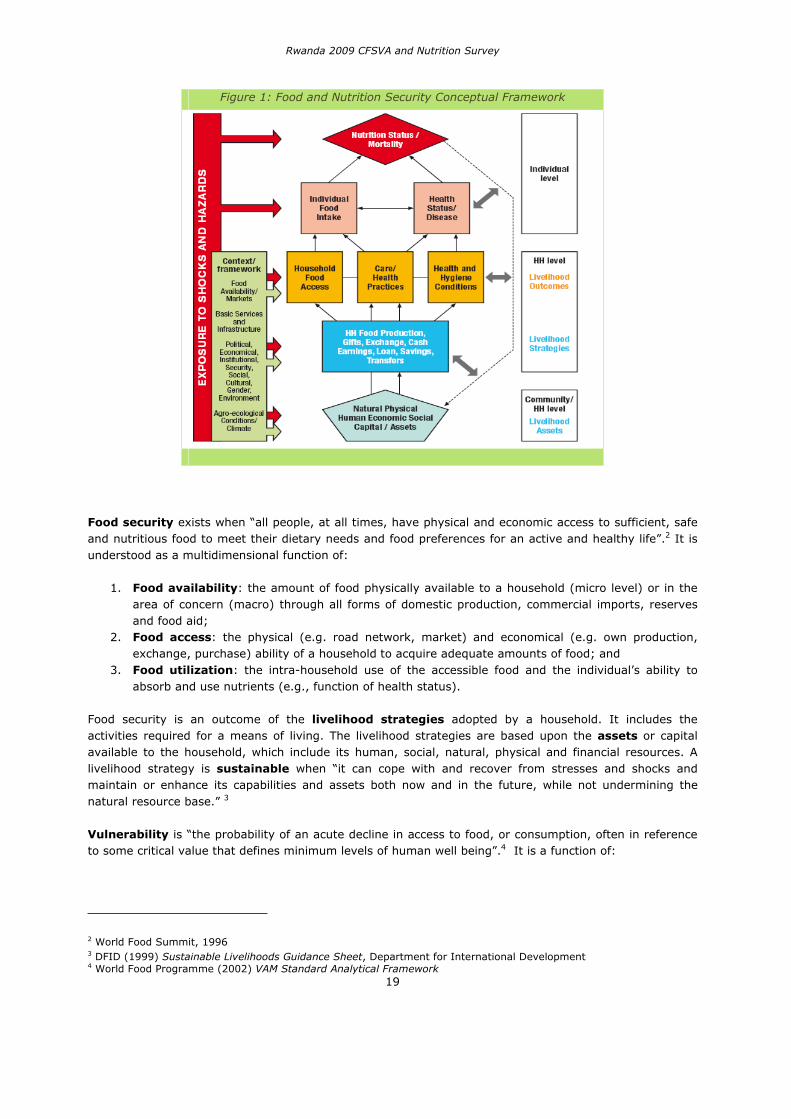
The CFSVA and Nutrition Situation analysis is based on a particular understanding of food security and vulnerability. The Food and Nutrition Security Conceptual Framework presented in Figure 1 informed not only the selection of indicators for analysis, but also the design of field assessment instruments.
This report follows the logic of the Food and Nutrition Security Conceptual Framework (Figure 1). First the human, social, natural, physical and economic capital / assets are introduced, including a discussion of the livelihood strategies. Next, food consumption and nutrition data are examined. The vulnerability context is then examined, and the different components are analyzed to identify determinants of food insecurity and malnutrition. Lastly, recommendations are provided for the One UN in Rwanda, especially its WFP and UNICEF country offices, and World Vision together with other development partners to strengthen food and nutrition security programmes (i.e., implications for programming).
Rwanda 2009 CFSVA and Nutrition Survey
19
Figure 1: Food and Nutrition Security Conceptual Framework
Food security exists when “all people, at all times, have physical and economic access to sufficient, safe and nutritious food to meet their dietary needs and food preferences for an active and healthy life”.2 It is understood as a multidimensional function of:
1. Food availability: the amount of food physically available to a household (micro level) or in the area of concern (macro) through all forms of domestic production, commercial imports, reserves and food aid;
2. Food access: the physical (e.g. road network, market) and economical (e.g. own production, exchange, purchase) ability of a household to acquire adequate amounts of food; and
3. Food utilization: the intra-household use of the accessible food and the individual’s ability to absorb and use nutrients (e.g., function of health status).
Food security is an outcome of the livelihood strategies adopted by a household. It includes the activities required for a means of living. The livelihood strategies are based upon the assets or capital available to the household, which include its human, social, natural, physical and financial resources. A livelihood strategy is sustainable when “it can cope with and recover from stresses and shocks and maintain or enhance its capabilities and assets both now and in the future, while not undermining the natural resource base.” 3
Vulnerability is “the probability of an acute decline in access to food, or consumption, often in reference to some critical value that defines minimum levels of human well being”.4 It is a function of:
2 World Food Summit, 19963 DFID (1999) Sustainable Livelihoods Guidance Sheet, Department for International Development 4 World Food Programme (2002) VAM Standard Analytical Framework
Rwanda 2009 CFSVA and Nutrition Survey
20
1. Exposure to risk: the probability of an event that, if it did materialize, would cause a welfare loss (e.g. drought); and
2. Risk management: the ability to mitigate the possible consequences of a probable event. This can in turn be divided into ex-ante risk management (preparedness) and ex-post risk management (ability to cope). The ability to cope is the response after an event occurred; it can be negative and affect the resource base of the household, such as the selling of assets, or positive (non-negative response such as migration). The ability to cope is undermined by the intensity of the event itself but also by poor structural and societal conditions such as poverty.
Nutritional Security: is achieved when a household has a secure physical, economic and environmental access to a balanced diet and safe drinking water, a sanitary environment, adequate health services, and knowledgeable care to ensure an active and healthy life at all times for all its members.
Nutritional status: is the balance between the intake of nutrients by an organism and their expenditure in the processes of growth, reproduction, and health maintenance. Consequently, malnutrition is any condition caused by excess or deficient nutrient intake. The indicators used to assess the nutritional status of children aged between 6 and 59 months old in this survey were based on anthropometric measurements of the mid-upper arm circumference (MUAC) and Z scores of anthropometric indices (weight-for-height, weight-for-age or height-for-age) with or without bilateral pitting oedema:
Anthropometric Measurements: the variations of the physical dimensions and the gross composition of the human body at different age levels and degrees of nutrition. Common anthropometric measurements include weight and length or height.
Mid-Upper Arm Circumference (MUAC): is a measurement of the circumference of the arm of the mid-upper and an indication of upper arm muscle wasting. MUAC is a common measure of child nutritional status that is fast, does not hinge on the accuracy of age reporting, and is quickly interpretable using a MUAC tape with colours for severe acute malnutrition (RED or a measurement <11cm), moderate acute malnutrition (YELLOW or a measurement between 11.0 - 12.5cm) and normal nutritional status (GREEN or a measurement of >12.5cm). Weight-for-Height (wasting): an indication of the current nutritional status of a child and reflects recent nutritional intake and/or episode of illness. Severe wasting is often linked to acute food shortage. Weight-for-age (underweight): a measurement that combines information from stunting and wasting. Children can therefore be underweight because they are stunted, wasted or both. Height-for-age (stunting): a measure of linear growth, and as such, an indicator of long term effect of under nutrition not affected by seasonal changes.
Standard Deviation (SD) or Z score: is the measure of an individual’s value (based on their anthropometric measurement) with respect to the distribution of the reference population, i.e., the deviation of the individual’s measure (of weight-for-height, weight-for-age and height-for-age)from the reference median.
Breastfeeding indicators: Early initiation of breastfeeding: the proportion of children born in the last 24 months who were put to the breast within one hour of birth:
Children born in the last 24 months who were put to the breast within one hour of birth
Children born in the last 24 months
Exclusive breastfeeding under 6 months: the proportion of infants 0–5 months of age who are fed exclusively on breast milk:
Infants 0–5 months of age who received only breast milk during the previous day
Infants 0–5 months of age
Rwanda 2009 CFSVA and Nutrition Survey
21
Continued breastfeeding at 1 year: Proportion of children 12–15 months of age who are fed breast milk:
Children 12–15 months of age who received breast milk during the previous day
Children 12–15 months of age
METHODOLOGY
This report presents the results of a nationwide cross-sectional study conducted in February-March 2009. Two instruments were used for primary data collection: a household survey administered to randomly selected households, and a community survey administered to key informants. In addition, the analysis builds on the results of a similar survey conducted in 2006 (Rwanda CFSVA, December 2006), and a comprehensive secondary data review conducted in 2008 (Rwanda - Secondary Data Analysis on Food Security and Vulnerability, April 2008)
Data collection for the survey was conducted by the National Institute of Statistics of Rwanda (NISR) in partnership with World Food Programme, UNICEF, World Vision Rwanda, MINAGRI, MINECOFIN, MINALOC and MoH after the survey protocol had been cleared by the National Ethics Committee. A total of 150 enumerators participated in a 9 days-training prior to data collection. The purpose of the training was to familiarize the enumerators with the protocol and questionnaires used for the study and ensure that the study was conducted in a standardized manner. It covered instructions on how to select respondents, conduct interviews and take anthropometric measurements. The training included field testing and practice sessions. After the training, enumerators went to the field in teams of 5 individuals including a team leader. In addition there were 10 national supervisors. The sampling strategy and data collection instruments are described below.
Sampling Strategy
Rwanda is administratively divided into four provinces (Northern Province, Southern Province, Eastern Province and Western Province) plus Kigali City and a total of 30 districts. Districts are further divided in sectors and cells. The 2009 CFSVA and Nutrition Survey was designed to provide statisticallyrepresentative information at the sub-provincial level. To facilitate comparison with existing studies, it was decided to define strata using administrative limits rather than food economy zones (as in 2006). Because of the large number of districts, it was decided to define strata that would be either single districts or a group of districts. Districts that were identified as similar with regards to their socio-economic and agro-environmental characteristics were grouped together. A total of 16 strata were defined including 8 districts and 8 groups of districts. Kigali City was not included in the sample.
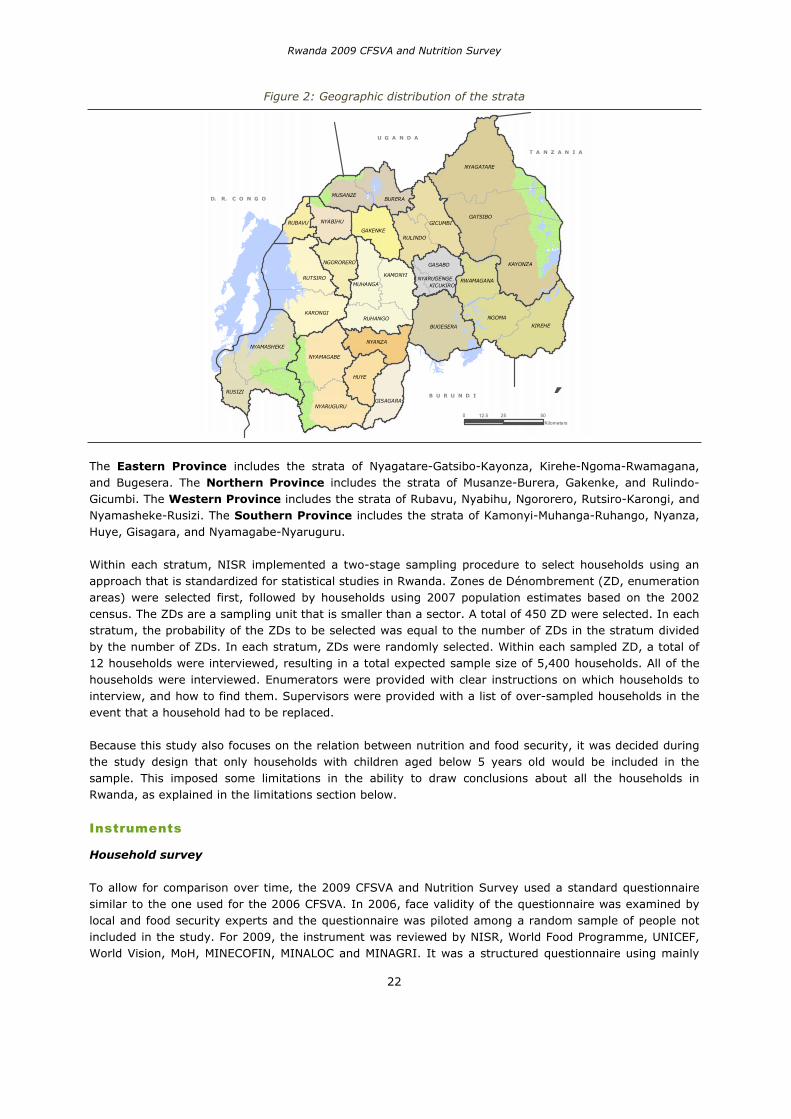
Rwanda 2009 CFSVA and Nutrition Survey
22
Figure 2: Geographic distribution of the strata
D. R. C O N G O
U G A N D A
T A N Z A N I A
B U R U N D I
KAYONZA
GATSIBO
NYAGATARE
KIREHE
RUSIZI
RUTSIRO
BUGESERA
NGOMA
HUYE
KARONGI
GICUMBI
NYAMAGABE
NYAMASHEKENYANZA
NYARUGURU
BURERA
GAKENKE
KAMONYI
GISAGARA
MUHANGA
RUHANGO
RULINDO
NYABIHU
MUSANZE
NGORORERO
RWAMAGANA
GASABO
RUBAVU
KICUKIRONYARUGENGE
0 25 5012.5Kilometers´
The Eastern Province includes the strata of Nyagatare-Gatsibo-Kayonza, Kirehe-Ngoma-Rwamagana, and Bugesera. The Northern Province includes the strata of Musanze-Burera, Gakenke, and Rulindo-Gicumbi. The Western Province includes the strata of Rubavu, Nyabihu, Ngororero, Rutsiro-Karongi, and Nyamasheke-Rusizi. The Southern Province includes the strata of Kamonyi-Muhanga-Ruhango, Nyanza, Huye, Gisagara, and Nyamagabe-Nyaruguru.
Within each stratum, NISR implemented a two-stage sampling procedure to select households using an approach that is standardized for statistical studies in Rwanda. Zones de Dénombrement (ZD, enumeration areas) were selected first, followed by households using 2007 population estimates based on the 2002 census. The ZDs are a sampling unit that is smaller than a sector. A total of 450 ZD were selected. In each stratum, the probability of the ZDs to be selected was equal to the number of ZDs in the stratum divided by the number of ZDs. In each stratum, ZDs were randomly selected. Within each sampled ZD, a total of 12 households were interviewed, resulting in a total expected sample size of 5,400 households. All of the households were interviewed. Enumerators were provided with clear instructions on which households to interview, and how to find them. Supervisors were provided with a list of over-sampled households in the event that a household had to be replaced.
Because this study also focuses on the relation between nutrition and food security, it was decided during the study design that only households with children aged below 5 years old would be included in the sample. This imposed some limitations in the ability to draw conclusions about all the households in Rwanda, as explained in the limitations section below.
Instruments
Household survey
To allow for comparison over time, the 2009 CFSVA and Nutrition Survey used a standard questionnaire similar to the one used for the 2006 CFSVA. In 2006, face validity of the questionnaire was examined by local and food security experts and the questionnaire was piloted among a random sample of people not included in the study. For 2009, the instrument was reviewed by NISR, World Food Programme, UNICEF, World Vision, MoH, MINECOFIN, MINALOC and MINAGRI. It was a structured questionnaire using mainly
Rwanda 2009 CFSVA and Nutrition Survey
23
close-ended questions with response options provided to the enumerators. For several questions, respondents were allowed to provide more than one response. The survey instrument sought to collect quantitative data on 13 components: (1) demographics; (2) housing and facilities; (3) household and productive assets; (4) inputs to livelihoods; (5) migration and remittances; (6) sources of credit; (7) agricultural production; (8) expenditure; (9) food sources and consumption; (10) shocks and food security; (11) programme participation; (12) maternal health and nutrition; and (13) child health and nutrition. Sections 12 and 13 included anthropometric measurements of weight, height and MUAC for women and children as well as age calculation. UNICEF-recommended standard height boards for adults and children were used to measure height to the nearest millimetre. UNICEF SECA 890 electronic scales were used to weigh mothers and children to the nearest 100 grams. The questionnaire was first developed in English and then translated in Kinyarwanda with back translation to English.
The questionnaire included a standardized consent form to secure the participation of selected individuals before starting the interview. Participation was voluntary, and respondents did not receive any money or compensation for participating. Names of respondents were not recorded.
Community questionnaire
In addition to the household survey, a community questionnaire was administered to a key informant, who was an official representative of the area, including the Executive Secretary of the Cell, or any individual responsible for administrative services at Cell level. A total of 438 community questionnaires were completed out of 450 sampled communities. The community questionnaire was developed using an approach similar to that of the household questionnaire. Questions were open-ended and the questionnaires covered four main aspects; migration and seasonal movement of population, health, external assistance (food aid), and market prices. The key informant interviews were intended to contextualize the information collected at the household level.
Data Entry and Analysis
Data entry was conducted by NISR using CSPro. The database was then exported to SPSS for analysis. Statistical analysis was conducted by WFP in Rwanda and Rome, with the support of NISR. SPSS and ADDAWIN were used to conduct PCA and cluster analysis.5 Z-scores for wasting, stunting and underweight were calculated using WHO Anthro. All other analyses were done using SPSS.
Weights Taking into consideration the sampling methodology summarized above, adjustment weights were computed to provide results representative at country level. The household probability of selection is equal to the product of a household’s probability of being selected in a ZD by the probability of the ZD of being sampled. The inverse of this probability is the design weight. The design weight is divided by the product of the total number of households in the population divided by the number of sampled households.6 The result is the normalized weights which were used in all analyses.
Nutrition: Z-scores for wasting (WHZ), stunting (HAZ) and underweight (WAZ) were computed using WHO Anthro and were imported into SPSS for the analysis. Z-scores are based on the 2006 WHO Child Growth Standards. In Rwanda, the latest estimates on child malnutrition were those from DHS 2005 which are based on the 1997 NCHS reference. Conversion formulas have been used to transform the DHS estimates based on the NCHS into predicted values based on the 2006 WHO standards. Such transformation allows a more accurate comparison between 2005 and 2009. The algorithms used for the transformations are based on a simple linear model that was fitted using the logit of WHO and NCHS estimates as,
5 ADDAWIN is freely available at http://cidoc.iuav.it/~silvio/addawin_en.html6 Number of households in the population was estimated using the 2007 population figures estimated by NISR.
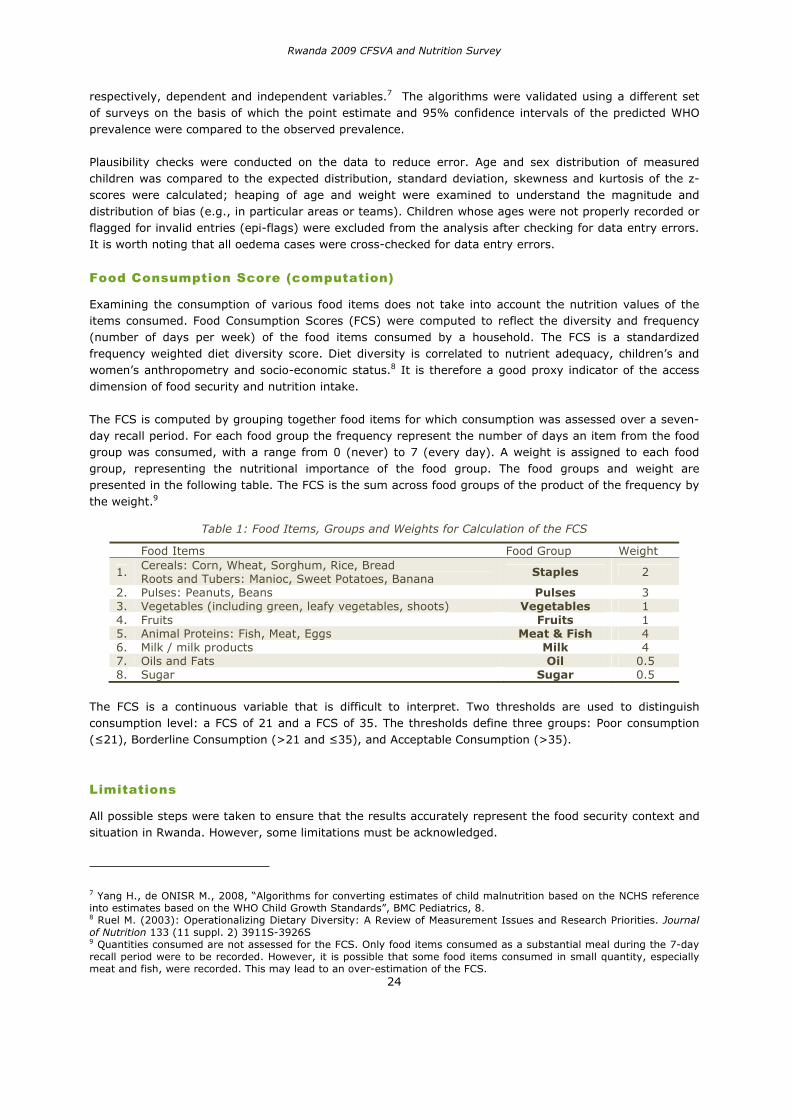
Rwanda 2009 CFSVA and Nutrition Survey
24
respectively, dependent and independent variables.7 The algorithms were validated using a different set of surveys on the basis of which the point estimate and 95% confidence intervals of the predicted WHO prevalence were compared to the observed prevalence.
Plausibility checks were conducted on the data to reduce error. Age and sex distribution of measured children was compared to the expected distribution, standard deviation, skewness and kurtosis of the z-scores were calculated; heaping of age and weight were examined to understand the magnitude and distribution of bias (e.g., in particular areas or teams). Children whose ages were not properly recorded or flagged for invalid entries (epi-flags) were excluded from the analysis after checking for data entry errors. It is worth noting that all oedema cases were cross-checked for data entry errors.
Food Consumption Score (computation)
Examining the consumption of various food items does not take into account the nutrition values of the items consumed. Food Consumption Scores (FCS) were computed to reflect the diversity and frequency (number of days per week) of the food items consumed by a household. The FCS is a standardized frequency weighted diet diversity score. Diet diversity is correlated to nutrient adequacy, children’s and women’s anthropometry and socio-economic status.8 It is therefore a good proxy indicator of the access dimension of food security and nutrition intake.
The FCS is computed by grouping together food items for which consumption was assessed over a seven-day recall period. For each food group the frequency represent the number of days an item from the food group was consumed, with a range from 0 (never) to 7 (every day). A weight is assigned to each food group, representing the nutritional importance of the food group. The food groups and weight are presented in the following table. The FCS is the sum across food groups of the product of the frequency by the weight.9
Table 1: Food Items, Groups and Weights for Calculation of the FCS
Food Items Food Group Weight
1. Cereals: Corn, Wheat, Sorghum, Rice, Bread Roots and Tubers: Manioc, Sweet Potatoes, Banana
Staples 2
2. Pulses: Peanuts, Beans Pulses 33. Vegetables (including green, leafy vegetables, shoots) Vegetables 14. Fruits Fruits 15. Animal Proteins: Fish, Meat, Eggs Meat & Fish 46. Milk / milk products Milk 47. Oils and Fats Oil 0.5 8. Sugar Sugar 0.5
The FCS is a continuous variable that is difficult to interpret. Two thresholds are used to distinguish consumption level: a FCS of 21 and a FCS of 35. The thresholds define three groups: Poor consumption ( 21), Borderline Consumption (>21 and 35), and Acceptable Consumption (>35).
Limitations
All possible steps were taken to ensure that the results accurately represent the food security context and situation in Rwanda. However, some limitations must be acknowledged.
7 Yang H., de ONISR M., 2008, “Algorithms for converting estimates of child malnutrition based on the NCHS reference into estimates based on the WHO Child Growth Standards”, BMC Pediatrics, 8.8 Ruel M. (2003): Operationalizing Dietary Diversity: A Review of Measurement Issues and Research Priorities. Journal of Nutrition 133 (11 suppl. 2) 3911S-3926S9 Quantities consumed are not assessed for the FCS. Only food items consumed as a substantial meal during the 7-day recall period were to be recorded. However, it is possible that some food items consumed in small quantity, especially meat and fish, were recorded. This may lead to an over-estimation of the FCS.
Rwanda 2009 CFSVA and Nutrition Survey
25
The results represent the geography and timing of the survey. Urban locations including Kigali, the capital city, were not included in the sample. Rather the sampling frame only included rural ZDs. According to the 2007 NISR population estimates, the population of Kigali City (districts of Nyarugenge, Gasabo and Kicukiro) accounts for 9.4% of the total population of Rwanda. The results therefore only represent rural population of Rwanda. In addition, because the 2009 CFSVA and Nutrition Survey focused on the link between food security and nutrition, only households with children aged 6 to 59 months old were included in the sample. In rural areas, households with children aged 6 to 59 months old represent 60% of all the households (based on 2006 CFSVA data). The results therefore do not represent the entire rural population of Rwanda, but only those with children in that age group. While it is unknown how different households without children aged below 5 are compared to those with children, we expect that the patterns and characteristics associated with food insecurity and malnutrition among this group can be extrapolated to the entire rural population.
Results are representative at the strata level (16 strata), therefore reliable estimates cannot be produced for every district.
The survey took place in February 2009, after the 2009 season A (February) harvest, resulting in good food availability. The results represent a snapshot of the food security for that period. However, the survey instrument includes questions with a recall period of up to one year to provide a broader context. The 2006 CFSVA was conducted in March-April 2006, during a lean period after a poor harvest. It is therefore possible that observed differences result from cyclical changes rather than long term trends.
The 2006 CFSVA was conducted among all rural households of Rwanda, while the 2009 CFSVA and Nutrition Survey focused on rural households with children aged 6 to 59 months old. To allow for comparison, all the measures from 2006 presented in this report (e.g. food consumption) were re-analyzed excluding households with no children aged 0-60 months old.
Inaccurate recall and quantitative estimates may affect the validity of the findings. The enumerators were trained to facilitate such recall and to collect accurate anthropometric data. It is also possible that expectations for ulterior benefits influenced the results. However respondents were explained to that no benefit was to be expected and that the interview was anonymous.
The questionnaires were developed in English and administered in Kinyarwanda. Careful training was conducted to reduce individual variations on how enumerators interpreted the questionnaire and understood the questions.
Food security and vulnerability are complex concepts to measure. This report focuses on food consumption as a proxy measure of food security. The measure has the advantage to be reproducible and comparable over time and location.
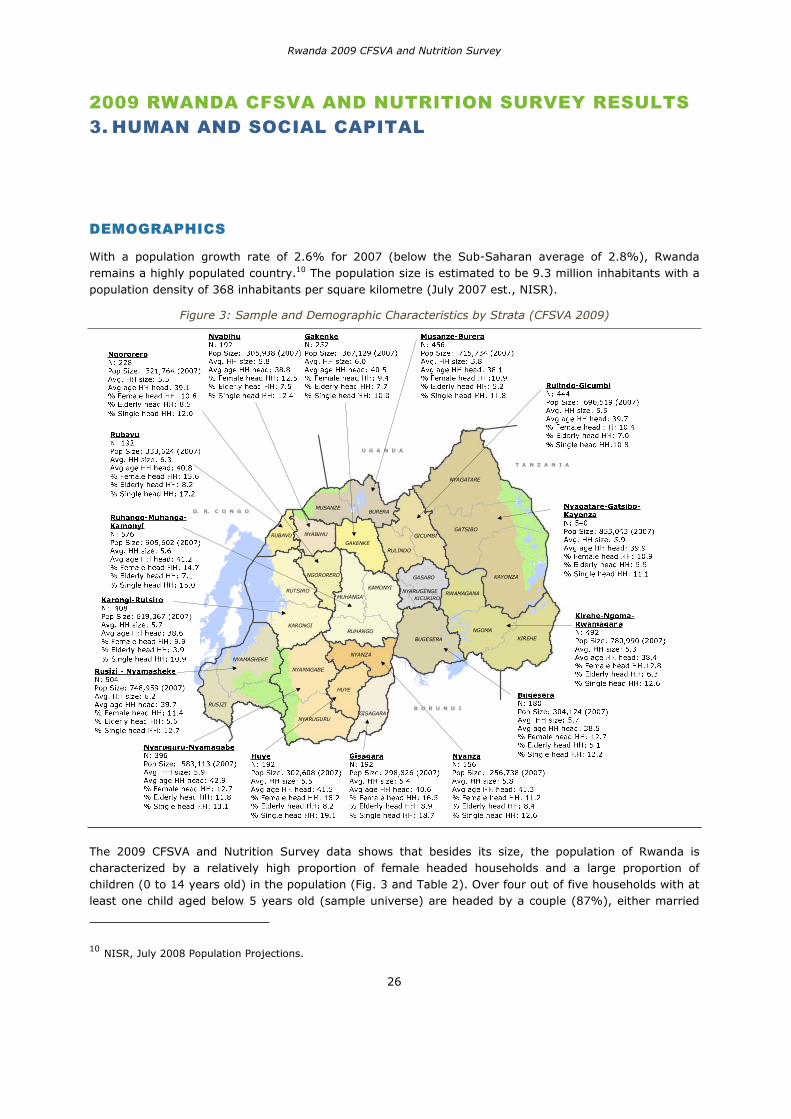
Rwanda 2009 CFSVA and Nutrition Survey
26
2009 RWANDA CFSVA AND NUTRITION SURVEY RESULTS 3. HUMAN AND SOCIAL CAPITAL
DEMOGRAPHICS
With a population growth rate of 2.6% for 2007 (below the Sub-Saharan average of 2.8%), Rwanda remains a highly populated country.10 The population size is estimated to be 9.3 million inhabitants with a population density of 368 inhabitants per square kilometre (July 2007 est., NISR).
Figure 3: Sample and Demographic Characteristics by Strata (CFSVA 2009)
D. R. C O N G O
U G A N D A
T A N Z A N I A
B U R U N D I
KAYONZA
GATSIBO
NYAGATARE
KIREHE
RUSIZI
RUTSIRO
BUGESERA
NGOMA
HUYE
KARONGI
GICUMBI
NYAMAGABE
NYAMASHEKENYANZA
NYARUGURU
BURERA
GAKENKE
KAMONYI
GISAGARA
MUHANGA
RUHANGO
RULINDO
NYABIHU
MUSANZE
NGORORERO
RWAMAGANA
GASABO
RUBAVU
KICUKIRONYARUGENGE
0 25 5012.5Kilometers´
The 2009 CFSVA and Nutrition Survey data shows that besides its size, the population of Rwanda is characterized by a relatively high proportion of female headed households and a large proportion of children (0 to 14 years old) in the population (Fig. 3 and Table 2). Over four out of five households with at least one child aged below 5 years old (sample universe) are headed by a couple (87%), either married
10 NISR, July 2008 Population Projections.
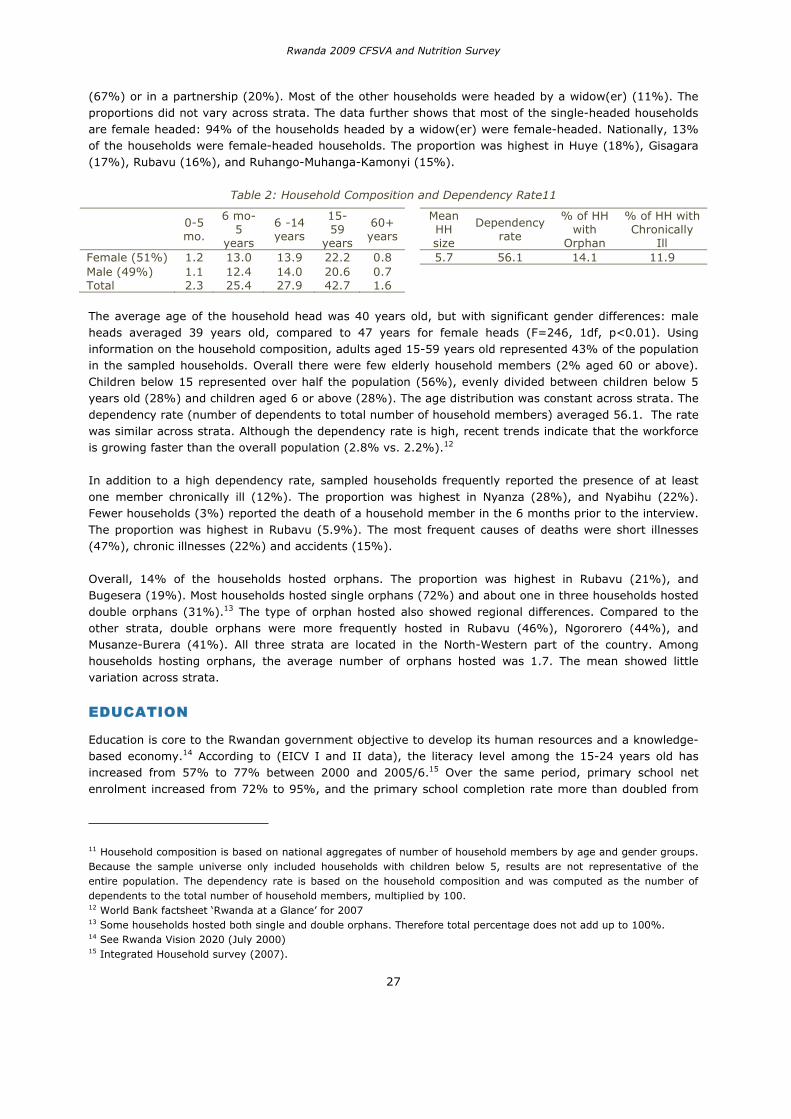
Rwanda 2009 CFSVA and Nutrition Survey
27
(67%) or in a partnership (20%). Most of the other households were headed by a widow(er) (11%). The proportions did not vary across strata. The data further shows that most of the single-headed households are female headed: 94% of the households headed by a widow(er) were female-headed. Nationally, 13% of the households were female-headed households. The proportion was highest in Huye (18%), Gisagara (17%), Rubavu (16%), and Ruhango-Muhanga-Kamonyi (15%).
Table 2: Household Composition and Dependency Rate11
0-5 mo.
6 mo- 5
years
6 -14 years
15-59
years
60+ years
Mean HH size
Dependency rate
% of HH with
Orphan
% of HH with Chronically
IllFemale (51%) 1.2 13.0 13.9 22.2 0.8 5.7 56.1 14.1 11.9 Male (49%) 1.1 12.4 14.0 20.6 0.7 Total 2.3 25.4 27.9 42.7 1.6
The average age of the household head was 40 years old, but with significant gender differences: male heads averaged 39 years old, compared to 47 years for female heads (F=246, 1df, p<0.01). Using information on the household composition, adults aged 15-59 years old represented 43% of the population in the sampled households. Overall there were few elderly household members (2% aged 60 or above). Children below 15 represented over half the population (56%), evenly divided between children below 5 years old (28%) and children aged 6 or above (28%). The age distribution was constant across strata. The dependency rate (number of dependents to total number of household members) averaged 56.1. The rate was similar across strata. Although the dependency rate is high, recent trends indicate that the workforce is growing faster than the overall population (2.8% vs. 2.2%).12
In addition to a high dependency rate, sampled households frequently reported the presence of at least one member chronically ill (12%). The proportion was highest in Nyanza (28%), and Nyabihu (22%). Fewer households (3%) reported the death of a household member in the 6 months prior to the interview. The proportion was highest in Rubavu (5.9%). The most frequent causes of deaths were short illnesses (47%), chronic illnesses (22%) and accidents (15%).
Overall, 14% of the households hosted orphans. The proportion was highest in Rubavu (21%), and Bugesera (19%). Most households hosted single orphans (72%) and about one in three households hosted double orphans (31%).13 The type of orphan hosted also showed regional differences. Compared to the other strata, double orphans were more frequently hosted in Rubavu (46%), Ngororero (44%), and Musanze-Burera (41%). All three strata are located in the North-Western part of the country. Among households hosting orphans, the average number of orphans hosted was 1.7. The mean showed little variation across strata.
EDUCATION
Education is core to the Rwandan government objective to develop its human resources and a knowledge-based economy.14 According to (EICV I and II data), the literacy level among the 15-24 years old has increased from 57% to 77% between 2000 and 2005/6.15 Over the same period, primary school net enrolment increased from 72% to 95%, and the primary school completion rate more than doubled from
11 Household composition is based on national aggregates of number of household members by age and gender groups. Because the sample universe only included households with children below 5, results are not representative of the entire population. The dependency rate is based on the household composition and was computed as the number of dependents to the total number of household members, multiplied by 100. 12 World Bank factsheet ‘Rwanda at a Glance’ for 200713 Some households hosted both single and double orphans. Therefore total percentage does not add up to 100%. 14 See Rwanda Vision 2020 (July 2000)15 Integrated Household survey (2007).
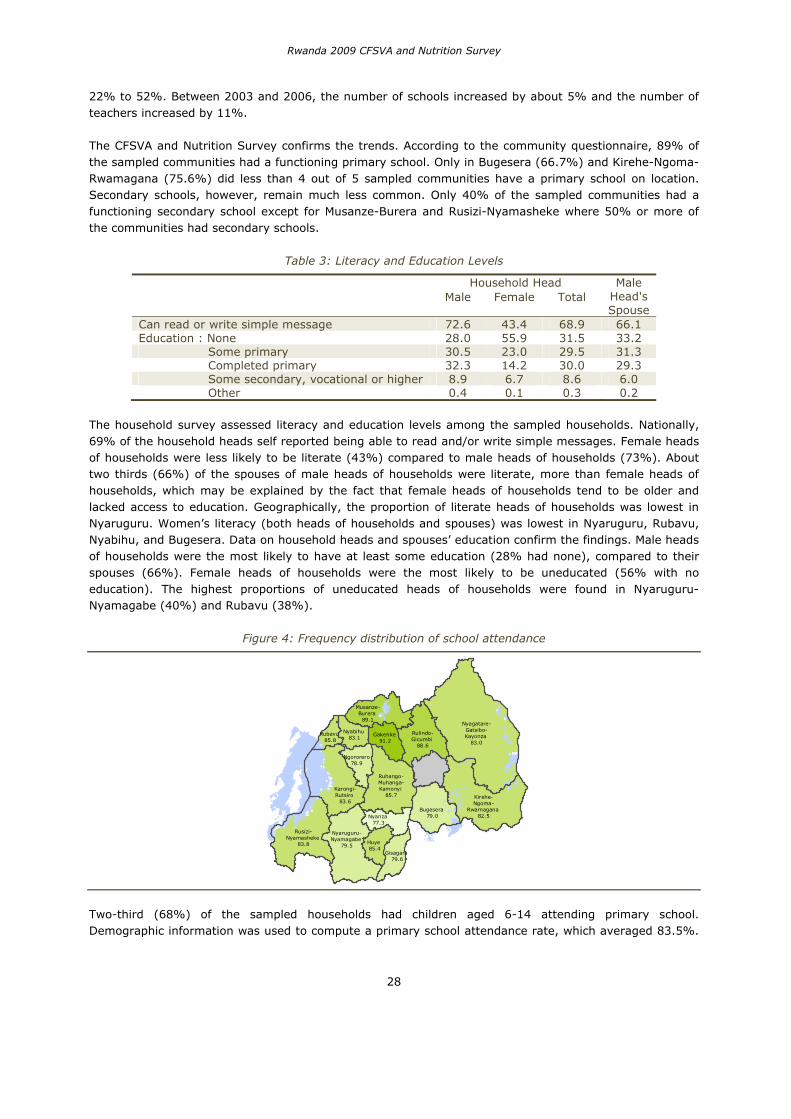
Rwanda 2009 CFSVA and Nutrition Survey
28
22% to 52%. Between 2003 and 2006, the number of schools increased by about 5% and the number of teachers increased by 11%.
The CFSVA and Nutrition Survey confirms the trends. According to the community questionnaire, 89% of the sampled communities had a functioning primary school. Only in Bugesera (66.7%) and Kirehe-Ngoma-Rwamagana (75.6%) did less than 4 out of 5 sampled communities have a primary school on location. Secondary schools, however, remain much less common. Only 40% of the sampled communities had a functioning secondary school except for Musanze-Burera and Rusizi-Nyamasheke where 50% or more of the communities had secondary schools.
Table 3: Literacy and Education Levels
Household Head Male Head's Spouse
Male Female Total
Can read or write simple message 72.6 43.4 68.9 66.1 Education : None 28.0 55.9 31.5 33.2
Some primary 30.5 23.0 29.5 31.3 Completed primary 32.3 14.2 30.0 29.3 Some secondary, vocational or higher 8.9 6.7 8.6 6.0 Other 0.4 0.1 0.3 0.2
The household survey assessed literacy and education levels among the sampled households. Nationally, 69% of the household heads self reported being able to read and/or write simple messages. Female heads of households were less likely to be literate (43%) compared to male heads of households (73%). About two thirds (66%) of the spouses of male heads of households were literate, more than female heads of households, which may be explained by the fact that female heads of households tend to be older and lacked access to education. Geographically, the proportion of literate heads of households was lowest in Nyaruguru. Women’s literacy (both heads of households and spouses) was lowest in Nyaruguru, Rubavu, Nyabihu, and Bugesera. Data on household heads and spouses’ education confirm the findings. Male heads of households were the most likely to have at least some education (28% had none), compared to their spouses (66%). Female heads of households were the most likely to be uneducated (56% with no education). The highest proportions of uneducated heads of households were found in Nyaruguru-Nyamagabe (40%) and Rubavu (38%).
Figure 4: Frequency distribution of school attendance
Nyagatare-Gatsibo-Kayonza
83.0
Karongi-Rutsiro
83.6
Bugesera 79.0
Rusizi-Nyamasheke
83.8
Kirehe-Ngoma-
Rwamagana 82.5
Nyaruguru-Nyamagabe
79.5
Rulindo-Gicumbi
88.6
Huye 85.4
Nyanza 77.3
Musanze-Burera
89.1
Gakenke 91.2
Ngororero78.9
Nyabihu 83.1
Ruhango-Muhanga-Kamonyi
85.7
Gisagara 79.6
Rubavu 85.8
Two-third (68%) of the sampled households had children aged 6-14 attending primary school. Demographic information was used to compute a primary school attendance rate, which averaged 83.5%.
Rwanda 2009 CFSVA and Nutrition Survey
29
The rate was below 80% in Nyanza (77%), Ngororero (79%) and Bugesera (79%). School attendance rates for boys and girls were similar.
The CFSVA further assessed reasons for missing school. Only a tenth (9%) of the households with children aged 6-14 and attending primary school, did miss school for at least a week during the 6 months period prior to the survey. Sickness was the main reason for children missing school, both among boys and girls.
HEALTH
Women and children’s health will be explored later in this report. In this section data from the community questionnaire on access to health facilities are presented. About one in four sampled communities (29%) reported having a functioning health post in the community. The highest percentages are found in Ngororero (50%) and Rusizi-Nyamasheke (42.9%). Communities with a functioning health post were least frequent in Rubavu (13.3%), Nyanza (15.4%), Gakenke (19%) and Nyagatare-Gatsibo-Kayonza (19.5%). In addition, communities with no health post on location were asked to estimate the distance (in hours) to the closest post. In all but three strata, health posts were within less than two hours. The longest distance was found in Bugesera (6.1 hours), Musanze-Burera (5.4 hours), and Karongi-Rutsiro (4.8 hours).
MIGRATION AND DISPLACEMENT
The on-going instability in several parts of the great lakes region (and most noticeably eastern Democratic Republic of Congo) continues to create massive displacement of populations. Rwanda hosts approximately 55,159 camp-based refugees including 1,882 urban refugees mainly from the Democratic Republic of Congo and Burundi. The Congolese are hosted in three main refugee camps: Gihembe in Gicumbi District (19,120 refugees), Nyabiheke in Gatsibo District (13,791 refugees) and Kiziba in Karongi District (with 18,341 refugees). Approximately 2,025 Burundian refugees live in Kigeme Camp in Nyamagabe District.16
In addition to refugee movements, there continues to be internal movement of Rwandans. The CFSVA data shows that 12% of the households had at least one member who moved or migrated during the 3 month period prior to the survey. There were differences across strata, with more frequent migration/movement in Huye (19%), Nyabihu (17%), and Ruhango-Muhanga-Kamonyi (17%). Most of the internal movements are over short distances, with the largest proportion of migrants (40%) staying in the same district, 27% moving to another district, in rural areas, and 27% outside of the district, in urban areas. Seven percent moved to other countries. The main causes for movement/migration were migration for work/economic opportunities (43%) and education (21%).
The community questionnaire also collected information on population movements. A majority of the communities (53%) described themselves as having experienced more arrivals than departure since 2006. About one in four (26%) described themselves as having experienced more departure than arrivals; 14.2% had experienced neither arrivals nor departure, and 5.9% had experienced equal amount of arrivals and departures. There were differences across strata. Nyaruguru-Nyamagabe has the lowest percentage of communities having experienced more arrivals (9%), with most reporting neither arrivals nor departures (46%) or mainly departures (42%). There were two strata where the proportion of communities reporting higher departures than arrivals: Nyabihu (38% arrivals, 56% departures) and Ngororero with 19% arrivals compared to 69% departures.
16 UNHCR Rwanda Fact sheet, March 2009.
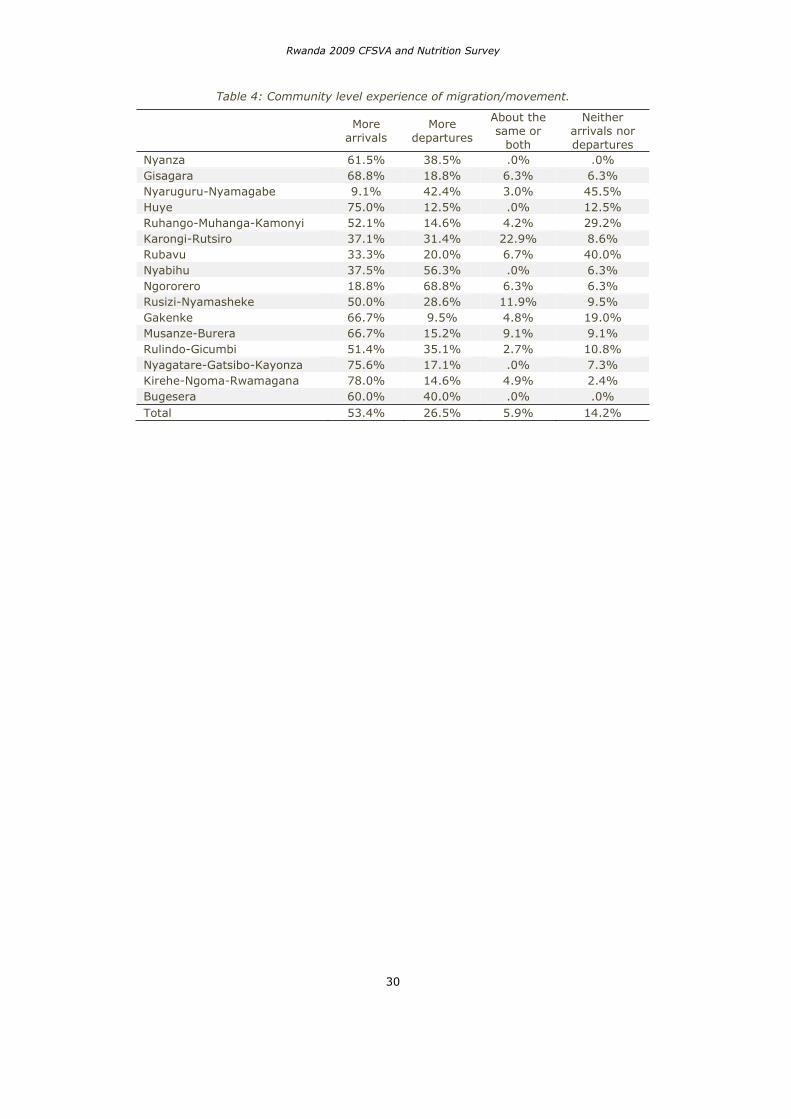
Rwanda 2009 CFSVA and Nutrition Survey
30
Table 4: Community level experience of migration/movement.
More arrivals
More departures
About the same or
both
Neither arrivals nor departures
Nyanza 61.5% 38.5% .0% .0% Gisagara 68.8% 18.8% 6.3% 6.3% Nyaruguru-Nyamagabe 9.1% 42.4% 3.0% 45.5% Huye 75.0% 12.5% .0% 12.5% Ruhango-Muhanga-Kamonyi 52.1% 14.6% 4.2% 29.2% Karongi-Rutsiro 37.1% 31.4% 22.9% 8.6% Rubavu 33.3% 20.0% 6.7% 40.0% Nyabihu 37.5% 56.3% .0% 6.3% Ngororero 18.8% 68.8% 6.3% 6.3% Rusizi-Nyamasheke 50.0% 28.6% 11.9% 9.5% Gakenke 66.7% 9.5% 4.8% 19.0% Musanze-Burera 66.7% 15.2% 9.1% 9.1% Rulindo-Gicumbi 51.4% 35.1% 2.7% 10.8% Nyagatare-Gatsibo-Kayonza 75.6% 17.1% .0% 7.3% Kirehe-Ngoma-Rwamagana 78.0% 14.6% 4.9% 2.4% Bugesera 60.0% 40.0% .0% .0%Total 53.4% 26.5% 5.9% 14.2%
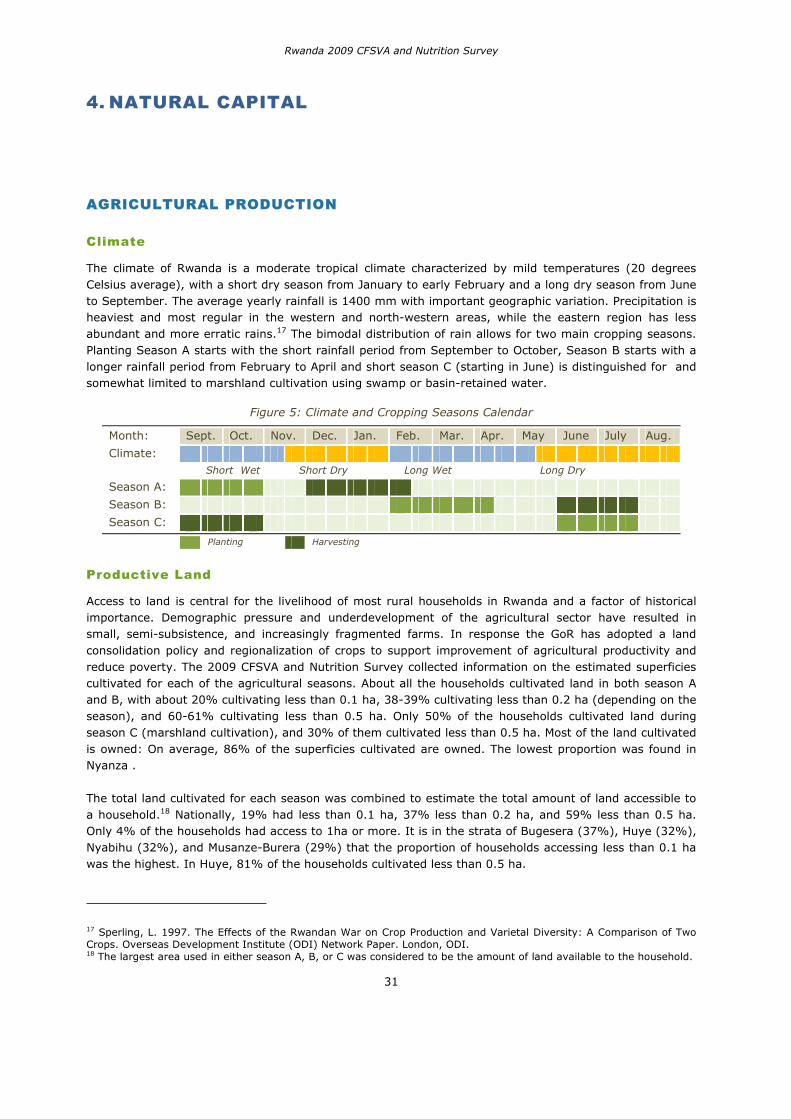
Rwanda 2009 CFSVA and Nutrition Survey
31
4. NATURAL CAPITAL
AGRICULTURAL PRODUCTION
Climate
The climate of Rwanda is a moderate tropical climate characterized by mild temperatures (20 degrees Celsius average), with a short dry season from January to early February and a long dry season from June to September. The average yearly rainfall is 1400 mm with important geographic variation. Precipitation is heaviest and most regular in the western and north-western areas, while the eastern region has less abundant and more erratic rains.17 The bimodal distribution of rain allows for two main cropping seasons. Planting Season A starts with the short rainfall period from September to October, Season B starts with a longer rainfall period from February to April and short season C (starting in June) is distinguished for and somewhat limited to marshland cultivation using swamp or basin-retained water.
Figure 5: Climate and Cropping Seasons Calendar
Month: Sept. Oct. Nov. Dec. Jan. Feb. Mar. Apr. May June July Aug.
Climate: Short Wet Short Dry Long Wet Long Dry
Season A:
Season B:
Season C:
Planting Harvesting
Productive Land
Access to land is central for the livelihood of most rural households in Rwanda and a factor of historical importance. Demographic pressure and underdevelopment of the agricultural sector have resulted in small, semi-subsistence, and increasingly fragmented farms. In response the GoR has adopted a land consolidation policy and regionalization of crops to support improvement of agricultural productivity and reduce poverty. The 2009 CFSVA and Nutrition Survey collected information on the estimated superficies cultivated for each of the agricultural seasons. About all the households cultivated land in both season A and B, with about 20% cultivating less than 0.1 ha, 38-39% cultivating less than 0.2 ha (depending on the season), and 60-61% cultivating less than 0.5 ha. Only 50% of the households cultivated land during season C (marshland cultivation), and 30% of them cultivated less than 0.5 ha. Most of the land cultivated is owned: On average, 86% of the superficies cultivated are owned. The lowest proportion was found in Nyanza .
The total land cultivated for each season was combined to estimate the total amount of land accessible to a household.18 Nationally, 19% had less than 0.1 ha, 37% less than 0.2 ha, and 59% less than 0.5 ha. Only 4% of the households had access to 1ha or more. It is in the strata of Bugesera (37%), Huye (32%), Nyabihu (32%), and Musanze-Burera (29%) that the proportion of households accessing less than 0.1 ha was the highest. In Huye, 81% of the households cultivated less than 0.5 ha.
17 Sperling, L. 1997. The Effects of the Rwandan War on Crop Production and Varietal Diversity: A Comparison of Two Crops. Overseas Development Institute (ODI) Network Paper. London, ODI.18 The largest area used in either season A, B, or C was considered to be the amount of land available to the household.
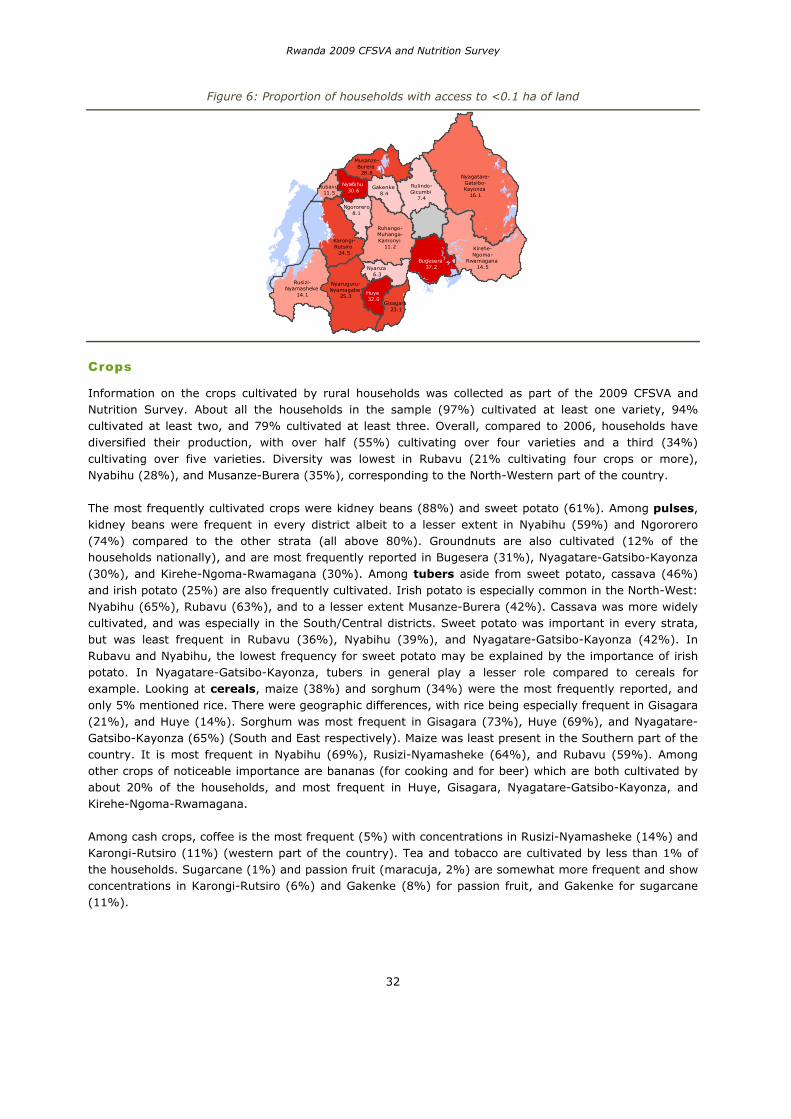
Rwanda 2009 CFSVA and Nutrition Survey
32
Figure 6: Proportion of households with access to <0.1 ha of land
Nyagatare-Gatsibo-Kayonza
16.1
Karongi-Rutsiro
24.5
Bugesera 37.2
Rusizi-Nyamasheke
14.1
Kirehe-Ngoma-
Rwamagana 14.5
Nyaruguru-Nyamagabe
25.3
Rulindo-Gicumbi
7.4
Huye 32.0
Nyanza 6.3
Musanze-Burera
28.8
Gakenke 8.4
Ngororero8.1
Nyabihu 30.6
Ruhango-Muhanga-Kamonyi
11.2
Gisagara 23.1
Rubavu 11.5
Crops
Information on the crops cultivated by rural households was collected as part of the 2009 CFSVA and Nutrition Survey. About all the households in the sample (97%) cultivated at least one variety, 94% cultivated at least two, and 79% cultivated at least three. Overall, compared to 2006, households have diversified their production, with over half (55%) cultivating over four varieties and a third (34%) cultivating over five varieties. Diversity was lowest in Rubavu (21% cultivating four crops or more), Nyabihu (28%), and Musanze-Burera (35%), corresponding to the North-Western part of the country.
The most frequently cultivated crops were kidney beans (88%) and sweet potato (61%). Among pulses,kidney beans were frequent in every district albeit to a lesser extent in Nyabihu (59%) and Ngororero (74%) compared to the other strata (all above 80%). Groundnuts are also cultivated (12% of the households nationally), and are most frequently reported in Bugesera (31%), Nyagatare-Gatsibo-Kayonza (30%), and Kirehe-Ngoma-Rwamagana (30%). Among tubers aside from sweet potato, cassava (46%) and irish potato (25%) are also frequently cultivated. Irish potato is especially common in the North-West: Nyabihu (65%), Rubavu (63%), and to a lesser extent Musanze-Burera (42%). Cassava was more widely cultivated, and was especially in the South/Central districts. Sweet potato was important in every strata, but was least frequent in Rubavu (36%), Nyabihu (39%), and Nyagatare-Gatsibo-Kayonza (42%). In Rubavu and Nyabihu, the lowest frequency for sweet potato may be explained by the importance of irish potato. In Nyagatare-Gatsibo-Kayonza, tubers in general play a lesser role compared to cereals for example. Looking at cereals, maize (38%) and sorghum (34%) were the most frequently reported, and only 5% mentioned rice. There were geographic differences, with rice being especially frequent in Gisagara (21%), and Huye (14%). Sorghum was most frequent in Gisagara (73%), Huye (69%), and Nyagatare-Gatsibo-Kayonza (65%) (South and East respectively). Maize was least present in the Southern part of the country. It is most frequent in Nyabihu (69%), Rusizi-Nyamasheke (64%), and Rubavu (59%). Among other crops of noticeable importance are bananas (for cooking and for beer) which are both cultivated by about 20% of the households, and most frequent in Huye, Gisagara, Nyagatare-Gatsibo-Kayonza, and Kirehe-Ngoma-Rwamagana.
Among cash crops, coffee is the most frequent (5%) with concentrations in Rusizi-Nyamasheke (14%) and Karongi-Rutsiro (11%) (western part of the country). Tea and tobacco are cultivated by less than 1% of the households. Sugarcane (1%) and passion fruit (maracuja, 2%) are somewhat more frequent and show concentrations in Karongi-Rutsiro (6%) and Gakenke (8%) for passion fruit, and Gakenke for sugarcane (11%).
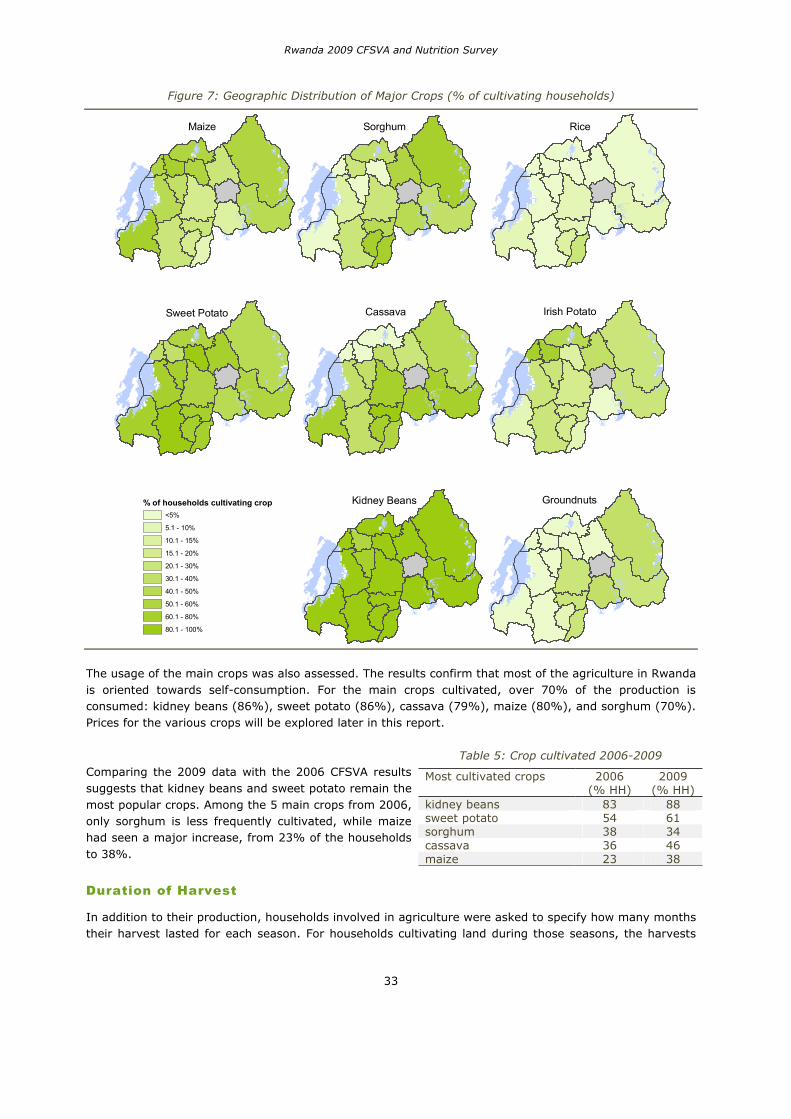
Rwanda 2009 CFSVA and Nutrition Survey
33
Figure 7: Geographic Distribution of Major Crops (% of cultivating households)
Maize Sorghum Rice
Sweet Potato Cassava Irish Potato
Kidney Beans Groundnuts% of households cultivating crop<5%
5.1 - 10%
10.1 - 15%
15.1 - 20%
20.1 - 30%
30.1 - 40%
40.1 - 50%
50.1 - 60%
60.1 - 80%
80.1 - 100%
The usage of the main crops was also assessed. The results confirm that most of the agriculture in Rwanda is oriented towards self-consumption. For the main crops cultivated, over 70% of the production is consumed: kidney beans (86%), sweet potato (86%), cassava (79%), maize (80%), and sorghum (70%). Prices for the various crops will be explored later in this report.
Comparing the 2009 data with the 2006 CFSVA results suggests that kidney beans and sweet potato remain the most popular crops. Among the 5 main crops from 2006, only sorghum is less frequently cultivated, while maize had seen a major increase, from 23% of the households to 38%.
Table 5: Crop cultivated 2006-2009
Most cultivated crops 2006 (% HH)
2009 (% HH)
kidney beans 83 88 sweet potato 54 61 sorghum 38 34 cassava 36 46 maize 23 38
Duration of Harvest
In addition to their production, households involved in agriculture were asked to specify how many months their harvest lasted for each season. For households cultivating land during those seasons, the harvests
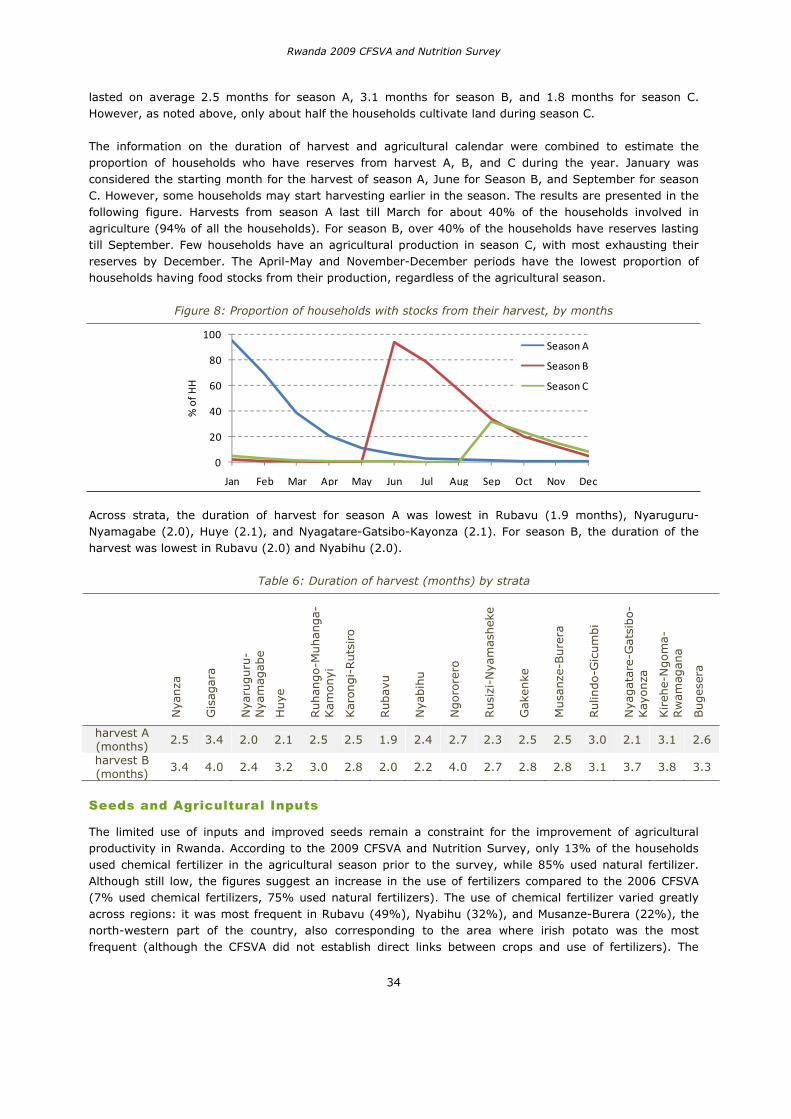
Rwanda 2009 CFSVA and Nutrition Survey
34
lasted on average 2.5 months for season A, 3.1 months for season B, and 1.8 months for season C. However, as noted above, only about half the households cultivate land during season C.
The information on the duration of harvest and agricultural calendar were combined to estimate the proportion of households who have reserves from harvest A, B, and C during the year. January was considered the starting month for the harvest of season A, June for Season B, and September for season C. However, some households may start harvesting earlier in the season. The results are presented in the following figure. Harvests from season A last till March for about 40% of the households involved in agriculture (94% of all the households). For season B, over 40% of the households have reserves lasting till September. Few households have an agricultural production in season C, with most exhausting their reserves by December. The April-May and November-December periods have the lowest proportion of households having food stocks from their production, regardless of the agricultural season.
Figure 8: Proportion of households with stocks from their harvest, by months
0
20
40
60
80
100
Jan Feb Mar Apr May Jun Jul Aug Sep Oct Nov Dec
%of
HH
Season A
Season B
Season C
Across strata, the duration of harvest for season A was lowest in Rubavu (1.9 months), Nyaruguru-Nyamagabe (2.0), Huye (2.1), and Nyagatare-Gatsibo-Kayonza (2.1). For season B, the duration of the harvest was lowest in Rubavu (2.0) and Nyabihu (2.0).
Table 6: Duration of harvest (months) by strata
Nya
nza
Gis
agar
a
Nya
ruguru
-N
yam
agab
e
Huye
Ruhan
go-M
uhan
ga-
Kam
onyi
Kar
ongi-
Ruts
iro
Rubav
u
Nya
bih
u
Ngoro
rero
Rusi
zi-N
yam
ashek
e
Gak
enke
Musa
nze
-Bure
ra
Rulin
do-G
icum
bi
Nya
gat
are-
Gat
sibo-
Kay
onza
Kireh
e-N
gom
a-Rw
amag
ana
Buges
era
harvest A (months) 2.5 3.4 2.0 2.1 2.5 2.5 1.9 2.4 2.7 2.3 2.5 2.5 3.0 2.1 3.1 2.6
harvest B (months)
3.4 4.0 2.4 3.2 3.0 2.8 2.0 2.2 4.0 2.7 2.8 2.8 3.1 3.7 3.8 3.3
Seeds and Agricultural Inputs
The limited use of inputs and improved seeds remain a constraint for the improvement of agricultural productivity in Rwanda. According to the 2009 CFSVA and Nutrition Survey, only 13% of the households used chemical fertilizer in the agricultural season prior to the survey, while 85% used natural fertilizer. Although still low, the figures suggest an increase in the use of fertilizers compared to the 2006 CFSVA (7% used chemical fertilizers, 75% used natural fertilizers). The use of chemical fertilizer varied greatly across regions: it was most frequent in Rubavu (49%), Nyabihu (32%), and Musanze-Burera (22%), the north-western part of the country, also corresponding to the area where irish potato was the most frequent (although the CFSVA did not establish direct links between crops and use of fertilizers). The
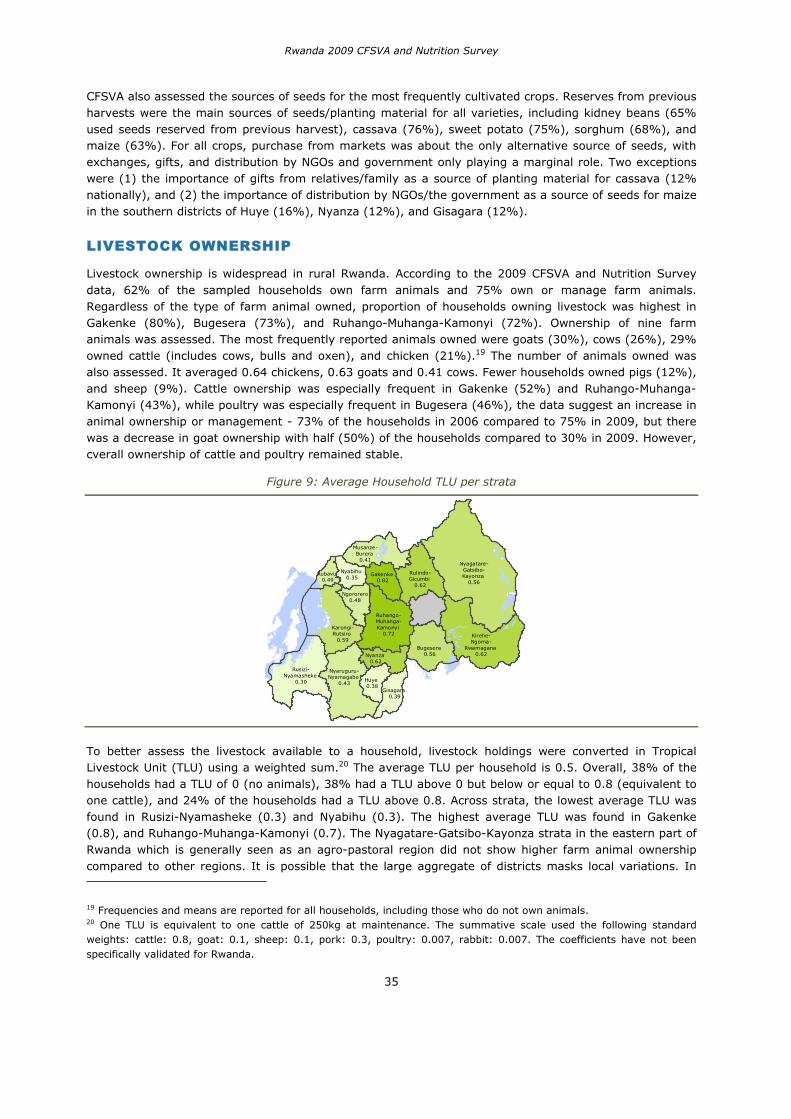
Rwanda 2009 CFSVA and Nutrition Survey
35
CFSVA also assessed the sources of seeds for the most frequently cultivated crops. Reserves from previous harvests were the main sources of seeds/planting material for all varieties, including kidney beans (65% used seeds reserved from previous harvest), cassava (76%), sweet potato (75%), sorghum (68%), and maize (63%). For all crops, purchase from markets was about the only alternative source of seeds, with exchanges, gifts, and distribution by NGOs and government only playing a marginal role. Two exceptions were (1) the importance of gifts from relatives/family as a source of planting material for cassava (12% nationally), and (2) the importance of distribution by NGOs/the government as a source of seeds for maize in the southern districts of Huye (16%), Nyanza (12%), and Gisagara (12%).
LIVESTOCK OWNERSHIP
Livestock ownership is widespread in rural Rwanda. According to the 2009 CFSVA and Nutrition Survey data, 62% of the sampled households own farm animals and 75% own or manage farm animals. Regardless of the type of farm animal owned, proportion of households owning livestock was highest in Gakenke (80%), Bugesera (73%), and Ruhango-Muhanga-Kamonyi (72%). Ownership of nine farm animals was assessed. The most frequently reported animals owned were goats (30%), cows (26%), 29% owned cattle (includes cows, bulls and oxen), and chicken (21%).19 The number of animals owned was also assessed. It averaged 0.64 chickens, 0.63 goats and 0.41 cows. Fewer households owned pigs (12%), and sheep (9%). Cattle ownership was especially frequent in Gakenke (52%) and Ruhango-Muhanga-Kamonyi (43%), while poultry was especially frequent in Bugesera (46%), the data suggest an increase in animal ownership or management - 73% of the households in 2006 compared to 75% in 2009, but there was a decrease in goat ownership with half (50%) of the households compared to 30% in 2009. However, cverall ownership of cattle and poultry remained stable.
Figure 9: Average Household TLU per strata
Nyagatare-Gatsibo-Kayonza
0.56
Karongi-Rutsiro
0.59
Bugesera 0.56
Rusizi-Nyamasheke
0.30
Kirehe-Ngoma-
Rwamagana 0.62
Nyaruguru-Nyamagabe
0.43
Rulindo-Gicumbi
0.62
Huye 0.38
Nyanza 0.62
Musanze-Burera
0.41
Gakenke 0.82
Ngororero0.48
Nyabihu 0.35
Ruhango-Muhanga-Kamonyi
0.72
Gisagara 0.39
Rubavu 0.49
To better assess the livestock available to a household, livestock holdings were converted in Tropical Livestock Unit (TLU) using a weighted sum.20 The average TLU per household is 0.5. Overall, 38% of the households had a TLU of 0 (no animals), 38% had a TLU above 0 but below or equal to 0.8 (equivalent to one cattle), and 24% of the households had a TLU above 0.8. Across strata, the lowest average TLU was found in Rusizi-Nyamasheke (0.3) and Nyabihu (0.3). The highest average TLU was found in Gakenke (0.8), and Ruhango-Muhanga-Kamonyi (0.7). The Nyagatare-Gatsibo-Kayonza strata in the eastern part of Rwanda which is generally seen as an agro-pastoral region did not show higher farm animal ownership compared to other regions. It is possible that the large aggregate of districts masks local variations. In
19 Frequencies and means are reported for all households, including those who do not own animals. 20 One TLU is equivalent to one cattle of 250kg at maintenance. The summative scale used the following standard weights: cattle: 0.8, goat: 0.1, sheep: 0.1, pork: 0.3, poultry: 0.007, rabbit: 0.007. The coefficients have not been specifically validated for Rwanda.
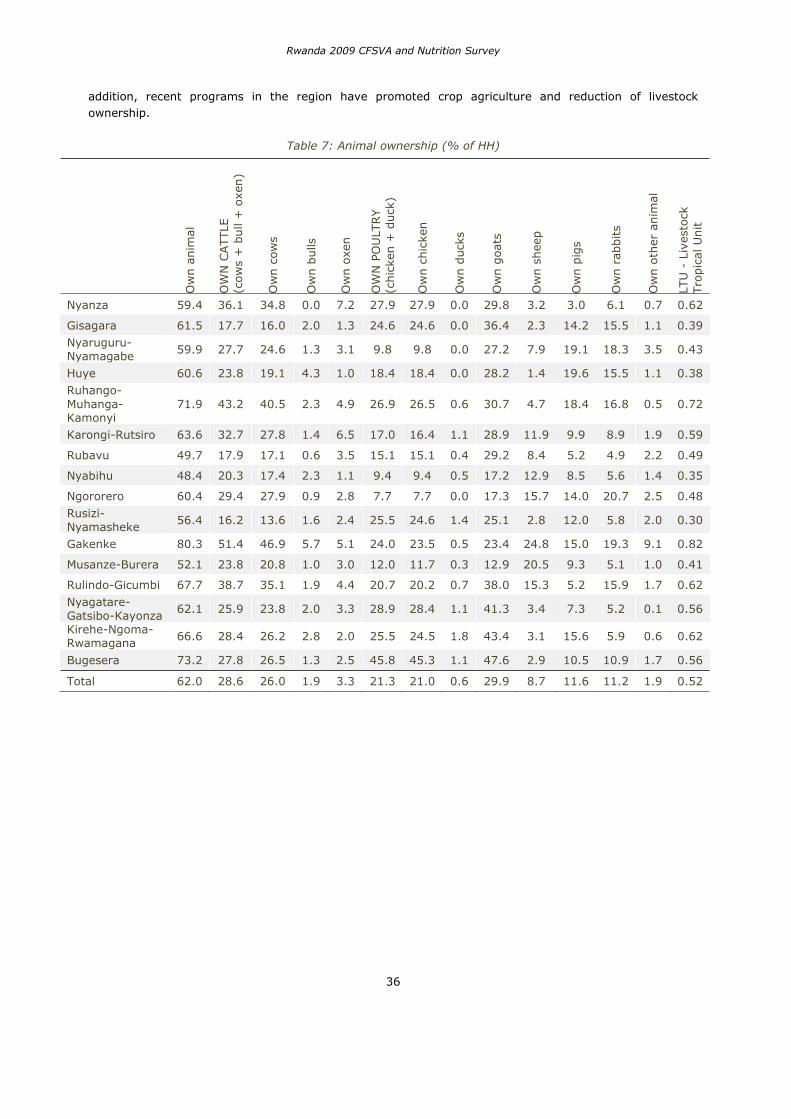
Rwanda 2009 CFSVA and Nutrition Survey
36
addition, recent programs in the region have promoted crop agriculture and reduction of livestock ownership.
Table 7: Animal ownership (% of HH)
Ow
n a
nim
al
OW
N C
ATTLE
(c
ow
s +
bull
+ o
xen)
Ow
n c
ows
Ow
n b
ulls
Ow
n o
xen
OW
N P
OU
LTRY
(chic
ken +
duck
)
Ow
n c
hic
ken
Ow
n d
uck
s
Ow
n g
oats
Ow
n s
hee
p
Ow
n p
igs
Ow
n r
abbits
Ow
n o
ther
anim
al
LTU
- L
ives
tock
Tro
pic
al U
nit
Nyanza 59.4 36.1 34.8 0.0 7.2 27.9 27.9 0.0 29.8 3.2 3.0 6.1 0.7 0.62
Gisagara 61.5 17.7 16.0 2.0 1.3 24.6 24.6 0.0 36.4 2.3 14.2 15.5 1.1 0.39
Nyaruguru-Nyamagabe 59.9 27.7 24.6 1.3 3.1 9.8 9.8 0.0 27.2 7.9 19.1 18.3 3.5 0.43
Huye 60.6 23.8 19.1 4.3 1.0 18.4 18.4 0.0 28.2 1.4 19.6 15.5 1.1 0.38
Ruhango-Muhanga-Kamonyi
71.9 43.2 40.5 2.3 4.9 26.9 26.5 0.6 30.7 4.7 18.4 16.8 0.5 0.72
Karongi-Rutsiro 63.6 32.7 27.8 1.4 6.5 17.0 16.4 1.1 28.9 11.9 9.9 8.9 1.9 0.59
Rubavu 49.7 17.9 17.1 0.6 3.5 15.1 15.1 0.4 29.2 8.4 5.2 4.9 2.2 0.49
Nyabihu 48.4 20.3 17.4 2.3 1.1 9.4 9.4 0.5 17.2 12.9 8.5 5.6 1.4 0.35
Ngororero 60.4 29.4 27.9 0.9 2.8 7.7 7.7 0.0 17.3 15.7 14.0 20.7 2.5 0.48
Rusizi-Nyamasheke
56.4 16.2 13.6 1.6 2.4 25.5 24.6 1.4 25.1 2.8 12.0 5.8 2.0 0.30
Gakenke 80.3 51.4 46.9 5.7 5.1 24.0 23.5 0.5 23.4 24.8 15.0 19.3 9.1 0.82
Musanze-Burera 52.1 23.8 20.8 1.0 3.0 12.0 11.7 0.3 12.9 20.5 9.3 5.1 1.0 0.41
Rulindo-Gicumbi 67.7 38.7 35.1 1.9 4.4 20.7 20.2 0.7 38.0 15.3 5.2 15.9 1.7 0.62
Nyagatare-Gatsibo-Kayonza
62.1 25.9 23.8 2.0 3.3 28.9 28.4 1.1 41.3 3.4 7.3 5.2 0.1 0.56
Kirehe-Ngoma-Rwamagana 66.6 28.4 26.2 2.8 2.0 25.5 24.5 1.8 43.4 3.1 15.6 5.9 0.6 0.62
Bugesera 73.2 27.8 26.5 1.3 2.5 45.8 45.3 1.1 47.6 2.9 10.5 10.9 1.7 0.56
Total 62.0 28.6 26.0 1.9 3.3 21.3 21.0 0.6 29.9 8.7 11.6 11.2 1.9 0.52
Rwanda 2009 CFSVA and Nutrition Survey
37
5. PHYSICAL CAPITAL
HOUSING AND AMENITIES
Housing Structure, and Lighting and Cooking Energy Sources
On average, households were composed of 5.7 members (a household is defined as people typically eating together). The crowding index (number of people sleeping per room) averaged 2.7. Overall, 27% of the households had 3 or more people sleeping per room, and 2% had six or more. Since the sample only targeted households with children aged below 5 years old, the mean household size and crowding index may differ from that of the general population. Geographically, the crowding index was highest in Nyanza (3.2), Nyaruguru-Nyamagabe (3.1), Bugesera (3.0), and Nyagatare-Gatsibo-Kayonza (3.0). It was lowest in Karongi-Rutsiro (2.3), Rubavu (2.3), and Nyabihu (2.4). Differences across strata were statistically significant (F=7.1, 15df, p<0.001).
Typical houses were made of mud for the floor (92%) and occasionally concrete (8%), and, for the roof, tiles (55%), galvanized iron (35%), or straw (8%). Materials for the floor were similar across strata. With regards to roofing material, galvanized iron was most common in Kirehe-Ngoma-Rwamagana (86%), Nyagatare (82%), Riusizi-Nyamasheke (69%), and Bugesera (35%). In those strata, the use of tiles was less frequent. Overall straw roofs were not widely used (8%), but were frequent in Bugesera (27%). Most households used kerosene, oil, or gas lamps (73%) as their main lighting source, with battery and flashlights being used by 12% of the households, candles by 3%, and electricity by 3%. However, 10% of the households declared having no lighting sources. This was most frequent in Nyaruguru-Nyamagabe (30%), Ngororero (24%), and Nyabihu (18%). There were fewer variations with regards to energy sources for cooking: 97% of the households used wood or charcoal as their main source.
Water and Sanitation
Over eighty percent of households (81%) who participated in the 2009 CFSVA and Nutrition Survey use improved sources as their primary sources of water, including public taps/piped water (70%), protected wells or springs (10%), and boreholes with pump (1%). The other households used unprotected sources including ponds, lakes, rivers (16%), and unprotected wells or springs (3%). The results are similar to those of the 2006 CFSVA (18% use ponds, lakes and rivers, with 4% using unprotected wells or springs), suggesting at best only marginal improvement. The use of unprotected/unimproved sources was most frequent in the Eastern Province strata: Nyagatare-Gatsibo-Kayonza (35%) and Kirehe-Ngoma-Rwamagana (33%). The proportion of households using unimproved sources of water was also high in Nyabihu (28%), Musanze-Burera (25%), and Nyanza (24%). Most households do not have to pay for water (77%), and those who do paid an average of 1100 RWF monthly (approx. $2). The proportion of households who had to pay for water was highest in Rubavu (72%), Bugesera (68%), Nyagatare-Gatsibo-Kayonza (44%), and Musanze-Burera (34%).
One-fifth of the households (22%) used alternate sources of water either in conjunction with the main source (18%), or as a replacement when the main source is unusable (4%). This secondary source was more frequently unprotected compared to the primary source. Among households using a secondary source, 45% used an unprotected source (the proportion was 19% for the primary source). The use of a secondary source was most frequent in Nyagatare-Gatsibo-Kayonza (38%), Nyanza (35%), Bugesera (34%), Nyabihu (32%), and Rubavu (32%).
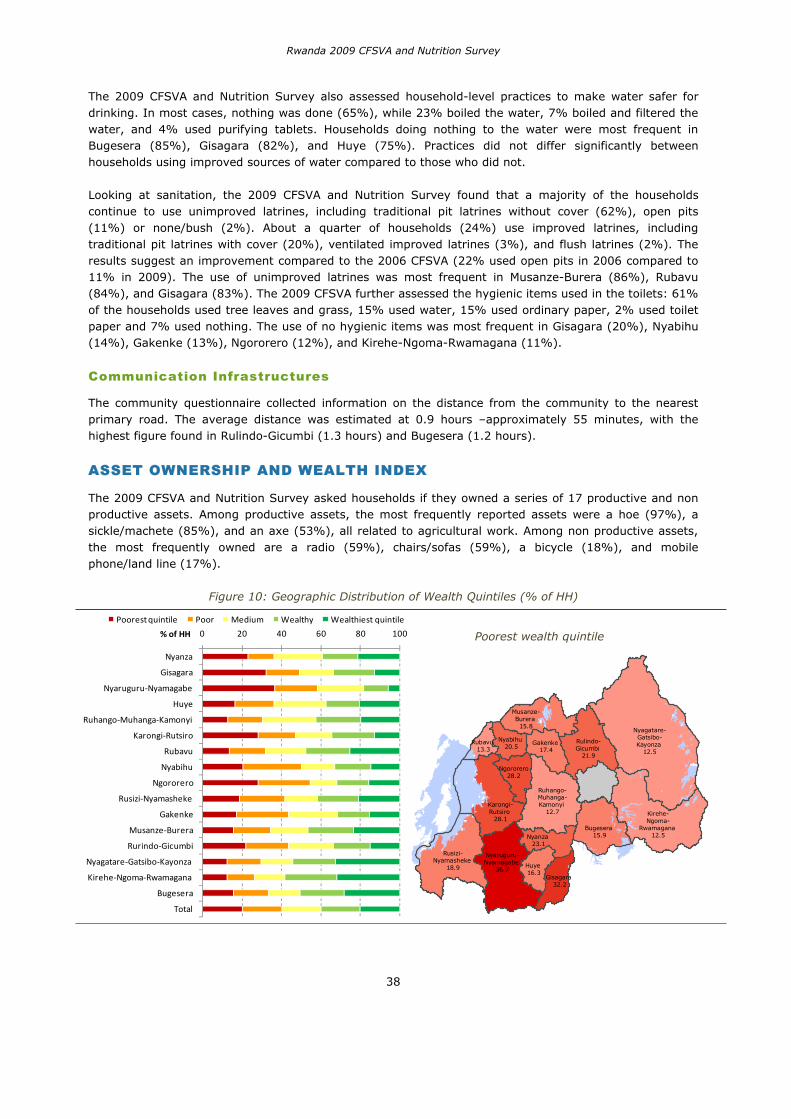
Rwanda 2009 CFSVA and Nutrition Survey
38
The 2009 CFSVA and Nutrition Survey also assessed household-level practices to make water safer for drinking. In most cases, nothing was done (65%), while 23% boiled the water, 7% boiled and filtered the water, and 4% used purifying tablets. Households doing nothing to the water were most frequent in Bugesera (85%), Gisagara (82%), and Huye (75%). Practices did not differ significantly between households using improved sources of water compared to those who did not.
Looking at sanitation, the 2009 CFSVA and Nutrition Survey found that a majority of the households continue to use unimproved latrines, including traditional pit latrines without cover (62%), open pits (11%) or none/bush (2%). About a quarter of households (24%) use improved latrines, including traditional pit latrines with cover (20%), ventilated improved latrines (3%), and flush latrines (2%). The results suggest an improvement compared to the 2006 CFSVA (22% used open pits in 2006 compared to 11% in 2009). The use of unimproved latrines was most frequent in Musanze-Burera (86%), Rubavu (84%), and Gisagara (83%). The 2009 CFSVA further assessed the hygienic items used in the toilets: 61% of the households used tree leaves and grass, 15% used water, 15% used ordinary paper, 2% used toilet paper and 7% used nothing. The use of no hygienic items was most frequent in Gisagara (20%), Nyabihu (14%), Gakenke (13%), Ngororero (12%), and Kirehe-Ngoma-Rwamagana (11%).
Communication Infrastructures
The community questionnaire collected information on the distance from the community to the nearest primary road. The average distance was estimated at 0.9 hours –approximately 55 minutes, with the highest figure found in Rulindo-Gicumbi (1.3 hours) and Bugesera (1.2 hours).
ASSET OWNERSHIP AND WEALTH INDEX
The 2009 CFSVA and Nutrition Survey asked households if they owned a series of 17 productive and non productive assets. Among productive assets, the most frequently reported assets were a hoe (97%), a sickle/machete (85%), and an axe (53%), all related to agricultural work. Among non productive assets, the most frequently owned are a radio (59%), chairs/sofas (59%), a bicycle (18%), and mobile phone/land line (17%).
Figure 10: Geographic Distribution of Wealth Quintiles (% of HH)
0 20 40 60 80 100
Nyanza
Gisagara
Nyaruguru Nyamagabe
Huye
Ruhango Muhanga Kamonyi
Karongi Rutsiro
Rubavu
Nyabihu
Ngororero
Rusizi Nyamasheke
Gakenke
Musanze Burera
Rurindo Gicumbi
Nyagatare Gatsibo Kayonza
Kirehe Ngoma Rwamagana
Bugesera
Total
% of HH
Poorestquintile Poor Medium Wealthy Wealthiest quintile
Nyagatare-Gatsibo-Kayonza
12.5
Karongi-Rutsiro
28.1Bugesera
15.9
Rusizi-Nyamasheke
18.9
Kirehe-Ngoma-
Rwamagana 12.5
Nyaruguru-Nyamagabe
36.7
Rulindo-Gicumbi
21.9
Huye 16.3
Nyanza 23.1
Musanze-Burera 15.8
Gakenke 17.4
Ngororero28.2
Nyabihu 20.5
Ruhango-Muhanga-Kamonyi
12.7
Gisagara 32.2
Rubavu 13.3
Poorest wealth quintile
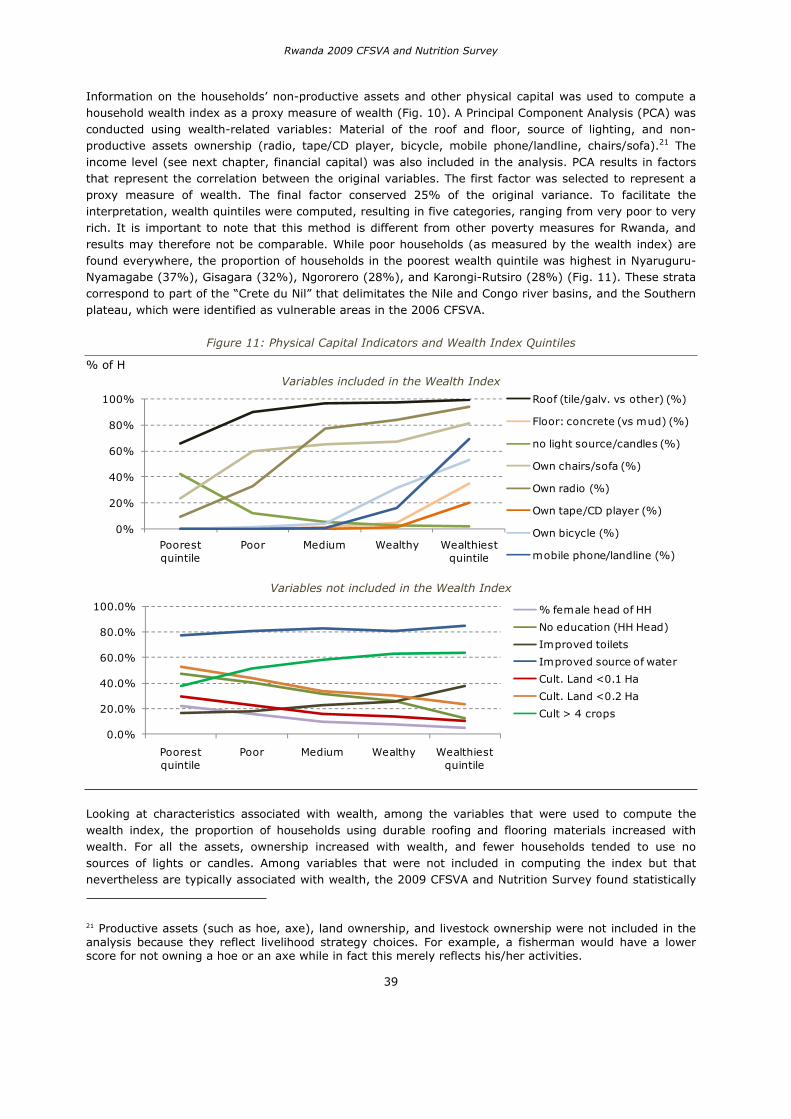
Rwanda 2009 CFSVA and Nutrition Survey
39
Information on the households’ non-productive assets and other physical capital was used to compute a household wealth index as a proxy measure of wealth (Fig. 10). A Principal Component Analysis (PCA) was conducted using wealth-related variables: Material of the roof and floor, source of lighting, and non-productive assets ownership (radio, tape/CD player, bicycle, mobile phone/landline, chairs/sofa).21 The income level (see next chapter, financial capital) was also included in the analysis. PCA results in factors that represent the correlation between the original variables. The first factor was selected to represent a proxy measure of wealth. The final factor conserved 25% of the original variance. To facilitate the interpretation, wealth quintiles were computed, resulting in five categories, ranging from very poor to very rich. It is important to note that this method is different from other poverty measures for Rwanda, and results may therefore not be comparable. While poor households (as measured by the wealth index) are found everywhere, the proportion of households in the poorest wealth quintile was highest in Nyaruguru-Nyamagabe (37%), Gisagara (32%), Ngororero (28%), and Karongi-Rutsiro (28%) (Fig. 11). These strata correspond to part of the “Crete du Nil” that delimitates the Nile and Congo river basins, and the Southern plateau, which were identified as vulnerable areas in the 2006 CFSVA.
Figure 11: Physical Capital Indicators and Wealth Index Quintiles
% of H Variables included in the Wealth Index
0%
20%
40%
60%
80%
100%
Poorest quintile
Poor Medium Wealthy Wealthiest quintile
Roof (tile/galv. vs other) (%)
Floor: concrete (vs mud) (%)
no light source/candles (%)
Own chairs/sofa (%)
Own radio (%)
Own tape/CD player (%)
Own bicycle (%)
mobile phone/landline (%)
Variables not included in the Wealth Index
0.0%
20.0%
40.0%
60.0%
80.0%
100.0%
Poorest quintile
Poor Medium Wealthy Wealthiest quintile
% female head of HH
No education (HH Head)
Improved toilets
Improved source of water
Cult. Land <0.1 Ha
Cult. Land <0.2 Ha
Cult > 4 crops
Looking at characteristics associated with wealth, among the variables that were used to compute the wealth index, the proportion of households using durable roofing and flooring materials increased with wealth. For all the assets, ownership increased with wealth, and fewer households tended to use no sources of lights or candles. Among variables that were not included in computing the index but that nevertheless are typically associated with wealth, the 2009 CFSVA and Nutrition Survey found statistically
21 Productive assets (such as hoe, axe), land ownership, and livestock ownership were not included in the analysis because they reflect livelihood strategy choices. For example, a fisherman would have a lower score for not owning a hoe or an axe while in fact this merely reflects his/her activities.
Rwanda 2009 CFSVA and Nutrition Survey
40
significant associations: (1) the proportion of female headed households decreased with wealth, (2) the average age of the household head decreased with wealth (from 41.3 in the lowest quintile to 38.4 in the richest quintile), (3) the proportion of household head with no education decreased with wealth, (4) the proportion of households using improved sources of water and improved toilets increased with wealth, (5) for household practicing agriculture, the proportion of households cultivating less than 0.1 and 0.2ha decreased with wealth (i.e. wealthier households tend to cultivate larger plots), (6) the agricultural diversity (% producing over 4 varieties) increases with wealth and (7) livestock ownership increased with wealth (from 0.2 TLU in the lowest quintile to 1.0 in the richest quintile).
In sum, the analysis of the wealth index computed using the 2009 CFSVA and Nutrition Survey suggest that poverty is most prevalent in the districts along the Crete du Nil and the southern plateau, and that poor households are more likely to have a female and/or older and/or uneducated head of household, have limited access to land and livestock, and use unimproved sources of water and sanitation. Correlations of the wealth index with livelihood outcomes (e.g. food consumption, expenditures) and nutrition will be explored in the following chapters.

Rwanda 2009 CFSVA and Nutrition Survey
41
6. ECONOMIC CAPITAL AND LIVELIHOOD STRATEGIES
INCOME AND ACTIVITIES
Income and Activities
Livelihood strategies denote the range and combination of activities and choices (including productive activities and investment strategies, etc.) made by households in order to achieve livelihood outcomes such as food security.22 The livelihood strategy analysis for the 2009 CFSVA and Nutrition Survey focuses on the combination of activities undertaken by the households. Those activities directly contribute to the economic and financial capital of the household. To capture this information, households sampled in the survey were asked to name up to four activities contributing to the livelihood of the household, by order of importance. A series of questions were designed to capture the relative contribution of each activity to the overall livelihood, and income of the households.
On average, the sample households reported 1.8 activities, with most households reporting one (33%) or two (57%) activities and few reporting three (10%). Less than 1% of the households report four activities. The main activity contributes on average to 75% of the overall livelihood of the household, and 68% of the estimated income. As could be expected in an economy dominated by agriculture, the most common activity reported by the interviewed households is agriculture: Four out of five households (82%) identify agriculture as the main activity, and 94% of the households mention agriculture among their four main activities. The proportion of households involved in agriculture is lowest in Bugesera (80%), Nyabihu (87%), Musanze-Burera (88%), and Kirehe-Ngoma-Rwamagana (89%). Everywhere else, over 90% of the households mention agriculture in their main activities.
The second most common activity was day labour (paid in kind and/or in cash: 28%), followed by livestock (farm animals rearing, sale of animals and animal products: 23%), and small trade (10%). All the other activities are mentioned by less than 7% of the households, including artisanal production, sale of agricultural products, salaries (private and public sector, NGO employees), hunting/gathering, large business, fishing, transport, aid, and remittances.
For the four main activities, households were asked to estimate the income generated by the activity. Since such estimates are generally difficult to obtain, six classes were used (0 – 5,000 RWF, 5,000 – 50,000, 50,000 - 75,000, 75,000 – 100,000, 100,000 – 200,000, and >200,000). To generate estimates of income and activity contribution, the mean of each category was used. Using this method, the mean annual income is estimated at 159,500 RWF (rounded), and the median is estimated at 115,000 RWF.23
The lowest estimate of the average annual income is found in Nyaruguru-Nyamagabe (111,500 RWF) which is also identified as the stratum with the highest proportion of households in the poorest wealth quintile.
22 DFID (1999) Sustainable Livelihoods Guidance Sheet, Department for International Development23 Measure of income and wealth lead to different households being identified as “poor” because of conceptual and methodological differences. However, the estimated income was included in computing the wealth index. As a result, both variables are strongly correlated. (Pearson Correlation 0.59, p<0.001) In this report, wealth is used as a measure of poverty rather than income poverty because it is a broader construct.
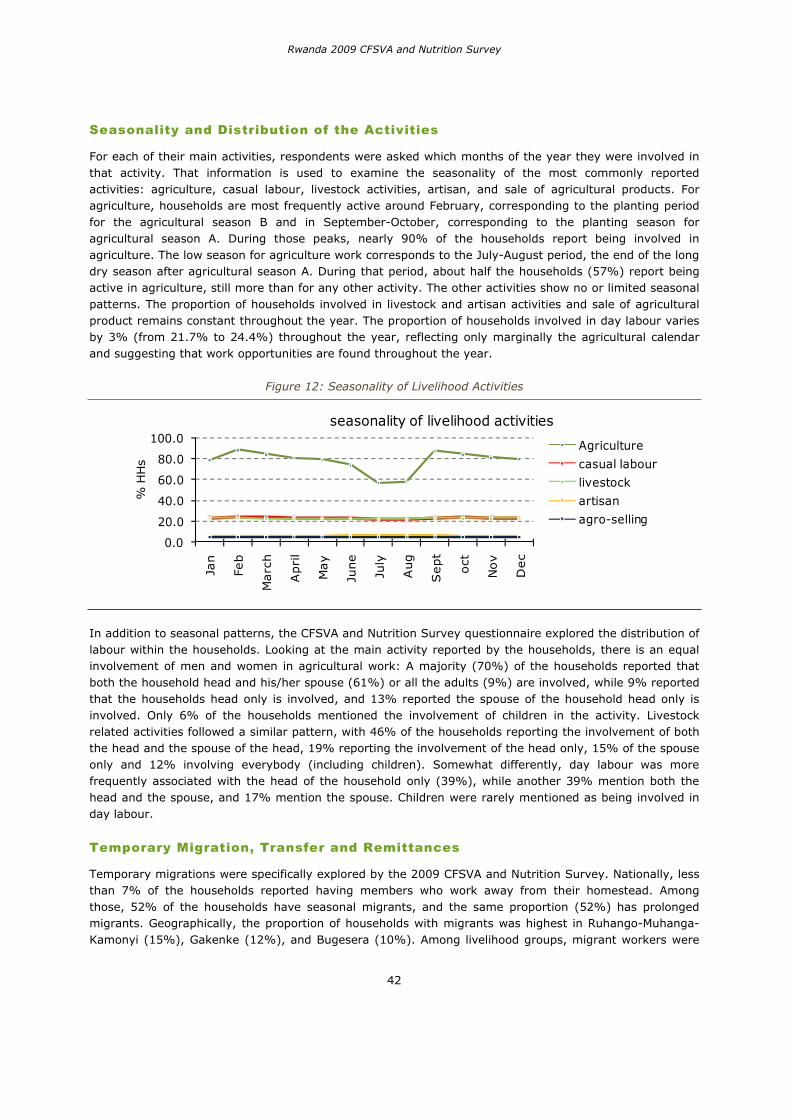
Rwanda 2009 CFSVA and Nutrition Survey
42
Seasonality and Distribution of the Activities
For each of their main activities, respondents were asked which months of the year they were involved in that activity. That information is used to examine the seasonality of the most commonly reported activities: agriculture, casual labour, livestock activities, artisan, and sale of agricultural products. For agriculture, households are most frequently active around February, corresponding to the planting period for the agricultural season B and in September-October, corresponding to the planting season for agricultural season A. During those peaks, nearly 90% of the households report being involved in agriculture. The low season for agriculture work corresponds to the July-August period, the end of the long dry season after agricultural season A. During that period, about half the households (57%) report being active in agriculture, still more than for any other activity. The other activities show no or limited seasonal patterns. The proportion of households involved in livestock and artisan activities and sale of agricultural product remains constant throughout the year. The proportion of households involved in day labour varies by 3% (from 21.7% to 24.4%) throughout the year, reflecting only marginally the agricultural calendar and suggesting that work opportunities are found throughout the year.
Figure 12: Seasonality of Livelihood Activities
0.0
20.0
40.0
60.0
80.0
100.0
Jan
Feb
Marc
h
Apri
l
May
June
July
Aug
Sept
oct
Nov
Dec
% H
Hs
seasonality of livelihood activities
Agriculture
casual labour
livestock
artisan
agro-selling
In addition to seasonal patterns, the CFSVA and Nutrition Survey questionnaire explored the distribution of labour within the households. Looking at the main activity reported by the households, there is an equal involvement of men and women in agricultural work: A majority (70%) of the households reported that both the household head and his/her spouse (61%) or all the adults (9%) are involved, while 9% reported that the households head only is involved, and 13% reported the spouse of the household head only is involved. Only 6% of the households mentioned the involvement of children in the activity. Livestock related activities followed a similar pattern, with 46% of the households reporting the involvement of both the head and the spouse of the head, 19% reporting the involvement of the head only, 15% of the spouse only and 12% involving everybody (including children). Somewhat differently, day labour was more frequently associated with the head of the household only (39%), while another 39% mention both the head and the spouse, and 17% mention the spouse. Children were rarely mentioned as being involved in day labour.
Temporary Migration, Transfer and Remittances
Temporary migrations were specifically explored by the 2009 CFSVA and Nutrition Survey. Nationally, less than 7% of the households reported having members who work away from their homestead. Among those, 52% of the households have seasonal migrants, and the same proportion (52%) has prolonged migrants. Geographically, the proportion of households with migrants was highest in Ruhango-Muhanga-Kamonyi (15%), Gakenke (12%), and Bugesera (10%). Among livelihood groups, migrant workers were
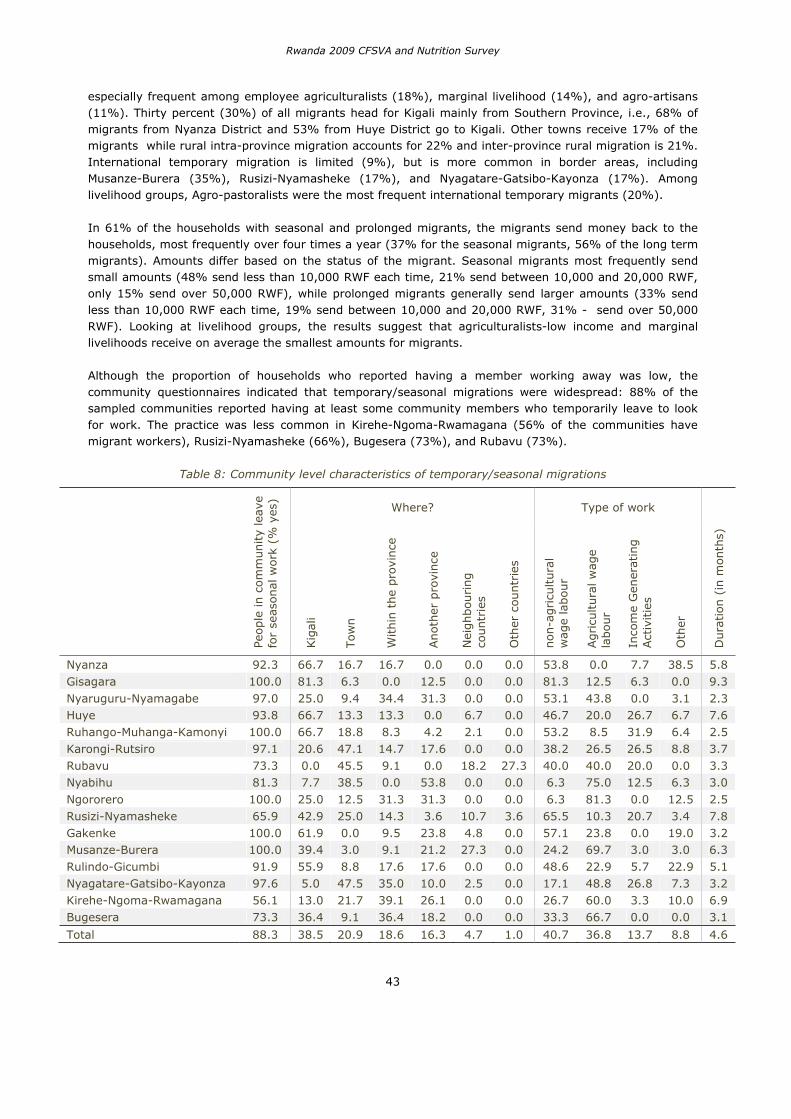
Rwanda 2009 CFSVA and Nutrition Survey
43
especially frequent among employee agriculturalists (18%), marginal livelihood (14%), and agro-artisans (11%). Thirty percent (30%) of all migrants head for Kigali mainly from Southern Province, i.e., 68% of migrants from Nyanza District and 53% from Huye District go to Kigali. Other towns receive 17% of the migrants while rural intra-province migration accounts for 22% and inter-province rural migration is 21%. International temporary migration is limited (9%), but is more common in border areas, including Musanze-Burera (35%), Rusizi-Nyamasheke (17%), and Nyagatare-Gatsibo-Kayonza (17%). Among livelihood groups, Agro-pastoralists were the most frequent international temporary migrants (20%).
In 61% of the households with seasonal and prolonged migrants, the migrants send money back to the households, most frequently over four times a year (37% for the seasonal migrants, 56% of the long term migrants). Amounts differ based on the status of the migrant. Seasonal migrants most frequently send small amounts (48% send less than 10,000 RWF each time, 21% send between 10,000 and 20,000 RWF, only 15% send over 50,000 RWF), while prolonged migrants generally send larger amounts (33% send less than 10,000 RWF each time, 19% send between 10,000 and 20,000 RWF, 31% - send over 50,000 RWF). Looking at livelihood groups, the results suggest that agriculturalists-low income and marginal livelihoods receive on average the smallest amounts for migrants.
Although the proportion of households who reported having a member working away was low, the community questionnaires indicated that temporary/seasonal migrations were widespread: 88% of the sampled communities reported having at least some community members who temporarily leave to look for work. The practice was less common in Kirehe-Ngoma-Rwamagana (56% of the communities have migrant workers), Rusizi-Nyamasheke (66%), Bugesera (73%), and Rubavu (73%).
Table 8: Community level characteristics of temporary/seasonal migrations
People
in c
om
munity
leav
e fo
r se
asonal
work
(%
yes
)
Where? Type of work
Dura
tion (
in m
onth
s)
Kig
ali
Tow
n
Within
the
pro
vince
Anoth
er p
rovi
nce
Nei
ghbou
ring
countr
ies
Oth
er c
ountr
ies
non-a
gricu
ltura
l w
age
labou
r
Agricu
ltura
l w
age
labour
Inco
me
Gen
erat
ing
Act
ivitie
s
Oth
er
Nyanza 92.3 66.7 16.7 16.7 0.0 0.0 0.0 53.8 0.0 7.7 38.5 5.8 Gisagara 100.0 81.3 6.3 0.0 12.5 0.0 0.0 81.3 12.5 6.3 0.0 9.3Nyaruguru-Nyamagabe 97.0 25.0 9.4 34.4 31.3 0.0 0.0 53.1 43.8 0.0 3.1 2.3 Huye 93.8 66.7 13.3 13.3 0.0 6.7 0.0 46.7 20.0 26.7 6.7 7.6Ruhango-Muhanga-Kamonyi 100.0 66.7 18.8 8.3 4.2 2.1 0.0 53.2 8.5 31.9 6.4 2.5 Karongi-Rutsiro 97.1 20.6 47.1 14.7 17.6 0.0 0.0 38.2 26.5 26.5 8.8 3.7Rubavu 73.3 0.0 45.5 9.1 0.0 18.2 27.3 40.0 40.0 20.0 0.0 3.3 Nyabihu 81.3 7.7 38.5 0.0 53.8 0.0 0.0 6.3 75.0 12.5 6.3 3.0Ngororero 100.0 25.0 12.5 31.3 31.3 0.0 0.0 6.3 81.3 0.0 12.5 2.5 Rusizi-Nyamasheke 65.9 42.9 25.0 14.3 3.6 10.7 3.6 65.5 10.3 20.7 3.4 7.8Gakenke 100.0 61.9 0.0 9.5 23.8 4.8 0.0 57.1 23.8 0.0 19.0 3.2 Musanze-Burera 100.0 39.4 3.0 9.1 21.2 27.3 0.0 24.2 69.7 3.0 3.0 6.3Rulindo-Gicumbi 91.9 55.9 8.8 17.6 17.6 0.0 0.0 48.6 22.9 5.7 22.9 5.1 Nyagatare-Gatsibo-Kayonza 97.6 5.0 47.5 35.0 10.0 2.5 0.0 17.1 48.8 26.8 7.3 3.2Kirehe-Ngoma-Rwamagana 56.1 13.0 21.7 39.1 26.1 0.0 0.0 26.7 60.0 3.3 10.0 6.9 Bugesera 73.3 36.4 9.1 36.4 18.2 0.0 0.0 33.3 66.7 0.0 0.0 3.1
Total 88.3 38.5 20.9 18.6 16.3 4.7 1.0 40.7 36.8 13.7 8.8 4.6
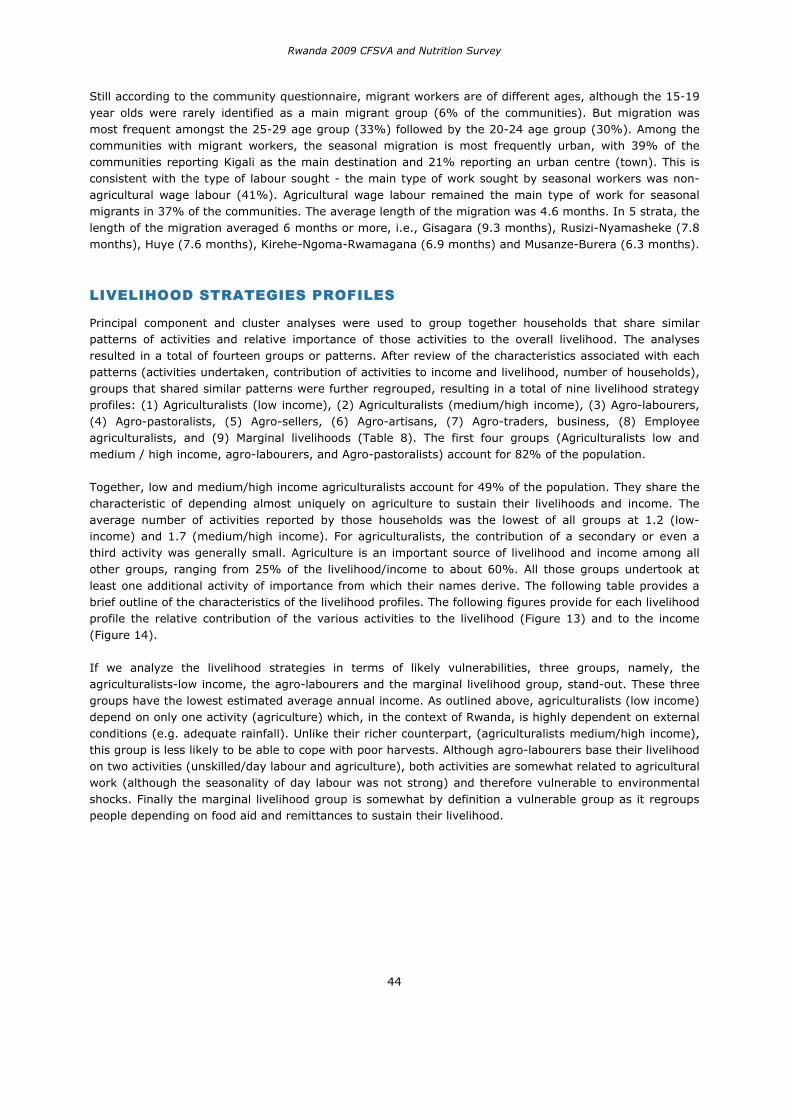
Rwanda 2009 CFSVA and Nutrition Survey
44
Still according to the community questionnaire, migrant workers are of different ages, although the 15-19 year olds were rarely identified as a main migrant group (6% of the communities). But migration was most frequent amongst the 25-29 age group (33%) followed by the 20-24 age group (30%). Among the communities with migrant workers, the seasonal migration is most frequently urban, with 39% of the communities reporting Kigali as the main destination and 21% reporting an urban centre (town). This is consistent with the type of labour sought - the main type of work sought by seasonal workers was non-agricultural wage labour (41%). Agricultural wage labour remained the main type of work for seasonal migrants in 37% of the communities. The average length of the migration was 4.6 months. In 5 strata, the length of the migration averaged 6 months or more, i.e., Gisagara (9.3 months), Rusizi-Nyamasheke (7.8 months), Huye (7.6 months), Kirehe-Ngoma-Rwamagana (6.9 months) and Musanze-Burera (6.3 months).
LIVELIHOOD STRATEGIES PROFILES
Principal component and cluster analyses were used to group together households that share similar patterns of activities and relative importance of those activities to the overall livelihood. The analyses resulted in a total of fourteen groups or patterns. After review of the characteristics associated with each patterns (activities undertaken, contribution of activities to income and livelihood, number of households), groups that shared similar patterns were further regrouped, resulting in a total of nine livelihood strategy profiles: (1) Agriculturalists (low income), (2) Agriculturalists (medium/high income), (3) Agro-labourers, (4) Agro-pastoralists, (5) Agro-sellers, (6) Agro-artisans, (7) Agro-traders, business, (8) Employee agriculturalists, and (9) Marginal livelihoods (Table 8). The first four groups (Agriculturalists low and medium / high income, agro-labourers, and Agro-pastoralists) account for 82% of the population.
Together, low and medium/high income agriculturalists account for 49% of the population. They share the characteristic of depending almost uniquely on agriculture to sustain their livelihoods and income. The average number of activities reported by those households was the lowest of all groups at 1.2 (low-income) and 1.7 (medium/high income). For agriculturalists, the contribution of a secondary or even a third activity was generally small. Agriculture is an important source of livelihood and income among all other groups, ranging from 25% of the livelihood/income to about 60%. All those groups undertook at least one additional activity of importance from which their names derive. The following table provides a brief outline of the characteristics of the livelihood profiles. The following figures provide for each livelihood profile the relative contribution of the various activities to the livelihood (Figure 13) and to the income (Figure 14).
If we analyze the livelihood strategies in terms of likely vulnerabilities, three groups, namely, the agriculturalists-low income, the agro-labourers and the marginal livelihood group, stand-out. These three groups have the lowest estimated average annual income. As outlined above, agriculturalists (low income) depend on only one activity (agriculture) which, in the context of Rwanda, is highly dependent on external conditions (e.g. adequate rainfall). Unlike their richer counterpart, (agriculturalists medium/high income), this group is less likely to be able to cope with poor harvests. Although agro-labourers base their livelihood on two activities (unskilled/day labour and agriculture), both activities are somewhat related to agricultural work (although the seasonality of day labour was not strong) and therefore vulnerable to environmental shocks. Finally the marginal livelihood group is somewhat by definition a vulnerable group as it regroups people depending on food aid and remittances to sustain their livelihood.
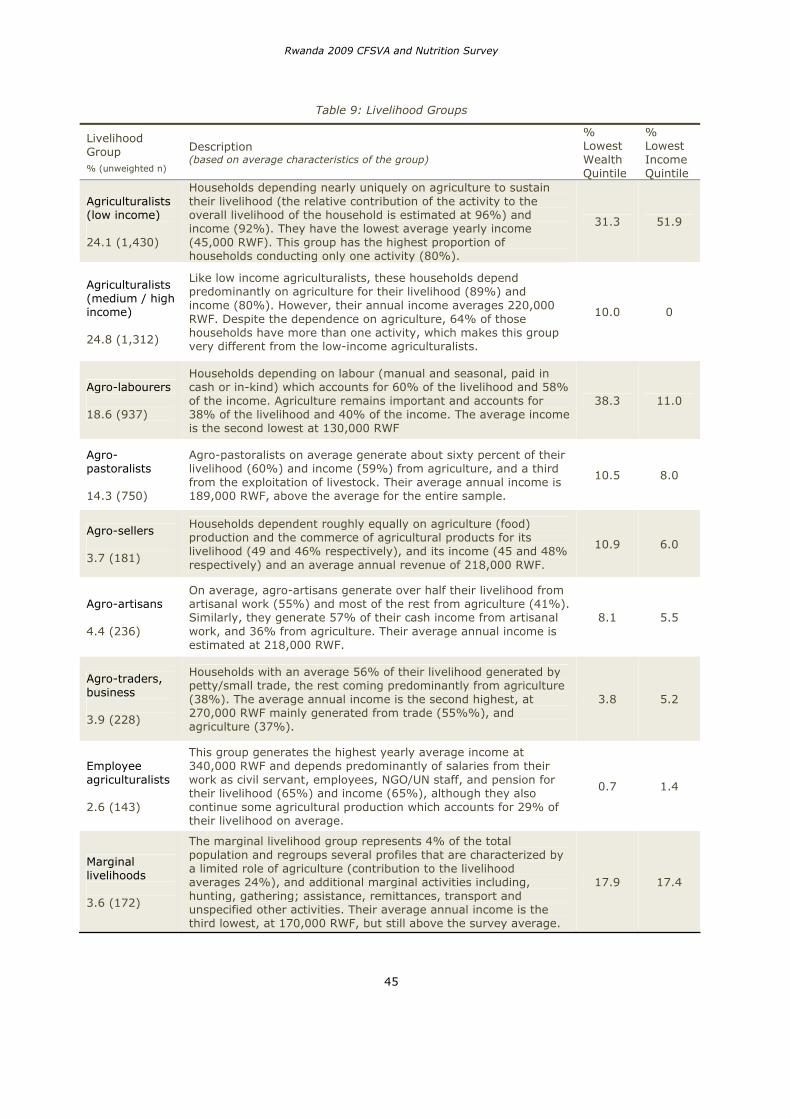
Rwanda 2009 CFSVA and Nutrition Survey
45
Table 9: Livelihood Groups
Livelihood Group
% (unweighted n)
Description (based on average characteristics of the group)
%Lowest Wealth Quintile
%Lowest Income Quintile
Agriculturalists (low income)
24.1 (1,430)
Households depending nearly uniquely on agriculture to sustain their livelihood (the relative contribution of the activity to the overall livelihood of the household is estimated at 96%) and income (92%). They have the lowest average yearly income (45,000 RWF). This group has the highest proportion of households conducting only one activity (80%).
31.3 51.9
Agriculturalists (medium / high income)
24.8 (1,312)
Like low income agriculturalists, these households depend predominantly on agriculture for their livelihood (89%) and income (80%). However, their annual income averages 220,000 RWF. Despite the dependence on agriculture, 64% of those households have more than one activity, which makes this group very different from the low-income agriculturalists.
10.0 0
Agro-labourers
18.6 (937)
Households depending on labour (manual and seasonal, paid in cash or in-kind) which accounts for 60% of the livelihood and 58% of the income. Agriculture remains important and accounts for 38% of the livelihood and 40% of the income. The average income is the second lowest at 130,000 RWF
38.3 11.0
Agro-pastoralists
14.3 (750)
Agro-pastoralists on average generate about sixty percent of their livelihood (60%) and income (59%) from agriculture, and a third from the exploitation of livestock. Their average annual income is 189,000 RWF, above the average for the entire sample.
10.5 8.0
Agro-sellers
3.7 (181)
Households dependent roughly equally on agriculture (food) production and the commerce of agricultural products for its livelihood (49 and 46% respectively), and its income (45 and 48% respectively) and an average annual revenue of 218,000 RWF.
10.9 6.0
Agro-artisans
4.4 (236)
On average, agro-artisans generate over half their livelihood from artisanal work (55%) and most of the rest from agriculture (41%). Similarly, they generate 57% of their cash income from artisanal work, and 36% from agriculture. Their average annual income is estimated at 218,000 RWF.
8.1 5.5
Agro-traders, business
3.9 (228)
Households with an average 56% of their livelihood generated by petty/small trade, the rest coming predominantly from agriculture (38%). The average annual income is the second highest, at 270,000 RWF mainly generated from trade (55%%), and agriculture (37%).
3.8 5.2
Employee agriculturalists
2.6 (143)
This group generates the highest yearly average income at 340,000 RWF and depends predominantly of salaries from their work as civil servant, employees, NGO/UN staff, and pension for their livelihood (65%) and income (65%), although they also continue some agricultural production which accounts for 29% of their livelihood on average.
0.7 1.4
Marginal livelihoods
3.6 (172)
The marginal livelihood group represents 4% of the total population and regroups several profiles that are characterized by a limited role of agriculture (contribution to the livelihood averages 24%), and additional marginal activities including, hunting, gathering; assistance, remittances, transport and unspecified other activities. Their average annual income is the third lowest, at 170,000 RWF, but still above the survey average.
17.9 17.4
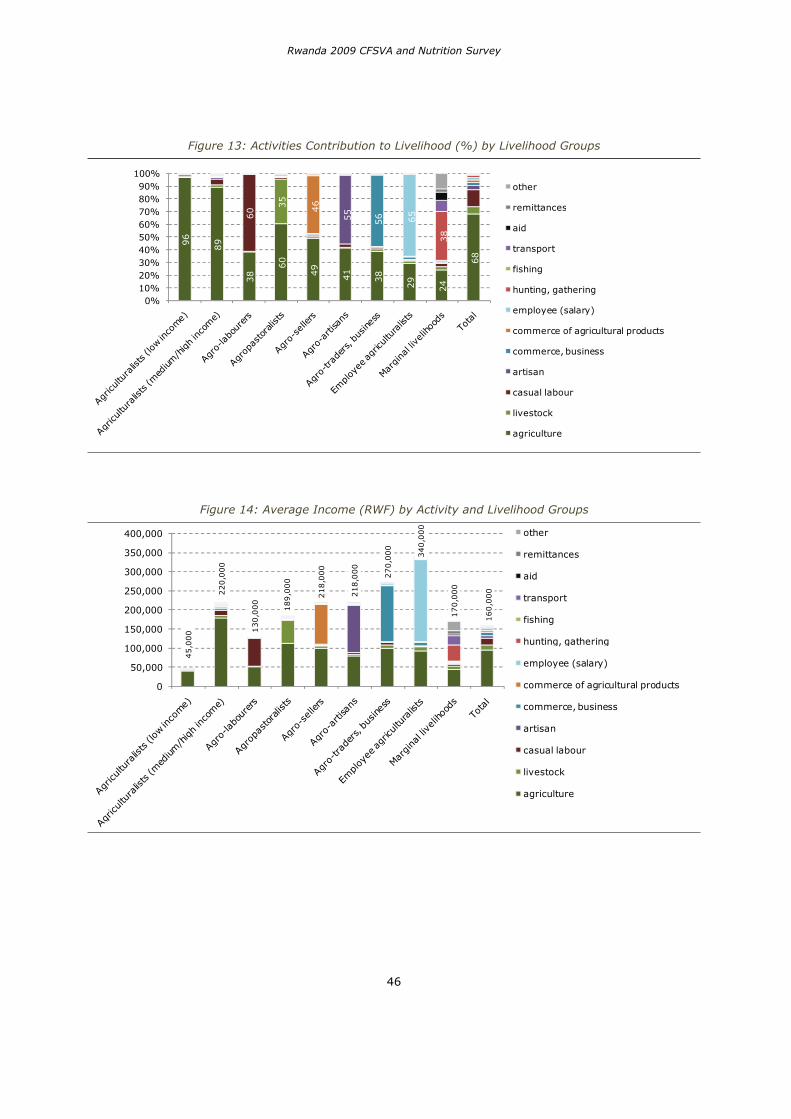
Rwanda 2009 CFSVA and Nutrition Survey
46
Figure 13: Activities Contribution to Livelihood (%) by Livelihood Groups
96
89
38
60
49
41
38
29
24
68
35
46
55
56 65
38
60
0%10%20%30%40%50%60%70%80%90%
100%other
remittances
aid
transport
fishing
hunting, gathering
employee (salary)
commerce of agricultural products
commerce, business
artisan
casual labour
livestock
agriculture
Figure 14: Average Income (RWF) by Activity and Livelihood Groups
45,0
00
220,0
00
130,0
00
189,0
00
218,0
00
218,0
00
270,0
00
340,0
00
170,0
00
160,0
00
0
50,000
100,000
150,000
200,000
250,000
300,000
350,000
400,000 other
remittances
aid
transport
fishing
hunting, gathering
employee (salary)
commerce of agricultural products
commerce, business
artisan
casual labour
livestock
agriculture
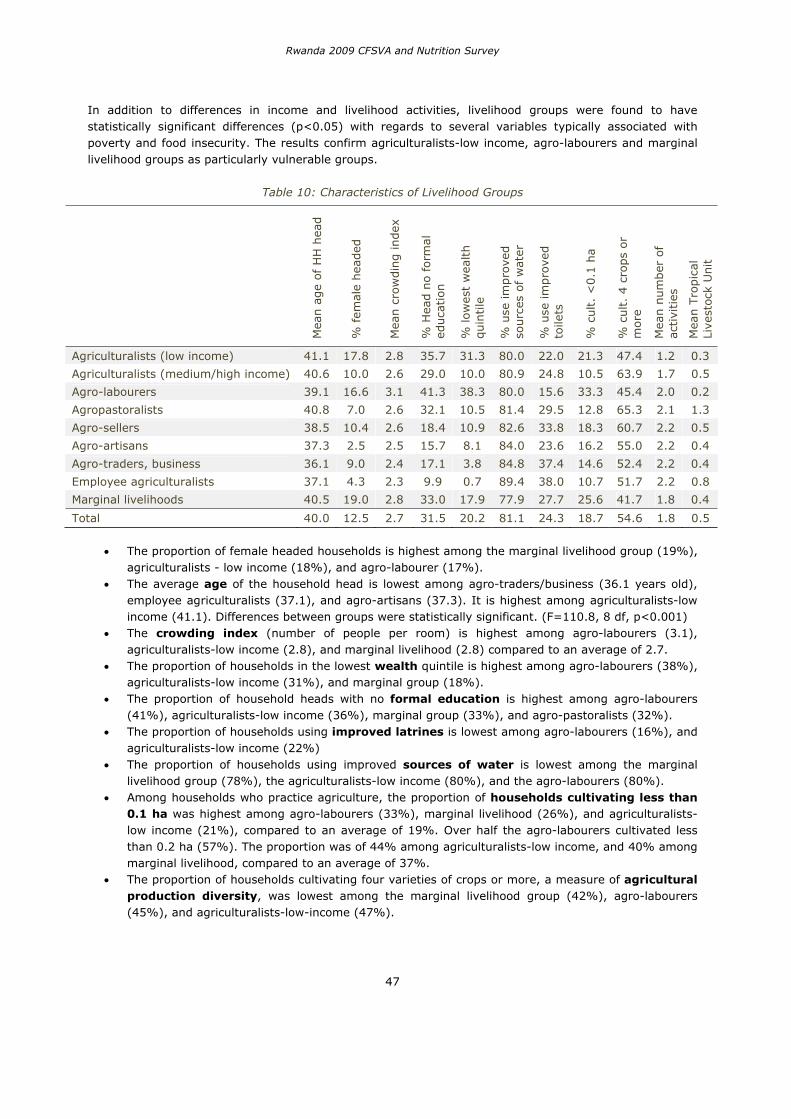
Rwanda 2009 CFSVA and Nutrition Survey
47
In addition to differences in income and livelihood activities, livelihood groups were found to have statistically significant differences (p<0.05) with regards to several variables typically associated with poverty and food insecurity. The results confirm agriculturalists-low income, agro-labourers and marginal livelihood groups as particularly vulnerable groups.
Table 10: Characteristics of Livelihood Groups
Mea
n a
ge
of H
H h
ead
% f
emal
e hea
ded
Mea
n c
row
din
g index
% H
ead n
o fo
rmal
ed
uca
tion
% low
est
wea
lth
quin
tile
% u
se im
pro
ved
sourc
es o
f w
ater
% u
se im
pro
ved
toile
ts
% c
ult.
<0.1
ha
% c
ult.
4 c
rops
or
more
Mea
n n
um
ber
of
activi
ties
Mea
n T
ropic
al
Live
stoc
k U
nit
Agriculturalists (low income) 41.1 17.8 2.8 35.7 31.3 80.0 22.0 21.3 47.4 1.2 0.3
Agriculturalists (medium/high income) 40.6 10.0 2.6 29.0 10.0 80.9 24.8 10.5 63.9 1.7 0.5
Agro-labourers 39.1 16.6 3.1 41.3 38.3 80.0 15.6 33.3 45.4 2.0 0.2
Agropastoralists 40.8 7.0 2.6 32.1 10.5 81.4 29.5 12.8 65.3 2.1 1.3
Agro-sellers 38.5 10.4 2.6 18.4 10.9 82.6 33.8 18.3 60.7 2.2 0.5
Agro-artisans 37.3 2.5 2.5 15.7 8.1 84.0 23.6 16.2 55.0 2.2 0.4
Agro-traders, business 36.1 9.0 2.4 17.1 3.8 84.8 37.4 14.6 52.4 2.2 0.4
Employee agriculturalists 37.1 4.3 2.3 9.9 0.7 89.4 38.0 10.7 51.7 2.2 0.8
Marginal livelihoods 40.5 19.0 2.8 33.0 17.9 77.9 27.7 25.6 41.7 1.8 0.4
Total 40.0 12.5 2.7 31.5 20.2 81.1 24.3 18.7 54.6 1.8 0.5
The proportion of female headed households is highest among the marginal livelihood group (19%), agriculturalists - low income (18%), and agro-labourer (17%). The average age of the household head is lowest among agro-traders/business (36.1 years old), employee agriculturalists (37.1), and agro-artisans (37.3). It is highest among agriculturalists-low income (41.1). Differences between groups were statistically significant. (F=110.8, 8 df, p<0.001) The crowding index (number of people per room) is highest among agro-labourers (3.1), agriculturalists-low income (2.8), and marginal livelihood (2.8) compared to an average of 2.7. The proportion of households in the lowest wealth quintile is highest among agro-labourers (38%), agriculturalists-low income (31%), and marginal group (18%). The proportion of household heads with no formal education is highest among agro-labourers (41%), agriculturalists-low income (36%), marginal group (33%), and agro-pastoralists (32%). The proportion of households using improved latrines is lowest among agro-labourers (16%), and agriculturalists-low income (22%) The proportion of households using improved sources of water is lowest among the marginal livelihood group (78%), the agriculturalists-low income (80%), and the agro-labourers (80%). Among households who practice agriculture, the proportion of households cultivating less than 0.1 ha was highest among agro-labourers (33%), marginal livelihood (26%), and agriculturalists-low income (21%), compared to an average of 19%. Over half the agro-labourers cultivated less than 0.2 ha (57%). The proportion was of 44% among agriculturalists-low income, and 40% among marginal livelihood, compared to an average of 37%. The proportion of households cultivating four varieties of crops or more, a measure of agricultural production diversity, was lowest among the marginal livelihood group (42%), agro-labourers (45%), and agriculturalists-low-income (47%).
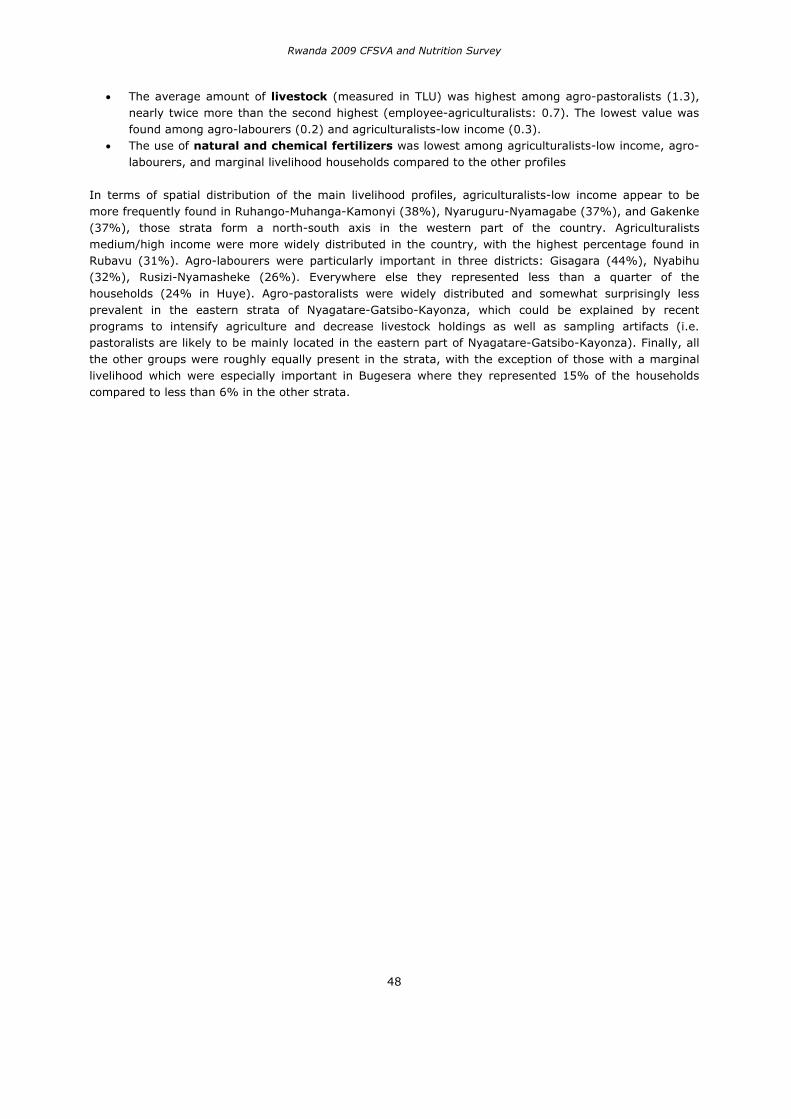
Rwanda 2009 CFSVA and Nutrition Survey
48
The average amount of livestock (measured in TLU) was highest among agro-pastoralists (1.3), nearly twice more than the second highest (employee-agriculturalists: 0.7). The lowest value was found among agro-labourers (0.2) and agriculturalists-low income (0.3). The use of natural and chemical fertilizers was lowest among agriculturalists-low income, agro-labourers, and marginal livelihood households compared to the other profiles
In terms of spatial distribution of the main livelihood profiles, agriculturalists-low income appear to be more frequently found in Ruhango-Muhanga-Kamonyi (38%), Nyaruguru-Nyamagabe (37%), and Gakenke (37%), those strata form a north-south axis in the western part of the country. Agriculturalists medium/high income were more widely distributed in the country, with the highest percentage found in Rubavu (31%). Agro-labourers were particularly important in three districts: Gisagara (44%), Nyabihu (32%), Rusizi-Nyamasheke (26%). Everywhere else they represented less than a quarter of the households (24% in Huye). Agro-pastoralists were widely distributed and somewhat surprisingly less prevalent in the eastern strata of Nyagatare-Gatsibo-Kayonza, which could be explained by recent programs to intensify agriculture and decrease livestock holdings as well as sampling artifacts (i.e. pastoralists are likely to be mainly located in the eastern part of Nyagatare-Gatsibo-Kayonza). Finally, all the other groups were roughly equally present in the strata, with the exception of those with a marginal livelihood which were especially important in Bugesera where they represented 15% of the households compared to less than 6% in the other strata.
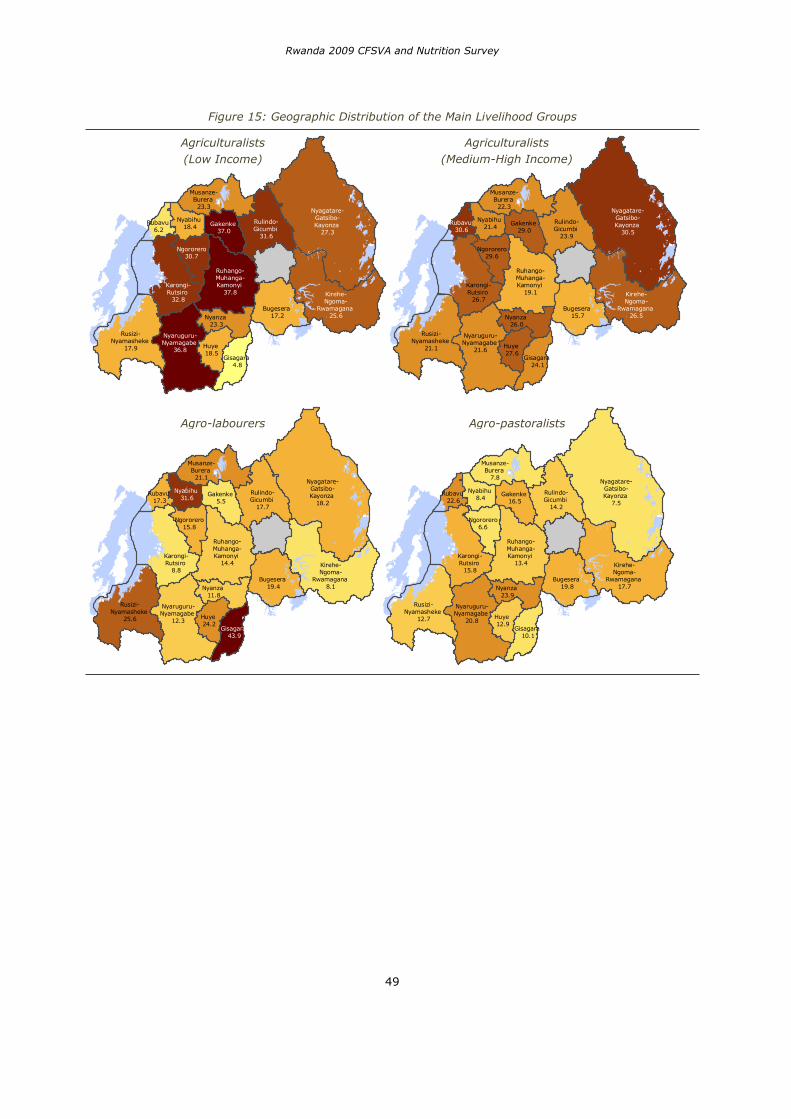
Rwanda 2009 CFSVA and Nutrition Survey
49
Figure 15: Geographic Distribution of the Main Livelihood Groups
Nyagatare-Gatsibo-Kayonza
27.3
Karongi-Rutsiro
32.8Bugesera
17.2
Rusizi-Nyamasheke
17.9
Kirehe-Ngoma-
Rwamagana 25.6
Nyaruguru-Nyamagabe
36.8
Rulindo-Gicumbi
31.6
Huye 18.5
Nyanza 23.3
Musanze-Burera 23.3
Gakenke 37.0
Ngororero30.7
Nyabihu 18.4
Ruhango-Muhanga-Kamonyi
37.8
Gisagara 4.8
Rubavu 6.2
Nyagatare-Gatsibo-Kayonza
30.5
Karongi-Rutsiro
26.7Bugesera
15.7
Rusizi-Nyamasheke
21.1
Kirehe-Ngoma-
Rwamagana 26.5
Nyaruguru-Nyamagabe
21.6
Rulindo-Gicumbi
23.9
Huye 27.6
Nyanza 26.0
Musanze-Burera 22.3
Gakenke 29.0
Ngororero29.6
Nyabihu 21.4
Ruhango-Muhanga-Kamonyi
19.1
Gisagara 24.1
Rubavu 30.6
Nyagatare-Gatsibo-Kayonza
18.2
Karongi-Rutsiro
8.8Bugesera
19.4
Rusizi-Nyamasheke
25.6
Kirehe-Ngoma-
Rwamagana 8.1
Nyaruguru-Nyamagabe
12.3
Rulindo-Gicumbi
17.7
Huye 24.2
Nyanza 11.8
Musanze-Burera
21.1
Gakenke 5.5
Ngororero15.8
Nyabihu 31.6
Ruhango-Muhanga-Kamonyi
14.4
Gisagara 43.9
Rubavu 17.3
Nyagatare-Gatsibo-Kayonza
7.5
Karongi-Rutsiro
15.8Bugesera
19.8
Rusizi-Nyamasheke
12.7
Kirehe-Ngoma-
Rwamagana 17.7
Nyaruguru-Nyamagabe
20.8
Rulindo-Gicumbi
14.2
Huye 12.9
Nyanza 23.9
Musanze-Burera
7.8
Gakenke 16.5
Ngororero6.6
Nyabihu 8.4
Ruhango-Muhanga-Kamonyi
13.4
Gisagara 10.1
Rubavu 22.6
Agriculturalists (Low Income)
Agriculturalists (Medium-High Income)
Agro-labourers Agro-pastoralists
Rwanda 2009 CFSVA and Nutrition Survey
50
EXPENDITURES
The 2009 CFSVA and Nutrition Survey collected information on cash, credit and trade forms of expenditure at the household level. For 15 food items and 7 non-food items, expenditures were recorded using a 30 day recall period. For 10 additional non-food items that are less frequently purchased (e.g. medical care, tools etc.), a 6 month recall period was used. The expenditures were then converted to food, non-food and total household monthly expenditures and per capita monthly expenditures. Proportions of food and non-food expenditures in the total expenditures were examined at the aggregated level. The data are used to examine patterns of expenditure, especially the proportion of food expenditure. Although the 2009 CFSVA and Nutrition Survey is not a comprehensive expenditure survey and absolute values of expenditure are only approximated (as are income), the results provide a good basis for comparison between groups. The estimates of the household income and household expenditure yield different results. However, it should be noted that both variables are computed using very different methods each with its own limitations, for example, the household income is based on an extrapolation using the cash contribution of up to the four main activities. The expenditure is based on a list of expenses on food and non-food items. This list may not cover all expenses and does not include possible savings. Both indicators may be affected by inaccurate recalls. However, both indicators yield consistent results (e.g. low income agriculturalists and agro-labourers have the lowest income and average total expenditure) and were showed to be statistically significantly associated (Pearson Correlation 0.33, p<0.001)
Food and Non-Food Expenditures
The monthly expenditure averaged 27,500 RWF among the sampled households, of which, on average, 45% (approx 12,500 RWF) is spent on food items, and 55% on non-food items (15,000 RWF). Most of the expenditures are made in cash (96%), with credit accounting for 3%, and barter for 1%. Expenditures vary across livelihood groups, with the lowest average expenditures in absolute value found among agro-labourers (16,000 RWF) and low-income agriculturalists (17,500 RWF). It is also among those two groups that food-items have the largest share of the expenditure (respectively 62% and 53%), the only groups where food items account for over 50% of the expenditures. These results further highlight the vulnerability of the two groups who generate limited income, have limited expenditures, and mostly spend on food items, limiting their ability to invest in other livelihood assets. The marginal livelihood group which was also identified as vulnerable shows absolute values (roughly 30,000RWF) and distribution of food/non food expenditures (45%/55%) similar to those of agriculturalists-medium/high income. However, it is the group for which the proportion of credit and barter in the total expenditure was highest (6% compared to an average of 4%).
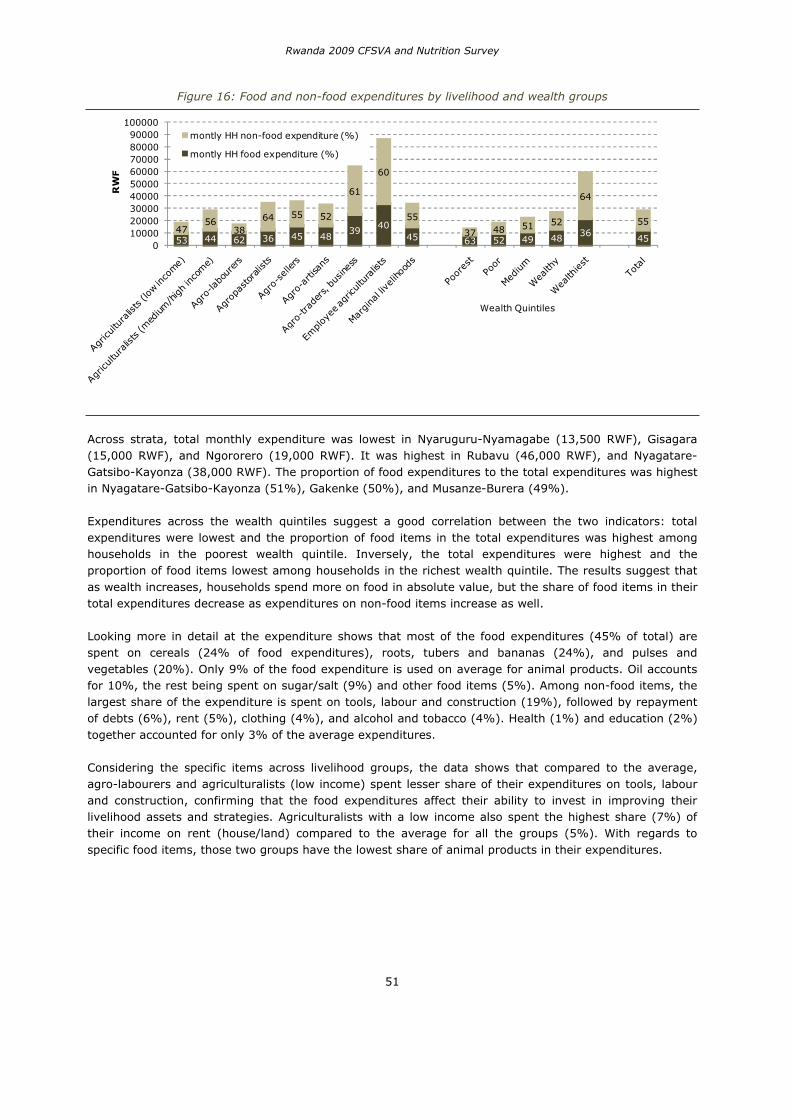
Rwanda 2009 CFSVA and Nutrition Survey
51
Figure 16: Food and non-food expenditures by livelihood and wealth groups
53 44 62 36 45 4839
4045 63 52 49 48 36
4547
5638
64 55 52
61
60
55
37 48 51 52
64
55
0100002000030000400005000060000700008000090000
100000R
WF
Wealth Quintiles
montly HH non-food expenditure (%)
montly HH food expenditure (%)
Across strata, total monthly expenditure was lowest in Nyaruguru-Nyamagabe (13,500 RWF), Gisagara (15,000 RWF), and Ngororero (19,000 RWF). It was highest in Rubavu (46,000 RWF), and Nyagatare-Gatsibo-Kayonza (38,000 RWF). The proportion of food expenditures to the total expenditures was highest in Nyagatare-Gatsibo-Kayonza (51%), Gakenke (50%), and Musanze-Burera (49%).
Expenditures across the wealth quintiles suggest a good correlation between the two indicators: total expenditures were lowest and the proportion of food items in the total expenditures was highest among households in the poorest wealth quintile. Inversely, the total expenditures were highest and the proportion of food items lowest among households in the richest wealth quintile. The results suggest that as wealth increases, households spend more on food in absolute value, but the share of food items in their total expenditures decrease as expenditures on non-food items increase as well.
Looking more in detail at the expenditure shows that most of the food expenditures (45% of total) are spent on cereals (24% of food expenditures), roots, tubers and bananas (24%), and pulses and vegetables (20%). Only 9% of the food expenditure is used on average for animal products. Oil accounts for 10%, the rest being spent on sugar/salt (9%) and other food items (5%). Among non-food items, the largest share of the expenditure is spent on tools, labour and construction (19%), followed by repayment of debts (6%), rent (5%), clothing (4%), and alcohol and tobacco (4%). Health (1%) and education (2%) together accounted for only 3% of the average expenditures.
Considering the specific items across livelihood groups, the data shows that compared to the average, agro-labourers and agriculturalists (low income) spent lesser share of their expenditures on tools, labour and construction, confirming that the food expenditures affect their ability to invest in improving their livelihood assets and strategies. Agriculturalists with a low income also spent the highest share (7%) of their income on rent (house/land) compared to the average for all the groups (5%). With regards to specific food items, those two groups have the lowest share of animal products in their expenditures.
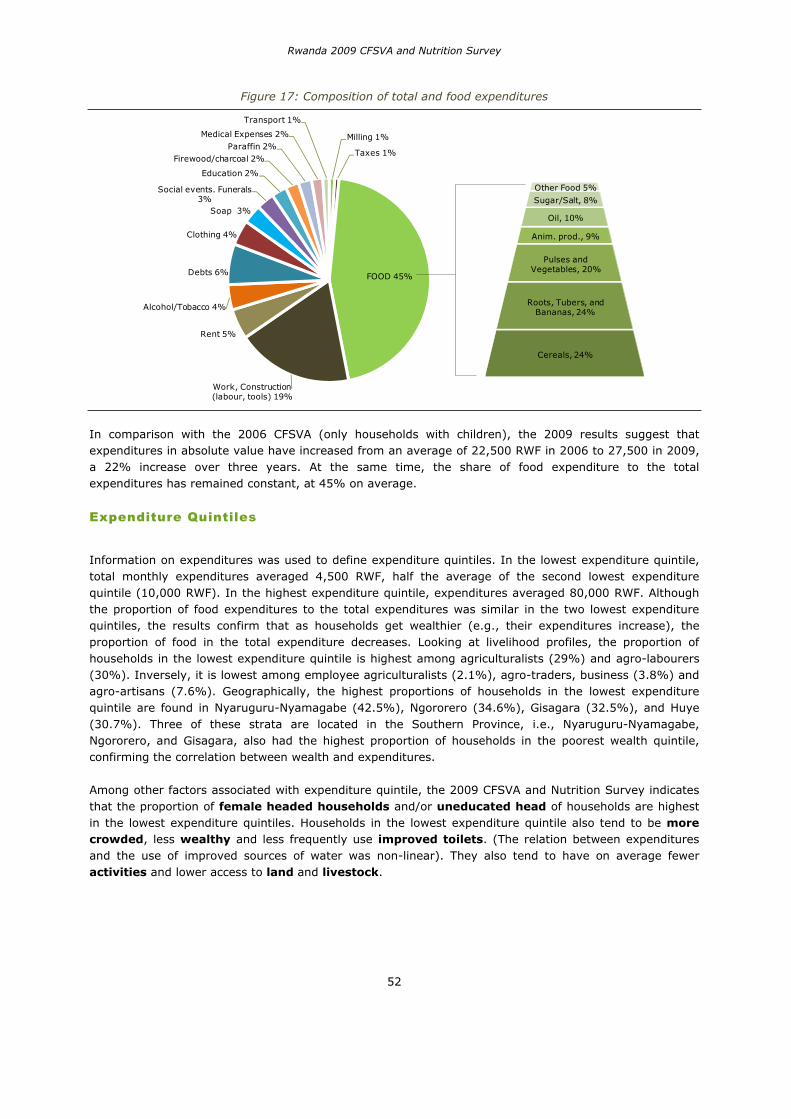
Rwanda 2009 CFSVA and Nutrition Survey
52
Figure 17: Composition of total and food expenditures
Milling 1%
Taxes 1%
FOOD 45%
Work, Construction (labour, tools) 19%
Rent 5%
Alcohol/Tobacco 4%
Debts 6%
Clothing 4%
Soap 3%
Social events. Funerals 3%
Education 2%
Firewood/charcoal 2%Paraffin 2%
Medical Expenses 2%
Transport 1%
Cereals, 24%
Roots, Tubers, and Bananas, 24%
Pulses and Vegetables, 20%
Anim. prod., 9%
Oil, 10%
Sugar/Salt, 8%
Other Food 5%
In comparison with the 2006 CFSVA (only households with children), the 2009 results suggest that expenditures in absolute value have increased from an average of 22,500 RWF in 2006 to 27,500 in 2009, a 22% increase over three years. At the same time, the share of food expenditure to the total expenditures has remained constant, at 45% on average.
Expenditure Quintiles
Information on expenditures was used to define expenditure quintiles. In the lowest expenditure quintile, total monthly expenditures averaged 4,500 RWF, half the average of the second lowest expenditure quintile (10,000 RWF). In the highest expenditure quintile, expenditures averaged 80,000 RWF. Although the proportion of food expenditures to the total expenditures was similar in the two lowest expenditure quintiles, the results confirm that as households get wealthier (e.g., their expenditures increase), the proportion of food in the total expenditure decreases. Looking at livelihood profiles, the proportion of households in the lowest expenditure quintile is highest among agriculturalists (29%) and agro-labourers (30%). Inversely, it is lowest among employee agriculturalists (2.1%), agro-traders, business (3.8%) and agro-artisans (7.6%). Geographically, the highest proportions of households in the lowest expenditure quintile are found in Nyaruguru-Nyamagabe (42.5%), Ngororero (34.6%), Gisagara (32.5%), and Huye (30.7%). Three of these strata are located in the Southern Province, i.e., Nyaruguru-Nyamagabe, Ngororero, and Gisagara, also had the highest proportion of households in the poorest wealth quintile, confirming the correlation between wealth and expenditures.
Among other factors associated with expenditure quintile, the 2009 CFSVA and Nutrition Survey indicates that the proportion of female headed households and/or uneducated head of households are highest in the lowest expenditure quintiles. Households in the lowest expenditure quintile also tend to be more crowded, less wealthy and less frequently use improved toilets. (The relation between expenditures and the use of improved sources of water was non-linear). They also tend to have on average fewer activities and lower access to land and livestock.
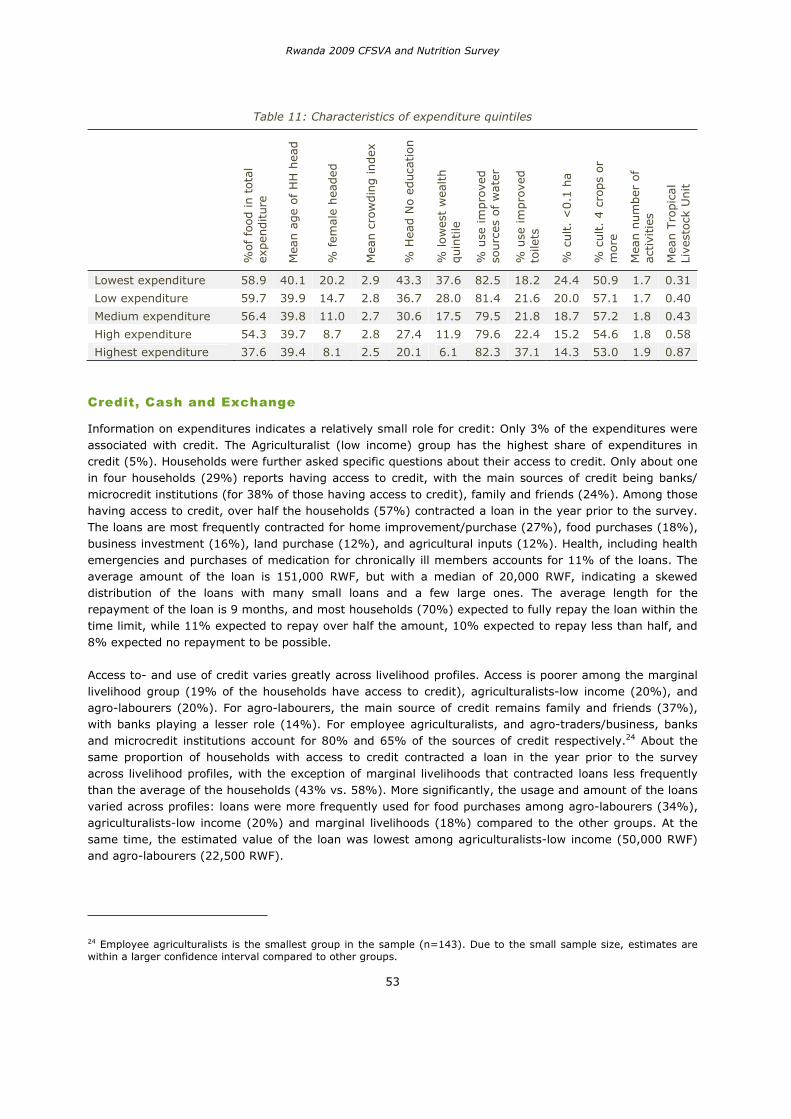
Rwanda 2009 CFSVA and Nutrition Survey
53
Table 11: Characteristics of expenditure quintiles
%of
foo
d in t
otal
ex
pen
diture
Mea
n a
ge
of H
H h
ead
% fem
ale
hea
ded
Mea
n c
row
din
g index
% H
ead N
o ed
uca
tion
% low
est
wea
lth
quin
tile
% u
se im
pro
ved
sourc
es o
f w
ater
% u
se im
pro
ved
toile
ts
% c
ult.
<0.1
ha
% c
ult.
4 c
rops
or
mor
e
Mea
n n
um
ber
of
activi
ties
Mea
n T
ropic
al
Live
stoc
k U
nit
Lowest expenditure 58.9 40.1 20.2 2.9 43.3 37.6 82.5 18.2 24.4 50.9 1.7 0.31
Low expenditure 59.7 39.9 14.7 2.8 36.7 28.0 81.4 21.6 20.0 57.1 1.7 0.40
Medium expenditure 56.4 39.8 11.0 2.7 30.6 17.5 79.5 21.8 18.7 57.2 1.8 0.43
High expenditure 54.3 39.7 8.7 2.8 27.4 11.9 79.6 22.4 15.2 54.6 1.8 0.58
Highest expenditure 37.6 39.4 8.1 2.5 20.1 6.1 82.3 37.1 14.3 53.0 1.9 0.87
Credit, Cash and Exchange
Information on expenditures indicates a relatively small role for credit: Only 3% of the expenditures were associated with credit. The Agriculturalist (low income) group has the highest share of expenditures in credit (5%). Households were further asked specific questions about their access to credit. Only about one in four households (29%) reports having access to credit, with the main sources of credit being banks/ microcredit institutions (for 38% of those having access to credit), family and friends (24%). Among those having access to credit, over half the households (57%) contracted a loan in the year prior to the survey. The loans are most frequently contracted for home improvement/purchase (27%), food purchases (18%), business investment (16%), land purchase (12%), and agricultural inputs (12%). Health, including health emergencies and purchases of medication for chronically ill members accounts for 11% of the loans. The average amount of the loan is 151,000 RWF, but with a median of 20,000 RWF, indicating a skewed distribution of the loans with many small loans and a few large ones. The average length for the repayment of the loan is 9 months, and most households (70%) expected to fully repay the loan within the time limit, while 11% expected to repay over half the amount, 10% expected to repay less than half, and 8% expected no repayment to be possible.
Access to- and use of credit varies greatly across livelihood profiles. Access is poorer among the marginal livelihood group (19% of the households have access to credit), agriculturalists-low income (20%), and agro-labourers (20%). For agro-labourers, the main source of credit remains family and friends (37%), with banks playing a lesser role (14%). For employee agriculturalists, and agro-traders/business, banks and microcredit institutions account for 80% and 65% of the sources of credit respectively.24 About the same proportion of households with access to credit contracted a loan in the year prior to the survey across livelihood profiles, with the exception of marginal livelihoods that contracted loans less frequently than the average of the households (43% vs. 58%). More significantly, the usage and amount of the loans varied across profiles: loans were more frequently used for food purchases among agro-labourers (34%), agriculturalists-low income (20%) and marginal livelihoods (18%) compared to the other groups. At the same time, the estimated value of the loan was lowest among agriculturalists-low income (50,000 RWF) and agro-labourers (22,500 RWF).
24 Employee agriculturalists is the smallest group in the sample (n=143). Due to the small sample size, estimates are within a larger confidence interval compared to other groups.
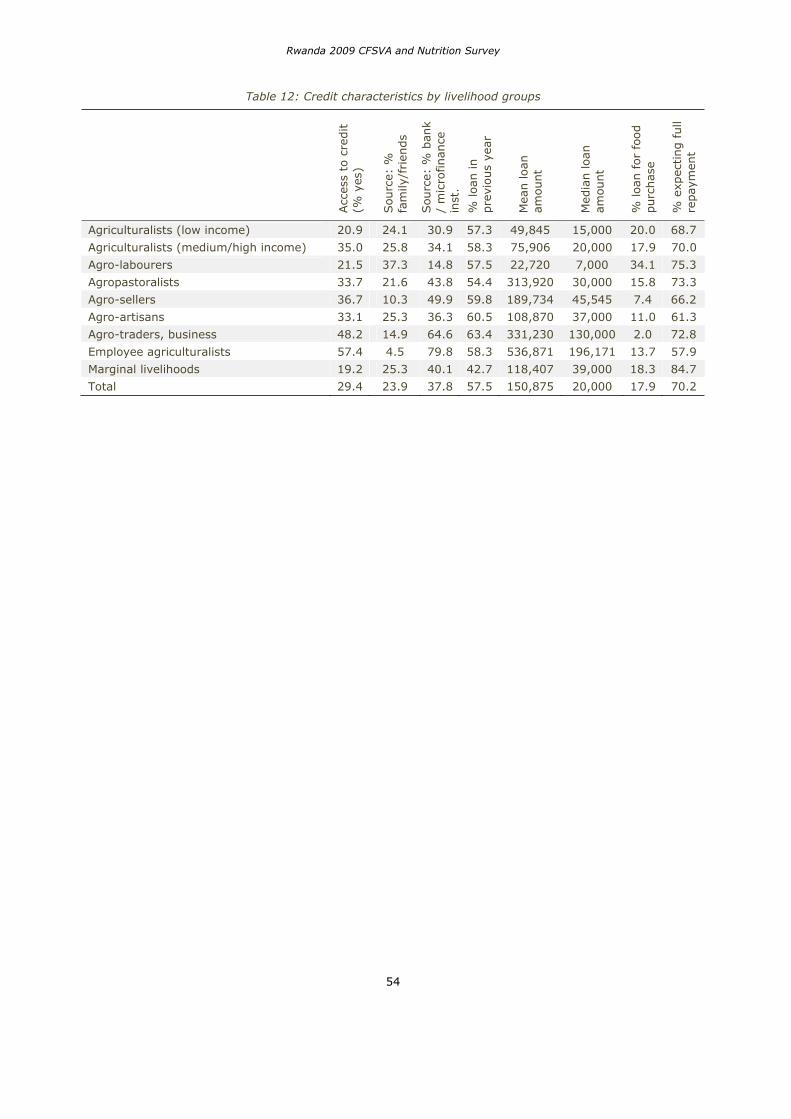
Rwanda 2009 CFSVA and Nutrition Survey
54
Table 12: Credit characteristics by livelihood groups
Acc
ess
to c
redit
(% y
es)
Sou
rce:
%
fam
ily/f
rien
ds
Sou
rce:
% b
ank
/ m
icro
finan
ce
inst
.
% loa
n in
pre
vious
year
Mea
n loan
am
ount
Med
ian loa
n
amou
nt
% loa
n f
or
food
purc
has
e
% e
xpec
ting f
ull
repay
men
t
Agriculturalists (low income) 20.9 24.1 30.9 57.3 49,845 15,000 20.0 68.7
Agriculturalists (medium/high income) 35.0 25.8 34.1 58.3 75,906 20,000 17.9 70.0
Agro-labourers 21.5 37.3 14.8 57.5 22,720 7,000 34.1 75.3
Agropastoralists 33.7 21.6 43.8 54.4 313,920 30,000 15.8 73.3
Agro-sellers 36.7 10.3 49.9 59.8 189,734 45,545 7.4 66.2
Agro-artisans 33.1 25.3 36.3 60.5 108,870 37,000 11.0 61.3
Agro-traders, business 48.2 14.9 64.6 63.4 331,230 130,000 2.0 72.8
Employee agriculturalists 57.4 4.5 79.8 58.3 536,871 196,171 13.7 57.9
Marginal livelihoods 19.2 25.3 40.1 42.7 118,407 39,000 18.3 84.7
Total 29.4 23.9 37.8 57.5 150,875 20,000 17.9 70.2
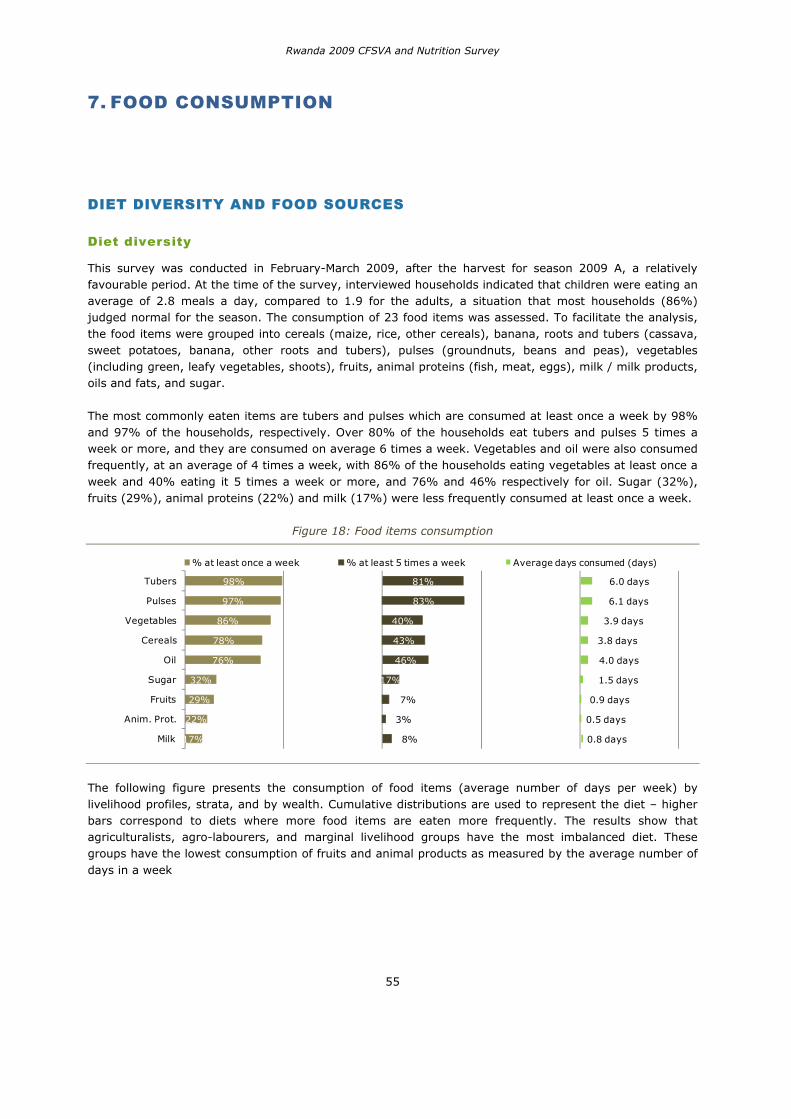
Rwanda 2009 CFSVA and Nutrition Survey
55
7. FOOD CONSUMPTION
DIET DIVERSITY AND FOOD SOURCES
Diet diversity
This survey was conducted in February-March 2009, after the harvest for season 2009 A, a relatively favourable period. At the time of the survey, interviewed households indicated that children were eating an average of 2.8 meals a day, compared to 1.9 for the adults, a situation that most households (86%) judged normal for the season. The consumption of 23 food items was assessed. To facilitate the analysis, the food items were grouped into cereals (maize, rice, other cereals), banana, roots and tubers (cassava, sweet potatoes, banana, other roots and tubers), pulses (groundnuts, beans and peas), vegetables (including green, leafy vegetables, shoots), fruits, animal proteins (fish, meat, eggs), milk / milk products, oils and fats, and sugar.
The most commonly eaten items are tubers and pulses which are consumed at least once a week by 98% and 97% of the households, respectively. Over 80% of the households eat tubers and pulses 5 times a week or more, and they are consumed on average 6 times a week. Vegetables and oil were also consumed frequently, at an average of 4 times a week, with 86% of the households eating vegetables at least once a week and 40% eating it 5 times a week or more, and 76% and 46% respectively for oil. Sugar (32%), fruits (29%), animal proteins (22%) and milk (17%) were less frequently consumed at least once a week.
Figure 18: Food items consumption
98%
97%
86%
78%
76%
32%
29%
22%
17%
81%
83%
40%
43%
46%
17%
7%
3%
8%
6.0 days
6.1 days
3.9 days
3.8 days
4.0 days
1.5 days
0.9 days
0.5 days
0.8 days
Tubers
Pulses
Vegetables
Cereals
Oil
Sugar
Fruits
Anim. Prot.
Milk
% at least once a week % at least 5 times a week Average days consumed (days)
The following figure presents the consumption of food items (average number of days per week) by livelihood profiles, strata, and by wealth. Cumulative distributions are used to represent the diet – higher bars correspond to diets where more food items are eaten more frequently. The results show that agriculturalists, agro-labourers, and marginal livelihood groups have the most imbalanced diet. These groups have the lowest consumption of fruits and animal products as measured by the average number of days in a week
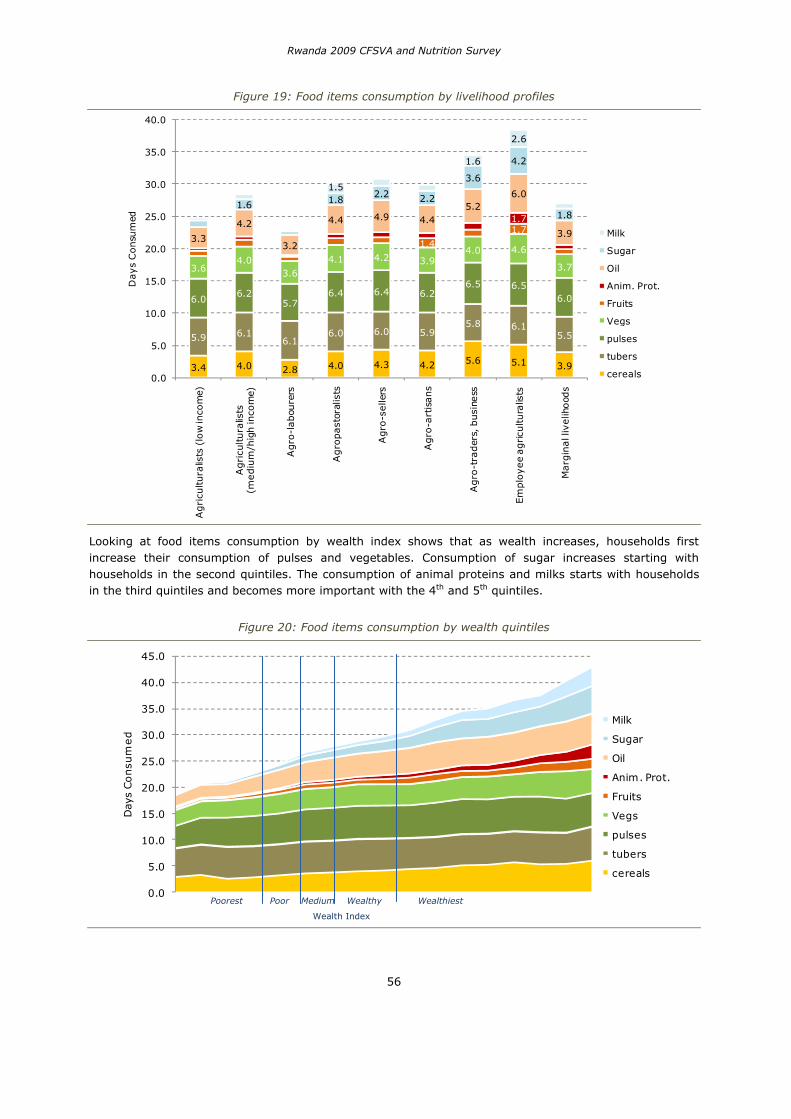
Rwanda 2009 CFSVA and Nutrition Survey
56
Figure 19: Food items consumption by livelihood profiles
3.4 4.0 2.8 4.0 4.3 4.2 5.6 5.1 3.9
5.9 6.16.1
6.0 6.0 5.95.8 6.1
5.5
6.06.2
5.76.4 6.4 6.2
6.5 6.56.0
3.64.0
3.6
4.1 4.2 3.94.0 4.6
3.7
1.4
1.71.7
3.3
4.2
3.2
4.4 4.9 4.45.2
6.0
3.9
1.6 1.82.2 2.2
3.6
4.2
1.8
1.5
1.6
2.6
0.0
5.0
10.0
15.0
20.0
25.0
30.0
35.0
40.0
Agri
cultura
lists
(lo
w in
com
e)
Agri
cultura
lists
(m
ediu
m/h
igh in
com
e)
Agro
-labou
rers
Agro
past
oral
ists
Agro
-selle
rs
Agro
-art
isans
Agro
-tra
der
s, b
usi
ness
Em
plo
yee
agricu
ltura
lists
Marg
inal l
ivelih
ood
s
Days
Consu
med
Milk
Sugar
Oil
Anim. Prot.
Fruits
Vegs
pulses
tubers
cereals
Looking at food items consumption by wealth index shows that as wealth increases, households first increase their consumption of pulses and vegetables. Consumption of sugar increases starting with households in the second quintiles. The consumption of animal proteins and milks starts with households in the third quintiles and becomes more important with the 4th and 5th quintiles.
Figure 20: Food items consumption by wealth quintiles
0.0
5.0
10.0
15.0
20.0
25.0
30.0
35.0
40.0
45.0
Day
s Consu
med
Milk
Sugar
Oil
Anim. Prot.
Fruits
Vegs
pulses
tubers
cereals
Poorest Poor Medium Wealthy Wealthiest
Wealth Index
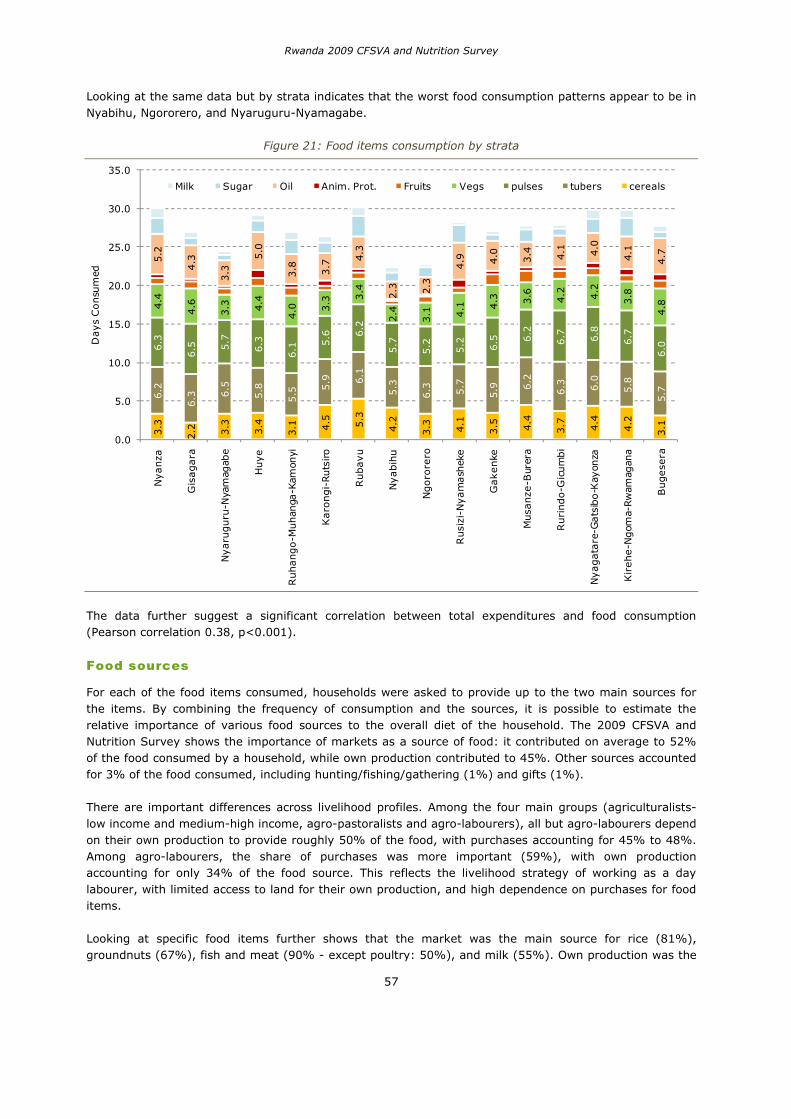
Rwanda 2009 CFSVA and Nutrition Survey
57
Looking at the same data but by strata indicates that the worst food consumption patterns appear to be in Nyabihu, Ngororero, and Nyaruguru-Nyamagabe.
Figure 21: Food items consumption by strata 3.3
2.2 3.3 3.4
3.1 4.5 5.3
4.2
3.3 4.1
3.5 4.4
3.7 4.4
4.2
3.1
6.2
6.3 6
.5
5.8
5.5 5
.9 6.1
5.3
6.3 5.7
5.9 6
.2
6.3 6.0
5.8
5.7
6.3
6.5 5
.7
6.3
6.1 5
.6 6.2
5.7
5.2 5.2 6.5 6
.2
6.7 6.8
6.7
6.0
4.4
4.6
3.3 4.4
4.0 3
.3 3.4
2.4
3.1 4.1 4
.3 3.6 4.2 4.2
3.8
4.8
5.2
4.3
3.3
5.0
3.8 3.7
4.3
2.3 2.3
4.9 4.0 3.4 4.1 4.0
4.1
4.7
0.0
5.0
10.0
15.0
20.0
25.0
30.0
35.0N
yanza
Gis
agara
Nyaru
guru
-Nya
mag
abe
Huye
Ruhango-M
uhan
ga-K
amon
yi
Karo
ngi-
Ruts
iro
Rubavu
Nyabih
u
Ngoro
rero
Rusi
zi-N
yam
ash
eke
Gakenke
Musa
nze
-Bur
era
Ruri
ndo-G
icum
bi
Nyagata
re-G
ats
ibo-K
ayon
za
Kir
ehe-N
gom
a-Rw
amag
ana
Bugese
ra
Days
Consu
med
Milk Sugar Oil Anim. Prot. Fruits Vegs pulses tubers cereals
The data further suggest a significant correlation between total expenditures and food consumption (Pearson correlation 0.38, p<0.001).
Food sources
For each of the food items consumed, households were asked to provide up to the two main sources for the items. By combining the frequency of consumption and the sources, it is possible to estimate the relative importance of various food sources to the overall diet of the household. The 2009 CFSVA and Nutrition Survey shows the importance of markets as a source of food: it contributed on average to 52% of the food consumed by a household, while own production contributed to 45%. Other sources accounted for 3% of the food consumed, including hunting/fishing/gathering (1%) and gifts (1%).
There are important differences across livelihood profiles. Among the four main groups (agriculturalists-low income and medium-high income, agro-pastoralists and agro-labourers), all but agro-labourers depend on their own production to provide roughly 50% of the food, with purchases accounting for 45% to 48%. Among agro-labourers, the share of purchases was more important (59%), with own production accounting for only 34% of the food source. This reflects the livelihood strategy of working as a day labourer, with limited access to land for their own production, and high dependence on purchases for food items.
Looking at specific food items further shows that the market was the main source for rice (81%), groundnuts (67%), fish and meat (90% - except poultry: 50%), and milk (55%). Own production was the
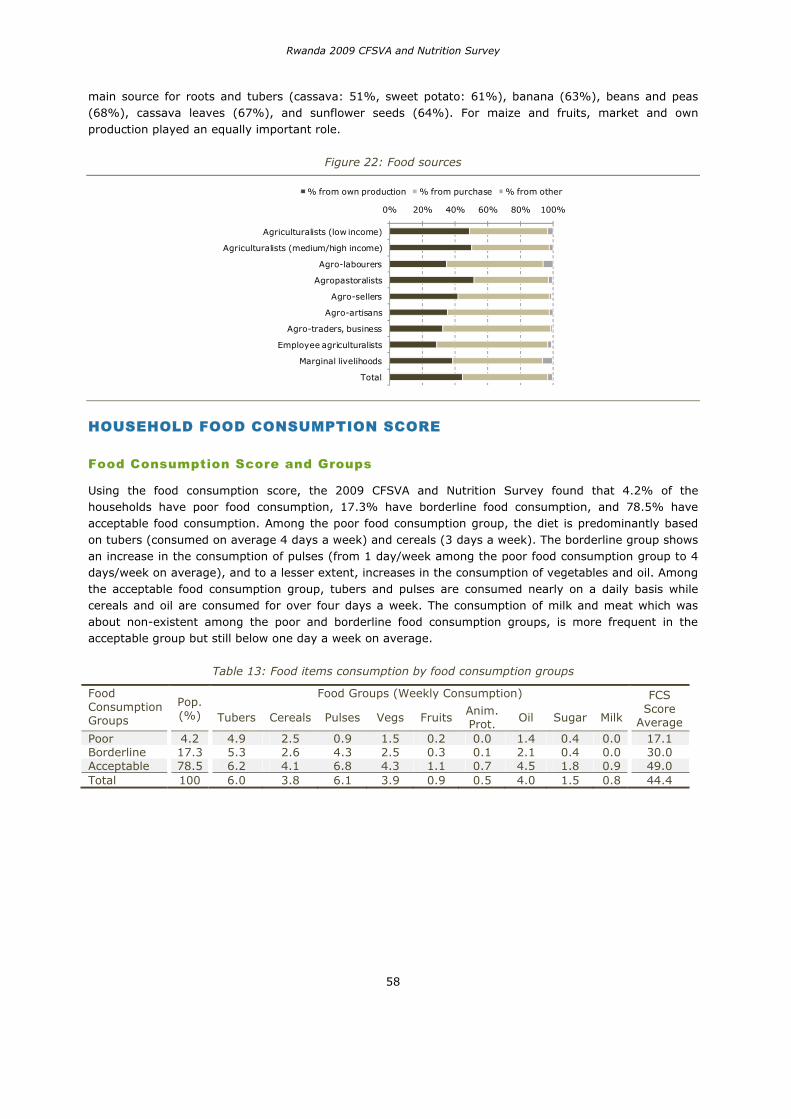
Rwanda 2009 CFSVA and Nutrition Survey
58
main source for roots and tubers (cassava: 51%, sweet potato: 61%), banana (63%), beans and peas (68%), cassava leaves (67%), and sunflower seeds (64%). For maize and fruits, market and own production played an equally important role.
Figure 22: Food sources
0% 20% 40% 60% 80% 100%
Agriculturalists (low income)
Agriculturalists (medium/high income)
Agro-labourers
Agropastoralists
Agro-sellers
Agro-artisans
Agro-traders, business
Employee agriculturalists
Marginal livelihoods
Total
% from own production % from purchase % from other
HOUSEHOLD FOOD CONSUMPTION SCORE
Food Consumption Score and Groups
Using the food consumption score, the 2009 CFSVA and Nutrition Survey found that 4.2% of the households have poor food consumption, 17.3% have borderline food consumption, and 78.5% have acceptable food consumption. Among the poor food consumption group, the diet is predominantly based on tubers (consumed on average 4 days a week) and cereals (3 days a week). The borderline group shows an increase in the consumption of pulses (from 1 day/week among the poor food consumption group to 4 days/week on average), and to a lesser extent, increases in the consumption of vegetables and oil. Among the acceptable food consumption group, tubers and pulses are consumed nearly on a daily basis while cereals and oil are consumed for over four days a week. The consumption of milk and meat which was about non-existent among the poor and borderline food consumption groups, is more frequent in the acceptable group but still below one day a week on average.
Table 13: Food items consumption by food consumption groups
FoodConsumption Groups
Pop. (%)
Food Groups (Weekly Consumption) FCSScore
Average Tubers Cereals Pulses Vegs Fruits Anim. Prot. Oil Sugar Milk
Poor 4.2 4.9 2.5 0.9 1.5 0.2 0.0 1.4 0.4 0.0 17.1 Borderline 17.3 5.3 2.6 4.3 2.5 0.3 0.1 2.1 0.4 0.0 30.0 Acceptable 78.5 6.2 4.1 6.8 4.3 1.1 0.7 4.5 1.8 0.9 49.0 Total 100 6.0 3.8 6.1 3.9 0.9 0.5 4.0 1.5 0.8 44.4
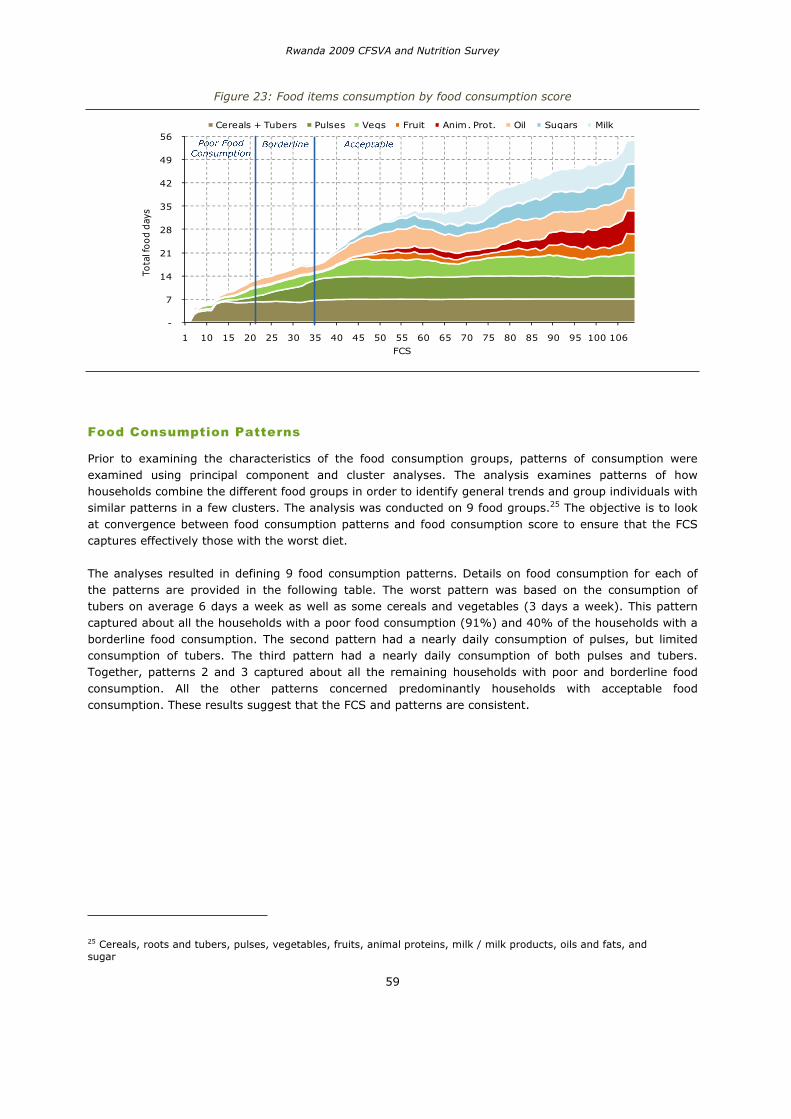
Rwanda 2009 CFSVA and Nutrition Survey
59
Figure 23: Food items consumption by food consumption score
-
7
14
21
28
35
42
49
56
1 10 15 20 25 30 35 40 45 50 55 60 65 70 75 80 85 90 95 100 106
Tota
l food d
ays
FCS
Cereals + Tubers Pulses Vegs Fruit Anim. Prot. Oil Sugars Milk
Food Consumption Patterns
Prior to examining the characteristics of the food consumption groups, patterns of consumption were examined using principal component and cluster analyses. The analysis examines patterns of how households combine the different food groups in order to identify general trends and group individuals with similar patterns in a few clusters. The analysis was conducted on 9 food groups.25 The objective is to look at convergence between food consumption patterns and food consumption score to ensure that the FCS captures effectively those with the worst diet.
The analyses resulted in defining 9 food consumption patterns. Details on food consumption for each of the patterns are provided in the following table. The worst pattern was based on the consumption of tubers on average 6 days a week as well as some cereals and vegetables (3 days a week). This pattern captured about all the households with a poor food consumption (91%) and 40% of the households with a borderline food consumption. The second pattern had a nearly daily consumption of pulses, but limited consumption of tubers. The third pattern had a nearly daily consumption of both pulses and tubers. Together, patterns 2 and 3 captured about all the remaining households with poor and borderline food consumption. All the other patterns concerned predominantly households with acceptable food consumption. These results suggest that the FCS and patterns are consistent.
25 Cereals, roots and tubers, pulses, vegetables, fruits, animal proteins, milk / milk products, oils and fats, and sugar
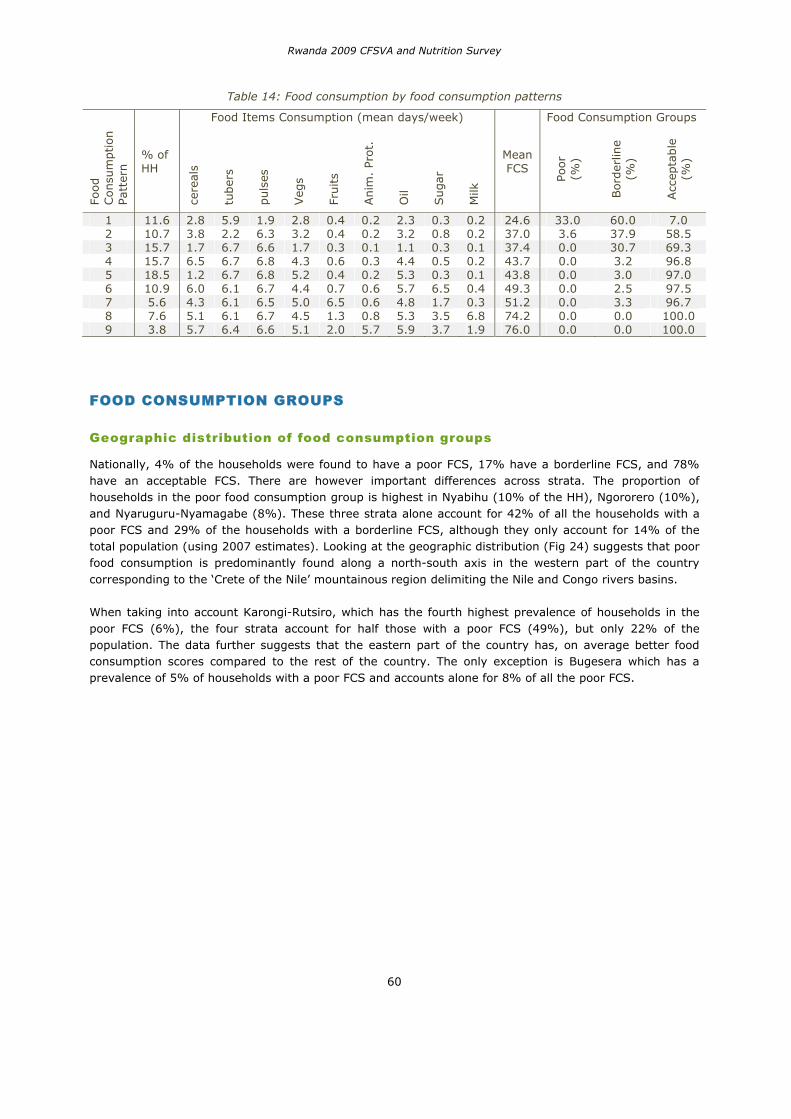
Rwanda 2009 CFSVA and Nutrition Survey
60
Table 14: Food consumption by food consumption patterns Fo
od
Consu
mption
Pat
tern
% of HH
Food Items Consumption (mean days/week)
Mean FCS
Food Consumption Groups
cere
als
tuber
s
puls
es
Veg
s
Fruits
Anim
. Pro
t.
Oil
Sugar
Milk
Poor
(%)
Bor
der
line
(%)
Acc
epta
ble
(%
)
1 11.6 2.8 5.9 1.9 2.8 0.4 0.2 2.3 0.3 0.2 24.6 33.0 60.0 7.0 2 10.7 3.8 2.2 6.3 3.2 0.4 0.2 3.2 0.8 0.2 37.0 3.6 37.9 58.5 3 15.7 1.7 6.7 6.6 1.7 0.3 0.1 1.1 0.3 0.1 37.4 0.0 30.7 69.34 15.7 6.5 6.7 6.8 4.3 0.6 0.3 4.4 0.5 0.2 43.7 0.0 3.2 96.8 5 18.5 1.2 6.7 6.8 5.2 0.4 0.2 5.3 0.3 0.1 43.8 0.0 3.0 97.06 10.9 6.0 6.1 6.7 4.4 0.7 0.6 5.7 6.5 0.4 49.3 0.0 2.5 97.5 7 5.6 4.3 6.1 6.5 5.0 6.5 0.6 4.8 1.7 0.3 51.2 0.0 3.3 96.78 7.6 5.1 6.1 6.7 4.5 1.3 0.8 5.3 3.5 6.8 74.2 0.0 0.0 100.0 9 3.8 5.7 6.4 6.6 5.1 2.0 5.7 5.9 3.7 1.9 76.0 0.0 0.0 100.0
FOOD CONSUMPTION GROUPS
Geographic distribution of food consumption groups
Nationally, 4% of the households were found to have a poor FCS, 17% have a borderline FCS, and 78% have an acceptable FCS. There are however important differences across strata. The proportion of households in the poor food consumption group is highest in Nyabihu (10% of the HH), Ngororero (10%), and Nyaruguru-Nyamagabe (8%). These three strata alone account for 42% of all the households with a poor FCS and 29% of the households with a borderline FCS, although they only account for 14% of the total population (using 2007 estimates). Looking at the geographic distribution (Fig 24) suggests that poor food consumption is predominantly found along a north-south axis in the western part of the country corresponding to the ‘Crete of the Nile’ mountainous region delimiting the Nile and Congo rivers basins.
When taking into account Karongi-Rutsiro, which has the fourth highest prevalence of households in the poor FCS (6%), the four strata account for half those with a poor FCS (49%), but only 22% of the population. The data further suggests that the eastern part of the country has, on average better food consumption scores compared to the rest of the country. The only exception is Bugesera which has a prevalence of 5% of households with a poor FCS and accounts alone for 8% of all the poor FCS.
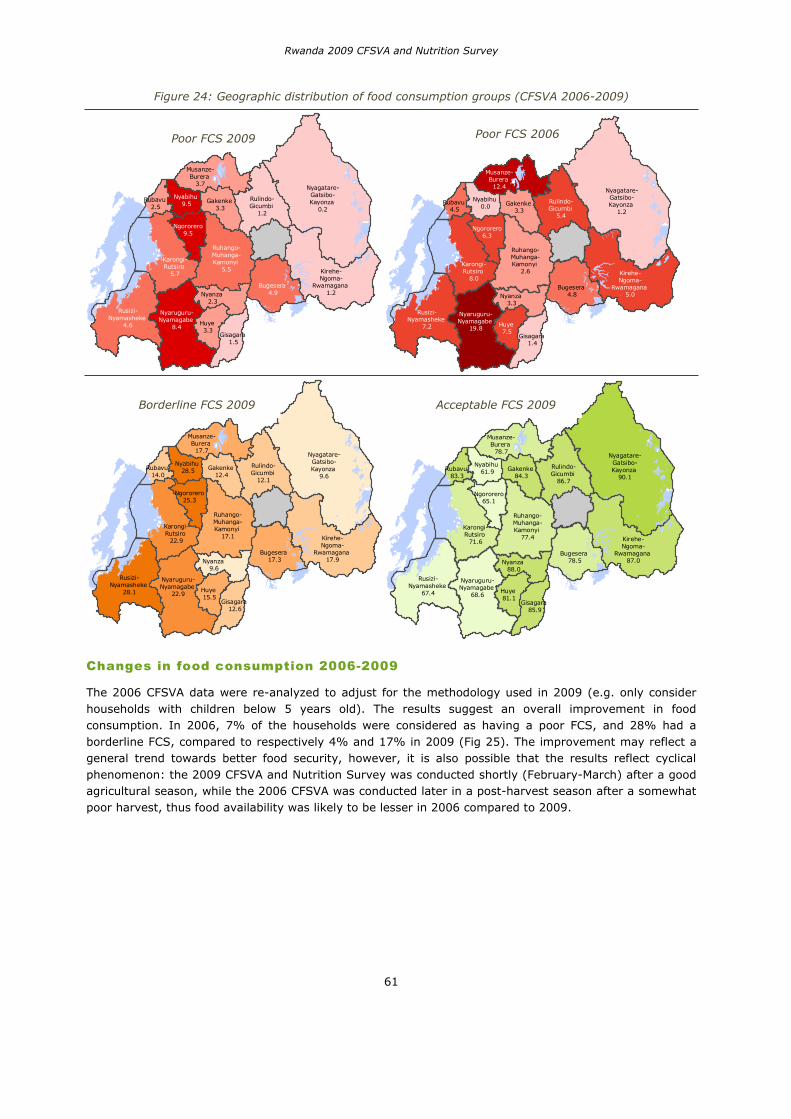
Rwanda 2009 CFSVA and Nutrition Survey
61
Figure 24: Geographic distribution of food consumption groups (CFSVA 2006-2009)
Nyagatare-Gatsibo-Kayonza
0.2
Karongi-Rutsiro
5.7
Bugesera 4.9
Rusizi-Nyamasheke
4.6
Kirehe-Ngoma-
Rwamagana 1.2
Nyaruguru-Nyamagabe
8.4
Rulindo-Gicumbi
1.2
Huye 3.3
Nyanza 2.3
Musanze-Burera
3.7
Gakenke 3.3
Ngororero9.5
Nyabihu 9.5
Ruhango-Muhanga-Kamonyi
5.5
Gisagara 1.5
Rubavu 2.5
Nyagatare-Gatsibo-Kayonza
1.2
Karongi-Rutsiro
8.0Bugesera
4.8
Rusizi-Nyamasheke
7.2
Kirehe-Ngoma-
Rwamagana 5.0
Nyaruguru-Nyamagabe
19.8
Rulindo-Gicumbi
5.4
Huye 7.5
Nyanza 3.3
Musanze-Burera 12.4
Gakenke 3.3
Ngororero6.3
Nyabihu 0.0
Ruhango-Muhanga-Kamonyi
2.6
Gisagara 1.4
Rubavu 4.5
Nyagatare-Gatsibo-Kayonza
9.6
Karongi-Rutsiro
22.9
Bugesera 17.3
Rusizi-Nyamasheke
28.1
Kirehe-Ngoma-
Rwamagana 17.9
Nyaruguru-Nyamagabe
22.9
Rulindo-Gicumbi
12.1
Huye 15.5
Nyanza 9.6
Musanze-Burera 17.7
Gakenke 12.4
Ngororero25.3
Nyabihu 28.5
Ruhango-Muhanga-Kamonyi
17.1
Gisagara 12.6
Rubavu 14.0
Nyagatare-Gatsibo-Kayonza
90.1
Karongi-Rutsiro
71.6
Bugesera 78.5
Rusizi-Nyamasheke
67.4
Kirehe-Ngoma-
Rwamagana 87.0
Nyaruguru-Nyamagabe
68.6
Rulindo-Gicumbi
86.7
Huye 81.1
Nyanza 88.0
Musanze-Burera
78.7
Gakenke 84.3
Ngororero65.1
Nyabihu 61.9
Ruhango-Muhanga-Kamonyi
77.4
Gisagara 85.9
Rubavu 83.3
Changes in food consumption 2006-2009
The 2006 CFSVA data were re-analyzed to adjust for the methodology used in 2009 (e.g. only consider households with children below 5 years old). The results suggest an overall improvement in food consumption. In 2006, 7% of the households were considered as having a poor FCS, and 28% had a borderline FCS, compared to respectively 4% and 17% in 2009 (Fig 25). The improvement may reflect a general trend towards better food security, however, it is also possible that the results reflect cyclical phenomenon: the 2009 CFSVA and Nutrition Survey was conducted shortly (February-March) after a good agricultural season, while the 2006 CFSVA was conducted later in a post-harvest season after a somewhat poor harvest, thus food availability was likely to be lesser in 2006 compared to 2009.
Poor FCS 2009 Poor FCS 2006
Borderline FCS 2009 Acceptable FCS 2009
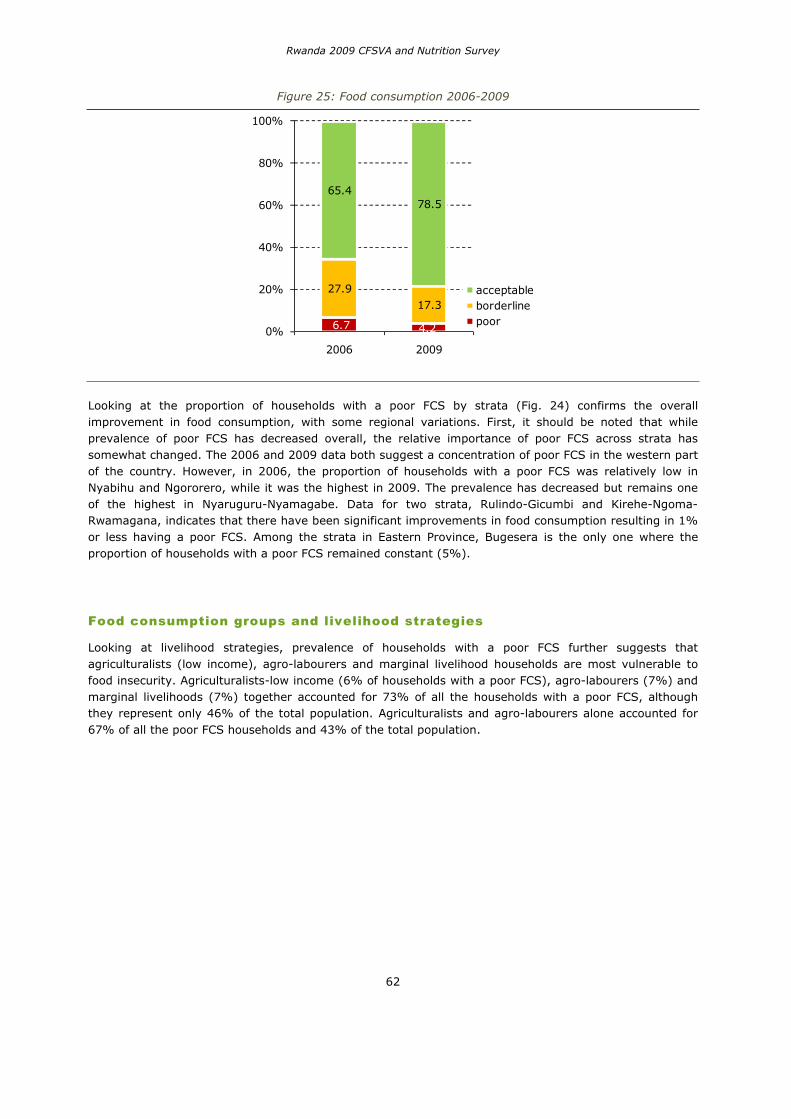
Rwanda 2009 CFSVA and Nutrition Survey
62
Figure 25: Food consumption 2006-2009
6.7 4.2
27.917.3
65.478.5
0%
20%
40%
60%
80%
100%
2006 2009
acceptableborderlinepoor
Looking at the proportion of households with a poor FCS by strata (Fig. 24) confirms the overall improvement in food consumption, with some regional variations. First, it should be noted that while prevalence of poor FCS has decreased overall, the relative importance of poor FCS across strata has somewhat changed. The 2006 and 2009 data both suggest a concentration of poor FCS in the western part of the country. However, in 2006, the proportion of households with a poor FCS was relatively low in Nyabihu and Ngororero, while it was the highest in 2009. The prevalence has decreased but remains one of the highest in Nyaruguru-Nyamagabe. Data for two strata, Rulindo-Gicumbi and Kirehe-Ngoma-Rwamagana, indicates that there have been significant improvements in food consumption resulting in 1% or less having a poor FCS. Among the strata in Eastern Province, Bugesera is the only one where the proportion of households with a poor FCS remained constant (5%).
Food consumption groups and livelihood strategies
Looking at livelihood strategies, prevalence of households with a poor FCS further suggests that agriculturalists (low income), agro-labourers and marginal livelihood households are most vulnerable to food insecurity. Agriculturalists-low income (6% of households with a poor FCS), agro-labourers (7%) and marginal livelihoods (7%) together accounted for 73% of all the households with a poor FCS, although they represent only 46% of the total population. Agriculturalists and agro-labourers alone accounted for 67% of all the poor FCS households and 43% of the total population.
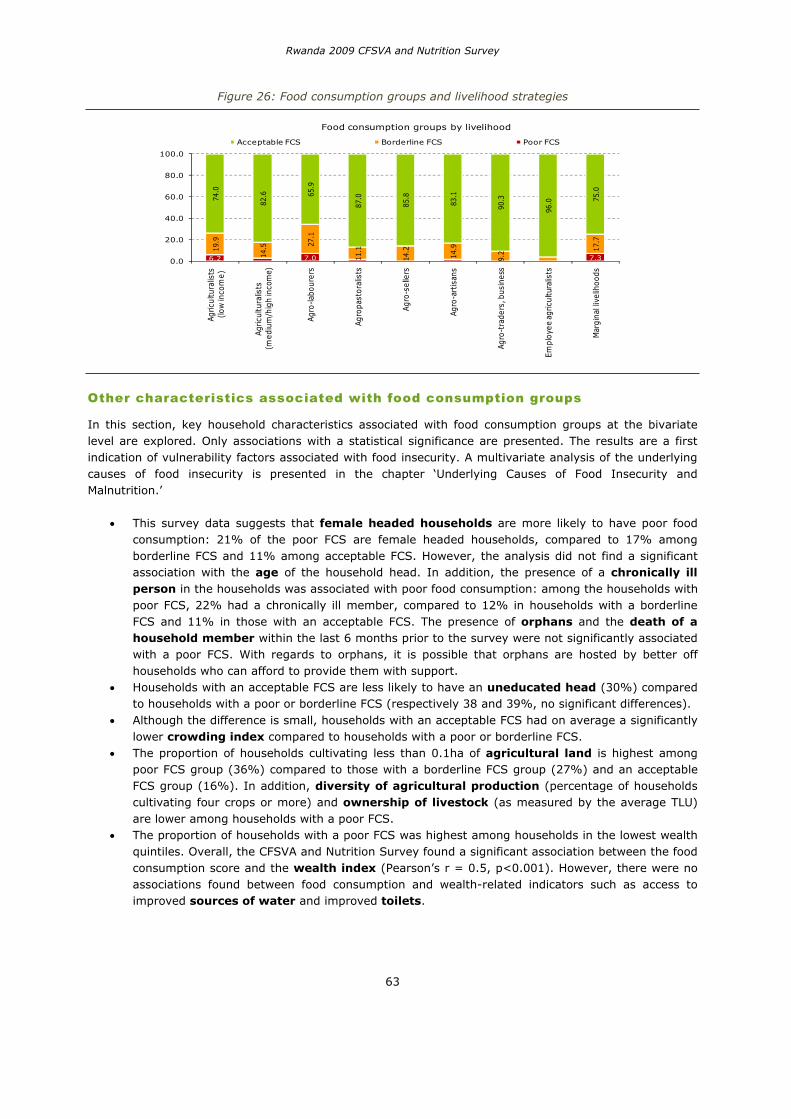
Rwanda 2009 CFSVA and Nutrition Survey
63
Figure 26: Food consumption groups and livelihood strategies
6.2 7.0 7.3
19.9
14.5 27
.1
11.1
14.2
14.9
9.2 17
.7
74.0
82.6 65
.9
87.0
85.8
83.1
90.3
96.0 75
.0
0.0
20.0
40.0
60.0
80.0
100.0
Agric
ultu
ralis
ts
(lo
w in
com
e)
Agric
ultu
ralis
ts
(med
ium
/hig
h in
com
e)
Agro
-labo
urer
s
Agro
past
oral
ists
Agro
-sel
lers
Agro
-art
isan
s
Agro
-tra
ders
, bus
ines
s
Empl
oyee
agr
icul
tura
lists
Mar
gina
l liv
elih
oods
Food consumption groups by livelihood
Acceptable FCS Borderline FCS Poor FCS
Other characteristics associated with food consumption groups
In this section, key household characteristics associated with food consumption groups at the bivariate level are explored. Only associations with a statistical significance are presented. The results are a first indication of vulnerability factors associated with food insecurity. A multivariate analysis of the underlying causes of food insecurity is presented in the chapter ‘Underlying Causes of Food Insecurity and Malnutrition.’
This survey data suggests that female headed households are more likely to have poor food consumption: 21% of the poor FCS are female headed households, compared to 17% among borderline FCS and 11% among acceptable FCS. However, the analysis did not find a significant association with the age of the household head. In addition, the presence of a chronically ill person in the households was associated with poor food consumption: among the households with poor FCS, 22% had a chronically ill member, compared to 12% in households with a borderline FCS and 11% in those with an acceptable FCS. The presence of orphans and the death of a household member within the last 6 months prior to the survey were not significantly associated with a poor FCS. With regards to orphans, it is possible that orphans are hosted by better off households who can afford to provide them with support. Households with an acceptable FCS are less likely to have an uneducated head (30%) compared to households with a poor or borderline FCS (respectively 38 and 39%, no significant differences). Although the difference is small, households with an acceptable FCS had on average a significantly lower crowding index compared to households with a poor or borderline FCS. The proportion of households cultivating less than 0.1ha of agricultural land is highest among poor FCS group (36%) compared to those with a borderline FCS group (27%) and an acceptable FCS group (16%). In addition, diversity of agricultural production (percentage of households cultivating four crops or more) and ownership of livestock (as measured by the average TLU) are lower among households with a poor FCS. The proportion of households with a poor FCS was highest among households in the lowest wealth quintiles. Overall, the CFSVA and Nutrition Survey found a significant association between the food consumption score and the wealth index (Pearson’s r = 0.5, p<0.001). However, there were no associations found between food consumption and wealth-related indicators such as access to improved sources of water and improved toilets.
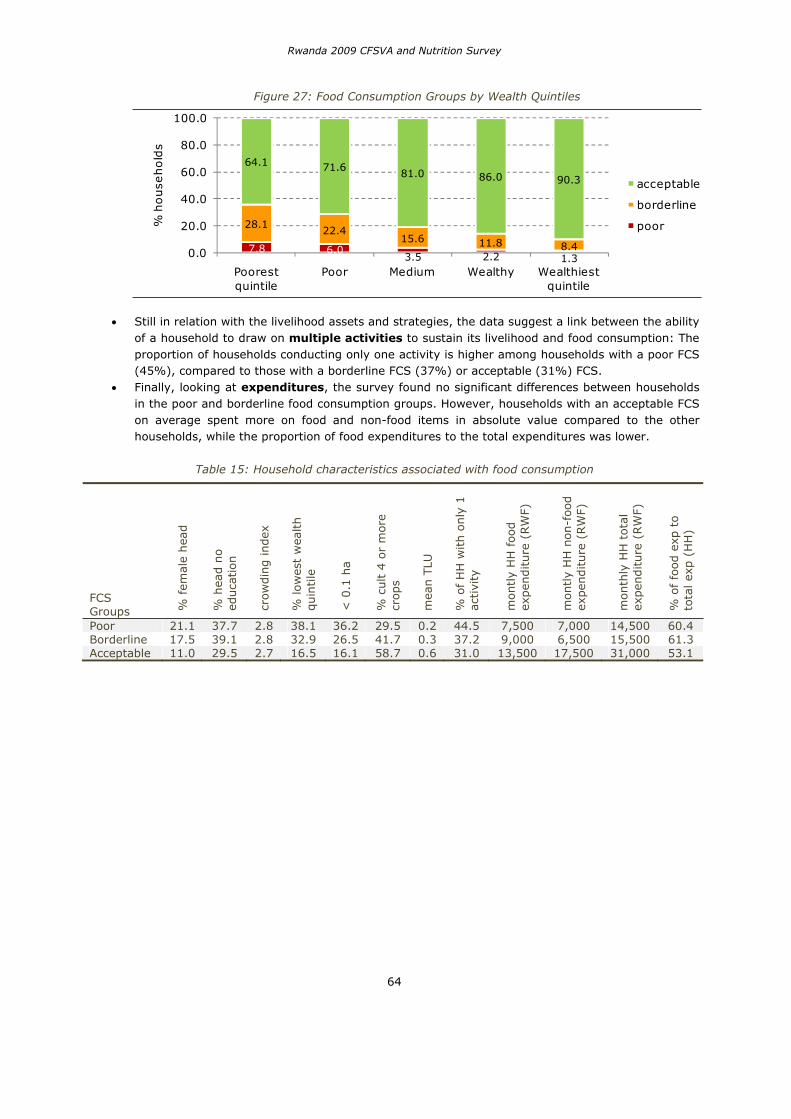
Rwanda 2009 CFSVA and Nutrition Survey
64
Figure 27: Food Consumption Groups by Wealth Quintiles
7.8 6.03.5 2.2 1.3
28.122.4
15.6 11.8 8.4
64.1 71.681.0 86.0 90.3
0.0
20.0
40.0
60.0
80.0
100.0
Poorest quintile
Poor Medium Wealthy Wealthiest quintile
% h
ouse
hold
s
acceptable
borderline
poor
Still in relation with the livelihood assets and strategies, the data suggest a link between the ability of a household to draw on multiple activities to sustain its livelihood and food consumption: The proportion of households conducting only one activity is higher among households with a poor FCS (45%), compared to those with a borderline FCS (37%) or acceptable (31%) FCS. Finally, looking at expenditures, the survey found no significant differences between households in the poor and borderline food consumption groups. However, households with an acceptable FCS on average spent more on food and non-food items in absolute value compared to the other households, while the proportion of food expenditures to the total expenditures was lower.
Table 15: Household characteristics associated with food consumption
FCSGroups %
fem
ale
hea
d
% h
ead n
o ed
uca
tion
crow
din
g index
% low
est
wea
lth
quin
tile
< 0
.1 h
a
% c
ult 4
or
more
cr
ops
mea
n T
LU
% o
f H
H w
ith o
nly
1
act
ivity
montly
HH
food
expen
diture
(RW
F)
montly
HH
non-f
ood
expen
diture
(RW
F)
month
ly H
H t
ota
l ex
pen
diture
(RW
F)
% o
f fo
od e
xp t
o to
tal ex
p (
HH
)
Poor 21.1 37.7 2.8 38.1 36.2 29.5 0.2 44.5 7,500 7,000 14,500 60.4 Borderline 17.5 39.1 2.8 32.9 26.5 41.7 0.3 37.2 9,000 6,500 15,500 61.3 Acceptable 11.0 29.5 2.7 16.5 16.1 58.7 0.6 31.0 13,500 17,500 31,000 53.1
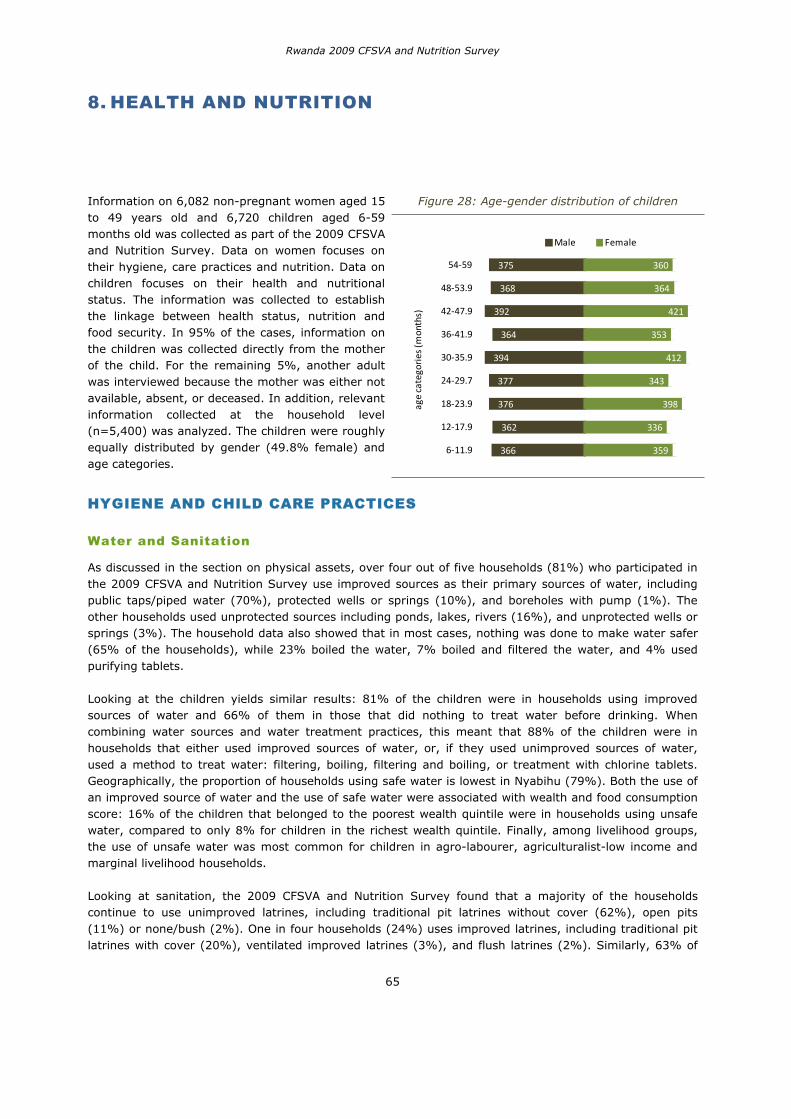
Rwanda 2009 CFSVA and Nutrition Survey
65
8. HEALTH AND NUTRITION
Information on 6,082 non-pregnant women aged 15 to 49 years old and 6,720 children aged 6-59 months old was collected as part of the 2009 CFSVA and Nutrition Survey. Data on women focuses on their hygiene, care practices and nutrition. Data on children focuses on their health and nutritional status. The information was collected to establish the linkage between health status, nutrition and food security. In 95% of the cases, information on the children was collected directly from the mother of the child. For the remaining 5%, another adult was interviewed because the mother was either not available, absent, or deceased. In addition, relevant information collected at the household level (n=5,400) was analyzed. The children were roughly equally distributed by gender (49.8% female) and age categories.
Figure 28: Age-gender distribution of children
366
362
376
377
394
364
392
368
375
359
336
398
343
412
353
421
364
360
6 11.9
12 17.9
18 23.9
24 29.7
30 35.9
36 41.9
42 47.9
48 53.9
54 59
agecategories
(months)
Male Female
HYGIENE AND CHILD CARE PRACTICES
Water and Sanitation
As discussed in the section on physical assets, over four out of five households (81%) who participated in the 2009 CFSVA and Nutrition Survey use improved sources as their primary sources of water, including public taps/piped water (70%), protected wells or springs (10%), and boreholes with pump (1%). The other households used unprotected sources including ponds, lakes, rivers (16%), and unprotected wells or springs (3%). The household data also showed that in most cases, nothing was done to make water safer (65% of the households), while 23% boiled the water, 7% boiled and filtered the water, and 4% used purifying tablets.
Looking at the children yields similar results: 81% of the children were in households using improved sources of water and 66% of them in those that did nothing to treat water before drinking. When combining water sources and water treatment practices, this meant that 88% of the children were in households that either used improved sources of water, or, if they used unimproved sources of water, used a method to treat water: filtering, boiling, filtering and boiling, or treatment with chlorine tablets. Geographically, the proportion of households using safe water is lowest in Nyabihu (79%). Both the use of an improved source of water and the use of safe water were associated with wealth and food consumption score: 16% of the children that belonged to the poorest wealth quintile were in households using unsafe water, compared to only 8% for children in the richest wealth quintile. Finally, among livelihood groups, the use of unsafe water was most common for children in agro-labourer, agriculturalist-low income and marginal livelihood households.
Looking at sanitation, the 2009 CFSVA and Nutrition Survey found that a majority of the households continue to use unimproved latrines, including traditional pit latrines without cover (62%), open pits (11%) or none/bush (2%). One in four households (24%) uses improved latrines, including traditional pit latrines with cover (20%), ventilated improved latrines (3%), and flush latrines (2%). Similarly, 63% of
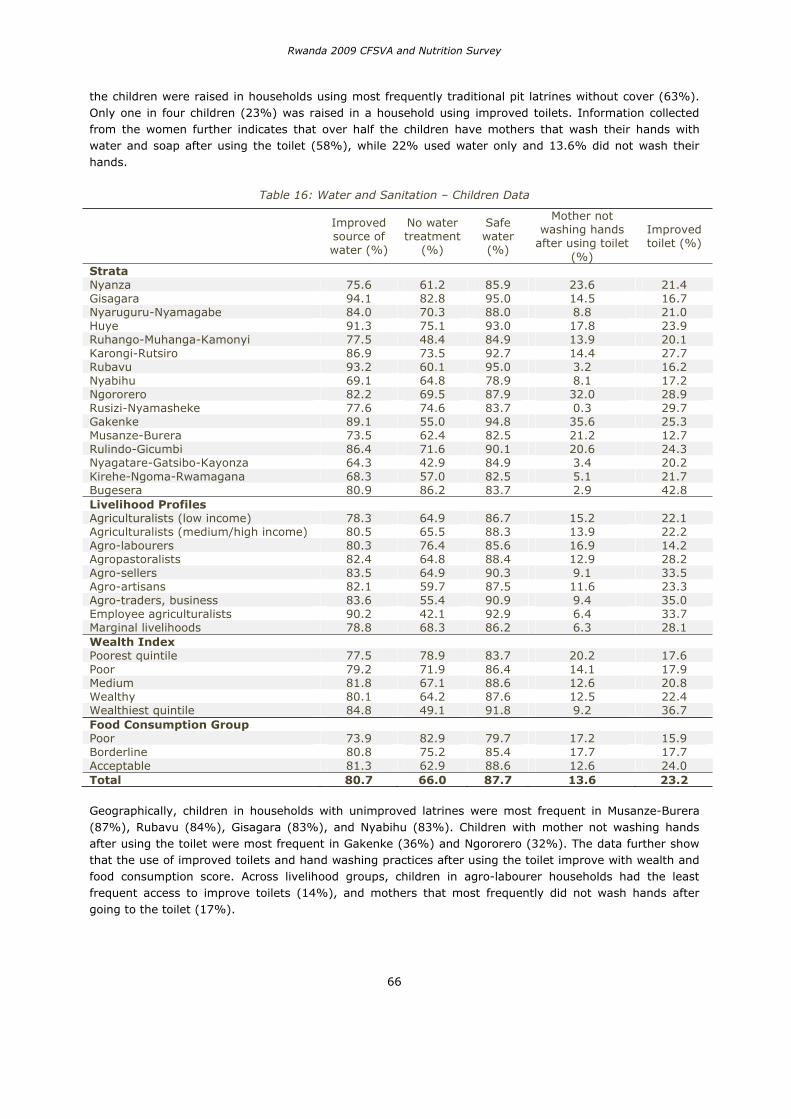
Rwanda 2009 CFSVA and Nutrition Survey
66
the children were raised in households using most frequently traditional pit latrines without cover (63%). Only one in four children (23%) was raised in a household using improved toilets. Information collected from the women further indicates that over half the children have mothers that wash their hands with water and soap after using the toilet (58%), while 22% used water only and 13.6% did not wash their hands.
Table 16: Water and Sanitation – Children Data
Improved source of water (%)
No water treatment
(%)
Safe water (%)
Mother not washing hands
after using toilet (%)
Improved toilet (%)
Strata Nyanza 75.6 61.2 85.9 23.6 21.4 Gisagara 94.1 82.8 95.0 14.5 16.7 Nyaruguru-Nyamagabe 84.0 70.3 88.0 8.8 21.0 Huye 91.3 75.1 93.0 17.8 23.9 Ruhango-Muhanga-Kamonyi 77.5 48.4 84.9 13.9 20.1 Karongi-Rutsiro 86.9 73.5 92.7 14.4 27.7 Rubavu 93.2 60.1 95.0 3.2 16.2 Nyabihu 69.1 64.8 78.9 8.1 17.2 Ngororero 82.2 69.5 87.9 32.0 28.9 Rusizi-Nyamasheke 77.6 74.6 83.7 0.3 29.7 Gakenke 89.1 55.0 94.8 35.6 25.3 Musanze-Burera 73.5 62.4 82.5 21.2 12.7 Rulindo-Gicumbi 86.4 71.6 90.1 20.6 24.3 Nyagatare-Gatsibo-Kayonza 64.3 42.9 84.9 3.4 20.2 Kirehe-Ngoma-Rwamagana 68.3 57.0 82.5 5.1 21.7 Bugesera 80.9 86.2 83.7 2.9 42.8 Livelihood Profiles Agriculturalists (low income) 78.3 64.9 86.7 15.2 22.1 Agriculturalists (medium/high income) 80.5 65.5 88.3 13.9 22.2 Agro-labourers 80.3 76.4 85.6 16.9 14.2 Agropastoralists 82.4 64.8 88.4 12.9 28.2 Agro-sellers 83.5 64.9 90.3 9.1 33.5 Agro-artisans 82.1 59.7 87.5 11.6 23.3 Agro-traders, business 83.6 55.4 90.9 9.4 35.0 Employee agriculturalists 90.2 42.1 92.9 6.4 33.7 Marginal livelihoods 78.8 68.3 86.2 6.3 28.1 Wealth Index Poorest quintile 77.5 78.9 83.7 20.2 17.6 Poor 79.2 71.9 86.4 14.1 17.9 Medium 81.8 67.1 88.6 12.6 20.8 Wealthy 80.1 64.2 87.6 12.5 22.4 Wealthiest quintile 84.8 49.1 91.8 9.2 36.7 Food Consumption Group Poor 73.9 82.9 79.7 17.2 15.9 Borderline 80.8 75.2 85.4 17.7 17.7 Acceptable 81.3 62.9 88.6 12.6 24.0 Total 80.7 66.0 87.7 13.6 23.2
Geographically, children in households with unimproved latrines were most frequent in Musanze-Burera (87%), Rubavu (84%), Gisagara (83%), and Nyabihu (83%). Children with mother not washing hands after using the toilet were most frequent in Gakenke (36%) and Ngororero (32%). The data further show that the use of improved toilets and hand washing practices after using the toilet improve with wealth and food consumption score. Across livelihood groups, children in agro-labourer households had the least frequent access to improve toilets (14%), and mothers that most frequently did not wash hands after going to the toilet (17%).
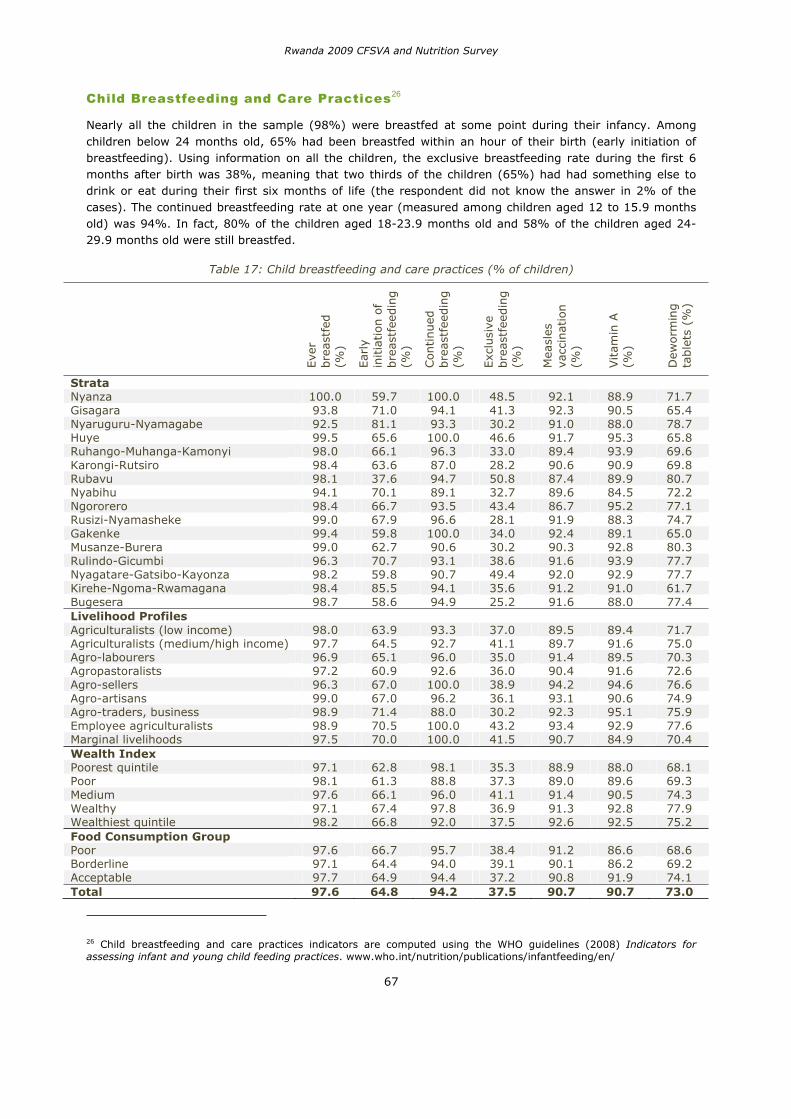
Rwanda 2009 CFSVA and Nutrition Survey
67
Child Breastfeeding and Care Practices26
Nearly all the children in the sample (98%) were breastfed at some point during their infancy. Among children below 24 months old, 65% had been breastfed within an hour of their birth (early initiation of breastfeeding). Using information on all the children, the exclusive breastfeeding rate during the first 6 months after birth was 38%, meaning that two thirds of the children (65%) had had something else to drink or eat during their first six months of life (the respondent did not know the answer in 2% of the cases). The continued breastfeeding rate at one year (measured among children aged 12 to 15.9 months old) was 94%. In fact, 80% of the children aged 18-23.9 months old and 58% of the children aged 24-29.9 months old were still breastfed.
Table 17: Child breastfeeding and care practices (% of children)
Eve
r bre
astf
ed
(%)
Ear
lyin
itia
tion o
f bre
astf
eedin
g
(%)
Con
tinued
bre
astf
eedin
g
(%)
Exc
lusi
ve
bre
astf
eedin
g
(%)
Mea
sles
va
ccin
atio
n
(%)
Vitam
in A
(%
)
Dew
orm
ing
table
ts (
%)
Strata Nyanza 100.0 59.7 100.0 48.5 92.1 88.9 71.7 Gisagara 93.8 71.0 94.1 41.3 92.3 90.5 65.4 Nyaruguru-Nyamagabe 92.5 81.1 93.3 30.2 91.0 88.0 78.7 Huye 99.5 65.6 100.0 46.6 91.7 95.3 65.8 Ruhango-Muhanga-Kamonyi 98.0 66.1 96.3 33.0 89.4 93.9 69.6 Karongi-Rutsiro 98.4 63.6 87.0 28.2 90.6 90.9 69.8 Rubavu 98.1 37.6 94.7 50.8 87.4 89.9 80.7 Nyabihu 94.1 70.1 89.1 32.7 89.6 84.5 72.2 Ngororero 98.4 66.7 93.5 43.4 86.7 95.2 77.1 Rusizi-Nyamasheke 99.0 67.9 96.6 28.1 91.9 88.3 74.7 Gakenke 99.4 59.8 100.0 34.0 92.4 89.1 65.0 Musanze-Burera 99.0 62.7 90.6 30.2 90.3 92.8 80.3 Rulindo-Gicumbi 96.3 70.7 93.1 38.6 91.6 93.9 77.7 Nyagatare-Gatsibo-Kayonza 98.2 59.8 90.7 49.4 92.0 92.9 77.7 Kirehe-Ngoma-Rwamagana 98.4 85.5 94.1 35.6 91.2 91.0 61.7 Bugesera 98.7 58.6 94.9 25.2 91.6 88.0 77.4 Livelihood Profiles Agriculturalists (low income) 98.0 63.9 93.3 37.0 89.5 89.4 71.7 Agriculturalists (medium/high income) 97.7 64.5 92.7 41.1 89.7 91.6 75.0 Agro-labourers 96.9 65.1 96.0 35.0 91.4 89.5 70.3 Agropastoralists 97.2 60.9 92.6 36.0 90.4 91.6 72.6 Agro-sellers 96.3 67.0 100.0 38.9 94.2 94.6 76.6 Agro-artisans 99.0 67.0 96.2 36.1 93.1 90.6 74.9 Agro-traders, business 98.9 71.4 88.0 30.2 92.3 95.1 75.9 Employee agriculturalists 98.9 70.5 100.0 43.2 93.4 92.9 77.6 Marginal livelihoods 97.5 70.0 100.0 41.5 90.7 84.9 70.4 Wealth Index Poorest quintile 97.1 62.8 98.1 35.3 88.9 88.0 68.1 Poor 98.1 61.3 88.8 37.3 89.0 89.6 69.3 Medium 97.6 66.1 96.0 41.1 91.4 90.5 74.3 Wealthy 97.1 67.4 97.8 36.9 91.3 92.8 77.9 Wealthiest quintile 98.2 66.8 92.0 37.5 92.6 92.5 75.2 Food Consumption Group Poor 97.6 66.7 95.7 38.4 91.2 86.6 68.6 Borderline 97.1 64.4 94.0 39.1 90.1 86.2 69.2 Acceptable 97.7 64.9 94.4 37.2 90.8 91.9 74.1 Total 97.6 64.8 94.2 37.5 90.7 90.7 73.0
26 Child breastfeeding and care practices indicators are computed using the WHO guidelines (2008) Indicators for assessing infant and young child feeding practices. www.who.int/nutrition/publications/infantfeeding/en/
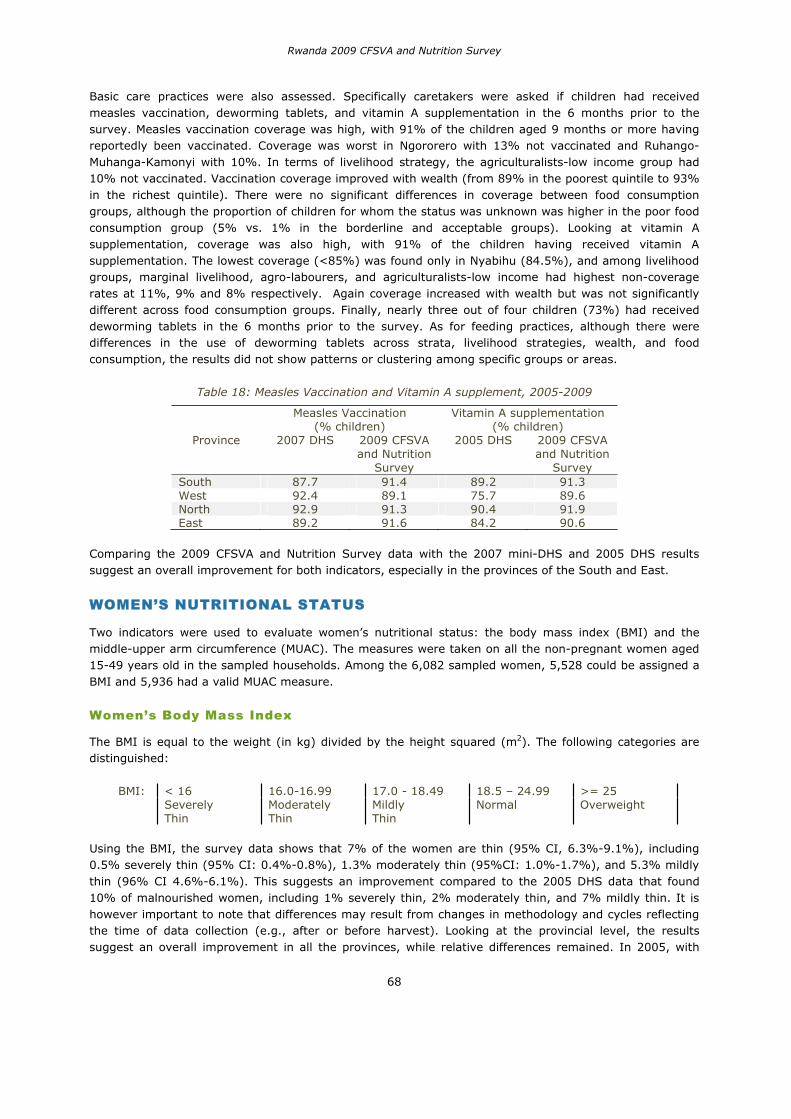
Rwanda 2009 CFSVA and Nutrition Survey
68
Basic care practices were also assessed. Specifically caretakers were asked if children had received measles vaccination, deworming tablets, and vitamin A supplementation in the 6 months prior to the survey. Measles vaccination coverage was high, with 91% of the children aged 9 months or more having reportedly been vaccinated. Coverage was worst in Ngororero with 13% not vaccinated and Ruhango-Muhanga-Kamonyi with 10%. In terms of livelihood strategy, the agriculturalists-low income group had 10% not vaccinated. Vaccination coverage improved with wealth (from 89% in the poorest quintile to 93% in the richest quintile). There were no significant differences in coverage between food consumption groups, although the proportion of children for whom the status was unknown was higher in the poor food consumption group (5% vs. 1% in the borderline and acceptable groups). Looking at vitamin A supplementation, coverage was also high, with 91% of the children having received vitamin A supplementation. The lowest coverage (<85%) was found only in Nyabihu (84.5%), and among livelihood groups, marginal livelihood, agro-labourers, and agriculturalists-low income had highest non-coverage rates at 11%, 9% and 8% respectively. Again coverage increased with wealth but was not significantly different across food consumption groups. Finally, nearly three out of four children (73%) had received deworming tablets in the 6 months prior to the survey. As for feeding practices, although there were differences in the use of deworming tablets across strata, livelihood strategies, wealth, and food consumption, the results did not show patterns or clustering among specific groups or areas.
Table 18: Measles Vaccination and Vitamin A supplement, 2005-2009
Province
Measles Vaccination (% children)
Vitamin A supplementation (% children)
2007 DHS 2009 CFSVA and Nutrition
Survey
2005 DHS 2009 CFSVA and Nutrition
Survey South 87.7 91.4 89.2 91.3 West 92.4 89.1 75.7 89.6 North 92.9 91.3 90.4 91.9 East 89.2 91.6 84.2 90.6
Comparing the 2009 CFSVA and Nutrition Survey data with the 2007 mini-DHS and 2005 DHS results suggest an overall improvement for both indicators, especially in the provinces of the South and East.
WOMEN’S NUTRITIONAL STATUS
Two indicators were used to evaluate women’s nutritional status: the body mass index (BMI) and the middle-upper arm circumference (MUAC). The measures were taken on all the non-pregnant women aged 15-49 years old in the sampled households. Among the 6,082 sampled women, 5,528 could be assigned a BMI and 5,936 had a valid MUAC measure.
Women’s Body Mass Index
The BMI is equal to the weight (in kg) divided by the height squared (m2). The following categories are distinguished:
BMI: < 16 16.0-16.99 17.0 - 18.49 18.5 – 24.99 >= 25 Severely
Thin Moderately Thin
Mildly Thin
Normal Overweight
Using the BMI, the survey data shows that 7% of the women are thin (95% CI, 6.3%-9.1%), including 0.5% severely thin (95% CI: 0.4%-0.8%), 1.3% moderately thin (95%CI: 1.0%-1.7%), and 5.3% mildly thin (96% CI 4.6%-6.1%). This suggests an improvement compared to the 2005 DHS data that found 10% of malnourished women, including 1% severely thin, 2% moderately thin, and 7% mildly thin. It is however important to note that differences may result from changes in methodology and cycles reflecting the time of data collection (e.g., after or before harvest). Looking at the provincial level, the results suggest an overall improvement in all the provinces, while relative differences remained. In 2005, with
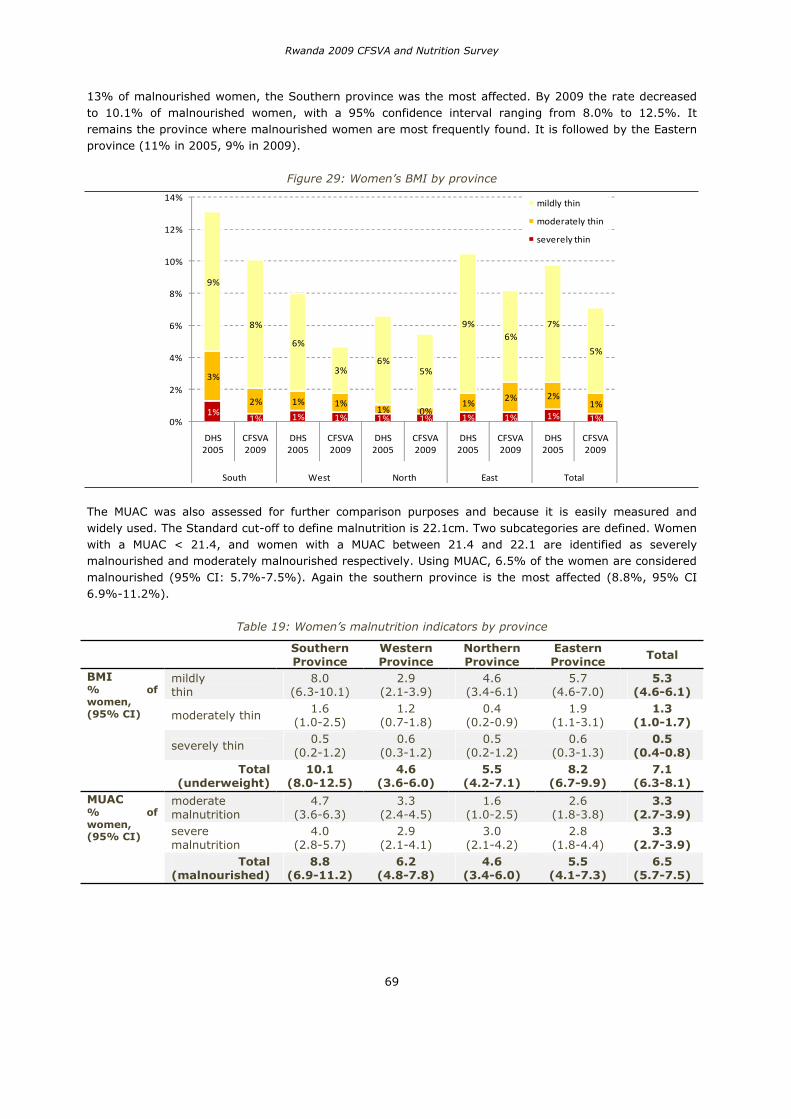
Rwanda 2009 CFSVA and Nutrition Survey
69
13% of malnourished women, the Southern province was the most affected. By 2009 the rate decreased to 10.1% of malnourished women, with a 95% confidence interval ranging from 8.0% to 12.5%. It remains the province where malnourished women are most frequently found. It is followed by the Eastern province (11% in 2005, 9% in 2009).
Figure 29: Women’s BMI by province
1%1% 1% 1% 1% 1% 1% 1% 1% 1%
3%
2% 1% 1%1% 0%
1% 2% 2%1%
9%
8%
6%
3%6%
5%
9%6%
7%
5%
0%
2%
4%
6%
8%
10%
12%
14%
DHS2005
CFSVA2009
DHS2005
CFSVA2009
DHS2005
CFSVA2009
DHS2005
CFSVA2009
DHS2005
CFSVA2009
South West North East Total
mildly thin
moderately thin
severely thin
The MUAC was also assessed for further comparison purposes and because it is easily measured and widely used. The Standard cut-off to define malnutrition is 22.1cm. Two subcategories are defined. Women with a MUAC < 21.4, and women with a MUAC between 21.4 and 22.1 are identified as severely malnourished and moderately malnourished respectively. Using MUAC, 6.5% of the women are considered malnourished (95% CI: 5.7%-7.5%). Again the southern province is the most affected (8.8%, 95% CI 6.9%-11.2%).
Table 19: Women’s malnutrition indicators by province
Southern Province
Western Province
Northern Province
Eastern Province
Total
BMI % of women, (95% CI)
mildly thin
8.0 (6.3-10.1)
2.9 (2.1-3.9)
4.6 (3.4-6.1)
5.7(4.6-7.0)
5.3(4.6-6.1)
moderately thin 1.6 (1.0-2.5)
1.2 (0.7-1.8)
0.4 (0.2-0.9)
1.9(1.1-3.1)
1.3(1.0-1.7)
severely thin 0.5 (0.2-1.2)
0.6 (0.3-1.2)
0.5 (0.2-1.2)
0.6(0.3-1.3)
0.5(0.4-0.8)
Total(underweight)
10.1 (8.0-12.5)
4.6(3.6-6.0)
5.5 (4.2-7.1)
8.2 (6.7-9.9)
7.1(6.3-8.1)
MUAC % of women, (95% CI)
moderate malnutrition
4.7 (3.6-6.3)
3.3 (2.4-4.5)
1.6 (1.0-2.5)
2.6(1.8-3.8)
3.3(2.7-3.9)
severe malnutrition
4.0 (2.8-5.7)
2.9 (2.1-4.1)
3.0 (2.1-4.2)
2.8(1.8-4.4)
3.3(2.7-3.9)
Total (malnourished)
8.8(6.9-11.2)
6.2(4.8-7.8)
4.6 (3.4-6.0)
5.5 (4.1-7.3)
6.5(5.7-7.5)
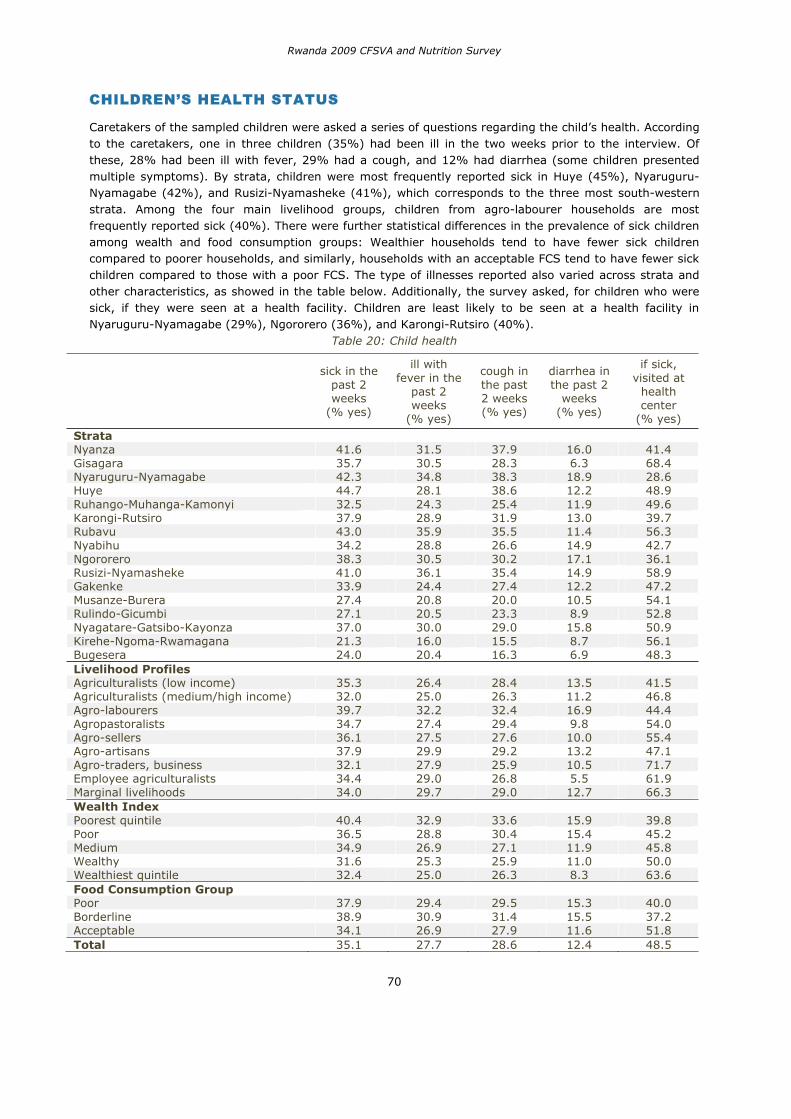
Rwanda 2009 CFSVA and Nutrition Survey
70
CHILDREN’S HEALTH STATUS
Caretakers of the sampled children were asked a series of questions regarding the child’s health. According to the caretakers, one in three children (35%) had been ill in the two weeks prior to the interview. Of these, 28% had been ill with fever, 29% had a cough, and 12% had diarrhea (some children presented multiple symptoms). By strata, children were most frequently reported sick in Huye (45%), Nyaruguru-Nyamagabe (42%), and Rusizi-Nyamasheke (41%), which corresponds to the three most south-western strata. Among the four main livelihood groups, children from agro-labourer households are most frequently reported sick (40%). There were further statistical differences in the prevalence of sick children among wealth and food consumption groups: Wealthier households tend to have fewer sick children compared to poorer households, and similarly, households with an acceptable FCS tend to have fewer sick children compared to those with a poor FCS. The type of illnesses reported also varied across strata and other characteristics, as showed in the table below. Additionally, the survey asked, for children who were sick, if they were seen at a health facility. Children are least likely to be seen at a health facility in Nyaruguru-Nyamagabe (29%), Ngororero (36%), and Karongi-Rutsiro (40%).
Table 20: Child health
sick in the past 2 weeks
(% yes)
ill with fever in the
past 2 weeks
(% yes)
cough in the past 2 weeks (% yes)
diarrhea in the past 2
weeks (% yes)
if sick, visited at
health center
(% yes)
Strata Nyanza 41.6 31.5 37.9 16.0 41.4 Gisagara 35.7 30.5 28.3 6.3 68.4 Nyaruguru-Nyamagabe 42.3 34.8 38.3 18.9 28.6 Huye 44.7 28.1 38.6 12.2 48.9 Ruhango-Muhanga-Kamonyi 32.5 24.3 25.4 11.9 49.6 Karongi-Rutsiro 37.9 28.9 31.9 13.0 39.7 Rubavu 43.0 35.9 35.5 11.4 56.3 Nyabihu 34.2 28.8 26.6 14.9 42.7 Ngororero 38.3 30.5 30.2 17.1 36.1 Rusizi-Nyamasheke 41.0 36.1 35.4 14.9 58.9 Gakenke 33.9 24.4 27.4 12.2 47.2 Musanze-Burera 27.4 20.8 20.0 10.5 54.1 Rulindo-Gicumbi 27.1 20.5 23.3 8.9 52.8 Nyagatare-Gatsibo-Kayonza 37.0 30.0 29.0 15.8 50.9 Kirehe-Ngoma-Rwamagana 21.3 16.0 15.5 8.7 56.1 Bugesera 24.0 20.4 16.3 6.9 48.3 Livelihood Profiles Agriculturalists (low income) 35.3 26.4 28.4 13.5 41.5 Agriculturalists (medium/high income) 32.0 25.0 26.3 11.2 46.8 Agro-labourers 39.7 32.2 32.4 16.9 44.4 Agropastoralists 34.7 27.4 29.4 9.8 54.0 Agro-sellers 36.1 27.5 27.6 10.0 55.4 Agro-artisans 37.9 29.9 29.2 13.2 47.1 Agro-traders, business 32.1 27.9 25.9 10.5 71.7 Employee agriculturalists 34.4 29.0 26.8 5.5 61.9 Marginal livelihoods 34.0 29.7 29.0 12.7 66.3 Wealth Index Poorest quintile 40.4 32.9 33.6 15.9 39.8 Poor 36.5 28.8 30.4 15.4 45.2 Medium 34.9 26.9 27.1 11.9 45.8 Wealthy 31.6 25.3 25.9 11.0 50.0 Wealthiest quintile 32.4 25.0 26.3 8.3 63.6 Food Consumption Group Poor 37.9 29.4 29.5 15.3 40.0 Borderline 38.9 30.9 31.4 15.5 37.2 Acceptable 34.1 26.9 27.9 11.6 51.8 Total 35.1 27.7 28.6 12.4 48.5
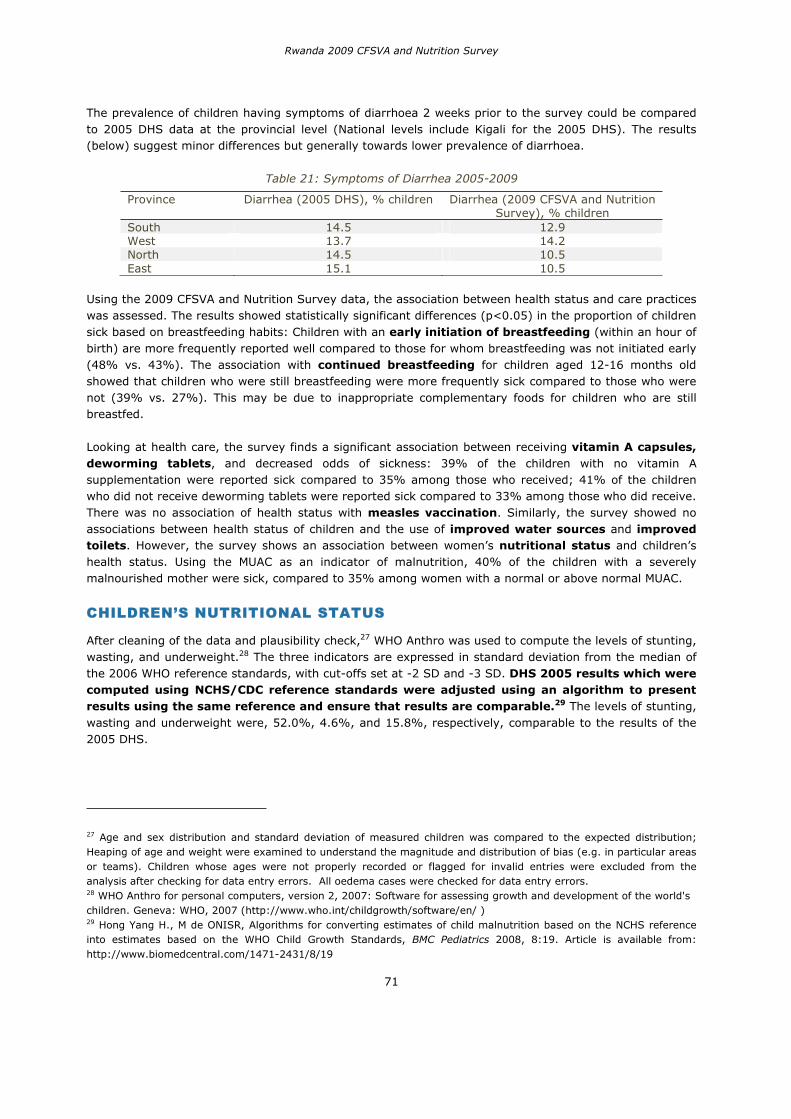
Rwanda 2009 CFSVA and Nutrition Survey
71
The prevalence of children having symptoms of diarrhoea 2 weeks prior to the survey could be compared to 2005 DHS data at the provincial level (National levels include Kigali for the 2005 DHS). The results (below) suggest minor differences but generally towards lower prevalence of diarrhoea.
Table 21: Symptoms of Diarrhea 2005-2009
Province Diarrhea (2005 DHS), % children Diarrhea (2009 CFSVA and Nutrition Survey), % children
South 14.5 12.9 West 13.7 14.2 North 14.5 10.5 East 15.1 10.5
Using the 2009 CFSVA and Nutrition Survey data, the association between health status and care practices was assessed. The results showed statistically significant differences (p<0.05) in the proportion of children sick based on breastfeeding habits: Children with an early initiation of breastfeeding (within an hour of birth) are more frequently reported well compared to those for whom breastfeeding was not initiated early (48% vs. 43%). The association with continued breastfeeding for children aged 12-16 months old showed that children who were still breastfeeding were more frequently sick compared to those who were not (39% vs. 27%). This may be due to inappropriate complementary foods for children who are still breastfed.
Looking at health care, the survey finds a significant association between receiving vitamin A capsules, deworming tablets, and decreased odds of sickness: 39% of the children with no vitamin A supplementation were reported sick compared to 35% among those who received; 41% of the children who did not receive deworming tablets were reported sick compared to 33% among those who did receive. There was no association of health status with measles vaccination. Similarly, the survey showed no associations between health status of children and the use of improved water sources and improved toilets. However, the survey shows an association between women’s nutritional status and children’s health status. Using the MUAC as an indicator of malnutrition, 40% of the children with a severely malnourished mother were sick, compared to 35% among women with a normal or above normal MUAC.
CHILDREN’S NUTRITIONAL STATUS
After cleaning of the data and plausibility check,27 WHO Anthro was used to compute the levels of stunting, wasting, and underweight.28 The three indicators are expressed in standard deviation from the median of the 2006 WHO reference standards, with cut-offs set at -2 SD and -3 SD. DHS 2005 results which were computed using NCHS/CDC reference standards were adjusted using an algorithm to present results using the same reference and ensure that results are comparable.29 The levels of stunting, wasting and underweight were, 52.0%, 4.6%, and 15.8%, respectively, comparable to the results of the 2005 DHS.
27 Age and sex distribution and standard deviation of measured children was compared to the expected distribution; Heaping of age and weight were examined to understand the magnitude and distribution of bias (e.g. in particular areas or teams). Children whose ages were not properly recorded or flagged for invalid entries were excluded from the analysis after checking for data entry errors. All oedema cases were checked for data entry errors.28 WHO Anthro for personal computers, version 2, 2007: Software for assessing growth and development of the world's children. Geneva: WHO, 2007 (http://www.who.int/childgrowth/software/en/ )29 Hong Yang H., M de ONISR, Algorithms for converting estimates of child malnutrition based on the NCHS reference into estimates based on the WHO Child Growth Standards, BMC Pediatrics 2008, 8:19. Article is available from: http://www.biomedcentral.com/1471-2431/8/19
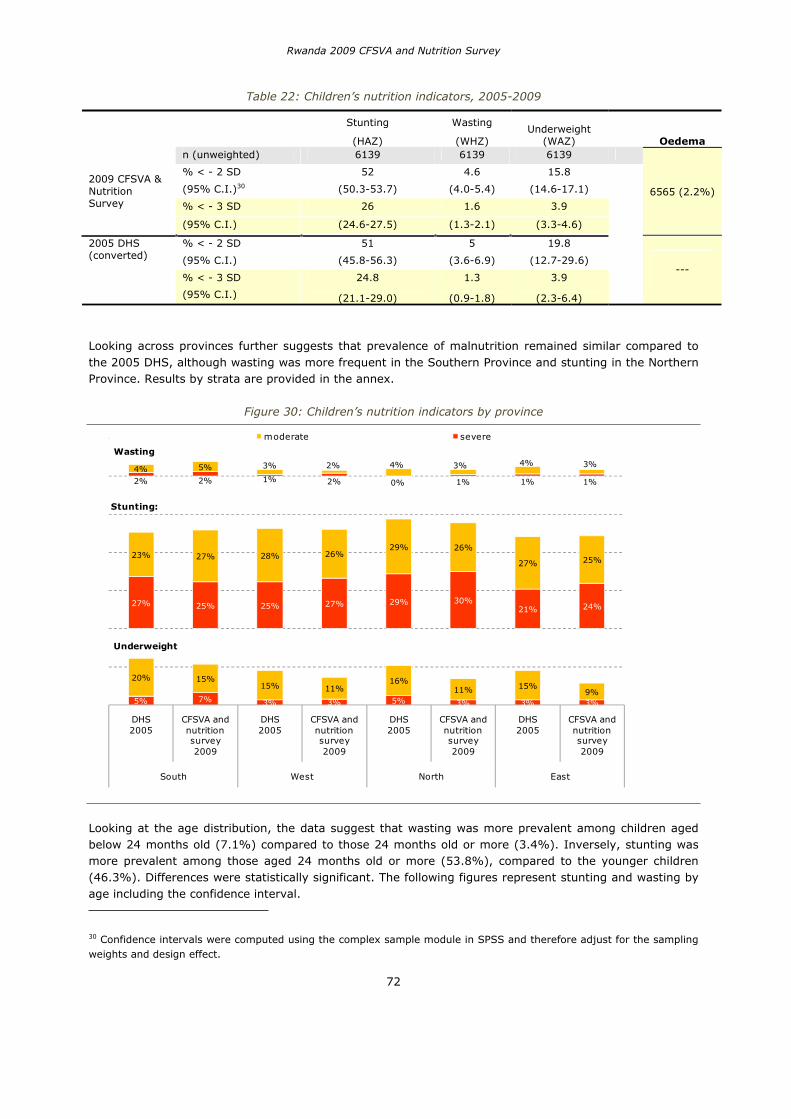
Rwanda 2009 CFSVA and Nutrition Survey
72
Table 22: Children’s nutrition indicators, 2005-2009
Stunting WastingUnderweight
(WAZ) Oedema (HAZ) (WHZ)
2009 CFSVA & Nutrition Survey
n (unweighted) 6139 6139 6139
6565 (2.2%)
% < - 2 SD 52 4.6 15.8
(95% C.I.)30 (50.3-53.7) (4.0-5.4) (14.6-17.1)
% < - 3 SD 26 1.6 3.9
(95% C.I.) (24.6-27.5) (1.3-2.1) (3.3-4.6)
2005 DHS (converted)
% < - 2 SD 51 5 19.8
--- (95% C.I.) (45.8-56.3) (3.6-6.9) (12.7-29.6)
% < - 3 SD 24.8 1.3 3.9
(95% C.I.) (21.1-29.0) (0.9-1.8) (2.3-6.4)
Looking across provinces further suggests that prevalence of malnutrition remained similar compared to the 2005 DHS, although wasting was more frequent in the Southern Province and stunting in the Northern Province. Results by strata are provided in the annex.
Figure 30: Children’s nutrition indicators by province
5% 7% 3% 3% 5% 3% 3% 3%
20% 15%15% 11%
16%11% 15%
9%
27% 25% 25% 27% 29% 30%21% 24%
23% 27% 28% 26%29% 26%
27% 25%
2% 2% 1% 2% 0% 1% 1% 1%
4% 5% 3% 2% 4% 3% 4% 3%
DHS 2005
CFSVA and nutrition survey 2009
DHS 2005
CFSVA and nutrition survey 2009
DHS 2005
CFSVA and nutrition survey 2009
DHS 2005
CFSVA and nutrition survey 2009
South West North East
Wasting
Stunting:
Underweight
moderate severe
Looking at the age distribution, the data suggest that wasting was more prevalent among children aged below 24 months old (7.1%) compared to those 24 months old or more (3.4%). Inversely, stunting was more prevalent among those aged 24 months old or more (53.8%), compared to the younger children (46.3%). Differences were statistically significant. The following figures represent stunting and wasting by age including the confidence interval.
30 Confidence intervals were computed using the complex sample module in SPSS and therefore adjust for the sampling weights and design effect.
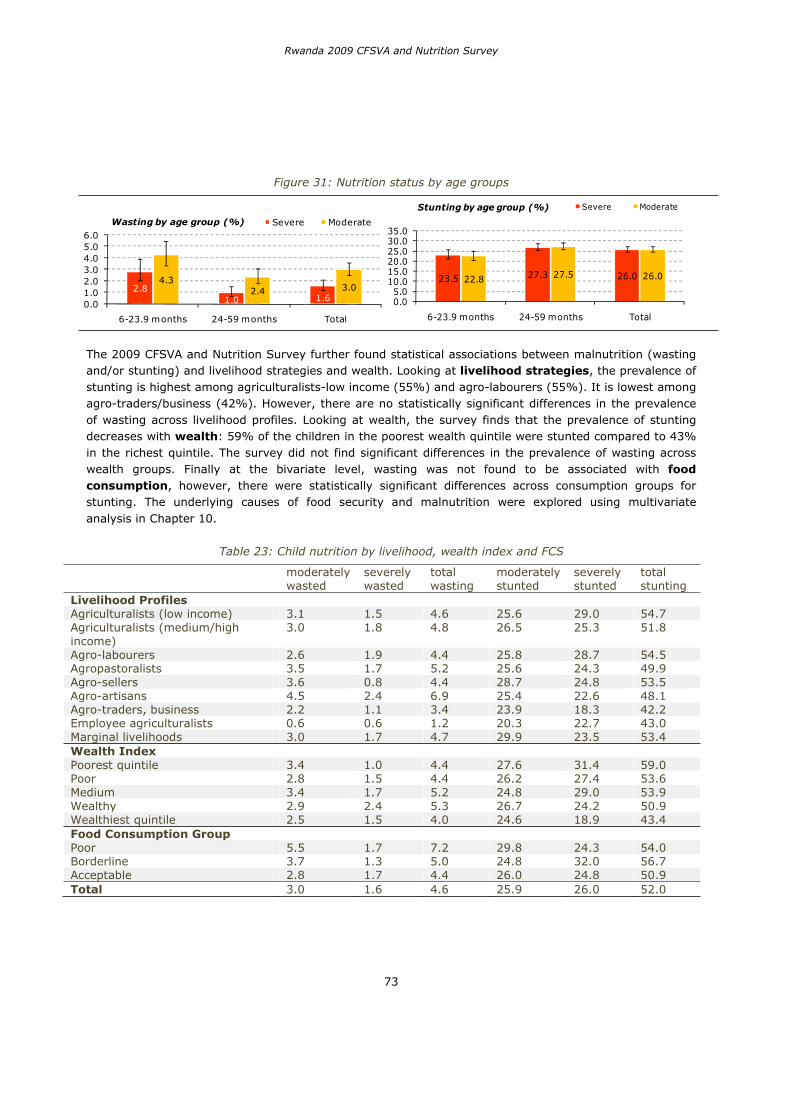
Rwanda 2009 CFSVA and Nutrition Survey
73
Figure 31: Nutrition status by age groups
2.81.0 1.6
4.32.4 3.0
0.01.02.03.04.05.06.0
6-23.9 months 24-59 months Total
Wasting by age group (%) Severe Moderate
23.5 27.3 26.022.8 27.5 26.0
0.05.0
10.015.020.025.030.035.0
6-23.9 months 24-59 months Total
Stunting by age group (%) Severe Moderate
The 2009 CFSVA and Nutrition Survey further found statistical associations between malnutrition (wasting and/or stunting) and livelihood strategies and wealth. Looking at livelihood strategies, the prevalence of stunting is highest among agriculturalists-low income (55%) and agro-labourers (55%). It is lowest among agro-traders/business (42%). However, there are no statistically significant differences in the prevalence of wasting across livelihood profiles. Looking at wealth, the survey finds that the prevalence of stunting decreases with wealth: 59% of the children in the poorest wealth quintile were stunted compared to 43% in the richest quintile. The survey did not find significant differences in the prevalence of wasting across wealth groups. Finally at the bivariate level, wasting was not found to be associated with foodconsumption, however, there were statistically significant differences across consumption groups for stunting. The underlying causes of food security and malnutrition were explored using multivariate analysis in Chapter 10.
Table 23: Child nutrition by livelihood, wealth index and FCS
moderately wasted
severely wasted
total wasting
moderatelystunted
severely stunted
total stunting
Livelihood Profiles Agriculturalists (low income) 3.1 1.5 4.6 25.6 29.0 54.7 Agriculturalists (medium/high income)
3.0 1.8 4.8 26.5 25.3 51.8
Agro-labourers 2.6 1.9 4.4 25.8 28.7 54.5 Agropastoralists 3.5 1.7 5.2 25.6 24.3 49.9 Agro-sellers 3.6 0.8 4.4 28.7 24.8 53.5 Agro-artisans 4.5 2.4 6.9 25.4 22.6 48.1 Agro-traders, business 2.2 1.1 3.4 23.9 18.3 42.2 Employee agriculturalists 0.6 0.6 1.2 20.3 22.7 43.0 Marginal livelihoods 3.0 1.7 4.7 29.9 23.5 53.4 Wealth Index Poorest quintile 3.4 1.0 4.4 27.6 31.4 59.0 Poor 2.8 1.5 4.4 26.2 27.4 53.6 Medium 3.4 1.7 5.2 24.8 29.0 53.9 Wealthy 2.9 2.4 5.3 26.7 24.2 50.9 Wealthiest quintile 2.5 1.5 4.0 24.6 18.9 43.4 Food Consumption Group Poor 5.5 1.7 7.2 29.8 24.3 54.0 Borderline 3.7 1.3 5.0 24.8 32.0 56.7 Acceptable 2.8 1.7 4.4 26.0 24.8 50.9 Total 3.0 1.6 4.6 25.9 26.0 52.0
Rwanda 2009 CFSVA and Nutrition Survey
74
9. RISK AND VULNERABILITY CONTEXT
RISK AND VULNERABILITY APPROACH
A household’s livelihood strategies and outcomes, including food security, are influenced by the environment in which the people live. Within this environment, critical trends (e.g. population growth, national and international economic trends, governance and technological changes), seasonal cycles (of prices, production, livelihood strategies), and shocks (natural and man-made) frame the vulnerability context.31 Within that context, the risk to food insecurity is defined as the interaction between the probability of a given hazard of certain intensity, the vulnerability of the population to the hazard and the size of the population.
R = H x VUL x POP with R = Risk to food insecurity: Probability of harmful consequence or expected losses (specifically with regards to food security)
H = Hazard: Probability of occurrence of a potentially damaging phenomenon within a given time period and area
VUL = Vulnerability of a household to the impact of a specific hazard POP = Population living in the area at risk
The analysis below provides a discussion of the general vulnerability context and risk to food insecurity focusing on shocks. Critical trends have been discussed in parts of this report (introduction, demographics).
SHOCKS
Reported Shocks
The 2009 CFSVA and Nutrition Survey asked households whether or not they had been exposed to any unusual situation during the last year that affected the household’s ability to provide for itself, eat in the manner they are accustomed to, or affected what the households owned. Nationally, 44% of the sampled households experienced such situations. It was most frequently reported in Bugesera (87%), Nyanza (71%), and Gisagara (60%). Among livelihood groups, agro-sellers (55%) and agro-labourers (51%) most frequently reported having experienced such situations. Finally, households in the lower wealth quintile and with a poorer food consumption score tended to report more frequently having experienced such a situation compared to others. The most commonly reported shocks were droughts, irregular rains or dry spells (23%) followed by illness/accident of a household member (8.5%). All the other shocks were reported by less than 5% of the sampled households, including, human diseases (in general, 3.2%), floods (2.7%), crop diseases (2.7%), high food prices (2.5%), and hailstones (2.4%).
31 DFID (1999) Sustainable Livelihoods Guidance Sheet, Department for International Development
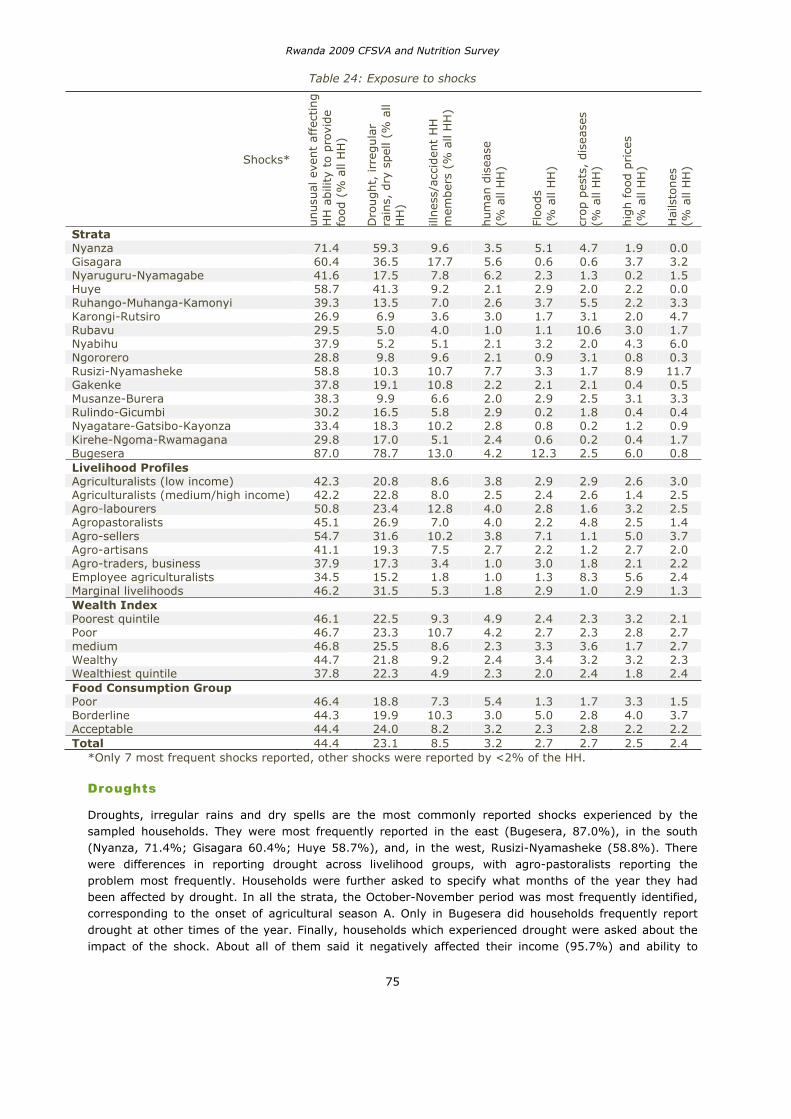
Rwanda 2009 CFSVA and Nutrition Survey
75
Table 24: Exposure to shocks
Shocks*
unusu
al e
vent
affe
ctin
gH
H a
bili
ty t
o p
rovi
de
food
(%
all
HH
)
Dro
ught,
irr
egula
r ra
ins,
dry
spel
l (%
all
HH
)
illnes
s/ac
ciden
t H
H
mem
ber
s (%
all
HH
)
hum
an d
isea
se
(% a
ll H
H)
Floods
(% a
ll H
H)
crop
pes
ts,
dis
ease
s (%
all
HH
)
hig
h f
ood p
rice
s
(% a
ll H
H)
Hai
lsto
nes
(% a
ll H
H)
Strata Nyanza 71.4 59.3 9.6 3.5 5.1 4.7 1.9 0.0Gisagara 60.4 36.5 17.7 5.6 0.6 0.6 3.7 3.2 Nyaruguru-Nyamagabe 41.6 17.5 7.8 6.2 2.3 1.3 0.2 1.5Huye 58.7 41.3 9.2 2.1 2.9 2.0 2.2 0.0 Ruhango-Muhanga-Kamonyi 39.3 13.5 7.0 2.6 3.7 5.5 2.2 3.3Karongi-Rutsiro 26.9 6.9 3.6 3.0 1.7 3.1 2.0 4.7 Rubavu 29.5 5.0 4.0 1.0 1.1 10.6 3.0 1.7Nyabihu 37.9 5.2 5.1 2.1 3.2 2.0 4.3 6.0 Ngororero 28.8 9.8 9.6 2.1 0.9 3.1 0.8 0.3Rusizi-Nyamasheke 58.8 10.3 10.7 7.7 3.3 1.7 8.9 11.7 Gakenke 37.8 19.1 10.8 2.2 2.1 2.1 0.4 0.5Musanze-Burera 38.3 9.9 6.6 2.0 2.9 2.5 3.1 3.3 Rulindo-Gicumbi 30.2 16.5 5.8 2.9 0.2 1.8 0.4 0.4Nyagatare-Gatsibo-Kayonza 33.4 18.3 10.2 2.8 0.8 0.2 1.2 0.9 Kirehe-Ngoma-Rwamagana 29.8 17.0 5.1 2.4 0.6 0.2 0.4 1.7Bugesera 87.0 78.7 13.0 4.2 12.3 2.5 6.0 0.8 Livelihood Profiles Agriculturalists (low income) 42.3 20.8 8.6 3.8 2.9 2.9 2.6 3.0Agriculturalists (medium/high income) 42.2 22.8 8.0 2.5 2.4 2.6 1.4 2.5 Agro-labourers 50.8 23.4 12.8 4.0 2.8 1.6 3.2 2.5Agropastoralists 45.1 26.9 7.0 4.0 2.2 4.8 2.5 1.4 Agro-sellers 54.7 31.6 10.2 3.8 7.1 1.1 5.0 3.7Agro-artisans 41.1 19.3 7.5 2.7 2.2 1.2 2.7 2.0 Agro-traders, business 37.9 17.3 3.4 1.0 3.0 1.8 2.1 2.2Employee agriculturalists 34.5 15.2 1.8 1.0 1.3 8.3 5.6 2.4 Marginal livelihoods 46.2 31.5 5.3 1.8 2.9 1.0 2.9 1.3Wealth Index Poorest quintile 46.1 22.5 9.3 4.9 2.4 2.3 3.2 2.1Poor 46.7 23.3 10.7 4.2 2.7 2.3 2.8 2.7 medium 46.8 25.5 8.6 2.3 3.3 3.6 1.7 2.7Wealthy 44.7 21.8 9.2 2.4 3.4 3.2 3.2 2.3 Wealthiest quintile 37.8 22.3 4.9 2.3 2.0 2.4 1.8 2.4Food Consumption Group Poor 46.4 18.8 7.3 5.4 1.3 1.7 3.3 1.5Borderline 44.3 19.9 10.3 3.0 5.0 2.8 4.0 3.7 Acceptable 44.4 24.0 8.2 3.2 2.3 2.8 2.2 2.2Total 44.4 23.1 8.5 3.2 2.7 2.7 2.5 2.4
*Only 7 most frequent shocks reported, other shocks were reported by <2% of the HH.
Droughts
Droughts, irregular rains and dry spells are the most commonly reported shocks experienced by the sampled households. They were most frequently reported in the east (Bugesera, 87.0%), in the south (Nyanza, 71.4%; Gisagara 60.4%; Huye 58.7%), and, in the west, Rusizi-Nyamasheke (58.8%). There were differences in reporting drought across livelihood groups, with agro-pastoralists reporting the problem most frequently. Households were further asked to specify what months of the year they had been affected by drought. In all the strata, the October-November period was most frequently identified, corresponding to the onset of agricultural season A. Only in Bugesera did households frequently report drought at other times of the year. Finally, households which experienced drought were asked about the impact of the shock. About all of them said it negatively affected their income (95.7%) and ability to
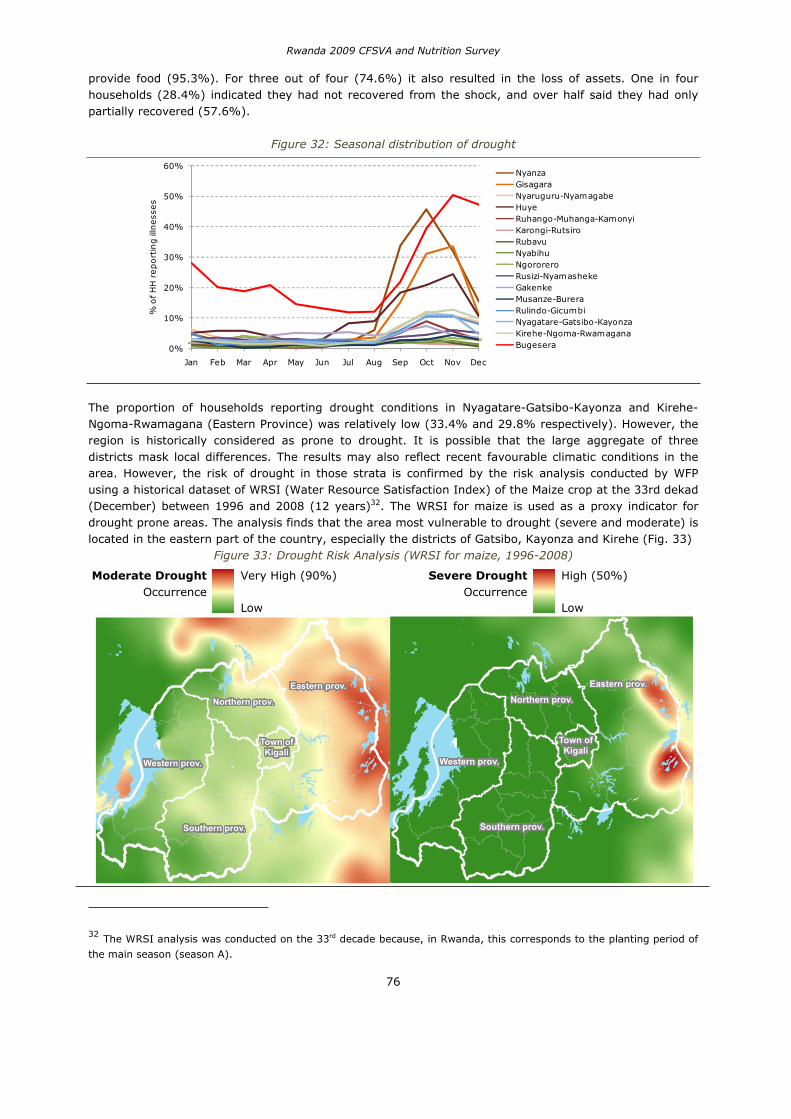
Rwanda 2009 CFSVA and Nutrition Survey
76
provide food (95.3%). For three out of four (74.6%) it also resulted in the loss of assets. One in four households (28.4%) indicated they had not recovered from the shock, and over half said they had only partially recovered (57.6%).
Figure 32: Seasonal distribution of drought
0%
10%
20%
30%
40%
50%
60%
Jan Feb Mar Apr May Jun Jul Aug Sep Oct Nov Dec
% o
f H
H r
eport
ing il
lness
es
NyanzaGisagaraNyaruguru-NyamagabeHuyeRuhango-Muhanga-KamonyiKarongi-RutsiroRubavuNyabihuNgororeroRusizi-NyamashekeGakenkeMusanze-BureraRulindo-GicumbiNyagatare-Gatsibo-KayonzaKirehe-Ngoma-RwamaganaBugesera
The proportion of households reporting drought conditions in Nyagatare-Gatsibo-Kayonza and Kirehe-Ngoma-Rwamagana (Eastern Province) was relatively low (33.4% and 29.8% respectively). However, the region is historically considered as prone to drought. It is possible that the large aggregate of three districts mask local differences. The results may also reflect recent favourable climatic conditions in the area. However, the risk of drought in those strata is confirmed by the risk analysis conducted by WFP using a historical dataset of WRSI (Water Resource Satisfaction Index) of the Maize crop at the 33rd dekad (December) between 1996 and 2008 (12 years)32. The WRSI for maize is used as a proxy indicator for drought prone areas. The analysis finds that the area most vulnerable to drought (severe and moderate) is located in the eastern part of the country, especially the districts of Gatsibo, Kayonza and Kirehe (Fig. 33)
Figure 33: Drought Risk Analysis (WRSI for maize, 1996-2008)
Moderate DroughtOccurrence
Very High (90%) Severe DroughtOccurrence
High (50%)
Low Low
Western prov.
Southern prov.
Town ofKigali
Northern prov.
Eastern prov.
Western prov.
Southern prov.
Town ofKigali
Northern prov.
Eastern prov.
32 The WRSI analysis was conducted on the 33rd decade because, in Rwanda, this corresponds to the planting period of
the main season (season A).
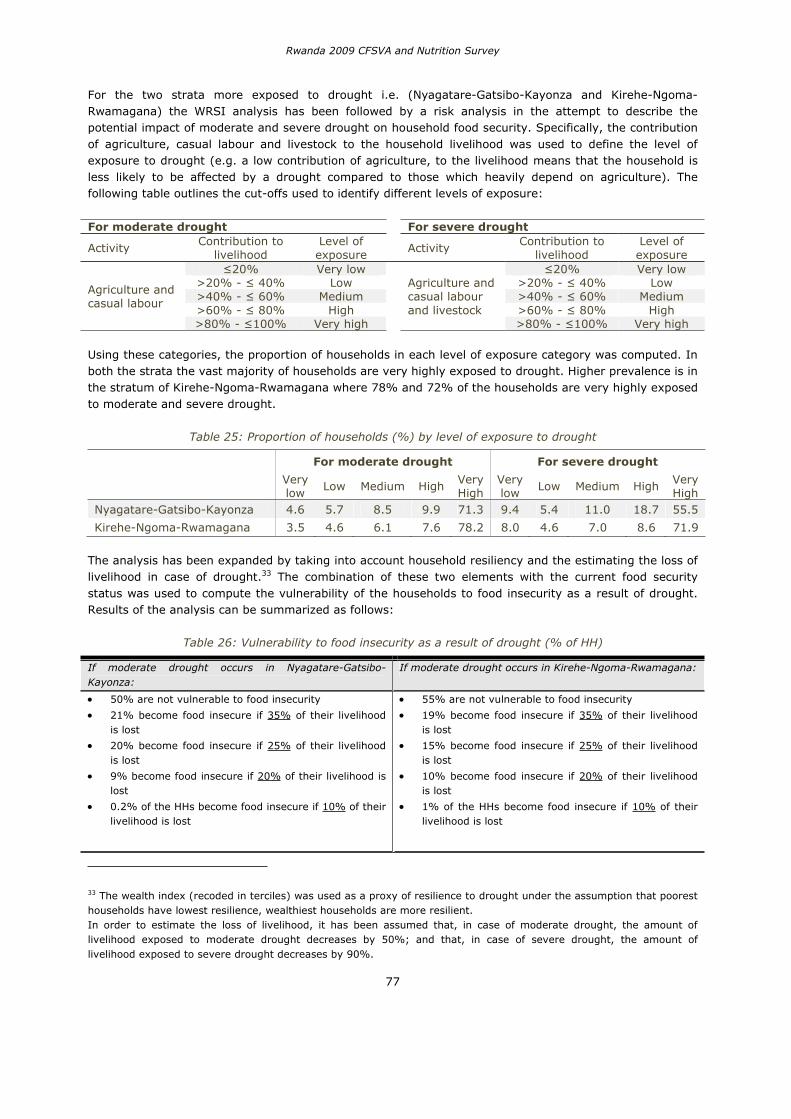
Rwanda 2009 CFSVA and Nutrition Survey
77
For the two strata more exposed to drought i.e. (Nyagatare-Gatsibo-Kayonza and Kirehe-Ngoma-Rwamagana) the WRSI analysis has been followed by a risk analysis in the attempt to describe the potential impact of moderate and severe drought on household food security. Specifically, the contribution of agriculture, casual labour and livestock to the household livelihood was used to define the level of exposure to drought (e.g. a low contribution of agriculture, to the livelihood means that the household is less likely to be affected by a drought compared to those which heavily depend on agriculture). The following table outlines the cut-offs used to identify different levels of exposure:
For moderate drought For severe drought
Activity Contribution to
livelihood Level of exposure Activity
Contribution to livelihood
Level of exposure
Agriculture and casual labour
20% Very low Agriculture and casual labour and livestock
20% Very low >20% - 40% Low >20% - 40% Low >40% - 60% Medium >40% - 60% Medium >60% - 80% High >60% - 80% High >80% - 100% Very high >80% - 100% Very high
Using these categories, the proportion of households in each level of exposure category was computed. In both the strata the vast majority of households are very highly exposed to drought. Higher prevalence is in the stratum of Kirehe-Ngoma-Rwamagana where 78% and 72% of the households are very highly exposed to moderate and severe drought.
Table 25: Proportion of households (%) by level of exposure to drought
For moderate drought For severe drought
Very low Low Medium High
Very High
Very low Low Medium High
Very High
Nyagatare-Gatsibo-Kayonza 4.6 5.7 8.5 9.9 71.3 9.4 5.4 11.0 18.7 55.5
Kirehe-Ngoma-Rwamagana 3.5 4.6 6.1 7.6 78.2 8.0 4.6 7.0 8.6 71.9
The analysis has been expanded by taking into account household resiliency and the estimating the loss of livelihood in case of drought.33 The combination of these two elements with the current food security status was used to compute the vulnerability of the households to food insecurity as a result of drought. Results of the analysis can be summarized as follows:
Table 26: Vulnerability to food insecurity as a result of drought (% of HH)
If moderate drought occurs in Nyagatare-Gatsibo-Kayonza:
If moderate drought occurs in Kirehe-Ngoma-Rwamagana:
50% are not vulnerable to food insecurity
21% become food insecure if 35% of their livelihood is lost
20% become food insecure if 25% of their livelihood is lost
9% become food insecure if 20% of their livelihood is lost
0.2% of the HHs become food insecure if 10% of their livelihood is lost
55% are not vulnerable to food insecurity
19% become food insecure if 35% of their livelihood is lost
15% become food insecure if 25% of their livelihood is lost
10% become food insecure if 20% of their livelihood is lost
1% of the HHs become food insecure if 10% of their livelihood is lost
33 The wealth index (recoded in terciles) was used as a proxy of resilience to drought under the assumption that poorest households have lowest resilience, wealthiest households are more resilient. In order to estimate the loss of livelihood, it has been assumed that, in case of moderate drought, the amount of livelihood exposed to moderate drought decreases by 50%; and that, in case of severe drought, the amount of livelihood exposed to severe drought decreases by 90%.
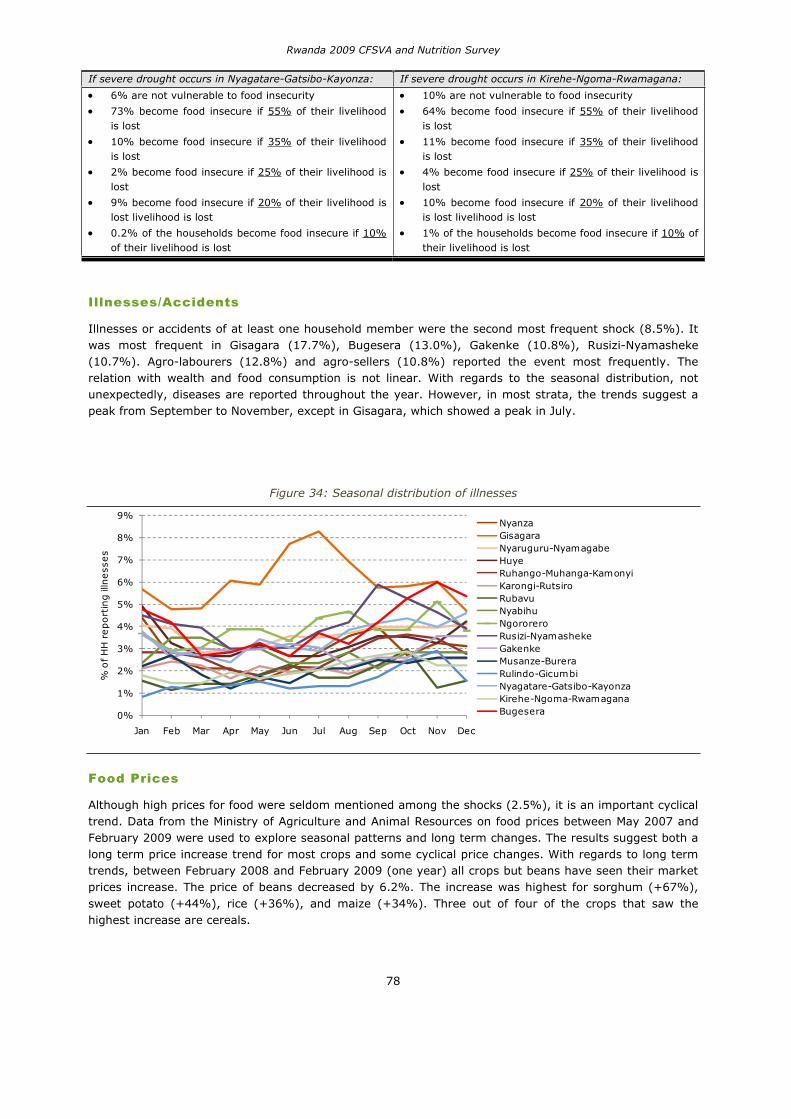
Rwanda 2009 CFSVA and Nutrition Survey
78
If severe drought occurs in Nyagatare-Gatsibo-Kayonza: If severe drought occurs in Kirehe-Ngoma-Rwamagana:
6% are not vulnerable to food insecurity
73% become food insecure if 55% of their livelihood is lost
10% become food insecure if 35% of their livelihood is lost
2% become food insecure if 25% of their livelihood is lost
9% become food insecure if 20% of their livelihood is lost livelihood is lost
0.2% of the households become food insecure if 10%of their livelihood is lost
10% are not vulnerable to food insecurity
64% become food insecure if 55% of their livelihood is lost
11% become food insecure if 35% of their livelihood is lost
4% become food insecure if 25% of their livelihood is lost
10% become food insecure if 20% of their livelihood is lost livelihood is lost
1% of the households become food insecure if 10% of their livelihood is lost
Illnesses/Accidents
Illnesses or accidents of at least one household member were the second most frequent shock (8.5%). It was most frequent in Gisagara (17.7%), Bugesera (13.0%), Gakenke (10.8%), Rusizi-Nyamasheke (10.7%). Agro-labourers (12.8%) and agro-sellers (10.8%) reported the event most frequently. The relation with wealth and food consumption is not linear. With regards to the seasonal distribution, not unexpectedly, diseases are reported throughout the year. However, in most strata, the trends suggest a peak from September to November, except in Gisagara, which showed a peak in July.
Figure 34: Seasonal distribution of illnesses
0%
1%
2%
3%
4%
5%
6%
7%
8%
9%
Jan Feb Mar Apr May Jun Jul Aug Sep Oct Nov Dec
% o
f H
H r
eport
ing il
lness
es
NyanzaGisagaraNyaruguru-NyamagabeHuyeRuhango-Muhanga-KamonyiKarongi-RutsiroRubavuNyabihuNgororeroRusizi-NyamashekeGakenkeMusanze-BureraRulindo-GicumbiNyagatare-Gatsibo-KayonzaKirehe-Ngoma-RwamaganaBugesera
Food Prices
Although high prices for food were seldom mentioned among the shocks (2.5%), it is an important cyclical trend. Data from the Ministry of Agriculture and Animal Resources on food prices between May 2007 and February 2009 were used to explore seasonal patterns and long term changes. The results suggest both a long term price increase trend for most crops and some cyclical price changes. With regards to long term trends, between February 2008 and February 2009 (one year) all crops but beans have seen their market prices increase. The price of beans decreased by 6.2%. The increase was highest for sorghum (+67%), sweet potato (+44%), rice (+36%), and maize (+34%). Three out of four of the crops that saw the highest increase are cereals.
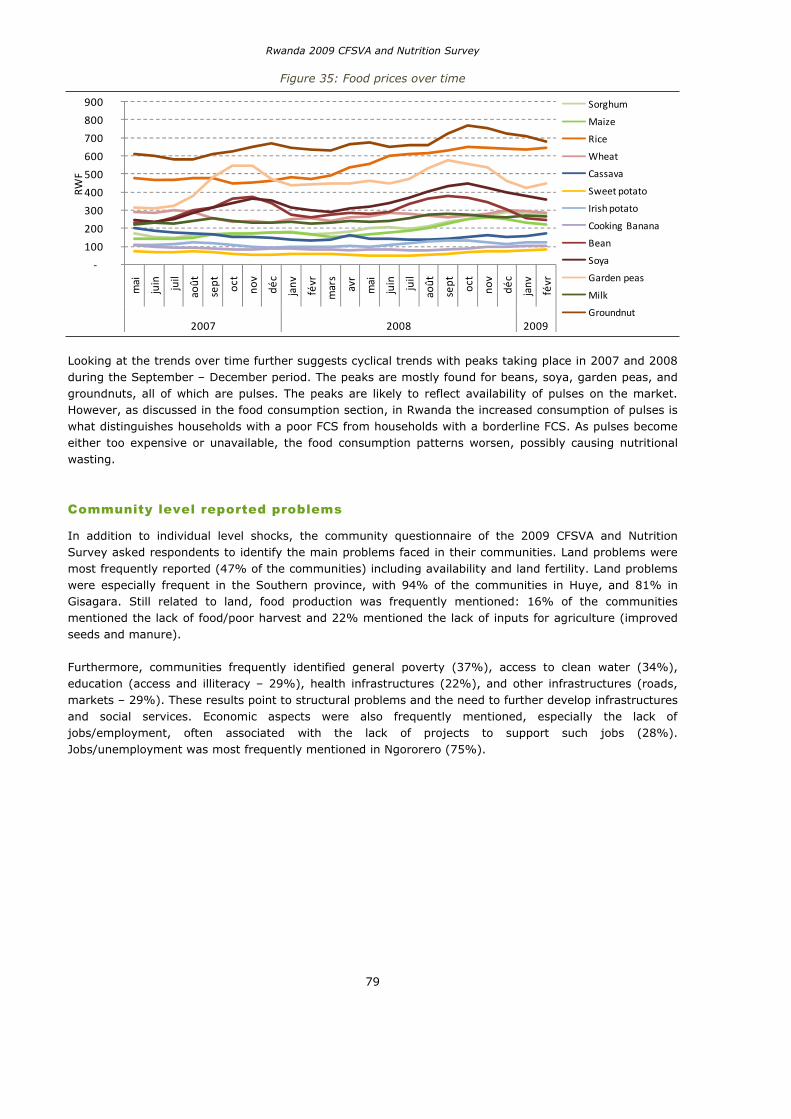
Rwanda 2009 CFSVA and Nutrition Survey
79
Figure 35: Food prices over time
100
200
300
400
500
600
700
800
900
mai
juin juil
août
sept oct
nov
déc
janv
févr
mars
avr
mai
juin juil
août
sept oct
nov
déc
janv
févr
2007 2008 2009
RWF
Sorghum
Maize
Rice
Wheat
Cassava
Sweet potato
Irishpotato
Cooking Banana
Bean
Soya
Garden peas
Milk
Groundnut
Looking at the trends over time further suggests cyclical trends with peaks taking place in 2007 and 2008 during the September – December period. The peaks are mostly found for beans, soya, garden peas, and groundnuts, all of which are pulses. The peaks are likely to reflect availability of pulses on the market. However, as discussed in the food consumption section, in Rwanda the increased consumption of pulses is what distinguishes households with a poor FCS from households with a borderline FCS. As pulses become either too expensive or unavailable, the food consumption patterns worsen, possibly causing nutritional wasting.
Community level reported problems
In addition to individual level shocks, the community questionnaire of the 2009 CFSVA and Nutrition Survey asked respondents to identify the main problems faced in their communities. Land problems were most frequently reported (47% of the communities) including availability and land fertility. Land problems were especially frequent in the Southern province, with 94% of the communities in Huye, and 81% in Gisagara. Still related to land, food production was frequently mentioned: 16% of the communities mentioned the lack of food/poor harvest and 22% mentioned the lack of inputs for agriculture (improved seeds and manure).
Furthermore, communities frequently identified general poverty (37%), access to clean water (34%), education (access and illiteracy – 29%), health infrastructures (22%), and other infrastructures (roads, markets – 29%). These results point to structural problems and the need to further develop infrastructures and social services. Economic aspects were also frequently mentioned, especially the lack of jobs/employment, often associated with the lack of projects to support such jobs (28%). Jobs/unemployment was most frequently mentioned in Ngororero (75%).
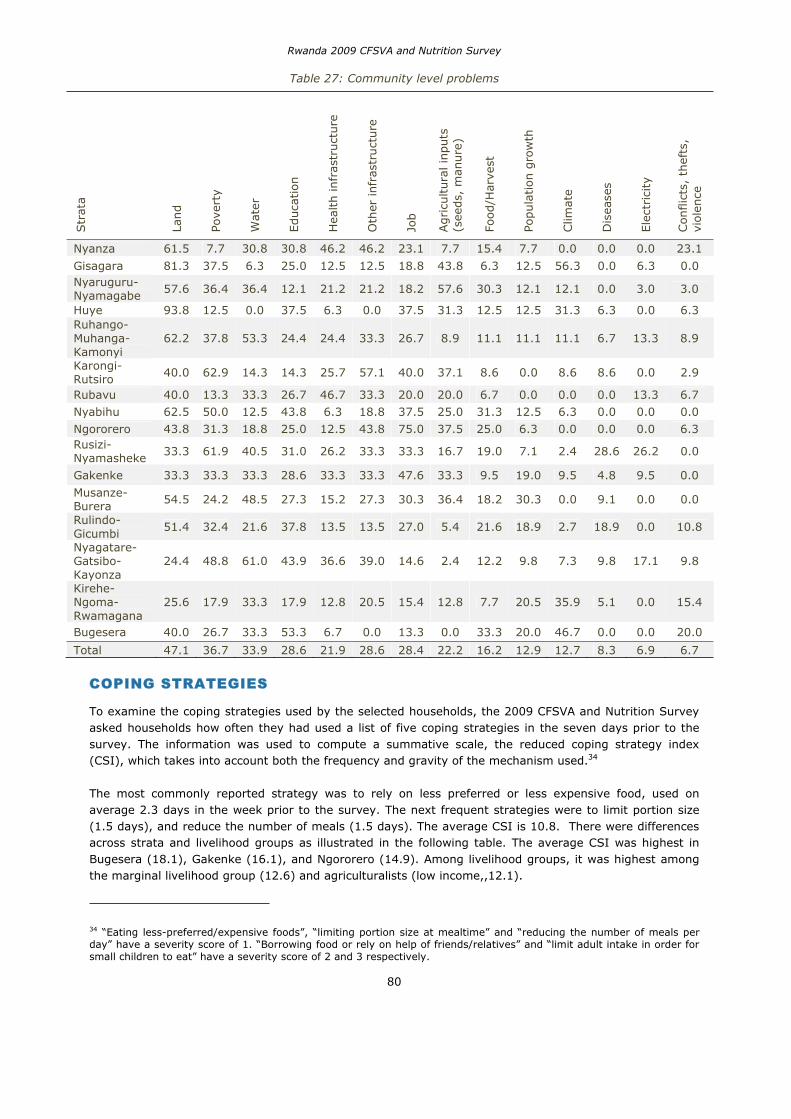
Rwanda 2009 CFSVA and Nutrition Survey
80
Table 27: Community level problems Str
ata
Land
Pove
rty
Wat
er
Educa
tion
Hea
lth infr
astr
uct
ure
Oth
er infr
astr
uct
ure
Job
Agricu
ltura
l in
puts
(s
eeds,
man
ure
)
Food/H
arve
st
Popula
tion g
row
th
Clim
ate
Dis
ease
s
Ele
ctrici
ty
Con
flic
ts,
thef
ts,
viole
nce
Nyanza 61.5 7.7 30.8 30.8 46.2 46.2 23.1 7.7 15.4 7.7 0.0 0.0 0.0 23.1
Gisagara 81.3 37.5 6.3 25.0 12.5 12.5 18.8 43.8 6.3 12.5 56.3 0.0 6.3 0.0 Nyaruguru-Nyamagabe
57.6 36.4 36.4 12.1 21.2 21.2 18.2 57.6 30.3 12.1 12.1 0.0 3.0 3.0
Huye 93.8 12.5 0.0 37.5 6.3 0.0 37.5 31.3 12.5 12.5 31.3 6.3 0.0 6.3 Ruhango-Muhanga-Kamonyi
62.2 37.8 53.3 24.4 24.4 33.3 26.7 8.9 11.1 11.1 11.1 6.7 13.3 8.9
Karongi-Rutsiro 40.0 62.9 14.3 14.3 25.7 57.1 40.0 37.1 8.6 0.0 8.6 8.6 0.0 2.9
Rubavu 40.0 13.3 33.3 26.7 46.7 33.3 20.0 20.0 6.7 0.0 0.0 0.0 13.3 6.7
Nyabihu 62.5 50.0 12.5 43.8 6.3 18.8 37.5 25.0 31.3 12.5 6.3 0.0 0.0 0.0
Ngororero 43.8 31.3 18.8 25.0 12.5 43.8 75.0 37.5 25.0 6.3 0.0 0.0 0.0 6.3Rusizi-Nyamasheke
33.3 61.9 40.5 31.0 26.2 33.3 33.3 16.7 19.0 7.1 2.4 28.6 26.2 0.0
Gakenke 33.3 33.3 33.3 28.6 33.3 33.3 47.6 33.3 9.5 19.0 9.5 4.8 9.5 0.0
Musanze-Burera
54.5 24.2 48.5 27.3 15.2 27.3 30.3 36.4 18.2 30.3 0.0 9.1 0.0 0.0
Rulindo-Gicumbi
51.4 32.4 21.6 37.8 13.5 13.5 27.0 5.4 21.6 18.9 2.7 18.9 0.0 10.8
Nyagatare-Gatsibo-Kayonza
24.4 48.8 61.0 43.9 36.6 39.0 14.6 2.4 12.2 9.8 7.3 9.8 17.1 9.8
Kirehe-Ngoma-Rwamagana
25.6 17.9 33.3 17.9 12.8 20.5 15.4 12.8 7.7 20.5 35.9 5.1 0.0 15.4
Bugesera 40.0 26.7 33.3 53.3 6.7 0.0 13.3 0.0 33.3 20.0 46.7 0.0 0.0 20.0
Total 47.1 36.7 33.9 28.6 21.9 28.6 28.4 22.2 16.2 12.9 12.7 8.3 6.9 6.7
COPING STRATEGIES
To examine the coping strategies used by the selected households, the 2009 CFSVA and Nutrition Survey asked households how often they had used a list of five coping strategies in the seven days prior to the survey. The information was used to compute a summative scale, the reduced coping strategy index (CSI), which takes into account both the frequency and gravity of the mechanism used.34
The most commonly reported strategy was to rely on less preferred or less expensive food, used on average 2.3 days in the week prior to the survey. The next frequent strategies were to limit portion size (1.5 days), and reduce the number of meals (1.5 days). The average CSI is 10.8. There were differences across strata and livelihood groups as illustrated in the following table. The average CSI was highest in Bugesera (18.1), Gakenke (16.1), and Ngororero (14.9). Among livelihood groups, it was highest among the marginal livelihood group (12.6) and agriculturalists (low income,,12.1).
34 “Eating less-preferred/expensive foods”, “limiting portion size at mealtime” and “reducing the number of meals per day” have a severity score of 1. “Borrowing food or rely on help of friends/relatives” and “limit adult intake in order for small children to eat” have a severity score of 2 and 3 respectively.
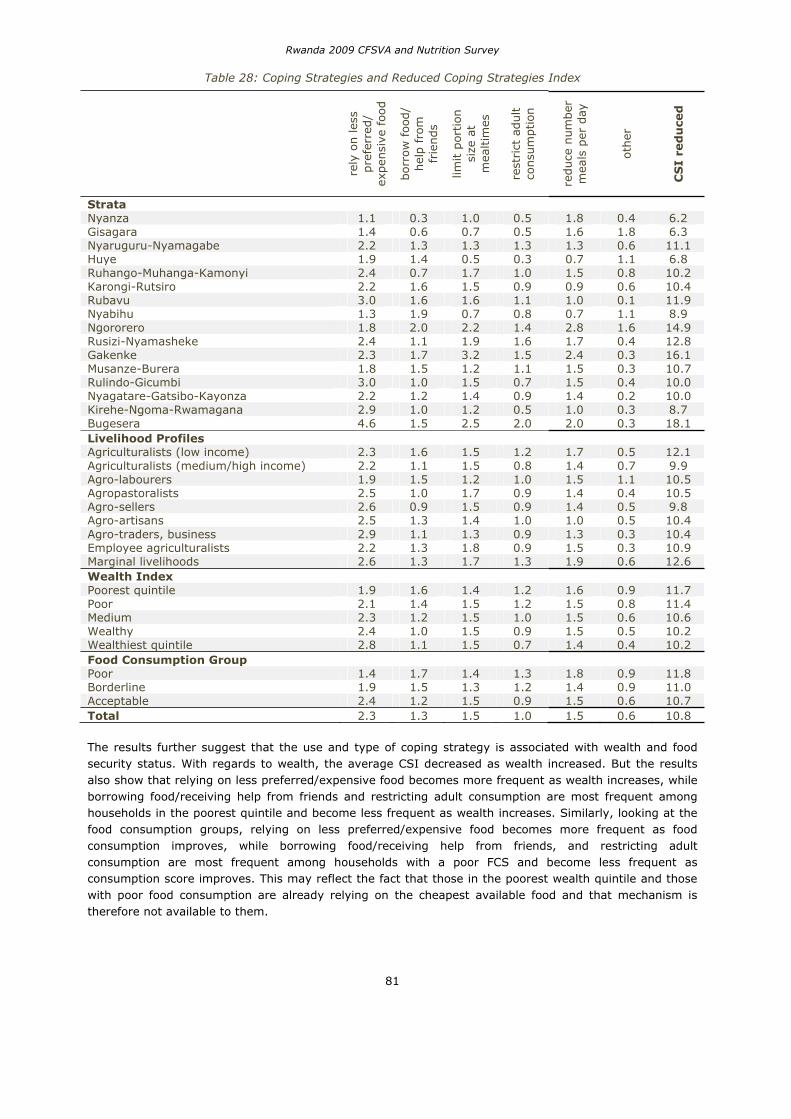
Rwanda 2009 CFSVA and Nutrition Survey
81
Table 28: Coping Strategies and Reduced Coping Strategies Index
rely
on les
s pre
ferr
ed/
expen
sive
food
borr
ow
food
/ hel
p f
rom
fr
iends
limit p
ortion
si
ze a
t m
ealtim
es
rest
rict
adult
consu
mption
reduce
num
ber
m
eals
per
day
oth
er
CS
I re
du
ced
Strata Nyanza 1.1 0.3 1.0 0.5 1.8 0.4 6.2 Gisagara 1.4 0.6 0.7 0.5 1.6 1.8 6.3 Nyaruguru-Nyamagabe 2.2 1.3 1.3 1.3 1.3 0.6 11.1 Huye 1.9 1.4 0.5 0.3 0.7 1.1 6.8 Ruhango-Muhanga-Kamonyi 2.4 0.7 1.7 1.0 1.5 0.8 10.2 Karongi-Rutsiro 2.2 1.6 1.5 0.9 0.9 0.6 10.4 Rubavu 3.0 1.6 1.6 1.1 1.0 0.1 11.9 Nyabihu 1.3 1.9 0.7 0.8 0.7 1.1 8.9 Ngororero 1.8 2.0 2.2 1.4 2.8 1.6 14.9 Rusizi-Nyamasheke 2.4 1.1 1.9 1.6 1.7 0.4 12.8 Gakenke 2.3 1.7 3.2 1.5 2.4 0.3 16.1 Musanze-Burera 1.8 1.5 1.2 1.1 1.5 0.3 10.7 Rulindo-Gicumbi 3.0 1.0 1.5 0.7 1.5 0.4 10.0 Nyagatare-Gatsibo-Kayonza 2.2 1.2 1.4 0.9 1.4 0.2 10.0 Kirehe-Ngoma-Rwamagana 2.9 1.0 1.2 0.5 1.0 0.3 8.7 Bugesera 4.6 1.5 2.5 2.0 2.0 0.3 18.1 Livelihood Profiles Agriculturalists (low income) 2.3 1.6 1.5 1.2 1.7 0.5 12.1 Agriculturalists (medium/high income) 2.2 1.1 1.5 0.8 1.4 0.7 9.9 Agro-labourers 1.9 1.5 1.2 1.0 1.5 1.1 10.5 Agropastoralists 2.5 1.0 1.7 0.9 1.4 0.4 10.5 Agro-sellers 2.6 0.9 1.5 0.9 1.4 0.5 9.8 Agro-artisans 2.5 1.3 1.4 1.0 1.0 0.5 10.4 Agro-traders, business 2.9 1.1 1.3 0.9 1.3 0.3 10.4 Employee agriculturalists 2.2 1.3 1.8 0.9 1.5 0.3 10.9 Marginal livelihoods 2.6 1.3 1.7 1.3 1.9 0.6 12.6 Wealth Index Poorest quintile 1.9 1.6 1.4 1.2 1.6 0.9 11.7 Poor 2.1 1.4 1.5 1.2 1.5 0.8 11.4 Medium 2.3 1.2 1.5 1.0 1.5 0.6 10.6 Wealthy 2.4 1.0 1.5 0.9 1.5 0.5 10.2 Wealthiest quintile 2.8 1.1 1.5 0.7 1.4 0.4 10.2 Food Consumption Group Poor 1.4 1.7 1.4 1.3 1.8 0.9 11.8 Borderline 1.9 1.5 1.3 1.2 1.4 0.9 11.0 Acceptable 2.4 1.2 1.5 0.9 1.5 0.6 10.7 Total 2.3 1.3 1.5 1.0 1.5 0.6 10.8
The results further suggest that the use and type of coping strategy is associated with wealth and food security status. With regards to wealth, the average CSI decreased as wealth increased. But the results also show that relying on less preferred/expensive food becomes more frequent as wealth increases, while borrowing food/receiving help from friends and restricting adult consumption are most frequent among households in the poorest quintile and become less frequent as wealth increases. Similarly, looking at the food consumption groups, relying on less preferred/expensive food becomes more frequent as food consumption improves, while borrowing food/receiving help from friends, and restricting adult consumption are most frequent among households with a poor FCS and become less frequent as consumption score improves. This may reflect the fact that those in the poorest wealth quintile and those with poor food consumption are already relying on the cheapest available food and that mechanism is therefore not available to them.
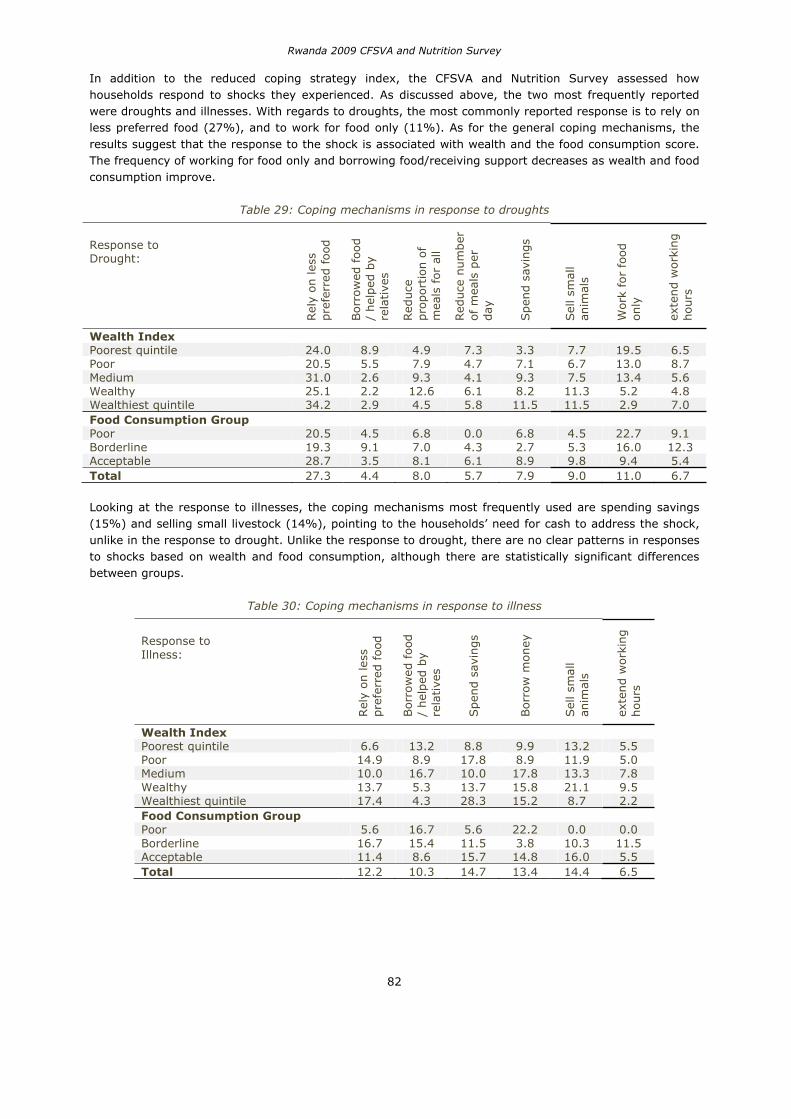
Rwanda 2009 CFSVA and Nutrition Survey
82
In addition to the reduced coping strategy index, the CFSVA and Nutrition Survey assessed how households respond to shocks they experienced. As discussed above, the two most frequently reported were droughts and illnesses. With regards to droughts, the most commonly reported response is to rely on less preferred food (27%), and to work for food only (11%). As for the general coping mechanisms, the results suggest that the response to the shock is associated with wealth and the food consumption score. The frequency of working for food only and borrowing food/receiving support decreases as wealth and food consumption improve.
Table 29: Coping mechanisms in response to droughts
Response to Drought:
Rel
y on les
s pre
ferr
ed f
ood
Borr
ow
ed f
ood
/ hel
ped
by
rela
tive
s
Red
uce
pro
port
ion o
f m
eals
for
all
Red
uce
num
ber
of
mea
ls p
er
day
Spen
d s
avin
gs
Sel
l sm
all
anim
als
Wor
k fo
r fo
od
only
exte
nd w
orki
ng
hours
Wealth Index Poorest quintile 24.0 8.9 4.9 7.3 3.3 7.7 19.5 6.5 Poor 20.5 5.5 7.9 4.7 7.1 6.7 13.0 8.7 Medium 31.0 2.6 9.3 4.1 9.3 7.5 13.4 5.6 Wealthy 25.1 2.2 12.6 6.1 8.2 11.3 5.2 4.8 Wealthiest quintile 34.2 2.9 4.5 5.8 11.5 11.5 2.9 7.0 Food Consumption Group Poor 20.5 4.5 6.8 0.0 6.8 4.5 22.7 9.1 Borderline 19.3 9.1 7.0 4.3 2.7 5.3 16.0 12.3 Acceptable 28.7 3.5 8.1 6.1 8.9 9.8 9.4 5.4 Total 27.3 4.4 8.0 5.7 7.9 9.0 11.0 6.7
Looking at the response to illnesses, the coping mechanisms most frequently used are spending savings (15%) and selling small livestock (14%), pointing to the households’ need for cash to address the shock, unlike in the response to drought. Unlike the response to drought, there are no clear patterns in responses to shocks based on wealth and food consumption, although there are statistically significant differences between groups.
Table 30: Coping mechanisms in response to illness
Response to Illness:
Rel
y on les
s pre
ferr
ed f
ood
Bor
row
ed f
ood
/
hel
ped
by
rela
tive
s
Spen
d s
avin
gs
Bor
row
money
Sel
l sm
all
anim
als
exte
nd w
orki
ng
hours
Wealth Index Poorest quintile 6.6 13.2 8.8 9.9 13.2 5.5 Poor 14.9 8.9 17.8 8.9 11.9 5.0 Medium 10.0 16.7 10.0 17.8 13.3 7.8 Wealthy 13.7 5.3 13.7 15.8 21.1 9.5 Wealthiest quintile 17.4 4.3 28.3 15.2 8.7 2.2 Food Consumption Group Poor 5.6 16.7 5.6 22.2 0.0 0.0 Borderline 16.7 15.4 11.5 3.8 10.3 11.5 Acceptable 11.4 8.6 15.7 14.8 16.0 5.5 Total 12.2 10.3 14.7 13.4 14.4 6.5
Rwanda 2009 CFSVA and Nutrition Survey
83
ASSISTANCE
Food Assistance
Nationally, 9.3% of the sampled households reported having received some sort of food assistance in the 12 months prior to the 2009 CFSVA and Nutrition Survey. However, there were important differences across strata. In Bugesera, 45.7% of the households reported having received food assistance in the 12 months prior to the survey, about three times more than the next most frequent strata, Huye, where 16.9% of the households received food assistance. The third highest reported frequency of food assistance was found in Nyaruguru-Nyamagabe (11.1%, Annex 8)
Across livelihood groups, Marginal livelihoods and Agro-labourers had the highest proportion of households reporting having received food assistance, at 15.9% and 12.0% respectively. By definition (see livelihood profile analysis) marginal livelihood households depend on external assistance to sustain their livelihood. Both groups have already been identified as vulnerable. However, among agriculturalists-low income, which were also identified as a vulnerable group, only 7.6% of the households reported receiving food assistance, below the national average. This suggests that this group has not been targeted appropriately to benefit from food assistance. Households with a poor FCS tend to report receiving food assistance more frequently (11.4%) compared to those with a borderline (10.5%) or acceptable (8.9%) FCS. However, the relation between benefiting from food assistance and wealth was non-linear.
Households were further asked to specify the main type of program from which they received food assistance. Over half of those who received food assistance benefited from school feeding programs (4.9% of the households nationally). School feeding was most important in the strata of Bugesera (41.7%) and Huye (12.6%). When asked who was providing the assistance, of a total of 4.9% receiving assistance, 2.2% said they received it from NGOs and 2.0% said they received it from the government. In Huye, the main source was NGOs (11.2% of 12.6% total). In Bugesera, the sources were divided, but most frequently from the government (26.3% of 41.7% total), with NGO accounting for 13.4%.
Free food distribution was a source of food assistance for 1.9% of the households nationally and it was most important in Ngororero (5.9%), Karongi-Rutsiro (3.3%), and Musanze-Burera (3.0%). Among the 1.9% housheolds receiving free food distribution, 0.9% identified the source as being friends, relatives, 0.5% identified the government and 0.3% identified NGOs. Other programs (food for pregnant/lactating women, food for work, food for training) were mentioned by less than 0.5% of the households on average. The three programs were most frequent in Huye.
Non-Food Assistance
Households were further asked whether or not they received non-food assistance over the 12 months period prior to the survey. Non-food assistance was less frequent than food assistance, with 6.6% and 9.3% reported receiving aid respectively. The strata with the highest proportion of households reporting assistance were different compared to food aid, with the highest frequencies found in Gakenke (10.7%), and Ruhango-Muhanga-Kamonyi (10.1%). Out of 6.6% receiving assistance, the main type reported were education (e.g. school material, 2.0%), and medical services (1.9%). Support for medical services was more frequently provided by the government rather than NGOs, while support for education was more frequently provided by NGOs rather than the government. The relation between benefiting from non-food assistance and wealth and food consumption is not linear (Annex 9).
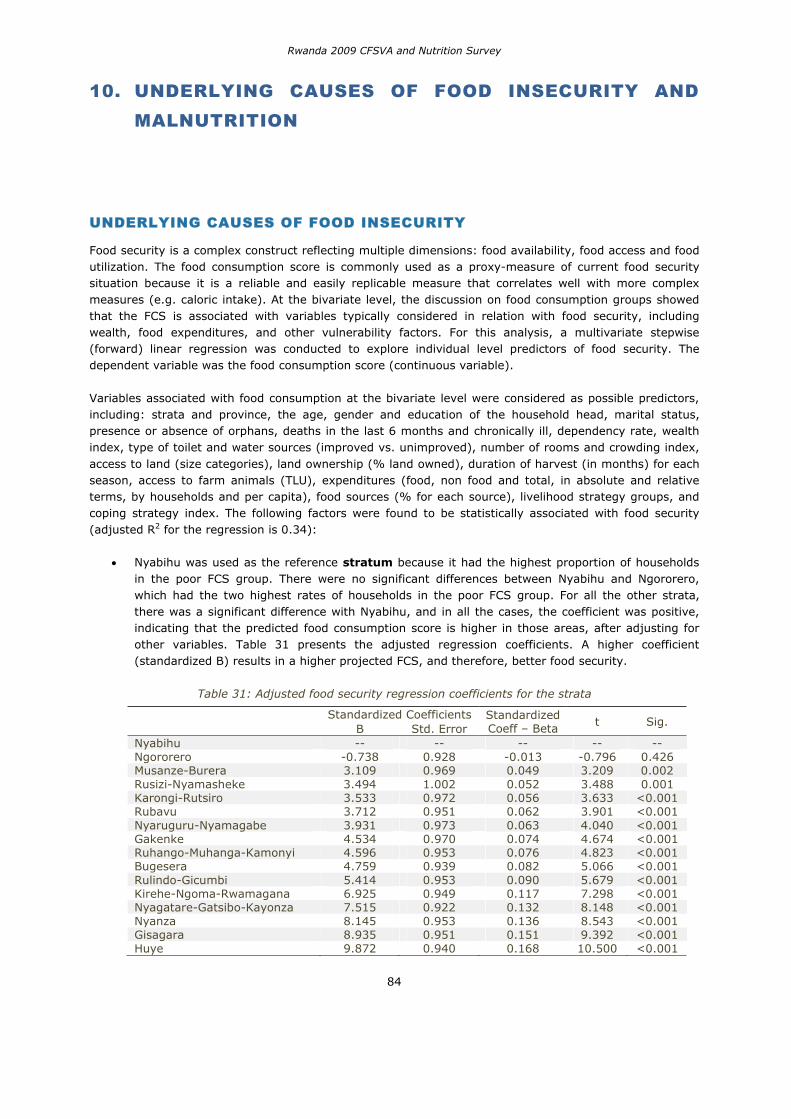
Rwanda 2009 CFSVA and Nutrition Survey
84
10. UNDERLYING CAUSES OF FOOD INSECURITY AND MALNUTRITION
UNDERLYING CAUSES OF FOOD INSECURITY
Food security is a complex construct reflecting multiple dimensions: food availability, food access and food utilization. The food consumption score is commonly used as a proxy-measure of current food security situation because it is a reliable and easily replicable measure that correlates well with more complex measures (e.g. caloric intake). At the bivariate level, the discussion on food consumption groups showed that the FCS is associated with variables typically considered in relation with food security, including wealth, food expenditures, and other vulnerability factors. For this analysis, a multivariate stepwise (forward) linear regression was conducted to explore individual level predictors of food security. The dependent variable was the food consumption score (continuous variable).
Variables associated with food consumption at the bivariate level were considered as possible predictors, including: strata and province, the age, gender and education of the household head, marital status, presence or absence of orphans, deaths in the last 6 months and chronically ill, dependency rate, wealth index, type of toilet and water sources (improved vs. unimproved), number of rooms and crowding index, access to land (size categories), land ownership (% land owned), duration of harvest (in months) for each season, access to farm animals (TLU), expenditures (food, non food and total, in absolute and relative terms, by households and per capita), food sources (% for each source), livelihood strategy groups, and coping strategy index. The following factors were found to be statistically associated with food security (adjusted R2 for the regression is 0.34):
Nyabihu was used as the reference stratum because it had the highest proportion of households in the poor FCS group. There were no significant differences between Nyabihu and Ngororero, which had the two highest rates of households in the poor FCS group. For all the other strata, there was a significant difference with Nyabihu, and in all the cases, the coefficient was positive, indicating that the predicted food consumption score is higher in those areas, after adjusting for other variables. Table 31 presents the adjusted regression coefficients. A higher coefficient (standardized B) results in a higher projected FCS, and therefore, better food security.
Table 31: Adjusted food security regression coefficients for the strata
Standardized Coefficients Standardized Coeff – Beta
t Sig. B Std. Error
Nyabihu -- -- -- -- --Ngororero -0.738 0.928 -0.013 -0.796 0.426 Musanze-Burera 3.109 0.969 0.049 3.209 0.002 Rusizi-Nyamasheke 3.494 1.002 0.052 3.488 0.001 Karongi-Rutsiro 3.533 0.972 0.056 3.633 <0.001 Rubavu 3.712 0.951 0.062 3.901 <0.001 Nyaruguru-Nyamagabe 3.931 0.973 0.063 4.040 <0.001 Gakenke 4.534 0.970 0.074 4.674 <0.001 Ruhango-Muhanga-Kamonyi 4.596 0.953 0.076 4.823 <0.001 Bugesera 4.759 0.939 0.082 5.066 <0.001 Rulindo-Gicumbi 5.414 0.953 0.090 5.679 <0.001 Kirehe-Ngoma-Rwamagana 6.925 0.949 0.117 7.298 <0.001 Nyagatare-Gatsibo-Kayonza 7.515 0.922 0.132 8.148 <0.001 Nyanza 8.145 0.953 0.136 8.543 <0.001 Gisagara 8.935 0.951 0.151 9.392 <0.001 Huye 9.872 0.940 0.168 10.500 <0.001
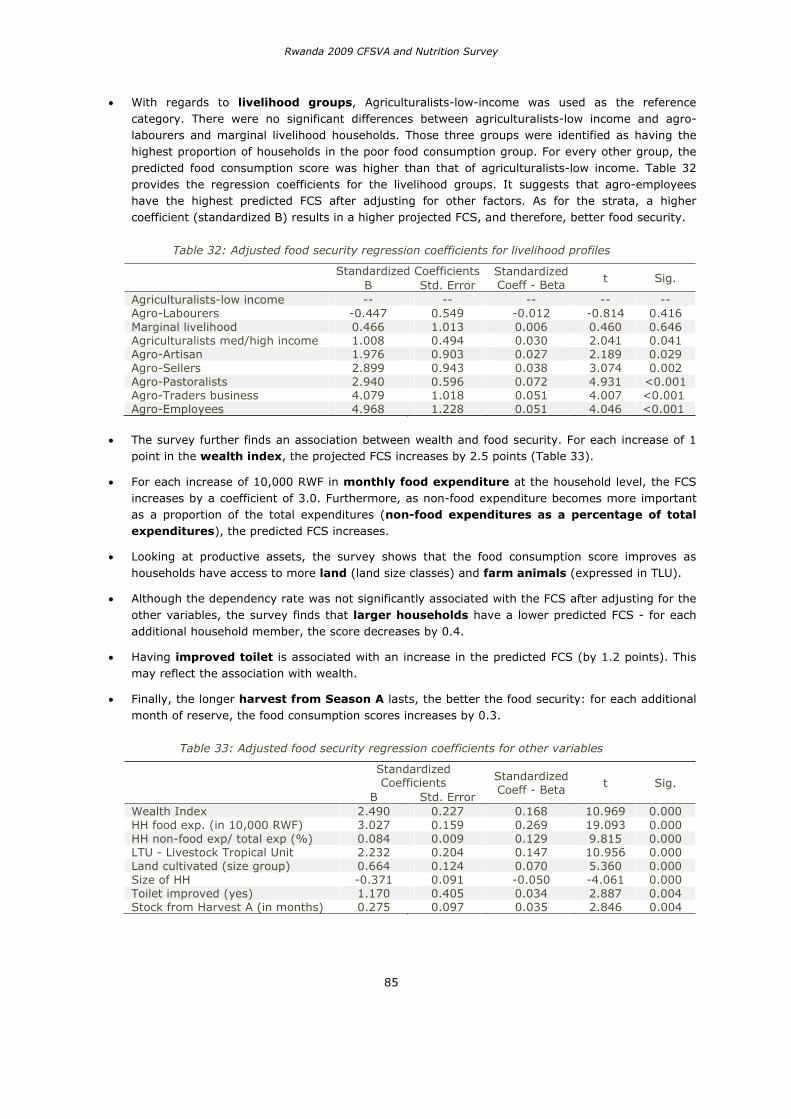
Rwanda 2009 CFSVA and Nutrition Survey
85
With regards to livelihood groups, Agriculturalists-low-income was used as the reference category. There were no significant differences between agriculturalists-low income and agro-labourers and marginal livelihood households. Those three groups were identified as having the highest proportion of households in the poor food consumption group. For every other group, the predicted food consumption score was higher than that of agriculturalists-low income. Table 32 provides the regression coefficients for the livelihood groups. It suggests that agro-employees have the highest predicted FCS after adjusting for other factors. As for the strata, a higher coefficient (standardized B) results in a higher projected FCS, and therefore, better food security.
Table 32: Adjusted food security regression coefficients for livelihood profiles
Standardized Coefficients Standardized Coeff - Beta t Sig.
B Std. Error Agriculturalists-low income -- -- -- -- --Agro-Labourers -0.447 0.549 -0.012 -0.814 0.416 Marginal livelihood 0.466 1.013 0.006 0.460 0.646 Agriculturalists med/high income 1.008 0.494 0.030 2.041 0.041 Agro-Artisan 1.976 0.903 0.027 2.189 0.029 Agro-Sellers 2.899 0.943 0.038 3.074 0.002 Agro-Pastoralists 2.940 0.596 0.072 4.931 <0.001 Agro-Traders business 4.079 1.018 0.051 4.007 <0.001 Agro-Employees 4.968 1.228 0.051 4.046 <0.001
The survey further finds an association between wealth and food security. For each increase of 1 point in the wealth index, the projected FCS increases by 2.5 points (Table 33).
For each increase of 10,000 RWF in monthly food expenditure at the household level, the FCS increases by a coefficient of 3.0. Furthermore, as non-food expenditure becomes more important as a proportion of the total expenditures (non-food expenditures as a percentage of total expenditures), the predicted FCS increases.
Looking at productive assets, the survey shows that the food consumption score improves as households have access to more land (land size classes) and farm animals (expressed in TLU).
Although the dependency rate was not significantly associated with the FCS after adjusting for the other variables, the survey finds that larger households have a lower predicted FCS - for each additional household member, the score decreases by 0.4.
Having improved toilet is associated with an increase in the predicted FCS (by 1.2 points). This may reflect the association with wealth.
Finally, the longer harvest from Season A lasts, the better the food security: for each additional month of reserve, the food consumption scores increases by 0.3.
Table 33: Adjusted food security regression coefficients for other variables
Standardized Coefficients Standardized
Coeff - Beta t Sig. B Std. Error
Wealth Index 2.490 0.227 0.168 10.969 0.000 HH food exp. (in 10,000 RWF) 3.027 0.159 0.269 19.093 0.000 HH non-food exp/ total exp (%) 0.084 0.009 0.129 9.815 0.000 LTU - Livestock Tropical Unit 2.232 0.204 0.147 10.956 0.000 Land cultivated (size group) 0.664 0.124 0.070 5.360 0.000 Size of HH -0.371 0.091 -0.050 -4.061 0.000 Toilet improved (yes) 1.170 0.405 0.034 2.887 0.004 Stock from Harvest A (in months) 0.275 0.097 0.035 2.846 0.004
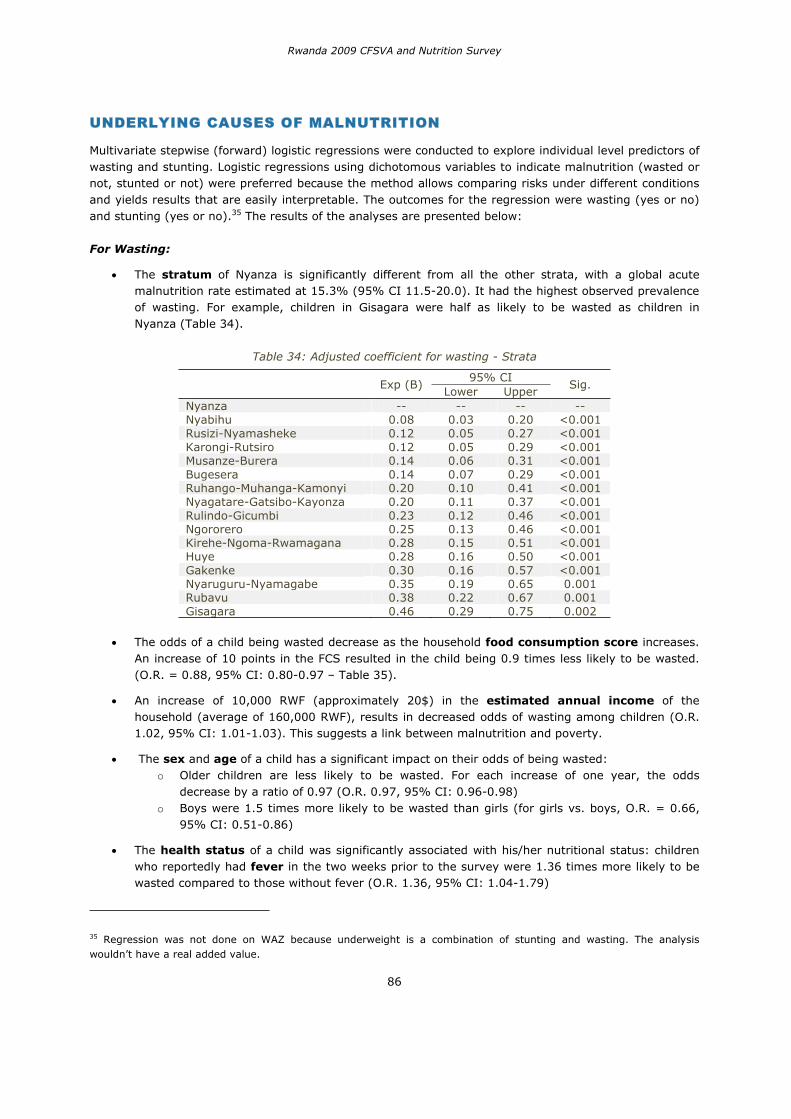
Rwanda 2009 CFSVA and Nutrition Survey
86
UNDERLYING CAUSES OF MALNUTRITION
Multivariate stepwise (forward) logistic regressions were conducted to explore individual level predictors of wasting and stunting. Logistic regressions using dichotomous variables to indicate malnutrition (wasted or not, stunted or not) were preferred because the method allows comparing risks under different conditions and yields results that are easily interpretable. The outcomes for the regression were wasting (yes or no) and stunting (yes or no).35 The results of the analyses are presented below:
For Wasting:
The stratum of Nyanza is significantly different from all the other strata, with a global acute malnutrition rate estimated at 15.3% (95% CI 11.5-20.0). It had the highest observed prevalence of wasting. For example, children in Gisagara were half as likely to be wasted as children in Nyanza (Table 34).
Table 34: Adjusted coefficient for wasting - Strata
Exp (B) 95% CI
Sig. Lower Upper
Nyanza -- -- -- --Nyabihu 0.08 0.03 0.20 <0.001 Rusizi-Nyamasheke 0.12 0.05 0.27 <0.001 Karongi-Rutsiro 0.12 0.05 0.29 <0.001 Musanze-Burera 0.14 0.06 0.31 <0.001 Bugesera 0.14 0.07 0.29 <0.001 Ruhango-Muhanga-Kamonyi 0.20 0.10 0.41 <0.001 Nyagatare-Gatsibo-Kayonza 0.20 0.11 0.37 <0.001 Rulindo-Gicumbi 0.23 0.12 0.46 <0.001 Ngororero 0.25 0.13 0.46 <0.001 Kirehe-Ngoma-Rwamagana 0.28 0.15 0.51 <0.001 Huye 0.28 0.16 0.50 <0.001 Gakenke 0.30 0.16 0.57 <0.001 Nyaruguru-Nyamagabe 0.35 0.19 0.65 0.001 Rubavu 0.38 0.22 0.67 0.001 Gisagara 0.46 0.29 0.75 0.002
The odds of a child being wasted decrease as the household food consumption score increases. An increase of 10 points in the FCS resulted in the child being 0.9 times less likely to be wasted. (O.R. = 0.88, 95% CI: 0.80-0.97 – Table 35).
An increase of 10,000 RWF (approximately 20$) in the estimated annual income of the household (average of 160,000 RWF), results in decreased odds of wasting among children (O.R. 1.02, 95% CI: 1.01-1.03). This suggests a link between malnutrition and poverty.
The sex and age of a child has a significant impact on their odds of being wasted: o Older children are less likely to be wasted. For each increase of one year, the odds
decrease by a ratio of 0.97 (O.R. 0.97, 95% CI: 0.96-0.98) o Boys were 1.5 times more likely to be wasted than girls (for girls vs. boys, O.R. = 0.66,
95% CI: 0.51-0.86)
The health status of a child was significantly associated with his/her nutritional status: children who reportedly had fever in the two weeks prior to the survey were 1.36 times more likely to be wasted compared to those without fever (O.R. 1.36, 95% CI: 1.04-1.79)
35 Regression was not done on WAZ because underweight is a combination of stunting and wasting. The analysis wouldn’t have a real added value.
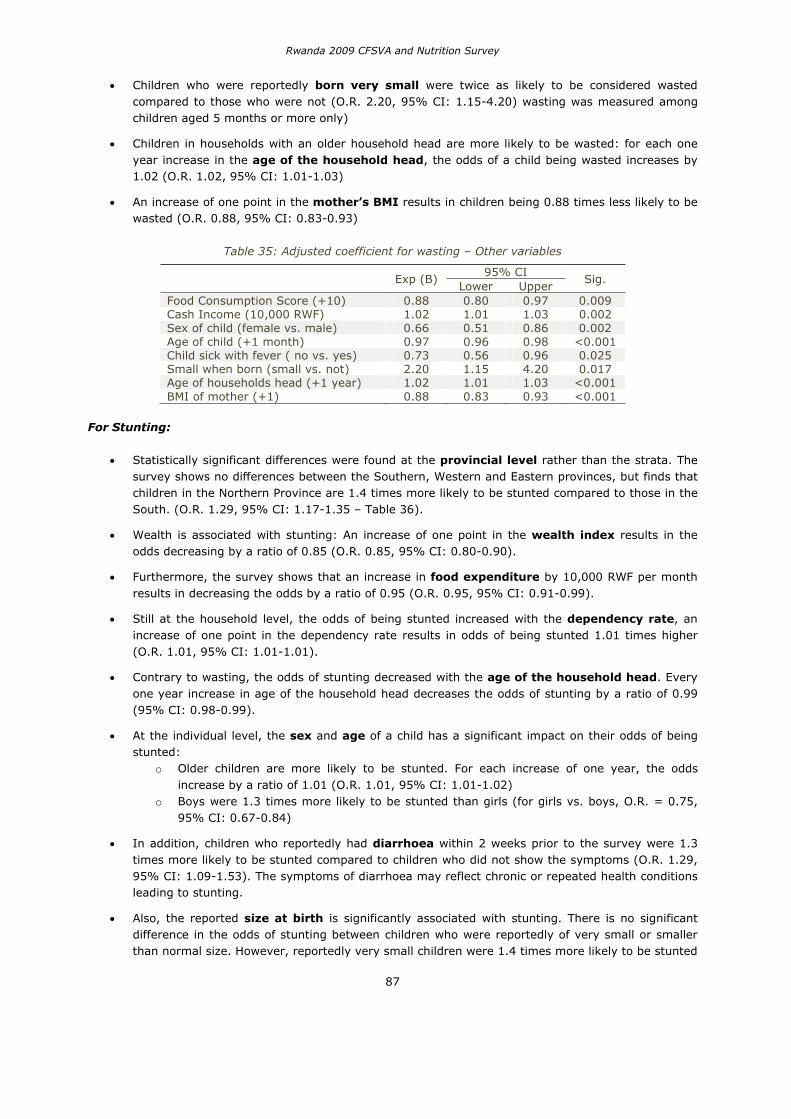
Rwanda 2009 CFSVA and Nutrition Survey
87
Children who were reportedly born very small were twice as likely to be considered wasted compared to those who were not (O.R. 2.20, 95% CI: 1.15-4.20) wasting was measured among children aged 5 months or more only)
Children in households with an older household head are more likely to be wasted: for each one year increase in the age of the household head, the odds of a child being wasted increases by 1.02 (O.R. 1.02, 95% CI: 1.01-1.03)
An increase of one point in the mother’s BMI results in children being 0.88 times less likely to be wasted (O.R. 0.88, 95% CI: 0.83-0.93)
Table 35: Adjusted coefficient for wasting – Other variables
Exp (B) 95% CI
Sig. Lower Upper
Food Consumption Score (+10) 0.88 0.80 0.97 0.009 Cash Income (10,000 RWF) 1.02 1.01 1.03 0.002 Sex of child (female vs. male) 0.66 0.51 0.86 0.002 Age of child (+1 month) 0.97 0.96 0.98 <0.001 Child sick with fever ( no vs. yes) 0.73 0.56 0.96 0.025 Small when born (small vs. not) 2.20 1.15 4.20 0.017 Age of households head (+1 year) 1.02 1.01 1.03 <0.001 BMI of mother (+1) 0.88 0.83 0.93 <0.001
For Stunting:
Statistically significant differences were found at the provincial level rather than the strata. The survey shows no differences between the Southern, Western and Eastern provinces, but finds that children in the Northern Province are 1.4 times more likely to be stunted compared to those in the South. (O.R. 1.29, 95% CI: 1.17-1.35 – Table 36).
Wealth is associated with stunting: An increase of one point in the wealth index results in the odds decreasing by a ratio of 0.85 (O.R. 0.85, 95% CI: 0.80-0.90).
Furthermore, the survey shows that an increase in food expenditure by 10,000 RWF per month results in decreasing the odds by a ratio of 0.95 (O.R. 0.95, 95% CI: 0.91-0.99).
Still at the household level, the odds of being stunted increased with the dependency rate, an increase of one point in the dependency rate results in odds of being stunted 1.01 times higher (O.R. 1.01, 95% CI: 1.01-1.01).
Contrary to wasting, the odds of stunting decreased with the age of the household head. Every one year increase in age of the household head decreases the odds of stunting by a ratio of 0.99 (95% CI: 0.98-0.99).
At the individual level, the sex and age of a child has a significant impact on their odds of being stunted:
o Older children are more likely to be stunted. For each increase of one year, the odds increase by a ratio of 1.01 (O.R. 1.01, 95% CI: 1.01-1.02)
o Boys were 1.3 times more likely to be stunted than girls (for girls vs. boys, O.R. = 0.75, 95% CI: 0.67-0.84)
In addition, children who reportedly had diarrhoea within 2 weeks prior to the survey were 1.3 times more likely to be stunted compared to children who did not show the symptoms (O.R. 1.29, 95% CI: 1.09-1.53). The symptoms of diarrhoea may reflect chronic or repeated health conditions leading to stunting.
Also, the reported size at birth is significantly associated with stunting. There is no significant difference in the odds of stunting between children who were reportedly of very small or smaller than normal size. However, reportedly very small children were 1.4 times more likely to be stunted
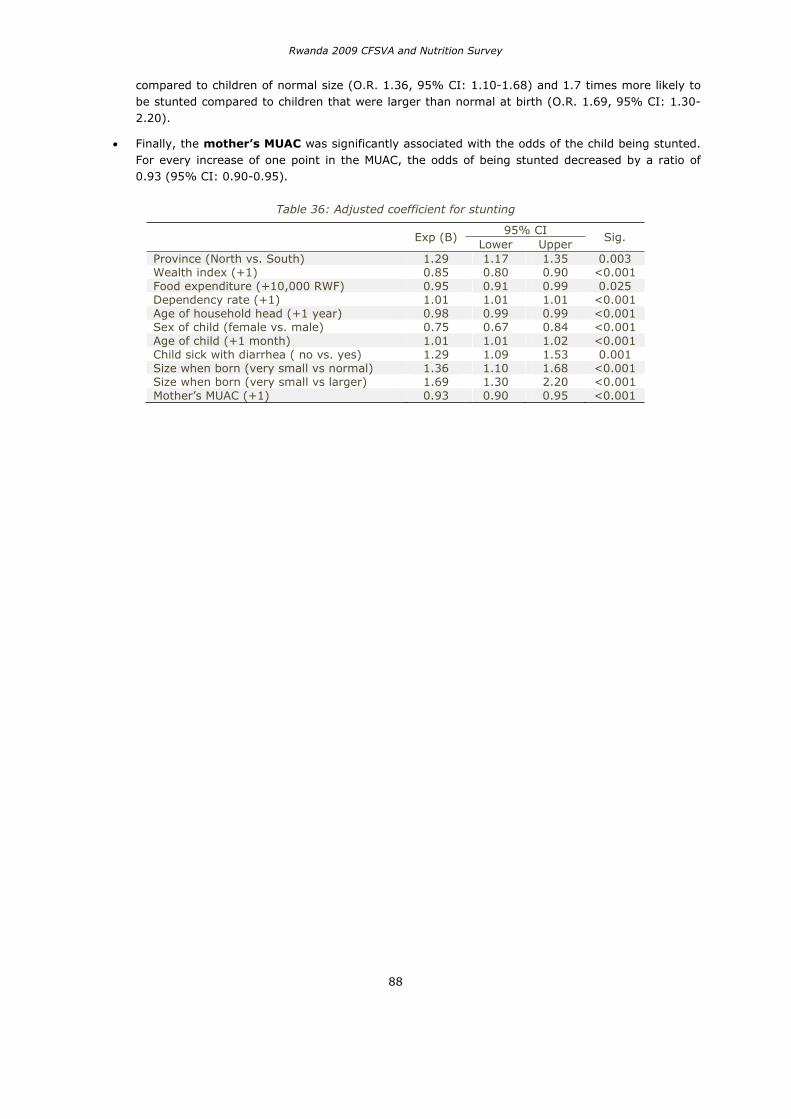
Rwanda 2009 CFSVA and Nutrition Survey
88
compared to children of normal size (O.R. 1.36, 95% CI: 1.10-1.68) and 1.7 times more likely to be stunted compared to children that were larger than normal at birth (O.R. 1.69, 95% CI: 1.30-2.20).
Finally, the mother’s MUAC was significantly associated with the odds of the child being stunted. For every increase of one point in the MUAC, the odds of being stunted decreased by a ratio of 0.93 (95% CI: 0.90-0.95).
Table 36: Adjusted coefficient for stunting
Exp (B) 95% CI
Sig. Lower Upper
Province (North vs. South) 1.29 1.17 1.35 0.003 Wealth index (+1) 0.85 0.80 0.90 <0.001 Food expenditure (+10,000 RWF) 0.95 0.91 0.99 0.025 Dependency rate (+1) 1.01 1.01 1.01 <0.001 Age of household head (+1 year) 0.98 0.99 0.99 <0.001 Sex of child (female vs. male) 0.75 0.67 0.84 <0.001 Age of child (+1 month) 1.01 1.01 1.02 <0.001 Child sick with diarrhea ( no vs. yes) 1.29 1.09 1.53 0.001 Size when born (very small vs normal) 1.36 1.10 1.68 <0.001 Size when born (very small vs larger) 1.69 1.30 2.20 <0.001 Mother’s MUAC (+1) 0.93 0.90 0.95 <0.001
Rwanda 2009 CFSVA and Nutrition Survey
89
11. CONCLUSIONS AND RECOMMENDATIONS
FOOD SECURITY AND MALNUTRITION SUMMARY PROFILES
Livelihood Strategy Priorities
While poverty, food insecurity and malnutrition exist among all livelihood profiles, the descriptive and multivariate analysis of the 2009 CFSVA and Nutrition Survey data point to three groups as being especially vulnerable: Agriculturalists-low income, agro-labourers, and marginal livelihood. The three groups account for 46% of the total population, but as many as 76% of all the households in the lowest wealth quintile and 73% of the households with a poor food consumption score. The survey did not find any significant direct link between the livelihood strategies and nutritional indicators. However several of the variables associated with malnutrition (e.g. wealth, food/total expenditures, food consumption score) were also associated with the livelihood strategy. Agro-labourers and marginal livelihoods have already the highest proportion benefiting from food assistance. Their level of food insecurity and vulnerability remains high. The three vulnerable profiles have the following characteristics:
1. Agriculturalists-low income:
Est. Pop. Size: 2,024,000 (24.1%) Vulnerability factors: Agriculturalists-low income depends nearly uniquely on agriculture to sustain their livelihood and income. They have a low diversity of activities and of agricultural production. Compared to other groups, they have limited access to land (high proportion of households with <0.1 ha of land), farm animals (low TLU) and limited use of chemical and natural fertilizers. They have a low average income which is used in high proportion for food, limited access to credit, and high proportion of households in the poorest wealth quintile. Agriculturalists-low income alone account for 37% of all the households in the lowest wealth quintile and 36% of the households with poor FCS. Compared to other groups, the household is more frequently headed by a woman and/or uneducated head. The crowding index is high. With regards to water, sanitation and hygiene, they more frequently use unimproved sources of water and latrines in contrast with other groups. A high proportion of mothers do not wash hands after visiting the toilet. Finally, their reduced coping strategy index was high in respect to other groups.
Geographic distribution: The proportion of agriculturalists-low income is highest in Ruhango-Muhanga-Kamonyi (38%), Gakenke (37%), Nyaruguru-Nyamagabe (37%), Karongi-Rutsiro (33%), and Rulindo-Gicumbi (31%).
Est. Nbr. of HH: 426,000 n (sample): 1,430 Wealth (% HH)
% poorest wealth quintile: 31.3 Food consumption (% of HH)
% poor FCS: 6.2 % borderline FCS: 19.9 % acceptable FCS: 73.9
Nutrition (% children) % wasted: 4.6 % stunted: 54.7
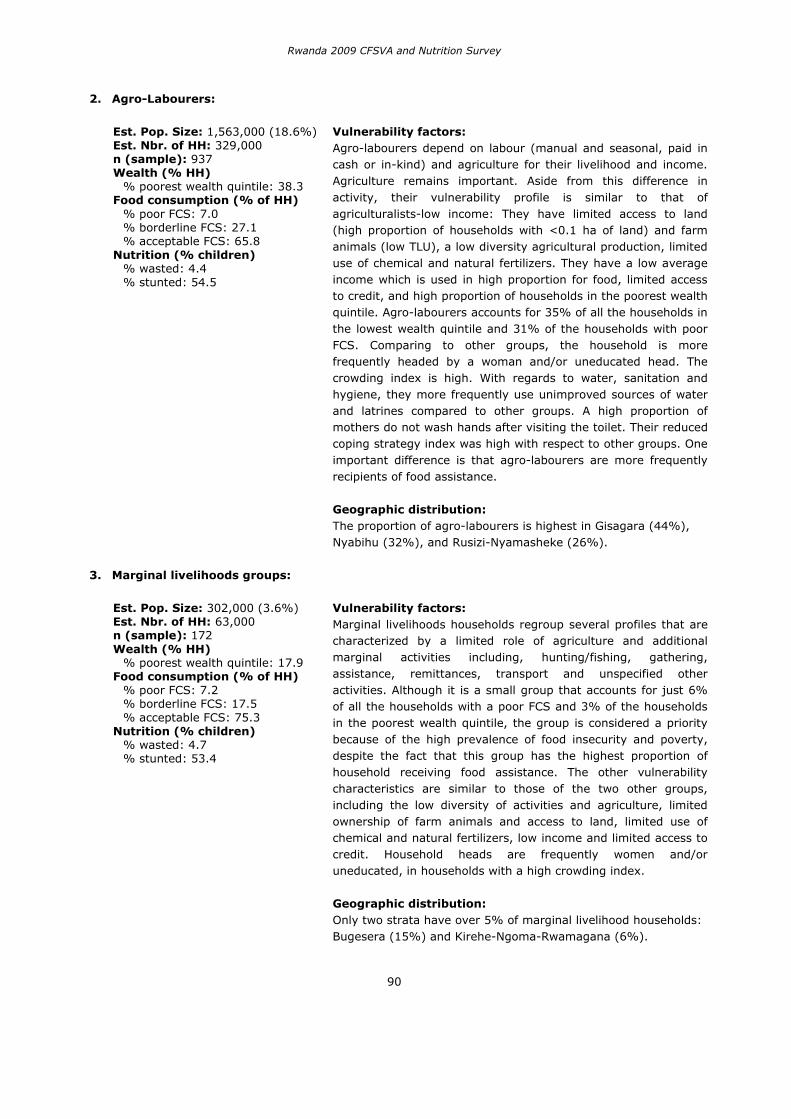
Rwanda 2009 CFSVA and Nutrition Survey
90
2. Agro-Labourers:
Est. Pop. Size: 1,563,000 (18.6%) Vulnerability factors: Agro-labourers depend on labour (manual and seasonal, paid in cash or in-kind) and agriculture for their livelihood and income. Agriculture remains important. Aside from this difference in activity, their vulnerability profile is similar to that of agriculturalists-low income: They have limited access to land (high proportion of households with <0.1 ha of land) and farm animals (low TLU), a low diversity agricultural production, limited use of chemical and natural fertilizers. They have a low average income which is used in high proportion for food, limited access to credit, and high proportion of households in the poorest wealth quintile. Agro-labourers accounts for 35% of all the households in the lowest wealth quintile and 31% of the households with poor FCS. Comparing to other groups, the household is more frequently headed by a woman and/or uneducated head. The crowding index is high. With regards to water, sanitation and hygiene, they more frequently use unimproved sources of water and latrines compared to other groups. A high proportion of mothers do not wash hands after visiting the toilet. Their reduced coping strategy index was high with respect to other groups. One important difference is that agro-labourers are more frequently recipients of food assistance.
Geographic distribution: The proportion of agro-labourers is highest in Gisagara (44%), Nyabihu (32%), and Rusizi-Nyamasheke (26%).
Est. Nbr. of HH: 329,000 n (sample): 937 Wealth (% HH)
% poorest wealth quintile: 38.3 Food consumption (% of HH)
% poor FCS: 7.0 % borderline FCS: 27.1 % acceptable FCS: 65.8
Nutrition (% children) % wasted: 4.4 % stunted: 54.5
3. Marginal livelihoods groups:
Est. Pop. Size: 302,000 (3.6%) Vulnerability factors: Marginal livelihoods households regroup several profiles that are characterized by a limited role of agriculture and additional marginal activities including, hunting/fishing, gathering, assistance, remittances, transport and unspecified other activities. Although it is a small group that accounts for just 6% of all the households with a poor FCS and 3% of the households in the poorest wealth quintile, the group is considered a priority because of the high prevalence of food insecurity and poverty, despite the fact that this group has the highest proportion of household receiving food assistance. The other vulnerability characteristics are similar to those of the two other groups, including the low diversity of activities and agriculture, limited ownership of farm animals and access to land, limited use of chemical and natural fertilizers, low income and limited access to credit. Household heads are frequently women and/or uneducated, in households with a high crowding index.
Geographic distribution: Only two strata have over 5% of marginal livelihood households: Bugesera (15%) and Kirehe-Ngoma-Rwamagana (6%).
Est. Nbr. of HH: 63,000 n (sample): 172 Wealth (% HH)
% poorest wealth quintile: 17.9 Food consumption (% of HH)
% poor FCS: 7.2 % borderline FCS: 17.5 % acceptable FCS: 75.3
Nutrition (% children) % wasted: 4.7 % stunted: 53.4
Rwanda 2009 CFSVA and Nutrition Survey
91
Geographic Priorities
For this study, 16 strata were defined using districts’ or aggregated districts’ boundaries. Although administrative aggregates may mask local dynamics and patterns that do not follow administrative divisions, administrative units were used because they correspond to levels of decisions and levels for which aggregate statistics are systematically available. Using the 2009 CFSVA and Nutrition Survey data, several geographic priorities can be identified. Unlike livelihood profiles were most vulnerability factors converged to identify three priority profiles, the identification of the geographic priorities depend on the variable considered (e.g. food security, poverty or nutrition). In addition, vulnerability factors vary across strata. A vulnerability profile for each stratum is presented in the Table 37.
Food Security Geographic Priorities Looking at food consumption scores, the three strata with the highest proportion of households in the poor FCS group are Nyabihu (9.6%), Ngororero (9.6%) and Nyaruguru-Nyamagabe (8.5%). As discussed in this report, the three strata are located along the Crete of the Nile line that runs from North to South in Rwanda. The three strata represent 14% of the total population, but account for 42% of all the households with a poor FCS. A second group of strata with prevalence of food insecurity above the national average of 5.0% includes Karongi-Rutsiro (5.6%), Ruhango-Muhanga-Kamonyi (5.5%), and Bugesera (5.0%). These three strata account for 22% of the population and 23% of all the food insecure households. Together the six strata account for 36% of the population and 65% of all the food insecure. It is important to note that although the proportion of households receiving food assistance in the Bugesera is high, it still has a high prevalence of food insecurity.
Wealth Geographic Priorities Five strata have higher than average prevalence of households in the poorest wealth quintile. They account together for 25% of the population and 45% of all the households with a poor FCS. The strata are Nyaruguru-Nyamagabe (37%), Gisagara (32%), Karongi-Rutsiro (28%), Ngororero (28%), and Nyanza (23%). Three of these strata were also identified as geographic priorities for food security (Ngororero, Nyaruguru-Nyamagabe, and Karongi-Rutsiro).
Nutrition Geographic Priorities For wasting, the multivariate analysis indicates Nyanza as the single geographic priority. However, more generally, the Southern Province is identified as priority, with the highest prevalences found in Nyanza, Gisagara and Nyaruguru-Nyamagabe. For stunting, the multivariate analysis indicates the Northern Province as the priority. Looking at prevalence of stunting across strata suggest that in addition to Gakenke in the North, Rubavu and Ngororero in the West and Nyaruguru-Nyamagabe in the South should also be included. Those four strata again are located along the Crete of the Nile.
Drought Risk Geographic Priorities Droughts are the most frequently reported shocks. In the context of Rwanda’s agriculture, highly dependent on climatic conditions, droughts are an important vulnerability factor. The geographic priority areas are identified as Bugesera in the Eastern Province, and, in the south, Nyanza, Gisagara, and Huye. In addition, Nyagatare-Gatsibo-Kayonza should be monitored.
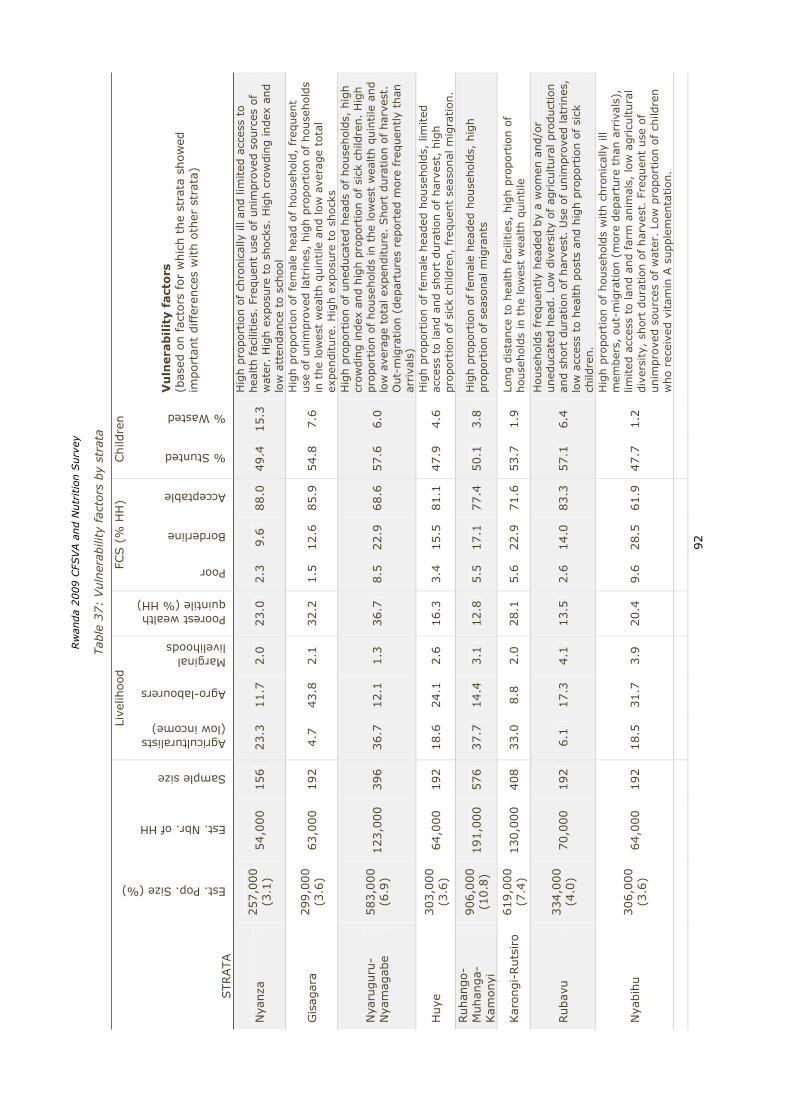
Rw
anda 2
009 C
FSVA a
nd N
utr
itio
n S
urv
ey
92
Tab
le 3
7:
Vuln
erab
ility
fac
tors
by
stra
ta
STRATA
Est. Pop. Size (%)
Est. Nbr. of HH
Sample size
Live
lihood
Poorest wealth quintile (% HH)
FCS (
% H
H)
Child
ren
Agriculturalists (low income)
Agro-labourers
Marginal livelihoods
Poor
Borderline
Acceptable
% Stunted
% Wasted
Vu
lnera
bil
ity f
act
ors
(b
ased
on f
acto
rs for
whic
h t
he
stra
ta s
how
ed
import
ant
diffe
rence
s w
ith o
ther
str
ata)
Nya
nza
257,0
00
(3.1
) 54,0
00
156
23.3
11.7
2.0
23.0
2.3
9.6
88.0
49.4
15.3
Hig
h p
roport
ion o
f ch
ronic
ally
ill
and lim
ited
acc
ess
to
hea
lth f
acili
ties.
Fre
quen
t use
of unim
pro
ved s
ourc
es o
f w
ater
. H
igh e
xposu
re t
o s
hock
s. H
igh c
row
din
g index
and
low
att
endan
ce t
o s
chool
Gis
agar
a299,0
00
(3.6
) 63,0
00
192
4.7
43.8
2.1
32.2
1.5
12.6
85.9
54.8
7.6
Hig
h p
roport
ion o
f fe
mal
e hea
d o
f hou
sehold
, fr
equen
t use
of
unim
pro
ved lat
rines
, hig
h p
roport
ion o
f hou
sehold
s in
the
low
est
wea
lth q
uin
tile
and low
ave
rage
tota
l ex
pen
diture
. H
igh e
xposu
re t
o sh
ock
s
Nya
ruguru
-N
yam
agab
e 583,0
00
(6.9
) 123,0
00
396
36.7
12.1
1.3
36.7
8.5
22.9
68.6
57.6
6.0
Hig
h p
roport
ion o
f uned
uca
ted h
eads
of house
hold
s, h
igh
crow
din
g index
and h
igh p
roport
ion o
f si
ck c
hild
ren.
Hig
h
pro
port
ion o
f hou
sehold
s in
the
low
est
wea
lth q
uin
tile
and
low
ave
rage
tota
l ex
pen
diture
. Shor
t dura
tion o
f har
vest
. O
ut-
mig
ration (
dep
artu
res
report
ed m
ore
fre
quen
tly
than
ar
riva
ls)
Huye
303,0
00
(3.6
) 64,0
00
192
18.6
24.1
2.6
16.3
3.4
15.5
81.1
47.9
4.6
H
igh p
roport
ion o
f fe
mal
e hea
ded
hou
sehold
s, lim
ited
ac
cess
to lan
d a
nd s
hor
t dura
tion o
f har
vest
, hig
h
pro
port
ion o
f si
ck c
hild
ren, fr
equen
t se
asonal
mig
ration.
Ruhan
go-
Muhan
ga-
Kam
onyi
906,0
00
(10.8
) 191,0
00
576
37.7
14.4
3.1
12.8
5.5
17.1
77.4
50.1
3.8
H
igh p
roport
ion o
f fe
mal
e hea
ded
hou
sehold
s, h
igh
pro
port
ion o
f se
asonal
mig
rants
Kar
ongi-
Ruts
iro
619,0
00
(7.4
) 130,0
00
408
33.0
8.8
2.0
28.1
5.6
22.9
71.6
53.7
1.9
Lo
ng d
ista
nce
to h
ealth fac
ilities
, hig
h p
roport
ion o
f hou
sehol
ds
in t
he
low
est
wea
lth q
uin
tile
Rubav
u
334,0
00
(4.0
) 70,0
00
192
6.1
17.3
4.1
13.5
2.6
14.0
83.3
57.1
6.4
House
hold
s fr
equen
tly
hea
ded
by
a w
om
en a
nd/o
r uned
uca
ted h
ead.
Low
div
ersi
ty o
f ag
ricu
ltura
l pro
duct
ion
and s
hort
dura
tion o
f har
vest
. U
se o
f unim
pro
ved lat
rines
, lo
w a
cces
s to
hea
lth p
ost
s an
d h
igh p
roport
ion o
f si
ck
child
ren.
Nya
bih
u
306,0
00
(3.6
) 64,0
00
192
18.5
31.7
3.9
20.4
9.6
28.5
61.9
47.7
1.2
Hig
h p
roport
ion o
f hou
sehold
s w
ith c
hro
nic
ally
ill
mem
ber
s, o
ut-
mig
ration (
more
dep
artu
re t
han
arr
ival
s),
limited
acc
ess
to lan
d a
nd far
m a
nim
als,
low
agricu
ltura
l div
ersi
ty,
shor
t dura
tion o
f har
vest
. Fr
equen
t use
of
unim
pro
ved s
ourc
es o
f w
ater
. Lo
w p
roport
ion o
f ch
ildre
n
who
rece
ived
vitam
in A
supple
men
tation.
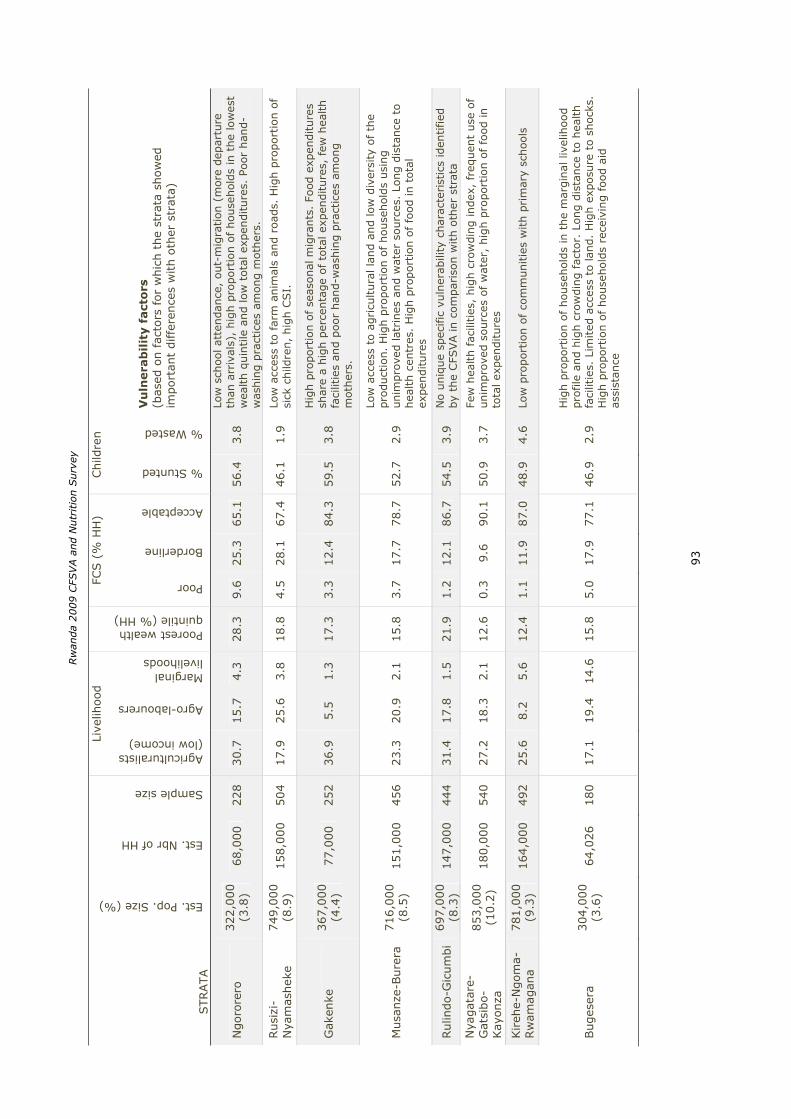
Rw
anda 2
009 C
FSVA a
nd N
utr
itio
n S
urv
ey
93
STRATA
Est. Pop. Size (%)
Est. Nbr of HH
Sample size
Live
lihood
Poorest wealth quintile (% HH)
FCS (
% H
H)
Child
ren
Agriculturalists (low income)
Agro-labourers
Marginal livelihoods
Poor
Borderline
Acceptable
% Stunted
% Wasted
Vu
lnera
bil
ity f
act
ors
(b
ased
on f
acto
rs for
whic
h t
he
stra
ta s
how
ed
import
ant
diffe
rence
s w
ith o
ther
str
ata)
Ngoro
rero
322,0
00
(3.8
) 68,0
00
228
30.7
15.7
4.3
28.3
9.6
25.3
65.1
56.4
3.8
Low
sch
ool at
tendan
ce,
out-
mig
ration (
more
dep
artu
re
than
arr
ival
s),
hig
h p
roport
ion o
f hou
sehol
ds
in t
he
low
est
wea
lth q
uin
tile
and low
tota
l ex
pen
diture
s. P
oor
han
d-
was
hin
g p
ract
ices
am
ong m
oth
ers.
Rusi
zi-
Nya
mash
eke
749,0
00
(8.9
) 158,0
00
504
17.9
25.6
3.8
18.8
4.5
28.1
67.4
46.1
1.9
Lo
w a
cces
s to
far
m a
nim
als
and r
oad
s. H
igh p
roport
ion o
f si
ck c
hild
ren,
hig
h C
SI.
Gak
enke
367,0
00
(4.4
) 77,0
00
252
36.9
5.5
1.3
17.3
3.3
12.4
84.3
59.5
3.8
Hig
h p
roport
ion o
f se
asonal
mig
rants
. Fo
od e
xpen
diture
s sh
are
a hig
h p
erce
nta
ge
of to
tal ex
pen
diture
s, few
hea
lth
faci
litie
s an
d p
oor
han
d-w
ashin
g p
ract
ices
am
ong
mot
her
s.
Musa
nze
-Bure
ra
716,0
00
(8.5
) 151,0
00
456
23.3
20.9
2.1
15.8
3.7
17.7
78.7
52.7
2.9
Low
acc
ess
to a
gricu
ltura
l la
nd a
nd low
div
ersi
ty o
f th
e pro
duct
ion.
Hig
h p
roport
ion o
f house
hold
s usi
ng
unim
pro
ved lat
rines
and w
ater
sourc
es.
Long d
ista
nce
to
hea
lth c
entr
es.
Hig
h p
roport
ion o
f fo
od in t
otal
ex
pen
diture
s
Rulin
do-G
icum
bi
697,0
00
(8.3
) 147,0
00
444
31.4
17.8
1.5
21.9
1.2
12.1
86.7
54.5
3.9
N
o u
niq
ue
spec
ific
vuln
erab
ility
char
acte
rist
ics
iden
tified
by
the
CFS
VA in c
om
par
ison w
ith o
ther
str
ata
Nya
gat
are-
Gat
sibo-
Kay
onza
853,0
00
(10.2
) 180,0
00
540
27.2
18.3
2.1
12.6
0.3
9.6
90.1
50.9
3.7
Fe
w h
ealth f
acili
ties
, hig
h c
row
din
g index
, fr
equen
t use
of
unim
pro
ved s
ourc
es o
f w
ater
, hig
h p
ropor
tion o
f fo
od in
tota
l ex
pen
diture
s
Kireh
e-N
gom
a-Rw
amag
ana
781,0
00
(9.3
) 164,0
00
492
25.6
8.2
5.6
12.4
1.1
11.9
87.0
48.9
4.6
Lo
w p
roport
ion o
f co
mm
unitie
s w
ith p
rim
ary
schools
Buges
era
304,0
00
(3.6
) 64,0
26
180
17.1
19.4
14.6
15.8
5.0
17.9
77.1
46.9
2.9
Hig
h p
roport
ion o
f hou
sehold
s in
the
mar
gin
al liv
elih
ood
pro
file
and h
igh c
row
din
g fac
tor.
Long d
ista
nce
to h
ealth
faci
litie
s. L
imited
acc
ess
to lan
d.
Hig
h e
xposu
re t
o s
hock
s.
Hig
h p
roport
ion o
f hou
sehold
s re
ceiv
ing food
aid
as
sist
ance
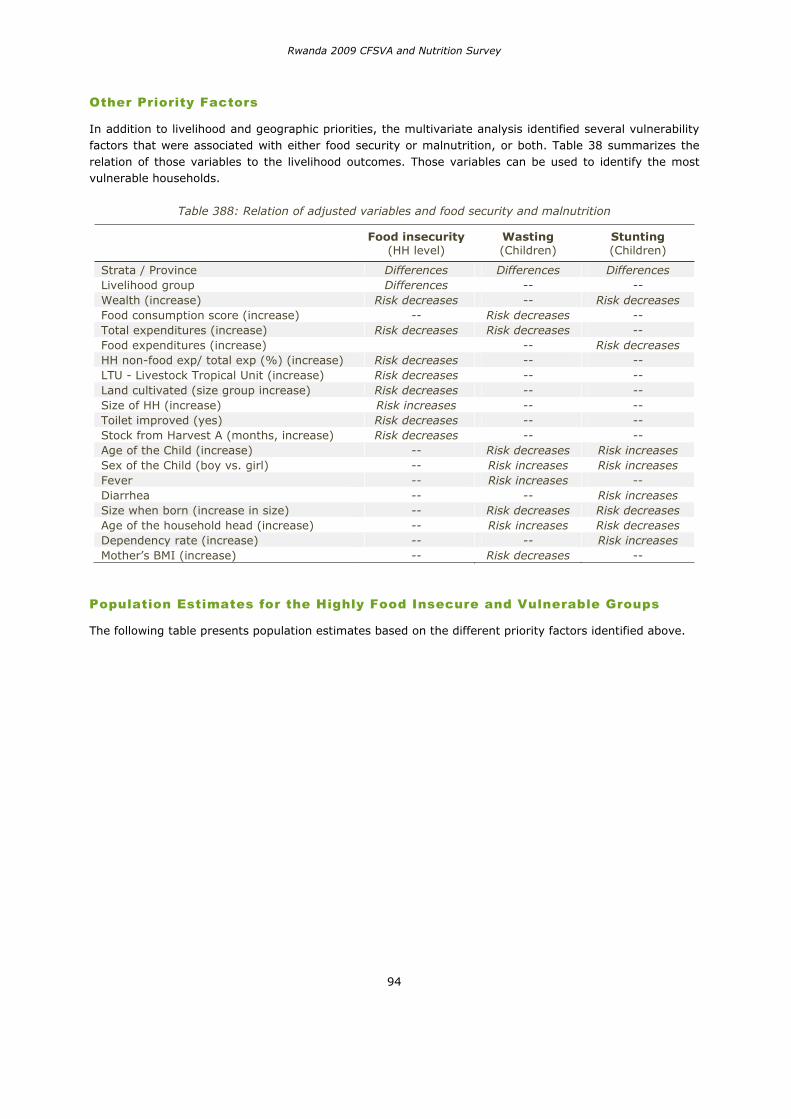
Rwanda 2009 CFSVA and Nutrition Survey
94
Other Priority Factors
In addition to livelihood and geographic priorities, the multivariate analysis identified several vulnerability factors that were associated with either food security or malnutrition, or both. Table 38 summarizes the relation of those variables to the livelihood outcomes. Those variables can be used to identify the most vulnerable households.
Table 388: Relation of adjusted variables and food security and malnutrition
Food insecurity (HH level)
Wasting (Children)
Stunting (Children)
Strata / Province Differences Differences Differences Livelihood group Differences -- -- Wealth (increase) Risk decreases -- Risk decreases Food consumption score (increase) -- Risk decreases --Total expenditures (increase) Risk decreases Risk decreases --Food expenditures (increase) -- Risk decreasesHH non-food exp/ total exp (%) (increase) Risk decreases -- --LTU - Livestock Tropical Unit (increase) Risk decreases -- -- Land cultivated (size group increase) Risk decreases -- --Size of HH (increase) Risk increases -- -- Toilet improved (yes) Risk decreases -- --Stock from Harvest A (months, increase) Risk decreases -- -- Age of the Child (increase) -- Risk decreases Risk increasesSex of the Child (boy vs. girl) -- Risk increases Risk increasesFever -- Risk increases --Diarrhea -- -- Risk increasesSize when born (increase in size) -- Risk decreases Risk decreasesAge of the household head (increase) -- Risk increases Risk decreasesDependency rate (increase) -- -- Risk increases Mother’s BMI (increase) -- Risk decreases --
Population Estimates for the Highly Food Insecure and Vulnerable Groups
The following table presents population estimates based on the different priority factors identified above.
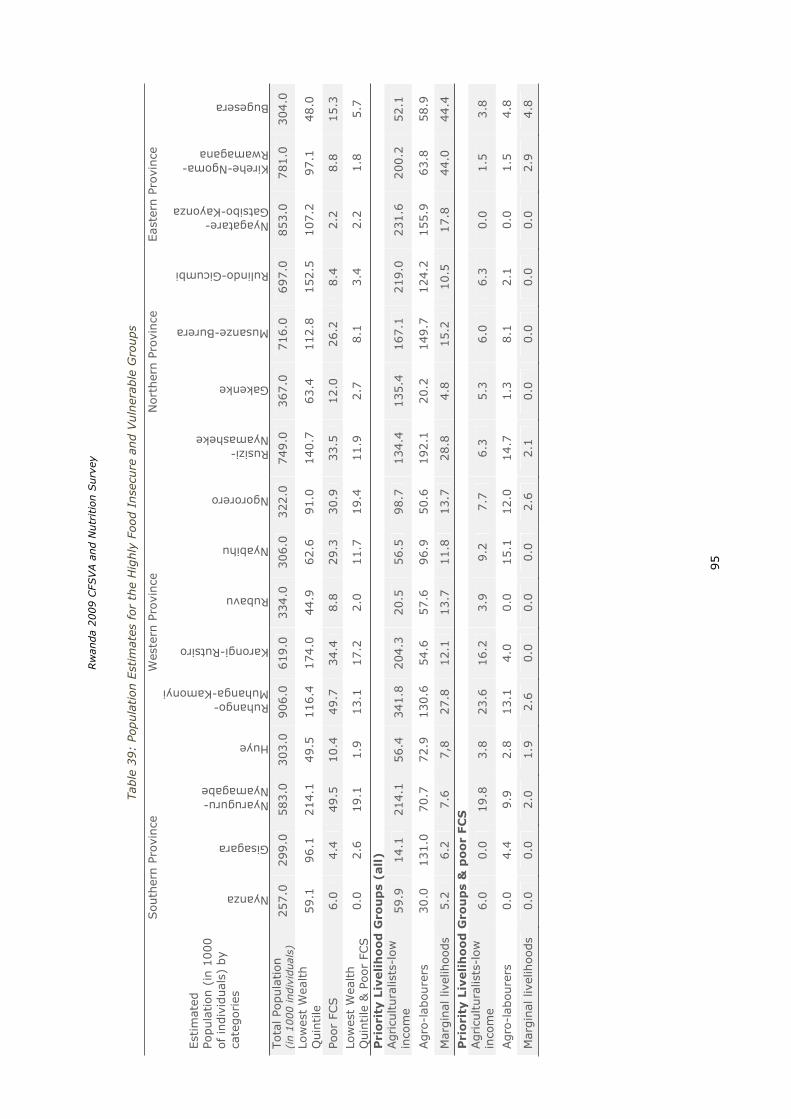
Rw
anda 2
009 C
FSVA a
nd N
utr
itio
n S
urv
ey
95
Tab
le 3
9:
Popula
tion E
stim
ates
for
the
Hig
hly
Foo
d I
nse
cure
and V
uln
erab
le G
roups
South
ern P
rovi
nce
W
este
rn P
rovi
nce
N
orth
ern P
rovi
nce
Eas
tern
Pro
vince
Est
imat
ed
Popula
tion (
in 1
000
of indiv
idual
s) b
y ca
tegories
Nyanza
Gisagara
Nyaruguru-Nyamagabe
Huye
Ruhango-Muhanga-Kamonyi
Karongi-Rutsiro
Rubavu
Nyabihu
Ngororero
Rusizi-Nyamasheke
Gakenke
Musanze-Burera
Rulindo-Gicumbi
Nyagatare-Gatsibo-Kayonza
Kirehe-Ngoma-Rwamagana
Bugesera
Tota
l Po
pula
tion
(i
n 1
000 indiv
iduals
)257.0
299.0
583.0
303.0
906.0
619.0
334.0
306.0
322.0
749.0
367.0
716.0
697.0
853.0
781.0
304.0
Low
est
Wea
lth
Quin
tile
59.1
96.1
214.1
49.5
116.4
174.0
44.9
62.6
91.0
140.7
63.4
112.8
152.5
107.2
97.1
48.0
Poor
FCS
6.0
4.4
49.5
10.4
49.7
34.4
8.8
29.3
30.9
33.5
12.0
26.2
8.4
2.2
8.8
15.3
Low
est
Wea
lth
Quin
tile
& P
oor
FCS
0.0
2.6
19.1
1.9
13.1
17.2
2.0
11.7
19.4
11.9
2.7
8.1
3.4
2.2
1.8
5.7
Pri
ori
ty L
ivelih
oo
d G
rou
ps
(all)
Agricu
ltura
lists
-low
in
com
e 59.9
14.1
214.1
56.4
341.8
204.3
20.5
56.5
98.7
134.4
135.4
167.1
219.0
231.6
200.2
52.1
Agro
-lab
oure
rs
30.0
131.0
70.7
72.9
130.6
54.6
57.6
96.9
50.6
192.1
20.2
149.7
124.2
155.9
63.8
58.9
Mar
gin
al liv
elih
oods
5.2
6.2
7.6
7,8
27.8
12.1
13.7
11.8
13.7
28.8
4.8
15.2
10.5
17.8
44.0
44.4
Pri
ori
ty L
ivelih
oo
d G
rou
ps
& p
oo
r FC
S
Agricu
ltura
lists
-low
in
com
e 6.0
0.0
19.8
3.8
23.6
16.2
3.9
9.2
7.7
6.3
5.3
6.0
6.3
0.0
1.5
3.8
Agro
-lab
oure
rs
0.0
4.4
9.9
2.8
13.1
4.0
0.0
15.1
12.0
14.7
1.3
8.1
2.1
0.0
1.5
4.8
Mar
gin
al liv
elih
oods
0.0
0.0
2.0
1.9
2.6
0.0
0.0
0.0
2.6
2.1
0.0
0.0
0.0
0.0
2.9
4.8
Rwanda 2009 CFSVA and Nutrition Survey
96
RECOMMENDATIONS AND INTERVENTIONS
In the summary profiles above, four types of priorities were explored in analyzing geographic priorities: (1) Food security, (2) Poverty, (3) Malnutrition, and (4) Risks of Drought. Within each category several strata have been identified as priority, and each stratum, in turn, was shown to have different vulnerability characteristics that need to be taken into account when planning interventions. In addition, livelihood profiles and other variables were also used to identify priorities. What follows are specific recommendations with, when possible, priority groups and geographic areas identified. However, given the diverse nature and sources of vulnerability, a broad-based plan that integrates poverty reduction, food security objectives, nutrition objectives and reduction of risks related to droughts is needed. The first recommendation therefore is:
1. Integrate food security, nutrition and disaster management programs with the national poverty reduction program to create a vulnerability reduction strategy. The analysis of the 2009 CFSVA and Nutrition Survey data indicates links between four components that need to be addressed with a broad multi-sector approach, i.e., investments in infrastructures, in agricultural productivity and diversity, and, in the service sector, especially education and health.
In addition, the following recommendations are advanced:
2. Increase agricultural output Target livelihood groups: Agriculturalists Of all factors with the potential to increase agricultural productivity, the availability of adapted and improved seeds and other inputs, including fertilizers should be prioritized. Seed fairs and private (for-profit) seed distribution networks must be promoted. In addition, agriculture extension officers must promote the use of sustainable practices to control erosion and loss of fertility within a sustainable agriculture model. Model gardens and demonstration plots may be useful. Such programs must be developed locally to address specific local conditions.
3. Develop vocational skills and capacities Target livelihood groups: Labourers, Vulnerable Agriculturalists (e.g. limited access to land)Labourers typically have little access to land and depend on manual labour to sustain their livelihoods. Unskilled agricultural labour wages are low which results in limited income for labourers. By developing skills and capacities, labourers will become more specialized workers which in turns can commend higher income. Agriculturalists who have limited access to land similarly need to develop alternative livelihood strategies to supplement their own agricultural production. Such additional strategies could include skilled and unskilled labour. Interventions to consider include: vocational training, Food-for-Training, investment in adult training programs and school implementation.
4. Develop school feeding for school-aged children and nutrition programs for children below 5 years old Target livelihood groups: all Stunting and Wasting continue to be highly prevalent in Rwanda.
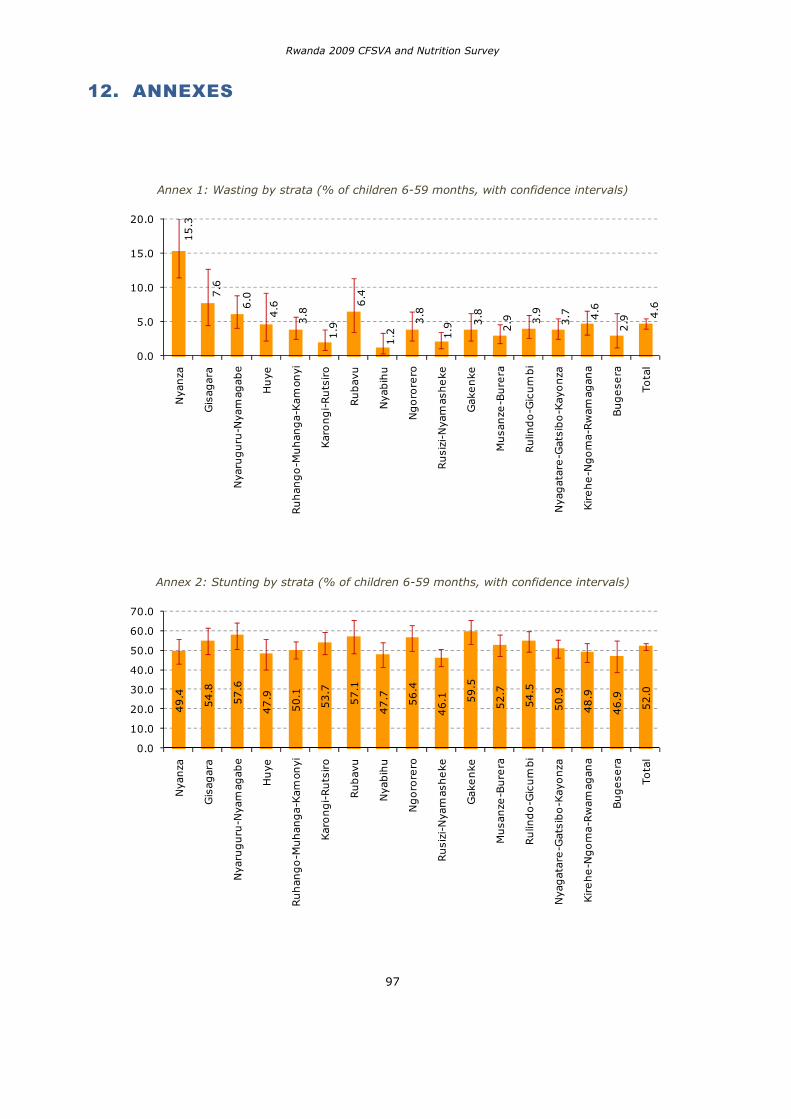
Rwanda 2009 CFSVA and Nutrition Survey
97
12. ANNEXES
Annex 1: Wasting by strata (% of children 6-59 months, with confidence intervals) 15.3
7.6
6.0
4.6
3.8
1.9
6.4
1.2
3.8
1.9
3.8
2.9 3
.9
3.7 4.6
2.9
4.6
0.0
5.0
10.0
15.0
20.0
Nya
nza
Gis
agar
a
Nya
ruguru
-Nya
mag
abe
Huye
Ruhan
go-M
uhan
ga-
Kam
onyi
Kar
ongi-Ruts
iro
Rubav
u
Nya
bih
u
Ngoro
rero
Rusi
zi-N
yam
asheke
Gak
enke
Musa
nze
-Bure
ra
Rulin
do-G
icum
bi
Nya
gat
are-G
atsi
bo-K
ayonza
Kirehe-N
gom
a-Rw
amag
ana
Bugese
ra
Tota
l
Annex 2: Stunting by strata (% of children 6-59 months, with confidence intervals)
49.4
54.8
57.6
47.9
50.1
53.7
57.1
47.7 56.4
46.1 59.5
52.7
54.5
50.9
48.9
46.9
52.0
0.0
10.0
20.0
30.0
40.0
50.0
60.0
70.0
Nya
nza
Gis
agar
a
Nya
ruguru
-Nya
mag
abe
Huye
Ruhan
go-M
uhan
ga-
Kam
onyi
Kar
ongi-Ruts
iro
Rubav
u
Nya
bih
u
Ngoro
rero
Rusi
zi-N
yam
asheke
Gak
enke
Musa
nze
-Bure
ra
Rulin
do-G
icum
bi
Nya
gat
are-G
atsi
bo-K
ayonza
Kirehe-N
gom
a-Rw
amag
ana
Bugese
ra
Tota
l
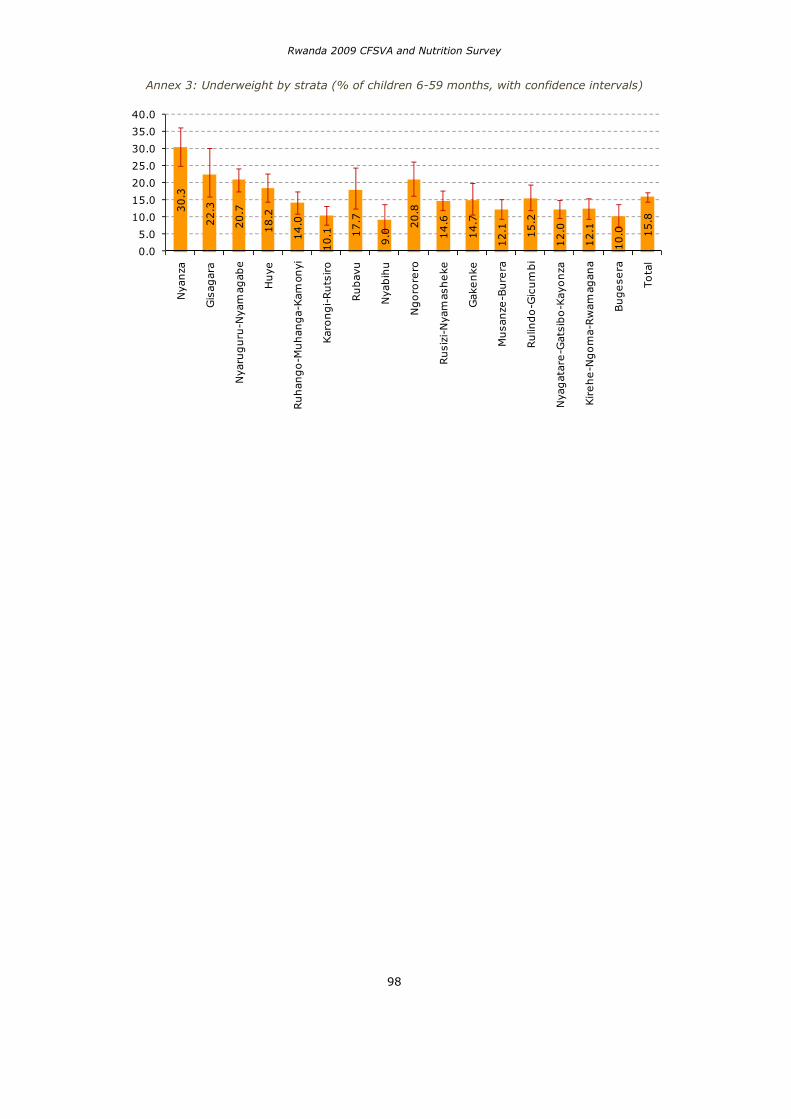
Rwanda 2009 CFSVA and Nutrition Survey
98
Annex 3: Underweight by strata (% of children 6-59 months, with confidence intervals)
30.3
22.3
20.7
18.2
14.0
10.1 1
7.7
9.0
20.8
14.6
14.7
12.1 15.2
12.0
12.1
10.0 15.8
0.0
5.0
10.0
15.0
20.0
25.0
30.0
35.0
40.0
Nya
nza
Gis
agar
a
Nya
ruguru
-Nya
mag
abe
Huye
Ruhan
go-M
uhan
ga-
Kam
onyi
Kar
ongi-Ruts
iro
Rubav
u
Nya
bih
u
Ngoro
rero
Rusi
zi-N
yam
asheke
Gak
enke
Musa
nze
-Bure
ra
Rulin
do-G
icum
bi
Nya
gat
are-G
atsi
bo-K
ayonza
Kirehe-N
gom
a-Rw
amag
ana
Bugese
ra
Tota
l
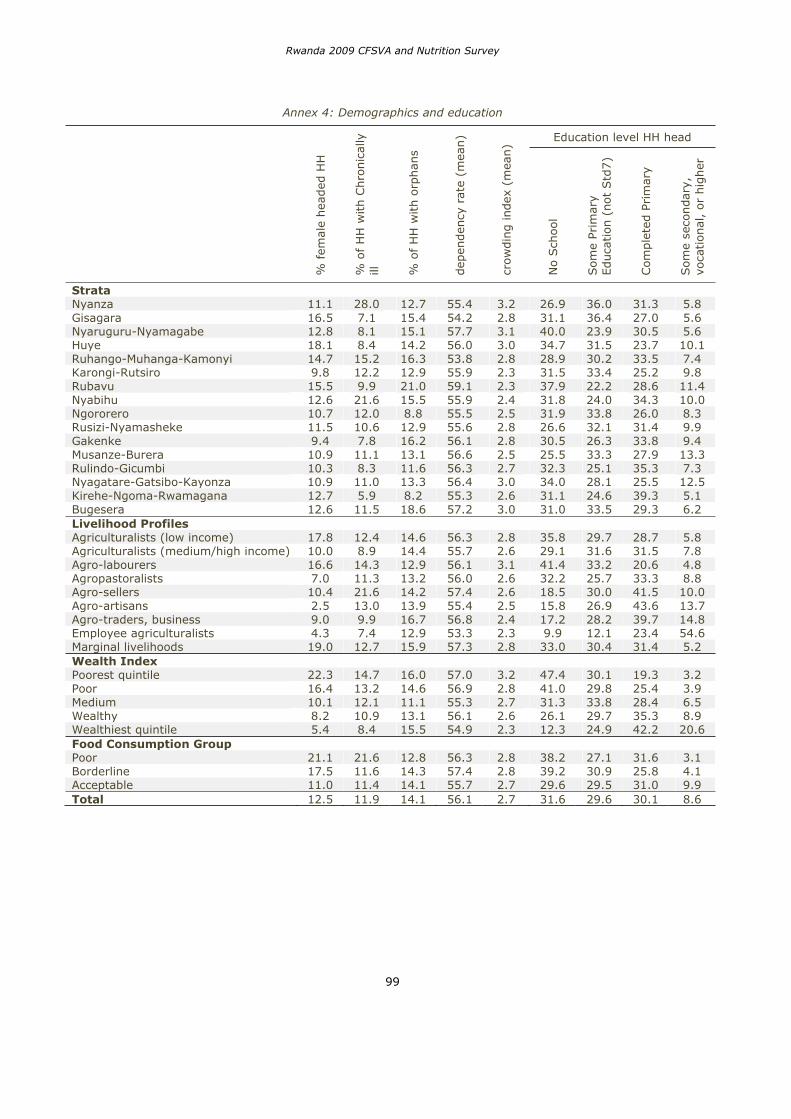
Rwanda 2009 CFSVA and Nutrition Survey
99
Annex 4: Demographics and education
% f
emal
e hea
ded
HH
% o
f H
H w
ith C
hro
nic
ally
ill
% o
f H
H w
ith o
rphan
s
dep
enden
cy r
ate
(mea
n)
crow
din
g index
(m
ean)
Education level HH head
No S
chool
Som
e Prim
ary
Educa
tion (
not
Std
7)
Com
ple
ted P
rim
ary
Som
e se
condary
, vo
cational
, or
hig
her
Strata Nyanza 11.1 28.0 12.7 55.4 3.2 26.9 36.0 31.3 5.8 Gisagara 16.5 7.1 15.4 54.2 2.8 31.1 36.4 27.0 5.6 Nyaruguru-Nyamagabe 12.8 8.1 15.1 57.7 3.1 40.0 23.9 30.5 5.6 Huye 18.1 8.4 14.2 56.0 3.0 34.7 31.5 23.7 10.1 Ruhango-Muhanga-Kamonyi 14.7 15.2 16.3 53.8 2.8 28.9 30.2 33.5 7.4 Karongi-Rutsiro 9.8 12.2 12.9 55.9 2.3 31.5 33.4 25.2 9.8 Rubavu 15.5 9.9 21.0 59.1 2.3 37.9 22.2 28.6 11.4 Nyabihu 12.6 21.6 15.5 55.9 2.4 31.8 24.0 34.3 10.0 Ngororero 10.7 12.0 8.8 55.5 2.5 31.9 33.8 26.0 8.3 Rusizi-Nyamasheke 11.5 10.6 12.9 55.6 2.8 26.6 32.1 31.4 9.9 Gakenke 9.4 7.8 16.2 56.1 2.8 30.5 26.3 33.8 9.4 Musanze-Burera 10.9 11.1 13.1 56.6 2.5 25.5 33.3 27.9 13.3 Rulindo-Gicumbi 10.3 8.3 11.6 56.3 2.7 32.3 25.1 35.3 7.3 Nyagatare-Gatsibo-Kayonza 10.9 11.0 13.3 56.4 3.0 34.0 28.1 25.5 12.5 Kirehe-Ngoma-Rwamagana 12.7 5.9 8.2 55.3 2.6 31.1 24.6 39.3 5.1 Bugesera 12.6 11.5 18.6 57.2 3.0 31.0 33.5 29.3 6.2 Livelihood Profiles Agriculturalists (low income) 17.8 12.4 14.6 56.3 2.8 35.8 29.7 28.7 5.8 Agriculturalists (medium/high income) 10.0 8.9 14.4 55.7 2.6 29.1 31.6 31.5 7.8 Agro-labourers 16.6 14.3 12.9 56.1 3.1 41.4 33.2 20.6 4.8 Agropastoralists 7.0 11.3 13.2 56.0 2.6 32.2 25.7 33.3 8.8 Agro-sellers 10.4 21.6 14.2 57.4 2.6 18.5 30.0 41.5 10.0 Agro-artisans 2.5 13.0 13.9 55.4 2.5 15.8 26.9 43.6 13.7 Agro-traders, business 9.0 9.9 16.7 56.8 2.4 17.2 28.2 39.7 14.8 Employee agriculturalists 4.3 7.4 12.9 53.3 2.3 9.9 12.1 23.4 54.6 Marginal livelihoods 19.0 12.7 15.9 57.3 2.8 33.0 30.4 31.4 5.2 Wealth Index Poorest quintile 22.3 14.7 16.0 57.0 3.2 47.4 30.1 19.3 3.2 Poor 16.4 13.2 14.6 56.9 2.8 41.0 29.8 25.4 3.9 Medium 10.1 12.1 11.1 55.3 2.7 31.3 33.8 28.4 6.5 Wealthy 8.2 10.9 13.1 56.1 2.6 26.1 29.7 35.3 8.9 Wealthiest quintile 5.4 8.4 15.5 54.9 2.3 12.3 24.9 42.2 20.6 Food Consumption Group Poor 21.1 21.6 12.8 56.3 2.8 38.2 27.1 31.6 3.1 Borderline 17.5 11.6 14.3 57.4 2.8 39.2 30.9 25.8 4.1 Acceptable 11.0 11.4 14.1 55.7 2.7 29.6 29.5 31.0 9.9 Total 12.5 11.9 14.1 56.1 2.7 31.6 29.6 30.1 8.6
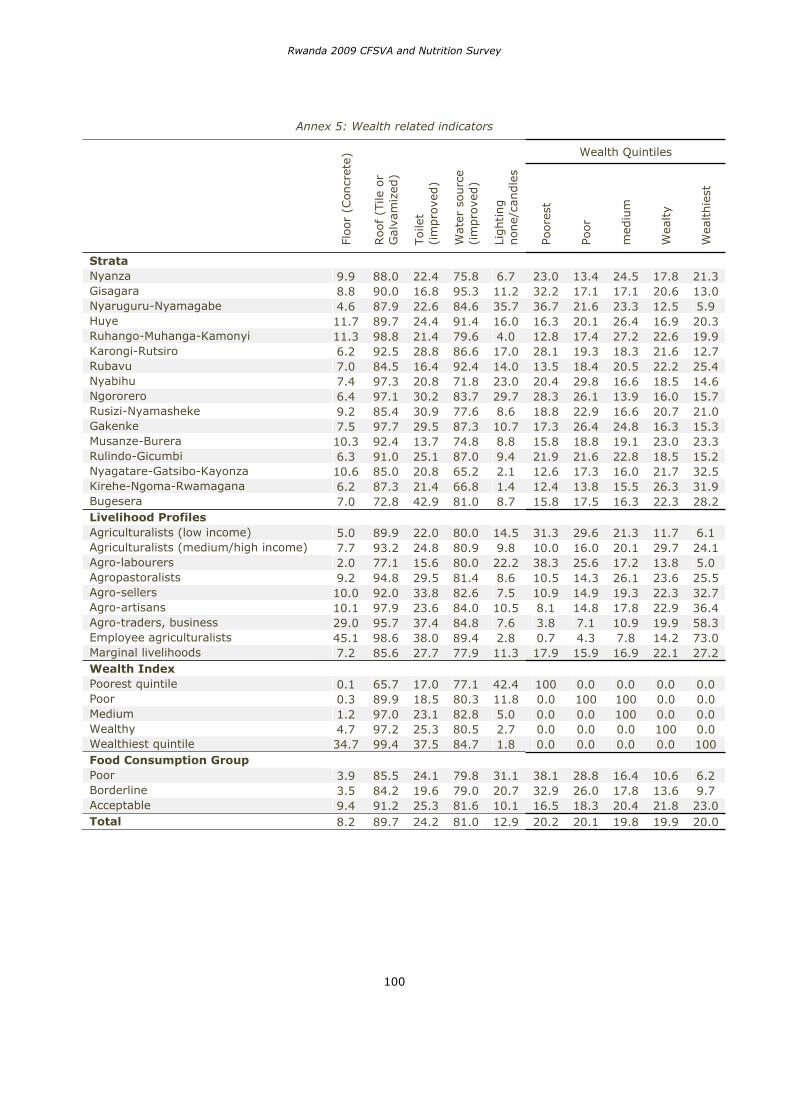
Rwanda 2009 CFSVA and Nutrition Survey
100
Annex 5: Wealth related indicators
Floor
(Concr
ete)
Roof
(Tile
or
Gal
vam
ized
)
Toile
t (i
mpro
ved)
Wat
er s
ourc
e (i
mpro
ved)
Lighting
none/
candle
s
Wealth Quintiles
Poore
st
Poor
med
ium
Wea
lty
Wea
lthie
st
Strata Nyanza 9.9 88.0 22.4 75.8 6.7 23.0 13.4 24.5 17.8 21.3 Gisagara 8.8 90.0 16.8 95.3 11.2 32.2 17.1 17.1 20.6 13.0 Nyaruguru-Nyamagabe 4.6 87.9 22.6 84.6 35.7 36.7 21.6 23.3 12.5 5.9 Huye 11.7 89.7 24.4 91.4 16.0 16.3 20.1 26.4 16.9 20.3 Ruhango-Muhanga-Kamonyi 11.3 98.8 21.4 79.6 4.0 12.8 17.4 27.2 22.6 19.9 Karongi-Rutsiro 6.2 92.5 28.8 86.6 17.0 28.1 19.3 18.3 21.6 12.7 Rubavu 7.0 84.5 16.4 92.4 14.0 13.5 18.4 20.5 22.2 25.4 Nyabihu 7.4 97.3 20.8 71.8 23.0 20.4 29.8 16.6 18.5 14.6 Ngororero 6.4 97.1 30.2 83.7 29.7 28.3 26.1 13.9 16.0 15.7 Rusizi-Nyamasheke 9.2 85.4 30.9 77.6 8.6 18.8 22.9 16.6 20.7 21.0 Gakenke 7.5 97.7 29.5 87.3 10.7 17.3 26.4 24.8 16.3 15.3 Musanze-Burera 10.3 92.4 13.7 74.8 8.8 15.8 18.8 19.1 23.0 23.3 Rulindo-Gicumbi 6.3 91.0 25.1 87.0 9.4 21.9 21.6 22.8 18.5 15.2 Nyagatare-Gatsibo-Kayonza 10.6 85.0 20.8 65.2 2.1 12.6 17.3 16.0 21.7 32.5 Kirehe-Ngoma-Rwamagana 6.2 87.3 21.4 66.8 1.4 12.4 13.8 15.5 26.3 31.9 Bugesera 7.0 72.8 42.9 81.0 8.7 15.8 17.5 16.3 22.3 28.2 Livelihood Profiles Agriculturalists (low income) 5.0 89.9 22.0 80.0 14.5 31.3 29.6 21.3 11.7 6.1 Agriculturalists (medium/high income) 7.7 93.2 24.8 80.9 9.8 10.0 16.0 20.1 29.7 24.1 Agro-labourers 2.0 77.1 15.6 80.0 22.2 38.3 25.6 17.2 13.8 5.0 Agropastoralists 9.2 94.8 29.5 81.4 8.6 10.5 14.3 26.1 23.6 25.5 Agro-sellers 10.0 92.0 33.8 82.6 7.5 10.9 14.9 19.3 22.3 32.7 Agro-artisans 10.1 97.9 23.6 84.0 10.5 8.1 14.8 17.8 22.9 36.4 Agro-traders, business 29.0 95.7 37.4 84.8 7.6 3.8 7.1 10.9 19.9 58.3 Employee agriculturalists 45.1 98.6 38.0 89.4 2.8 0.7 4.3 7.8 14.2 73.0 Marginal livelihoods 7.2 85.6 27.7 77.9 11.3 17.9 15.9 16.9 22.1 27.2 Wealth Index Poorest quintile 0.1 65.7 17.0 77.1 42.4 100 0.0 0.0 0.0 0.0 Poor 0.3 89.9 18.5 80.3 11.8 0.0 100 100 0.0 0.0 Medium 1.2 97.0 23.1 82.8 5.0 0.0 0.0 100 0.0 0.0 Wealthy 4.7 97.2 25.3 80.5 2.7 0.0 0.0 0.0 100 0.0 Wealthiest quintile 34.7 99.4 37.5 84.7 1.8 0.0 0.0 0.0 0.0 100 Food Consumption Group Poor 3.9 85.5 24.1 79.8 31.1 38.1 28.8 16.4 10.6 6.2 Borderline 3.5 84.2 19.6 79.0 20.7 32.9 26.0 17.8 13.6 9.7 Acceptable 9.4 91.2 25.3 81.6 10.1 16.5 18.3 20.4 21.8 23.0 Total 8.2 89.7 24.2 81.0 12.9 20.2 20.1 19.8 19.9 20.0
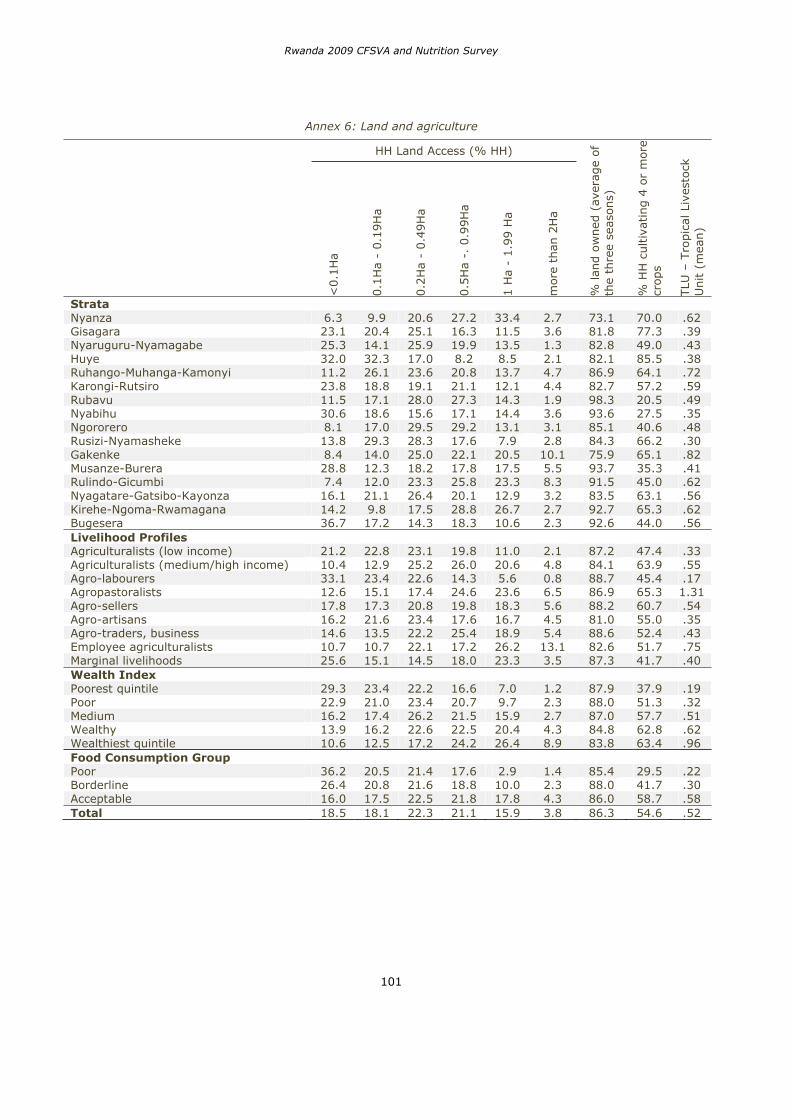
Rwanda 2009 CFSVA and Nutrition Survey
101
Annex 6: Land and agriculture
HH Land Access (% HH)
% lan
d o
wned
(av
erag
e of
the
thre
e se
asons)
% H
H c
ultiv
atin
g 4
or
more
crop
s
TLU
– T
ropic
al L
ives
tock
U
nit (
mea
n)
<0.1
Ha
0.1
Ha
- 0.1
9H
a
0.2
Ha
- 0.4
9H
a
0.5
Ha
-. 0
.99H
a
1 H
a -
1.9
9 H
a
mor
e th
an 2
Ha
Strata Nyanza 6.3 9.9 20.6 27.2 33.4 2.7 73.1 70.0 .62Gisagara 23.1 20.4 25.1 16.3 11.5 3.6 81.8 77.3 .39 Nyaruguru-Nyamagabe 25.3 14.1 25.9 19.9 13.5 1.3 82.8 49.0 .43Huye 32.0 32.3 17.0 8.2 8.5 2.1 82.1 85.5 .38 Ruhango-Muhanga-Kamonyi 11.2 26.1 23.6 20.8 13.7 4.7 86.9 64.1 .72Karongi-Rutsiro 23.8 18.8 19.1 21.1 12.1 4.4 82.7 57.2 .59 Rubavu 11.5 17.1 28.0 27.3 14.3 1.9 98.3 20.5 .49Nyabihu 30.6 18.6 15.6 17.1 14.4 3.6 93.6 27.5 .35 Ngororero 8.1 17.0 29.5 29.2 13.1 3.1 85.1 40.6 .48Rusizi-Nyamasheke 13.8 29.3 28.3 17.6 7.9 2.8 84.3 66.2 .30 Gakenke 8.4 14.0 25.0 22.1 20.5 10.1 75.9 65.1 .82Musanze-Burera 28.8 12.3 18.2 17.8 17.5 5.5 93.7 35.3 .41 Rulindo-Gicumbi 7.4 12.0 23.3 25.8 23.3 8.3 91.5 45.0 .62Nyagatare-Gatsibo-Kayonza 16.1 21.1 26.4 20.1 12.9 3.2 83.5 63.1 .56 Kirehe-Ngoma-Rwamagana 14.2 9.8 17.5 28.8 26.7 2.7 92.7 65.3 .62Bugesera 36.7 17.2 14.3 18.3 10.6 2.3 92.6 44.0 .56 Livelihood Profiles Agriculturalists (low income) 21.2 22.8 23.1 19.8 11.0 2.1 87.2 47.4 .33Agriculturalists (medium/high income) 10.4 12.9 25.2 26.0 20.6 4.8 84.1 63.9 .55 Agro-labourers 33.1 23.4 22.6 14.3 5.6 0.8 88.7 45.4 .17Agropastoralists 12.6 15.1 17.4 24.6 23.6 6.5 86.9 65.3 1.31 Agro-sellers 17.8 17.3 20.8 19.8 18.3 5.6 88.2 60.7 .54Agro-artisans 16.2 21.6 23.4 17.6 16.7 4.5 81.0 55.0 .35 Agro-traders, business 14.6 13.5 22.2 25.4 18.9 5.4 88.6 52.4 .43Employee agriculturalists 10.7 10.7 22.1 17.2 26.2 13.1 82.6 51.7 .75 Marginal livelihoods 25.6 15.1 14.5 18.0 23.3 3.5 87.3 41.7 .40Wealth Index Poorest quintile 29.3 23.4 22.2 16.6 7.0 1.2 87.9 37.9 .19Poor 22.9 21.0 23.4 20.7 9.7 2.3 88.0 51.3 .32 Medium 16.2 17.4 26.2 21.5 15.9 2.7 87.0 57.7 .51Wealthy 13.9 16.2 22.6 22.5 20.4 4.3 84.8 62.8 .62 Wealthiest quintile 10.6 12.5 17.2 24.2 26.4 8.9 83.8 63.4 .96Food Consumption Group Poor 36.2 20.5 21.4 17.6 2.9 1.4 85.4 29.5 .22Borderline 26.4 20.8 21.6 18.8 10.0 2.3 88.0 41.7 .30 Acceptable 16.0 17.5 22.5 21.8 17.8 4.3 86.0 58.7 .58Total 18.5 18.1 22.3 21.1 15.9 3.8 86.3 54.6 .52
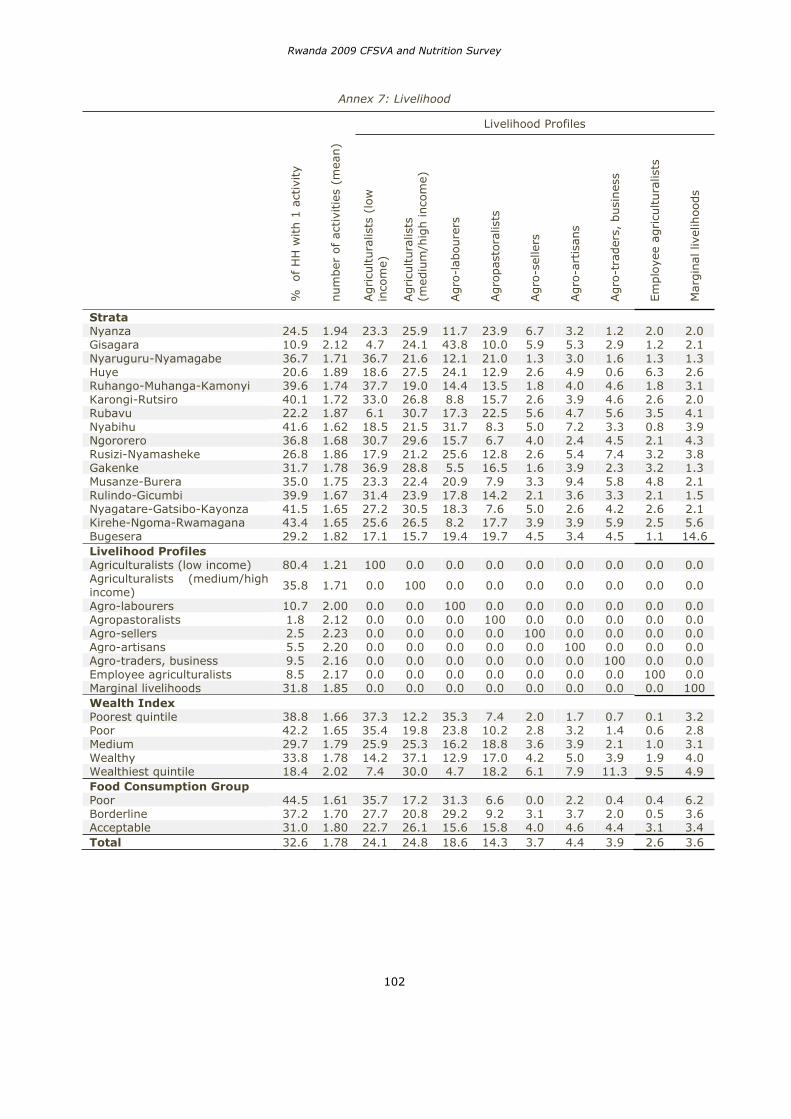
Rwanda 2009 CFSVA and Nutrition Survey
102
Annex 7: Livelihood
%
of H
H w
ith 1
act
ivity
num
ber
of
activi
ties
(m
ean)
Livelihood Profiles
Agricu
ltura
lists
(lo
w
inco
me)
Agricu
ltura
lists
(m
ediu
m/h
igh inco
me)
Agro
-laboure
rs
Agro
pas
tora
lists
Agro
-sel
lers
Agro
-art
isan
s
Agro
-tra
der
s, b
usi
nes
s
Em
plo
yee
agricu
ltura
lists
Mar
gin
al liv
elih
oods
Strata Nyanza 24.5 1.94 23.3 25.9 11.7 23.9 6.7 3.2 1.2 2.0 2.0 Gisagara 10.9 2.12 4.7 24.1 43.8 10.0 5.9 5.3 2.9 1.2 2.1 Nyaruguru-Nyamagabe 36.7 1.71 36.7 21.6 12.1 21.0 1.3 3.0 1.6 1.3 1.3 Huye 20.6 1.89 18.6 27.5 24.1 12.9 2.6 4.9 0.6 6.3 2.6 Ruhango-Muhanga-Kamonyi 39.6 1.74 37.7 19.0 14.4 13.5 1.8 4.0 4.6 1.8 3.1 Karongi-Rutsiro 40.1 1.72 33.0 26.8 8.8 15.7 2.6 3.9 4.6 2.6 2.0 Rubavu 22.2 1.87 6.1 30.7 17.3 22.5 5.6 4.7 5.6 3.5 4.1 Nyabihu 41.6 1.62 18.5 21.5 31.7 8.3 5.0 7.2 3.3 0.8 3.9 Ngororero 36.8 1.68 30.7 29.6 15.7 6.7 4.0 2.4 4.5 2.1 4.3 Rusizi-Nyamasheke 26.8 1.86 17.9 21.2 25.6 12.8 2.6 5.4 7.4 3.2 3.8 Gakenke 31.7 1.78 36.9 28.8 5.5 16.5 1.6 3.9 2.3 3.2 1.3 Musanze-Burera 35.0 1.75 23.3 22.4 20.9 7.9 3.3 9.4 5.8 4.8 2.1 Rulindo-Gicumbi 39.9 1.67 31.4 23.9 17.8 14.2 2.1 3.6 3.3 2.1 1.5 Nyagatare-Gatsibo-Kayonza 41.5 1.65 27.2 30.5 18.3 7.6 5.0 2.6 4.2 2.6 2.1 Kirehe-Ngoma-Rwamagana 43.4 1.65 25.6 26.5 8.2 17.7 3.9 3.9 5.9 2.5 5.6 Bugesera 29.2 1.82 17.1 15.7 19.4 19.7 4.5 3.4 4.5 1.1 14.6 Livelihood Profiles Agriculturalists (low income) 80.4 1.21 100 0.0 0.0 0.0 0.0 0.0 0.0 0.0 0.0 Agriculturalists (medium/high income) 35.8 1.71 0.0 100 0.0 0.0 0.0 0.0 0.0 0.0 0.0
Agro-labourers 10.7 2.00 0.0 0.0 100 0.0 0.0 0.0 0.0 0.0 0.0 Agropastoralists 1.8 2.12 0.0 0.0 0.0 100 0.0 0.0 0.0 0.0 0.0 Agro-sellers 2.5 2.23 0.0 0.0 0.0 0.0 100 0.0 0.0 0.0 0.0 Agro-artisans 5.5 2.20 0.0 0.0 0.0 0.0 0.0 100 0.0 0.0 0.0 Agro-traders, business 9.5 2.16 0.0 0.0 0.0 0.0 0.0 0.0 100 0.0 0.0 Employee agriculturalists 8.5 2.17 0.0 0.0 0.0 0.0 0.0 0.0 0.0 100 0.0 Marginal livelihoods 31.8 1.85 0.0 0.0 0.0 0.0 0.0 0.0 0.0 0.0 100 Wealth Index Poorest quintile 38.8 1.66 37.3 12.2 35.3 7.4 2.0 1.7 0.7 0.1 3.2 Poor 42.2 1.65 35.4 19.8 23.8 10.2 2.8 3.2 1.4 0.6 2.8 Medium 29.7 1.79 25.9 25.3 16.2 18.8 3.6 3.9 2.1 1.0 3.1 Wealthy 33.8 1.78 14.2 37.1 12.9 17.0 4.2 5.0 3.9 1.9 4.0 Wealthiest quintile 18.4 2.02 7.4 30.0 4.7 18.2 6.1 7.9 11.3 9.5 4.9 Food Consumption Group Poor 44.5 1.61 35.7 17.2 31.3 6.6 0.0 2.2 0.4 0.4 6.2 Borderline 37.2 1.70 27.7 20.8 29.2 9.2 3.1 3.7 2.0 0.5 3.6 Acceptable 31.0 1.80 22.7 26.1 15.6 15.8 4.0 4.6 4.4 3.1 3.4 Total 32.6 1.78 24.1 24.8 18.6 14.3 3.7 4.4 3.9 2.6 3.6
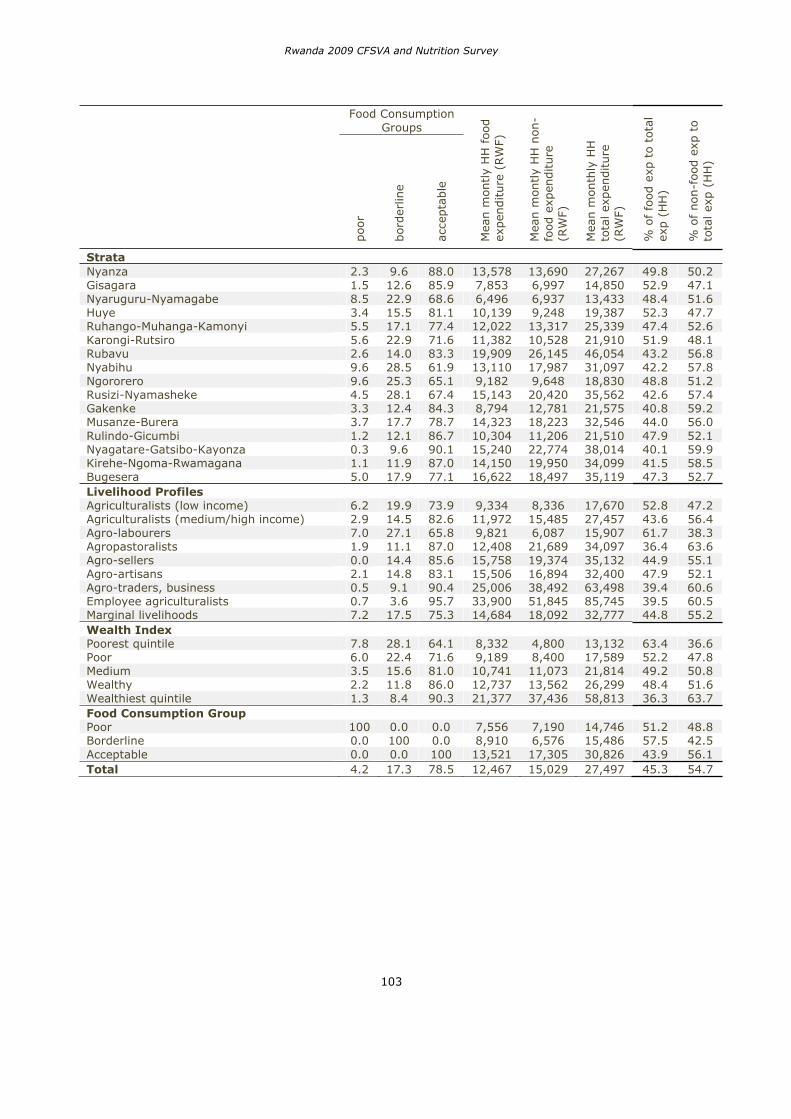
Rwanda 2009 CFSVA and Nutrition Survey
103
Food Consumption Groups
Mea
n m
ontly
HH
foo
d
expen
diture
(RW
F)
Mea
n m
ontly
HH
non-
food
exp
enditure
(R
WF)
Mea
n m
onth
ly H
H
tota
l ex
pen
diture
(R
WF)
% o
f fo
od e
xp t
o to
tal
exp (
HH
)
% o
f non-f
ood
exp
to
tota
l ex
p (
HH
)
poo
r
bor
der
line
acce
pta
ble
Strata Nyanza 2.3 9.6 88.0 13,578 13,690 27,267 49.8 50.2 Gisagara 1.5 12.6 85.9 7,853 6,997 14,850 52.9 47.1 Nyaruguru-Nyamagabe 8.5 22.9 68.6 6,496 6,937 13,433 48.4 51.6 Huye 3.4 15.5 81.1 10,139 9,248 19,387 52.3 47.7 Ruhango-Muhanga-Kamonyi 5.5 17.1 77.4 12,022 13,317 25,339 47.4 52.6 Karongi-Rutsiro 5.6 22.9 71.6 11,382 10,528 21,910 51.9 48.1 Rubavu 2.6 14.0 83.3 19,909 26,145 46,054 43.2 56.8 Nyabihu 9.6 28.5 61.9 13,110 17,987 31,097 42.2 57.8 Ngororero 9.6 25.3 65.1 9,182 9,648 18,830 48.8 51.2 Rusizi-Nyamasheke 4.5 28.1 67.4 15,143 20,420 35,562 42.6 57.4 Gakenke 3.3 12.4 84.3 8,794 12,781 21,575 40.8 59.2 Musanze-Burera 3.7 17.7 78.7 14,323 18,223 32,546 44.0 56.0 Rulindo-Gicumbi 1.2 12.1 86.7 10,304 11,206 21,510 47.9 52.1 Nyagatare-Gatsibo-Kayonza 0.3 9.6 90.1 15,240 22,774 38,014 40.1 59.9 Kirehe-Ngoma-Rwamagana 1.1 11.9 87.0 14,150 19,950 34,099 41.5 58.5 Bugesera 5.0 17.9 77.1 16,622 18,497 35,119 47.3 52.7 Livelihood Profiles Agriculturalists (low income) 6.2 19.9 73.9 9,334 8,336 17,670 52.8 47.2 Agriculturalists (medium/high income) 2.9 14.5 82.6 11,972 15,485 27,457 43.6 56.4 Agro-labourers 7.0 27.1 65.8 9,821 6,087 15,907 61.7 38.3 Agropastoralists 1.9 11.1 87.0 12,408 21,689 34,097 36.4 63.6 Agro-sellers 0.0 14.4 85.6 15,758 19,374 35,132 44.9 55.1 Agro-artisans 2.1 14.8 83.1 15,506 16,894 32,400 47.9 52.1 Agro-traders, business 0.5 9.1 90.4 25,006 38,492 63,498 39.4 60.6 Employee agriculturalists 0.7 3.6 95.7 33,900 51,845 85,745 39.5 60.5 Marginal livelihoods 7.2 17.5 75.3 14,684 18,092 32,777 44.8 55.2 Wealth Index Poorest quintile 7.8 28.1 64.1 8,332 4,800 13,132 63.4 36.6 Poor 6.0 22.4 71.6 9,189 8,400 17,589 52.2 47.8 Medium 3.5 15.6 81.0 10,741 11,073 21,814 49.2 50.8 Wealthy 2.2 11.8 86.0 12,737 13,562 26,299 48.4 51.6 Wealthiest quintile 1.3 8.4 90.3 21,377 37,436 58,813 36.3 63.7 Food Consumption Group Poor 100 0.0 0.0 7,556 7,190 14,746 51.2 48.8 Borderline 0.0 100 0.0 8,910 6,576 15,486 57.5 42.5 Acceptable 0.0 0.0 100 13,521 17,305 30,826 43.9 56.1 Total 4.2 17.3 78.5 12,467 15,029 27,497 45.3 54.7
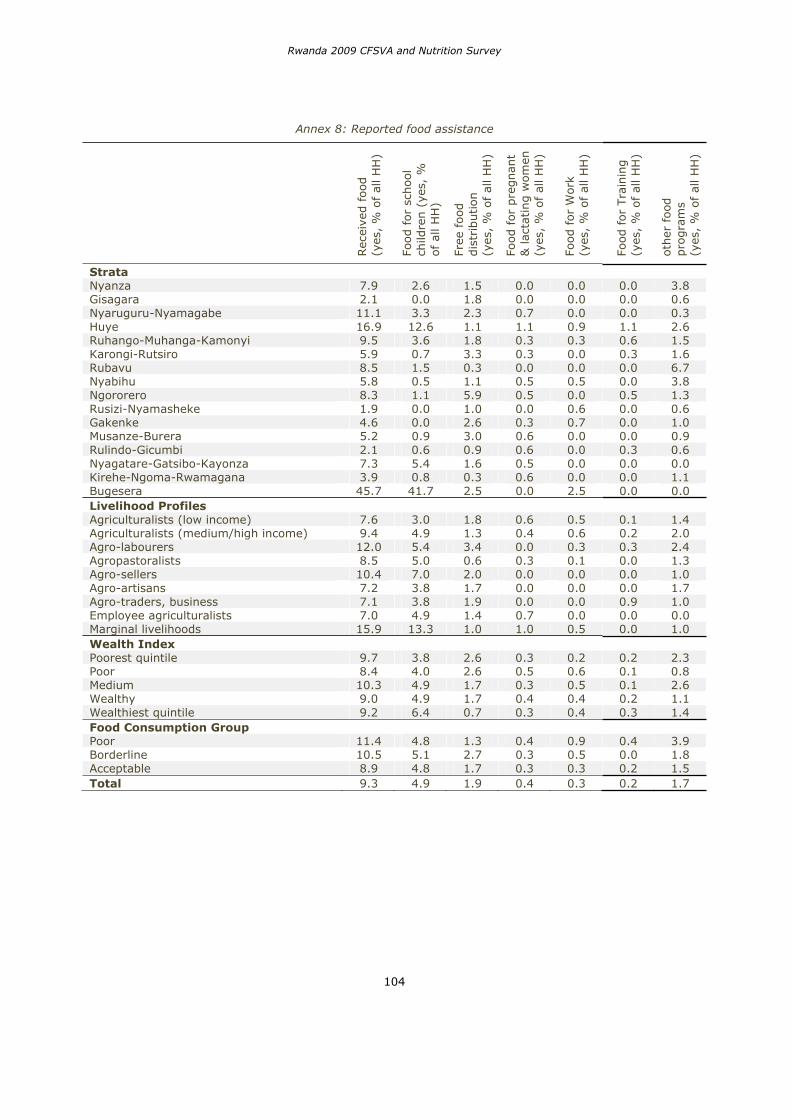
Rwanda 2009 CFSVA and Nutrition Survey
104
Annex 8: Reported food assistance
Rec
eive
d f
ood
(yes
, %
of
all H
H)
Food f
or
schoo
l ch
ildre
n (
yes,
%
of
all H
H)
Free
food
dis
trib
ution
(yes
, %
of
all H
H)
Food f
or
pre
gnan
t &
lac
tating w
omen
(y
es,
% o
f al
l H
H)
Food f
or
Work
(y
es,
% o
f al
l H
H)
Food f
or
Tra
inin
g
(yes
, %
of
all H
H)
oth
er f
ood
pro
gra
ms
(y
es,
% o
f al
l H
H)
Strata Nyanza 7.9 2.6 1.5 0.0 0.0 0.0 3.8 Gisagara 2.1 0.0 1.8 0.0 0.0 0.0 0.6 Nyaruguru-Nyamagabe 11.1 3.3 2.3 0.7 0.0 0.0 0.3 Huye 16.9 12.6 1.1 1.1 0.9 1.1 2.6 Ruhango-Muhanga-Kamonyi 9.5 3.6 1.8 0.3 0.3 0.6 1.5 Karongi-Rutsiro 5.9 0.7 3.3 0.3 0.0 0.3 1.6 Rubavu 8.5 1.5 0.3 0.0 0.0 0.0 6.7 Nyabihu 5.8 0.5 1.1 0.5 0.5 0.0 3.8 Ngororero 8.3 1.1 5.9 0.5 0.0 0.5 1.3 Rusizi-Nyamasheke 1.9 0.0 1.0 0.0 0.6 0.0 0.6 Gakenke 4.6 0.0 2.6 0.3 0.7 0.0 1.0 Musanze-Burera 5.2 0.9 3.0 0.6 0.0 0.0 0.9 Rulindo-Gicumbi 2.1 0.6 0.9 0.6 0.0 0.3 0.6 Nyagatare-Gatsibo-Kayonza 7.3 5.4 1.6 0.5 0.0 0.0 0.0 Kirehe-Ngoma-Rwamagana 3.9 0.8 0.3 0.6 0.0 0.0 1.1 Bugesera 45.7 41.7 2.5 0.0 2.5 0.0 0.0 Livelihood Profiles Agriculturalists (low income) 7.6 3.0 1.8 0.6 0.5 0.1 1.4 Agriculturalists (medium/high income) 9.4 4.9 1.3 0.4 0.6 0.2 2.0 Agro-labourers 12.0 5.4 3.4 0.0 0.3 0.3 2.4 Agropastoralists 8.5 5.0 0.6 0.3 0.1 0.0 1.3 Agro-sellers 10.4 7.0 2.0 0.0 0.0 0.0 1.0 Agro-artisans 7.2 3.8 1.7 0.0 0.0 0.0 1.7 Agro-traders, business 7.1 3.8 1.9 0.0 0.0 0.9 1.0 Employee agriculturalists 7.0 4.9 1.4 0.7 0.0 0.0 0.0 Marginal livelihoods 15.9 13.3 1.0 1.0 0.5 0.0 1.0 Wealth Index Poorest quintile 9.7 3.8 2.6 0.3 0.2 0.2 2.3 Poor 8.4 4.0 2.6 0.5 0.6 0.1 0.8 Medium 10.3 4.9 1.7 0.3 0.5 0.1 2.6 Wealthy 9.0 4.9 1.7 0.4 0.4 0.2 1.1 Wealthiest quintile 9.2 6.4 0.7 0.3 0.4 0.3 1.4 Food Consumption Group Poor 11.4 4.8 1.3 0.4 0.9 0.4 3.9 Borderline 10.5 5.1 2.7 0.3 0.5 0.0 1.8 Acceptable 8.9 4.8 1.7 0.3 0.3 0.2 1.5 Total 9.3 4.9 1.9 0.4 0.3 0.2 1.7
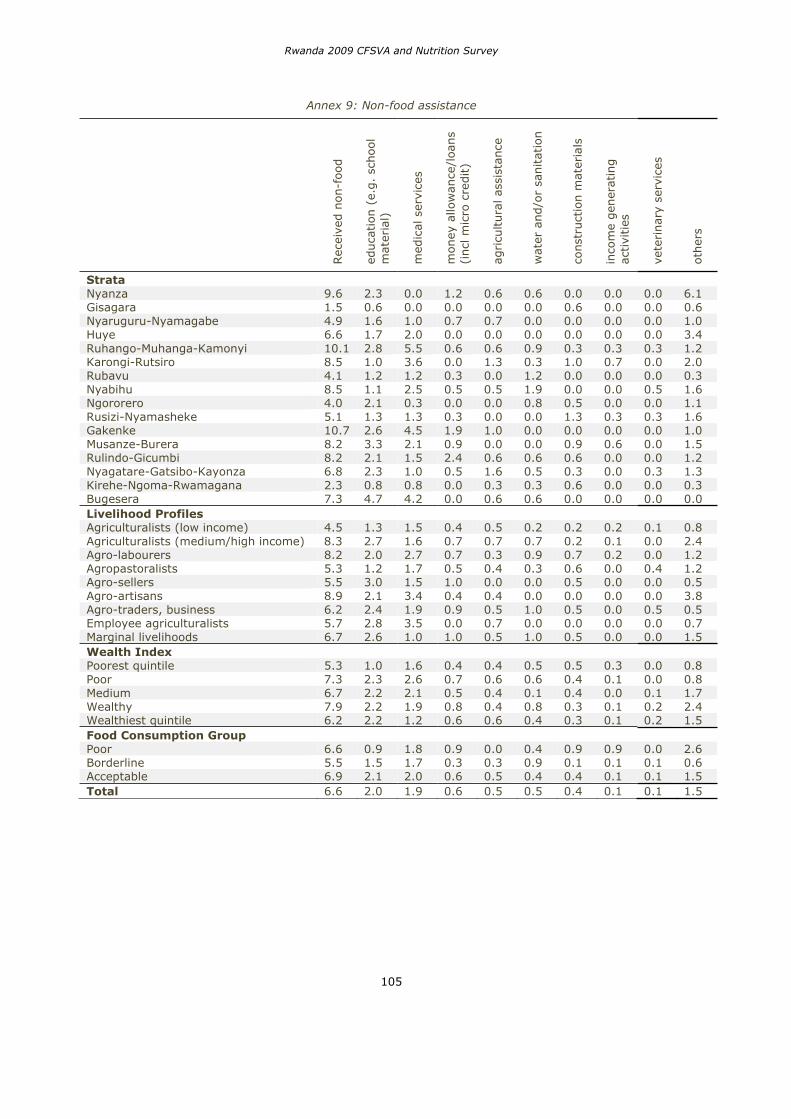
Rwanda 2009 CFSVA and Nutrition Survey
105
Annex 9: Non-food assistance
Rec
eive
d n
on-f
ood
educa
tion
(e.
g.
school
mat
eria
l)
med
ical
ser
vice
s
money
allo
wan
ce/l
oans
(incl
mic
ro c
redit)
agricu
ltura
l as
sist
ance
wat
er a
nd/o
r sa
nitat
ion
const
ruct
ion m
ater
ials
inco
me
gen
erat
ing
act
ivitie
s
vete
rinar
y se
rvic
es
oth
ers
Strata Nyanza 9.6 2.3 0.0 1.2 0.6 0.6 0.0 0.0 0.0 6.1 Gisagara 1.5 0.6 0.0 0.0 0.0 0.0 0.6 0.0 0.0 0.6 Nyaruguru-Nyamagabe 4.9 1.6 1.0 0.7 0.7 0.0 0.0 0.0 0.0 1.0 Huye 6.6 1.7 2.0 0.0 0.0 0.0 0.0 0.0 0.0 3.4 Ruhango-Muhanga-Kamonyi 10.1 2.8 5.5 0.6 0.6 0.9 0.3 0.3 0.3 1.2 Karongi-Rutsiro 8.5 1.0 3.6 0.0 1.3 0.3 1.0 0.7 0.0 2.0 Rubavu 4.1 1.2 1.2 0.3 0.0 1.2 0.0 0.0 0.0 0.3 Nyabihu 8.5 1.1 2.5 0.5 0.5 1.9 0.0 0.0 0.5 1.6 Ngororero 4.0 2.1 0.3 0.0 0.0 0.8 0.5 0.0 0.0 1.1 Rusizi-Nyamasheke 5.1 1.3 1.3 0.3 0.0 0.0 1.3 0.3 0.3 1.6 Gakenke 10.7 2.6 4.5 1.9 1.0 0.0 0.0 0.0 0.0 1.0 Musanze-Burera 8.2 3.3 2.1 0.9 0.0 0.0 0.9 0.6 0.0 1.5 Rulindo-Gicumbi 8.2 2.1 1.5 2.4 0.6 0.6 0.6 0.0 0.0 1.2 Nyagatare-Gatsibo-Kayonza 6.8 2.3 1.0 0.5 1.6 0.5 0.3 0.0 0.3 1.3 Kirehe-Ngoma-Rwamagana 2.3 0.8 0.8 0.0 0.3 0.3 0.6 0.0 0.0 0.3 Bugesera 7.3 4.7 4.2 0.0 0.6 0.6 0.0 0.0 0.0 0.0 Livelihood Profiles Agriculturalists (low income) 4.5 1.3 1.5 0.4 0.5 0.2 0.2 0.2 0.1 0.8 Agriculturalists (medium/high income) 8.3 2.7 1.6 0.7 0.7 0.7 0.2 0.1 0.0 2.4 Agro-labourers 8.2 2.0 2.7 0.7 0.3 0.9 0.7 0.2 0.0 1.2 Agropastoralists 5.3 1.2 1.7 0.5 0.4 0.3 0.6 0.0 0.4 1.2 Agro-sellers 5.5 3.0 1.5 1.0 0.0 0.0 0.5 0.0 0.0 0.5 Agro-artisans 8.9 2.1 3.4 0.4 0.4 0.0 0.0 0.0 0.0 3.8 Agro-traders, business 6.2 2.4 1.9 0.9 0.5 1.0 0.5 0.0 0.5 0.5 Employee agriculturalists 5.7 2.8 3.5 0.0 0.7 0.0 0.0 0.0 0.0 0.7 Marginal livelihoods 6.7 2.6 1.0 1.0 0.5 1.0 0.5 0.0 0.0 1.5 Wealth Index Poorest quintile 5.3 1.0 1.6 0.4 0.4 0.5 0.5 0.3 0.0 0.8 Poor 7.3 2.3 2.6 0.7 0.6 0.6 0.4 0.1 0.0 0.8 Medium 6.7 2.2 2.1 0.5 0.4 0.1 0.4 0.0 0.1 1.7 Wealthy 7.9 2.2 1.9 0.8 0.4 0.8 0.3 0.1 0.2 2.4 Wealthiest quintile 6.2 2.2 1.2 0.6 0.6 0.4 0.3 0.1 0.2 1.5 Food Consumption Group Poor 6.6 0.9 1.8 0.9 0.0 0.4 0.9 0.9 0.0 2.6 Borderline 5.5 1.5 1.7 0.3 0.3 0.9 0.1 0.1 0.1 0.6 Acceptable 6.9 2.1 2.0 0.6 0.5 0.4 0.4 0.1 0.1 1.5 Total 6.6 2.0 1.9 0.6 0.5 0.5 0.4 0.1 0.1 1.5
Rwanda 2009 CFSVA and Nutrition Survey
106
Annex 10: List of references
CFSVA and Nutrition Survey, and Secondary Data Analysis (SDA)
Department for International Development, DFID (1999) Sustainable Livelihoods Guidance Sheet Government of Rwanda (2000) Enquête Intégrale sur les Conditions de Vie des Ménages (EICV I) ____ (2000) Rwanda Vision 2020, Ministry of Finance and Economic Planning ____ (2001) Enquête Démographique et de Sante (EDS 2000) Office National de la Population (ONAPO)
and ORC Macro ____ (2005) Enquête Démographique et de Santé (EDS 2005), Rapport Préliminaire (Institut National de
la Statistique, Ministère des Finances et de la Planification Economique, Commission Nationale de Lutte contre le Sida, Centre de Traitement et de Recherche sur le Sida, Laboratoire National de Référence, MEASURE DHS)
____ (2006) Enquête Intégrale sur les Conditions de Vie des Ménages (EICV II) ____ (2006) Maternal, Neonatal and Child Health Assessment ____ (2006) Rwanda Aid Policy (Draft for Discussion), Revision 5.0 ____ (2007) Millennium Development Goals, Towards Sustainable Social and Economic Growth, Country
Report (NISR) ____ (2007) Macro-Economic Performance, Ministry of Finance and Economic Planning ____ (2007) Vision 2020 Umurenge: An integrated local development programme to accelerate poverty
eradication, rural growth and social protection ____ (2008) Economic Development and Poverty Reduction Strategy 2008-2012 (EDPRS) International Federation of Red Cross and Red Crescent Societies (2006) Rwanda: Drought Appeal no.
MDRRW001 3 March 2006 Ruel M. (2003): Operationalizing Dietary Diversity: A Review of Measurement Issues and Research
Priorities. Journal of Nutrition 133 (11 suppl. 2) 3911S-3926S Sperling, L. 1997. The Effects of the Rwandan War on Crop Production and Varietal Diversity: A
Comparison of Two Crops. Overseas Development Institute (ODI) Network Paper. London, ODI.
UNDAF (2008) United Nations Development Assistance Framework 2008-2012, Rwanda UNDP (2008) Human and Development Report – Rwanda,
http://hdrstats.undp.org/countries/country_fact_sheets/cty_fs_RWA.html WHO guidelines (2008) Indicators for assessing infant and young child feeding practices.
www.who.int/nutrition/publications/infantfeeding/en/ World Bank factsheet (2007) ‘Rwanda at a Glance’ World Food Programme (2002) VAM Standard Analytical Framework ____ (2006) Comprehensive Food Security and Vulnerability Analysis (CFSVA), March-April 2006 ____ (2007) Logistics Capacity Assessment, Rwanda ____ (2007) Formative Evaluation of the WFP/RWANDA, Protracted Relief and Recovery Operation (PRRO)
10531.0: Assistance to Refugees and Recovery Operations for the Most Vulnerable Households
____ (2008) Rwanda Secondary Data Analysis on Food Security and Vulnerability Yang H., de ONISR M., 2008, “Algorithms for converting estimates of child malnutrition based on the NCHS
reference into estimates based on the WHO Child Growth Standards”, BMC Paediatrics, 8


Printed by AZ MEDIA PLUS
Tel: (+250) 504263