Embed Size (px)
Citation preview
NJ Center for Teaching and Learning ~ 1 ~ www.njctl.org
6th Grade Data Displays Chapter Questions
1. Why are there different ways to display data?
2. What are some of the ways to display data?
Chapter Problems
Frequency Tables and Histograms Classwork
1) The following are test grades from your classmates. Organize the data into a frequency table and create a histogram.
100 73 89 65 86 79 83 95 83 96 83 86 76 69 89 79 74 85
2) The following are times that it took children in gym class to run a mile. Organize this data into a frequency table and create a histogram.
7:23 8:02 10:04 7:05 7:50 9:24 6:59 9:01 8:34 7:25 8:55 6:39 7:55 11:01 9:28 8:02 9:54 8:24
3) Organize this data into a histogram.
Length of walk time 21 35 48 63 67 11 19 31 43 15 44 37 42 34 69 67
Time Tally Frequency 10-19 III 3 20-29 I 1 30-39 IIII 4 40-49 IIII 4 50-59 0 60-69 IIII 4
NJ Center for Teaching and Learning ~ 2 ~ www.njctl.org
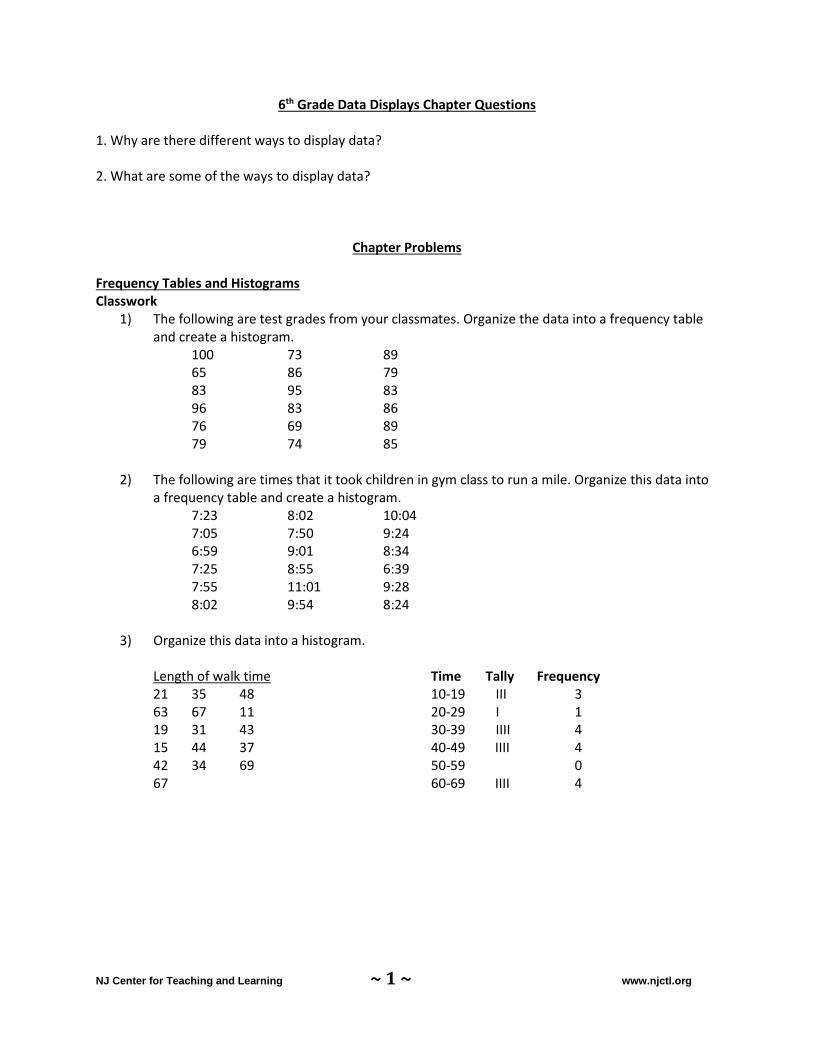
4) a. How many students scored
below 70?
b. How many students scored a 52?
c. Can you determine the exact value of the test grade that was in the 60’s?
5) Create a frequency table and a histogram for the data below. Test Scores 92 84 76 75 85 97 67 48 87 93 87 88 79 68 66 100 99 79 88 81 80 79 99 91 Homework
6) The following is test scores from a math test. Organize these scores into a frequency table and create a histogram.
78 97 49 99 67 47 97 84 79 87 86 51 97 89 87 84 79 75 97 84 83
7) The following is temperatures in New Jersey in August. Organize them into a frequency table and create a histogram.
100 102 105 97 95 101 89 88 90 99 95 93 89 89 96 102 91 99 98 92 103 108 98 92
NJ Center for Teaching and Learning ~ 3 ~ www.njctl.org
8) Organize this data into a histogram.
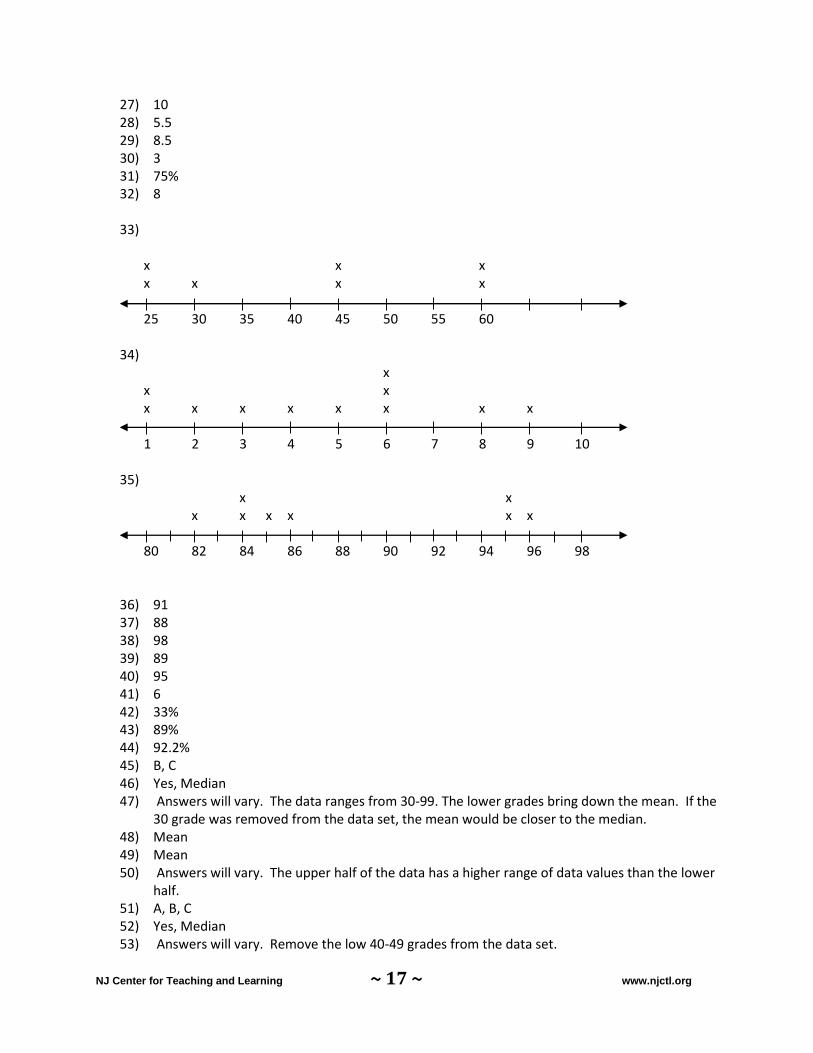
Length of time walked 64 41 38 27 11 48 33 13 61 57 49 37 19 69 45 34 24 12
Time Tally Frequency 10-19 IIII 4 20-29 II 2 30-39 IIII 4 40-49 IIII 4 50-59 I 1 60-69 III 3
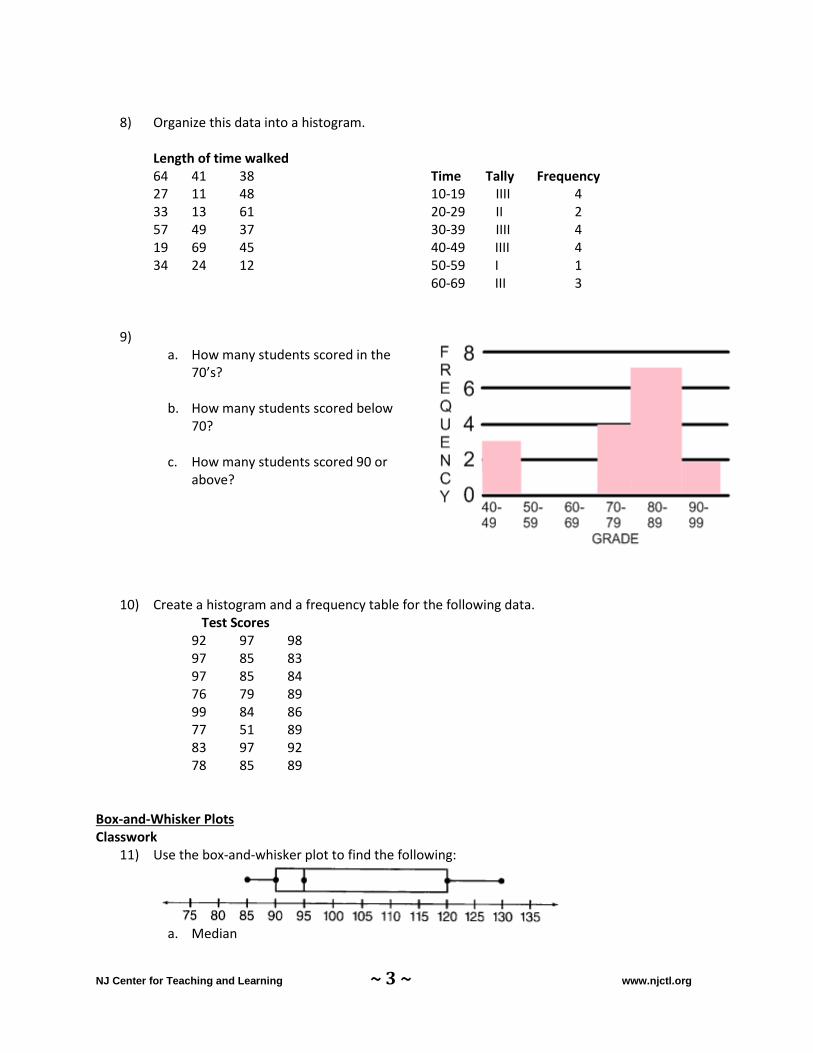
9)
a. How many students scored in the 70’s?
b. How many students scored below 70?
c. How many students scored 90 or
above?
10) Create a histogram and a frequency table for the following data. Test Scores 92 97 98 97 85 83 97 85 84 76 79 89 99 84 86 77 51 89 83 97 92 78 85 89
Box-and-Whisker Plots Classwork
11) Use the box-and-whisker plot to find the following:
a. Median
NJ Center for Teaching and Learning ~ 4 ~ www.njctl.org
b. Minimum c. Maximum d. Range e. Lower Quartile f. Upper Quartile g. Interquartile Range
Create a box-and-whisker plot for these data:
12) 12, 16, 62, 48, 16, 59, 43, 39 13) Test Grades: 78, 82, 65, 46, 84, 99, 100, 90, 75, 59, 75, 79, 80, 86, 68 14) $21, $50, $78, $13, $45, $5, $12, $37, $61, $11, $77, $31, $19, $11, $29, $16
15) The price of tablets in dollars at Laptop World and PC Mall are shown in the box-and-whisker plots below.
a. What percent of tablets at Laptop World cost less than $325? b. What percent of tablets at PC Mall cost less than $940? c. How does the price of tablets at Laptop World compare to the price of computers at PC
Mall? Homework
16) Use the box-and-whisker plot to find the following:
a. Median b. Minimum c. Maximum d. Range e. Lower Quartile f. Upper Quartile g. Interquartile Range
Create a box-and-whisker plot for each set of data:
17) 30, 57, 34, 40, 32, 52, 54, 48, 56 18) Test Grades: 80, 81, 64, 66, 74, 98, 100, 91, 85, 89, 55, 66, 70, 84, 98 19) 17, 5, 28, 33, 25, 5, 12, 3, 16, 11, 22, 31, 9, 11
Laptop World
PC Mall
NJ Center for Teaching and Learning ~ 5 ~ www.njctl.org
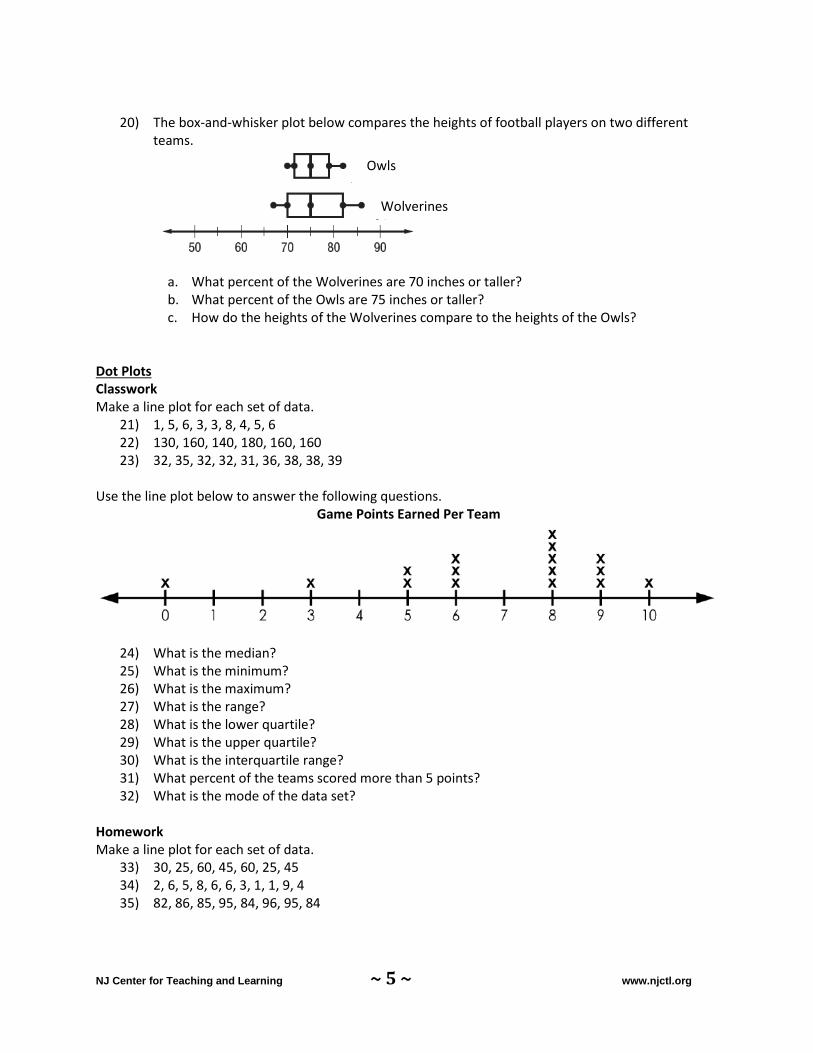
20) The box-and-whisker plot below compares the heights of football players on two different
teams.
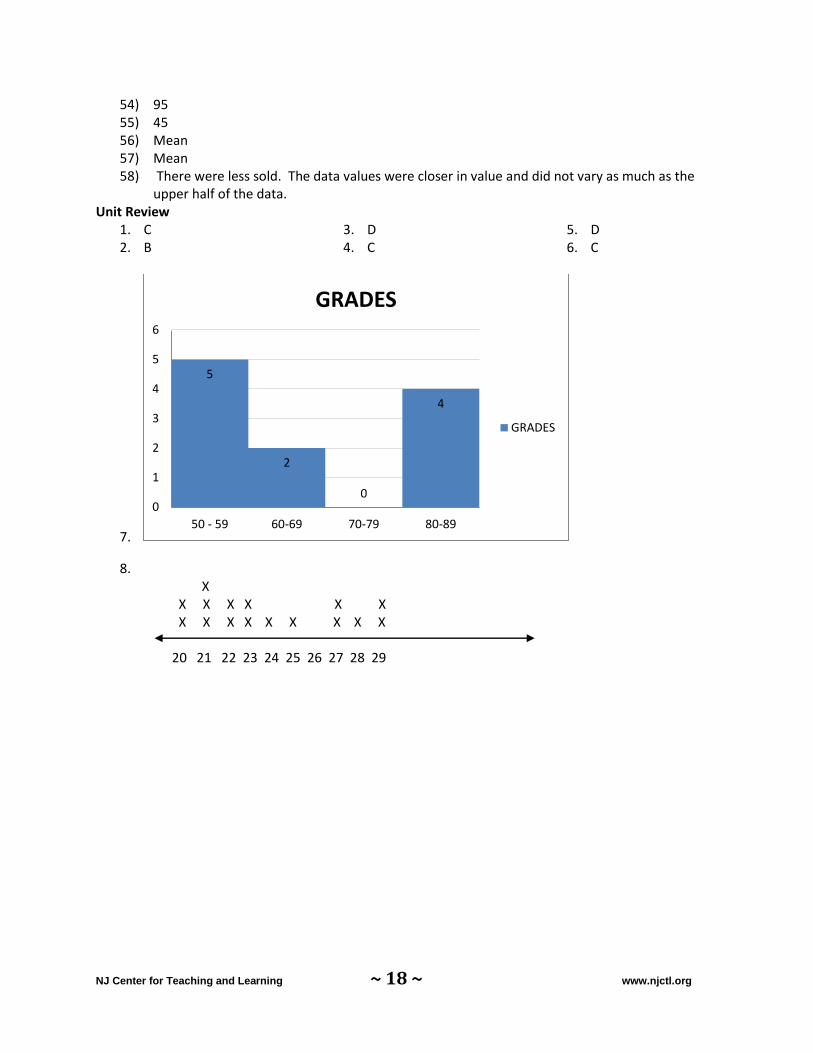
a. What percent of the Wolverines are 70 inches or taller? b. What percent of the Owls are 75 inches or taller? c. How do the heights of the Wolverines compare to the heights of the Owls?
Dot Plots Classwork Make a line plot for each set of data.
21) 1, 5, 6, 3, 3, 8, 4, 5, 6 22) 130, 160, 140, 180, 160, 160 23) 32, 35, 32, 32, 31, 36, 38, 38, 39
Use the line plot below to answer the following questions.
Game Points Earned Per Team
24) What is the median? 25) What is the minimum? 26) What is the maximum? 27) What is the range? 28) What is the lower quartile? 29) What is the upper quartile? 30) What is the interquartile range? 31) What percent of the teams scored more than 5 points? 32) What is the mode of the data set?
Homework Make a line plot for each set of data.
33) 30, 25, 60, 45, 60, 25, 45 34) 2, 6, 5, 8, 6, 6, 3, 1, 1, 9, 4 35) 82, 86, 85, 95, 84, 96, 95, 84
Owls
Wolverines
NJ Center for Teaching and Learning ~ 6 ~ www.njctl.org
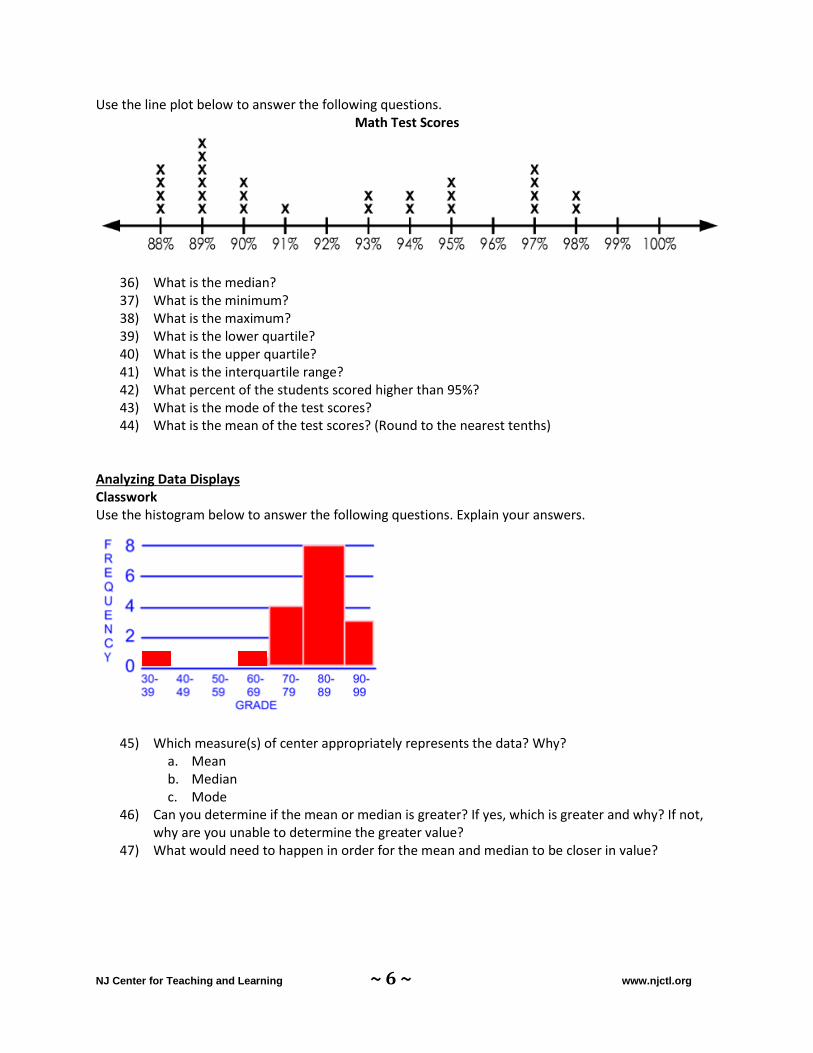
Use the line plot below to answer the following questions. Math Test Scores
36) What is the median? 37) What is the minimum? 38) What is the maximum? 39) What is the lower quartile? 40) What is the upper quartile? 41) What is the interquartile range? 42) What percent of the students scored higher than 95%? 43) What is the mode of the test scores? 44) What is the mean of the test scores? (Round to the nearest tenths)
Analyzing Data Displays Classwork Use the histogram below to answer the following questions. Explain your answers.
45) Which measure(s) of center appropriately represents the data? Why? a. Mean b. Median c. Mode
46) Can you determine if the mean or median is greater? If yes, which is greater and why? If not, why are you unable to determine the greater value?
47) What would need to happen in order for the mean and median to be closer in value?
NJ Center for Teaching and Learning ~ 7 ~ www.njctl.org
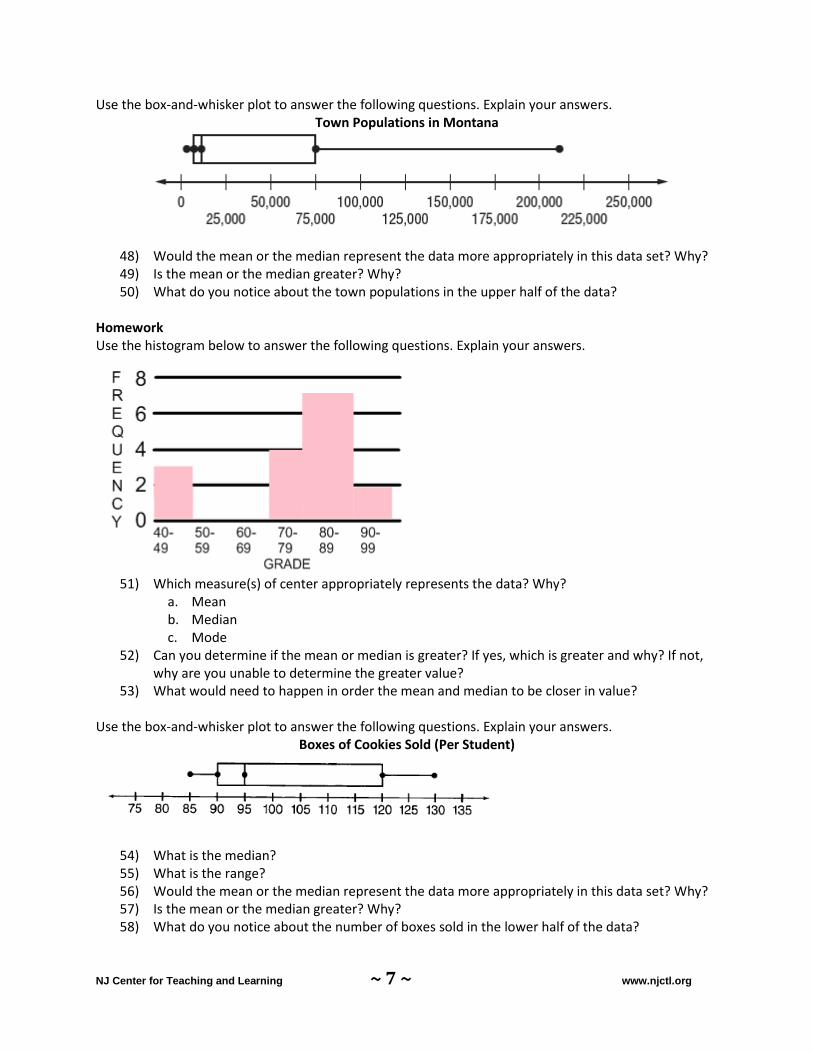
Use the box-and-whisker plot to answer the following questions. Explain your answers. Town Populations in Montana
48) Would the mean or the median represent the data more appropriately in this data set? Why? 49) Is the mean or the median greater? Why? 50) What do you notice about the town populations in the upper half of the data?
Homework Use the histogram below to answer the following questions. Explain your answers.
51) Which measure(s) of center appropriately represents the data? Why?
a. Mean b. Median c. Mode
52) Can you determine if the mean or median is greater? If yes, which is greater and why? If not, why are you unable to determine the greater value?
53) What would need to happen in order the mean and median to be closer in value? Use the box-and-whisker plot to answer the following questions. Explain your answers.
Boxes of Cookies Sold (Per Student)
54) What is the median? 55) What is the range? 56) Would the mean or the median represent the data more appropriately in this data set? Why? 57) Is the mean or the median greater? Why? 58) What do you notice about the number of boxes sold in the lower half of the data?
NJ Center for Teaching and Learning ~ 8 ~ www.njctl.org
0
2
4
6
8
10
12
14
16
Poodle Collie Springer Yorkie GermanShepard
Terrier Mixed
Chapter Review Multiple Choice Choose the correct answer for each question. No partial credit will be given.
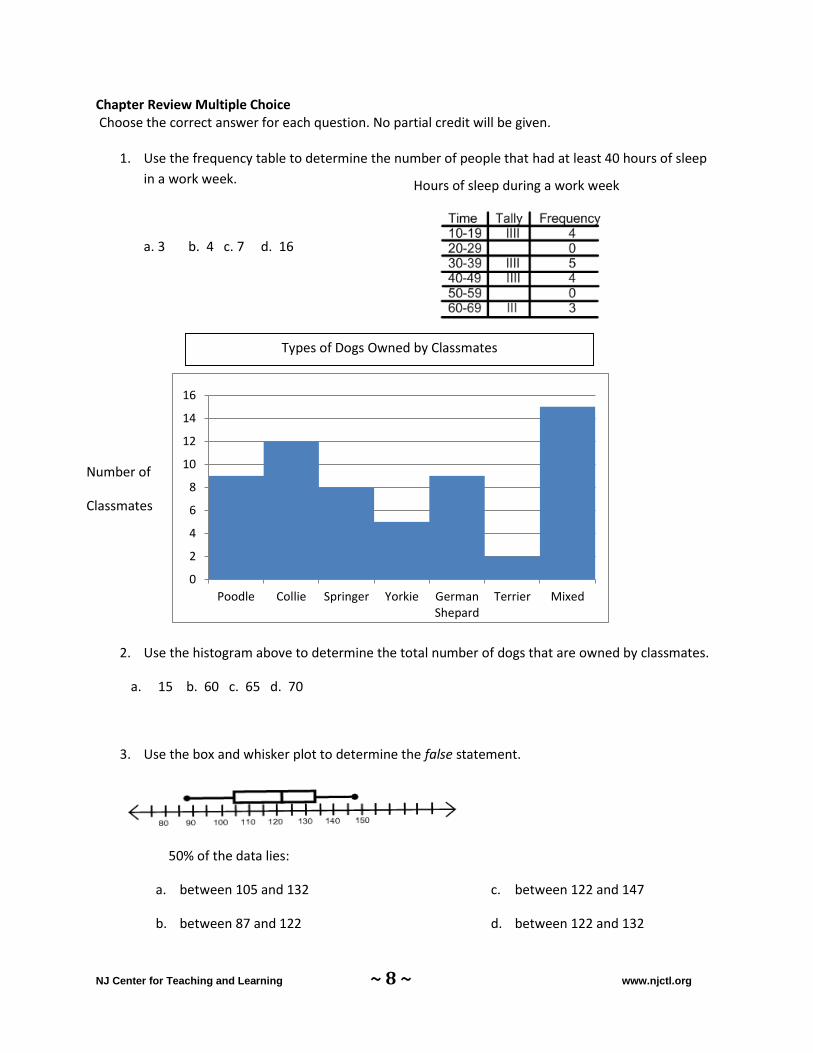
1. Use the frequency table to determine the number of people that had at least 40 hours of sleep
in a work week.
a. 3 b. 4 c. 7 d. 16
2. Use the histogram above to determine the total number of dogs that are owned by classmates.
a. 15 b. 60 c. 65 d. 70
3. Use the box and whisker plot to determine the false statement.
50% of the data lies:
a. between 105 and 132
b. between 87 and 122
c. between 122 and 147
d. between 122 and 132
Hours of sleep during a work week
Types of Dogs Owned by Classmates
Number of
Classmates
NJ Center for Teaching and Learning ~ 9 ~ www.njctl.org
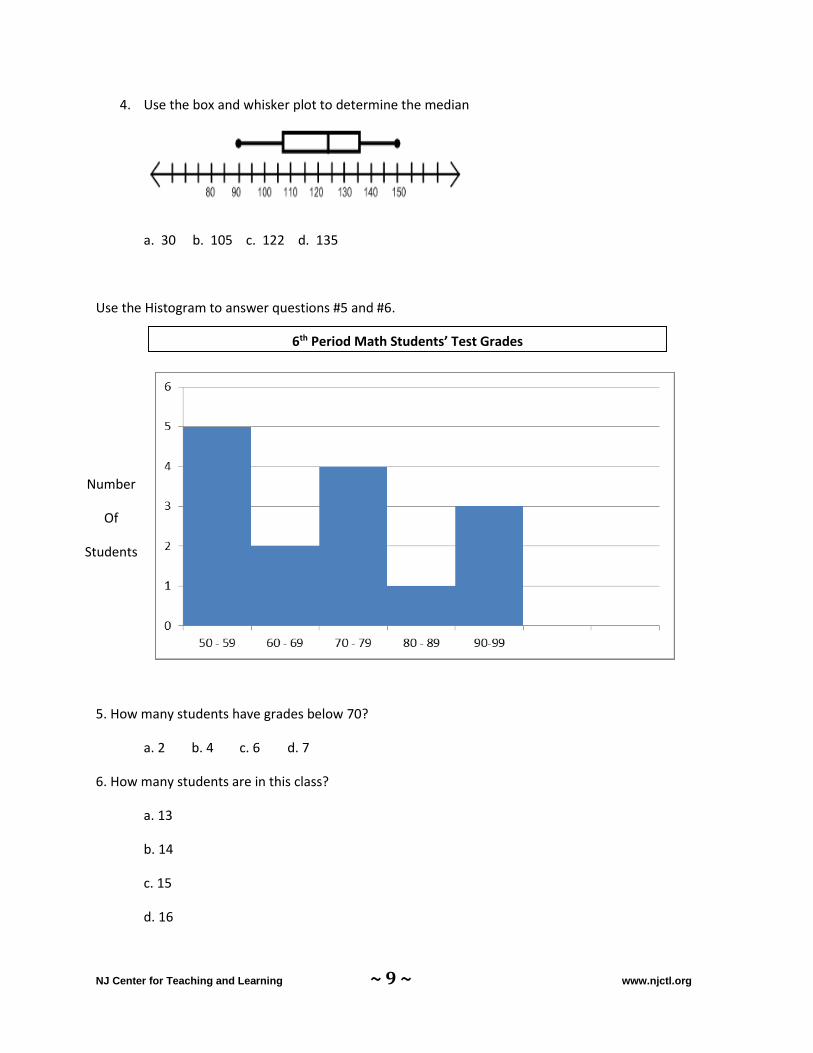
4. Use the box and whisker plot to determine the median
a. 30 b. 105 c. 122 d. 135
Use the Histogram to answer questions #5 and #6.
5. How many students have grades below 70?
a. 2 b. 4 c. 6 d. 7
6. How many students are in this class?
a. 13
b. 14
c. 15
d. 16
6th Period Math Students’ Test Grades
Number
Of
Students
NJ Center for Teaching and Learning ~ 10 ~ www.njctl.org
Short Constructed Response – Write the correct answer for each question. No partial credit will be
given.
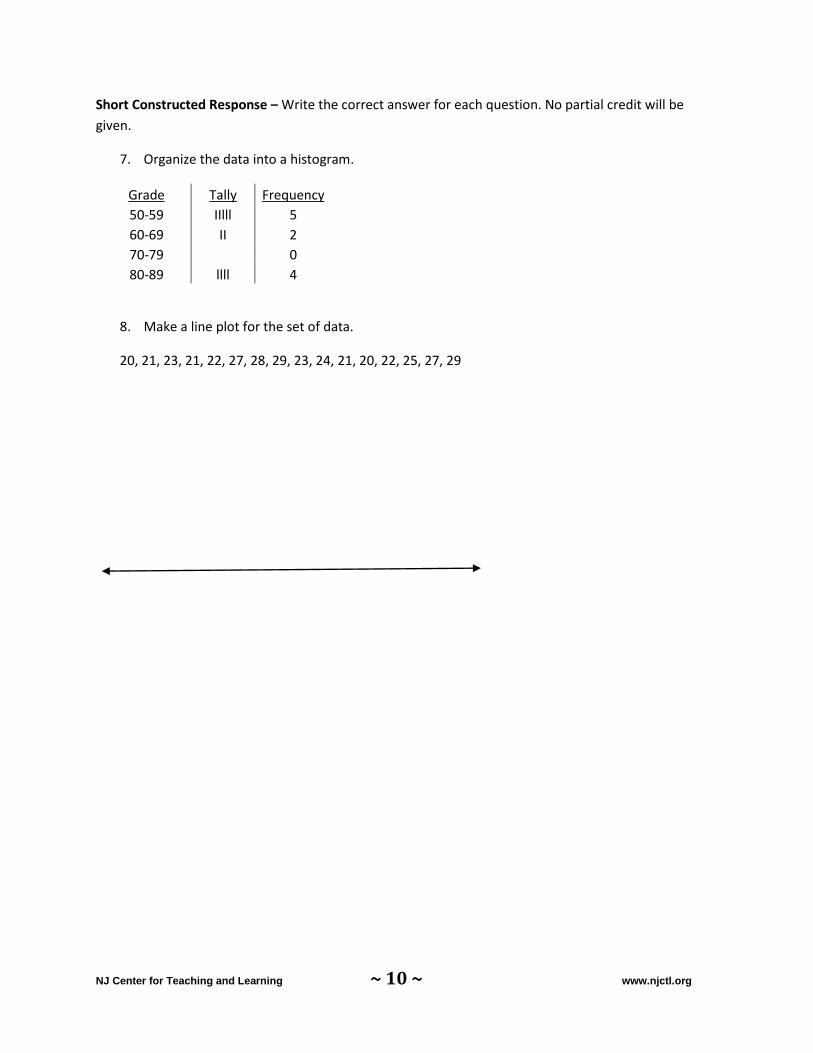
7. Organize the data into a histogram.
Grade Tally Frequency
50-59 ІІlll 5
60-69 ІІ 2
70-79 0
80-89 llll 4
8. Make a line plot for the set of data.
20, 21, 23, 21, 22, 27, 28, 29, 23, 24, 21, 20, 22, 25, 27, 29
NJ Center for Teaching and Learning ~ 11 ~ www.njctl.org
Extended Constructed Response
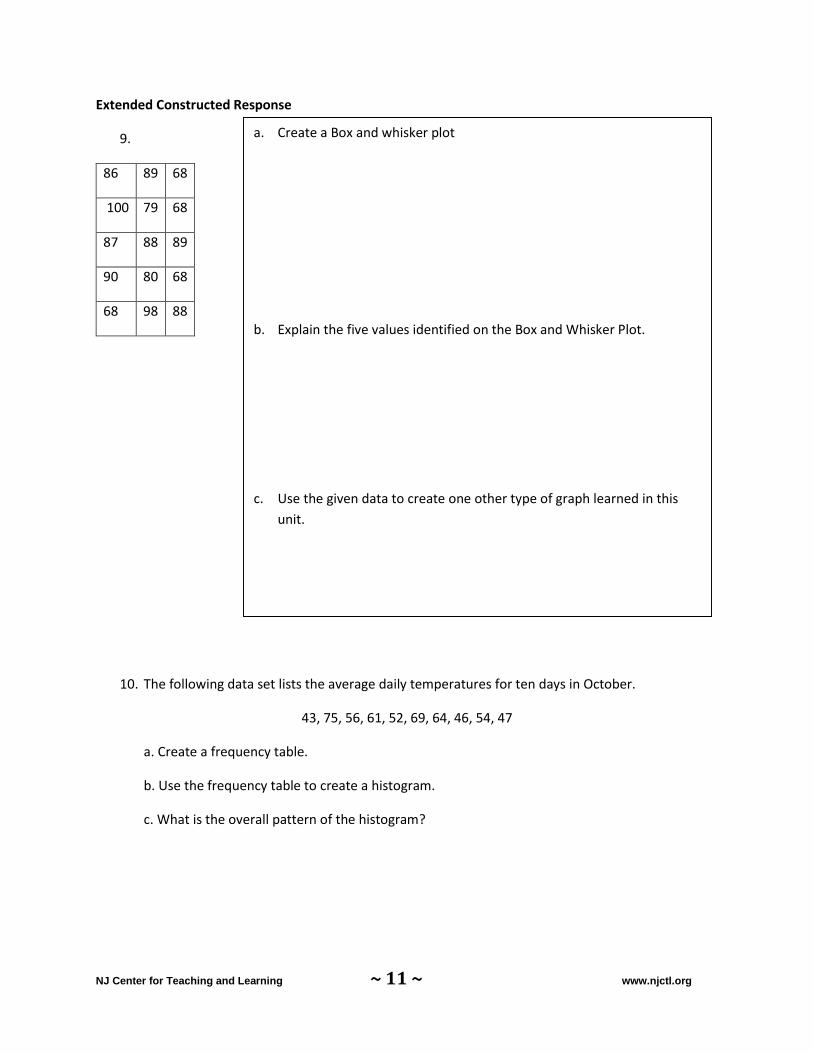
9.
86 89 68
100 79 68
87 88 89
90 80 68
68 98 88
10. The following data set lists the average daily temperatures for ten days in October.
43, 75, 56, 61, 52, 69, 64, 46, 54, 47
a. Create a frequency table.
b. Use the frequency table to create a histogram.
c. What is the overall pattern of the histogram?
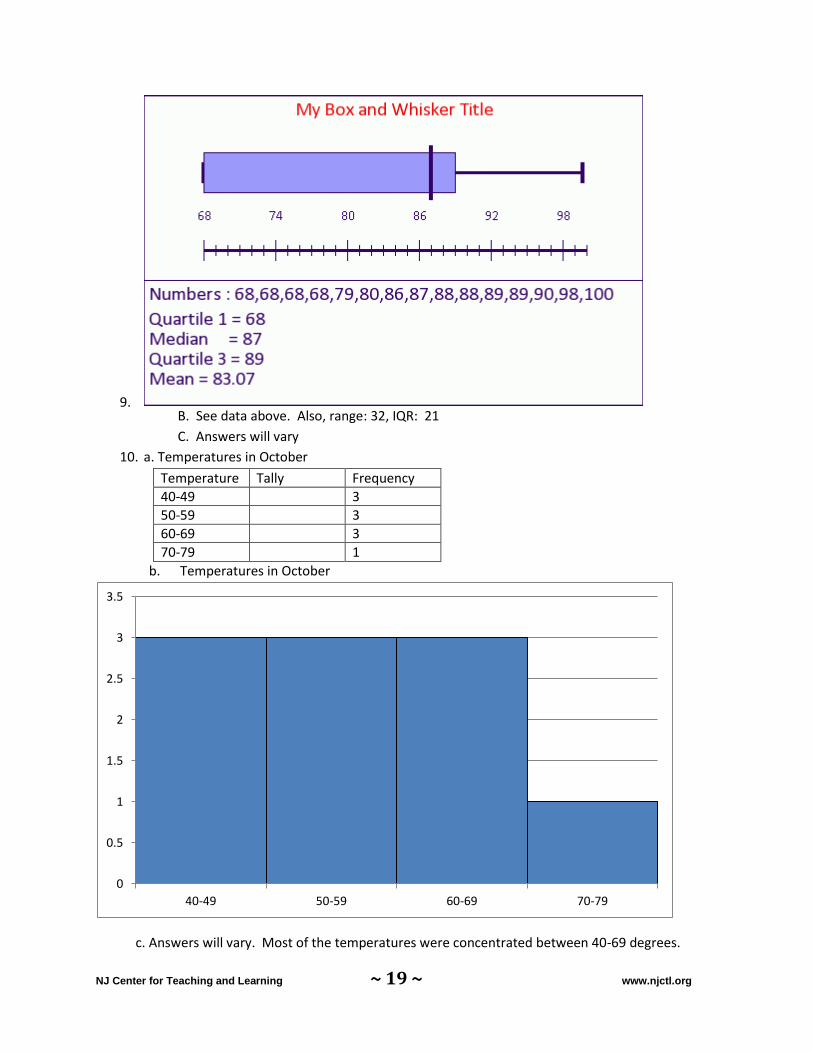
a. Create a Box and whisker plot
b. Explain the five values identified on the Box and Whisker Plot.
c. Use the given data to create one other type of graph learned in this
unit.
NJ Center for Teaching and Learning ~ 12 ~ www.njctl.org
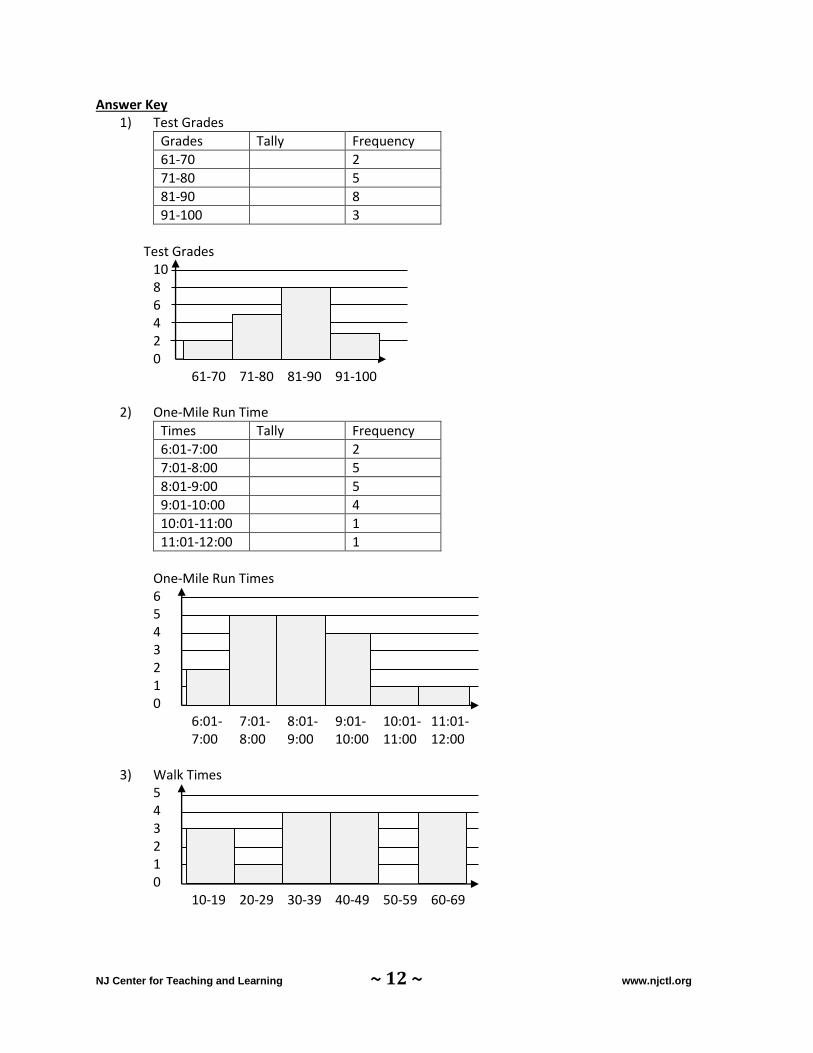
Answer Key 1) Test Grades
Grades Tally Frequency
61-70 2
71-80 5
81-90 8
91-100 3
Test Grades
10 8 6 4 2 0 61-70 71-80 81-90 91-100
2) One-Mile Run Time
Times Tally Frequency
6:01-7:00 2
7:01-8:00 5
8:01-9:00 5
9:01-10:00 4
10:01-11:00 1
11:01-12:00 1
One-Mile Run Times 6 5 4 3 2 1 0 6:01- 7:01- 8:01- 9:01- 10:01- 11:01- 7:00 8:00 9:00 10:00 11:00 12:00
3) Walk Times
5 4 3 2 1 0 10-19 20-29 30-39 40-49 50-59 60-69
NJ Center for Teaching and Learning ~ 13 ~ www.njctl.org
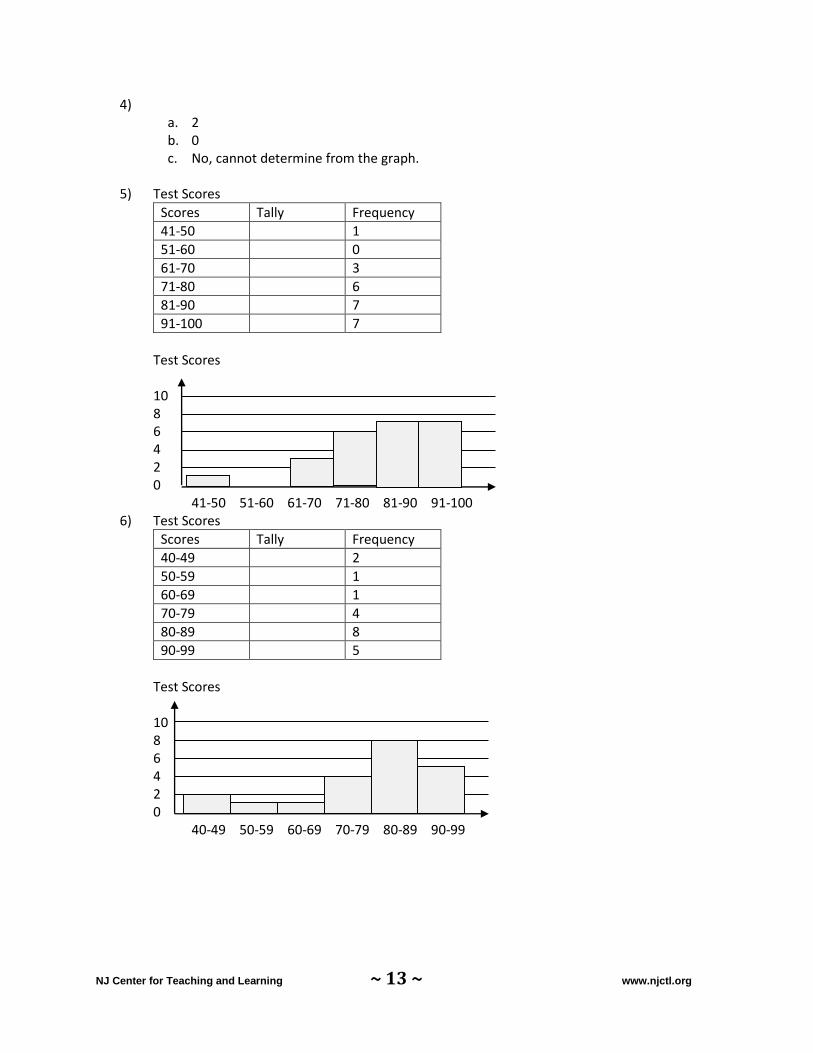
4) a. 2 b. 0 c. No, cannot determine from the graph.
5) Test Scores
Scores Tally Frequency
41-50 1
51-60 0
61-70 3
71-80 6
81-90 7
91-100 7
Test Scores 10 8 6 4 2 0 41-50 51-60 61-70 71-80 81-90 91-100
6) Test Scores
Scores Tally Frequency
40-49 2
50-59 1
60-69 1
70-79 4
80-89 8
90-99 5
Test Scores 10 8 6 4 2 0 40-49 50-59 60-69 70-79 80-89 90-99
NJ Center for Teaching and Learning ~ 14 ~ www.njctl.org
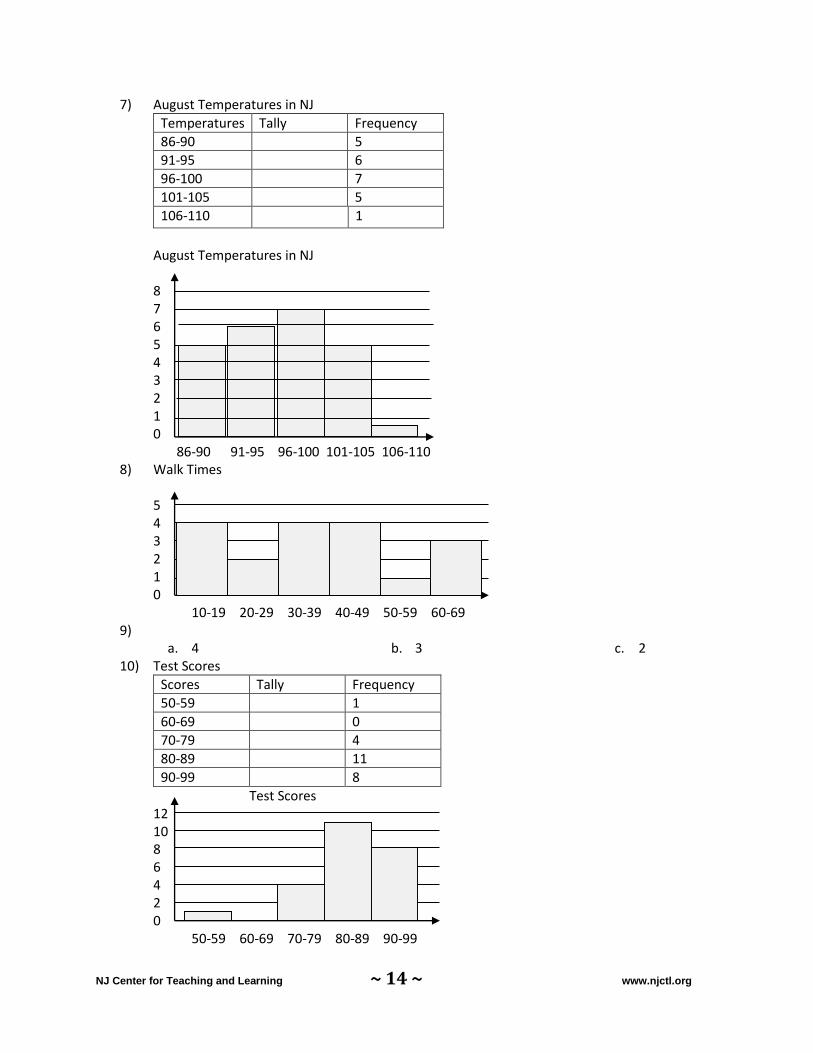
7) August Temperatures in NJ
Temperatures Tally Frequency
86-90 5
91-95 6
96-100 7
101-105 5
106-110 1
August Temperatures in NJ 8 7 6 5 4 3 2 1 0 86-90 91-95 96-100 101-105 106-110
8) Walk Times 5 4 3 2 1 0 10-19 20-29 30-39 40-49 50-59 60-69
9) a. 4 b. 3 c. 2
10) Test Scores
Scores Tally Frequency
50-59 1
60-69 0
70-79 4
80-89 11
90-99 8
Test Scores 12 10 8 6 4 2 0 50-59 60-69 70-79 80-89 90-99
NJ Center for Teaching and Learning ~ 15 ~ www.njctl.org
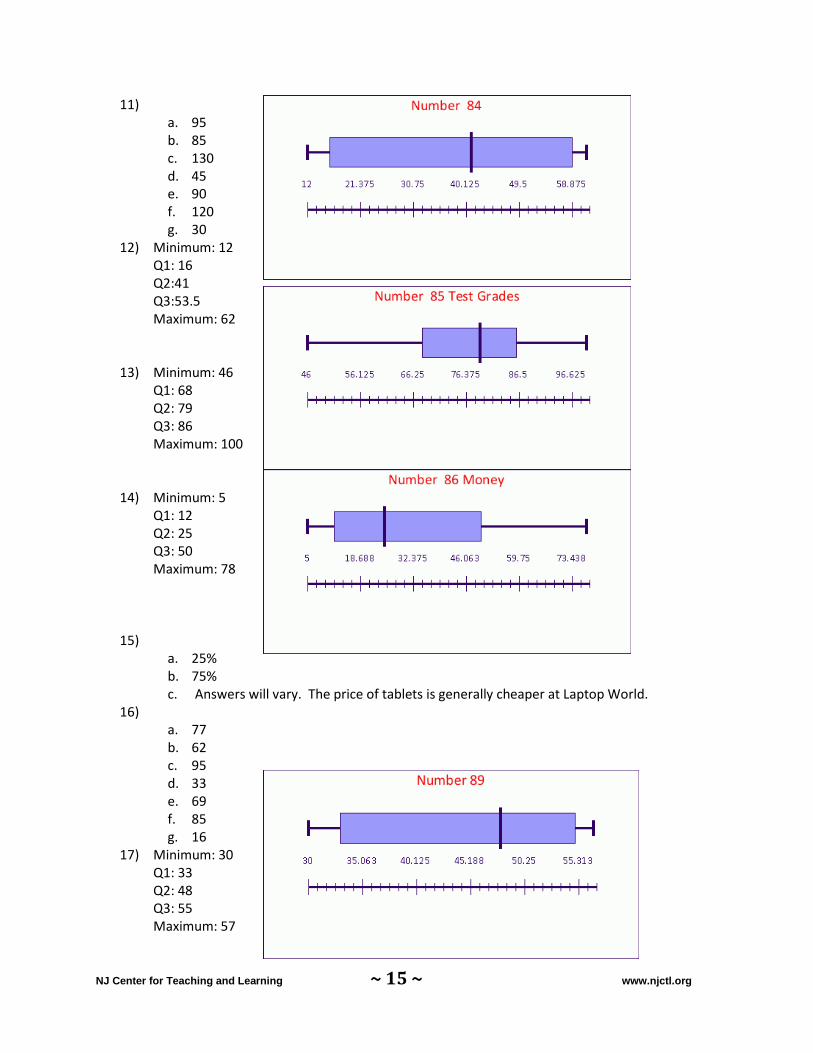
11) a. 95 b. 85 c. 130 d. 45 e. 90 f. 120 g. 30
12) Minimum: 12 Q1: 16 Q2:41 Q3:53.5 Maximum: 62
13) Minimum: 46 Q1: 68 Q2: 79 Q3: 86 Maximum: 100
14) Minimum: 5 Q1: 12 Q2: 25 Q3: 50 Maximum: 78
15) a. 25% b. 75% c. Answers will vary. The price of tablets is generally cheaper at Laptop World.
16) a. 77 b. 62 c. 95 d. 33 e. 69 f. 85 g. 16
17) Minimum: 30 Q1: 33 Q2: 48 Q3: 55 Maximum: 57
NJ Center for Teaching and Learning ~ 16 ~ www.njctl.org
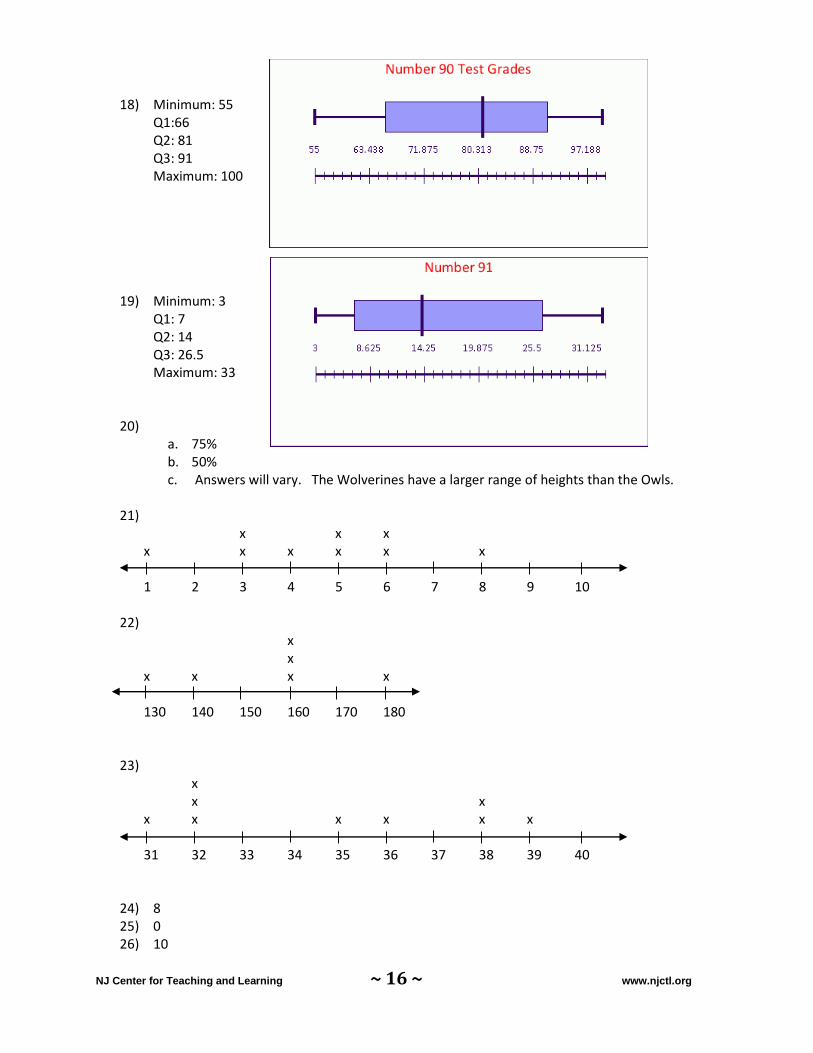
18) Minimum: 55 Q1:66 Q2: 81 Q3: 91 Maximum: 100
19) Minimum: 3 Q1: 7 Q2: 14 Q3: 26.5 Maximum: 33
20) a. 75% b. 50% c. Answers will vary. The Wolverines have a larger range of heights than the Owls.
21) x x x
x x x x x x 1 2 3 4 5 6 7 8 9 10
22)
x x x x x x 130 140 150 160 170 180
23) x x x x x x x x x 31 32 33 34 35 36 37 38 39 40
24) 8 25) 0 26) 10
NJ Center for Teaching and Learning ~ 17 ~ www.njctl.org
27) 10 28) 5.5 29) 8.5 30) 3 31) 75% 32) 8
33) x x x x x x x
25 30 35 40 45 50 55 60
34) x x x x x x x x x x x 1 2 3 4 5 6 7 8 9 10
35) x x x x x x x x 80 82 84 86 88 90 92 94 96 98
36) 91 37) 88 38) 98 39) 89 40) 95 41) 6 42) 33% 43) 89% 44) 92.2% 45) B, C 46) Yes, Median 47) Answers will vary. The data ranges from 30-99. The lower grades bring down the mean. If the
30 grade was removed from the data set, the mean would be closer to the median. 48) Mean 49) Mean 50) Answers will vary. The upper half of the data has a higher range of data values than the lower
half. 51) A, B, C 52) Yes, Median 53) Answers will vary. Remove the low 40-49 grades from the data set.
NJ Center for Teaching and Learning ~ 18 ~ www.njctl.org
54) 95 55) 45 56) Mean 57) Mean 58) There were less sold. The data values were closer in value and did not vary as much as the
upper half of the data. Unit Review
1. C 2. B
3. D 4. C
5. D 6. C
7.
8. X X X X X X X X X X X X X X X X 20 21 22 23 24 25 26 27 28 29
5
2
0
4
0
1
2
3
4
5
6
50 - 59 60-69 70-79 80-89
GRADES
GRADES
NJ Center for Teaching and Learning ~ 19 ~ www.njctl.org
9. B. See data above. Also, range: 32, IQR: 21
C. Answers will vary
10. a. Temperatures in October
Temperature Tally Frequency
40-49 3
50-59 3
60-69 3
70-79 1
b. Temperatures in October
c. Answers will vary. Most of the temperatures were concentrated between 40-69 degrees.
0
0.5
1
1.5
2
2.5
3
3.5
40-49 50-59 60-69 70-79


![Data Displays [6th grade] - Trinity University](https://img.pdfslide.net/doc/110x75/6158447bed9af03ef17afc50/data-displays-6th-grade-trinity-university.jpg)