Embed Size (px)
Citation preview

6th Year Economics
Higher Level Rónán Murdock
Supply, Demand & Elasticity
No part of this publication may be copied, reproduced or transmitted in any form or by any means, electronic, mechanical, photocopying, recording, or otherwise, without prior written permission from The Dublin School of Grinds. Ref: 6/Eco/h/rm/supply, demand & elasticity

Looking to maximise your CAO points?Easter is a crucial time for students to vastly improve on the points that they received in their mock exams. To help students take advantage of this valuable time, The Dublin School of Grinds is running intensive, exam-focused Easter Revision Courses. Each course runs for five days (90 minutes per day). All courses take place in Stillorgan, Co. Dublin.
The focus of these courses is to maximise students’ CAO points.
SPECIAL OFFERBUY 2 COURSES GET A 3RD COURSE FREE
To avail of this offer, early booking is required as courses were fully booked last year.
What do students get at these courses?
9 90 minutes of intensive tuition per day for five days, with Ireland’s leading teachers.
9 Comprehensive study notes.
9 A focus on simple shortcuts to raise students’ grades and exploit the critically important marking scheme.
9 Access to a free supervised study room.
EASTERREVISION COURSES
NOTE: These courses are built on the fact that there are certain predicable trends that reappear over and over again in the State Examinations.
FREE DAILY BUS SERVICE For full information on our Easter bus service, see 3 pages ahead.
To book, call us on 01 442 4442 or book online at www.dublinschoolofgrinds.ie
Access to food and beverage facilities is also available to students.
25% SIBLING DISCOUNT AVAILABLE. Please call 01 442 4442 to avail of this discount.
EASTER REVISION COURSE FEES:6TH YEAR & 5TH YEAR COURSES
PRICE TOTAL SAVINGS
1st Course €295 €295 -
2nd Course €180 €475 €115
3rd Course FREE €475 €410
4th Course €70 €545 €635
5th Course €100 €645 €830
6th Course €100 €745 €1,025
7th Course €100 €845 €1,220
8th Course €50 €895 €1,465
9th Course €50 €945 €1,710
3RD YEAR COURSES
PRICE TOTAL SAVINGS
1st Course €195 €195 -
2nd Course €100 €295 €95
3rd Course FREE €295 €290
4th Course €85 €380 €400
5th Course €50 €430 €545
6th Course €50 €480 €690
7th Course €50 €530 €835
8th Course €50 €580 €980
DSOG Easter 2017 8pg A4 FINAL PRINT.indd 2 20/02/2017 13:25

Timetable An extensive range of course options are available over a two-week period to cater for students’ timetable needs. Courses are held over the following weeks:
» Monday 10th – Friday 14th April 2017
» Monday 17th – Friday 21st April 2017
All Easter Revision Courses take place in The Talbot Hotel, Stillorgan (formerly known as The Stillorgan Park Hotel).
BUY 2 COURSES &GET A 3RD COURSE
F R E E !
6th Year Easter Revision CoursesSUBJECT LEVEL DATES TIME
Accounting H Monday 10th - Friday 14th April 12:00pm - 1:30pm
Agricultural Science H Monday 10th - Friday 14th April 10:00am - 11:30am
Applied Maths H Monday 10th - Friday 14th April 8:00am - 9:30am
Art History H Monday 10th - Friday 14th April 2:00pm - 3:30pm
Biology Course A* H Monday 10th - Friday 14th April 8:00am - 9:30am
Biology Course A* H Monday 17th - Friday 21st April 10:00am - 11:30am
Biology Course B* H Monday 10th - Friday 14th April 10:00am - 11:30am
Biology Course B* H Monday 17th - Friday 21st April 8:00am - 9:30am
Business H Monday 10th - Friday 14th April 12:00pm - 1:30pm
Business H Monday 17th - Friday 21st April 8:00am - 9:30am
Chemistry Course A* H Monday 17th - Friday 21st April 8:00am - 9:30am
Chemistry Course B* H Monday 17th - Friday 21st April 10:00am - 11:30am
Classical Studies H Monday 10th - Friday 14th April 2:00pm - 3:30pm
Economics H Monday 10th - Friday 14th April 8:00am - 9:30am
Economics H Monday 17th - Friday 21st April 10:00am - 11:30am
English Paper 1* H Monday 17th - Friday 21st April 8:00am - 9:30am
English Paper 2* H Monday 10th - Friday 14th April 8:00am - 9:30am
English Paper 2* H Monday 17th - Friday 21st April 10:00am - 11:30am
French H Monday 10th - Friday 14th April 10:00am - 11:30am
French H Monday 17th - Friday 21st April 8:00am - 9:30am
Geography H Monday 10th - Friday 14th April 8:00am - 9:30am
Geography H Monday 10th - Friday 14th April 2:00pm - 3:30pm
German H Monday 17th - Friday 21st April 12:00pm - 1:30pm
History (Europe)* H Monday 17th - Friday 21st April 2:00pm - 3:30pm
History (Ireland)* H Monday 17th - Friday 21st April 12:00pm - 1:30pm
Home Economics H Monday 10th - Friday 14th April 12:00pm - 1:30pm
Irish H Monday 10th - Friday 14th April 10:00am - 11:30am
Irish H Monday 17th - Friday 21st April 12:00pm - 1:30pm
Maths Paper 1* H Monday 10th - Friday 14th April 8:00am - 9:30am
Maths Paper 1* H Monday 10th - Friday 14th April 12:00pm - 1:30pm
Maths Paper 1* H Monday 17th - Friday 21st April 8:00am - 9:30am
Maths Paper 2* H Monday 10th - Friday 14th April 10:00am - 11:30am
Maths Paper 2* H Monday 17th - Friday 21st April 10:00am - 11:30am
Maths Paper 2* H Monday 17th - Friday 21st April 12:00pm - 1:30pm
Maths O Monday 10th - Friday 14th April 10:00am - 11:30am
Maths O Monday 17th - Friday 21st April 12:00pm - 1:30pm
Physics H Monday 17th - Friday 21st April 10:00am - 11:30am
Spanish H Monday 10th - Friday 14th April 12:00pm - 1:30pm
Spanish H Monday 17th - Friday 21st April 10:00am - 11:30am
Note: 5th Year students are welcome to attend any of the 6th Year courses above.
* Due to large course content, these subjects have been divided into two courses. For a full list of topics covered in these courses, please see 3 pages ahead.
5th Year Easter Revision CoursesSUBJECT LEVEL DATES TIME
English H Monday 10th - Friday 14th April 12:00pm - 1:30pm
Maths H Monday 10th - Friday 14th April 10:00am - 11:30am
Note: 4th Year students are welcome to attend any of the 5th Year courses listed above.
3rd Year Easter Revision CoursesSUBJECT LEVEL DATES TIME
Business Studies
H Monday 17th - Friday 21st April 2:00pm - 3:30pm
English H Monday 10th - Friday 14th April 10:00am - 11:30am
English H Monday 17th - Friday 21st April 12:00pm - 1:30pm
French H Monday 17th - Friday 21st April 12:00pm - 1:30pm
Geography H Monday 17th - Friday 21st April 8:00am - 9:30am
German H Monday 17th - Friday 21st April 2:00pm - 3:30pm
History H Monday 10th - Friday 14th April 8:00am - 9:30am
Irish H Monday 10th - Friday 14th April 12:00pm - 1:30pm
Maths H Monday 10th - Friday 14th April 8:00am - 9:30am
Maths H Monday 17th - Friday 21st April 10:00am - 11:30am
Maths O Monday 10th - Friday 14th April 2:00pm - 3:30pm
Science H Monday 10th - Friday 14th April 12:00pm - 1:30pm
Science H Monday 17th - Friday 21st April 8:00am - 9:30am
Spanish H Monday 10th - Friday 14th April 2:00pm - 3:30pm
Note: 2nd Year students are welcome to attend any of the 3rd Year courses above.
6th Year Oral Preparation CoursesWith the Oral marking component worth up to 40%, it is of paramount importance that students are fully prepared for these examinations. These courses will show students how to lead the Examiner towards topics they are prepared for. This will equip students with the information they need to maximise their performance in the State Examinations.
FEES: €140
VENUE: The Talbot Hotel, Stillorgan (formerly The Stillorgan Park Hotel)
SUBJECT LEVEL DATES TIME
French H Sunday 12th March 9:00am - 1:00pm
German H Saturday 11th March 9:00am - 1:00pm
Irish H Sunday 19th March 9:00am - 1:00pm
Spanish H Saturday 11th March 2:00pm - 6:00pm
To book, call us on 01 442 4442 or book online at www.dublinschoolofgrinds.ie
DSOG Easter 2017 8pg A4 FINAL PRINT.indd 3 20/02/2017 13:25
© Dublin School of Grinds Page 1 Rónán Murdock
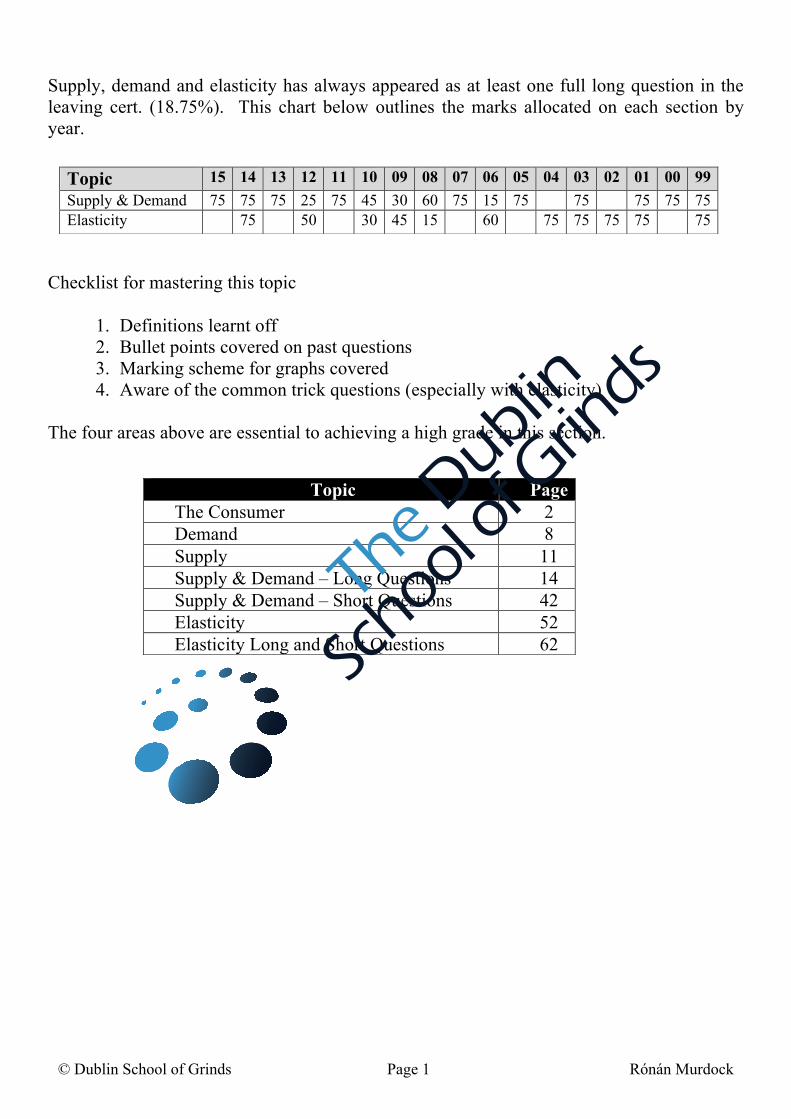
Supply, demand and elasticity has always appeared as at least one full long question in the leaving cert. (18.75%). This chart below outlines the marks allocated on each section by year.
Checklist for mastering this topic
1. Definitions learnt off2. Bullet points covered on past questions3. Marking scheme for graphs covered4. Aware of the common trick questions (especially with elasticity)
The four areas above are essential to achieving a high grade in this section.
Topic 15 14 13 12 11 10 09 08 07 06 05 04 03 02 01 00 99 Supply & Demand 75 75 75 25 75 45 30 60 75 15 75 75 75 75 75 Elasticity 75 50 30 45 15 60 75 75 75 75 75
Topic Page The Consumer 2 Demand 8 Supply 11 Supply & Demand – Long Questions 14 Supply & Demand – Short Questions 42 Elasticity 52 Elasticity Long and Short Questions 62

© Dublin School of Grinds Page 2 Rónán Murdock
The Consumer The individual who makes the decision to buy goods or services for their own personal use.
Assumptions about Consumer Behaviour
1. The consumer aims to gets maximum Satisfaction from that incomeA consumer will spend their limited income in such a way that they will achievethe most satisfaction from their money.He will obey the Equi-Marginal Principal of Consumer Behaviour.
2. The consumer has a Limited IncomeThe consumer’s income is not large enough to satisfy their needs and wants,therefore the consumer must choose between those goods he wishes to buy.
3. The consumer is subject to the law of Diminishing marginal utilityAs a consumer consumes additional units of a good their marginal utility for thisgood will eventually decline.
4. Economic goodsThe consumer will only spend his/her income on economic goods.
5. The consumer acts RationallyThe consumer acts in that manner consistent with his preferences. If the personsees an identical commodity priced differently in two adjoining shops they willbuy it at the lower price.
Economic Goods Is a product or service which commands a price, derives utility and is transferable. Characteristics of Economic Goods à PUT – PUT – PUT - PUT
1. It must command a PriceIts supply must be scarce in relation to the demand for it. If not people will not beprepared to pay a price to obtain it.
2. It must provide you with UtilityThe good must give you a feeling of satisfaction. Anything which is a nuisance doesnot and so is not an economic good.
3. It must be TransferableFor an item to be considered an economic good it must be capable of being transferredfrom one person to another
S
LI
D
E
R
SLIDER
© Dublin School of Grinds Page 3 Rónán Murdock
Examples of Goods which are not Economic Goods
1) Fresh AirThey are plentiful in supply/not scarce – commands no price
2) WeedsThey do not provide you with utility – you are not prepared to pay
3) Beauty/Good HealthThey are not capable of being sold.
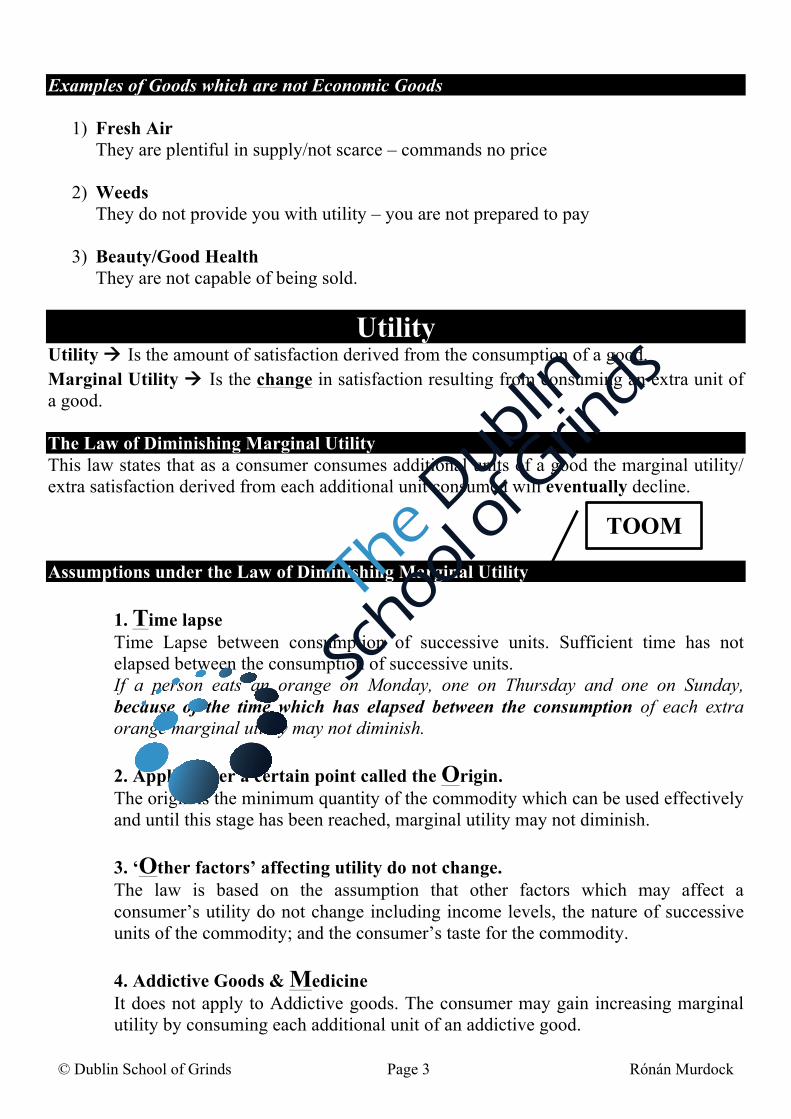
Utility Utility à Is the amount of satisfaction derived from the consumption of a good. Marginal Utility à Is the change in satisfaction resulting from consuming an extra unit of a good.
The Law of Diminishing Marginal Utility This law states that as a consumer consumes additional units of a good the marginal utility/ extra satisfaction derived from each additional unit consumed will eventually decline.
Assumptions under the Law of Diminishing Marginal Utility
1. Time lapseTime Lapse between consumption of successive units. Sufficient time has not elapsed between the consumption of successive units. If a person eats an orange on Monday, one on Thursday and one on Sunday, because of the time which has elapsed between the consumption of each extra orange marginal utility may not diminish.
2. Applies after a certain point called the Origin.The origin is the minimum quantity of the commodity which can be used effectivelyand until this stage has been reached, marginal utility may not diminish.
3. ‘Other factors’ affecting utility do not change.The law is based on the assumption that other factors which may affect aconsumer’s utility do not change including income levels, the nature of successiveunits of the commodity; and the consumer’s taste for the commodity.
4. Addictive Goods & MedicineIt does not apply to Addictive goods. The consumer may gain increasing marginalutility by consuming each additional unit of an addictive good.
TOOM

© Dublin School of Grinds Page 4 Rónán Murdock
Sample Leaving Cert Question
As consumers consume more units of a good their marginal utility will eventually fall. (i) Explain the underlined term.
_____________________________________________________________(ii) Suggest one good a person may consume which may not result in a fall in
their marginal utility. Explain your answer.
(iii) Complete the following table in your answerbook. State at what pointdiminishing marginal utility sets in and explain your choice.
2009 – Section A – Question 7 – 17 Marks (a) State the Law of Diminishing Marginal Utility. Definition @ 9 marksThis law states that as a consumer consumes additional units of a good the marginal utility/ extra satisfaction derived from each additional unit consumed will eventually decline.
(b) The table below illustrates the Law of Diminishing Marginal Utility.Number of units consumed 1 2 3 4 5 6
Total Utility in units 30 65 85 100 110 115 Marginal Utility in units 30
5 figures @ 1mark each= 5 marks
Complete the table and state the point after which diminishing utility set in. 3 marks Diminishing utility sets in after the consumption of the 2nd unit/when the 3rd unit is consumed.
Number of units consumed 1 2 3 4 5 6 Total utility in units 10 35 75 95 110 115
Marginal utility in units 10
© Dublin School of Grinds Page 5 Rónán Murdock
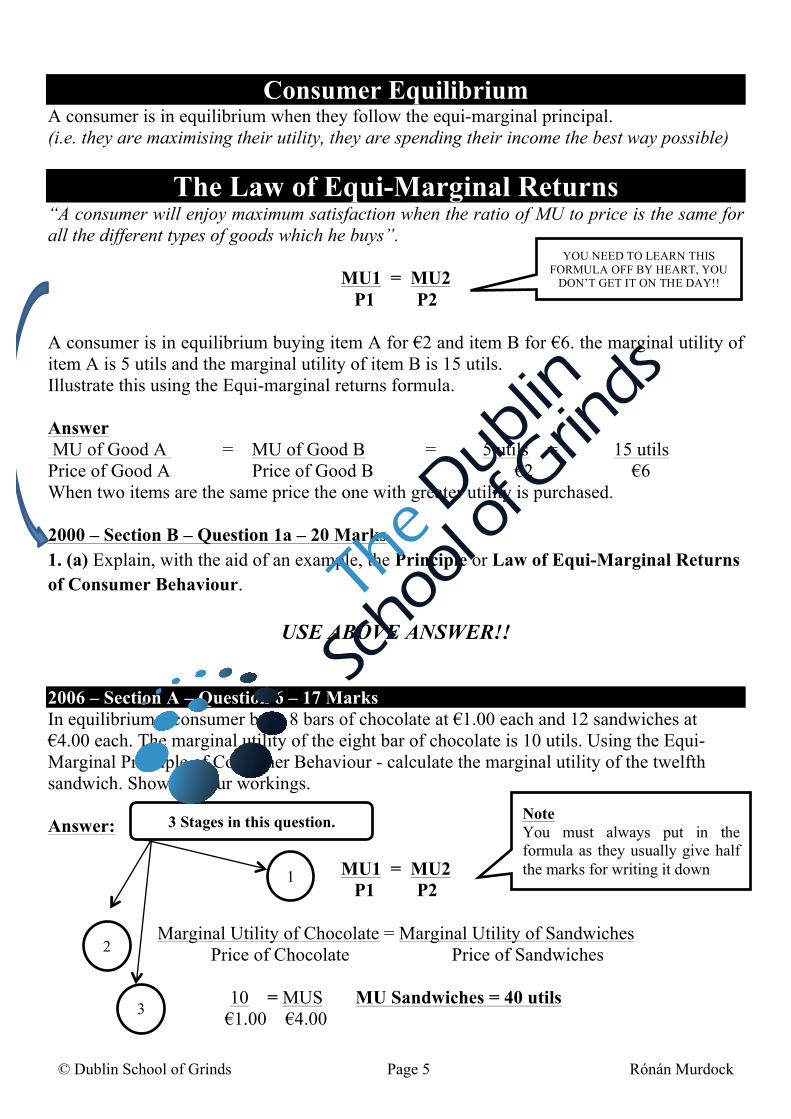
Consumer Equilibrium A consumer is in equilibrium when they follow the equi-marginal principal. (i.e. they are maximising their utility, they are spending their income the best way possible)
The Law of Equi-Marginal Returns “A consumer will enjoy maximum satisfaction when the ratio of MU to price is the same for all the different types of goods which he buys”.
MU1 = MU2 P1 P2
A consumer is in equilibrium buying item A for €2 and item B for €6. the marginal utility of item A is 5 utils and the marginal utility of item B is 15 utils. Illustrate this using the Equi-marginal returns formula.
Answer MU of Good A = MU of Good B = 5 utils = 15 utils Price of Good A Price of Good B €2 €6 When two items are the same price the one with greater utility is purchased.
2000 – Section B – Question 1a – 20 Marks 1. (a) Explain, with the aid of an example, the Principle or Law of Equi-Marginal Returnsof Consumer Behaviour.
USE ABOVE ANSWER!!
2006 – Section A – Question 6 – 17 Marks In equilibrium a consumer buys 8 bars of chocolate at €1.00 each and 12 sandwiches at €4.00 each. The marginal utility of the eight bar of chocolate is 10 utils. Using the Equi-Marginal Principle of Consumer Behaviour - calculate the marginal utility of the twelfth sandwich. Show all your workings.
Answer:
MU1 = MU2 P1 P2
Marginal Utility of Chocolate = Marginal Utility of Sandwiches Price of Chocolate Price of Sandwiches
10 = MUS MU Sandwiches = 40 utils €1.00 €4.00
YOU NEED TO LEARN THIS FORMULA OFF BY HEART, YOU
DON’T GET IT ON THE DAY!!
Note You must always put in the formula as they usually give half the marks for writing it down 1
2
3
3 Stages in this question.

© Dublin School of Grinds Page 6 Rónán Murdock
2005 – Section A – Question 6 – 17 Marks A consumer in equilibrium buys 10 cups of coffee at €2 each and 10 phone cards at €6 each. The marginal utility of the cups of coffee is 5 utils. What is the marginal utility of phone cards? Show your workings.
SAMPLE QUESTION A woman wins a shopping voucher worth €230. She can pick any quantity of goods A and B in her local furniture shop to the value of €230. The woman calculates her utility for each of the two goods to be as follows.
(i) Fill in the figures for marginal utility in the table provided.(ii) Prove that this woman should buy 5 units of good A and 4 units of good B in order
to maximise her total utility?
Try this question yourself Formula
Workings
Answer à Marginal utility of phone cards ___________
Quantity GOOD A à €30 GOOD B à €20 Total
Utility Marginal
Utility Total
Utility Marginal
Utility 1 210 210 100 100 2 345 180 3 465 240 4 555 280 5 615 300 6 660 310
1 2
3

© Dublin School of Grinds Page 7 Rónán Murdock
Sample Question The table shows the utility schedules for three goods from which a utility maximising consumer must chose. The consumer has a budget of €120. What quantities should this consumer chose in order to maximise revenue. A, B or C.
Tick the correct option below. A 2 of X, 3 of Y and 1 of Z
B 2 of X, 1 of Y and 2 of Z
C 4 of X, 4 of Y and 0 of Z
Formula
A
B
C
Quantity Good X à €10 Good Y à €20 Good Z à €40 1 50 60 200 2 30 40 120 3 20 30 60 4 10 10 40
MU1 = MU2 P1 P2
Remember you don’t get this formula on exam day. LEARN IT OFF!

© Dublin School of Grinds Page 8 Rónán Murdock
Demand
Demand curves which slope downwards from L to R are called Normal Demand Curves.
Exceptions to the Law of Demand
1) Giffen GoodsEssentials which constitute a large proportion of the expenditure of low-incomefamilies e.g. white bread, potatoes, rice. If the price of bread is increased then peoplewould probably continue to buy the quantity they require after the price increase.Example à White Bread
2) Snob items or Goods of OstentationWhen the price of these goods falls (Rolls Royce) they lose their exclusiveness asmore people can now afford them and so demand amongst the more wealthy for thesegoods decreases. Example à Rolex
3) Specualtitive GoodsGoods, the demand for which is influenced byexpectations – when the price of such goods increase,(stocks, houses) the quantity demanded may also increasebecause of the expectation of future price increases.Example à Houses , Shares
What is the shape of their demand curve?
The Demand Curve slopes downwards from L to R indicating that the higher the price the less the quantity that will be demanded and the lower the price the greater the quantity that will be demanded.
Paul earns a low wage. After all his bills he has €20 per day to feed his family. His family needs 4 kilos of food every per day to live. Paul can buy either meat or bread to feed his family. Meat is charged @ €8 per kilo and bread is charged at €4 per kilo. Ideally Paul would like to buy as much meat as he can afford as it is tastier and healthier. With food prices at this rate Paul can afford to buy 1 kilo of meat (€8) and 3 kilos of bread (€4 x 3 = €12). à €8 + €12 = €20. However, if the price of bread was to rise to €5 per kilo and the price of meat was to stay the same Paul would have to buy more bread as he can no longer afford to buy any meat. (€5 x 4kg = €20). So with Giffen Goods if prices rise it has a Neutral or Positive effect on demand.
The cheapest available good. When these goods go up in price consumers buy more of it. Why? Because they have no choice. There is no cheaper alternative.

© Dublin School of Grinds Page 9 Rónán Murdock
Shifts in and Movements along a Demand Curve Movement A change in price results in a movement along a demand curve.
Shift A change in any of the other Six conditions leads to a shift in the demand curve.
1) Future Expectations2) Unplanned Events3) Change in price of Substitute good4) Change in consumer Taste / preferences5) Income Levels6) Change in Price of Complimentary goods.
To remember the 6 factors that cause a shift think if the word FUST I C .
These factors can create more or less demand.
More Demand Less Demand
Demand Curve Shifts to Right Demand Curve Shifts to Left

© Dublin School of Grinds Page 10 Rónán Murdock
Sample Question – 30 Marks State and explain five factors that would cause a shift in a demand curve for concert tickets. In each case explain how the factor affects the demand curve.
FACTORS THAT CAUSE A SHIFT IN THE DEMAND CURVE?
FUST I C1. Expectations About the Future
If consumers expects the performance not to repeated they may increase their demand. If they expect ticket price to rise in the future they may buy the ticket now and demand will increase. Effect à Demand Curve shifts Right
2. Unplanned EventsFactors such as the weather may influence the current demand for tickets e.g. good weather may increase demand for an outdoor event. Effect à
3. Change in price of Substitute GoodIf the price of tickets for an alternative concert increased then demand for tickets for this concert may increase. Effect à
4. Taste / PreferenceIf the consumer’s preference for the artist/event becomes stronger then the demand for concert tickets will increase. Effect à
5. Income levelsIf income rises then the demand for concert tickets will increase, assuming concert tickets is a normal good. Effect à
6. Change in price of Complementary goodIf the price of hotel accommodation near the concert venue decreased then demand for the concert tickets may increase. Effect à
State à 2 Marks Explain à 2 Marks
Effect à 2 Marks 5 Points at 6 Marks

© Dublin School of Grinds Page 11 Rónán Murdock
Supply The supply of a good/service is the total quantity which is made available at any given price over a specific time period. The Supply Equation - Sx = f(Px, Pog, C, Tn)
Other Types of Supply Curves
1) Perfectly Inelastic Supply Curve
2) Minimum Price
3) Limited Capacity
The Supply Curve slopes upwards from L to R because the higher the price the greater the quantity supplied i.e. a positive relationship between P and Q.
There is a supply available and the quantity supplied will not fall even if there is a price reduction – not common – fish
No supply will be made available below a certain price.
At a certain point there will be no further increase in quantity supplied as the firm has now reached maximum productive capacity even though prices may continue to rise.

© Dublin School of Grinds Page 12 Rónán Murdock
Shifts in and Movements Along a Supply Curve A change in price leads to a movement along the Supply Curve. Changes in anything else leads to a shift in the Supply Curve
CUTESTThe following factors causes shifts in a supply curve
1. The Cost of producing the product.2. Unplanned factors.
3. The state of the firm’s production TEchnology
4. Number of Sellers in the industry.
5. Taxation / Subsidy.
These factors can create more or less Supply .
More Supply Less Supply
Supply Curve Shifts to Right Supply Curve Shifts to Left

© Dublin School of Grinds Page 13 Rónán Murdock
2007 – Section B – Question 1c – 25 Marks Outline FOUR factors, other than price, which affect the supply curve of an individual firm. In each case explain how the factor affects the supply curve.
CUTEST1. The Cost of producing the product.If there is an increase in costs of factors of production, which a firm uses in the production oftheir good, then it will be more costly to manufacture the good. They will not continue tosupply the same quantity of the good at the old prices – there will be a reduction in thequantity supplied.
2. Unplanned factors.There may be changes in the quantity supplied, which were never intended by the producer. Examples include agriculture – due to changes in the weather; diseases etc. In industry there may be shortages of raw materials, strikes etc.
3. The state of the firm’s production technology.As new machinery is invented, as labour becomes more specialised and efficient the factorsof production become more efficient. It becomes possible to increase their output eventhought the payments they receive remain the same.
4. Number of Sellers in the industry.If the number of firms in the industry decreased e.g. due to rationalisation then the overallquantity supplied to the market would decrease
5. Taxation / Subsidy.If the government were to reduce the rates of taxation on the raw materials used in themanufacture of a commodity, this represents a reduction in the cost of production and hencequantity supplied would increase.If a subsidy is granted on the raw materials or on the labour employed by the firm, this hasthe effect of reducing costs and thereby resulting in an increase in the quantity supplied.
C U TE S T

© Dublin School of Grinds Page 14 Rónán Murdock
Supply and Demand Combined Market Price for a commodity is determined by the
intersection of Supply and Demand Curves
Effects of Shifts on Equilibrium There are 4 possible outcomes you must figure out what happens first.
1. More Demand Demand Curve Shifts to Right
2. Less Demand Demand Curve Shifts to Left
3. More Supply Supply Curve Shifts to Right
4. Less Supply Supply Curve Shifts to Left
Whenever you are told to explain your answer think of D.E.R.E.
D Discuss
E Effect
R Reason
E Equilibrium

© Dublin School of Grinds Page 15 Rónán Murdock
WHAT HAPPENS WHEN THE PR ICE OF A GOOD FALLS? òòPrice Fallsòò Price Falls òò Price Falls òò Price Falls òò Price Falls òò
Two things happen
1. The substitution effect2. The income effect
The Substitution Effect
i. The good becomes cheaper compared to other goods.ii. The substitution effect will always push the consumer in one direction.
HE / SHE WILL BUY MORE OF THE GOOD.
Income Effect
i. When a good drops in price it means that the consumer’s purchasing powerincreases as a result of his/her real income increasing.
ii. However this doesn’t necessarily mean that the consumer will buy more of thegood.
On the next page we will see what happens when the income effect and substitution effect are combined.
Normal Good = More consump@on For a normal good the fact that real income has increased (as a result of the good being cheaper) will cause the consumer to buy more.
Inferior / Giffen Good = Less consump@on If the good is inferior or giffen, the increase in real income will cause the consumer to buy less of the good.
Remember nothing has happened to the consumers income / wages. That is still the same.

© Dublin School of Grinds Page 16 Rónán Murdock
Effects of a Price Reduction on the following goods
Substitution Effect
Income Effect Overall Effect
Good X Normal Good
Positive Demand rises as good is relatively cheaper (+10 units)
+
Positive Demand rises as real income rises (10 Units)
= Demand Rises by 20 units
Good Y Inferior Good
Positive Demand rises as good is relatively cheaper (+10 units)
+
Negative Demand falls as real income rises (- 6 Units)
=
Demand rises by 4 units because the positive substitution effect is greater than the negative Income effect
Good Z Giffen Good
Positive Demand rises as good is relatively cheaper (+6 Units)
+
Negative Demand falls as real income rises (- 8 Units)
=
Demand falls by 2 units because the negative Income effect is greater than the positive substitution effect
2013 Section B – Question 1c- 20 Marks A fall in the price of a consumer product has both a substitution effect and an income effect. (i) Explain the underlined terms.
Substitution effect Income effect When the price of a good rises customers may shift to cheaper substitutes to maximise utility.
When the price of a good falls it means that the consumer’s real income will rise.
(ii) If the price of an inferior product falls (all other things being equal) will more or less ofthe product be purchased? Explain your answer with reference to the substitution effect andthe income effect.Price of inferior product falls
Substitution effect Income effect
Effect on demand Demand will rise Demand will fall Explanation The consumer is getting more
marginal utility for this good now that it is cheaper.
Because the good is an inferior good, demand will fall as the consumer will
buy less as income has increased.
NB→ This point must be added to get full marks: If positive substitution effect is greater than the negative income effect then demand for the product will increase

© Dublin School of Grinds Page 17 Rónán Murdock
Past Leaving Cert Questions
2014 Section B – Question 1a- 25 Marks
(i) State and explain the law illustrated in the above table.
(ii) Outline two assumptions underlying this law.T O O M
2014 Section B – Question 1b - 30 Marks (i) State the ‘Law of Supply’, and illustrate with a labelled diagram.
(ii) Explain how technical progress affects the supply curve.
(iii) Outline, with the aid of labelled diagrams, two other factors that would cause ashift in the supply curve.
No of Units Consumed 1 2 3 4 5 Total Utility in Units 20 45 60 70 75
Marginal Utility in Units 10 25 15 10 5

© Dublin School of Grinds Page 18 Rónán Murdock
2014 Section B – Question 1c - 20 Marks Macklemore announces a concert in Ireland at a venue with a maximum capacity of 80,000 people. The tickets are priced at €65 and the concert sells out in hours. (i) Draw one labelled diagram, showing a market demand curve and a market supplycurve that would be consistent with the above information. Explain your answer.
(ii) Explain, using the concept of Consumer Surplus, why it might make sense for theconcert promoters to have different ticket prices (e.g. VIP section, seating section andstanding section) for this concert.

© Dublin School of Grinds Page 19 Rónán Murdock
2013 Section B – Question 1a- 25 Marks (i) Distinguish between the terms ‘effective demand’ and ‘derived demand’.(ii) Outline two possible exceptions to the Law of Demand.
(i) Effective demand: Effective demand is demand supported by the necessary purchasingpower.(ii) Derived demand: Where a factor or production is demanded not for its own use but forits contribution to the production process.
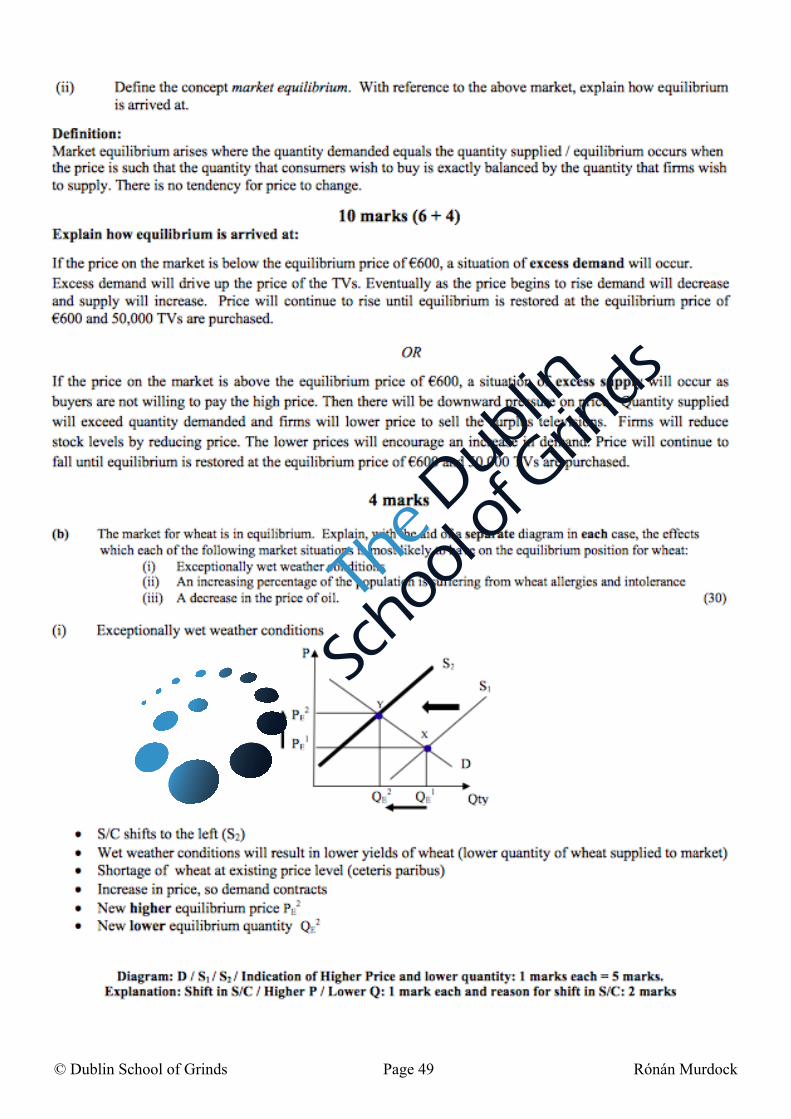
2013 Section B – Question 1b – 30 Marks The market for a brand of blue jeans is in equilibrium. Explain, with the aid of a separate diagram in each case, the effects which each of the following is most likely to have on the equilibrium position:
D.E.R.E. – D.E.R.E. – D.E.R.E. – D.E.R.E.Discuss
1. Effect2. Reason3. Equilibrium (New Price and New Quantity)
( i )
Due to the economic downturn there is a reduction in the real income of consumers. Effect
Reason
Equilibrium
A fall in the price of cotton, a key input in the production of the blue jeans. Effect
Reason
Equilibrium
The blue jeans have recently been endorsed by a popular sports star. Effect
Reason
Equilibrium
Whenever you are ask to graph a change to the Supply and
Demand curve think of D.E.R.E.
DERE

© Dublin School of Grinds Page 20 Rónán Murdock
Solution to the question on previous page.
(i) Due to the economic downturn there is a reduction in the real income of consumers.
Effect Demand curve shifts to the left. Reason Consumer income has fallen and they can’t afford the product. Equilibrium There is a new lower price and new lower quantity.
(ii) A fall in the price of cotton, a key input in the production of the blue jeans.Effect Supply curve shifts to the right. Reason The costs of production have fallen. Equilibrium There is a new lower price and new higher quantity.
(iii) The blue jeans have recently been endorsed by a popular sports star.Effect Demand curve shifts to the right. Reason Consumers’ preference for these jeans has increased. Equilibrium There is a new higher price and new higher quantity
Random question. How could the government reduce the consumption of soft drinks?
1. ____________________________
2. ____________________________
3. ____________________________
DERE
The Paradox of Value Adam Smith identified the problem that certain goods have a high value in use and a low value in exchange e.g. water, while others have a low value in use and a high value in exchange e.g. diamonds Therefore, it is the MU of a good and not its total utility which determines the price to be paid.

© Dublin School of Grinds Page 21 Rónán Murdock
2011 Section B – Question 1a – 20 Marks (i) Define the economic terms: individual (consumer) demand; market demand.(ii) Explain, with the aid of labelled diagrams, the relationship between individual(consumer) demand and market demand.
Individual Demand: The quantity of a good an individual consumer demands at different prices. Market Demand: The total quantity of a good that all consumers demand at different prices.
Consumer A Consumer B Market
2011 Section B – Question 1b – 30 Marks (i) Distinguish between the economic meanings of a ‘movement along a demand curve’ anda ‘shift in a demand curve’ for concert tickets. Illustrate your answer using diagrams. (16m)
Movement along a Demand Curve This is a movement which is caused by a change in the selling price of the good itself, with all other factors being equal.
Shift in a Demand Curve If any of the factors other than the price of the good itself change this will result in a shift in the demand curve.
Movement along a Demand Curve Shift in a Demand Curve

© Dublin School of Grinds Page 22 Rónán Murdock
2011 Section B – Question 1b – 30 Marks (ii) State and explain two factors that would cause a shift in a demand curve for concerttickets. In each case explain how the factor affects the demand curve.(14m) 2 Points @ 7 Marks
FACTORS THAT CAUSE A SHIFT IN THE DEMAND CURVE?
FUST I C1) Expectations About the Future
a. If consumers expects the performance not to repeated they may increase theirdemand. If they expect ticket price to rise in the future they may buy the ticketnow and demand will increase.
b. Effect à
2) Unplanned Eventsa. Factors such as the weather may influence the current demand for tickets e.g.
good weather may increase demand for an outdoor event.b. Effect à
3) Change in price of Substitute Gooda. If the price of tickets for an alternative concert increased then demand for
tickets for this concert may increase.b. Effect à
4) Taste / Preferencea. If the consumer’s preference for the artist/event becomes stronger then the
demand for concert tickets will increase.b. Effect à
5) Income levelsa. If income rises then the demand for concert tickets will increase, assuming
concert tickets is a normal good.b. Effect à
6) Change in price of Complementary gooda. If the price of hotel accommodation near the concert venue decreased then
demand for the concert tickets may increase.b. Effect à

© Dublin School of Grinds Page 23 Rónán Murdock
2012 – Section B – Question 1a – 25 Marks (i) Explain the Equi-Marginal Principle of consumer behaviour.
(ii) State and explain three other economic assumptions used to analyse consumerbehaviour.
2011 Section B – Question 1c (i) – 25 Marks (12 Marks) The Law of Diminishing Marginal Utility states that as more of a product is consumed, eventually each additional unit of the good provides less additional utility (marginal utility). (i) Explain two assumptions underlying the Law of Diminishing Marginal Utility. (2P X 6M)
(i) Assumptions underlying the Law of Diminishing Marginal Utility.
1. Applies after a certain point called the origin.2. Addictive Goods3. Time lapse4. ‘Other factors’ affecting utility do not change.
2011 Section B – Question 1c (ii) – 25 Marks (13 Marks) A consumer in equilibrium buys 6 health bars at €0.80 each and 9 cartons of juice at €1.50 each. The marginal utility of the 6th health bar is 40 utils. (ii) Using the Equi-Marginal Principle of Consumer Behaviour calculate the marginalutility of the ninth carton of juice. (Show all your workings.)
MU1 = MU2 P1 P2
Marginal Utility of Health Bars = Marginal Utility of Juice . Price of Health Bars Price of Juice .
40 = X 80 150
X = 75 Utils

© Dublin School of Grinds Page 24 Rónán Murdock
2010 Section B – Question 2a – 25 Marks (Sample Paper) (i) Outline the Law of Demand.(ii) State and explain three exceptions to the Law of Demand.
i. ii.
1) 2) 3)
2008 Section B – Question 3a – 20 Marks (Sample Paper) (7m, 7m, 6m) For something to be considered an economic good, it must possess certain characteristics. State and explain THREE of these characteristics. (20 marks)
P U T
2008 Section B – Question 3b – 25 Marks (Sample Paper) State and explain FIVE factors which affect a consumer’s demand schedule.
This can be caused by a movement or shift Movement à Price
Shift à FUSTIC
1.
2.
3.
4.
5.

© Dublin School of Grinds Page 25 Rónán Murdock
2008 Section B – Question 3c – 30 Marks (Sample Paper) (i) Show by means of a labelled diagram, the market demand and supply for a product.Indicate equilibrium price and quantity;(ii) Using a separate diagram in each case, show the effects of the following onequilibrium price and quantity:• A successful advertising campaign in favour of the product;• A tariff on imports of the product is increased
Advertising Campaign Tariff on Imports
Effect Effect
Reason Reason
Equilibrium Equilibrium

© Dublin School of Grinds Page 26 Rónán Murdock
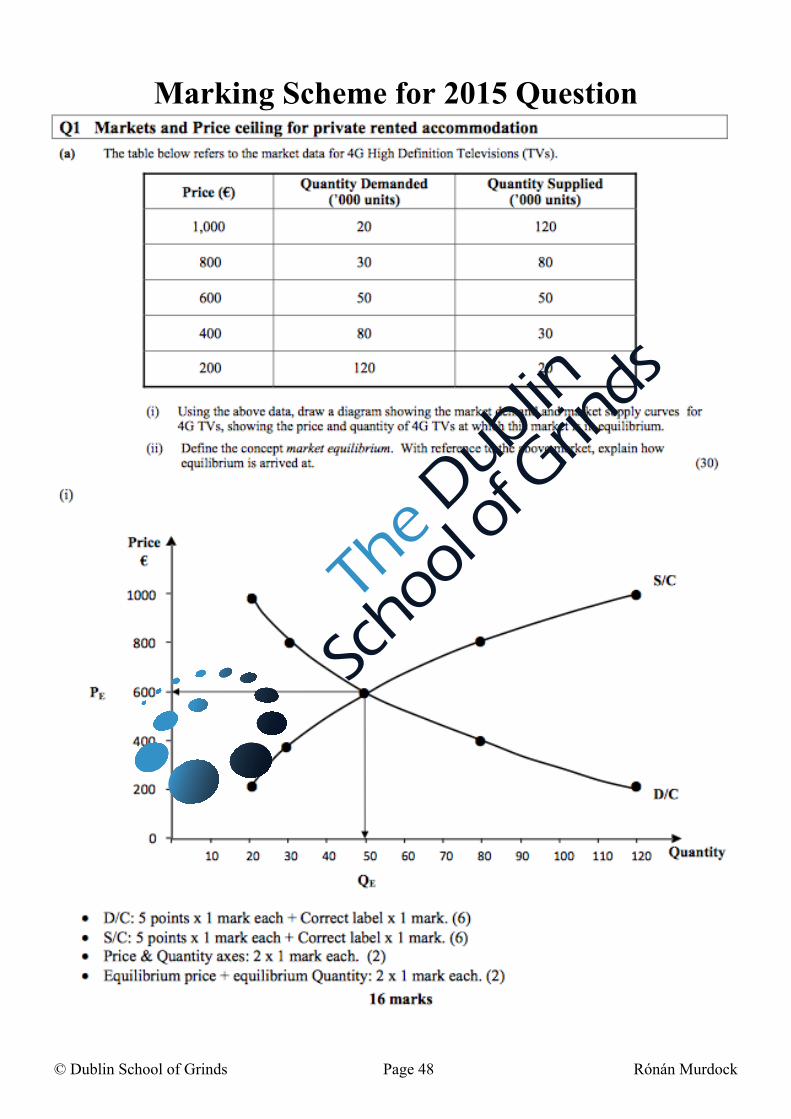
2010 Section B – Question 1a – 30 Marks The data below represents the market demand and the market supply schedules for the soft drink ‘Quencher’.
(i) Using the above data, draw the diagram showing the market demand and market supplycurves for the soft drink ‘Quencher’. Clearly mark the point of equilibrium and theequilibrium price and quantity.
(ii) Explain what it means for the market ‘to be in equilibrium’.
(iii) Assume costs of production fell, resulting in an extra 20,000 units supplied at each ofthe above listed prices. With reference to your diagram in 1(a) (i) above and assuming thatdemand remains unchanged, draw the new supply curve. Clearly indicate the new point ofequilibrium and the new equilibrium price and quantity.
(ii)AnswerTo be in Equilibrium, is where quantity demanded meets quantity supplied and there is notendency for prices to change.
Price €
Quantity Demanded (‘000 units)
Quantity Supplied (‘000 units)
New Quantity Supplied
2.00 40 5 2.25 30 10 2.50 20 20 2.75 10 30 3.00 5 40

© Dublin School of Grinds Page 27 Rónán Murdock
Answer to question on previous page.
(iii) Notes on the graph below• The points on the curves are clearly laid out, make sure you do this.• Make sure to leave the same space between each point on the X and Y axis.
2010 Section B – Question 1c – 15 Marks Many health advisors wish to reduce the consumption of soft drinks. Advise the Minister for Health and Children on possible economic actions that the Government could take to reduce the consumption of soft drinks.
1. TaxationIncrease taxes on soft drinks. (V.A.T.)
2. Education and Awareness campaignThe government could increase spending on advertising campaigns to raise awarenessof the problems which may result from the consumption of soft drinks.
3. LegislationIt could ban the sale of soft drinks in schools and colleges / ban their sale in vendingmachines.
4. SubsidisationBy doing this the prices of substitute goods may be more attractive and this may leadto a drop in the demand for soft drinks e.g. the subsidisation of milk in schools.

© Dublin School of Grinds Page 28 Rónán Murdock
2009 Section B – Question 1a – 30 Marks (i) Show, by means of a labelled diagram, the market demand and supply curves for gamesconsoles e.g. Xbox, PlayStation, Nintendo DS. Identify and explain the market equilibriumposition.
(ii) Explain, with the aid of a separate diagram in each case, the effects which each of thefollowing is most likely to have on the above equilibrium position:
a. 50% reduction in the price of computer games used with the games console
b. Quota placed on the quantity of games consoles entering Ireland
c. Government introduce a 2% levy (tax) on all income earned
50% reduction in the price of computer games used with the games console Effect
Reason
Equilibrium
Quota placed on the quantity of games consoles entering Ireland Effect
Reason
Equilibrium
Government introduce a 2% levy (tax) on all income earned Effect
Reason
Equilibrium

© Dublin School of Grinds Page 29 Rónán Murdock
Solution to the Question on the previous page
Discuss Discuss Discuss Effect Demand Curve Shifts to the right
Effect Supply curve shifts to the left
Effect Demand Curve shifts to the left
Reason Because the complimentary good is now cheaper.
Reason The quota has reduced the supply of the product.
Reason As a result of the levy consumers have less disposable income
Equilibrium Higher Price Higher Quantity
Equilibrium Higher Price Lower Quantity
Equilibrium Lower Price Lower Quantity
2008 – Section B – Question 1 – 20 Marks 1. (a) (i) Explain, with the aid of an example, the ‘Law of Demand’. (5m)
The Law of Demand states that an increase in price leads to a decrease in quantity demanded, or a decrease in price leads to an increase in quantity demanded. For Example, If price of a bar chocolate increased by 5c per bar then quantity demanded or purchased would fall. (ii) State and explain three exceptions to the ‘Law of Demand’. (15m)
1. Giffen Goods
2. Snob items
3. Speculative goods
4. Goods of Addiction

© Dublin School of Grinds Page 30 Rónán Murdock
2008 – Section B – Question 1b – 16 Marks The data below represents the market demand and supply schedules for MP3 Players.
Price €
Quantity Demanded (‘000 units)
Quantity Supplied (‘000 units)
New Quantity Demanded (‘000 units)
20 100 20 30 80 40 40 60 60 50 40 80 60 20 100
(i) Using the above data, draw the diagram showing the market demand and supply curvesfor MP3 Players. (14m)(ii) Show on your diagram the price and quantity of MP3 Players at which this market is inequilibrium. (2m)
2008 – Section B – Question 1 – 25 Marks (i) With reference to your diagram in 1(b) (i), assume that consumer demand for MP3Players increases by 40 units at each price listed above, while supply remains unchanged,draw the new demand curve for this situation and show the new equilibrium price andquantity.
(ii) Explain two possible reasons for the shift in the demand curve.1.
2.
3.

© Dublin School of Grinds Page 31 Rónán Murdock
Solution to the question on previous page.
In this diagram it is important that you have a • Correctly labelled demand curve• Correctly labelled supply curve• Correctly labelling Price and Quantity axes• Correctly labelling demand and supply curves
2005 Section B – Question 1a – 25Marks State and explain FIVE factors which affect a consumer’s demand schedule. (can also be phrased as cause a shift in the demand curve for a particular good)
FUST I C1) Future Expectations
2) Unplanned Events
3) Change in price of Substitute good
4) Change in consumer Taste / preferences
5) Income Levels
6) Change in Price of Complimentary goods
(ii) It is important that you showthe following on the graph
A) Equilibrium price €40B) Equilibrium quantity 60
units

© Dublin School of Grinds Page 32 Rónán Murdock
2007 – Section B – Question 1a – 20 Marks (i) Define the economic terms: individual (firm) supply; market supply.(ii) Explain, with the aid of labelled diagrams, the relationship between individual (firm)supply and market supply.
Individual Supply: The quantity of a good an individual firm is willing to supply at different prices.
Market supply: The total quantity of a good that all firms are willing to supply at different prices.
Firm A Supply
Firm B Supply
Market Supply
Explanation of Relationship between Firm and Market Supply

© Dublin School of Grinds Page 33 Rónán Murdock
2007 – Section B – Question 1b – 30 Marks Explain, with the aid of a labelled diagram, the supply curve of an individual firm in each of the following circumstances.
State one example in each case.
(i) A firm is willing to increase supply as price rises, but there is a minimum price belowwhich the firm will not supply at all.(ii) A firm can supply only up to a maximum production capacity.(iii) The product is fixed in supply (e.g. perishable good) and a firm is operating in the shortrun.

© Dublin School of Grinds Page 34 Rónán Murdock
2007 – Section B – Question 1c – 25 Marks Outline FOUR factors, other than price, which affect the supply curve of an individual firm. In each case explain how the factor affects the supply curve.
CUTEST1. The Cost of producing the product.If there is an increase in costs of factors of production, which a firm uses in the production oftheir good, then it will be more costly to manufacture the good. They will not continue tosupply the same quantity of the good at the old prices – there will be a reduction in thequantity supplied.
2. Unplanned factors.There may be changes in the quantity supplied, which were never intended by the producer. Examples include agriculture – due to changes in the weather; diseases etc. In industry there may be shortages of raw materials, strikes etc.
3. The state of the firm’s production technology.As new machinery is invented, as labour becomes more specialised and efficient the factorsof production become more efficient. It becomes possible to increase their output eventhought the payments they receive remain the same.
4. Number of Sellers in the industry.If the number of firms in the industry decreased e.g. due to rationalisation then the overallquantity supplied to the market would decrease
5. Taxation / Subsidy.If the government were to reduce the rates of taxation on the raw materials used in themanufacture of a commodity, this represents a reduction in the cost of production and hencequantity supplied would increase. If a subsidy is granted on the raw materials or on thelabour employed by the firm, this has the effect of reducing costs and thereby resulting in anincrease in the quantity supplied.
2006 – Section B – Question 1 – 15 Marks For analytical purposes economists make certain assumptions about consumer behaviour. State and explain FOUR principal assumptions.

© Dublin School of Grinds Page 35 Rónán Murdock
2005 Section B – Question 1 – 30 Marks (i) Show, by means of a labeled diagram, the market demand and supply for a product.Indicate the equilibrium price and quantity in this market. (6m)
(ii) Explain, with the aid of a separate diagram in each case, the effects which each of thefollowing may have on the above equilibrium position:• A successful advertising campaign in favour of the product is introduced;• A tariff on imports of the product is removed.
Advertising Campaign Tariff on Imports
Effect Effect
Reason Reason
Equilibrium Equilibrium

© Dublin School of Grinds Page 36 Rónán Murdock
Answer to the question on the previous page.
2003 – Section B – Question 3A – 30 Marks (i) State and explain FOUR factors which affect a consumer’s demand schedule, other thanthe price of a good itself.
(ii) Explain the economic rationale for assuming that a person’s demand curve for a normalgood slopes downward.The reason a person’s demand curve for a normal good slopes downward as the price of agood falls the consumer buys more of this cheaper good, because the marginal utility percent spent on this good increases and the consumer aims to maximise his/her total utility.

© Dublin School of Grinds Page 37 Rónán Murdock
2005 Section B – Question 1 – 20 Marks Assume that the average spending on energy by a low-income family is €40 weekly. The price of energy rises by 20% so that the same consumption by a low-income family would now cost €48 weekly. The government is considering introducing one of the following policy measures to assist low-income families:
a. Giving low- income families an increased allowance of €8 weekly (incomesupplement);
b. Subsidising the producers of energy so that energy can continue to be sold at theinitial price (price subsidy).
Which policy measure would you advise the government to take? Explain the economic reasons for your answer.
(A) 1. Cost EfficientAs the income supplement specifically targets low-income families it is cost efficient and cheaper for the government than the price subsidy.
2. Purchasing Power Maintained / No change to standard of livingLow-income families will now receive an additional €8 weekly income. The family now have a choice in deciding how to allocate this. It can maintain existing energy consumption or economise on the use of energy and use the €8 in some alternative way.
3. Efficient use of scarce resources by consumersAs the price of energy rises, consumers seeing this may economise on energy use thussaving scarce resources.
OR
(B) 1. Protecting employmentBy using a price subsidy the demand for energy will remain unchanged and so employment is protected.
2. Prevent an increase in inflation / maintain competitivenessThe government may use the price subsidy so that energy prices remain unchanged hence maintaining price stability and ensuring that our competitiveness is not affected, subject to EU rules.

© Dublin School of Grinds Page 38 Rónán Murdock
2003 – Section B – Question 3 – 20 Marks For something to be considered an economic good, it must possess certain characteristics. State and explain THREE of these characteristics.
2003 – Section B – Question 3c – 25 Marks A consumer spends all income on two goods, Good A and Good B. Both goods are normal goods but they are not complementary goods. The price of Good A is reduced and the price of Good B remains unchanged. The consumer continues to spend all income on the two goods. Distinguish between the substitution effect and the income effect of the price reduction in Good A.
Substitution Effect Income Effect Demand for Good A Demand for Good A
Increases Increases Good A is now relatively cheaper. Hence the consumer is getting
increased marginal utility for this good.
Consumer has additional income, due to the reduction in price of Good A As good A is a normal good the demand
for this good will increase.
2001 – Section B – Question 3 – 25 Marks State FOUR factors that affect the supply of a good, other than the price of the good itself, and explain how each factor affects supply.
1) Cost of Producing the good
2) Unplanned Factors
3) Technology
4) Number of Sellers in the Industry
5) Taxation
Cutest
If you’re in doubt on this question go back to the chart on page 9. Remember it is a normal good.

© Dublin School of Grinds Page 39 Rónán Murdock
2001 – Section B – Question 3 – 25 Marks State and explain the principal economic assumptions made about consumer behaviour. 1. 2. 3. 4.
2001 – Section B – Question 3 – 25 Marks The law of diminishing marginal utility states that as additional units of a good are consumed the marginal utility of this good will eventually decline. ii(i) State and explain the assumptions underlying the law of diminishing marginal utility. Assumptions under the Law of Diminishing Marginal Utility
1. 2. 3. 4.
i(ii) Give TWO examples of commodities which do not comply with this law. Justify each choice with a brief explanation.
2000 – Section B – Question 1a – 20 Marks 1. (a) Explain, with the aid of an example, the Principle or Law of Equi-Marginal Returnsof Consumer Behaviour.
The Law of Equi-Marginal Returns “A consumer will enjoy maximum satisfaction when the ratio of MU to price is the same for all the different types of goods which he buys”.
MU1 = MU2 P1 P2
A consumer is in equilibrium buying item A @ 2 and item B @ €6. the marginal utility of item A is 5 utils and the marginal utility of item B is 15 utils.
MU of Good A = MU of Good B à 5 utils = 15 utils Price of Good A Price of Good B €2 €6
When two items are the same price the one with greater utility is purchased.

© Dublin School of Grinds Page 40 Rónán Murdock
2000 – Section B – Question 1b – 30 Marks A consumer spends all income on two goods, Good X and Good Y. Both goods are normal goods but they are not complementary goods. The price of good X is reduced and the price of good Y remains unchanged. The consumer continues to spend all income on the two goods. Explain, using the Substitution effect and Income effect how this price reduction affects the demand for both goods.
Demand for Good X Substitution Effect Income Effect
Increases Increases Good X is now relatively cheaper. Hence the consumer is getting
increased marginal utility for this good.
Consumer has additional income, due to the reduction in price of Good X As good X is a normal good the demand
for this good will increase.
Demand for Good Y Substitution Effect Income Effect
Decreases Increases Good Y is now relatively Expensive. Hence the consumer is now getting decreased marginal utility for this good in comparision to good X.
Consumer has additional income, due to the reduction in price of Good X As good Y is a normal good the demand
for this good will increase.
If you’re in doubt on this question go back to the chart. Remember it is a normal good.

© Dublin School of Grinds Page 41 Rónán Murdock
2000 – Section B – Question 1c – 20 Marks (i) Explain briefly, what is meant by the Law of Demand.
The Law of Demand states that an increase in price leads to a decrease in quantity demanded, or a decrease in price leads to an increase in quantity demanded.
For Example, If price of a bar chocolate increased by 5c per bar then quantity demanded or purchased would fall.
(ii) There are exceptions to the Law of Demand.Explain clearly THREE of these exceptions.
1. Giffen Goods
2. Snob items
3. Speculative goods

© Dublin School of Grinds Page 42 Rónán Murdock
Supply and Demand – Short Questions 2015 – Section A – Question 7 – 17 Marks
2009 – Section A – Question 7 – 17 Marks (a) State the Law of Diminishing Marginal Utility. Definition @ 9 marksThis law states that as a consumer consumes additional units of a good the marginal utility/ extra satisfaction derived from each additional unit consumed will eventually decline.
(b) The table below illustrates the Law of Diminishing Marginal Utility.
Number of units consumed 1 2 3 4 5 6 Total Utility in units 30 65 85 100 110 115
Marginal Utility in units 30 35 20 15 10 5
5 figures @ 1mark each= 5 marks
Complete the table and state the point after which diminishing utility set in. 3 marks Diminishing utility sets in after the consumption of the 2nd unit/when the 3rd unit is consumed.
© Dublin School of Grinds Page 43 Rónán Murdock
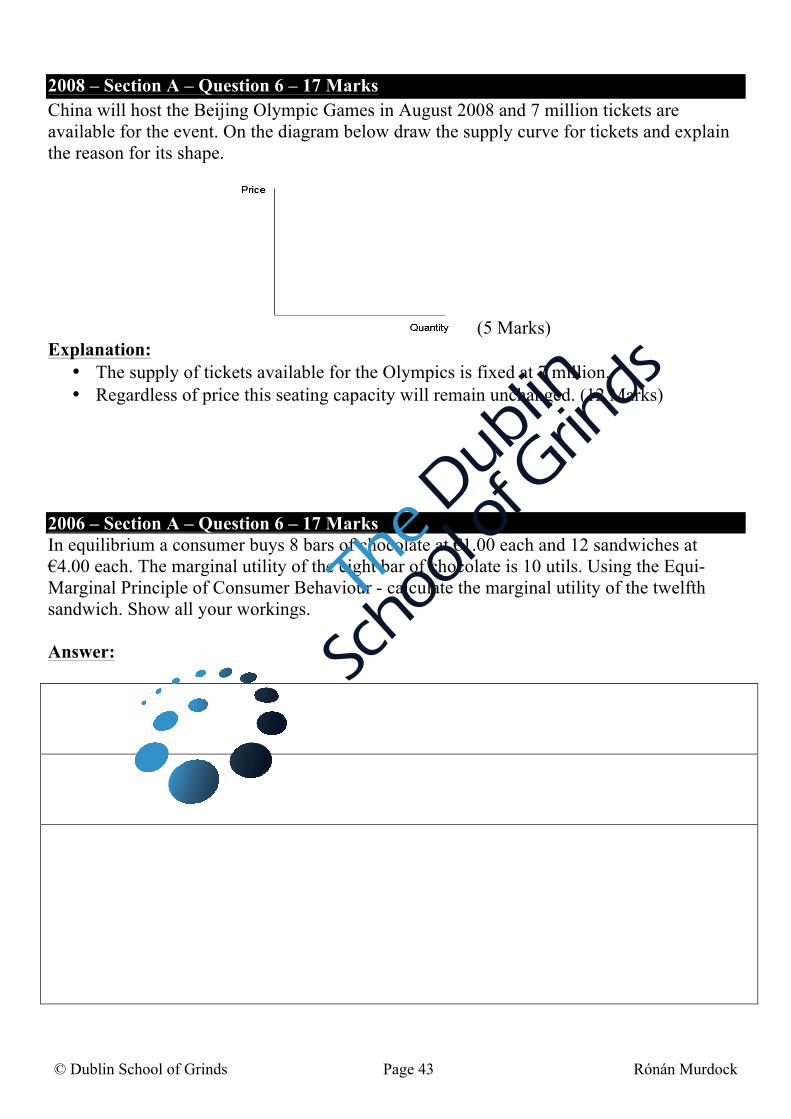
2008 – Section A – Question 6 – 17 Marks China will host the Beijing Olympic Games in August 2008 and 7 million tickets are available for the event. On the diagram below draw the supply curve for tickets and explain the reason for its shape.
(5 Marks) Explanation:
• The supply of tickets available for the Olympics is fixed at 7 million.• Regardless of price this seating capacity will remain unchanged. (12 Marks)
2006 – Section A – Question 6 – 17 Marks In equilibrium a consumer buys 8 bars of chocolate at €1.00 each and 12 sandwiches at €4.00 each. The marginal utility of the eight bar of chocolate is 10 utils. Using the Equi-Marginal Principle of Consumer Behaviour - calculate the marginal utility of the twelfth sandwich. Show all your workings.
Answer:

© Dublin School of Grinds Page 44 Rónán Murdock
Solution:
MU1 = MU2 P1 P2
Marginal Utility of Chocolate = Marginal Utility of Sandwiches Price of Chocolate Price of Sandwiches
10 = MUS MU Sandwiches = 40 utils €1.00 €4.00
2005 – Section A – Question 6 – 17 Marks A consumer in equilibrium buys 10 cups of coffee at €2 each and 10 phone cards at €6 each. The marginal utility of the cups of coffee is 5 utils. What is the marginal utility of phone cards? Show your workings. Solution:
MU1 = MU2 P1 P2
Marginal Utility of coffee = Marginal Utility of Phone Cards Price of Coffee Price of Phone Cards
5 = MU P.C. MU Phone Cards = 15 utils . €2 €6
2004 – Section A – Question 6 – 17 Marks Define the Law of Diminishing Marginal Utility and state TWO assumptions underlying the law.
The law of diminishing marginal utility states that as a consumer consumes additional units of a good their marginal utility for this good will eventually decline.
Assumptions under the Law of Diminishing Marginal Utility
1. Applies after a certain point called the origin.2. Addictive Goods3. Time lapse4. ‘Other factors’ affecting utility do not change.
(Definition: 9 marks graded Assumptions: 8 marks: 2 x 4 marks each.)

© Dublin School of Grinds Page 45 Rónán Murdock
2003 – Section A – Question 6 – 17 Marks Using the diagram, explain how higher consumers’ incomes (other factors unchanged) may affect the demand curve for mobile phones in Ireland.
Explanation As consumers’ incomes grow, the increased purchasing power will give ‘new’ consumers the ability to purchase mobile phones, and/or existing customers the ability to update their models.
2003 – Section A – Question 7 – 17 Marks State FOUR economic assumptions used for analysing consumer behaviour.
1. The consumer has a limited income.2. The consumer aims to gets maximum satisfaction / utility from that income.3. The consumer acts rationally.4. The consumer is subject to the Law of Diminishing Marginal Utility.

© Dublin School of Grinds Page 46 Rónán Murdock
Now test yourself with the 2015 paper – Question 1

© Dublin School of Grinds Page 47 Rónán Murdock
Effect Effect Effect
Reason Reason Reason
Equilibrium Equilibrium Equilibrium
Price Ceiling on Rent
© Dublin School of Grinds Page 48 Rónán Murdock
Marking Scheme for 2015 Question
© Dublin School of Grinds Page 49 Rónán Murdock

© Dublin School of Grinds Page 50 Rónán Murdock

© Dublin School of Grinds Page 51 Rónán Murdock

© Dublin School of Grinds Page 52 Rónán Murdock
Elasticity “If price rises, demand falls. If price falls, demand rises”
But by how much is the question?
The Types of Elasticity
1. Elastic DemandThe percentage change in price will be less than the percentage change in quantity demanded. For Example, Price decreases by 25% demand increases by 40%.
Change in Price < Change in Demand Goods with Elastic Demand These are goods which have a co-efficient greater than 1. If producers of elastic goods wish to maximise revenue they must decrease their selling price. Why? The percentage increase in demand exceeds the percentage decrease in price.
The following co-effecients all represent Elastic Demand: +2.0, -2.0, +1.1, -1.1 (They are all greater than 1 in absolute terms)
Examples of Elastic goods
Example of an elastic good If the price is reduced by 25% quantity demanded will increase by 40%
Below is a graph representing an elastic good
As we can see the price has decreased by 25% and the demand has increased by 40%

© Dublin School of Grinds Page 53 Rónán Murdock
2. Inelastic DemandThe percentage change in price will be greater than the percentage change in quantity demanded. For Example, Price decreases by 40% demand increases by 15%.
Change in Price > Change in Demand Goods with Inelastic Demand These are goods which have a co-efficient less than 1. If producers of inelastic goods wish to maximise revenue they must increase their selling price. Why? The percentage increase in price exceeds the percentage decrease in demand.
The following values represent Inelastic Demand +0.9, -0.9, -0.2
Examples of Inelastic goods
Example of an elastic good If the price is reduced by 40% quantity demanded will increase by 15%
Below is a graph representing an inelastic good
Hint→ Remember the three ‘I’s of an inelastic curve… (i) Inelastic.(ii) Shaped like a slanted I.(iii) Insensitive to a change in price.

© Dublin School of Grinds Page 54 Rónán Murdock
3. Unit ElasticAny percentage change in price results in an equal percentage change in quantity demanded. These are goods which have a co-efficient equal to 1.
Change in Price = Change in Demand If a good is Unit Elastic, the quantity demanded will change in direct proportion to price change. For Example, Price decreases by 15% demand increases by 15%. The following values represent Unitary Elastic Demand +1 and -1
Below is a graph representing an unitary elastic demand
For Example A 30% price change will lead to a 30% change in quantity demanded.
4. Perfect Inelastic DemandIf the percentage change in the price of a good causes no change in the quantity demanded of that good.
5. Perfect Elastic DemandConsumers will demand all of a firms goods at a given price but any increase will cause demand to fall to zero (0) This happens in markets with perfect competition.
Note that the demand curve is
drawn an 45 degrees.

© Dublin School of Grinds Page 55 Rónán Murdock
The three types of Elasticity A) Price Elasticity of DemandB) Income Elasticity of DemandC) Cross-Elasticity of Demand
Price Elasticity of Demand
Measures the percentage change in the quantity demanded for a good caused by the percentage change in the price of that good.
Formula =
∆Q = Change in quantity demanded Q1 = Original Quantity demanded Q2 = New Quantity demanded after price change ∆P = Change in Price P1 = Original Price P2 = New Price after Price change
Practice Question A consumer spends €120 per month on a product when its unit price is 80c, and continues to spend €120 per month on this product when its unit price increases to €1. Calculate the consumer’s price elasticity of demand.
Fill in the following values below ∆Q ∆P Q1 P1 Q2 P2
Make sure to learn the definitions off
by heart!!
There is a bit of a trick question here, so read
the question very carefully!!!
The Most Common Mistake that students make on the above question!! If the quantity demanded or selling price drops (which usually happens) students often forget to show this. If the selling price drops by 20 cent you must write (-20) when you are showing
the change in price.
© Dublin School of Grinds Page 56 Rónán Murdock
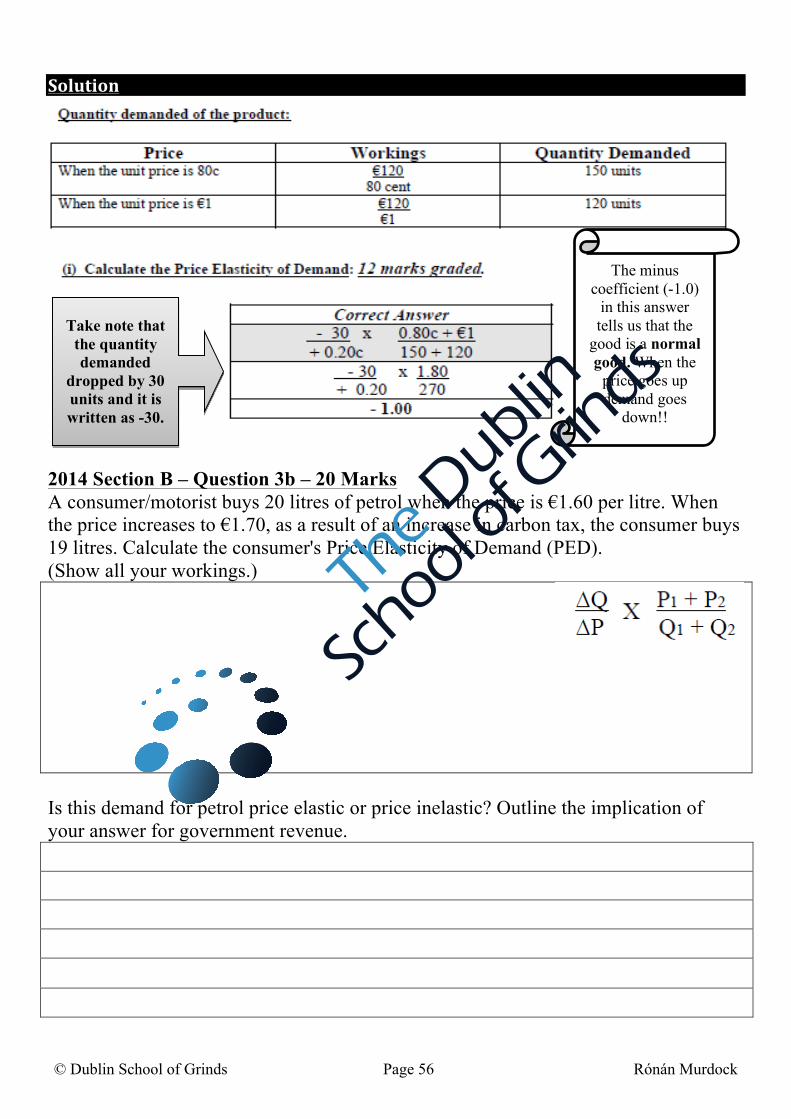
Solution
2014 Section B – Question 3b – 20 Marks A consumer/motorist buys 20 litres of petrol when the price is €1.60 per litre. When the price increases to €1.70, as a result of an increase in carbon tax, the consumer buys 19 litres. Calculate the consumer's Price Elasticity of Demand (PED). (Show all your workings.)
Is this demand for petrol price elastic or price inelastic? Outline the implication of your answer for government revenue.
Take note that the quantity demanded
dropped by 30 units and it is written as -30.
The minus coefficient (-1.0)
in this answer tells us that the
good is a normal good. When the
price goes up demand goes
down!!

© Dublin School of Grinds Page 57 Rónán Murdock
Here are the Factors which affect Price Elasticity of Supply
1. Firms Production CapacityIf the firm is operating with plenty of capacity it should be able to increase production without any major difficulty. Therefore Supply is likely to be more elastic.
2. Time periodSupply tends to be more inelastic in the short as producers will often struggle to bring about an immediate increase in supply. For Example, If the price of fish was to increase this would not bring about an immediate increase in supply.
3. Storage CostsIf storage costs are low producers may increase supply without any major impact on costs. Therefore supply is more likely to be elastic.
4. Nature of the productPerishable products are more likely to be inelastic in supply. For example a rise in the price of strawberries will not result in an increase in supply on the day.
Sample Question The price of strawberries rises from €8 to €10 per kilo. One firm increases its production from 60,000 to 100,000 kilos. Calculate the firms price elasticity of supply.
This question hasn’t come up yet in the leaving cert but it is on the syllabus so make so to cover it, if you learn off the four titles it’s easy enough to explain.

© Dublin School of Grinds Page 58 Rónán Murdock
Here are the Factors which affect Price elasticity of Demand
1. Complementary goodsIf the two goods are complimentary the demand for the cheaper of the two goods is likely to be inelastic.
2. Is the product ExpensiveIn general the greater the proportion of income which is spent on a good, the more elastic the demand for it is likely to be, in response to a change in its own price. A rise of 50% in the price of a box of matches is unlikely to have a significant effect on its demand.
3. Brand LoyaltyA consumer may become strongly attached to a particular product through habit or loyalty to that brand. An increase in price for that good will not cause him/her to consume less of the product or to switch to cheaper substitutes. The demand for such goods will therefore be price inelastic.
4. Is it a Luxury or necessity?It is not vital that one should possess luxuries and therefore the PEDfor them will be relatively elastic.Necessities are vital for life – people must buy them even when theirprice is increased, so their PED will be relatively inelastic.
5. Availability of close SubstitutesWhen a good has a close substitute and its price is increased the demand for the good will be elastic because people will switch to the cheaper substitute. Where a good has no substitutes and its price is increased there is no substitute to switch to and so it will be inelastic.
C
E
L
S
L
CELLS

© Dublin School of Grinds Page 59 Rónán Murdock
Income Elasticity of Demand Measures the percentage change in demand for one good caused by a percentage change in the consumers income. Formula
Where YED= income elasticity of demand ∆Q= change in quantity demanded Q1= original quantity demanded Q2= new quantity demanded ∆Y= change in income Y1= original level of income Y2= new level of income
• Income elasticity of demand for most goods (normal goods) is positive, the quantitydemanded rises as Income rises.
• An inferior good is a good with a negative income elasticity of demand• The demand for consumer durables and luxuries has a high Income elasticity of
Demand - the demand for them rises greatly as Income rises.
So the only people who will buy this is people who are on a very desperate. Now if incomes rise demand for this product will fall as consumers will buy better quality food for their cats. The grid below illustrates this.
Note: The key thing you need to pay attention to here is the negative co-efficient.
∆Q Demand falls by 5% -5 - 0.5 Note that the co-efficient is negative. That tells us that the product is inferior. ∆Y Incomes rise by 10% 10
The Golden Rule Normal Good = Positive YED Inferior Good = Negative YED
Inferior good à A very low quality product. An example of an inferior good would be always save cat food. If you look closely at the cats pissed off face it’s like he’s begging you not to buy him that crap.

© Dublin School of Grinds Page 60 Rónán Murdock
2002 – Section B – Question 3d – 10 Marks Income elasticity of demand for a good is +1.8 and sales in Year 1 are 20,000 units. If consumers’ incomes are expected to rise by 5% in Year 2, calculate the expected level of sales. Show your workings. Remember Calculate the percentage rise in demand first. (Co-efficient x percentage change in income)
Question 1 Which type of goods can be observed assuming the following income elasticities of demand?
Type of good? Luxury, necessity etc Good X: + 0.5 Good Y: +2.6 Good Z: - 0.4
Question 2 The income elasticities of demand of two goods, A and B, are as follows: Good A: + 3.0 Good B: - 0.2 Now income rises by 5 %. By how much quantities demanded of A and B will change?
Good A: + 3.0 Good B: - 0.2

© Dublin School of Grinds Page 61 Rónán Murdock
Cross Elasticity of Demand (CED)
Measures the percentage change in the demand for one good cause by the percentage change in the price of other goods.
For Example How a change in the price of Ryanair affects the demand for Aer Lingus.
Formula:
∆QA = change in quantity demanded of good A Q1A = original quantity of demanded of good A Q2A = quantity demanded of good A after the price of Good B has changed ∆PB = change in the price of B P1B= original price of B P2B= new price of B
When two goods are substitutes a rise in the price of one will lead to an increase in the demand for the other so CED will be positive. When goods are complimentary an increase in the price of one will lead to a fall in demand for the other so CED will be negative.
Sample Question – 20 Marks A consumer buys 8 units of Good A when the price of Good B is €4. When the price of Good B rises to €6 (the price of Good A remaining unchanged) the consumer buys 15 units of Good A. Using an appropriate formula, calculate this consumer’s cross elasticity of demand for Good A. Show your workings. Is Good A a substitute for, or a complement to, Good B? Explain your reasoning.
The Golden Rule Substitutes = Positive CED
Complimentary = Negative CED
© Dublin School of Grinds Page 62 Rónán Murdock
Past Leaving Cert Questions
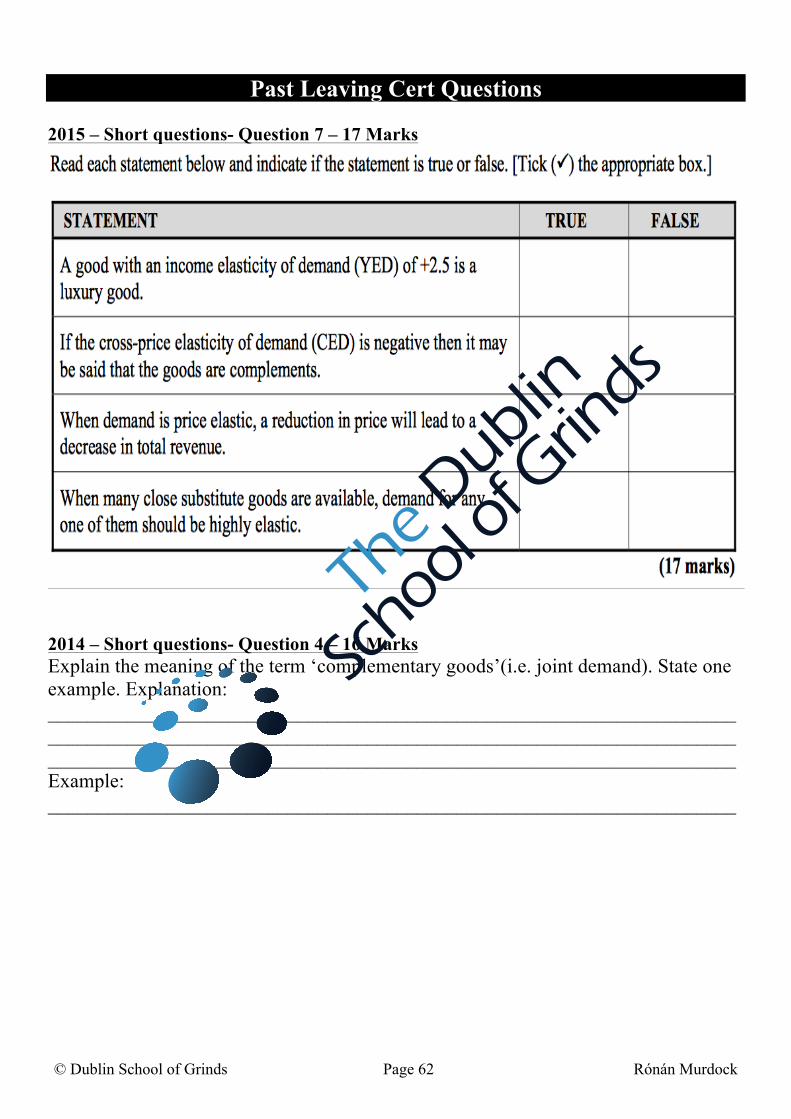
2015 – Short questions- Question 7 – 17 Marks
2014 – Short questions- Question 4 – 16 Marks Explain the meaning of the term ‘complementary goods’(i.e. joint demand). State one example. Explanation: _______________________________________________________________________________________________________________________________________________________________________________________________________________ Example: _____________________________________________________________________

© Dublin School of Grinds Page 63 Rónán Murdock
2013 – Short questions- Question 3
Sample Question If, last year, average income at constant prices rose from €10,000 to €10,700 and the income elasticity of demand for iPhones is +4, by what percentage would the amount spent on iPhones increased by?

© Dublin School of Grinds Page 64 Rónán Murdock
2012 – Section B – Question 1b – 30 Marks A manufacturer of three different products calculates the price elasticity of demand (PED) for each product as follows:
Product A: -2.8 Product B: -1.0 Product C: -0.5 The manufacturer wishes to maximise its revenues. Explain in respect of each of these products, what change, if any, the manufacturer should make in the prices currently being charged to enable it to achieve its aim. Illustrate your answers with the aid of a demand curve for each product
Product A Product B Product C What type of good is
it? What
should the seller do?
WHY?
What will happen to revenue?
Graph
When you see a question like this think of the 4 W’s. 1. What type of good is it?2. What should the manufacturer do?3. Why?4. What will happen to revenue?
Note à If they ever give you a figure that has a positive PED (ie. +0.6 or +4.3) and they ask what should the seller do in order to raise revenue?
Say they should raise their selling price because if they do this they will have higher sales at a higher selling price. These are goods which don’t obey the law of demand.

© Dublin School of Grinds Page 65 Rónán Murdock
2012 – Section B – Question 1c – 20 Marks You are given the following information about certain products:
Cross Elasticity of Demand between Product X & Product A = -0.8 Cross Elasticity of Demand between Product X & Product B = +3.2 Cross Elasticity of Demand between Product X & Product C = -1.6 Cross Elasticity of Demand between Product X & Product D = +0.5
(i) Which of the products above are substitutes for Product X?Explain your answer
(ii) Which product is the closer complement to Product X? Explain your answer.
© Dublin School of Grinds Page 66 Rónán Murdock
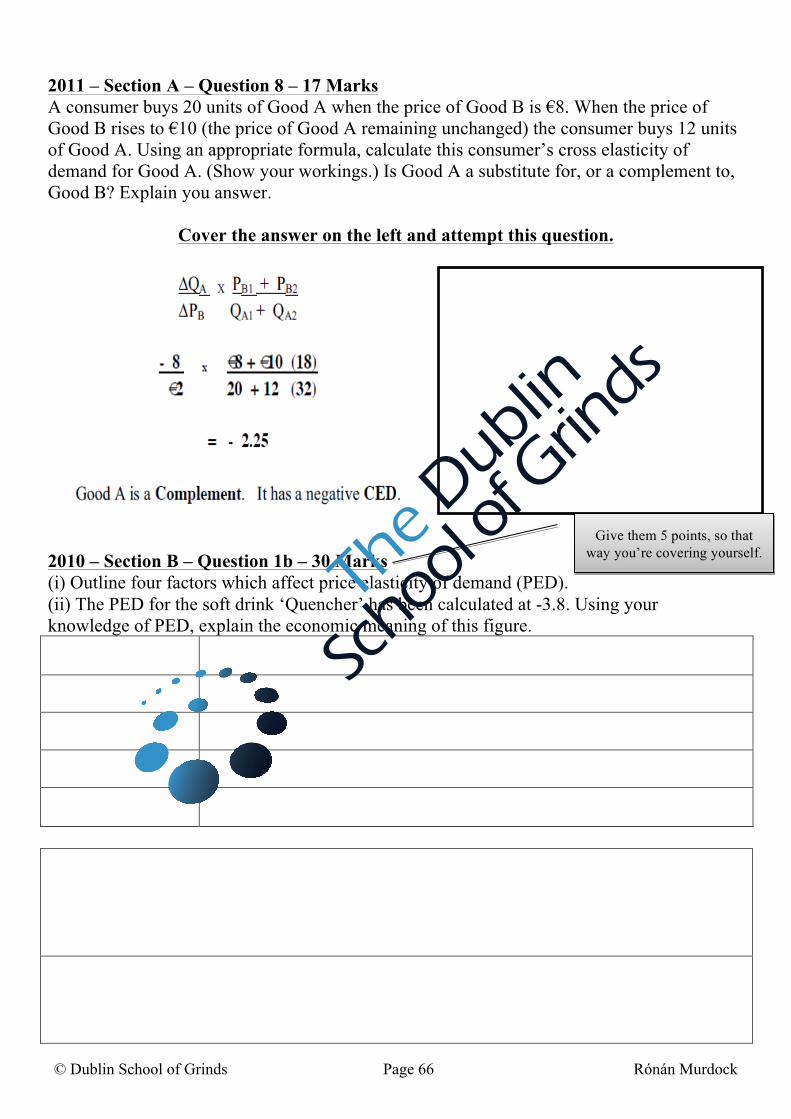
2011 – Section A – Question 8 – 17 Marks A consumer buys 20 units of Good A when the price of Good B is €8. When the price of Good B rises to €10 (the price of Good A remaining unchanged) the consumer buys 12 units of Good A. Using an appropriate formula, calculate this consumer’s cross elasticity of demand for Good A. (Show your workings.) Is Good A a substitute for, or a complement to, Good B? Explain you answer.
Cover the answer on the left and attempt this question.
2010 – Section B – Question 1b – 30 Marks (i) Outline four factors which affect price elasticity of demand (PED).(ii) The PED for the soft drink ‘Quencher’ has been calculated at -3.8. Using yourknowledge of PED, explain the economic meaning of this figure.
Give them 5 points, so that way you’re covering yourself.

© Dublin School of Grinds Page 67 Rónán Murdock
2010 – Section A – Question 3 – 16 Marks A consumer spends €200 monthly on Product A when its price is €2 and continues to spend €200 monthly when its price increases to €2.50. Calculate the consumer’s price elasticity of demand. Show all your workings and explain your answer.
2009 – Section A – Question 2 – 16 Marks
∆Q = ∆P = Q1 = P1 = Q2 = P2 =

© Dublin School of Grinds Page 68 Rónán Murdock
2009 – Section B – Question 1b – 30 Marks (i) Define income elasticity of demand and price elasticity of demand.(ii) Which figure stated below is most likely to represent each of the following:• Income elasticity of demand for low price cuts of meat;• Income elasticity of demand for Apple iPhones;• Price elasticity of demand for Petrol.Give reasons for your choice in each case.
Low Price Cuts of Meat Apple Iphones Petrol
2009 – Section B – Question 1c – 15 Marks Assume Income elasticity of demand for games consoles is + 2.5 and total sales in 2008 were 100,000 units. Calculate the expected total sales for the year if consumers’ incomes are expected to fall by 8% in 2009. Show your workings.
Sample Question Assume Income elasticity of demand for games consoles is + 2.5 and total sales in 2008 were 50,000 units. Calculate the expected total sales for the year if consumers’ incomes are expected to increase by 6% in 2009. Show your workings.
- 1.6 - 0.1 + 4.3

© Dublin School of Grinds Page 69 Rónán Murdock
2008 – Section B – Question 1 – 14 Marks The data below represents the market demand and supply schedules for MP3 Players.
Price €
Quantity Demanded (‘000 units)
Quantity Supplied (‘000 units)
20 100 20 30 80 40 40 60 60 50 40 80 60 20 100
Using this data, calculate the price elasticity of demand when price changes from €40 to €50. (Show all your workings). For this price change, is demand for MP3 Players elastic or inelastic? Explain your answer.
2007 – Section A – Question – 16 Marks Consumers buy 50 units of a product when the price is €1.50. When the price is reduced to €1 consumers buy 90 units. Using an appropriate formula, calculate the consumers’ price elasticity of demand. Show your workings and explain your answer.
ΔQ x P1 + P2 ΔP Q1 + Q2

© Dublin School of Grinds Page 70 Rónán Murdock
2006 – Section B – Question 1b – 30 Marks A manufacturer of three different products calculates the price elasticity of demand for each product as follows:
Product X: -1.5 Product Y: -1.0 Product Z: -0.3
The company wishes to maximise its revenues. Explain in respect of each of these products, what change, if any, the company should make in the prices currently being charged to enable it to achieve its aim.
Product X: -1.5 Product Y: -1.0 Product Z: -0.3 What type of
good? Elastic or Inelastic? Normal / Inferior?
What should the
manufacturer do?
Why?
What will happen to revenue?
When you see a question like this think of the 4 W’s. 1. What type of good is it?2. What should the manufacturer do?3. Why?4. What will happen to revenue?

© Dublin School of Grinds Page 71 Rónán Murdock
2004 – Section B – Question 1a – 20 Marks Define the following types or degrees of price elasticity of demand: (i) Perfectly elastic demand; (ii) Perfectly inelastic demand;(iii) Elastic demand; (iv) Unitary elastic demand.
(i)
(ii)
(iii)
(iv)
2004 – Section B – Question 2b – 25 Marks State and explain FIVE factors that affect price elasticity of demand.
(1)
(2)
(3)
(4)
(5)
(6)

© Dublin School of Grinds Page 72 Rónán Murdock
2004 – Section B – Question 1c – 30 Marks A consumer spends €120 per month on a product when its unit price is 80c, and continues to spend €120 per month on this product when its unit price increases to €1. (i) Using the formula below, calculate the consumer’s price elasticity of demand. Show allyour workings.
ΔQ x P1 + P2 ΔP Q1 + Q2
(ii) Is demand for this product elastic, inelastic or unitary elastic?(iii) Should the seller make any changes in the selling price of this commodity toincrease overall revenue? Explain your answer.(i) ∆Q = ∆P =
Q1 = P1 =
Q2 = P2 =
(ii)
(iii)
2003 – Section B – Question 1a – 20 Marks Define (i) price elasticity of demand and (ii) cross elasticity of demand. In each case, state the formula by which it is measured.
Fill in the values for question (i) into the grid below. Make
sure to always do this!

© Dublin School of Grinds Page 73 Rónán Murdock
2003 – Section B – Question 1b – 25 Marks When the price of Good X is €27, the quantity demanded of Good Y is 1,200 units. When the price of Good X falls to €23 (the price of Good Y unchanged) the quantity demanded of Good Y falls to 800 units. (i) Using the cross elasticity of demand formula, calculate the cross elasticity of demandfor Good Y. Show all your workings.(ii) Is Good Y a substitute for or complement to Good X? Explain your choice.
2003 – Section B – Question 1c – 30 Marks A firm has the following price elasticities of demand for two goods, Good X and Good Y:
Good X ….. -‐2.0 Good Y ….. -‐0.5
What changes, if any, should the firm make in the selling price of each of the goods to increase overall revenue. Explain your answer.
-‐2.0 -‐0.5 TYPE OF GOOD
ACTION
WHY
RESULT
When you see a question like this think of the 4 W’s. 1. What type of good is it?2. What should the manufacturer do?3. Why?4. What will happen to revenue?

© Dublin School of Grinds Page 74 Rónán Murdock
2002 – Section B – Question 3a – 15 Marks Define (i) Income Elasticity of Demand. (ii) Cross Elasticity of Demand.
(i) Income Elasticity of Demand
(ii) Cross Elasticity of Demand
2002 – Section B – Question 3b – 20 Marks (i) “Income elasticity of demand is usually positive but sometimes negative”. Explain,
giving examples, the meaning of this statement.(ii) A consumer spends 40% of income on a certain good. After the consumer’s incomedoubles (everything else remaining unchanged), only 30% of income is spent on the good.State whether this good is a normal or inferior good and explain your answer.

© Dublin School of Grinds Page 75 Rónán Murdock
2014 Section B – Question 3a - 30 Marks (i) Define the categories of Price Elasticity of Demand (PED): elastic, inelastic andunit elastic.Elastic
Inelastic
Unit elastic
(ii) State three factors that affect PED and explain how each factor affects it.
1
2
3
4
30 Marks – 12 Minutes

© Dublin School of Grinds Page 76 Rónán Murdock
2014 Section B – Question 3b - 20 Marks A consumer/motorist buys 20 litres of petrol when the price is €1.60 per litre. When the price increases to €1.70, as a result of an increase in carbon tax, the consumer buys 19 litres. Calculate the consumer's Price Elasticity of Demand (PED). (Show all your workings.) Is this demand for petrol price elastic or price inelastic? Outline the implication of your answer for government revenue.
2014 Section B – Question 3c - 25 Marks A firm is considering a change to its product's price. It conducts market research which reveals that the Price Elasticity of Demand (PED) for the product is -2.5.
Use this information to answer the following question: (i) If the firm wishes to maximise total sales revenue, should it lower or raise the priceof the product? Explain your answer.

© Dublin School of Grinds Page 77 Rónán Murdock
The market research also reveals Income Elasticity of Demand (YED) for the product is +4.5. Use this information to answer the following question:
(ii) In the case of an economy which is expected to remain in recession for the nextfive years, what, if any, will be the likely impact on the demand for the product?Explain your answer.
2002 – Section B – Question 3c – 30 Marks Which of the figures stated below is likely to represent: (i) Income elasticity of demand for potatoes;(ii) Income elasticity of demand for designer clothes;(iii) Price elasticity of demand for airline seats.
-2.8, -0.1, + 2.5Explain each of your choices.
-2.8
1.
2.
3.
-0.1
1.
2.
3.
+2.5
1.
2.
3.

© Dublin School of Grinds Page 78 Rónán Murdock
Tricky questions from sample papers
25 Marks Domestic users in most European countries pay for the provision of clean water and wastewater service provision.
(i) Outline three economic reasons for the introduction of water charges for households.
(ii) State and explain two possible economic effect which these water charges may have foreach of the following:
households who pay these water charges the Irish Government.