Embed Size (px)
DESCRIPTION
7. 2 Polynomial Functions and Their Graphs. Objectives: Identify and describe the important features of the graph of polynomial function. Use a polynomial function to model real-world data. Standard: 2.8.11.S. Analyze properties and relationships of polynomial functions. - PowerPoint PPT Presentation
Citation preview
7. 2 Polynomial Functions and 7. 2 Polynomial Functions and Their GraphsTheir Graphs
Objectives:Objectives: Identify and describe the Identify and describe the important features of the graph of important features of the graph of
polynomial function.polynomial function.
Use a polynomial function to model Use a polynomial function to model real-world data.real-world data.
Standard:Standard: 2.8.11.S. Analyze properties 2.8.11.S. Analyze properties and relationships of polynomial and relationships of polynomial
functionsfunctions..
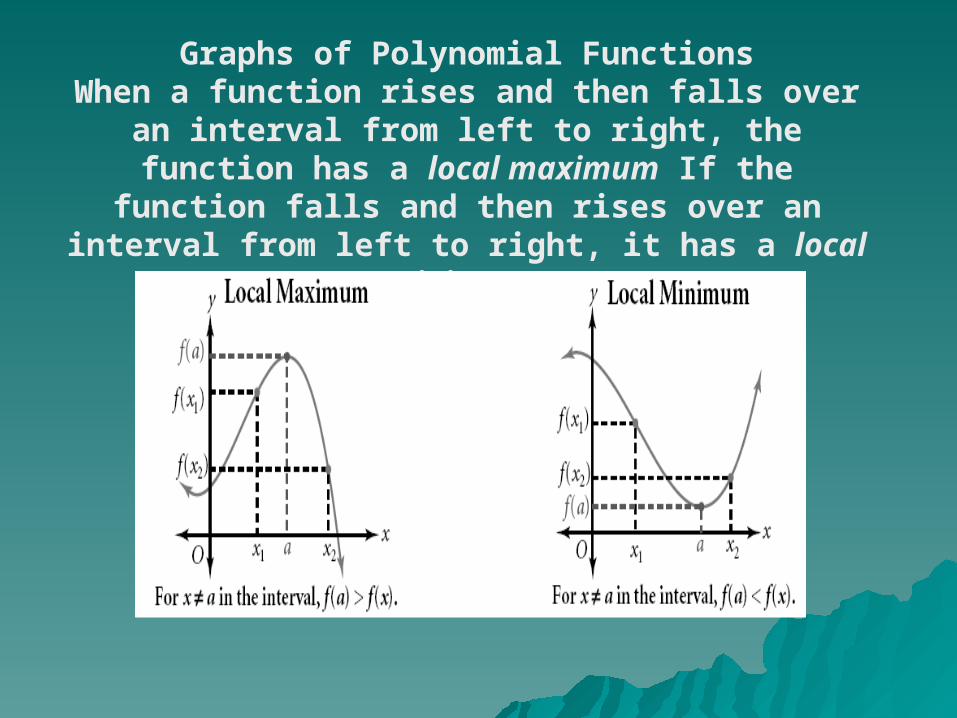
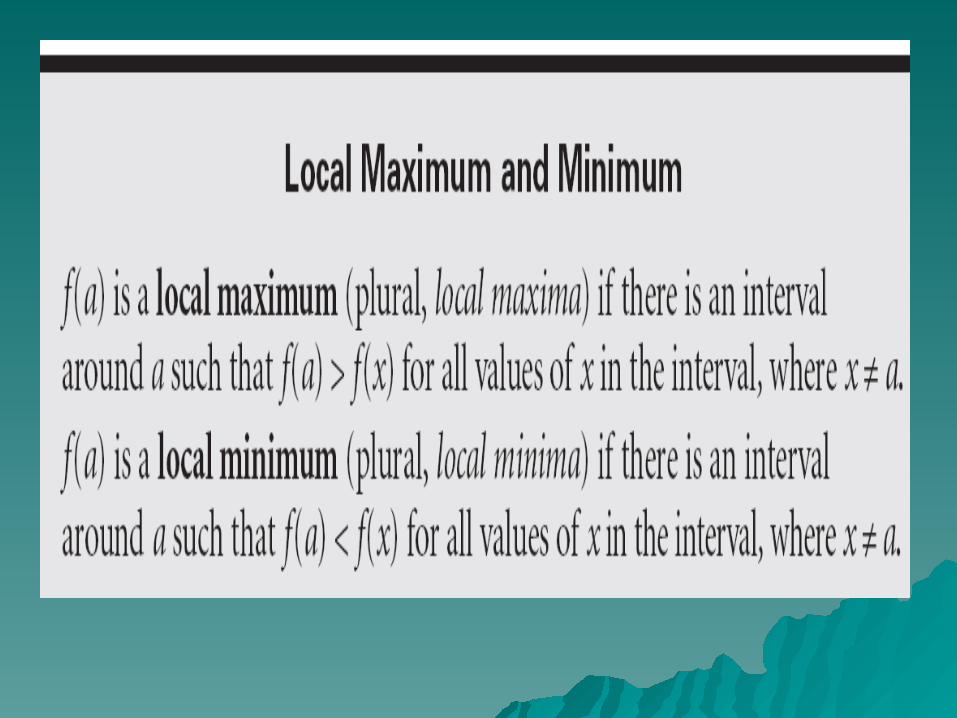
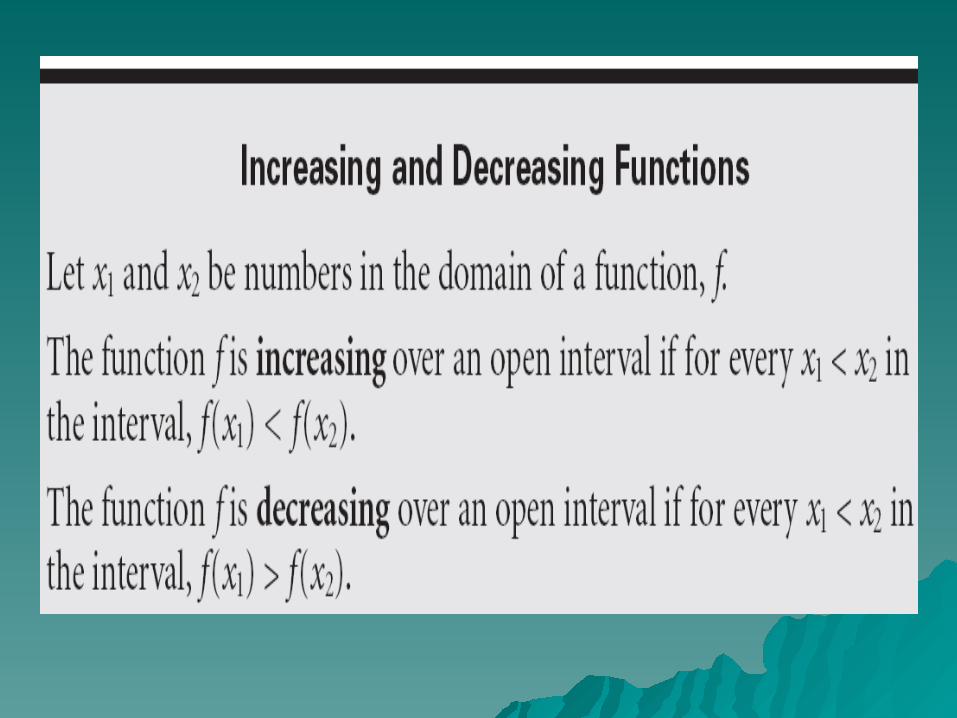
Graphs of Polynomial FunctionsWhen a function rises and then falls over an interval from left to right, the function has a local maximum If the function falls and then rises over an interval from
left to right, it has a local minimum.
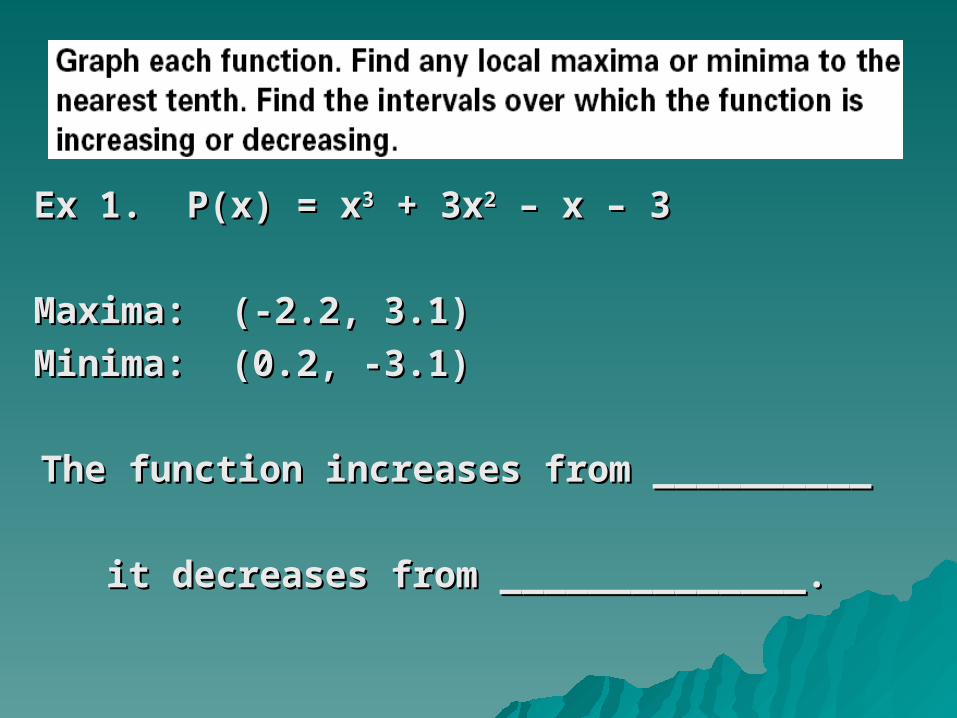
Ex 1. P(x) = xEx 1. P(x) = x33 + 3x + 3x22 – x – 3 – x – 3
Maxima: (-2.2, 3.1)Maxima: (-2.2, 3.1)
Minima: (0.2, -3.1)Minima: (0.2, -3.1)
The function increases from __________ The function increases from __________
it decreases from ______________.it decreases from ______________.
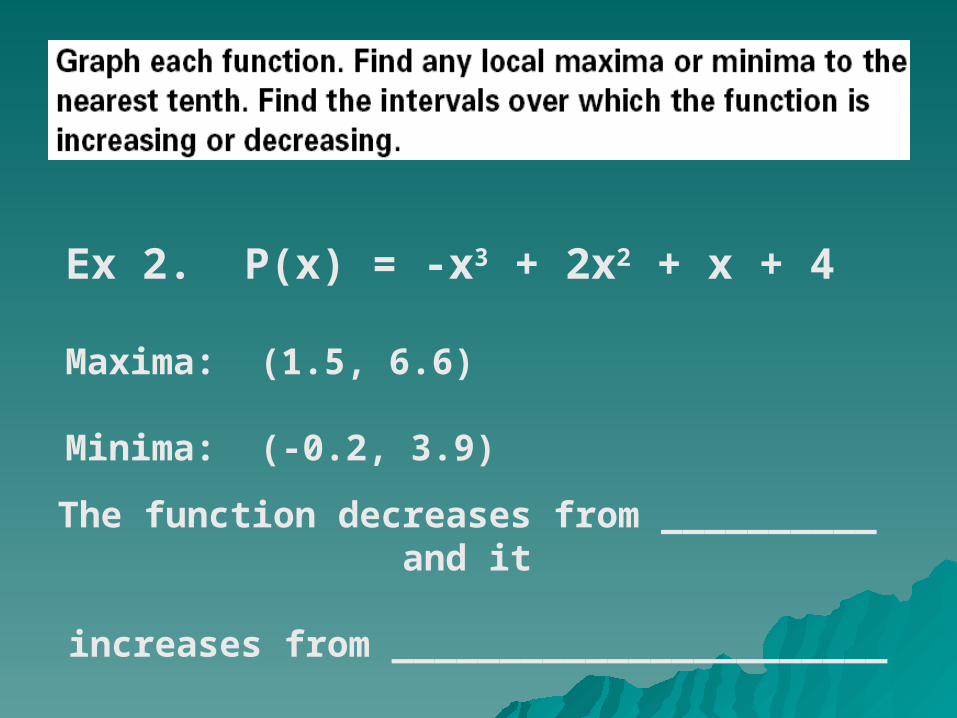
Ex 2. P(x) = -x3 + 2x2 + x + 4
Maxima: (1.5, 6.6)
Minima: (-0.2, 3.9)
The function decreases from __________ and it
increases from _______________________
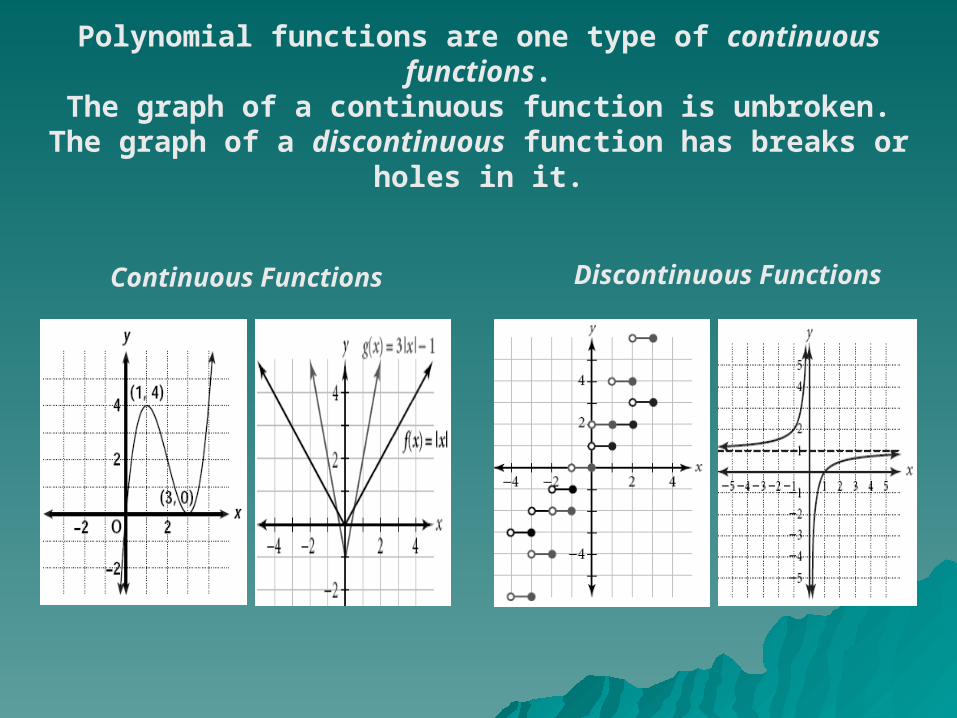
Polynomial functions are one type of continuous functions.The graph of a continuous function is unbroken.
The graph of a discontinuous function has breaks or holes in it.
Discontinuous FunctionsContinuous Functions
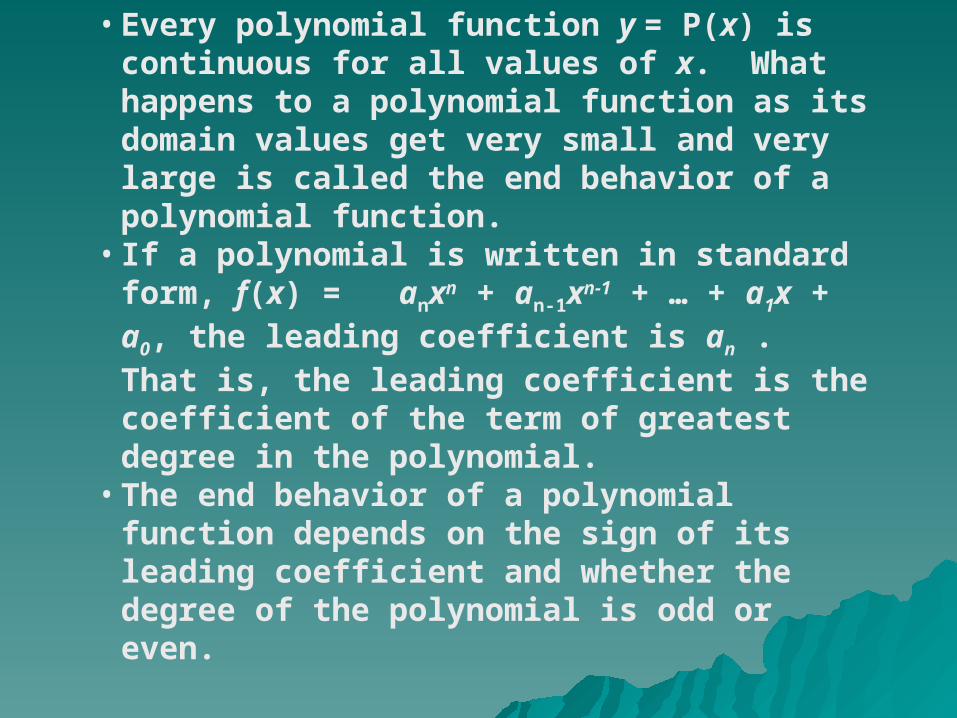
• Every polynomial function y = P(x) is continuous for all values of x. What happens to a polynomial function as its domain values get very small and very large is called the end behavior of a polynomial function.
• If a polynomial is written in standard form, f(x) = anxn + an-1xn-1 + … + a1x + a0, the leading coefficient is an . That is, the leading coefficient is the coefficient of the term of greatest degree in the polynomial.
• The end behavior of a polynomial function depends on the sign of its leading coefficient and whether the degree of the polynomial is odd or even.
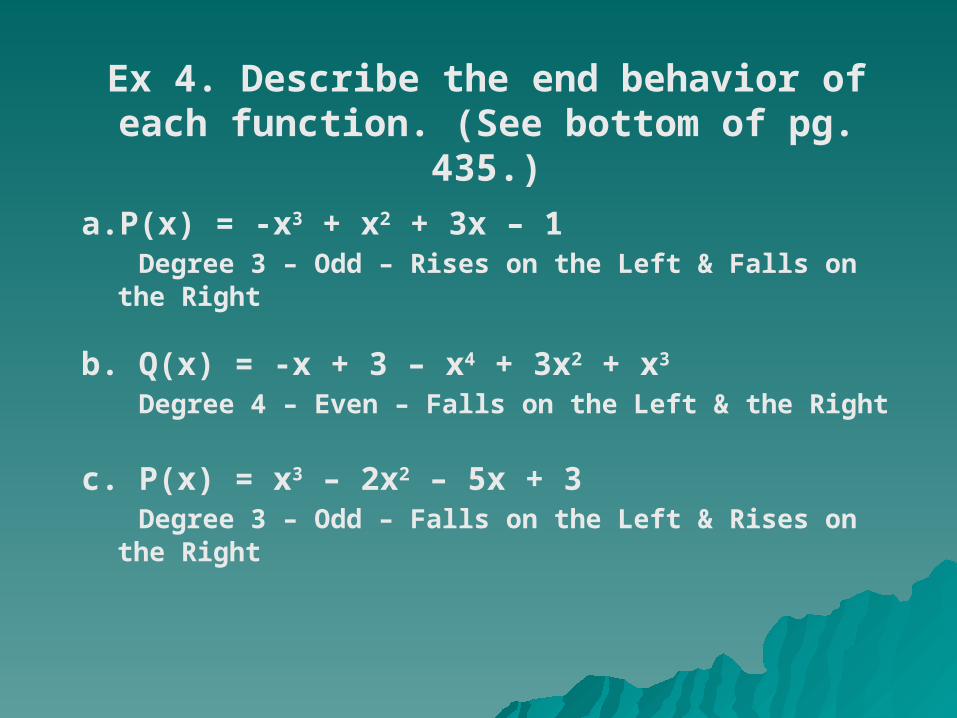
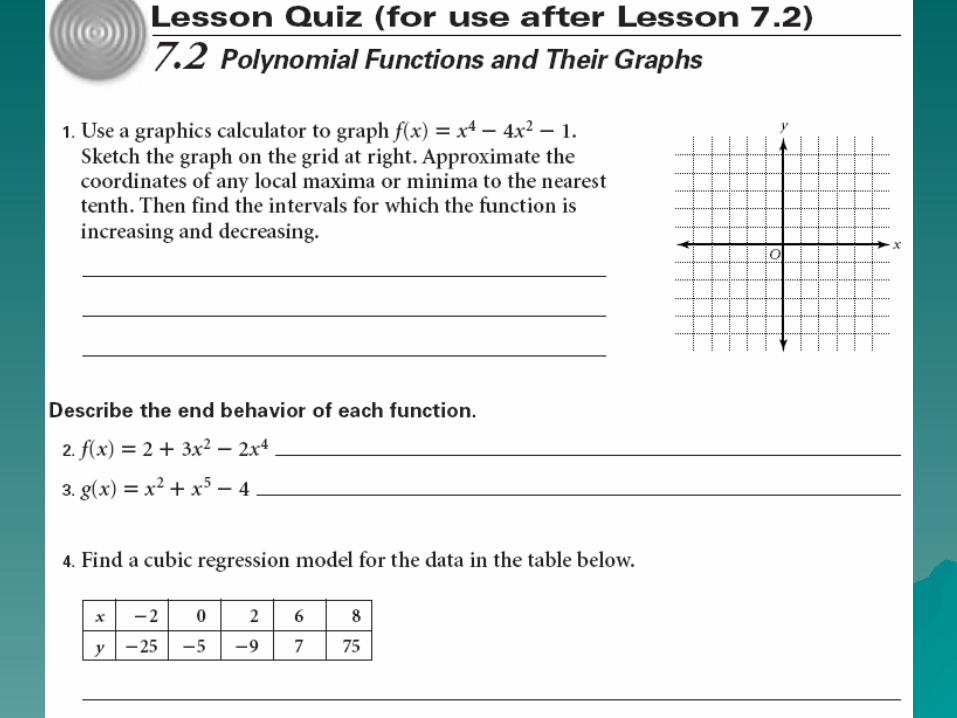
Ex 4. Describe the end behavior of each function. (See bottom of pg. 435.)
a. P(x) = -x3 + x2 + 3x – 1 Degree 3 – Odd – Rises on the Left & Falls on the Right
b. Q(x) = -x + 3 – x4 + 3x2 + x3
Degree 4 – Even – Falls on the Left & the Right
c. P(x) = x3 – 2x2 – 5x + 3 Degree 3 – Odd – Falls on the Left & Rises on the Right
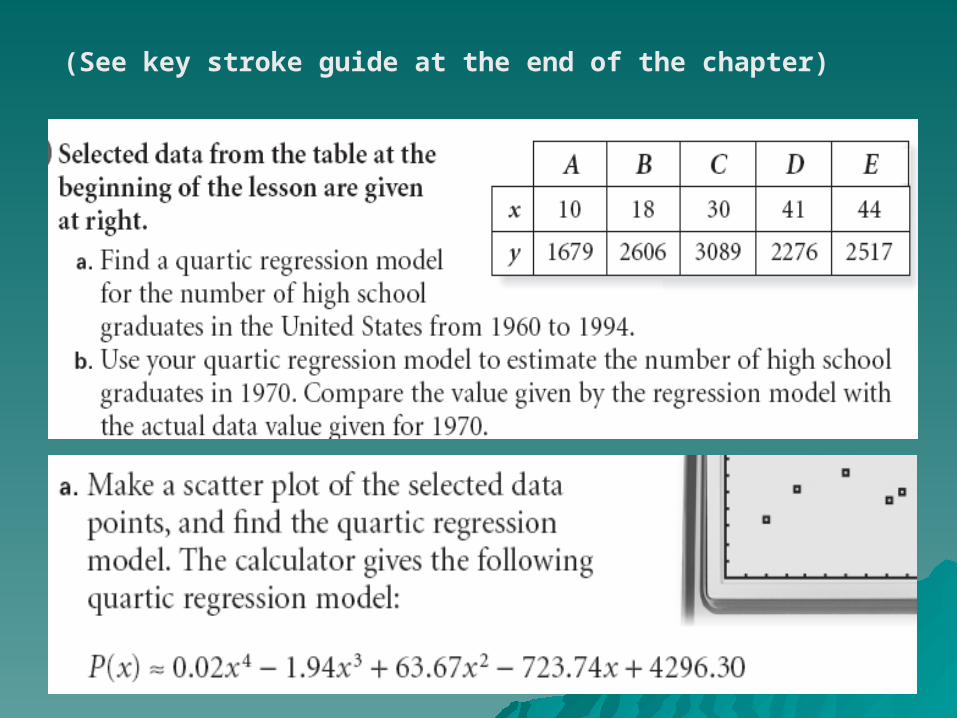
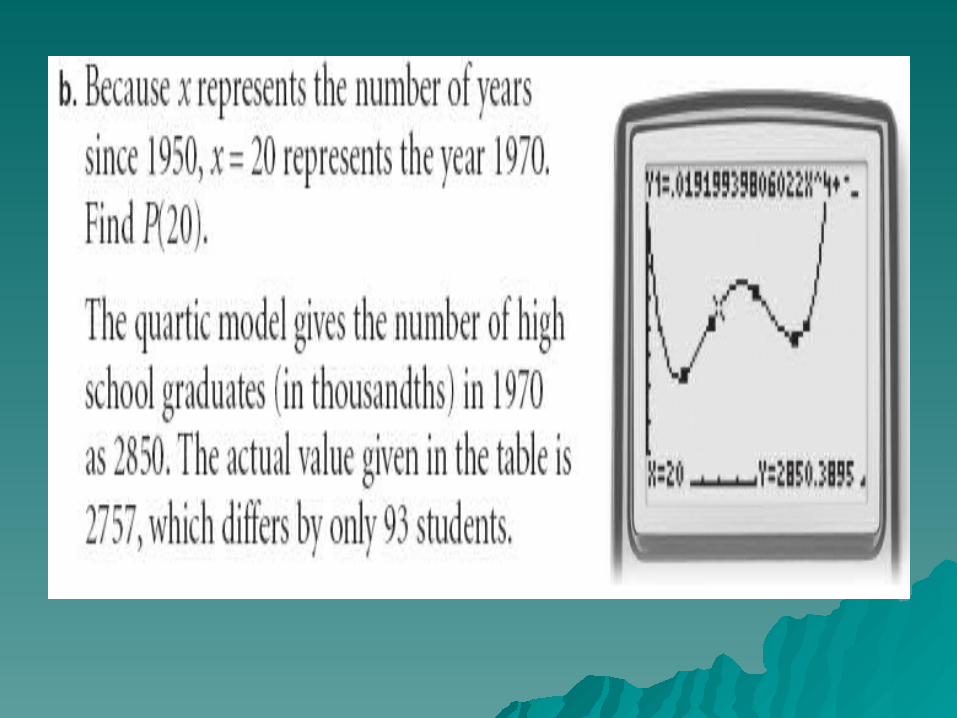
(See key stroke guide at the end of the chapter)
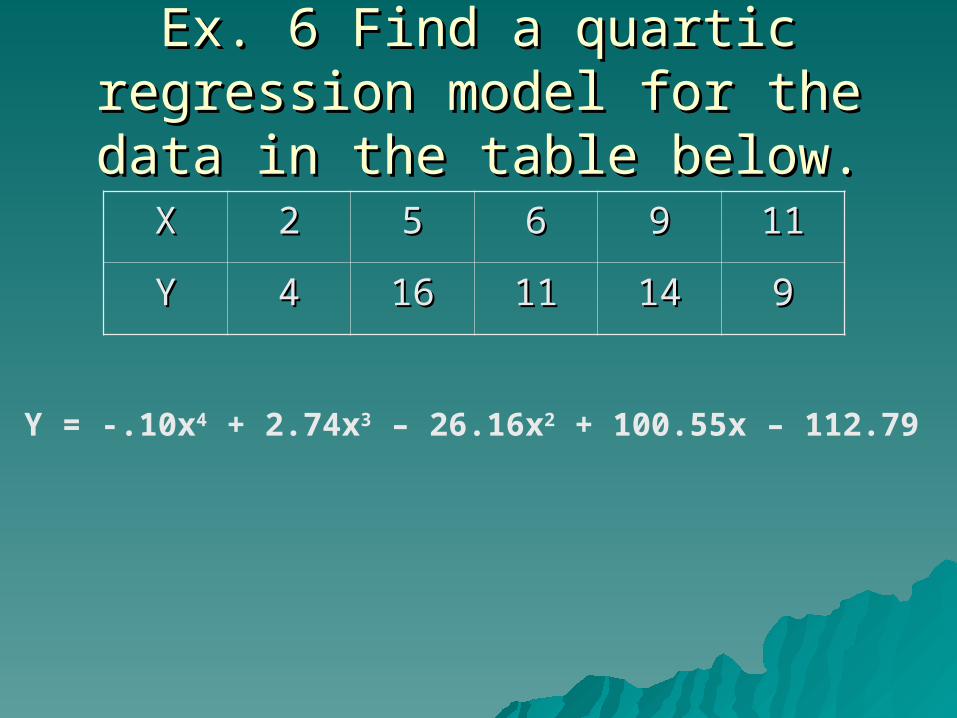
Ex. 6 Find a quartic regression Ex. 6 Find a quartic regression model for the data in the table model for the data in the table
below.below.XX 22 55 66 99 1111
YY 44 1616 1111 1414 99
Y = -.10x4 + 2.74x3 – 26.16x2 + 100.55x – 112.79
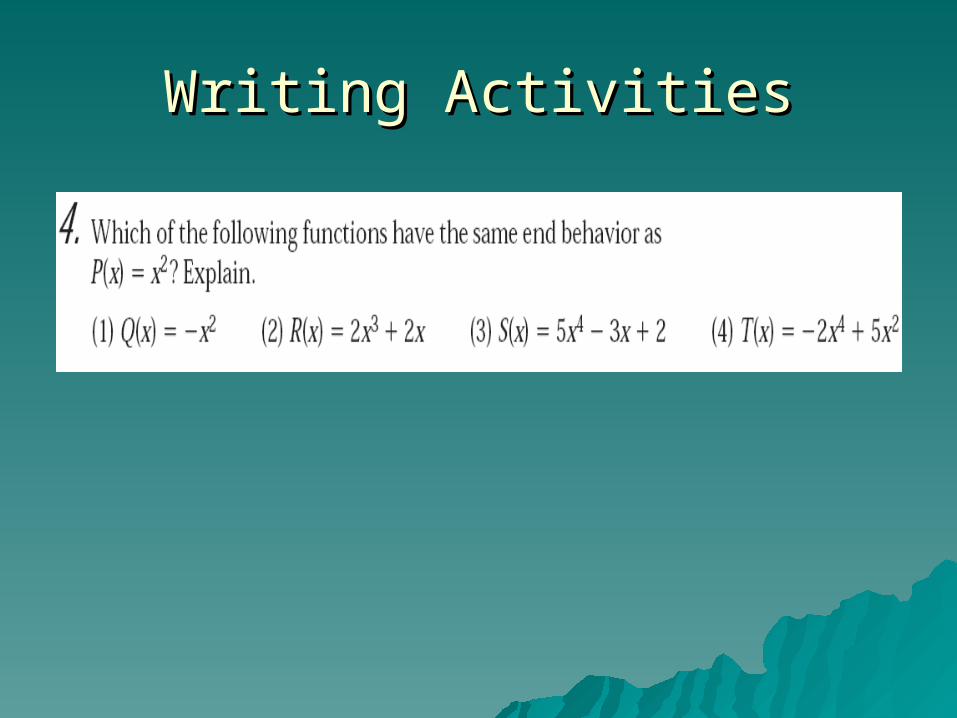
Writing ActivitiesWriting Activities
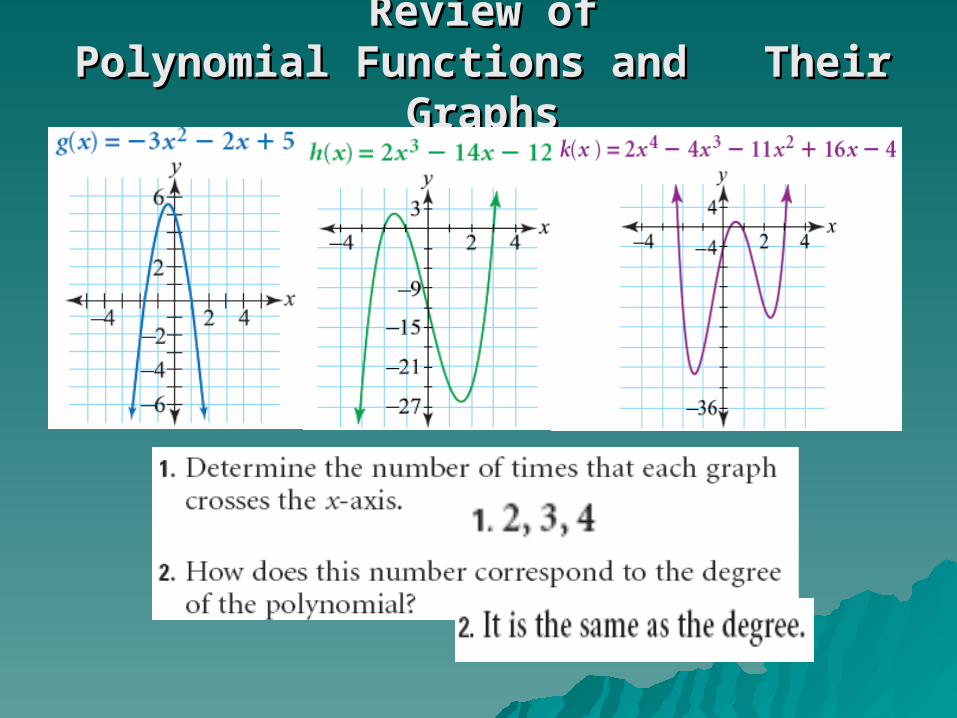
Review ofReview ofPolynomial Functions and Their GraphsPolynomial Functions and Their Graphs
Homework
Integrated Algebra II- Section 7.2 Level A
Academic Algebra II- Section 7.2 Level B