Embed Size (px)
Citation preview
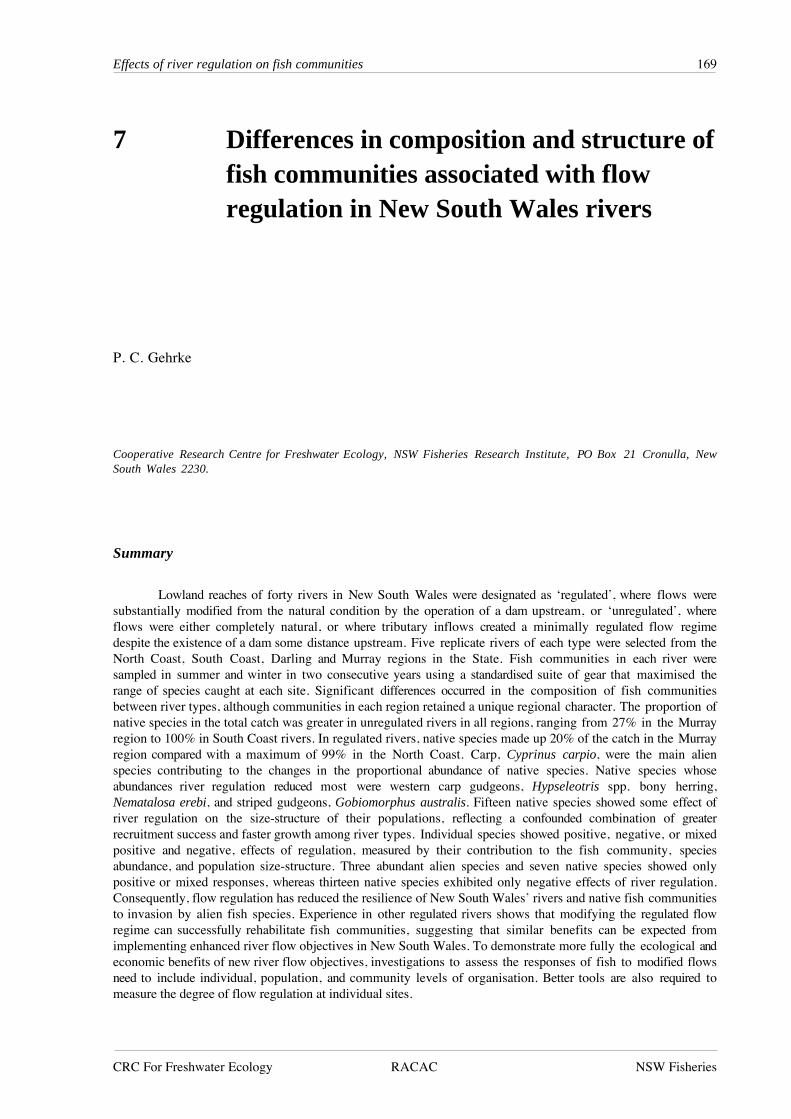
Effects of river regulation on fish communities 169
CRC For Freshwater Ecology RACAC NSW Fisheries
7 Differences in composition and structure offish communities associated with flowregulation in New South Wales rivers
P. C. Gehrke
Cooperative Research Centre for Freshwater Ecology, NSW Fisheries Research Institute, PO Box 21 Cronulla, NewSouth Wales 2230.
Summary
Lowland reaches of forty rivers in New South Wales were designated as ‘regulated’, where flows weresubstantially modified from the natural condition by the operation of a dam upstream, or ‘unregulated’, whereflows were either completely natural, or where tributary inflows created a minimally regulated flow regimedespite the existence of a dam some distance upstream. Five replicate rivers of each type were selected from theNorth Coast, South Coast, Darling and Murray regions in the State. Fish communities in each river weresampled in summer and winter in two consecutive years using a standardised suite of gear that maximised therange of species caught at each site. Significant differences occurred in the composition of fish communitiesbetween river types, although communities in each region retained a unique regional character. The proportion ofnative species in the total catch was greater in unregulated rivers in all regions, ranging from 27% in the Murrayregion to 100% in South Coast rivers. In regulated rivers, native species made up 20% of the catch in the Murrayregion compared with a maximum of 99% in the North Coast. Carp, Cyprinus carpio, were the main alienspecies contributing to the changes in the proportional abundance of native species. Native species whoseabundances river regulation reduced most were western carp gudgeons, Hypseleotris spp. bony herring,Nematalosa erebi, and striped gudgeons, Gobiomorphus australis. Fifteen native species showed some effect ofriver regulation on the size-structure of their populations, reflecting a confounded combination of greaterrecruitment success and faster growth among river types. Individual species showed positive, negative, or mixedpositive and negative, effects of regulation, measured by their contribution to the fish community, speciesabundance, and population size-structure. Three abundant alien species and seven native species showed onlypositive or mixed responses, whereas thirteen native species exhibited only negative effects of river regulation.Consequently, flow regulation has reduced the resilience of New South Wales’ rivers and native fish communitiesto invasion by alien fish species. Experience in other regulated rivers shows that modifying the regulated flowregime can successfully rehabilitate fish communities, suggesting that similar benefits can be expected fromimplementing enhanced river flow objectives in New South Wales. To demonstrate more fully the ecological andeconomic benefits of new river flow objectives, investigations to assess the responses of fish to modified flowsneed to include individual, population, and community levels of organisation. Better tools are also required tomeasure the degree of flow regulation at individual sites.
170 NSW Rivers Survey
CRC For Freshwater Ecology RACAC
INTRODUCTION
Regulation of stream flow by dams which impound water that would otherwise provide
flow downstream is a major cause of degradation in aquatic riverine ecosystems around the world
(Bain et al. 1988; Merron et al. 1993; Garcia de Jalon et al. 1994; Gehrke et al. 1995; Humphries
et al. 1996; Zhong and Power 1996). Ecological effects of flow regulation in Australia include
changes in populations of freshwater crayfish (Geddes 1990), mussels and snails (Walker 1992;
Walker et al. 1992), fish (Cadwallader 1978; Harris 1988; Cadwallader and Lawrence 1990), and
declining species diversity in fish communities (Gehrke et al. 1995). Apart from reducing the
amount of flow in affected rivers, flow regulation also typically alters the variability of natural
flow regimes on hourly, daily, monthly, seasonal, interannual, and longer time-scales. The natural
fauna within a river system is adapted to natural fluctuations in environmental conditions, so that
altered stability in stream flow due to river regulation may disturb environmentally-cued
reproductive cycles (Ward and Stanford 1989). In this way, the altered frequency of disturbance
due to either high or low flows in regulated rivers may cause a decline in species diversity as
suggested by the intermediate-disturbance hypothesis (Connell 1978; Ward and Stanford 1983).
Effects of flow regulation on riverine communities may differ according to the type of
shift in flow regime created by regulation. For example, rivers that are regulated principally to
provide water for irrigation during seasons of low rainfall, such as the Murrumbidgee River,
maintain a highly seasonal flow that is out of phase with the natural seasonal flow cycle (Merron et
al. 1993; Walker and Thoms 1993; Gehrke et al. 1995). In these situations, the natural river
channel is the major conduit of water for downstream use. The storage capacity of dams absorbs
small to intermediate-size floods and water extraction reduces the mean annual flow volume. In
contrast, rivers that are regulated to generate hydroelectricity experience highly erratic flows on a
daily basis (Boon 1993; Comargo 1993; Moog 1993; Garcia de Jalon et al. 1994; Sear 1994;
Travnichek et al. 1995) according to demand within the power grid. Large urban populations
require a much more constant water supply, which is commonly extracted either directly from the
reservoir through pipes, or by releasing water downstream to a pumping basin. In either case,
downstream flows are commonly minimal and relatively stable (Ibañez et al. 1995; Gehrke et al.
1996).
In New South Wales, where rivers are regulated for all of these reasons, observed effects of
flow regulation on fish communities are likely to differ among geographical regions according
both to, the nature of changes to flow regimes brought about by flow regulation, and to the
sensitivity of individual species and entire fish communities to departures from natural flows. This
Effects of river regulation on fish communities 171
NSW Fisheries - Office of Conservation
study examines differences in fish communities between regulated and unregulated rivers to
identify likely effects of regulation on fish resources, and to consider ways in which partial
restoration of natural flows may reverse some of these effects.
METHODS
Lowland river reaches in New South Wales were classified as either ‘regulated’, where
flows were substantially modified from the natural condition by the operation of a dam upstream,
or ‘unregulated’, where flows were either completely natural, or where tributary inflows create a
minimally regulated flow regime despite the existence of a dam some distance upstream. The
terminology adopted here differs from the legislative definitions applied by the NSW Water Act,
which define regulated rivers as those rivers where flows are regulated by dams owned or operated
by the Department of Land and Water Conservation. Consequently, some sites designated as
regulated in this study are identified as unregulated by NSW legislation. Similarly, the definitions
adopted for this study pre-date the terminology of ‘controlled’ and ‘uncontrolled’ rivers used for
the purpose of setting river flow objectives for the NSW Water Reform Package announced by the
Government in August 1997.
None of these simple classifications adequately reflects the continuum of river-regulation
intensity in New South Wales rivers. This continuum ranges from river reaches whose flows are
totally unmodified from the natural condition, to rivers whose flows are completely determined by
dam releases. However, neither the methods nor the data existed during the initial stages of this
project to classify lowland rivers in New South Wales according to their degree of regulation.
Consequently, lowland rivers were simply classified subjectively according to whether their flows
were predominantly regulated or unregulated. For this reason, river reaches nominally classified as
regulated represent a range of regulated flow regimes, and conversely, nominal unregulated rivers
include reaches whose flows are not modified by dams, as well as some whose flows may be
altered by dam releases, extraction, or by impoundment in weirs from time to time. It was difficult
to find five replicate, truly unregulated lowland rivers in the two inland regions, so that the rivers
selected represent a random selection of the least-regulated rivers. For convenience throughout
this report, these minimally regulated rivers are referred to as unregulated, and are compared to
other regulated rivers which are, in comparison, heavily regulated. Comparisons between these
river-reach types therefore indicate differences in fish communities between opposite ends of the
continuum of flow regulation.
172 NSW Rivers Survey
CRC For Freshwater Ecology RACAC
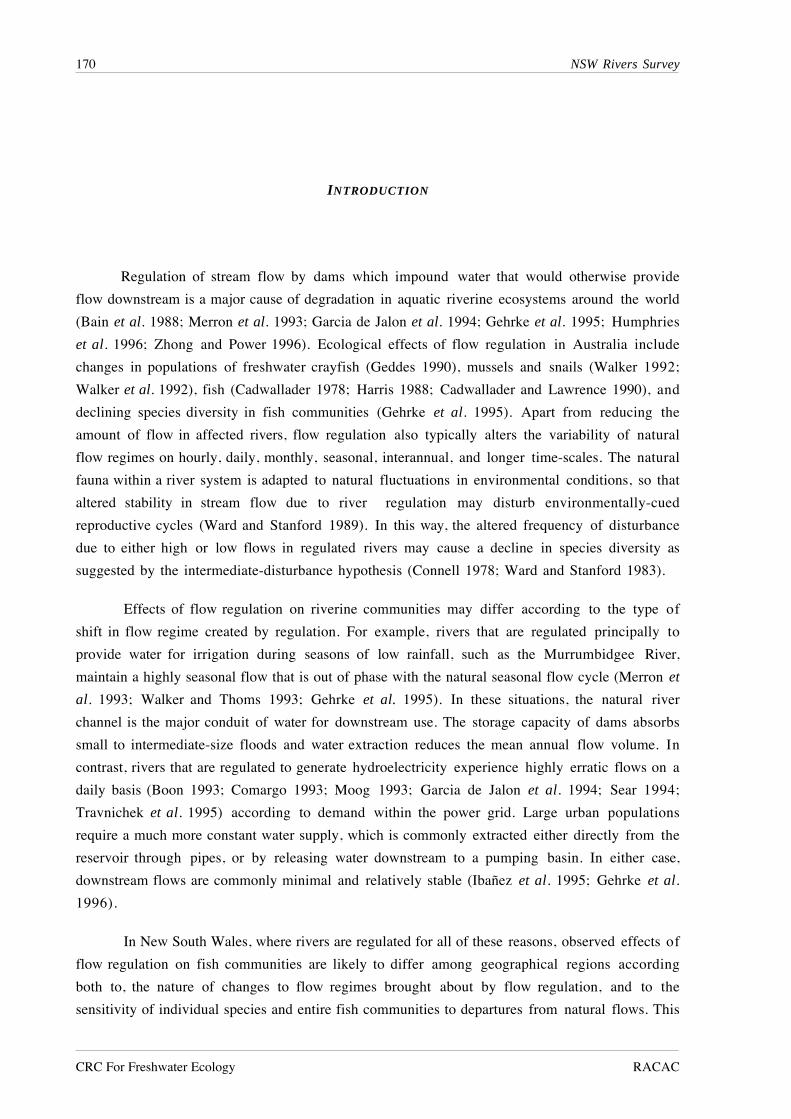
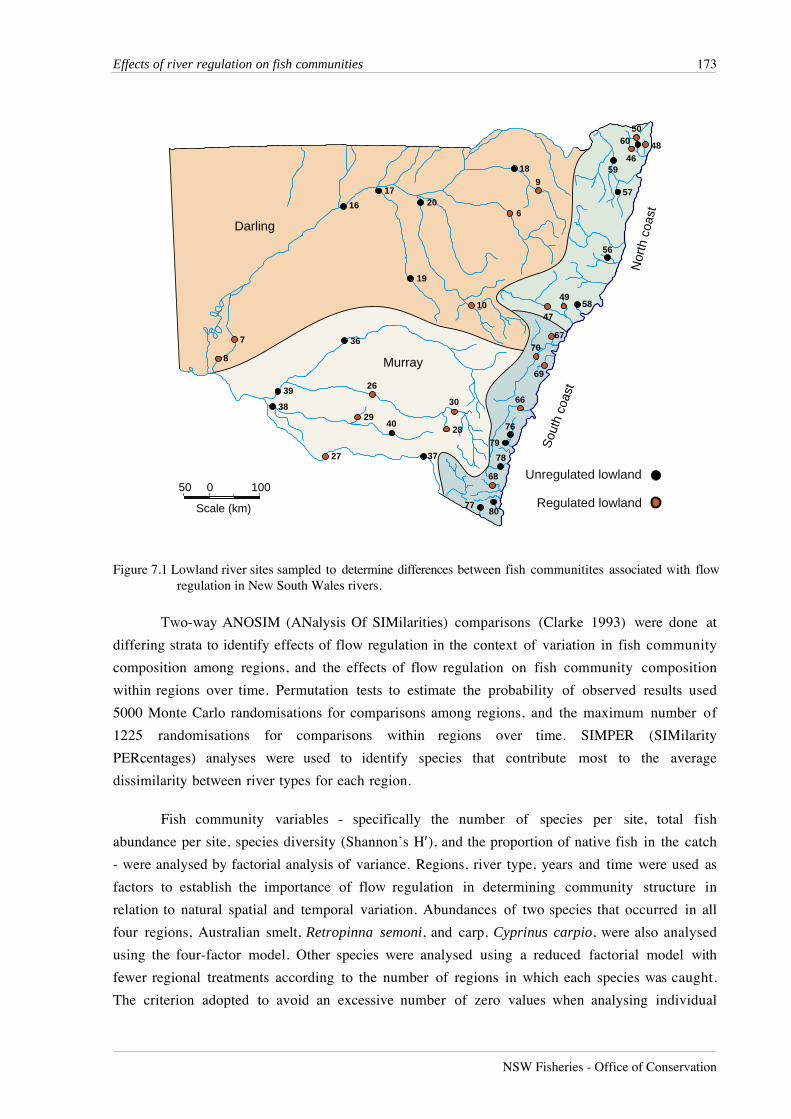
Forty river reaches were selected for this study. Sites were selected as described in
Chapter 1, from rivers in the North Coast, South Coast, Darling and Murray regions in New South
Wales. Lowland rivers were defined as rivers below 300 m altitude in the Murray and Darling
regions, or between 40 m altitude and the upper tidal limit in coastal regions. Within each region,
five replicate reaches of each river type were selected using a modified random process that
avoided selecting sites that had been extensively examined in other projects by NSW Fisheries.
This process also selected three sites that were highly degraded and lacked water, necessitating
rejection of these sites for the purposes of this study and selection of replacement, random sites.
Sites used for this analysis are shown in Figure 7.1. For a full description of these sites see
Chapter 2.
Fish were caught by applying a standardised suite of quantitative sampling methods at
each site, including ten 2-minute duration shots from a boat electrofisher, three fyke nets, three
multimesh gill nets, and nine small-meshed wire bait traps to sample small fish species. For details
of how these methods were applied and standardised, refer to Chapter 1. The unit of sampling
effort used for comparisons in this study was the pooled catch from all sampling methods,
including eels that were recorded as observed, to represent an estimate of the total fish community
at each site. Variability and selectivity among gear types is presented separately (Chapter 10).
Sites were sampled twice yearly over two years to obtain an indication of variability in fish
communities within and between years. The sample design therefore provided four factors for
analysis: river type (regulated, unregulated); regions (4), years (2) and times (2). Data were
analysed using a variety of techniques. Fish community data were analysed using PRIMER 4.0
(Plymouth Marine Laboratory) to perform hierarchical agglomerative classification analysis and
multi-dimensional scaling (MDS) ordinations. These analyses were done at two levels, with
differing degrees of pooling, to conform to the data limits in PRIMER. Primary analyses of all
forty sites used catch data that were pooled over the four sampling times. Secondary analyses of
ten sites within each region used data that were not pooled over times of sampling to include
information on possible temporal effects of flow regulation. Species abundances were transformed
to the fourth root, and similarities were calculated using the Bray-Curtis similarity measure (Bray
and Curtis 1957). The fourth root transformation has the advantage that, as it is a power
transformation, similarities calculated using the Bray-Curtis measure are invariant to the scale of
measurement (Stephenson and Burgess, 1980). Both classification and ordination were done on
similarities among sites, as determined from relative species abundances, as well as inverse analyses
of similarities among species, as determined from sites in which they occurred. All classifications
used the group-average linking algorithm.
Effects of river regulation on fish communities 173
NSW Fisheries - Office of Conservation
Two-way ANOSIM (ANalysis Of SIMilarities) comparisons (Clarke 1993) were done at
differing strata to identify effects of flow regulation in the context of variation in fish community
composition among regions, and the effects of flow regulation on fish community composition
within regions over time. Permutation tests to estimate the probability of observed results used
5000 Monte Carlo randomisations for comparisons among regions, and the maximum number of
1225 randomisations for comparisons within regions over time. SIMPER (SIMilarity
PERcentages) analyses were used to identify species that contribute most to the average
dissimilarity between river types for each region.
Fish community variables - specifically the number of species per site, total fish
abundance per site, species diversity (Shannon’s H′), and the proportion of native fish in the catch
- were analysed by factorial analysis of variance. Regions, river type, years and time were used as
factors to establish the importance of flow regulation in determining community structure in
relation to natural spatial and temporal variation. Abundances of two species that occurred in all
four regions, Australian smelt, Retropinna semoni, and carp, Cyprinus carpio, were also analysed
using the four-factor model. Other species were analysed using a reduced factorial model with
fewer regional treatments according to the number of regions in which each species was caught.
The criterion adopted to avoid an excessive number of zero values when analysing individual
50 0 100
Scale (km) Regulated lowland
Unregulated lowland
Darling
Murray
Nor
th c
oast
Sou
th c
oast
6
7
8
9
10
16
17
18
19
20
26
27
2829
30
36
37
38
39
40
46
47
48
49
50
56
57
58
59
60
66
67
68
69
70
76
77
78
79
80
Figure 7.1 Lowland river sites sampled to determine differences between fish communitites associated with flowregulation in New South Wales rivers.
174 NSW Rivers Survey
CRC For Freshwater Ecology RACAC
species was that at least 50 individuals must have been caught during the study. Abundance data
were transformed to log10 (x+1) to homogenise variances and to ensure that variances were
independent of treatment means. Transformation was not necessary in all cases, and in a minority
of cases, transformation was not successful in producing homogeneous variances (Cochran’s test).
However, the most consistent interpretations were achieved by applying the same transformation to
all abundance data. The arc-sine transformation was used for analysing the proportion of native
fish in the catch.
In addition to community composition and species abundances, the population size-
structure was compared between regulated and unregulated rivers using Kolmogorov-Smirnov
two-tailed tests for all species where more than 30 individuals were caught from each river type.
Separate tests were done for each region.
RESULTS
A total of 27,495 fish from 51 species was recorded from lowland river reaches during this
study (Table 7.1). Australian smelt was the most abundant species, followed by bony herring,
Nematalosa erebi, western carp gudgeons, Hypseleotris spp., empire gudgeon, Hypseleotris
compressa, and carp. Five species - Carcharhinus leucas, Craterocephalus fluviatilis,
Gnathanodon speciosus, Platycephalus fuscus and Redigobious macrostoma, were caught only
once, while fewer than 10 individuals were caught for an additional seven species.
Effects of river regulation on fish communities 175
NSW Fisheries - Office of Conservation
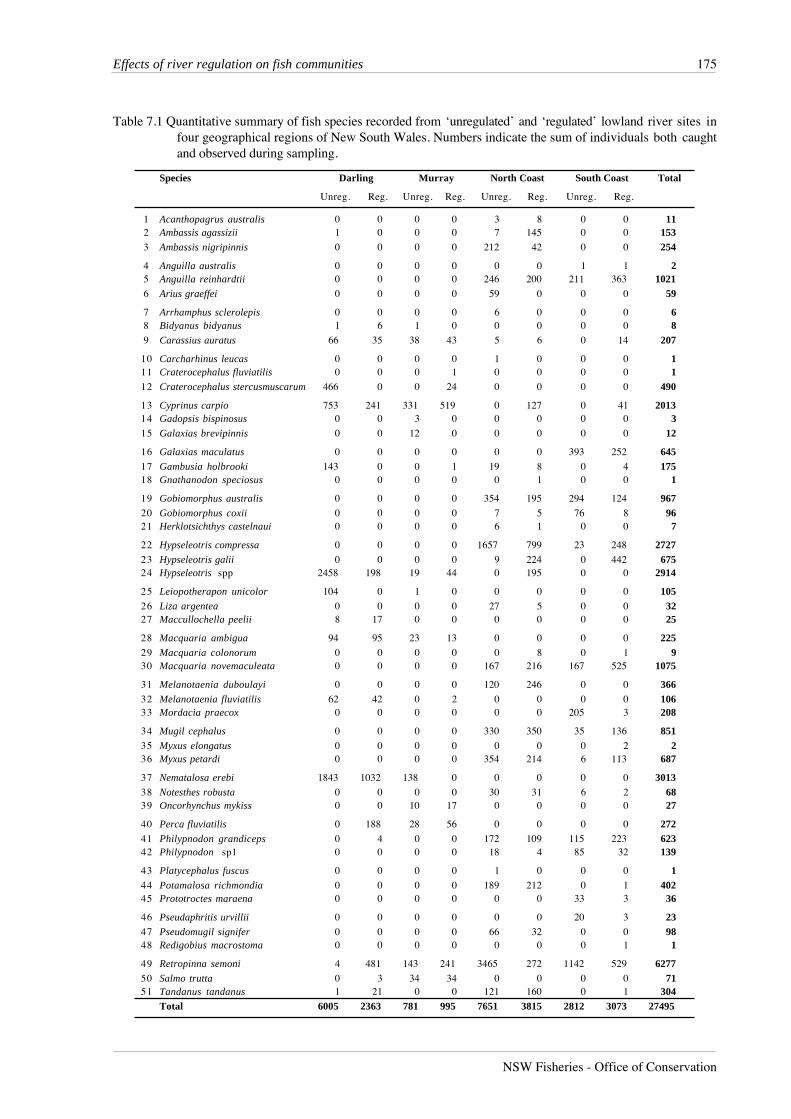
Table 7.1 Quantitative summary of fish species recorded from ‘unregulated’ and ‘regulated’ lowland river sites infour geographical regions of New South Wales. Numbers indicate the sum of individuals both caughtand observed during sampling.
Species Darling Murray North Coast South Coast Total
Unreg. Reg. Unreg. Reg. Unreg. Reg. Unreg. Reg.
1 Acanthopagrus australis 0 0 0 0 3 8 0 0 11 2 Ambassis agassizii 1 0 0 0 7 145 0 0 153 3 Ambassis nigripinnis 0 0 0 0 212 42 0 0 254
4 Anguilla australis 0 0 0 0 0 0 1 1 2 5 Anguilla reinhardtii 0 0 0 0 246 200 211 363 1021 6 Arius graeffei 0 0 0 0 59 0 0 0 59
7 Arrhamphus sclerolepis 0 0 0 0 6 0 0 0 6 8 Bidyanus bidyanus 1 6 1 0 0 0 0 0 8 9 Carassius auratus 66 35 38 43 5 6 0 14 207
10 Carcharhinus leucas 0 0 0 0 1 0 0 0 1 11 Craterocephalus fluviatilis 0 0 0 1 0 0 0 0 1 12 Craterocephalus stercusmuscarum 466 0 0 24 0 0 0 0 490
13 Cyprinus carpio 753 241 331 519 0 127 0 41 2013 14 Gadopsis bispinosus 0 0 3 0 0 0 0 0 3 15 Galaxias brevipinnis 0 0 12 0 0 0 0 0 12
16 Galaxias maculatus 0 0 0 0 0 0 393 252 645 17 Gambusia holbrooki 143 0 0 1 19 8 0 4 175 18 Gnathanodon speciosus 0 0 0 0 0 1 0 0 1
19 Gobiomorphus australis 0 0 0 0 354 195 294 124 967 20 Gobiomorphus coxii 0 0 0 0 7 5 76 8 96 21 Herklotsichthys castelnaui 0 0 0 0 6 1 0 0 7
22 Hypseleotris compressa 0 0 0 0 1657 799 23 248 2727 23 Hypseleotris galii 0 0 0 0 9 224 0 442 675 24 Hypseleotris spp 2458 198 19 44 0 195 0 0 2914
25 Leiopotherapon unicolor 104 0 1 0 0 0 0 0 105 26 Liza argentea 0 0 0 0 27 5 0 0 32 27 Maccullochella peelii 8 17 0 0 0 0 0 0 25
28 Macquaria ambigua 94 95 23 13 0 0 0 0 225 29 Macquaria colonorum 0 0 0 0 0 8 0 1 9 30 Macquaria novemaculeata 0 0 0 0 167 216 167 525 1075
31 Melanotaenia duboulayi 0 0 0 0 120 246 0 0 366 32 Melanotaenia fluviatilis 62 42 0 2 0 0 0 0 106 33 Mordacia praecox 0 0 0 0 0 0 205 3 208
34 Mugil cephalus 0 0 0 0 330 350 35 136 851 35 Myxus elongatus 0 0 0 0 0 0 0 2 2 36 Myxus petardi 0 0 0 0 354 214 6 113 687
37 Nematalosa erebi 1843 1032 138 0 0 0 0 0 3013 38 Notesthes robusta 0 0 0 0 30 31 6 2 68 39 Oncorhynchus mykiss 0 0 10 17 0 0 0 0 27
40 Perca fluviatilis 0 188 28 56 0 0 0 0 272 41 Philypnodon grandiceps 0 4 0 0 172 109 115 223 623 42 Philypnodon sp1 0 0 0 0 18 4 85 32 139
43 Platycephalus fuscus 0 0 0 0 1 0 0 0 1 44 Potamalosa richmondia 0 0 0 0 189 212 0 1 402 45 Prototroctes maraena 0 0 0 0 0 0 33 3 36
46 Pseudaphritis urvillii 0 0 0 0 0 0 20 3 23 47 Pseudomugil signifer 0 0 0 0 66 32 0 0 98 48 Redigobius macrostoma 0 0 0 0 0 0 0 1 1
49 Retropinna semoni 4 481 143 241 3465 272 1142 529 6277 50 Salmo trutta 0 3 34 34 0 0 0 0 71 51 Tandanus tandanus 1 21 0 0 121 160 0 1 304
Total 6005 2363 781 995 7651 3815 2812 3073 27495
176 NSW Rivers Survey
CRC For Freshwater Ecology RACAC
Composition of fish communities among regions and between river types
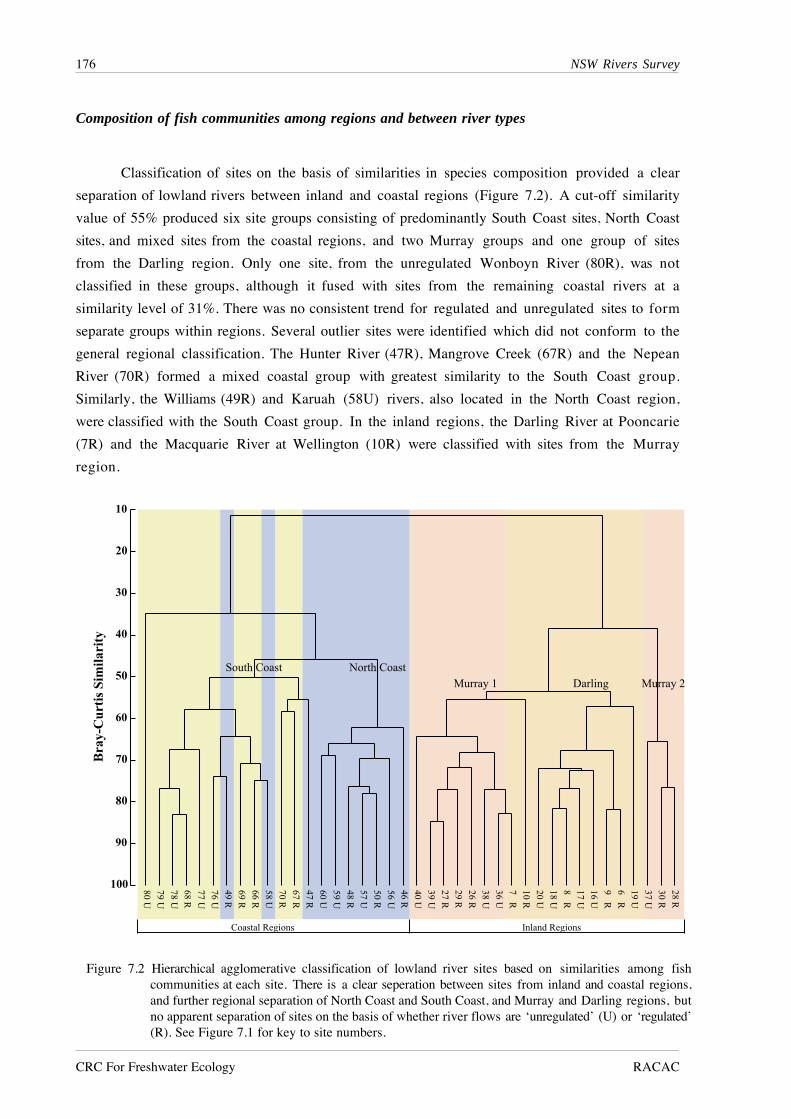
Classification of sites on the basis of similarities in species composition provided a clear
separation of lowland rivers between inland and coastal regions (Figure 7.2). A cut-off similarity
value of 55% produced six site groups consisting of predominantly South Coast sites, North Coast
sites, and mixed sites from the coastal regions, and two Murray groups and one group of sites
from the Darling region. Only one site, from the unregulated Wonboyn River (80R), was not
classified in these groups, although it fused with sites from the remaining coastal rivers at a
similarity level of 31%. There was no consistent trend for regulated and unregulated sites to form
separate groups within regions. Several outlier sites were identified which did not conform to the
general regional classification. The Hunter River (47R), Mangrove Creek (67R) and the Nepean
River (70R) formed a mixed coastal group with greatest similarity to the South Coast group.
Similarly, the Williams (49R) and Karuah (58U) rivers, also located in the North Coast region,
were classified with the South Coast group. In the inland regions, the Darling River at Pooncarie
(7R) and the Macquarie River at Wellington (10R) were classified with sites from the Murray
region.
Figure 7.2 Hierarchical agglomerative classification of lowland river sites based on similarities among fishcommunities at each site. There is a clear seperation between sites from inland and coastal regions,and further regional separation of North Coast and South Coast, and Murray and Darling regions, butno apparent separation of sites on the basis of whether river flows are ‘unregulated’ (U) or ‘regulated’(R). See Figure 7.1 for key to site numbers.
Effects of river regulation on fish communities 177
NSW Fisheries - Office of Conservation
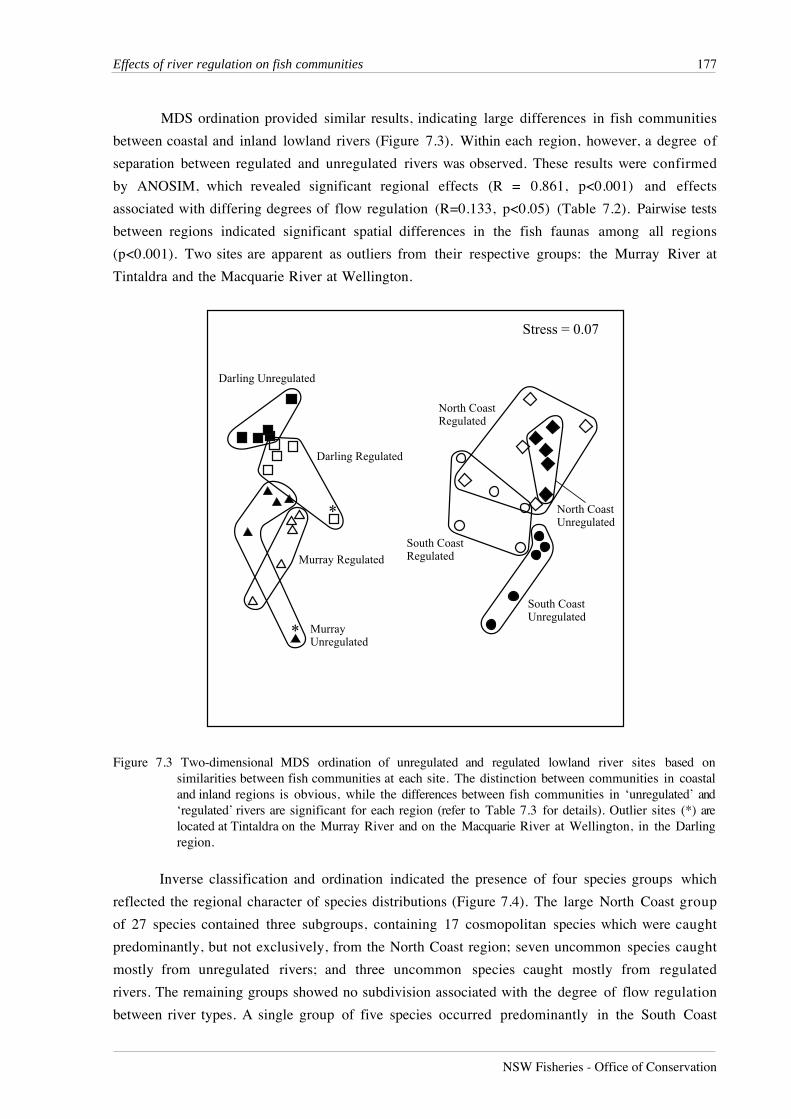
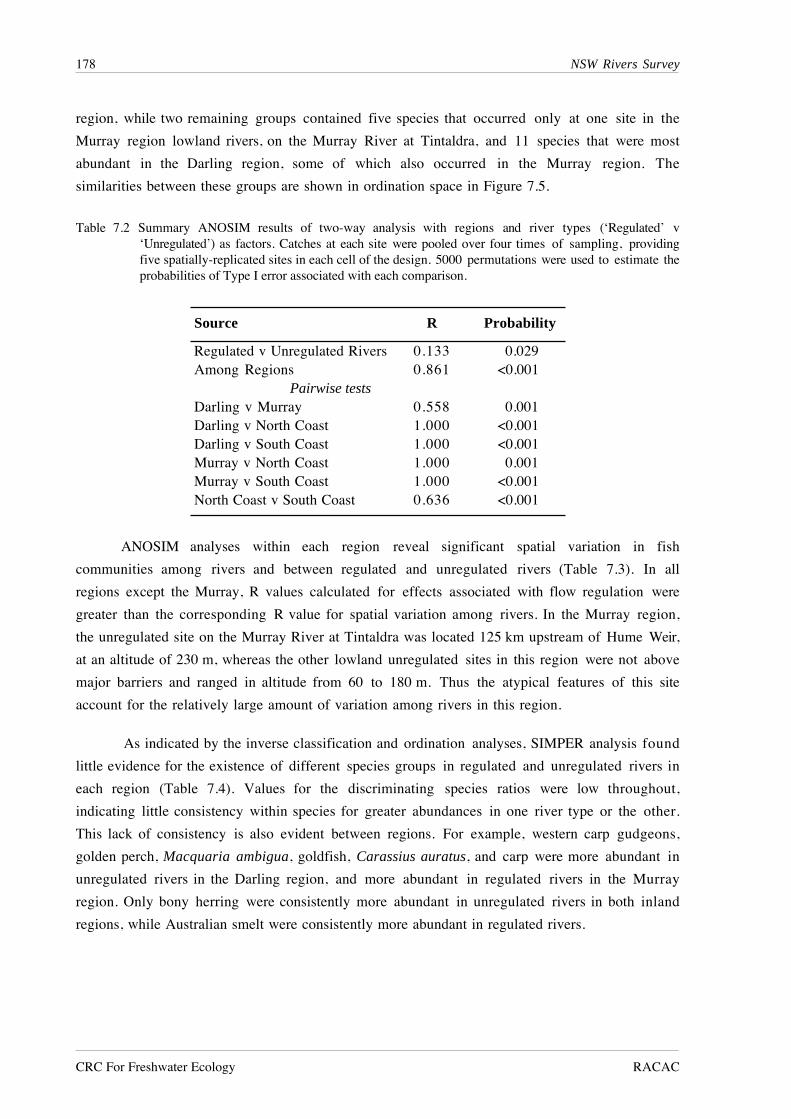
MDS ordination provided similar results, indicating large differences in fish communities
between coastal and inland lowland rivers (Figure 7.3). Within each region, however, a degree of
separation between regulated and unregulated rivers was observed. These results were confirmed
by ANOSIM, which revealed significant regional effects (R = 0.861, p<0.001) and effects
associated with differing degrees of flow regulation (R=0.133, p<0.05) (Table 7.2). Pairwise tests
between regions indicated significant spatial differences in the fish faunas among all regions
(p<0.001). Two sites are apparent as outliers from their respective groups: the Murray River at
Tintaldra and the Macquarie River at Wellington.
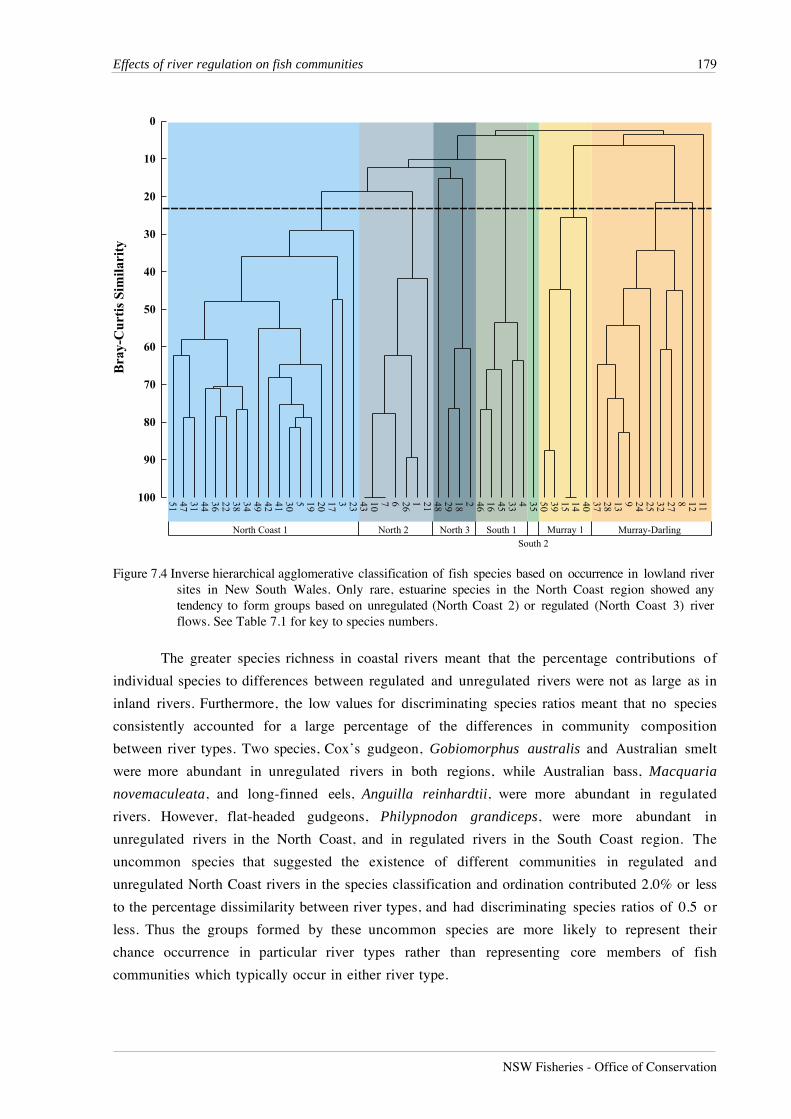
Inverse classification and ordination indicated the presence of four species groups which
reflected the regional character of species distributions (Figure 7.4). The large North Coast group
of 27 species contained three subgroups, containing 17 cosmopolitan species which were caught
predominantly, but not exclusively, from the North Coast region; seven uncommon species caught
mostly from unregulated rivers; and three uncommon species caught mostly from regulated
rivers. The remaining groups showed no subdivision associated with the degree of flow regulation
between river types. A single group of five species occurred predominantly in the South Coast
Figure 7.3 Two-dimensional MDS ordination of unregulated and regulated lowland river sites based onsimilarities between fish communities at each site. The distinction between communities in coastaland inland regions is obvious, while the differences between fish communities in ‘unregulated’ and‘regulated’ rivers are significant for each region (refer to Table 7.3 for details). Outlier sites (*) arelocated at Tintaldra on the Murray River and on the Macquarie River at Wellington, in the Darlingregion.
178 NSW Rivers Survey
CRC For Freshwater Ecology RACAC
region, while two remaining groups contained five species that occurred only at one site in the
Murray region lowland rivers, on the Murray River at Tintaldra, and 11 species that were most
abundant in the Darling region, some of which also occurred in the Murray region. The
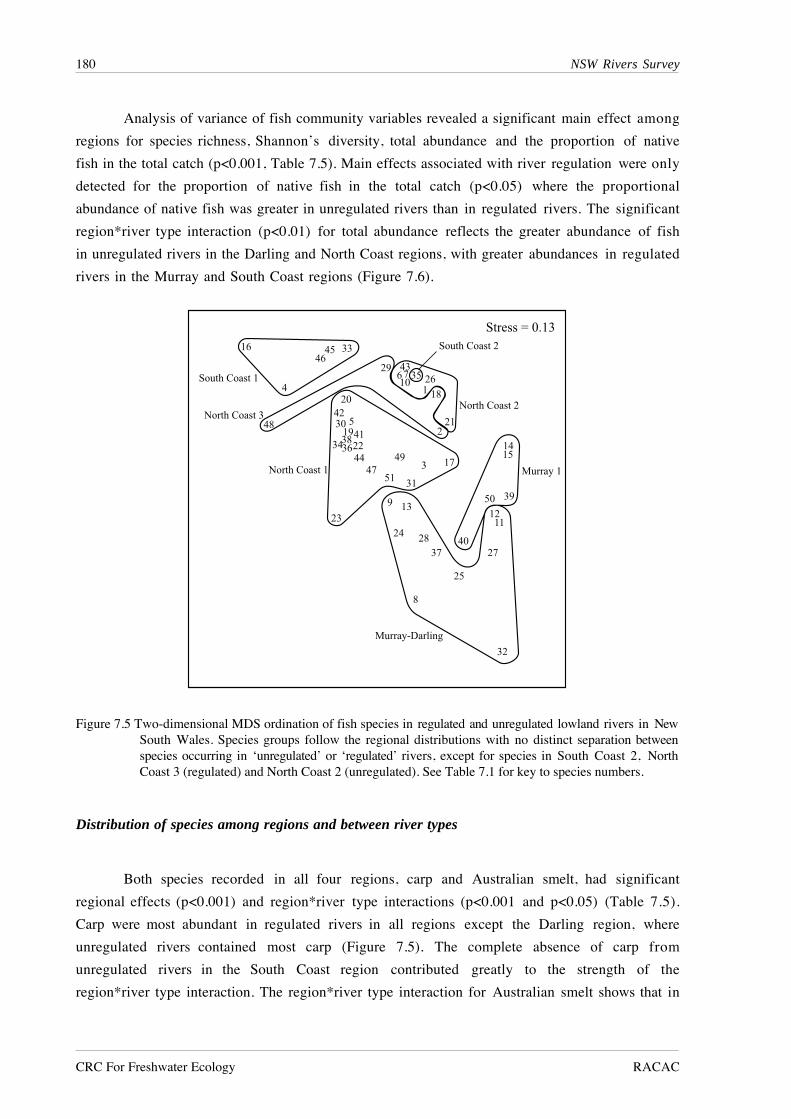
similarities between these groups are shown in ordination space in Figure 7.5.
ANOSIM analyses within each region reveal significant spatial variation in fish
communities among rivers and between regulated and unregulated rivers (Table 7.3). In all
regions except the Murray, R values calculated for effects associated with flow regulation were
greater than the corresponding R value for spatial variation among rivers. In the Murray region,
the unregulated site on the Murray River at Tintaldra was located 125 km upstream of Hume Weir,
at an altitude of 230 m, whereas the other lowland unregulated sites in this region were not above
major barriers and ranged in altitude from 60 to 180 m. Thus the atypical features of this site
account for the relatively large amount of variation among rivers in this region.
As indicated by the inverse classification and ordination analyses, SIMPER analysis found
little evidence for the existence of different species groups in regulated and unregulated rivers in
each region (Table 7.4). Values for the discriminating species ratios were low throughout,
indicating little consistency within species for greater abundances in one river type or the other.
This lack of consistency is also evident between regions. For example, western carp gudgeons,
golden perch, Macquaria ambigua, goldfish, Carassius auratus, and carp were more abundant in
unregulated rivers in the Darling region, and more abundant in regulated rivers in the Murray
region. Only bony herring were consistently more abundant in unregulated rivers in both inland
regions, while Australian smelt were consistently more abundant in regulated rivers.
Table 7.2 Summary ANOSIM results of two-way analysis with regions and river types (‘Regulated’ v‘Unregulated’) as factors. Catches at each site were pooled over four times of sampling, providingfive spatially-replicated sites in each cell of the design. 5000 permutations were used to estimate theprobabilities of Type I error associated with each comparison.
Source R Probability
Regulated v Unregulated Rivers 0.133 0.029 Among Regions 0.861 <0.001
Pairwise testsDarling v Murray 0.558 0.001 Darling v North Coast 1.000 <0.001 Darling v South Coast 1.000 <0.001 Murray v North Coast 1.000 0.001 Murray v South Coast 1.000 <0.001 North Coast v South Coast 0.636 <0.001
Effects of river regulation on fish communities 179
NSW Fisheries - Office of Conservation
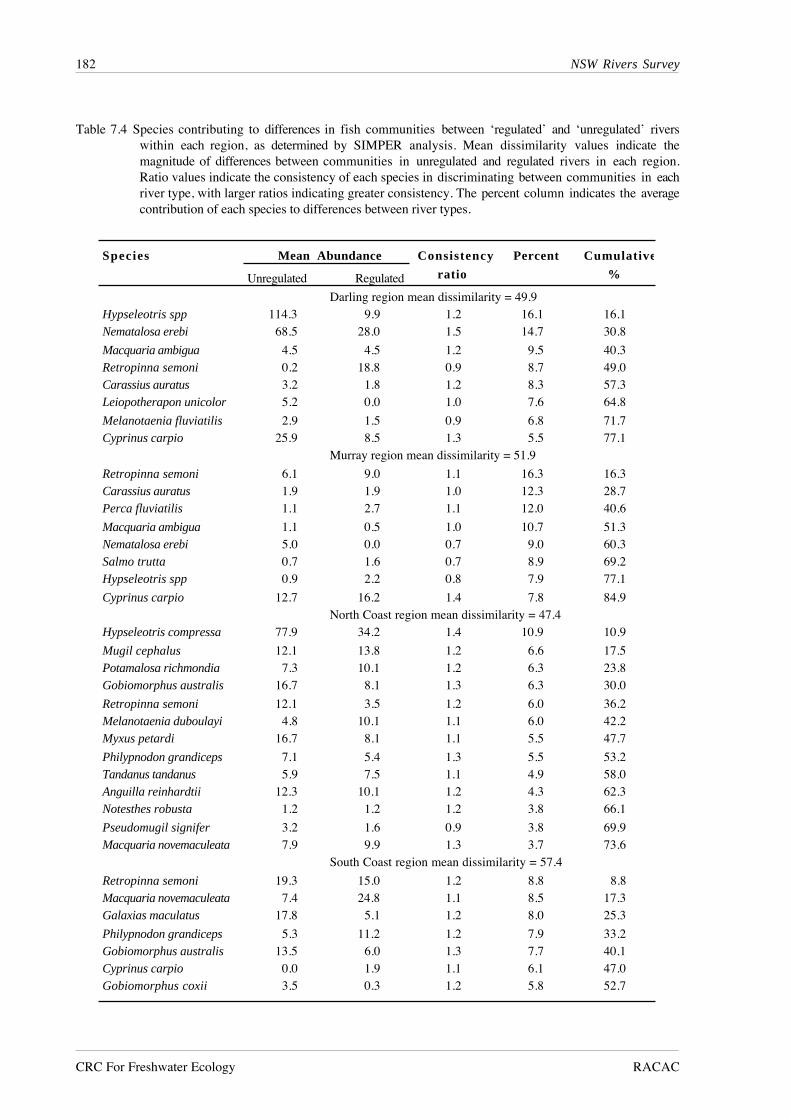
The greater species richness in coastal rivers meant that the percentage contributions of
individual species to differences between regulated and unregulated rivers were not as large as in
inland rivers. Furthermore, the low values for discriminating species ratios meant that no species
consistently accounted for a large percentage of the differences in community composition
between river types. Two species, Cox’s gudgeon, Gobiomorphus australis and Australian smelt
were more abundant in unregulated rivers in both regions, while Australian bass, Macquaria
novemaculeata, and long-finned eels, Anguilla reinhardtii, were more abundant in regulated
rivers. However, flat-headed gudgeons, Philypnodon grandiceps, were more abundant in
unregulated rivers in the North Coast, and in regulated rivers in the South Coast region. The
uncommon species that suggested the existence of different communities in regulated and
unregulated North Coast rivers in the species classification and ordination contributed 2.0% or less
to the percentage dissimilarity between river types, and had discriminating species ratios of 0.5 or
less. Thus the groups formed by these uncommon species are more likely to represent their
chance occurrence in particular river types rather than representing core members of fish
communities which typically occur in either river type.
Figure 7.4 Inverse hierarchical agglomerative classification of fish species based on occurrence in lowland riversites in New South Wales. Only rare, estuarine species in the North Coast region showed anytendency to form groups based on unregulated (North Coast 2) or regulated (North Coast 3) riverflows. See Table 7.1 for key to species numbers.
180 NSW Rivers Survey
CRC For Freshwater Ecology RACAC
Analysis of variance of fish community variables revealed a significant main effect among
regions for species richness, Shannon’s diversity, total abundance and the proportion of native
fish in the total catch (p<0.001, Table 7.5). Main effects associated with river regulation were only
detected for the proportion of native fish in the total catch (p<0.05) where the proportional
abundance of native fish was greater in unregulated rivers than in regulated rivers. The significant
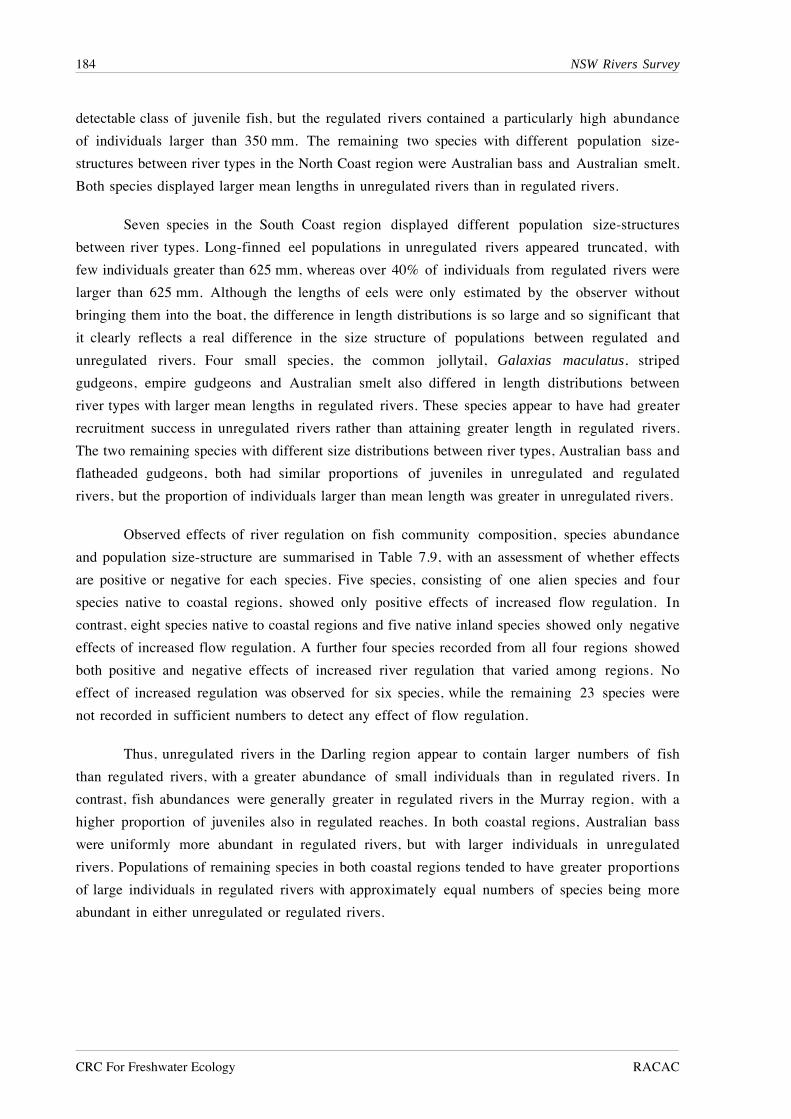
region*river type interaction (p<0.01) for total abundance reflects the greater abundance of fish
in unregulated rivers in the Darling and North Coast regions, with greater abundances in regulated
rivers in the Murray and South Coast regions (Figure 7.6).
Distribution of species among regions and between river types
Both species recorded in all four regions, carp and Australian smelt, had significant
regional effects (p<0.001) and region*river type interactions (p<0.001 and p<0.05) (Table 7.5).
Carp were most abundant in regulated rivers in all regions except the Darling region, where
unregulated rivers contained most carp (Figure 7.5). The complete absence of carp from
unregulated rivers in the South Coast region contributed greatly to the strength of the
region*river type interaction. The region*river type interaction for Australian smelt shows that in
Figure 7.5 Two-dimensional MDS ordination of fish species in regulated and unregulated lowland rivers in NewSouth Wales. Species groups follow the regional distributions with no distinct separation betweenspecies occurring in ‘unregulated’ or ‘regulated’ rivers, except for species in South Coast 2, NorthCoast 3 (regulated) and North Coast 2 (unregulated). See Table 7.1 for key to species numbers.
Effects of river regulation on fish communities 181
NSW Fisheries - Office of Conservation
both coastal regions, unregulated rivers had higher abundances than regulated rivers, but the
situation was reversed in the inland regions.
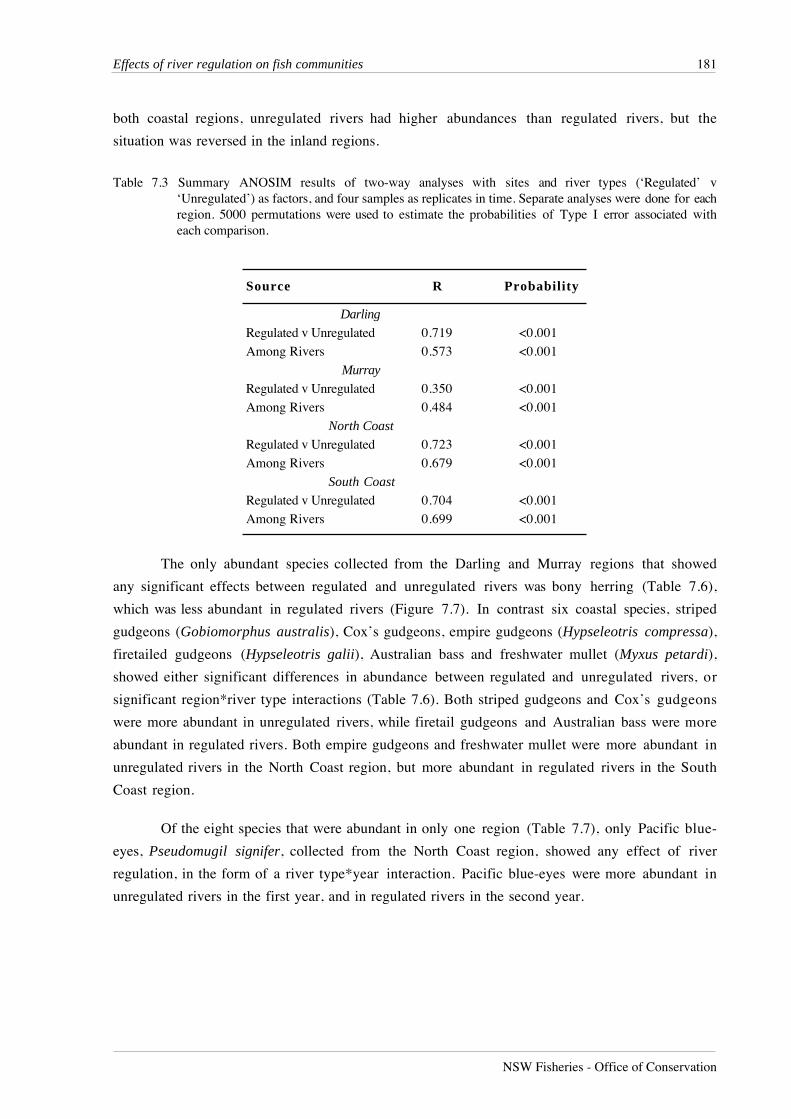
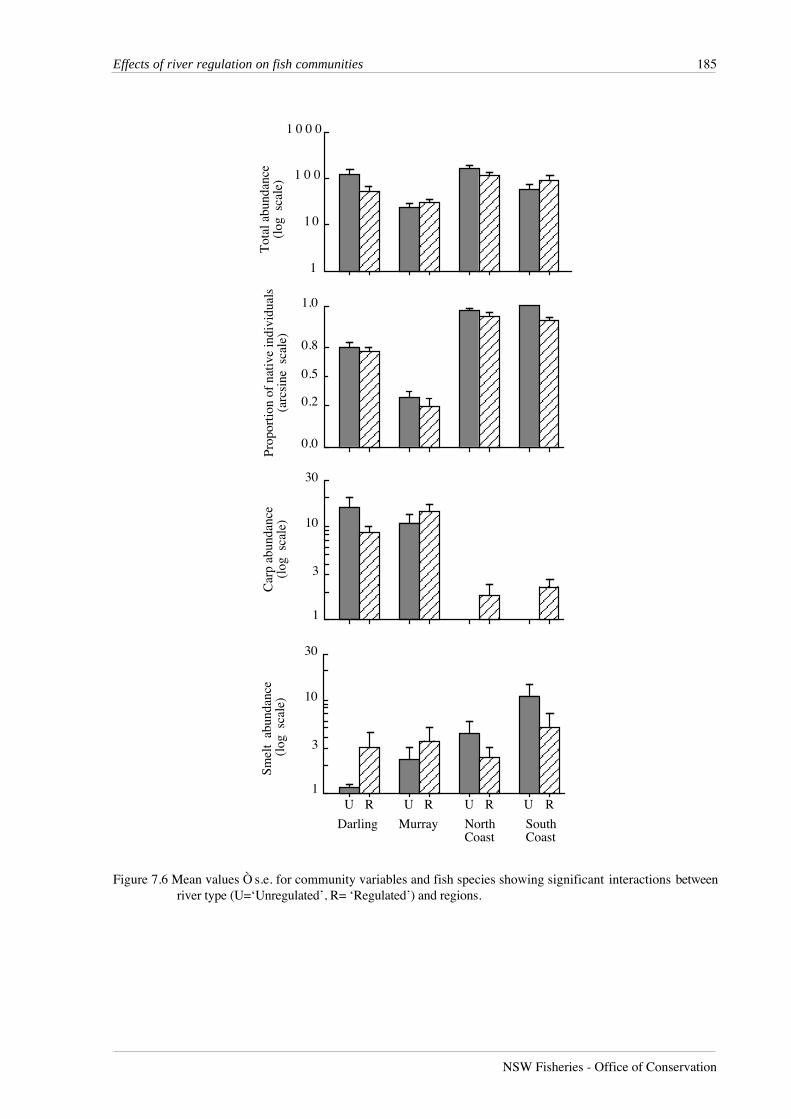
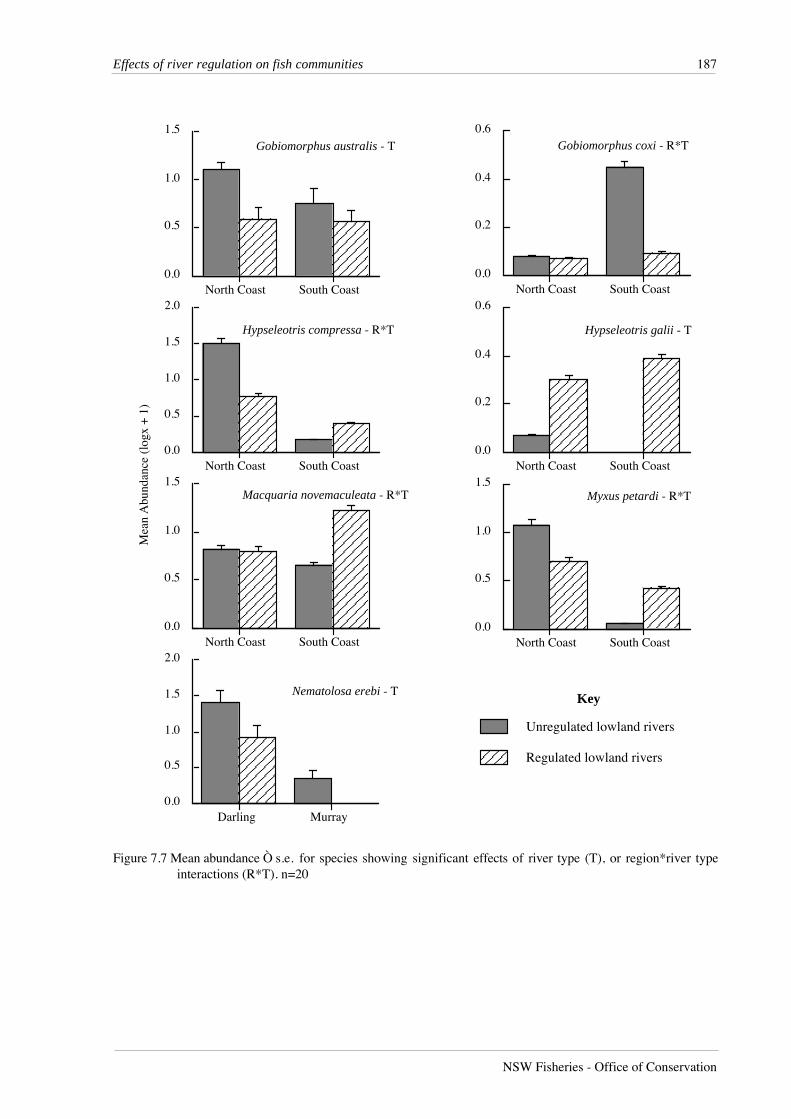
The only abundant species collected from the Darling and Murray regions that showed
any significant effects between regulated and unregulated rivers was bony herring (Table 7.6),
which was less abundant in regulated rivers (Figure 7.7). In contrast six coastal species, striped
gudgeons (Gobiomorphus australis), Cox’s gudgeons, empire gudgeons (Hypseleotris compressa),
firetailed gudgeons (Hypseleotris galii), Australian bass and freshwater mullet (Myxus petardi),
showed either significant differences in abundance between regulated and unregulated rivers, or
significant region*river type interactions (Table 7.6). Both striped gudgeons and Cox’s gudgeons
were more abundant in unregulated rivers, while firetail gudgeons and Australian bass were more
abundant in regulated rivers. Both empire gudgeons and freshwater mullet were more abundant in
unregulated rivers in the North Coast region, but more abundant in regulated rivers in the South
Coast region.
Of the eight species that were abundant in only one region (Table 7.7), only Pacific blue-
eyes, Pseudomugil signifer, collected from the North Coast region, showed any effect of river
regulation, in the form of a river type*year interaction. Pacific blue-eyes were more abundant in
unregulated rivers in the first year, and in regulated rivers in the second year.
Table 7.3 Summary ANOSIM results of two-way analyses with sites and river types (‘Regulated’ v‘Unregulated’) as factors, and four samples as replicates in time. Separate analyses were done for eachregion. 5000 permutations were used to estimate the probabilities of Type I error associated witheach comparison.
Source R Probability
Darling
Regulated v Unregulated 0.719 <0.001
Among Rivers 0.573 <0.001
Murray
Regulated v Unregulated 0.350 <0.001
Among Rivers 0.484 <0.001
North Coast
Regulated v Unregulated 0.723 <0.001
Among Rivers 0.679 <0.001
South Coast
Regulated v Unregulated 0.704 <0.001
Among Rivers 0.699 <0.001
182 NSW Rivers Survey
CRC For Freshwater Ecology RACAC
Table 7.4 Species contributing to differences in fish communities between ‘regulated’ and ‘unregulated’ riverswithin each region, as determined by SIMPER analysis. Mean dissimilarity values indicate themagnitude of differences between communities in unregulated and regulated rivers in each region.Ratio values indicate the consistency of each species in discriminating between communities in eachriver type, with larger ratios indicating greater consistency. The percent column indicates the averagecontribution of each species to differences between river types.
Species Mean Abundance Consistency Percent Cumulative
Unregulated Regulated ratio %
Darling region mean dissimilarity = 49.9Hypseleotris spp 114.3 9.9 1.2 16.1 16.1 Nematalosa erebi 68.5 28.0 1.5 14.7 30.8
Macquaria ambigua 4.5 4.5 1.2 9.5 40.3 Retropinna semoni 0.2 18.8 0.9 8.7 49.0 Carassius auratus 3.2 1.8 1.2 8.3 57.3 Leiopotherapon unicolor 5.2 0.0 1.0 7.6 64.8
Melanotaenia fluviatilis 2.9 1.5 0.9 6.8 71.7 Cyprinus carpio 25.9 8.5 1.3 5.5 77.1
Murray region mean dissimilarity = 51.9
Retropinna semoni 6.1 9.0 1.1 16.3 16.3 Carassius auratus 1.9 1.9 1.0 12.3 28.7 Perca fluviatilis 1.1 2.7 1.1 12.0 40.6
Macquaria ambigua 1.1 0.5 1.0 10.7 51.3 Nematalosa erebi 5.0 0.0 0.7 9.0 60.3 Salmo trutta 0.7 1.6 0.7 8.9 69.2 Hypseleotris spp 0.9 2.2 0.8 7.9 77.1
Cyprinus carpio 12.7 16.2 1.4 7.8 84.9 North Coast region mean dissimilarity = 47.4
Hypseleotris compressa 77.9 34.2 1.4 10.9 10.9
Mugil cephalus 12.1 13.8 1.2 6.6 17.5 Potamalosa richmondia 7.3 10.1 1.2 6.3 23.8 Gobiomorphus australis 16.7 8.1 1.3 6.3 30.0
Retropinna semoni 12.1 3.5 1.2 6.0 36.2 Melanotaenia duboulayi 4.8 10.1 1.1 6.0 42.2 Myxus petardi 16.7 8.1 1.1 5.5 47.7
Philypnodon grandiceps 7.1 5.4 1.3 5.5 53.2 Tandanus tandanus 5.9 7.5 1.1 4.9 58.0 Anguilla reinhardtii 12.3 10.1 1.2 4.3 62.3 Notesthes robusta 1.2 1.2 1.2 3.8 66.1
Pseudomugil signifer 3.2 1.6 0.9 3.8 69.9 Macquaria novemaculeata 7.9 9.9 1.3 3.7 73.6
South Coast region mean dissimilarity = 57.4
Retropinna semoni 19.3 15.0 1.2 8.8 8.8 Macquaria novemaculeata 7.4 24.8 1.1 8.5 17.3 Galaxias maculatus 17.8 5.1 1.2 8.0 25.3
Philypnodon grandiceps 5.3 11.2 1.2 7.9 33.2 Gobiomorphus australis 13.5 6.0 1.3 7.7 40.1 Cyprinus carpio 0.0 1.9 1.1 6.1 47.0 Gobiomorphus coxii 3.5 0.3 1.2 5.8 52.7
Effects of river regulation on fish communities 183
NSW Fisheries - Office of Conservation
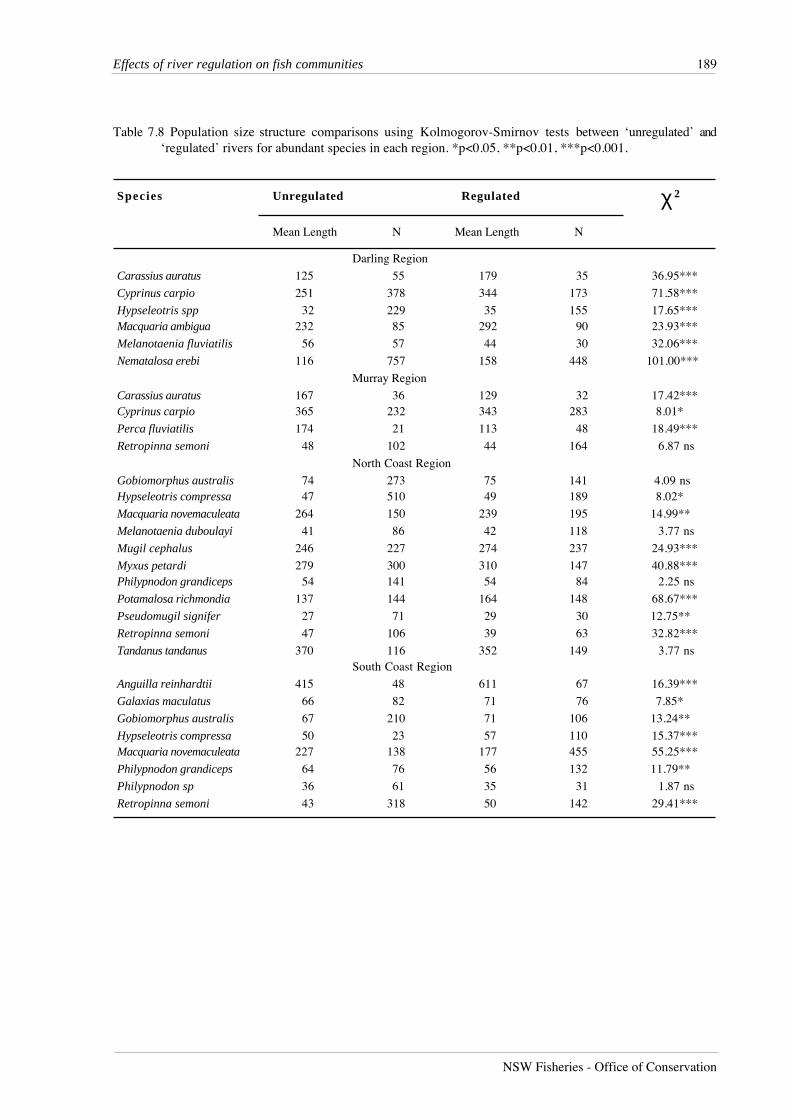
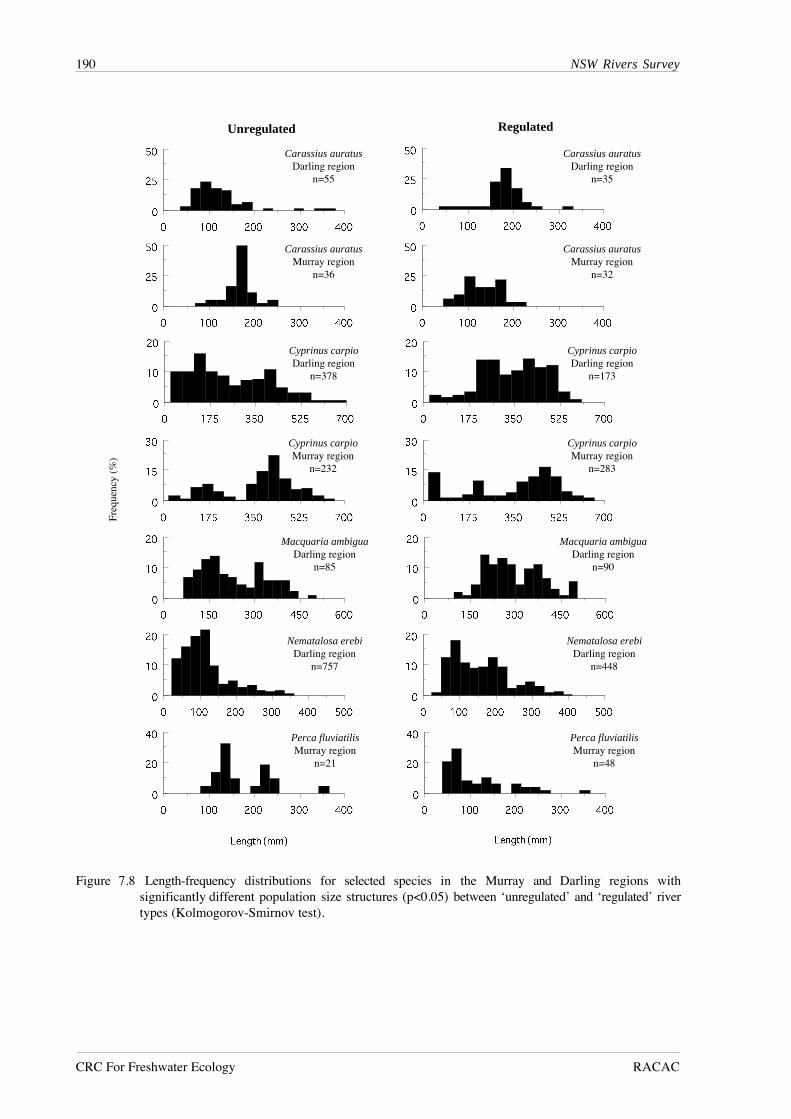
Population size structure
In the Darling region, all species abundant in both unregulated and regulated rivers had
significantly different population size-structures (p<0.001) between river types (Table 7.8),
reflecting the greater abundance of juveniles in unregulated rivers for all species (Figure 7.8),
both native and alien, except for crimson-spotted rainbowfish, Melanotaenia fluviatilis. This result
suggests higher recruitment success in unregulated rivers in the Darling region.
The situation was reversed in the Murray region, where all three species showing a
significant difference in population size structure contained a greater proportion of small
individuals in regulated rivers. These species, goldfish, carp and redfin perch, Perca fluviatilis, are
all alien species. The only abundant native species in this region, Australian smelt, showed no
significant difference in size structure between river types.
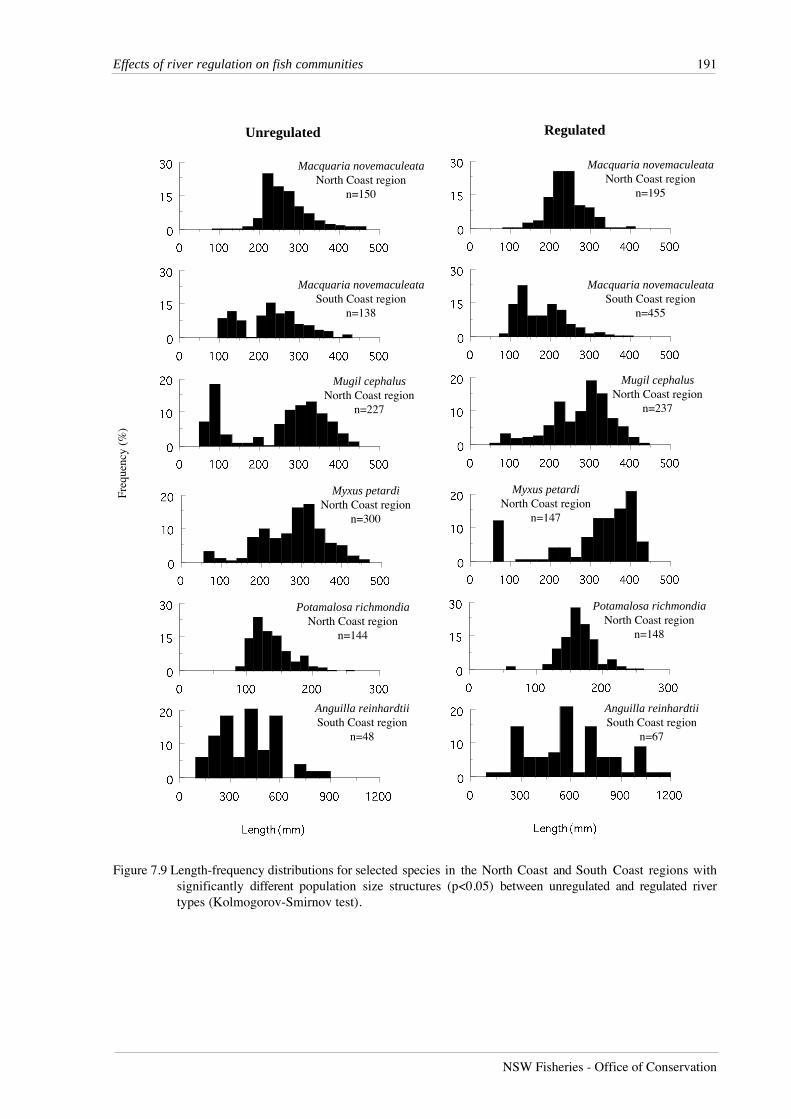
Seven species in the North Coast region displayed different population size structures
between river types. Empire gudgeons, striped mullet, Mugil cephalus, freshwater mullet,
freshwater herring, Potamalosa richmondia, and Pacific blue-eyes, had larger mean lengths in
regulated rivers (Figure 7.9). Unregulated rivers contained a large proportion of juvenile striped
mullet less than 150 mm, as well as a large number of individuals longer than 250 mm. In
comparison, regulated rivers displayed a single mode around 300 mm in the length distribution
for this species. For freshwater mullet, both regulated and unregulated rivers contained a
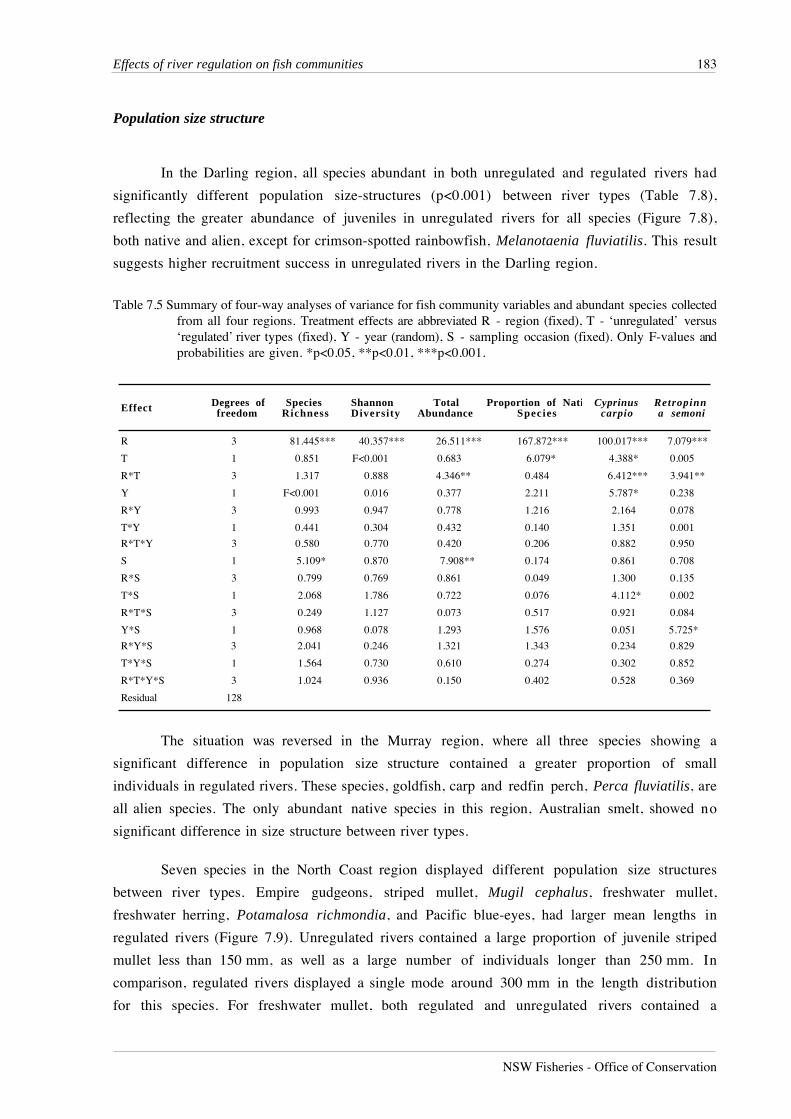
Table 7.5 Summary of four-way analyses of variance for fish community variables and abundant species collectedfrom all four regions. Treatment effects are abbreviated R - region (fixed), T - ‘unregulated’ versus‘regulated’ river types (fixed), Y - year (random), S - sampling occasion (fixed). Only F-values andprobabilities are given. *p<0.05, **p<0.01, ***p<0.001.
Effect Degrees of freedom
Species Richness
Shannon Diversity
Total Abundance
Proportion of NatiSpecies
Cyprinus carpio
Retropinna semoni
R 3 81.445*** 40.357*** 26.511*** 167.872*** 100.017*** 7.079***
T 1 0.851 F<0.001 0.683 6.079* 4.388* 0.005
R*T 3 1.317 0.888 4.346** 0.484 6.412*** 3.941**
Y 1 F<0.001 0.016 0.377 2.211 5.787* 0.238
R*Y 3 0.993 0.947 0.778 1.216 2.164 0.078
T*Y 1 0.441 0.304 0.432 0.140 1.351 0.001
R*T*Y 3 0.580 0.770 0.420 0.206 0.882 0.950
S 1 5.109* 0.870 7.908** 0.174 0.861 0.708
R*S 3 0.799 0.769 0.861 0.049 1.300 0.135
T*S 1 2.068 1.786 0.722 0.076 4.112* 0.002
R*T*S 3 0.249 1.127 0.073 0.517 0.921 0.084
Y*S 1 0.968 0.078 1.293 1.576 0.051 5.725*
R*Y*S 3 2.041 0.246 1.321 1.343 0.234 0.829
T*Y*S 1 1.564 0.730 0.610 0.274 0.302 0.852
R*T*Y*S 3 1.024 0.936 0.150 0.402 0.528 0.369
Residual 128
184 NSW Rivers Survey
CRC For Freshwater Ecology RACAC
detectable class of juvenile fish, but the regulated rivers contained a particularly high abundance
of individuals larger than 350 mm. The remaining two species with different population size-
structures between river types in the North Coast region were Australian bass and Australian smelt.
Both species displayed larger mean lengths in unregulated rivers than in regulated rivers.
Seven species in the South Coast region displayed different population size-structures
between river types. Long-finned eel populations in unregulated rivers appeared truncated, with
few individuals greater than 625 mm, whereas over 40% of individuals from regulated rivers were
larger than 625 mm. Although the lengths of eels were only estimated by the observer without
bringing them into the boat, the difference in length distributions is so large and so significant that
it clearly reflects a real difference in the size structure of populations between regulated and
unregulated rivers. Four small species, the common jollytail, Galaxias maculatus, striped
gudgeons, empire gudgeons and Australian smelt also differed in length distributions between
river types with larger mean lengths in regulated rivers. These species appear to have had greater
recruitment success in unregulated rivers rather than attaining greater length in regulated rivers.
The two remaining species with different size distributions between river types, Australian bass and
flatheaded gudgeons, both had similar proportions of juveniles in unregulated and regulated
rivers, but the proportion of individuals larger than mean length was greater in unregulated rivers.
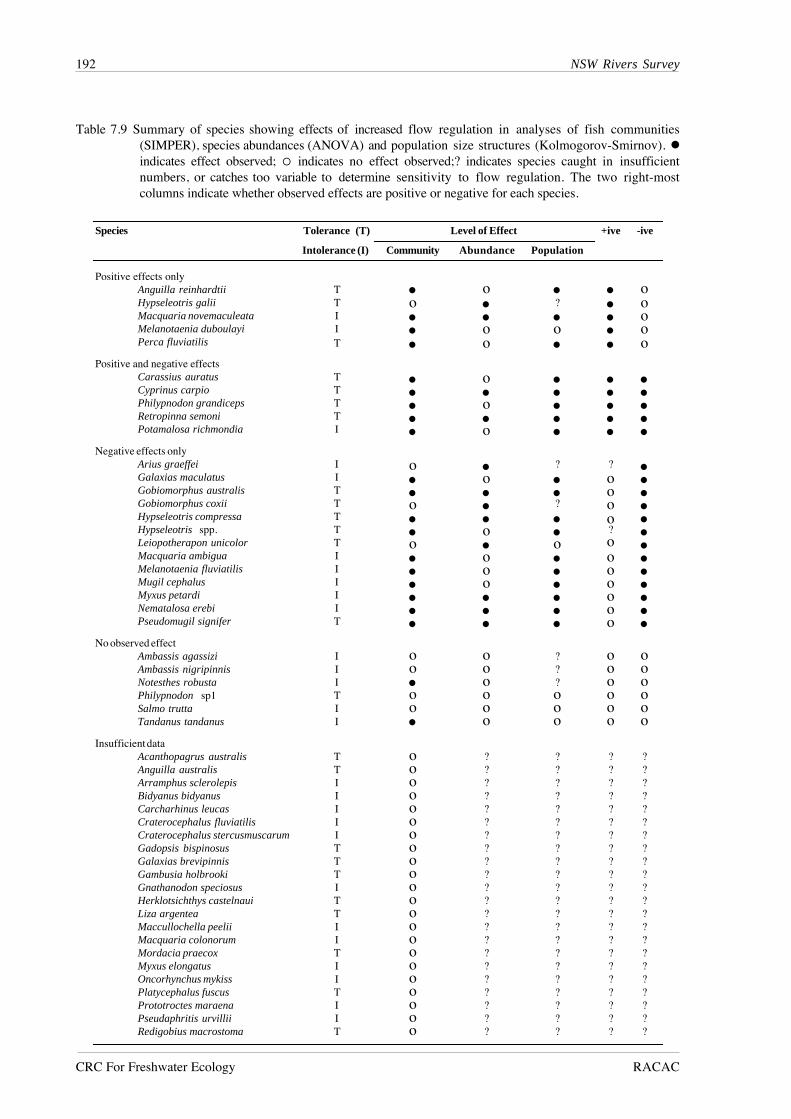
Observed effects of river regulation on fish community composition, species abundance
and population size-structure are summarised in Table 7.9, with an assessment of whether effects
are positive or negative for each species. Five species, consisting of one alien species and four
species native to coastal regions, showed only positive effects of increased flow regulation. In
contrast, eight species native to coastal regions and five native inland species showed only negative
effects of increased flow regulation. A further four species recorded from all four regions showed
both positive and negative effects of increased river regulation that varied among regions. No
effect of increased regulation was observed for six species, while the remaining 23 species were
not recorded in sufficient numbers to detect any effect of flow regulation.
Thus, unregulated rivers in the Darling region appear to contain larger numbers of fish
than regulated rivers, with a greater abundance of small individuals than in regulated rivers. In
contrast, fish abundances were generally greater in regulated rivers in the Murray region, with a
higher proportion of juveniles also in regulated reaches. In both coastal regions, Australian bass
were uniformly more abundant in regulated rivers, but with larger individuals in unregulated
rivers. Populations of remaining species in both coastal regions tended to have greater proportions
of large individuals in regulated rivers with approximately equal numbers of species being more
abundant in either unregulated or regulated rivers.
Effects of river regulation on fish communities 185
NSW Fisheries - Office of Conservation
1
1 0
1 0 0
1 0 0 0
Tot
al a
bund
ance
(log
sca
le)
1
3
10
30
Car
p ab
unda
nce
(log
sca
le)
0.0
0.2
0.5
0.8
1.0
Prop
ortio
n of
nat
ive
indi
vidu
als
(arc
sine
sca
le)
Smel
t ab
unda
nce
(lo
g s
cale
)
U R U R U R U R
Darling Murray NorthCoast
SouthCoast
1
3
10
30
Figure 7.6 Mean values Ò s.e. for community variables and fish species showing significant interactions betweenriver type (U=‘Unregulated’, R= ‘Regulated’) and regions.
Table 7.6 Summary of four-way analyses of variance for species that were abundant in two regions only. Treatment effects are abbreviated R - region (fixed), T -‘unregulated’ versus ‘regulated’ river types (fixed), Y - year (random), S - sampling occasion (fixed). Only F-values and probabilities are given. *p<0.05,**p<0.01, ***p<0.001.
Darling - Murray North Coast - South Coast
Effect Degrees ofreedom
Carassius auratus
Hypseleotriss p p
Macquaria ambigua
Nematalosa erebi
Perca f luv ia t i l i s
Anguilla reinhardtii
Gobiomorphus australis
Gobiomorphus c o x i i
Hypseleotriscompressa
Hypseleotrisga l i i
Macquaria novemaculeata
Mugil cephalus
Myxus petardi
Notesthes robusta
Philypnodon grandiceps
Philypnodon s p p
R 1 0.886 19.246*** 17.512*** 65.192*** 5.826* 0.314 2.163 13.779*** 28.079*** 0.004 1.271 20.178*** 36.717*** 24.783*** 0.562 8.287**
T 1 0.984 0.555 1.771 10.990** 2.553 0.005 7.658** 11.818*** 2.424 6.360* 5.992* 0.274 0.220 0.837 0.828 0.565
R*T 1 0.536 1.627 0.108 0.328 0.264 0.045 1.658 10.879*** 8.612** 0.440 7.186** 2.203 11.699** 0.057 3.412 0.139
Y 1 0.289 0.033 1.502 0.063 2.670 0.057 0.518 3.704 0.026 0.212 0.699 0.022 0.014 1.815 0.001 1.050
R*Y 1 0.650 0.002 0.003 0.082 0.241 0.247 0.452 4.480* 0.928 0.177 <0.001 0.724 0.047 0.452 0.537 3.375
T*Y 1 0.015 0.000 0.506 0.004 0.562 0.009 0.172 7.127** 0.497 0.183 0.044 0.649 0.012 0.144 1.841 1.552
R*T*Y 1 0.306 0.614 0.802 0.001 0.155 0.265 0.102 1.951 0.313 0.151 0.049 0.136 0.117 0.087 0.746 0.188
S 1 0.702 2.178 0.138 5.746* 0.692 0.801 0.281 2.151 2.808 0.315 0.455 0.961 0.021 0.521 1.195 0.019
R*S 1 0.276 0.235 0.942 5.107* 0.470 3.111 0.027 0.276 0.036 0.251 0.413 0.011 0.880 0.521 0.003 0.453
T*S 1 0.035 0.013 0.008 2.559 0.351 0.200 0.244 0.521 0.643 0.280 0.065 0.795 0.326 0.860 0.666 <0.001
R*T*S 1 1.539 0.108 0.894 2.139 0.857 0.390 0.028 0.012 0.360 0.219 0.787 0.940 0.134 0.179 0.302 0.694
Y*S 1 0.120 0.291 1.386 5.332* 0.246 0.459 0.138 3.707 0.136 0.663 0.439 <0.001 0.201 0.043 0.174 0.415
R*Y*S 1 0.252 0.571 0.098 0.198 1.093 0.680 1.583 4.857* 0.164 1.663 0.040 0.250 1.395 2.429 0.514 3.304
T*Y*S 1 0.227 0.119 0.125 3.505 0.014 1.224 0.007 1.393 0.146 0.045 0.083 0.258 1.637 0.080 0.296 0.031
R*T*Y*S 1 0.026 0.602 0.236 <0.001 0.185 0.026 0.406 0.431 0.812 0.473 0.308 0.301 0.439 2.669 0.001 1.690
Residual 64
Effects of river regulation on fish communities 187
NSW Fisheries - Office of Conservation
0.0
0.2
0.4
0.6
North Coast South Coast
Hypseleotris galii - T
0.0
0.5
1.0
1.5
North Coast South Coast
Gobiomorphus australis - T
0.0
0.5
1.0
1.5
2.0
Darling Murray
Nematolosa erebi - T
0.0
0.5
1.0
1.5
North Coast South Coast
Myxus petardi - R*T
0.0
0.5
1.0
1.5
North Coast South Coast
Macquaria novemaculeata - R*T
0.0
0.5
1.0
1.5
2.0
North Coast South Coast
Hypseleotris compressa - R*T
0.0
0.2
0.4
0.6
North Coast South Coast
Gobiomorphus coxi - R*T
Unregulated lowland rivers
Regulated lowland rivers
Mea
n A
bund
ance
(lo
gx +
1)
Key
Figure 7.7 Mean abundance Ò s.e. for species showing significant effects of river type (T), or region*river typeinteractions (R*T). n=20
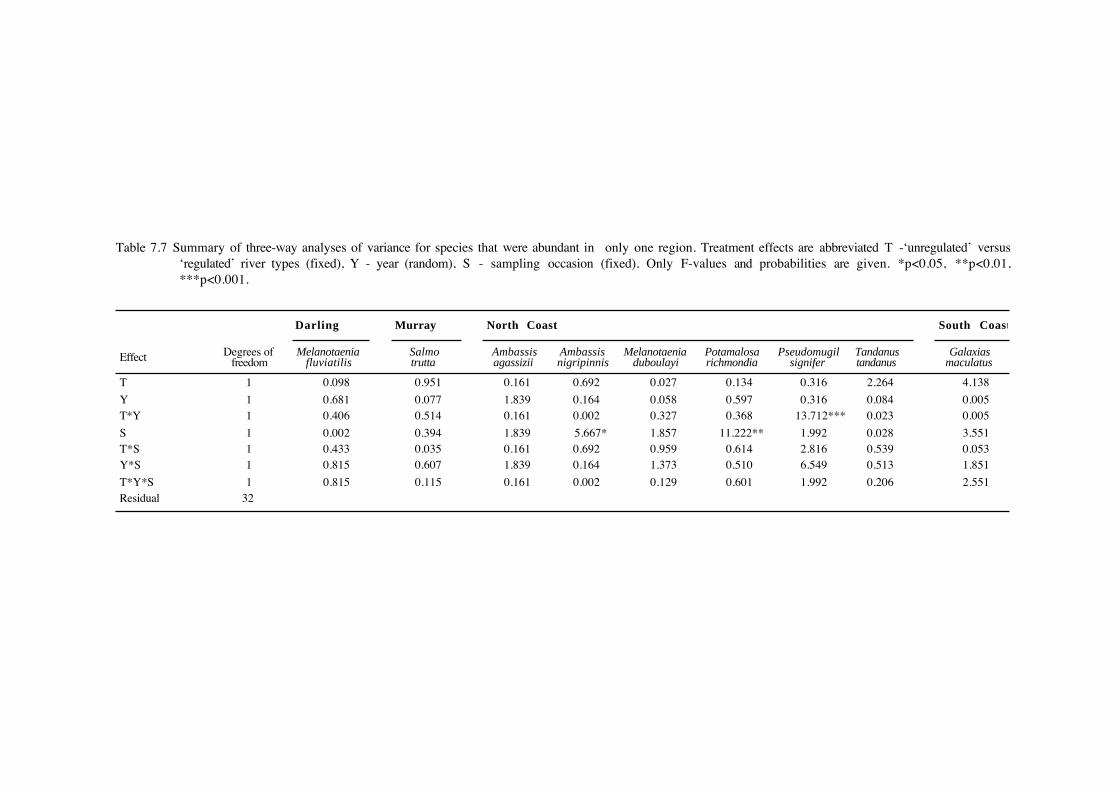
Table 7.7 Summary of three-way analyses of variance for species that were abundant in only one region. Treatment effects are abbreviated T -‘unregulated’ versus‘regulated’ river types (fixed), Y - year (random), S - sampling occasion (fixed). Only F-values and probabilities are given. *p<0.05, **p<0.01,***p<0.001.
Darling Murray North Coast South Coast
Effect Degrees of freedom
Melanotaenia fluviatilis
Salmo trutta
Ambassis agassizii
Ambassis nigripinnis
Melanotaenia duboulayi
Potamalosa richmondia
Pseudomugil signifer
Tandanus tandanus
Galaxias maculatus
T 1 0.098 0.951 0.161 0.692 0.027 0.134 0.316 2.264 4.138
Y 1 0.681 0.077 1.839 0.164 0.058 0.597 0.316 0.084 0.005 T*Y 1 0.406 0.514 0.161 0.002 0.327 0.368 13.712*** 0.023 0.005
S 1 0.002 0.394 1.839 5.667* 1.857 11.222** 1.992 0.028 3.551 T*S 1 0.433 0.035 0.161 0.692 0.959 0.614 2.816 0.539 0.053 Y*S 1 0.815 0.607 1.839 0.164 1.373 0.510 6.549 0.513 1.851
T*Y*S 1 0.815 0.115 0.161 0.002 0.129 0.601 1.992 0.206 2.551 Residual 32
Effects of river regulation on fish communities 189
NSW Fisheries - Office of Conservation
Table 7.8 Population size structure comparisons using Kolmogorov-Smirnov tests between ‘unregulated’ and‘regulated’ rivers for abundant species in each region. *p<0.05, **p<0.01, ***p<0.001.
Species Unregulated Regulated χ 2
Mean Length N Mean Length N
Darling Region
Carassius auratus 125 55 179 35 36.95***
Cyprinus carpio 251 378 344 173 71.58***
Hypseleotris spp 32 229 35 155 17.65*** Macquaria ambigua 232 85 292 90 23.93***
Melanotaenia fluviatilis 56 57 44 30 32.06***
Nematalosa erebi 116 757 158 448 101.00***
Murray Region
Carassius auratus 167 36 129 32 17.42*** Cyprinus carpio 365 232 343 283 8.01*
Perca fluviatilis 174 21 113 48 18.49***
Retropinna semoni 48 102 44 164 6.87 ns
North Coast Region
Gobiomorphus australis 74 273 75 141 4.09 ns Hypseleotris compressa 47 510 49 189 8.02*
Macquaria novemaculeata 264 150 239 195 14.99**
Melanotaenia duboulayi 41 86 42 118 3.77 ns
Mugil cephalus 246 227 274 237 24.93***
Myxus petardi 279 300 310 147 40.88*** Philypnodon grandiceps 54 141 54 84 2.25 ns
Potamalosa richmondia 137 144 164 148 68.67***
Pseudomugil signifer 27 71 29 30 12.75**
Retropinna semoni 47 106 39 63 32.82***
Tandanus tandanus 370 116 352 149 3.77 ns South Coast Region
Anguilla reinhardtii 415 48 611 67 16.39***
Galaxias maculatus 66 82 71 76 7.85*
Gobiomorphus australis 67 210 71 106 13.24**
Hypseleotris compressa 50 23 57 110 15.37*** Macquaria novemaculeata 227 138 177 455 55.25***
Philypnodon grandiceps 64 76 56 132 11.79**
Philypnodon sp 36 61 35 31 1.87 ns
Retropinna semoni 43 318 50 142 29.41***
190 NSW Rivers Survey
CRC For Freshwater Ecology RACAC
Carassius auratusDarling region
n=35
Unregulated
Carassius auratusDarling region
n=55
Regulated
Carassius auratusMurray region
n=36
Carassius auratusMurray region
n=32
Cyprinus carpioDarling region
n=173
Cyprinus carpioDarling region
n=378
Macquaria ambiguaDarling region
n=90
Macquaria ambiguaDarling region
n=85
Nematalosa erebiDarling region
n=448
Nematalosa erebiDarling region
n=757
Perca fluviatilisMurray region
n=48
Perca fluviatilisMurray region
n=21
Cyprinus carpioMurray region
n=283
Cyprinus carpioMurray region
n=232
Freq
uenc
y (%
)
Figure 7.8 Length-frequency distributions for selected species in the Murray and Darling regions withsignificantly different population size structures (p<0.05) between ‘unregulated’ and ‘regulated’ rivertypes (Kolmogorov-Smirnov test).
Effects of river regulation on fish communities 191
NSW Fisheries - Office of Conservation
Anguilla reinhardtiiSouth Coast region
n=67
Anguilla reinhardtiiSouth Coast region
n=48
Macquaria novemaculeataNorth Coast region
n=195
Macquaria novemaculeataNorth Coast region
n=150
Macquaria novemaculeataSouth Coast region
n=455
Macquaria novemaculeataSouth Coast region
n=138
Mugil cephalusNorth Coast region
n=237
Mugil cephalusNorth Coast region
n=227
Myxus petardiNorth Coast region
n=147
Myxus petardiNorth Coast region
n=300
Freq
uenc
y (%
)
Potamalosa richmondiaNorth Coast region
n=148
Potamalosa richmondiaNorth Coast region
n=144
Unregulated Regulated
Figure 7.9 Length-frequency distributions for selected species in the North Coast and South Coast regions withsignificantly different population size structures (p<0.05) between unregulated and regulated rivertypes (Kolmogorov-Smirnov test).
192 NSW Rivers Survey
CRC For Freshwater Ecology RACAC
Table 7.9 Summary of species showing effects of increased flow regulation in analyses of fish communities(SIMPER), species abundances (ANOVA) and population size structures (Kolmogorov-Smirnov). !indicates effect observed; % indicates no effect observed;? indicates species caught in insufficientnumbers, or catches too variable to determine sensitivity to flow regulation. The two right-mostcolumns indicate whether observed effects are positive or negative for each species.
Species Tolerance (T) Level of Effect +ive -ive
Intolerance (I) Community Abundance Population
Positive effects onlyAnguilla reinhardtii T • o • • oHypseleotris galii T o • ? • oMacquaria novemaculeata I • • • • oMelanotaenia duboulayi I • o o • oPerca fluviatilis T • o • • o
Positive and negative effectsCarassius auratus T • o • • •Cyprinus carpio T • • • • •Philypnodon grandiceps T • o • • •Retropinna semoni T • • • • •Potamalosa richmondia I • o • • •
Negative effects onlyArius graeffei I o • ? ? •Galaxias maculatus I • o • o •Gobiomorphus australis T • • • o •Gobiomorphus coxii T o • ? o •Hypseleotris compressa T • • • o •Hypseleotris spp. T • o • ? •Leiopotherapon unicolor T o • o o •Macquaria ambigua I • o • o •Melanotaenia fluviatilis I • o • o •Mugil cephalus I • o • o •Myxus petardi I • • • o •Nematalosa erebi I • • • o •Pseudomugil signifer T • • • o •
No observed effectAmbassis agassizi I o o ? o oAmbassis nigripinnis I o o ? o oNotesthes robusta I • o ? o oPhilypnodon sp1 T o o o o oSalmo trutta I o o o o oTandanus tandanus I • o o o o
Insufficient dataAcanthopagrus australis T o ? ? ? ?Anguilla australis T o ? ? ? ?Arramphus sclerolepis I o ? ? ? ?Bidyanus bidyanus I o ? ? ? ?Carcharhinus leucas I o ? ? ? ?Craterocephalus fluviatilis I o ? ? ? ?Craterocephalus stercusmuscarum I o ? ? ? ?Gadopsis bispinosus T o ? ? ? ?Galaxias brevipinnis T o ? ? ? ?Gambusia holbrooki T o ? ? ? ?Gnathanodon speciosus I o ? ? ? ?Herklotsichthys castelnaui T o ? ? ? ?Liza argentea T o ? ? ? ?Maccullochella peelii I o ? ? ? ?Macquaria colonorum I o ? ? ? ?Mordacia praecox T o ? ? ? ?Myxus elongatus I o ? ? ? ?Oncorhynchus mykiss I o ? ? ? ?Platycephalus fuscus T o ? ? ? ?Prototroctes maraena I o ? ? ? ?Pseudaphritis urvillii I o ? ? ? ?Redigobius macrostoma T o ? ? ? ?
Effects of river regulation on fish communities 193
NSW Fisheries - Office of Conservation
DISCUSSION
The different terminology used to define river flow regimes in New South Wales reflects
recent advances in understanding of the effects of river management, and the continuing need for
quantitative tools to better measure the ways in which flows are manipulated. A simple dichotomy
according to whether flow regimes are influenced by dams was the only practical approach for
rivers in New South Wales when this study was initiated. Since then, a number of measures have
been developed to quantify and categorise hydrological changes in rivers. The Annual
Proportional Flow Deviation (Gehrke et al. 1995) uses actual and modelled monthly flow data to
estimate changes in flow volume and seasonality from the natural condition. A more
comprehensive suite of measures is provided by Richter et al. (1996), covering monthly flows,
annnual extremes, timing of flows, frequency and duration of high and low flows, and the rate and
frequency of changes in flow. These and other similar methods enable comparisons between
hydrologically-similar rivers at a finer level of resolution than was possible during the present
study. But unfortunately, these methods cannot yet be applied to many of the rivers in New South
Wales. Continued development of suitable tools for measuring flow regimes is required to enable
future studies to improve understanding of ecological responses to changes in flow.
Effects of flow regulation on riverine fish have been closely studied in recent years, at
levels ranging from responses of individual fish, through population-level changes to changes in
the composition and structure of fish communities. Reported effects include reduced abundance
of fish larvae (Scheidegger and Bain 1995), suppressed growth rates (Weisberg and Burton 1993),
altered community structure (Bain et al. 1988; Kinsolving and Bain 1993) and reduced species
diversity (Gehrke et al. 1995).
Fish communities in New South Wales rivers show substantial differences in species
composition between reaches where flows are highly regulated and reaches which retain a
predominantly natural, minimally-regulated flow regime. At the same time, fish communities in all
four regions investigated in this study displayed a regional identity, irrespective of whether flows
in a given river were regulated or unregulated. The existence of a regional identity might be
encouraging from the point of view that the basic structure of riverine fish communities is still
intact despite various environmental disturbances. However, the regional pattern also supports a
contrary perspective that contemporary fish communities in lowland rivers simply reflect the
degree of disturbance since European settlement within the four regions studied.
Different reasons may exist between coastal and inland regions for the differences in fish
communities between regulated and unregulated rivers. In both the Darling and Murray regions,
rivers are regulated predominantly to provide a secure supply of water for irrigation, with flood
mitigation, town water supply and hydroelectric power generation accounting for relatively small
194 NSW Rivers Survey
CRC For Freshwater Ecology RACAC
proportions of the total flow. Flows in these rivers retain a strong seasonal pattern that is out of
phase with the natural flow cycle, with a reduced mean annual flow volume and increased stability
(Merron et al. 1993; Walker and Thoms 1993; Gehrke et al. 1995; Imbert and Stanford 1996). In
contrast, regulated rivers in the North Coast and South Coast regions are mostly regulated to
provide town water supplies. Some exceptions occur, such as the Hunter and Richmond rivers,
which provide flows for irrigation as well as town water supplies. Rivers regulated for town water
supplies may exhibit a suppressed seasonal cycle with reduced annual flows and increased flow
stability (Ibañez et al. 1995; Gehrke et al. 1996). Therefore the main difference in flow regime
between rivers regulated for irrigation purposes and those regulated for town water supplies is the
degree of seasonal change. Consequently, the ecological impacts of flow regulation in the rivers in
this study are likely to differ qualitatively from impacts in rivers regulated for generating
hydroelectricity, where flows are erratic and variable on a daily time scale (e.g. Bain et al. 1988;
Garcia de Jalon et al. 1994).
Fish communities in both inland and coastal regions had a lower proportional abundance
of native species in highly regulated rivers, or conversely, a greater proportional abundance of
alien species. The nature and degree of flow regulation lie on a continuum of disturbance to river
ecosystems (Connell 1978; Ward and Stanford 1983; Gehrke et al. 1995), ranging from reduced
flow variability in rivers regulated for irrigation or town water supply to increased flow variability
in rivers regulated to generate hydroelectricity. Both extremes disrupt equilibrium processes in
aquatic ecosystems, and allow habitat generalist species to increase in abundance while habitat
specialists decline (e.g. Bain et al. 1988; Gehrke et al. 1995), leading to a reduction in species
diversity. Successful alien species are commonly habitat generalists that become established
following human disturbance, especially when the pre-existing fauna is depauperate (Ross 1991).
In New South Wales, carp, goldfish, gambusia and redfin perch are all alien species with generalist
habitat requirements, and which thrive in disturbed habitats. For example, carp occurred in
regulated rivers only in both the North Coast and South Coast regions. In contrast, many native
species have specialist flow requirements that influence recruitment success (Harris and Gehrke
1994). Thus by increasing the stability of river flows and reducing the frequency of natural
disturbance, river regulation disadvantages fluvial specialist species while favouring generalist
species.
It is surprising then that this study detected no differences in species diversity or species
richness between regulated and unregulated rivers. This outcome may result from the replacement
of sensitive native species with alien species (Minckley and Meffe 1987; Welcomme 1994) in
regulated rivers, creating relatively small changes in species diversity and richness when compared
with the large amount of spatial variation in this study. Under these circumstances, the proportion
of native fish in samples provides a more sensitive indicator of changes in fish communities than
species richness or diversity. In contrast, Gehrke et al. (1995) found a highly significant reduction
in diversity with increasing flow regulation in the Murray-Darling River system. The reason for
the different results between these two studies may lie in the larger amount of spatial and temporal
Effects of river regulation on fish communities 195
NSW Fisheries - Office of Conservation
replication in the present study, and the quantitative approach to measuring the degree of
regulation in the former study.
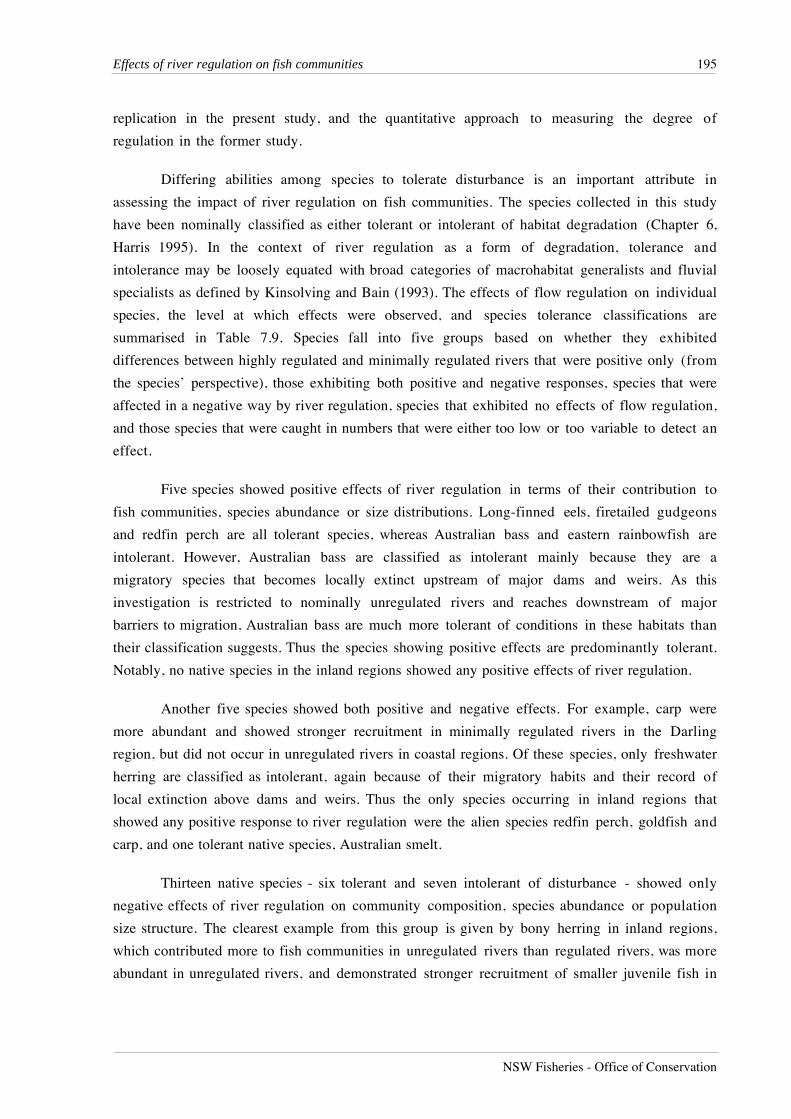
Differing abilities among species to tolerate disturbance is an important attribute in
assessing the impact of river regulation on fish communities. The species collected in this study
have been nominally classified as either tolerant or intolerant of habitat degradation (Chapter 6,
Harris 1995). In the context of river regulation as a form of degradation, tolerance and
intolerance may be loosely equated with broad categories of macrohabitat generalists and fluvial
specialists as defined by Kinsolving and Bain (1993). The effects of flow regulation on individual
species, the level at which effects were observed, and species tolerance classifications are
summarised in Table 7.9. Species fall into five groups based on whether they exhibited
differences between highly regulated and minimally regulated rivers that were positive only (from
the species’ perspective), those exhibiting both positive and negative responses, species that were
affected in a negative way by river regulation, species that exhibited no effects of flow regulation,
and those species that were caught in numbers that were either too low or too variable to detect an
effect.
Five species showed positive effects of river regulation in terms of their contribution to
fish communities, species abundance or size distributions. Long-finned eels, firetailed gudgeons
and redfin perch are all tolerant species, whereas Australian bass and eastern rainbowfish are
intolerant. However, Australian bass are classified as intolerant mainly because they are a
migratory species that becomes locally extinct upstream of major dams and weirs. As this
investigation is restricted to nominally unregulated rivers and reaches downstream of major
barriers to migration, Australian bass are much more tolerant of conditions in these habitats than
their classification suggests. Thus the species showing positive effects are predominantly tolerant.
Notably, no native species in the inland regions showed any positive effects of river regulation.
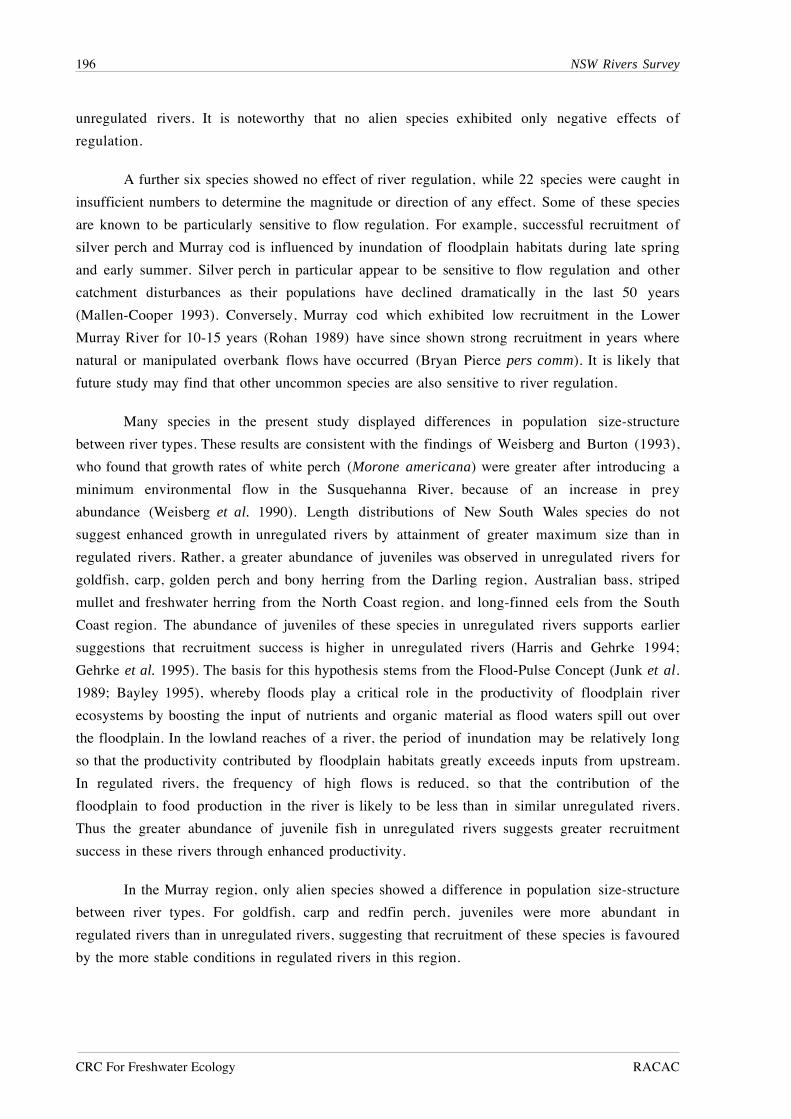
Another five species showed both positive and negative effects. For example, carp were
more abundant and showed stronger recruitment in minimally regulated rivers in the Darling
region, but did not occur in unregulated rivers in coastal regions. Of these species, only freshwater
herring are classified as intolerant, again because of their migratory habits and their record of
local extinction above dams and weirs. Thus the only species occurring in inland regions that
showed any positive response to river regulation were the alien species redfin perch, goldfish and
carp, and one tolerant native species, Australian smelt.
Thirteen native species - six tolerant and seven intolerant of disturbance - showed only
negative effects of river regulation on community composition, species abundance or population
size structure. The clearest example from this group is given by bony herring in inland regions,
which contributed more to fish communities in unregulated rivers than regulated rivers, was more
abundant in unregulated rivers, and demonstrated stronger recruitment of smaller juvenile fish in
196 NSW Rivers Survey
CRC For Freshwater Ecology RACAC
unregulated rivers. It is noteworthy that no alien species exhibited only negative effects of
regulation.
A further six species showed no effect of river regulation, while 22 species were caught in
insufficient numbers to determine the magnitude or direction of any effect. Some of these species
are known to be particularly sensitive to flow regulation. For example, successful recruitment of
silver perch and Murray cod is influenced by inundation of floodplain habitats during late spring
and early summer. Silver perch in particular appear to be sensitive to flow regulation and other
catchment disturbances as their populations have declined dramatically in the last 50 years
(Mallen-Cooper 1993). Conversely, Murray cod which exhibited low recruitment in the Lower
Murray River for 10-15 years (Rohan 1989) have since shown strong recruitment in years where
natural or manipulated overbank flows have occurred (Bryan Pierce pers comm). It is likely that
future study may find that other uncommon species are also sensitive to river regulation.
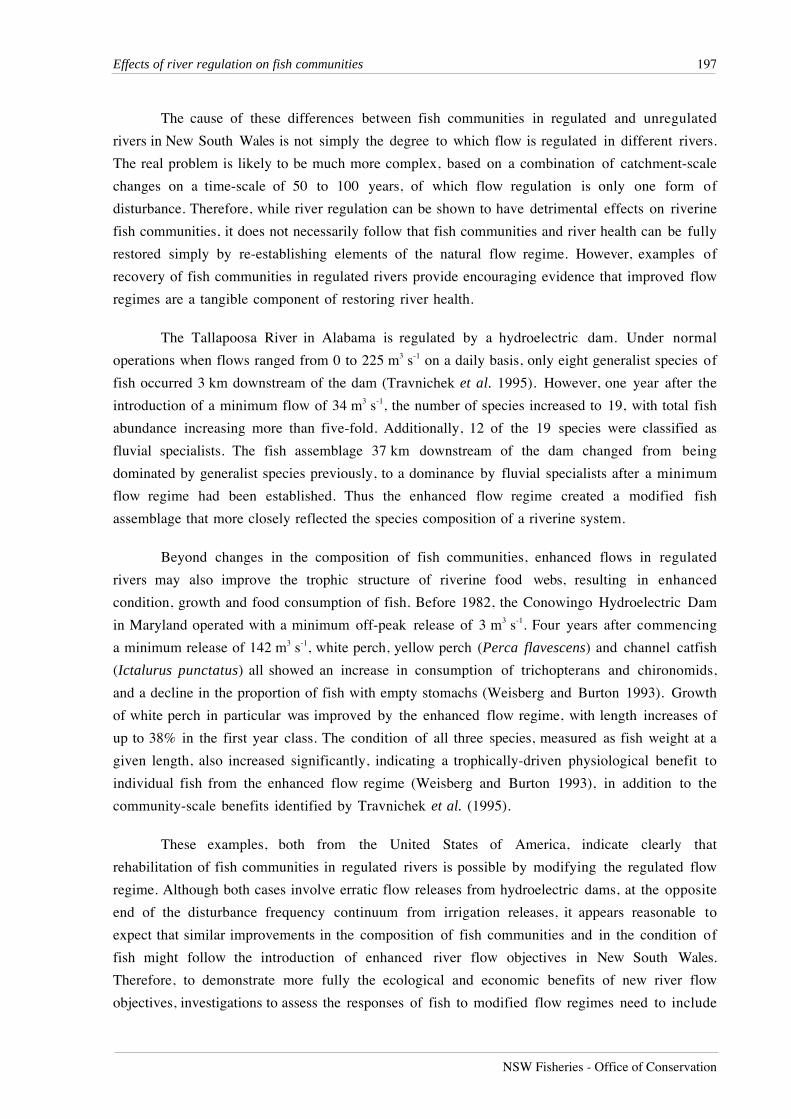
Many species in the present study displayed differences in population size-structure
between river types. These results are consistent with the findings of Weisberg and Burton (1993),
who found that growth rates of white perch (Morone americana) were greater after introducing a
minimum environmental flow in the Susquehanna River, because of an increase in prey
abundance (Weisberg et al. 1990). Length distributions of New South Wales species do not
suggest enhanced growth in unregulated rivers by attainment of greater maximum size than in
regulated rivers. Rather, a greater abundance of juveniles was observed in unregulated rivers for
goldfish, carp, golden perch and bony herring from the Darling region, Australian bass, striped
mullet and freshwater herring from the North Coast region, and long-finned eels from the South
Coast region. The abundance of juveniles of these species in unregulated rivers supports earlier
suggestions that recruitment success is higher in unregulated rivers (Harris and Gehrke 1994;
Gehrke et al. 1995). The basis for this hypothesis stems from the Flood-Pulse Concept (Junk et al.
1989; Bayley 1995), whereby floods play a critical role in the productivity of floodplain river
ecosystems by boosting the input of nutrients and organic material as flood waters spill out over
the floodplain. In the lowland reaches of a river, the period of inundation may be relatively long
so that the productivity contributed by floodplain habitats greatly exceeds inputs from upstream.
In regulated rivers, the frequency of high flows is reduced, so that the contribution of the
floodplain to food production in the river is likely to be less than in similar unregulated rivers.
Thus the greater abundance of juvenile fish in unregulated rivers suggests greater recruitment
success in these rivers through enhanced productivity.
In the Murray region, only alien species showed a difference in population size-structure
between river types. For goldfish, carp and redfin perch, juveniles were more abundant in
regulated rivers than in unregulated rivers, suggesting that recruitment of these species is favoured
by the more stable conditions in regulated rivers in this region.
Effects of river regulation on fish communities 197
NSW Fisheries - Office of Conservation
The cause of these differences between fish communities in regulated and unregulated
rivers in New South Wales is not simply the degree to which flow is regulated in different rivers.
The real problem is likely to be much more complex, based on a combination of catchment-scale
changes on a time-scale of 50 to 100 years, of which flow regulation is only one form of
disturbance. Therefore, while river regulation can be shown to have detrimental effects on riverine
fish communities, it does not necessarily follow that fish communities and river health can be fully
restored simply by re-establishing elements of the natural flow regime. However, examples of
recovery of fish communities in regulated rivers provide encouraging evidence that improved flow
regimes are a tangible component of restoring river health.
The Tallapoosa River in Alabama is regulated by a hydroelectric dam. Under normal
operations when flows ranged from 0 to 225 m3 s-1 on a daily basis, only eight generalist species of
fish occurred 3 km downstream of the dam (Travnichek et al. 1995). However, one year after the
introduction of a minimum flow of 34 m3 s-1, the number of species increased to 19, with total fish
abundance increasing more than five-fold. Additionally, 12 of the 19 species were classified as
fluvial specialists. The fish assemblage 37 km downstream of the dam changed from being
dominated by generalist species previously, to a dominance by fluvial specialists after a minimum
flow regime had been established. Thus the enhanced flow regime created a modified fish
assemblage that more closely reflected the species composition of a riverine system.
Beyond changes in the composition of fish communities, enhanced flows in regulated
rivers may also improve the trophic structure of riverine food webs, resulting in enhanced
condition, growth and food consumption of fish. Before 1982, the Conowingo Hydroelectric Dam
in Maryland operated with a minimum off-peak release of 3 m3 s-1. Four years after commencing
a minimum release of 142 m3 s-1, white perch, yellow perch (Perca flavescens) and channel catfish
(Ictalurus punctatus) all showed an increase in consumption of trichopterans and chironomids,
and a decline in the proportion of fish with empty stomachs (Weisberg and Burton 1993). Growth
of white perch in particular was improved by the enhanced flow regime, with length increases of
up to 38% in the first year class. The condition of all three species, measured as fish weight at a
given length, also increased significantly, indicating a trophically-driven physiological benefit to
individual fish from the enhanced flow regime (Weisberg and Burton 1993), in addition to the
community-scale benefits identified by Travnichek et al. (1995).
These examples, both from the United States of America, indicate clearly that
rehabilitation of fish communities in regulated rivers is possible by modifying the regulated flow
regime. Although both cases involve erratic flow releases from hydroelectric dams, at the opposite
end of the disturbance frequency continuum from irrigation releases, it appears reasonable to
expect that similar improvements in the composition of fish communities and in the condition of
fish might follow the introduction of enhanced river flow objectives in New South Wales.
Therefore, to demonstrate more fully the ecological and economic benefits of new river flow
objectives, investigations to assess the responses of fish to modified flow regimes need to include
198 NSW Rivers Survey
CRC For Freshwater Ecology RACAC
individual and population-scale responses in addition to the broader composition of fish
communities. Furthermore, quantitative methods, such as the Annual Proportional Flow Deviation
(Gehrke et al. 1995), Indicators of Hydrologic Alteration (Richter et al. 1996), or similar
techniques are urgently required to strengthen comparisons between rivers subjected to differing
degrees and types of flow regulation.
ACKNOWLEDGMENTS
I would like to express my gratitude to Rossana Silveira, Simon Hartley, John Matthews,
Michael Rodgers for their assistance with data analyses and producing the graphics for this
chapter. Patrick Driver and Dr John Harris also provided helpful comments on earlier drafts of the
manuscript.
REFERENCES
Bain, M.B., Finn, J.T. and Booke, H.E. (1988). Streamflow regulation and fish communitystructure. Ecology 69, 382-392.
Bayley, P.B. (1995). Understanding large river-floodplain ecosystems. Bioscience 45, 153-158.
Boon, P.J. (1993). Distribution, abundance and development of trichoptera larvae in the RiverNorth Tyne following the commencement of hydroelectric power generation. RegulatedRivers: Research & Management 8, 211-224.
Bray, J.R. and Curtis, J.T. (1957). An ordination of the upland forest communities of SouthernWisconsin. Ecological Monographs 27, 325-349.
Cadwallader, P.L. (1978). Some causes of the decline in range and abundance of native fish in theMurray-Darling river system. Proceedings of the Royal Society of Victoria 90, 211-224.
Cadwallader, P. L. and Lawrence, B. (1990). Fish. In Mackay, N. and Eastburn, D. (eds), TheMurray, Murray-Darling Basin Commission, Canberra. pp. 316-335.
Clarke, K.R. (1993). Non-parametric multivariate analyses of changes in community structure.Australian Journal of Ecology 18, 117-143.
Comargo, J.A. (1993). Dynamic stability in hydropsychid guilds along a regulated stream: therole of competitive interactions versus environmental perturbations. Regulated Rivers:Research & Management 8, 29-40.
Connell, J. H. (1978). Diversity in tropical rain forests and coral reefs. Science 199, 1302-1310.
Effects of river regulation on fish communities 199
NSW Fisheries - Office of Conservation
Garcia de Jalon, D., Sanchez, P. and Comargo, J.A. (1994). Downstream effects of a newhydropower impoundment on macrophyte, macroinvertebrate and fish communities.Regulated Rivers: Research & Management 9, 253-261.
Geddes, M. C. (1990). Crayfish. In Mackay, N. and Eastburn, D. (eds), The Murray, Murray-Darling Basin Commission, Canberra. pp. 302-307.
Gehrke, P.C., Brown, P. Schiller, C.B., Moffatt, D.B and Bruce, A.M. (1995). River regulation andfish communities in the Murray-Darling River system, Australia. Regulated Rivers:Research & Management 11, 363-375.
Gehrke, P.C., Astles, K.L. and Harris, J.H. (1996). Effects of river flow diversion on fishcommunities in the Hawkesbury-Nepean River system, Australia. In Gehrke, P.C. andHarris, J.H. (1996). Fish and Fisheries of the Hawkesbury-Nepean River System. chapter10. Final Report to the Sydney Water Corporation. NSW Fisheries Research Institute andCooperative Research Centre for Freshwater Ecology.
Harris, J.H. (1988). Demography of Australian bass, Macquaria novemaculeata (Perciformes,Percichthyidae), in the Sydney Basin. Australian Journal of Marine and FreshwaterResearch 39, 355-369.
Harris, J.H. (1995). The use of fish in ecological assessments. Australian Journal of Ecology 20,65-80.
Harris, J.H. and Gehrke, P.C. (1994). Development of predictive models linking fish populationrecruitment with streamflow. In Population dynamics for fisheries management (ed D. A.Hancock), Australian Society for Fish Biology Workshop, Sorrento, 24-28 August 1993,Bureau of Resource Sciences Proceedings AGPS, Canberra, pp. 195-199.
Humphries, P., Davies, P.E. and Mulcahy, M.E. (1996). Macroinvertebrate assemblages of littoralhabitats in the Macquarie and Mersey Rivers, Tasmania: implications for the managementof regulated rivers. Regulated Rivers: Research & Management 12, 99-122.
Ibañez, C., Rodrigues-Capitulo, A. and Prat, N. (1995). The combined impacts of river regulationand eutrophication on the dynamics of the salt wedge and the ecology of the Lower EbroRiver (North-east Spain). In Harper, D.M. and Ferguson, A.J.D. (eds), The EcologicalBasis for River Management. John Wiley & Sons, Chichester. pp. 105-114.
Imbert, J.B. and Stanford, J.A. (1996). An ecological study of a regulated prairie stream inWestern Montana. Regulated Rivers: Research & Management 12, 597-615.
Junk, W.J., Bayley, P.B. and Sparks, R.E.(1989). The flood pulse concept in river-floodplainsystems. In Proceedings of the International Large Rivers Symposium (ed D.P. Dodge),Canadian Special Publication of Fisheries and Aquatic Sciences, 106, 110-127.
Kinsolving, A.D. and Bain, M.B. (1993). Fish assemblage recovery along a riverine disturbancegradient. Ecological Applications 3, 531-544.
Mallen-Cooper, M. (1993). Habitat changes and declines of freshwater fish in Australia: what isthe evidence and do we need more? In Sustainable Fisheries through Sustaining FishHabitat (ed D. A. Hancock). Australian Society for Fish Biology Workshop, VictorHarbor, SA, 12-13 August 1992. Bureau of Resource Sciences Proceedings AGPS,Canberra, pp. 41-42.
Marsden, T.J. and Gehrke, P.C. (1996). Fish passage in the Hawkesbury-Nepean River system. InGehrke, P.C. and Harris, J.H. (1996). Fish and Fisheries of the Hawkesbury-Nepean RiverSystem. chapter 11. Final Report to the Sydney Water Corporation. NSW FisheriesResearch Institute and Cooperative Research Centre for Freshwater Ecology.
Merron, G., Bruton, M. and La Hausse de Lalouviere, P. (1993). Changes in fish communities ofthe Phongolo floodplain, Zululand (South Africa) before, during and after a severedrought. Regulated Rivers: Research & Management 8, 335-344.
Minkley, W. L. and Meffe, G. K. (1987). Differential selection by flooding in stream fishcommunities of the arid American southwest. In Matthews, W. J. and Heins, D. C. (Eds),Community and Evolutionary Ecology of North American Stream Fishes, University ofOklahoma Press, Norman. pp. 93-104.
200 NSW Rivers Survey
CRC For Freshwater Ecology RACAC
Moog, O. (1993). Quantification of daily peak hydropower effects on aquatic fauna andmanagement to minimise environmental impacts. Regulated Rivers: Research &Management 8, 5-14.
Richter, B.D., Baumgartner, J.V., Powell, J. and Braun, D.P. (1996). A method for assessinghydrologic alteration within ecosystems. Conservation Biology 10, 1163-1174.
Ross, S.T., Matthews, W.J. and Echelle, A.A. (1985). Persistence of stream fish assemblages: effectsof environmental change. American Naturalist 126, 24-40.
Rohan, G. (1989). River fishery (South Australia) - Review of management arrangements. InProceedings of the Workshop on Native Fish Management, pp. 101-115. Canberra 16-17June 1988. (Murray-Darling Basin Commission: Canberra).
Scheidegger, K.J. and Bain, M.B. (1995). Larval fish distribution and microhabitat use in free-flowing and regulated rivers. Copeia 1995 (1), 125-135.
Sear, (1994). Fine sediment infiltration into gravel spawning beds within a regulated riverexperiencing floods: ecological implications for salmonids. Regulated Rivers: Research &Management 9, 373-390.
Stephenson, W.S. and Burgess, D. (1980). Skewness of data in the analysis of species-in-sites-in-times. Proceedings of the Royal Society of Queensland 91, 331-342.
Travnichek, V.H, Bain, M.B. and Maceina, M.J. (1995). Recovery of a warmwater fish assemblageafter the initiation of a minimum-flow release downstream from a hydroelectric dam.Transactions of the American Fisheries Society 124, 836-844.
Walker, K. F. (1992). A semi-arid lowland river: the River Murray, Australia. In Calow, P. A. andPetts, G. E. (eds), The Rivers Handbook, Vol. 1. Blackwell Scientific, Oxford. pp. 472-492.
Walker, K. F., Thoms, M. C. and Sheldon, F. (1992). Effects of weirs on the littoral environmentof the River Murray, South Australia. In Boon, P. J., Calow, P. A. and Petts, G. E. (eds),River Conservation and Management, Wiley, Chichester. pp. 271-292.
Walker, K. F. and Thoms, M. C. (1993). Environmental effects of flow regulation on the lowerRiver Murray, Australia. Regulated Rivers: Research and Management 8, 103-119.
Ward, J.V. and Stanford, J.A. (1983). The intermediate-disturbance hypothesis: an explanation forbiotic diversity patterns in lotic ecosystems. In T.D. Fontaine III and S.M Bartell, eds.Dynamics of Lotic Ecosystems. pp 347-356. Ann Arbor Science, Ann Arbor, Michigan.
Ward, J. V., and Stanford, J. A. (1989). Riverine ecosystems: the influence of man on catchmentdynamics and fish ecology. in Dodge, D. P. (ed), Proceedings of the International LargeRivers Symposium, Canadian Special Publication of Fisheries and Aquatic Sciences, 106,56-64.
Weisberg, S.B. and Burton, W.H. (1993). Enhancement of fish feeding and growth after anincrease in minimum flow below the Conowingo Dam. North American Journal ofFisheries Management 13, 103-109.
Weisberg, S.B., Jannicki, A.J., Gerritsen, J. and Wilson, H.A. (1990). Enhancement of benthicmacroinvertebrates by minimum flow from a hydroelectric dam. Regulated Rivers:Research & Management 5, 265-277.
Welcomme, R. L. (1994). The status of large river habitats. In Cowx, I. G. (Ed.), Rehabilitation ofFreshwater Fisheries, Fishing News Books, Oxford. pp. 11-20.
Zhong, Y. and Power, G. (1996). Environmental impacts of hydroelectric projects on fishresources in China. Regulated Rivers: Research & Management 12, 81-98.
Alien fish species in NSW 201
CRC For Freshwater Ecology RACAC NSW Fisheries
8 Alien fish species from the New SouthWales Rivers Survey
R.A. FaragherA and M. LintermansB
A Cooperative Research Centre for Freshwater Ecology, NSW Fisheries Research Institute, PO Box 21, Cronulla, NSW
2230B
Wildlife Research and Monitoring Unit, Environment ACT, PO Box 144, Lyneham, ACT 2602
Summary
Alien species are defined as those species introduced from overseas and now established in the wild. Ofthe 11 species which have been recorded from New South Wales rivers, six were captured during the currentsurvey for a total of 5,103 individuals, or 18.4% of the total fish catch.
The species captured were brown trout, Salmo trutta, rainbow trout, Oncorhynchus mykiss, redfin perch,Perca fluviatilis, gambusia, Gambusia holbrooki, goldfish, Carassius auratus, and common carp, Cyprinuscarpio. This chapter deals with the first five of these species, with carp being considered separately in Chapter 9.
Alien fish showed significant differences in abundance among regions and among river types with ahighly significant region*river type interaction. Catches were also lower in winter months than in summer.Rivers in the Darling region contained the highest number of alien species but the Murray region had the highestproportion of individuals belonging to alien species (57.5%). In comparison the Darling (25.1%), North Coast(8.7%) and South Coast (9.1%) had lower proportions of alien species in the total catch. Distributions of each ofthe alien species captured during the survey could be explained by temperature tolerance and habitat attributes.
INTRODUCTION
Alien species are defined as those species introduced from overseas and now established in
the wild. The term was used (Harris 1995a) to distinguish between alien species and introduced
202 NSW Rivers Survey
CRC For Freshwater Ecology RACAC
species (native species established outside their natural distribution) and feral species (domestic
fish escaped to the wild).
There are 11 alien species listed as occurring in New South Wales freshwater habitats which
came into New South Wales as both deliberate and accidental introductions. These species have
been identified recently by Harris (1995b). They are yellowfin goby, Acanthogobius flavimanus,
goldfish, Carassius auratus, common carp, Cyprinus carpio, gambusia, Gambusia holbrooki,
rainbow trout, Oncorhynchus mykiss, redfin perch, Perca fluviatilis, brown trout, Salmo trutta,
Atlantic salmon, Salmo salar, brook trout, Salvelinus fontinalis, tench, Tinca tinca, and oriental
weatherloach, Misgurnus anguillicaudatus.
METHODS
Methods describing the sampling design, fish collection, site selection and data
management are found in Chapter 2. A descriptive analysis was found to portray the data most
informatively. Four-factorial analysis of variance was used to assess the variability in alien fish
distributions among regions and river types and between times of sampling and years of the
survey. Regions, river types and time of sampling were treated as fixed factors, with years as a
random factor. Analyses for the alien species included common carp although data on this species
are analysed in more detail separately (Chapter 9). Only the data on fish actually caught, rather
than those observed, were analysed.
RESULTS
Analysis of alien fish data
Of the 11 possible alien species which have been recorded from New South Wales rivers,
only six were captured during the survey. The total catch of the six alien species during the survey
was 5,103 fish (18.4% of the total catch) and included Salmo trutta, Oncorhynchus mykiss, Perca
fluviatilis, Gambusia holbrooki, Cyprinus carpio and Carassius auratus (Table 8.1). Analysis of
variance of alien fish abundance pooled for all species (log (x+1) transformed) showed highly
Alien fish species in NSW 203
NSW Fisheries - Office of Conservation
significant main effects among regions (p<0.001) and less significant differences among river
types (p<0.05) with a highly significant region * river type interaction (p<0.001) (Table 8.2).
This interaction showed that the pattern of distribution of these species among river types varied
among the four ecological regions of the survey (see below). The time of sampling was also a
significant effect (p<0.05) with winter samples showing lower abundances of alien species than
those in summer, indicating greater catchability of alien species at warmer temperatures. There
were no significant differences in alien fish abundance between the two years of the survey. Actual
numbers of the six alien species captured in the four survey periods is shown in Table 8.3.
Rivers in the Darling region contained the highest number (6) of alien fish species
captured. However the Murray region had the highest proportion of alien fish individuals (57.5%)
(Table 8.1). In comparison the Darling (25.1%), North Coast (8.7%) and South Coast (9.1%) had
lower proportions of alien species in the total catch.
Alien species accounted for 41.7% (5 of 12) of the number of fish species collected from
the montane rivers. The comparative figure for the slopes sites was 14.6% (6 of 41) and for the
unregulated and regulated river sites the contribution of alien species were 13% (6 of 46) and
13.6% (6 of 44) respectively. The contribution of the aliens to the total catch of individuals of all
species was highest in the montane sites, followed by the slopes sites. The corresponding
contribution of aliens in the unregulated and regulated lowland rivers sites was lower at
approximately 10% (Table 8.1, Figure 8.2).
Distribution of alien species.
Those species predicted but not captured were yellowfin goby, Acanthogobius flavimanus,
Atlantic salmon, Salmo salar, brook trout, Salvelinus fontinalis, tench, Tinca tinca, and oriental
weatherloach, Misgurnus anguillicaudatus. The numbers of each of the alien species captured in
each of the four survey periods is shown in Table 8.3. The inland drainages had the highest
number of alien species, with both the Murray and the Darling regions containing carp and all five
other species.
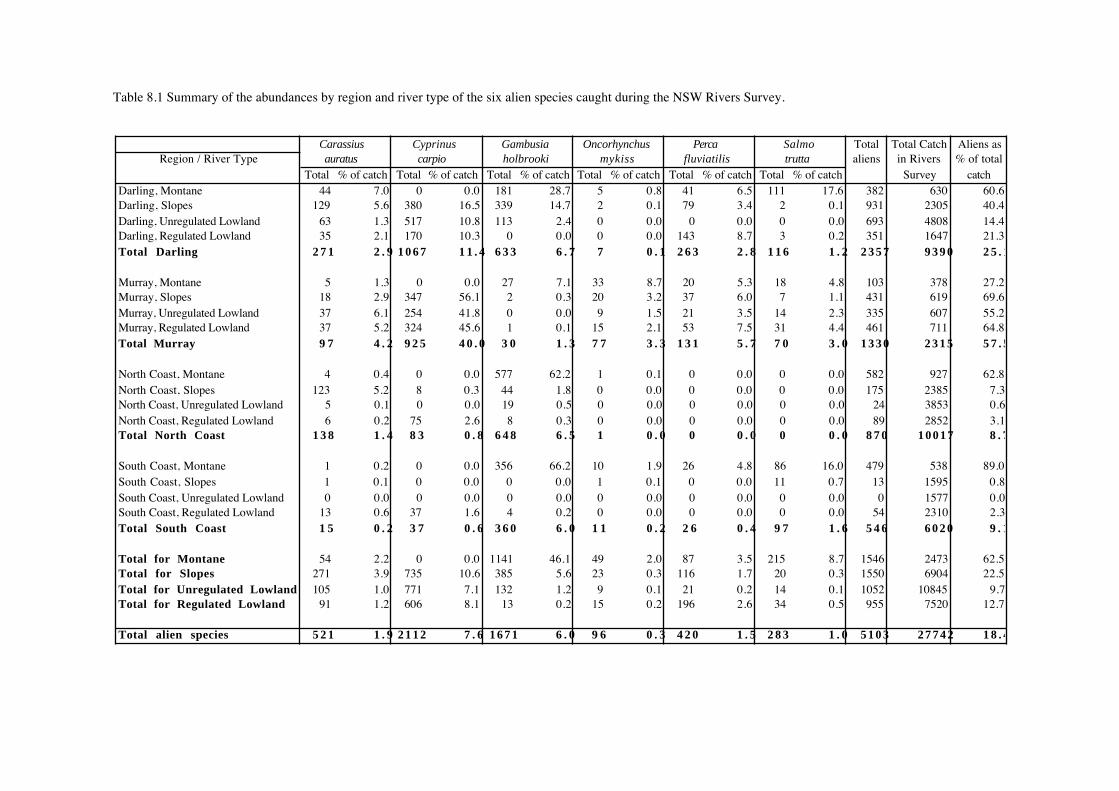
Table 8.1 Summary of the abundances by region and river type of the six alien species caught during the NSW Rivers Survey.
Carassius Cyprinus Gambusia Oncorhynchus Perca Salmo Total Total Catch Aliens asRegion / River Type auratus carpio holbrooki mykiss fluviatilis trutta aliens in Rivers % of total
Total % of catch Total % of catch Total % of catch Total % of catch Total % of catch Total % of catch Survey catchDarling, Montane 44 7.0 0 0.0 181 28.7 5 0.8 41 6.5 111 17.6 382 630 60.6Darling, Slopes 129 5.6 380 16.5 339 14.7 2 0.1 79 3.4 2 0.1 931 2305 40.4Darling, Unregulated Lowland 63 1.3 517 10.8 113 2.4 0 0.0 0 0.0 0 0.0 693 4808 14.4Darling, Regulated Lowland 35 2.1 170 10.3 0 0.0 0 0.0 143 8.7 3 0.2 351 1647 21.3Total Darling 2 7 1 2 . 9 1 0 6 7 1 1 . 4 6 3 3 6 . 7 7 0 . 1 2 6 3 2 . 8 1 1 6 1 . 2 2 3 5 7 9 3 9 0 2 5 . 1
Murray, Montane 5 1.3 0 0.0 27 7.1 33 8.7 20 5.3 18 4.8 103 378 27.2Murray, Slopes 18 2.9 347 56.1 2 0.3 20 3.2 37 6.0 7 1.1 431 619 69.6Murray, Unregulated Lowland 37 6.1 254 41.8 0 0.0 9 1.5 21 3.5 14 2.3 335 607 55.2Murray, Regulated Lowland 37 5.2 324 45.6 1 0.1 15 2.1 53 7.5 31 4.4 461 711 64.8Total Murray 9 7 4 . 2 9 2 5 4 0 . 0 3 0 1 . 3 7 7 3 . 3 1 3 1 5 . 7 7 0 3 . 0 1 3 3 0 2 3 1 5 5 7 . 5
North Coast, Montane 4 0.4 0 0.0 577 62.2 1 0.1 0 0.0 0 0.0 582 927 62.8North Coast, Slopes 123 5.2 8 0.3 44 1.8 0 0.0 0 0.0 0 0.0 175 2385 7.3North Coast, Unregulated Lowland 5 0.1 0 0.0 19 0.5 0 0.0 0 0.0 0 0.0 24 3853 0.6North Coast, Regulated Lowland 6 0.2 75 2.6 8 0.3 0 0.0 0 0.0 0 0.0 89 2852 3.1Total North Coast 1 3 8 1 . 4 8 3 0 . 8 6 4 8 6 . 5 1 0 . 0 0 0 . 0 0 0 . 0 8 7 0 10017 8 . 7
South Coast, Montane 1 0.2 0 0.0 356 66.2 10 1.9 26 4.8 86 16.0 479 538 89.0South Coast, Slopes 1 0.1 0 0.0 0 0.0 1 0.1 0 0.0 11 0.7 13 1595 0.8South Coast, Unregulated Lowland 0 0.0 0 0.0 0 0.0 0 0.0 0 0.0 0 0.0 0 1577 0.0South Coast, Regulated Lowland 13 0.6 37 1.6 4 0.2 0 0.0 0 0.0 0 0.0 54 2310 2.3Total South Coast 1 5 0 . 2 3 7 0 . 6 3 6 0 6 . 0 1 1 0 . 2 2 6 0 . 4 9 7 1 . 6 5 4 6 6 0 2 0 9 . 1
Total for Montane 54 2.2 0 0.0 1141 46.1 49 2.0 87 3.5 215 8.7 1546 2473 62.5Total for Slopes 271 3.9 735 10.6 385 5.6 23 0.3 116 1.7 20 0.3 1550 6904 22.5Total for Unregulated Lowland 105 1.0 771 7.1 132 1.2 9 0.1 21 0.2 14 0.1 1052 10845 9.7Total for Regulated Lowland 91 1.2 606 8.1 13 0.2 15 0.2 196 2.6 34 0.5 955 7520 12.7
Total alien species 5 2 1 1 . 9 2 1 1 2 7 . 6 1 6 7 1 6 . 0 9 6 0 . 3 4 2 0 1 . 5 2 8 3 1 . 0 5 1 0 3 2 7 7 4 2 1 8 . 4
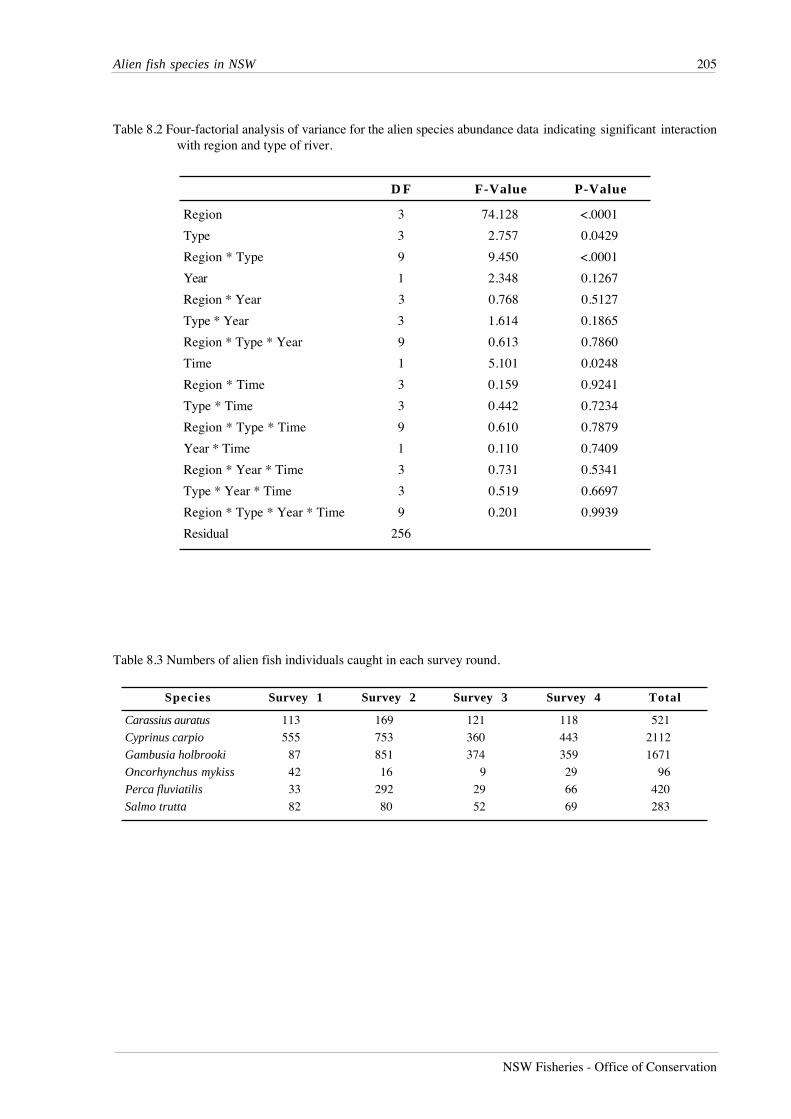
Alien fish species in NSW 205
NSW Fisheries - Office of Conservation
Table 8.2 Four-factorial analysis of variance for the alien species abundance data indicating significant interactionwith region and type of river.
D F F-Value P-Value
Region 3 74.128 <.0001
Type 3 2.757 0.0429
Region * Type 9 9.450 <.0001
Year 1 2.348 0.1267
Region * Year 3 0.768 0.5127
Type * Year 3 1.614 0.1865
Region * Type * Year 9 0.613 0.7860
Time 1 5.101 0.0248
Region * Time 3 0.159 0.9241
Type * Time 3 0.442 0.7234
Region * Type * Time 9 0.610 0.7879
Year * Time 1 0.110 0.7409
Region * Year * Time 3 0.731 0.5341
Type * Year * Time 3 0.519 0.6697
Region * Type * Year * Time 9 0.201 0.9939
Residual 256
Table 8.3 Numbers of alien fish individuals caught in each survey round.
Species Survey 1 Survey 2 Survey 3 Survey 4 Total
Carassius auratus 113 169 121 118 521
Cyprinus carpio 555 753 360 443 2112
Gambusia holbrooki 87 851 374 359 1671
Oncorhynchus mykiss 42 16 9 29 96
Perca fluviatilis 33 292 29 66 420
Salmo trutta 82 80 52 69 283
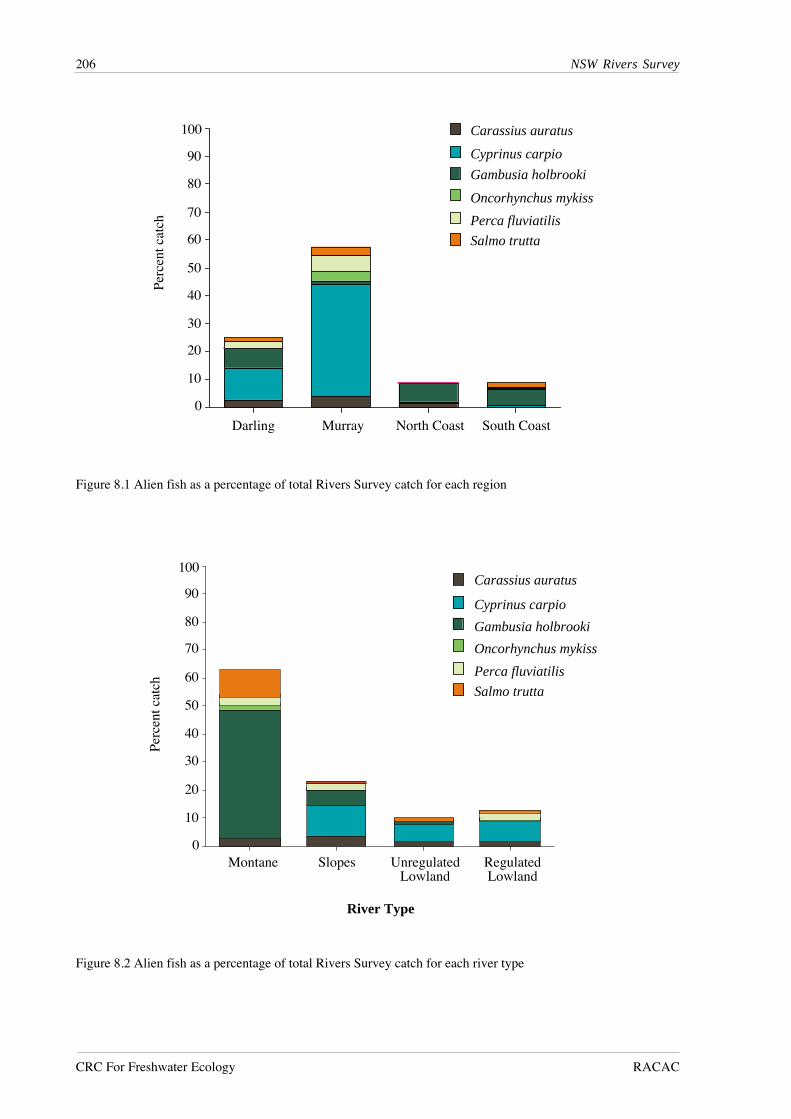
206 NSW Rivers Survey
CRC For Freshwater Ecology RACAC
Carassius auratus
Cyprinus carpio
Gambusia holbrooki
Oncorhynchus mykiss
Perca fluviatilis
Salmo trutta
Montane Slopes
River Type
UnregulatedLowland
RegulatedLowland
0
10
20
30
40
50
60
70
80
90
100
Perc
ent c
atch
0
10
20
30
40
50
60
70
80
90
100
Darling Murray North Coast South Coast
Carassius auratus
Cyprinus carpio
Gambusia holbrooki
Oncorhynchus mykiss
Perca fluviatilis
Salmo trutta
Perc
ent c
atch
Figure 8.1 Alien fish as a percentage of total Rivers Survey catch for each region
Figure 8.2 Alien fish as a percentage of total Rivers Survey catch for each river type
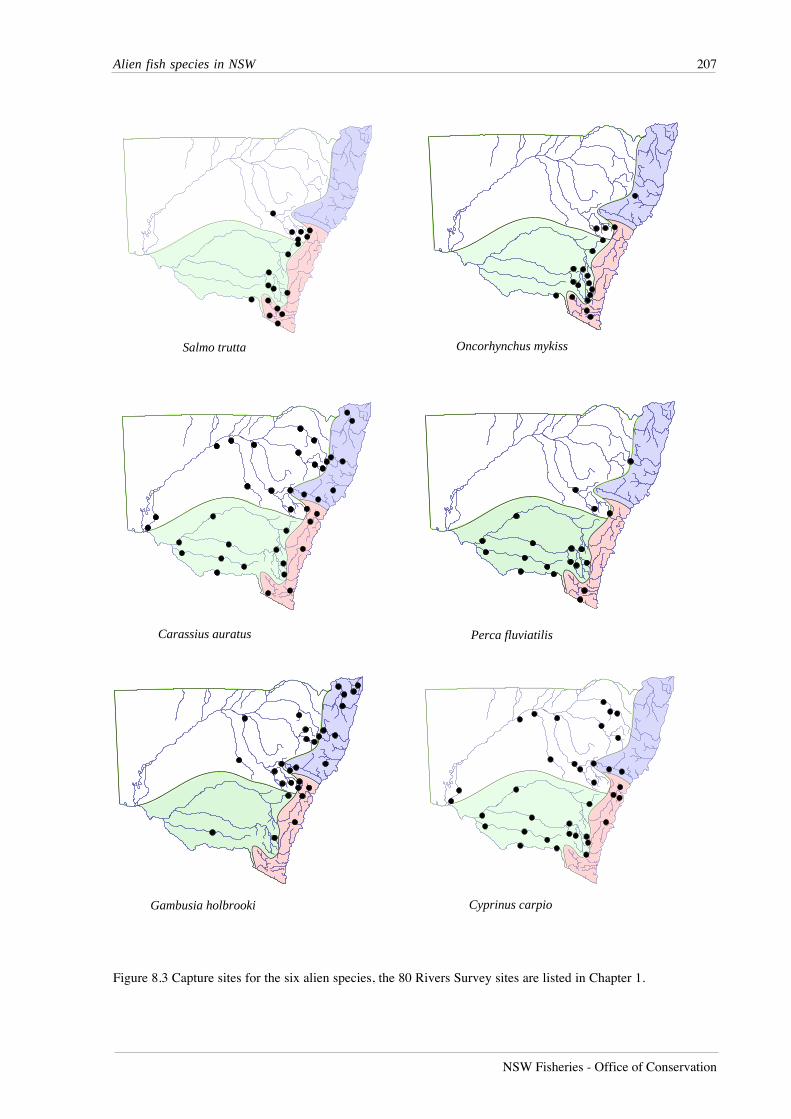
Alien fish species in NSW 207
NSW Fisheries - Office of Conservation
Perca fluviatilis
Salmo trutta Oncorhynchus mykiss
Gambusia holbrooki
Carassius auratus
Cyprinus carpio
Figure 8.3 Capture sites for the six alien species, the 80 Rivers Survey sites are listed in Chapter 1.
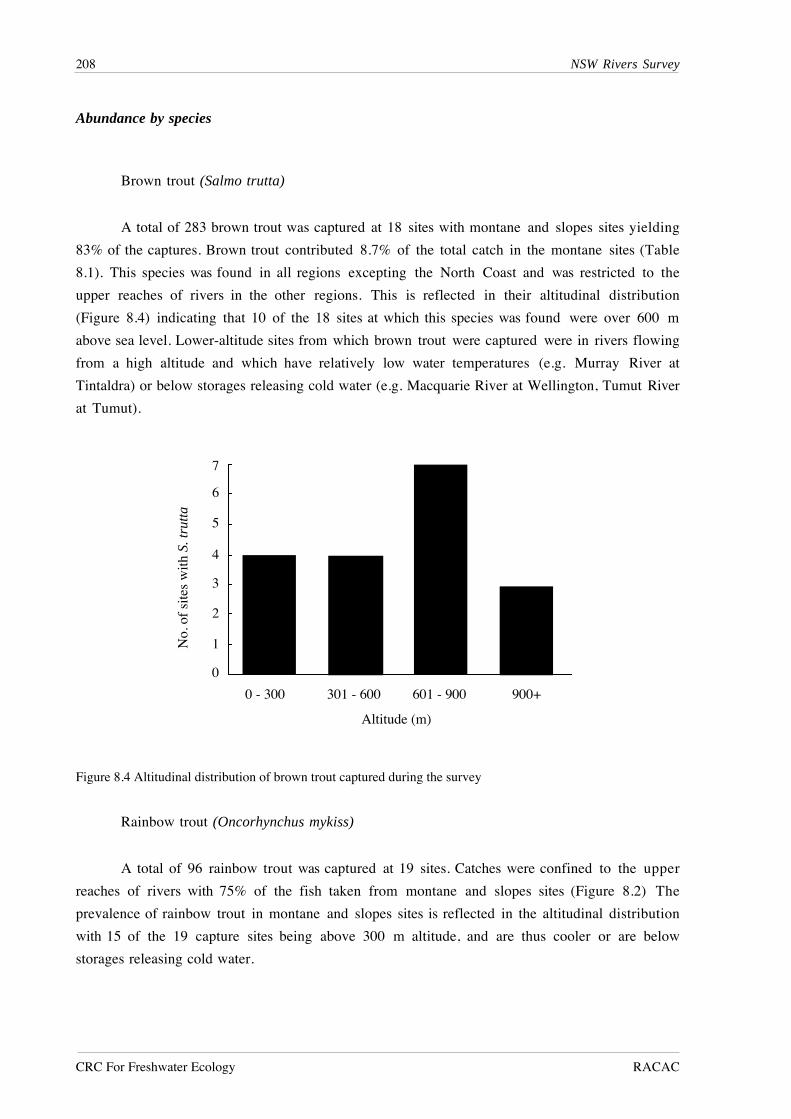
208 NSW Rivers Survey
CRC For Freshwater Ecology RACAC
Abundance by species
Brown trout (Salmo trutta)
A total of 283 brown trout was captured at 18 sites with montane and slopes sites yielding
83% of the captures. Brown trout contributed 8.7% of the total catch in the montane sites (Table
8.1). This species was found in all regions excepting the North Coast and was restricted to the
upper reaches of rivers in the other regions. This is reflected in their altitudinal distribution
(Figure 8.4) indicating that 10 of the 18 sites at which this species was found were over 600 m
above sea level. Lower-altitude sites from which brown trout were captured were in rivers flowing
from a high altitude and which have relatively low water temperatures (e.g. Murray River at
Tintaldra) or below storages releasing cold water (e.g. Macquarie River at Wellington, Tumut River
at Tumut).
Rainbow trout (Oncorhynchus mykiss)
A total of 96 rainbow trout was captured at 19 sites. Catches were confined to the upper
reaches of rivers with 75% of the fish taken from montane and slopes sites (Figure 8.2) The
prevalence of rainbow trout in montane and slopes sites is reflected in the altitudinal distribution
with 15 of the 19 capture sites being above 300 m altitude, and are thus cooler or are below
storages releasing cold water.
0 - 300 301 - 600 601 - 900 900+
1
2
3
4
5
6
7
0
No.
of
site
s w
ith S
. tru
tta
Altitude (m)
Figure 8.4 Altitudinal distribution of brown trout captured during the survey
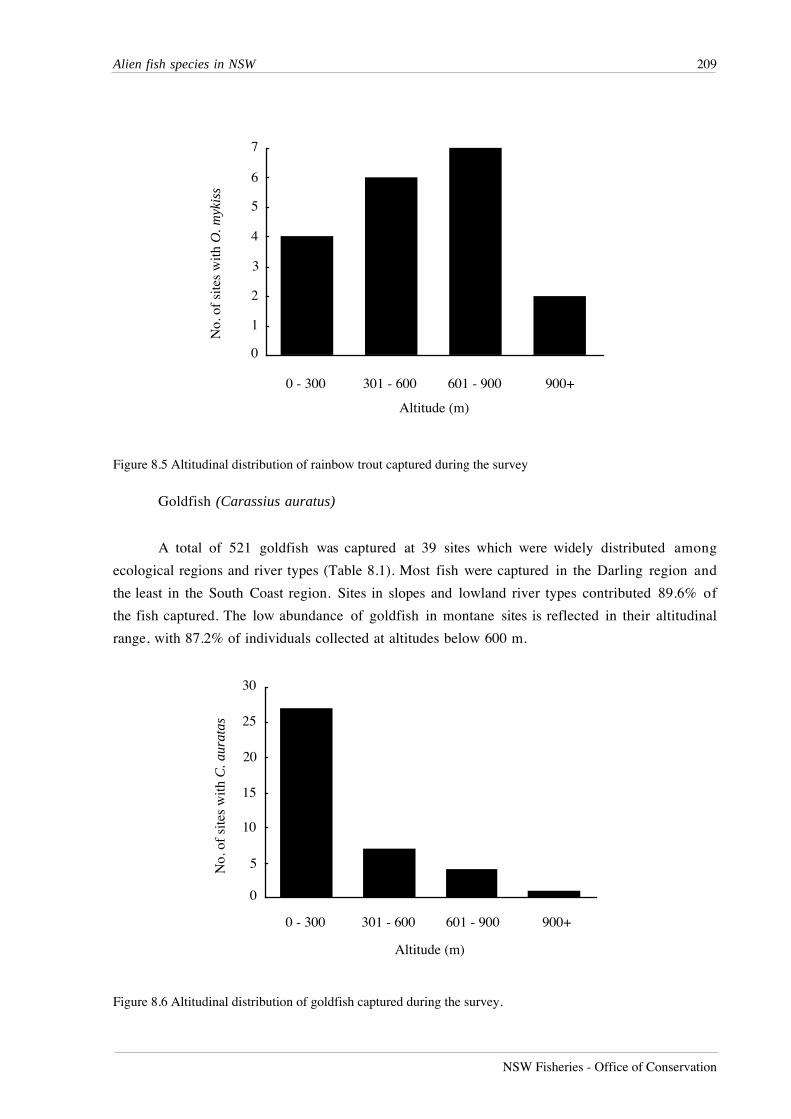
Alien fish species in NSW 209
NSW Fisheries - Office of Conservation
Goldfish (Carassius auratus)
A total of 521 goldfish was captured at 39 sites which were widely distributed among
ecological regions and river types (Table 8.1). Most fish were captured in the Darling region and
the least in the South Coast region. Sites in slopes and lowland river types contributed 89.6% of
the fish captured. The low abundance of goldfish in montane sites is reflected in their altitudinal
range, with 87.2% of individuals collected at altitudes below 600 m.
0 - 300 301 - 600 601 - 900 900+
0
1
2
3
4
5
6
7
No.
of
site
s w
ith O
. myk
iss
Altitude (m)
Figure 8.5 Altitudinal distribution of rainbow trout captured during the survey
0
5
0 - 300 301 - 600 601 - 900 900+
10
15
20
25
30
No.
of
site
s w
ith C
. aur
atas
Altitude (m)
Figure 8.6 Altitudinal distribution of goldfish captured during the survey.
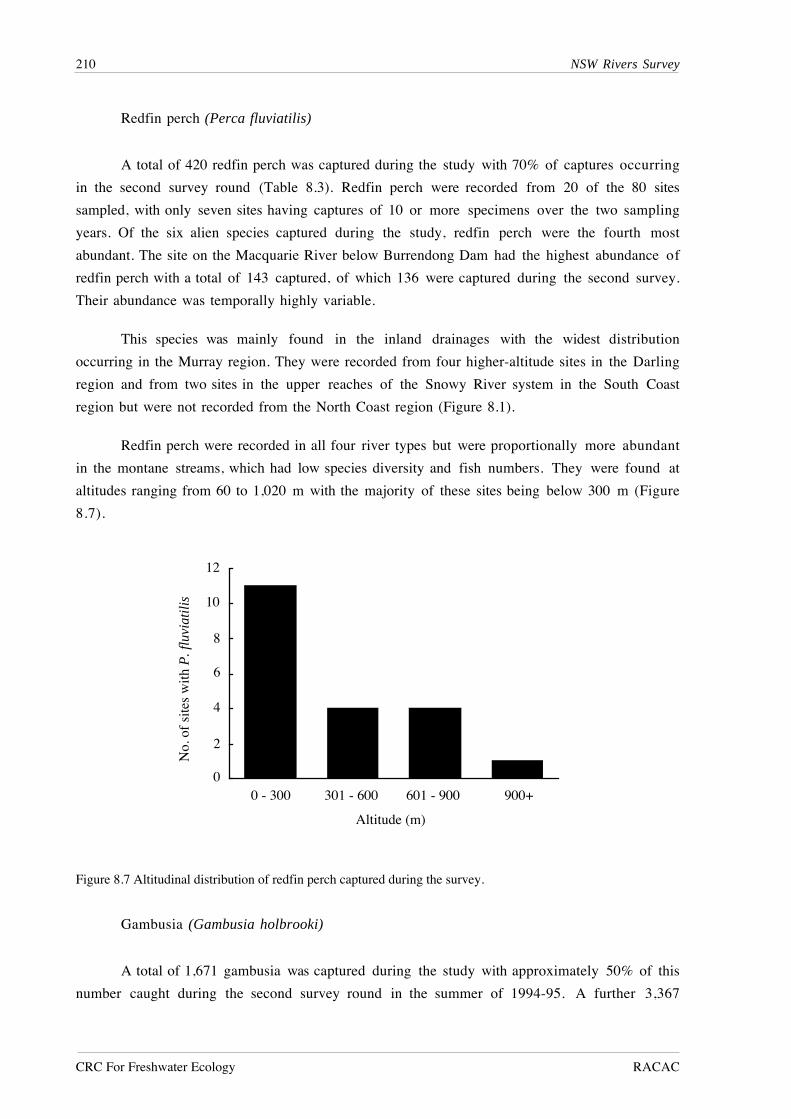
210 NSW Rivers Survey
CRC For Freshwater Ecology RACAC
Redfin perch (Perca fluviatilis)
A total of 420 redfin perch was captured during the study with 70% of captures occurring
in the second survey round (Table 8.3). Redfin perch were recorded from 20 of the 80 sites
sampled, with only seven sites having captures of 10 or more specimens over the two sampling
years. Of the six alien species captured during the study, redfin perch were the fourth most
abundant. The site on the Macquarie River below Burrendong Dam had the highest abundance of
redfin perch with a total of 143 captured, of which 136 were captured during the second survey.
Their abundance was temporally highly variable.
This species was mainly found in the inland drainages with the widest distribution
occurring in the Murray region. They were recorded from four higher-altitude sites in the Darling
region and from two sites in the upper reaches of the Snowy River system in the South Coast
region but were not recorded from the North Coast region (Figure 8.1).
Redfin perch were recorded in all four river types but were proportionally more abundant
in the montane streams, which had low species diversity and fish numbers. They were found at
altitudes ranging from 60 to 1,020 m with the majority of these sites being below 300 m (Figure
8.7).
Gambusia (Gambusia holbrooki)
A total of 1,671 gambusia was captured during the study with approximately 50% of this
number caught during the second survey round in the summer of 1994-95. A further 3,367
No.
of
site
s w
ith P
. flu
viat
ilis
12
4
0
2
6
8
10
0 - 300 301 - 600 601 - 900 900+
Altitude (m)
Figure 8.7 Altitudinal distribution of redfin perch captured during the survey.
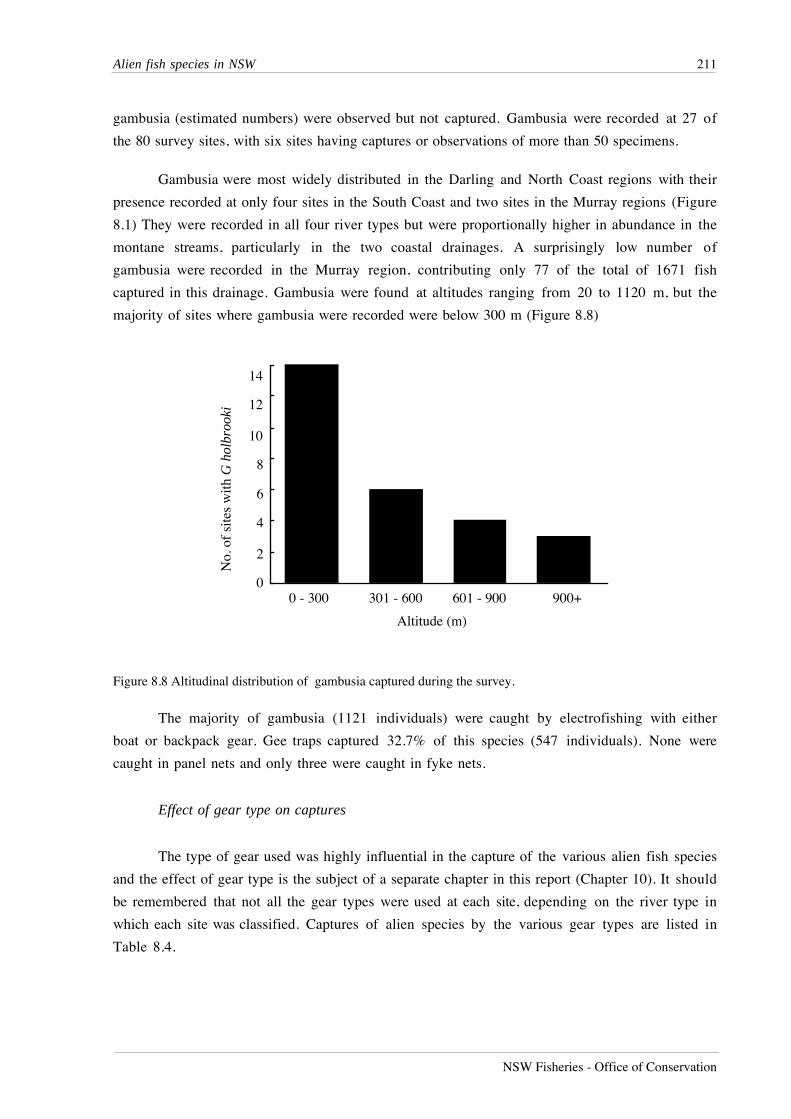
Alien fish species in NSW 211
NSW Fisheries - Office of Conservation
gambusia (estimated numbers) were observed but not captured. Gambusia were recorded at 27 of
the 80 survey sites, with six sites having captures or observations of more than 50 specimens.
Gambusia were most widely distributed in the Darling and North Coast regions with their
presence recorded at only four sites in the South Coast and two sites in the Murray regions (Figure
8.1) They were recorded in all four river types but were proportionally higher in abundance in the
montane streams, particularly in the two coastal drainages. A surprisingly low number of
gambusia were recorded in the Murray region, contributing only 77 of the total of 1671 fish
captured in this drainage. Gambusia were found at altitudes ranging from 20 to 1120 m, but the
majority of sites where gambusia were recorded were below 300 m (Figure 8.8)
The majority of gambusia (1121 individuals) were caught by electrofishing with either
boat or backpack gear. Gee traps captured 32.7% of this species (547 individuals). None were
caught in panel nets and only three were caught in fyke nets.
Effect of gear type on captures
The type of gear used was highly influential in the capture of the various alien fish species
and the effect of gear type is the subject of a separate chapter in this report (Chapter 10). It should
be remembered that not all the gear types were used at each site, depending on the river type in
which each site was classified. Captures of alien species by the various gear types are listed in
Table 8.4.
0
2
4
6
8
10
12
14
No.
of
site
s w
ith G
hol
broo
ki
0 - 300 301 - 600 601 - 900 900+
Altitude (m)
Figure 8.8 Altitudinal distribution of gambusia captured during the survey.
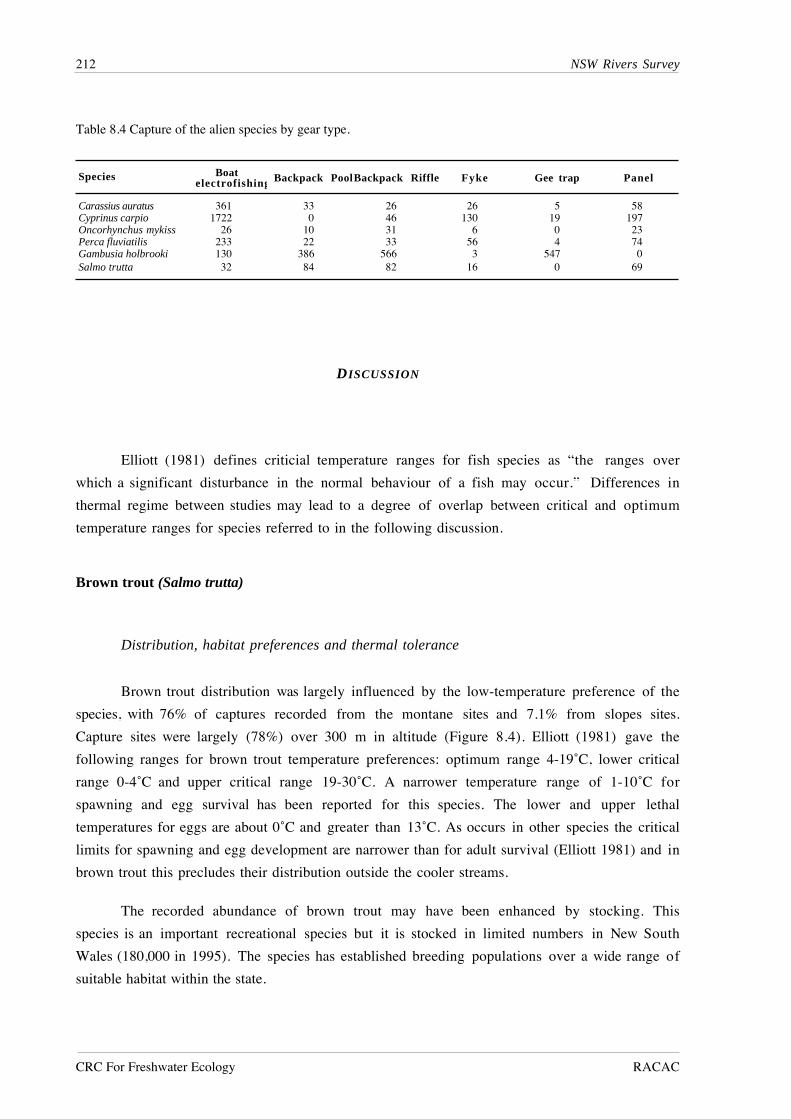
212 NSW Rivers Survey
CRC For Freshwater Ecology RACAC
DISCUSSION
Elliott (1981) defines criticial temperature ranges for fish species as “the ranges over
which a significant disturbance in the normal behaviour of a fish may occur.” Differences in
thermal regime between studies may lead to a degree of overlap between critical and optimum
temperature ranges for species referred to in the following discussion.
Brown trout (Salmo trutta)
Distribution, habitat preferences and thermal tolerance
Brown trout distribution was largely influenced by the low-temperature preference of the
species, with 76% of captures recorded from the montane sites and 7.1% from slopes sites.
Capture sites were largely (78%) over 300 m in altitude (Figure 8.4). Elliott (1981) gave the
following ranges for brown trout temperature preferences: optimum range 4-19˚C, lower critical
range 0-4˚C and upper critical range 19-30˚C. A narrower temperature range of 1-10˚C for
spawning and egg survival has been reported for this species. The lower and upper lethal
temperatures for eggs are about 0˚C and greater than 13˚C. As occurs in other species the critical
limits for spawning and egg development are narrower than for adult survival (Elliott 1981) and in
brown trout this precludes their distribution outside the cooler streams.
The recorded abundance of brown trout may have been enhanced by stocking. This
species is an important recreational species but it is stocked in limited numbers in New South
Wales (180,000 in 1995). The species has established breeding populations over a wide range of
suitable habitat within the state.
Table 8.4 Capture of the alien species by gear type.
Species Boat electrofishing Backpack PoolBackpack Riffle Fyke Gee trap Panel
Carassius auratus 361 33 26 26 5 58 Cyprinus carpio 1722 0 46 130 19 197 Oncorhynchus mykiss 26 10 31 6 0 23 Perca fluviatilis 233 22 33 56 4 74 Gambusia holbrooki 130 386 566 3 547 0 Salmo trutta 32 84 82 16 0 69
Alien fish species in NSW 213
NSW Fisheries - Office of Conservation
Impacts of brown trout on other fish species
The decline of populations of the mountain galaxiid Galaxias olidus has been attributed to
predation by brown trout (Frankenburg 1966; Tilzey 1976; Fletcher 1979; 1986; Jackson and
Williams 1980). Furthermore, Fletcher (1979) found similarities in the diets of both species,
suggesting an overlap in their diets. During the present study brown trout were captured at 18
sites. At 8 (44%) of these sites G. olidus were also captured, indicating that at least in some
situations these species can coexist.
Jackson (1978) showed that for sympatric populations of brown trout and river blackfish,
Gadopsis marmoratus, although their diets were similar, coexistence was possible because each
species occupied different habitats. It is also probable that brown trout can eliminate invertebrate
species by predation (Fletcher 1979; Williams 1974). Williams (1974) found that brown trout
predation most likely caused the decline of the Tasmanian mountain shrimp Anaspides tasmaniae
and Fletcher (1979) demonstrated a decline in invertebrates after brown trout were introduced to a
stream where G. olidus also occurred. Trout may also impact riparian fauna species as they have
been reported to prey on small reptiles (Lintermans 1992; Rutzou et al. 1994).
Rainbow trout (Oncorhynchus mykiss)
As with brown trout, rainbow trout were largely confined to the upper reaches of the rivers
surveyed, with 75% of capture records being from montane or slope sites. Those sites below 600
m altitude were on rivers emanating from high altitudes or received cool water from large dams
upstream, so that water temperature influenced the distributional pattern. Elliott (1981) gave the
optimum range for rainbow trout as 10-22˚C, the lower critical range 0-9˚C and the upper critical
range as 19-30˚C. The spawning temperature lies in the range 4-19˚C and the lower and upper
lethal temperatures for eggs are about 0˚C and above 20˚C. Large-scale stocking of this species
takes place throughout suitable locations and it is an important recreational species. During 1995,
350,000 rainbow trout were released from the NSW Fisheries hatchery at Jindabyne and fish were
also released from the Ebor hatchery.
Effects of rainbow trout on other species
Although rainbow trout have not been as strongly linked to predation on smaller fish
species as brown trout, their presence has been shown to affect invertebrates, particularly
zooplankton, in both size and species composition (Galbraith 1967; Brooks 1968). Lintermans
and Rutzou (1990) found that rainbow trout and G. olidus had almost mutually exclusive
distributions in the upper Cotter River catchment in the ACT indicating that rainbow trout are
similar to brown trout in their impacts on this galaxiid. Although of the 19 sites at which rainbow
trout were captured during the present study, 9 (47.4%) of these sites were also inhabited by
214 NSW Rivers Survey
CRC For Freshwater Ecology RACAC
G. olidus indicating that cohabitation is possible. They have also been reported as preying on
small reptiles (Lintermans 1992; Rutzou et al. 1994).
Epizootic Haematopoietic Necrosis Virus also has also been recorded from cultured
rainbow trout and translocation of redfin perch and salmonids poses a risk of the disease
spreading to native fish as some native species have been shown to be highly susceptible to the
virus (Langdon 1990).
Goldfish (Carassius auratus)
Goldfish were widely distributed, largely (86.8%) at sites below 600 m altitude. Only five
of the capture sites were in the montane rivers. Cyprinids such as goldfish are eurythermic (Elliott
1981), and therefore have a generalised distribution in New South Wales. Goldfish have an
optimal temperature near 27˚C, a lower critical range of 0-17˚C and an upper critical range of 27-
42˚C. Spawning temperatures are in the range of 5-19˚C (Billard et al. 1981). It is also a fish of
slower-flowing waters and pools and can survive low oxygen concentrations (McDowall 1996a).
Goldfish have been present as wild populations in Australia for many decades but few
deterimental impacts have been recorded. However, this may simply reflect the lack of research
directed at this species.
Effects of goldfish on other fish species
Goldfish ulcer disease (GUD) is a bacterial disease of goldfish and is caused by an atypical
strain of Aeromonas salmonicida. The disease was first isolated from a goldfish farm in Victoria in
1974 (Rowland and Ingram 1991; Trust et al. 1980). Since then outbreaks have occurred at
warmwater fish hatcheries in New South Wales and Victoria (Whittington et al. 1987). Rowland
and Ingram (1991) stated that fingerlings of Murray cod, Maccullochella peelii, golden perch,
Macquaria ambigua, and silver perch, Bidyanus bidyanus, are resistant to GUD but that salmonids
are highly susceptible. This has obvious implications for the valuable aquaculture industry based
on salmonids and possibly for the major recreational fisheries exploiting salmonid fish in the wild.
Redfin perch (Perca fluviatilis)
Distribution, habitat preferences and thermal tolerance
The majority of sites where redfin perch were recorded were in the slopes or lowland
rivers. This is in accordance with the reported distribution of this species in Tasmania (Weatherley
1974), Victoria (Cadwallader and Backhouse 1983), and Britain (Weatherley 1963b). The
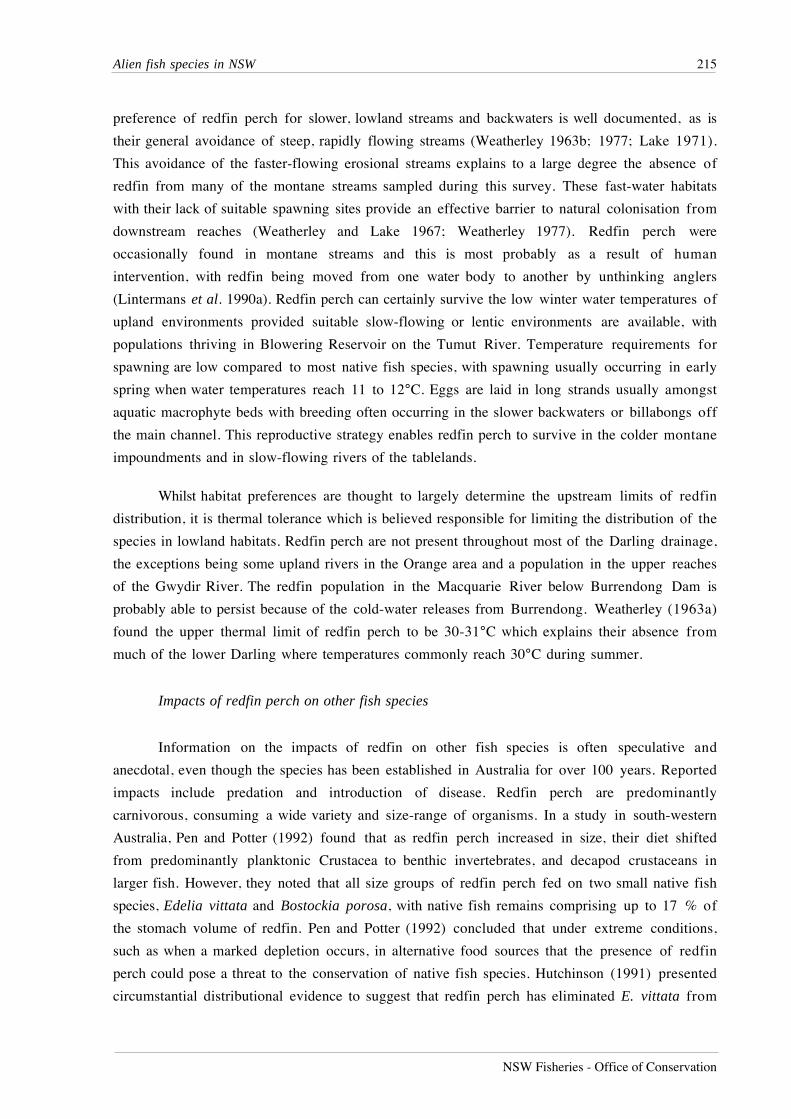
Alien fish species in NSW 215
NSW Fisheries - Office of Conservation
preference of redfin perch for slower, lowland streams and backwaters is well documented, as is
their general avoidance of steep, rapidly flowing streams (Weatherley 1963b; 1977; Lake 1971).
This avoidance of the faster-flowing erosional streams explains to a large degree the absence of
redfin from many of the montane streams sampled during this survey. These fast-water habitats
with their lack of suitable spawning sites provide an effective barrier to natural colonisation from
downstream reaches (Weatherley and Lake 1967; Weatherley 1977). Redfin perch were
occasionally found in montane streams and this is most probably as a result of human
intervention, with redfin being moved from one water body to another by unthinking anglers
(Lintermans et al. 1990a). Redfin perch can certainly survive the low winter water temperatures of
upland environments provided suitable slow-flowing or lentic environments are available, with
populations thriving in Blowering Reservoir on the Tumut River. Temperature requirements for
spawning are low compared to most native fish species, with spawning usually occurring in early
spring when water temperatures reach 11 to 12°C. Eggs are laid in long strands usually amongst
aquatic macrophyte beds with breeding often occurring in the slower backwaters or billabongs off
the main channel. This reproductive strategy enables redfin perch to survive in the colder montane
impoundments and in slow-flowing rivers of the tablelands.
Whilst habitat preferences are thought to largely determine the upstream limits of redfin
distribution, it is thermal tolerance which is believed responsible for limiting the distribution of the
species in lowland habitats. Redfin perch are not present throughout most of the Darling drainage,
the exceptions being some upland rivers in the Orange area and a population in the upper reaches
of the Gwydir River. The redfin population in the Macquarie River below Burrendong Dam is
probably able to persist because of the cold-water releases from Burrendong. Weatherley (1963a)
found the upper thermal limit of redfin perch to be 30-31°C which explains their absence from
much of the lower Darling where temperatures commonly reach 30°C during summer.
Impacts of redfin perch on other fish species
Information on the impacts of redfin on other fish species is often speculative and
anecdotal, even though the species has been established in Australia for over 100 years. Reported
impacts include predation and introduction of disease. Redfin perch are predominantly
carnivorous, consuming a wide variety and size-range of organisms. In a study in south-western
Australia, Pen and Potter (1992) found that as redfin perch increased in size, their diet shifted
from predominantly planktonic Crustacea to benthic invertebrates, and decapod crustaceans in
larger fish. However, they noted that all size groups of redfin perch fed on two small native fish
species, Edelia vittata and Bostockia porosa, with native fish remains comprising up to 17 % of
the stomach volume of redfin. Pen and Potter (1992) concluded that under extreme conditions,
such as when a marked depletion occurs, in alternative food sources that the presence of redfin
perch could pose a threat to the conservation of native fish species. Hutchinson (1991) presented
circumstantial distributional evidence to suggest that redfin perch has eliminated E. vittata from
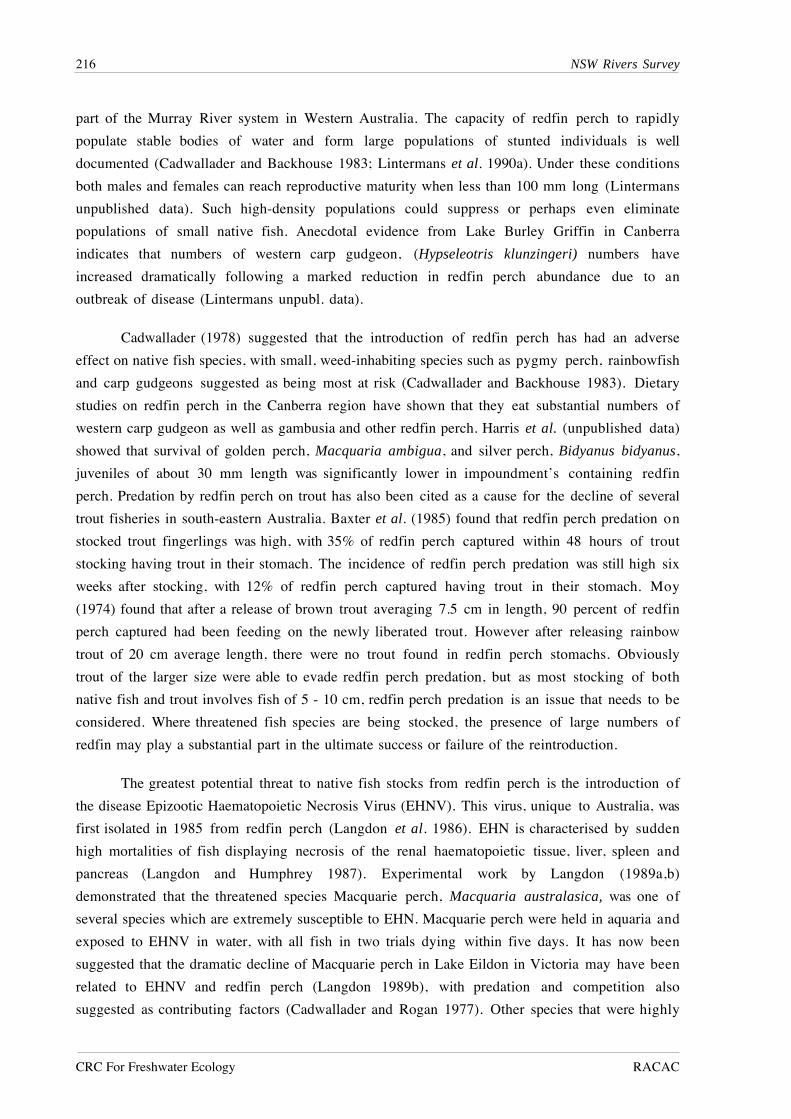
216 NSW Rivers Survey
CRC For Freshwater Ecology RACAC
part of the Murray River system in Western Australia. The capacity of redfin perch to rapidly
populate stable bodies of water and form large populations of stunted individuals is well
documented (Cadwallader and Backhouse 1983; Lintermans et al. 1990a). Under these conditions
both males and females can reach reproductive maturity when less than 100 mm long (Lintermans
unpublished data). Such high-density populations could suppress or perhaps even eliminate
populations of small native fish. Anecdotal evidence from Lake Burley Griffin in Canberra
indicates that numbers of western carp gudgeon, (Hypseleotris klunzingeri) numbers have
increased dramatically following a marked reduction in redfin perch abundance due to an
outbreak of disease (Lintermans unpubl. data).
Cadwallader (1978) suggested that the introduction of redfin perch has had an adverse
effect on native fish species, with small, weed-inhabiting species such as pygmy perch, rainbowfish
and carp gudgeons suggested as being most at risk (Cadwallader and Backhouse 1983). Dietary
studies on redfin perch in the Canberra region have shown that they eat substantial numbers of
western carp gudgeon as well as gambusia and other redfin perch. Harris et al. (unpublished data)
showed that survival of golden perch, Macquaria ambigua, and silver perch, Bidyanus bidyanus,
juveniles of about 30 mm length was significantly lower in impoundment’s containing redfin
perch. Predation by redfin perch on trout has also been cited as a cause for the decline of several
trout fisheries in south-eastern Australia. Baxter et al. (1985) found that redfin perch predation on
stocked trout fingerlings was high, with 35% of redfin perch captured within 48 hours of trout
stocking having trout in their stomach. The incidence of redfin perch predation was still high six
weeks after stocking, with 12% of redfin perch captured having trout in their stomach. Moy
(1974) found that after a release of brown trout averaging 7.5 cm in length, 90 percent of redfin
perch captured had been feeding on the newly liberated trout. However after releasing rainbow
trout of 20 cm average length, there were no trout found in redfin perch stomachs. Obviously
trout of the larger size were able to evade redfin perch predation, but as most stocking of both
native fish and trout involves fish of 5 - 10 cm, redfin perch predation is an issue that needs to be
considered. Where threatened fish species are being stocked, the presence of large numbers of
redfin may play a substantial part in the ultimate success or failure of the reintroduction.
The greatest potential threat to native fish stocks from redfin perch is the introduction of
the disease Epizootic Haematopoietic Necrosis Virus (EHNV). This virus, unique to Australia, was
first isolated in 1985 from redfin perch (Langdon et al. 1986). EHN is characterised by sudden
high mortalities of fish displaying necrosis of the renal haematopoietic tissue, liver, spleen and
pancreas (Langdon and Humphrey 1987). Experimental work by Langdon (1989a,b)
demonstrated that the threatened species Macquarie perch, Macquaria australasica, was one of
several species which are extremely susceptible to EHN. Macquarie perch were held in aquaria and
exposed to EHNV in water, with all fish in two trials dying within five days. It has now been
suggested that the dramatic decline of Macquarie perch in Lake Eildon in Victoria may have been
related to EHNV and redfin perch (Langdon 1989b), with predation and competition also
suggested as contributing factors (Cadwallader and Rogan 1977). Other species that were highly
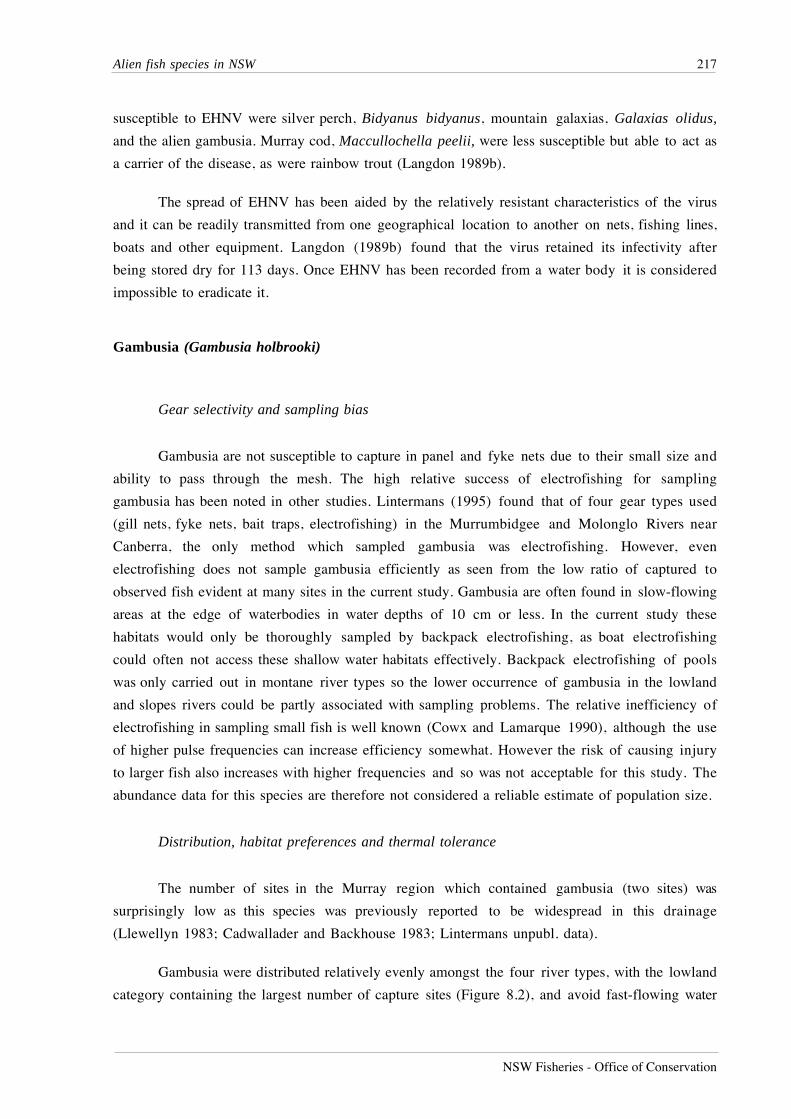
Alien fish species in NSW 217
NSW Fisheries - Office of Conservation
susceptible to EHNV were silver perch, Bidyanus bidyanus, mountain galaxias, Galaxias olidus,
and the alien gambusia. Murray cod, Maccullochella peelii, were less susceptible but able to act as
a carrier of the disease, as were rainbow trout (Langdon 1989b).
The spread of EHNV has been aided by the relatively resistant characteristics of the virus
and it can be readily transmitted from one geographical location to another on nets, fishing lines,
boats and other equipment. Langdon (1989b) found that the virus retained its infectivity after
being stored dry for 113 days. Once EHNV has been recorded from a water body it is considered
impossible to eradicate it.
Gambusia (Gambusia holbrooki)
Gear selectivity and sampling bias
Gambusia are not susceptible to capture in panel and fyke nets due to their small size and
ability to pass through the mesh. The high relative success of electrofishing for sampling
gambusia has been noted in other studies. Lintermans (1995) found that of four gear types used
(gill nets, fyke nets, bait traps, electrofishing) in the Murrumbidgee and Molonglo Rivers near
Canberra, the only method which sampled gambusia was electrofishing. However, even
electrofishing does not sample gambusia efficiently as seen from the low ratio of captured to
observed fish evident at many sites in the current study. Gambusia are often found in slow-flowing
areas at the edge of waterbodies in water depths of 10 cm or less. In the current study these
habitats would only be thoroughly sampled by backpack electrofishing, as boat electrofishing
could often not access these shallow water habitats effectively. Backpack electrofishing of pools
was only carried out in montane river types so the lower occurrence of gambusia in the lowland
and slopes rivers could be partly associated with sampling problems. The relative inefficiency of
electrofishing in sampling small fish is well known (Cowx and Lamarque 1990), although the use
of higher pulse frequencies can increase efficiency somewhat. However the risk of causing injury
to larger fish also increases with higher frequencies and so was not acceptable for this study. The
abundance data for this species are therefore not considered a reliable estimate of population size.
Distribution, habitat preferences and thermal tolerance
The number of sites in the Murray region which contained gambusia (two sites) was
surprisingly low as this species was previously reported to be widespread in this drainage
(Llewellyn 1983; Cadwallader and Backhouse 1983; Lintermans unpubl. data).
Gambusia were distributed relatively evenly amongst the four river types, with the lowland
category containing the largest number of capture sites (Figure 8.2), and avoid fast-flowing water
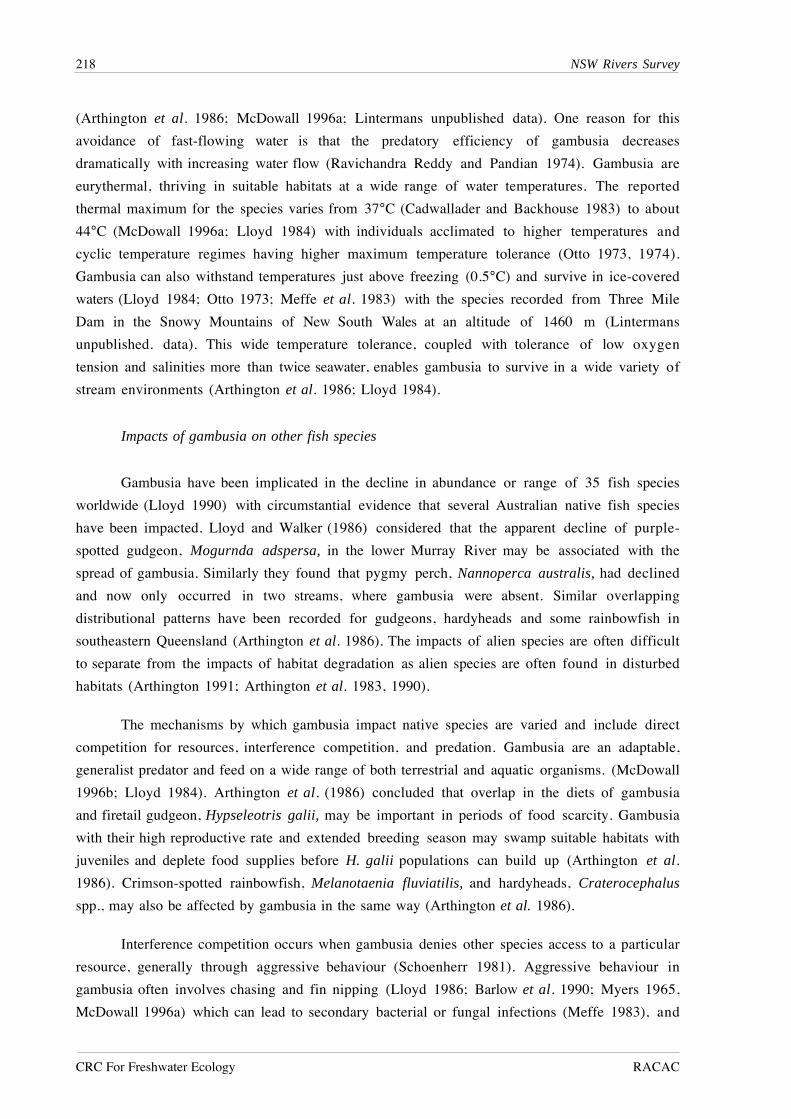
218 NSW Rivers Survey
CRC For Freshwater Ecology RACAC
(Arthington et al. 1986; McDowall 1996a; Lintermans unpublished data). One reason for this
avoidance of fast-flowing water is that the predatory efficiency of gambusia decreases
dramatically with increasing water flow (Ravichandra Reddy and Pandian 1974). Gambusia are
eurythermal, thriving in suitable habitats at a wide range of water temperatures. The reported
thermal maximum for the species varies from 37°C (Cadwallader and Backhouse 1983) to about
44°C (McDowall 1996a; Lloyd 1984) with individuals acclimated to higher temperatures and
cyclic temperature regimes having higher maximum temperature tolerance (Otto 1973, 1974).
Gambusia can also withstand temperatures just above freezing (0.5°C) and survive in ice-covered
waters (Lloyd 1984; Otto 1973; Meffe et al. 1983) with the species recorded from Three Mile
Dam in the Snowy Mountains of New South Wales at an altitude of 1460 m (Lintermans
unpublished. data). This wide temperature tolerance, coupled with tolerance of low oxygen
tension and salinities more than twice seawater, enables gambusia to survive in a wide variety of
stream environments (Arthington et al. 1986; Lloyd 1984).
Impacts of gambusia on other fish species
Gambusia have been implicated in the decline in abundance or range of 35 fish species
worldwide (Lloyd 1990) with circumstantial evidence that several Australian native fish species
have been impacted. Lloyd and Walker (1986) considered that the apparent decline of purple-
spotted gudgeon, Mogurnda adspersa, in the lower Murray River may be associated with the
spread of gambusia. Similarly they found that pygmy perch, Nannoperca australis, had declined
and now only occurred in two streams, where gambusia were absent. Similar overlapping
distributional patterns have been recorded for gudgeons, hardyheads and some rainbowfish in
southeastern Queensland (Arthington et al. 1986). The impacts of alien species are often difficult
to separate from the impacts of habitat degradation as alien species are often found in disturbed
habitats (Arthington 1991; Arthington et al. 1983, 1990).
The mechanisms by which gambusia impact native species are varied and include direct
competition for resources, interference competition, and predation. Gambusia are an adaptable,
generalist predator and feed on a wide range of both terrestrial and aquatic organisms. (McDowall
1996b; Lloyd 1984). Arthington et al. (1986) concluded that overlap in the diets of gambusia
and firetail gudgeon, Hypseleotris galii, may be important in periods of food scarcity. Gambusia
with their high reproductive rate and extended breeding season may swamp suitable habitats with
juveniles and deplete food supplies before H. galii populations can build up (Arthington et al.
1986). Crimson-spotted rainbowfish, Melanotaenia fluviatilis, and hardyheads, Craterocephalus
spp., may also be affected by gambusia in the same way (Arthington et al. 1986).
Interference competition occurs when gambusia denies other species access to a particular
resource, generally through aggressive behaviour (Schoenherr 1981). Aggressive behaviour in
gambusia often involves chasing and fin nipping (Lloyd 1986; Barlow et al. 1990; Myers 1965,
McDowall 1996a) which can lead to secondary bacterial or fungal infections (Meffe 1983), and
Alien fish species in NSW 219
NSW Fisheries - Office of Conservation
eventually death (Meffe et al. 1983). Schoenherr (1981) discussed a behavioural hierarchy in
which gambusia females are dominant and aggressive, resulting in increased mortality rates and
reduced fecundity of the Gila topminnow, Poeciliopsis occidentalis. This reduction in survival of
adult female Gila topminnows was attributed to increased physiological stress due to aggression
from gambusia (Schoenherr 1981).
Gambusia are also known to prey upon the eggs and fry of other fish species (Schoenherr
1981), with Meffe (1985) calculating that a single female gambusia could consume the entire
annual production of fry of the Gila topminnow. Meffe (1985) concluded that even a low
predation rate on fry could have a significant impact if the target species has low fecundity or if
the predator is abundant.
Species expected but not captured
The six alien species recorded for New South Wales but not captured during the current
survey are yellowfin goby, roach, Atlantic salmon, brook trout, tench and oriental weatherloach.
The absence of each species from the survey can be explained by either habitat preferences, very
small populations or extremely limited distributions. The yellowfin goby, an import from Asia
presumed to have entered Australia via ballast water from ships, typically inhabits estuaries of
major ports and has been captured from upper estuarine limits in the Hawkesbury River, New
South Wales (Harris 1995a).
The two salmonid species, brook trout and Atlantic salmon, are maintained in the wild by
stocking and are released in only a limited number of sites, mostly in impoundments, which the
current survey did not sample. Oriental weatherloach is a popular aquarium fish which was first
detected in the wild in 1984 in both Victoria and the Australian Capital Territory. (Allen 1984;
Lintermans et al. 1990b). This species is abundant but only in localised populations (Lintermans
and Burchmore 1996), and was not detected during this survey. Tench and roach have only rarely
been recorded in New South Wales (Llewellyn 1983), occurring in small numbers and with
restricted distributions.
Ecological consequences of alien fish species
Alien species are more likely to be successful in disturbed habitats and to occupy broad
ecological niches (Arthington et al, 1990; Courtenay and Hensley 1980; Harris 1995b; Ross
1991). Apart from the two trout species, which thrive in headwater streams because of available
niches and because there are often no large competing predatory species other than eels (Harris
1995), the alien species found during this survey largely occupy disturbed ecosystems. The
220 NSW Rivers Survey
CRC For Freshwater Ecology RACAC
habitats have been altered in many ways including flow regulation by weirs and dams altering
both the flow and temperature regimes.
The impacts of alien species on the native fish and invertebrates are many and can include
food competition, predation, space competition, habitat disturbance and their role as disease
vectors (Harris 1995a; Fletcher 1986; Cadwallader 1996). They have also been implicated in
extinctions of fish species. Miller et al. (1989) showed that for a range of extinct North American
fish species the most common cause of extinction was habitat loss but the effects of introduced
species were responsible for the demise of 68% of 40 taxa now extinct. Alien fish species may also
be impacting other faunal groups such as invertebrates and amphibians. Predation by trout on
tadpoles of the endangered spotted tree frog Littoria spenceri is considered a major threat to this
species (G. Gillespie, personal communication). Predation by gambusia on eggs and lavae
probably threatens other aquatic taxa, especially amphibians.
REFERENCES
Allen, S. (1984). Occurrence of juvenile oriental weatherloach Misgurnus anguillicaudatus(Pisces: Cobitidae) in the Yarra River. Victorian Naturalist, 101 (5): 240-242
Arthington, A. H. (1991). Ecological and genetic impacts of introduced and translocatedfreshwater fishes in Australia. Canadian Journal of Fish and Aquatic Sciences 48 (Suppl.1): 33-43.
Arthington, A. H., Hamlet, S. and Bluhdorn, D. R. (1990). The role of habitat disturbance in theestablishment of introduced warm-water fishes in Australia. In D. A. Pollard (ed.)Proceedings of the Australian Society for Fish Biology Workshop on Introduced andTranslocated Fishes and their Ecological Effects. Magnetic Island, Townsville, August1989. Bureau of Rural Resources Proceedings No. 8 Australian Government PublishingService, Canberra
Arthington, A. H., Milton, D. A. and McKay, R. J. (1983). Effects of urban development andhabitat alterations on the distribution and abundance of native and exotic freshwater fishin the Brisbane region, Queensland. Australian Journal of Ecology. 8, 87-101.
Arthington. A. H., McKay, R. J. and Milton, D. A. (1986). The ecology and management ofexotic and endemic freshwater fishes in Queensland. In: T. J. A. Hundloe (ed.) FisheriesManagement: Theory and Practice in Queensland. Griffith University Press.
Barlow, C., Reynolds, L. F. and Bock, K. (1990). Fish in Farm Dams. Agfact F3.1.1, NSWAgriculture and Fisheries
Baxter, A. F., Vallis, S. L. and Hume, D. J. (1985). The predation of recently released rainbowtrout fingerlings (Salmo gairdneri) by redfin (Perca fluviatilis) in Lake Burrumbeet,October - December 1983. Arthur Rylah Institute for Environmental Research TechnicalReport Series No 16.
Billard, R., Bry, C. and Gillet, C. (1981). Stress, environment and reproduction in teleost fish. InPickering, A.D. (Ed.) Stress and Fish. Academic Press, London.
Brooks, J.L. (1968). The effects of prey size selection by lake planktivores. Systematic Zoology17, 273-91.
Alien fish species in NSW 221
NSW Fisheries - Office of Conservation
Cadawallader P.L. (1996). Overview of the impacts of introduced salmonids on Australian nativefauna. Australian Nature Conservation Agency, Canberra.
Cadwallader, P. L (1978). Some causes of the decline in range and abundance of native fish in theMurray-Darling river system. Proceedings of the Royal Society of Victoria. 90, 211-24.
Cadwallader, P. L. and Backhouse, G. N. (1984). A Guide to the Freshwater Fish of Victoria.Victorian Government Printing Office, Melbourne.
Cadwallader, P. L. and Rogan, P. L. (1977). The Macquarie perch Macquaria australasica (Pisces:Percicthyidae), of Lake Eildon, Victoria. Australian Journal of Ecology 2, 409-18.
Courtenay,W.R. Jnr. and Hensley, D.A. (1980). Special problems associated with monitoringexotic species. pp 281-307 In Hocutt, C.H. and Stauffer, J.R. Jnr (Eds) Biologicalmonitoring of fish. Lexington Books, Lexington Massachusetts.
Cowx, I. G. and Lamarque, P. (1990). Fishing with Electricity: Applications in FreshwaterFisheries Management. Fishing News Books, Oxford.
Elliott, J.M. (1981). Some aspects of thermal stress on freshwater teleosts., In Pickering, A.D. (Ed.)Stress and Fish. Academic Press, London.
Fletcher, A.R. (1979). “Effects of Salmo trutta on Galaxias olidus and macroinvertebrates instream communities”. M.Sc. Thesis, Monash University.
Fletcher, A.R. (1986). Effects of introduced fish in Australia. In Limnology in Australia (P.DeDeckker and W.D. Williams Eds.) CSIRO Melbourne and Junk, Dordrecht. Pp 231-38.
Frankenburg, R.S. (1966). Fishes of the Family Galaxiidae. Australian Natural History 15,161-64.
Galbraith, M.G. (1967). Size-selective predation on Daphnia by rainbow trout and yellow perch.Transactions of the American Fisheries Society 96, 1-10.
Harris, J. H. (1995a). Alien fishes in Australia. In Diekman B., (ed.) Unwanted Aliens? Australia’sIntroduced Animals (Proceedings of Nature Conservation Council of NSW Seminar, 23-24September 1994, Sydney.
Harris, J. H. (1995b) The use of fish in ecological assessments. Australian Journal of Ecology 20,65 - 80.
Harris, J. H., Bruce, A., Davis, K., Hartley, S. and Silveira, R. (1995). Study of the Fish resources ofNSW Rivers. First Annual Report, May 1995. NSW Fisheries Research Institute andCooperative Research Centre for Freshwater Ecology.
Hutchinson, M. J. (1991). Distribution patterns of redfin perch Perca fluviatilis Linnaeus andWestern Pygmy Perch Edelia vittata Castelnau in the Murray River system of WesternAustralia. Records of the Western Australian Museum. 15(1), 295-301.
Jackson, P.D. (1978). Benthic invertebrate fauna and feeding relationships of brown trout Salmotrutta Linnaeus, and river blackfish Gadopsis marmoratus Richardson, in the AberfeldyRiver, Victoria. Australian Journal of Marine and Freshwater Research 29, 725-42.
Jackson, P.D. and Williams, W.D. (1980) Effects of brown trout Salmo trutta L., on the distributionof some native fishes in three areas of southern Victoria. Australian Journal of Marineand Freshwater Research 31, 61-68.
Lake, J. S. (1971). Freshwater Fishes and Rivers of Australia. Thomas Nelson (Australia).
Langdon, J. S. (1989a). Prevention and control of fish diseases in the Murray-Darling basin. In:Proceedings of the Workshop on Native Fish Management, Canberra, 16-18 June 1988.Murray-Darling Basin Commission, Canberra.
Langdon, J. S. (1989b). Experimental transmission and pathogenicity of epizootic haematopoieticnecrosis virus (EHNV) in redfin perch Perca fluviatilis L., and 11 other teleosts. Journalof Fish Diseases 12, 295-310.
Langdon, J.S. 1990. Disease risks of fish introductions and translocations. In Introduced andtranslocated fishes and their ecological effects. Australian Society for Fish BiologyWorkshop. Bureau of Rural Resources Proceedings No. 8, Canberra.
222 NSW Rivers Survey
CRC For Freshwater Ecology RACAC
Langdon, J. S., Humphrey, J. D., Williams, L. M., Hyatt, A. D. and Westbury, H. A. (1986). Firstvirus isolation from Australian fish: an iridovirus-like pathogen from redfin perch Percafluviatilis L. Journal of Fish Diseases 9, 129-35.
Langdon, J. S. and Humphrey, J. D. (1987). Epizootic haematopoietic necrosis, a new viral diseasein redfin perch Perca fluviatilis L., in Australia. Journal of Fish Diseases 10, 289-97.
Lintermans, M. (1992). Predation on Eulamprus tympanum by rainbow trout. Herpetofauna 22,(1) 34-35
Lintermans, M. (1995). Lower Molonglo Water Quality Control Centre Biological MonitoringProgram: 1994 Fish Monitoring Report. Consultancy report to ACT Electricity and Water.
Lintermans, M., and Burchmore, J. (1996). Family Cobitidae: Loaches in McDowall, R.M. (ed)Freshwater fishes of South Eastern Australia, Second edition, Reed.
Lintermans, M., and Rutzou, T. (1990). The fish fauna of the upper Cotter River catchment.Research report 4, ACT Parks and Conservation Service, Canberra.
Lintermans, M., Rutzou, T., and Kukolic, K. (1990a).Introduced fish of the Canberra region -recent range expansions. In D. Pollard (ed.) Proceedings of the Australian Society for FishBiology Workshop on Introduced and Translocated Fishes and their Ecological Effects.Magnetic Island, Townsville, August 1989. Bureau of Rural Resources Proceedings No. 8Australian Government Publishing Service, Canberra.
Lintermans, M., Rutzou, T., and Kukolic, K., (1990b) The status, distribution and possible impactsof the oriental weatherloach Misgurnus anguillicaudatus in the Ginninderra CreekCatchment. Research Report 2, ACT Parks and Conservation Service, Canberra
Llewellyn, L. C. (1983). The Distribution of Fish in New South Wales. Australian Society forLimnology Special Publication No. 7.
Lloyd, L. N. (1984). Exotic fish - useful additions or ‘animal weeds’. Fishes of Sahul 1, 31-34,39-42.
Lloyd, L. N. (1986) An alternative to insect control by “Mosquitofish” Gambusia affinis. In T.D. St. George, B. H. Kay and J. Blok (eds.) Arbovirus research in Australia. Proceedingsof the fourth Symposium, Brisbane 1986.
Lloyd, L. N (1990). Ecological interactions of Gambusia holbrooki with Australian native fishes.In D. Pollard (ed.) Proceedings of the Australian Society for Fish Biology Workshop onIntroduced and Translocated Fishes and their Ecological Effects. Magnetic Island,Townsville, August 1989. Bureau of Rural Resources Proceedings No. 8 AustralianGovernment Publishing Service, Canberra.
Lloyd, L. N. and Walker, K. F. (1986). Distribution and conservation status of small freshwaterfish in the River Murray, South Australia. Transactions of the Royal Society of SouthAustralia. 110, 49-57.
McDowall, R. M. (1996a). Family Poecillidae: Livebearers. In McDowall R. M. (ed.) FreshwaterFishes of South-eastern Australia. Reed Books, Sydney.
Mc Dowall, R. M. (1996b). Family Percidae: Freshwater Perches. In McDowall R. M. (ed.)Freshwater Fishes of South-eastern Australia. Reed Books, Sydney.
Meffe, G. K. (1983). Attempted chemical renovation of an Arizona springbrook for managementof the endangered Sonoran topminnow. North American Journal of FisheriesManagement. 3, 315-21.
Meffe, G. K. (1985). Predation and species replacement in American south-western fishes: A casestudy. Southwestern. Naturalist. 30, 173-87.
Meffe, G, K., Hendrickson, D. A., Minckley, W. L. and Rinne, J. N. (1983). Factors resulting indecline of the endangered Sonoran topminnow Poeciliopsis occidentalis (Atheriniformes:Poecilidae) in the united States. Biological Conservation. 25, 135-59.
Miller, R.R., Willams, J.E. (1989). Extinctions of North American Fishes during the past century.Fisheries 14 (6), 22-38.
Alien fish species in NSW 223
NSW Fisheries - Office of Conservation
Milton, D. A. and Arthington, A. H. (1983). Reproductive biology of Gambusia affinis holbrookiBaird and Girard, Xiphophorus helleri (Gunther) and X. maculatus (Heckel) (Pisces;Poeciliidae) in Queensland, Australia. Journal of Fish Biology 23, 23-41.
Moy, D. R. (1974). Survival of trout liberated into Barkers Creek Reservoir, Harcourt. FreshwaterFisheries Newsletter 6, 19-20.
Myers, G. S. (1965). Gambusia, the fish destroyer. Australian Zoologist. 13, 102.
Otto, R. G. (1973). Temperature tolerance of the mosquitofish, Gambusia affinis (Baird andGirard). Journal of fish biology 5, 575-85.
Otto, R. G. (1974). The effects of acclimation to cyclic thermal regimes on heat tolerance of thewestern mosquitofish. Transactions of the American Fisheries Society. 103, 331-35.
Ravichandra Reddy, S. and Pandian, T. J. (1974). Effect of running water on the predatoryefficiency of the larvivorous fish Gambusia affinis. Oecologia (Berl.) 16, 253-56.
Ross S.T. (1991). Mechanisms structuring stream fish assembledges; are there lessons fromintroduced species? Environmental biology of Fishes 30, 359-368
Rowland S.J. and Ingram B.A. (1991).Diseases of Australian native freshwater fishes withparticular emphasis on the ectoparasitic and fungal diseases of Murray cod(Maccullochella peeli), golden perch (Macquaria ambigua) and silver perch (Bidyanusbidyanus). Fisheries Bulletin 4, NSW Fisheries July 1991.
Rutzou, T.V., Rauhala, M.R. and Ormay, P.I. (1994). The fish fauna of the Tidbinbilla Rivercatchment . Technical Report 7. ACT Parks and Conservation Service, Canberra.
Schoenherr, A. A. (1981). The role of competition in the displacement of native fishes byintroduced species. In Naiman, R. J. and Stolz, D. L, (eds.) Fishes in North AmericanDeserts. Wiley Interscience. New York.
Tilzey, R.D.J. (1976). Observation of interactions between indigenous Galaxiidae and introducedSalmonidae in the Lake Eucumbene catchment. Australian Journal of Marine andFreshwater Research. 27,551-64.
Trust T.J., Khouri A.G. Austin R.A. and Ashburner L.D. (1980). first isolation in Australia ofatypical Aeromonas salmonicida. FEMS Microbiology Letters 9, 39-42.
Weatherley, A. H. (1963a). Thermal stress and interrenal tissue in the perch Perca fluviatilis(Linnaeus). Proceedings of the Zoological. Society London. 141, 527-55.
Weatherley, A. H. (1963b). Zoogeography of Perca fluviatilis (Linnaeus) and Perca flavescens(Mitchill) with special reference to the effects of high temperature. Proceedings of theZoological. Society London, 141, 557-76.
Weatherley, A. H. (1974). Introduced freshwater fish. In: Williams W. D. (ed.) Biogeography andEcology in Tasmania. Monographiae Biologicae Volume 25, Dr. W Junk Publishers, TheHague.
Weatherley, A. H. (1977). Perca fluviatilis in Australia: Zoogeographic expression of a life cyclein relation to an environment. Journal of the Fisheries Research Board of Canada, 34,1464-66.
Weatherley, A. H. and Lake J. S. (1967). Introduced fish species in Australian waters; pp 217-239.In Weatherley A. H. (ed.) Australian inland waters and their fauna: eleven studies,Australian National University Press, Canberra.
Whittington R.J., Gudkovs N., Carrington M.J., Ashburner L.D. and Thurstan S.J. (1987). Clinicalmicrobiological and epidemiological findings in recent outbreaks of goldfish ulcer diseasedue to atypical Aeromonas salmonicida in south-eastern Australia. Journal of FishDiseases, 10, 353-62.