Embed Size (px)
Citation preview
Improving Local Service Delivery
for the MDGs in Asia: The Philippines’ Case
A Joint Project of the Philippine Institute for Development Studies (PIDS) and United
Nations Children‘s Fund (UNICEF)
FINAL DRAFT
15 June 2009
Executive Summary
This report argues that improving local service delivery is about improving people‘s lives.
Three reasons are given as evidence for the importance of the report. First, it attempts at assessing
local service delivery systems and practices in the Philippines in light of sector performance of select
three sectors, i.e. education, health, and water. Second, based on the sectoral analyses and comparative
assessment, it interrogates on how local service delivery systems and practices can be improved in
order to formulate sectoral decentralization policy frameworks as inputs to national strategies and
plans in improving local service delivery in the country. And third, that though only sectoral
decentralization assessment on the three sectors is done and not the whole gamut of decentralization
per se, it is able to provide a perspective or a snapshot on how to (i) assess the impact of
decentralization on local service delivery since the enactment of the Philippines‘ Local Government
Code nearly two decades ago, (ii) assess the progress of the Philippines in meeting the Millennium
Development Goals (MDGs), particularly those related to primary and secondary education (Goals 2
and 3), maternal and child health (Goals 4 and 5), and potable water supply (Goal 7), and (iii) assess
how institutional actors have been responsive and been held to account for their powers and
responsibilities in practicing supply-side governance by providing for the critical MDG-related
services as a way to meet the rights-based needs of Filipinos, especially the poor; as well as assess how
Filipinos have been empowered to practice demand-side governance for good performance and better
results.
The report develops a Triangulation Framework for local service delivery as a contribution to the
regional study on ―Improving Local Service Delivery for the MDGs in Asia.‖ Triangulation
Framework is a framework of analysis that provides for a perspective on how to better understand the
dynamics of local service delivery systems and the requirements for improving them, with a view to
replicating best practices and learning from dysfunctional ones. It is a triangulation because local
service delivery, say of education, is better understood and improved upon if it is viewed from three
angles or components, i.e. policy, institutions, and finance; or, more specifically, good policy
environment and effectiveness, efficient intergovernmental fiscal and financial system, and
accountable institutional actors. Although the logic of triangulation is premised on the
interdependence of the three components, this paper argues that institutional actors are primary for at
least three reasons, to wit: (i) local institutional actors such as local government units (LGUs) are at the
forefront of service provision; (ii) despite financial constraints and policy gaps, local institutional
actors can deliver out of innovative practices and political will; and (iii) local institutional agency
entails empowerment and accountability of different actors –civil society, LGUs, private sector – that
can be galvanized and be held accountable in light of the common purpose of providing local public
goods in the most efficient, equitable, sustainable manner. Corollary argument is that governance is
key in helping catalyze institutional change and improve local service delivery for development
outcomes such as quality of life, empowered citizenry, and responsive leadership based on normative
entitlements and against the backdrop of development constraints and limited opportunities for
reforms. The values – rights, equity, quality, and sustainability- and principles of governance –
efficiency, participation, transparency, accountability, and predictability- both lay the groundwork for
delivering services and serve as the indicators in assessing local service delivery. Improving local
service delivery, therefore, is a function of the triangulation of policy, institutions, and finance within
value-based and principle-oriented governance framework.
One of the major thrusts and strategies in improving local service delivery on the three sectors on
education, health, and water is to address key issues and challenges of each sector, as well as take into
account sector reforms and recommendations based on sector performance as inputs to national
development plans, strategies, and programs.
In primary and secondary education, the key policy, institutional, and financial issues and challenges
viewed from the national level are, inter alia: (i) the imperative of ensuring sustainable performance
gains, (ii) low quality of education, (iii) shortage of education inputs, (iv) quality of the teaching staff,
(v) inadequate spending for education, (vi) slow implementation of RA 9155, Philippine EFA 2015,
and BESRA, (vii) the need to strengthen school-based management (SBM), (viii) tension between
central and local authorities, and DepEd and field offices, and (ix) weak, if not dysfunctional, Local
School Boards (LSBs) and School Governing Councils (SGCs).
Viewed from sector analysis on performance outcomes in the LSD areas of Agusan del Sur and
Dumaguete City, the needed policy, institutional, and financial reforms and recommendations are: (i)
improving utilization of allocated MOOE, (ii) clarifying roles and accountabilities of institutions such
as LSBs, SCGs, PTCAs for greater coordination, (iii) improving compliance to compulsory basic
education, (iv) improving funding effectiveness to address equity, (v) clarifying accountabilities for
education outcomes at different levels, (vi) advancing school empowerment through SBM, (vii) greater
coordination, between DepEd and DPWH for example, in school building program, (viii) greater LGU
spending per capita, and (ix) building fund management capability of PTCAs.
In maternal and child health, the key policy, institutional, and financial issues and challenges viewed
from the national level are, inter alia: (i) slow reduction of maternal mortality ratio; (ii) sustaining the
progress in improving child health, particularly U5MR and IMR; (iii) weak responsiveness of health
care system; (iv) weak coordination among LGUs in bridging the gaps in health governance and
operations as crucial factors for effective delivery of maternal and child health; (v) institutional
capacity deficits such as (a) technical, financial, institutional, and managerial capacities of LGUs for
devolved health functions and responsibilities and, (b) supervisory, policy-making, standard-setting,
technical-assistance to LGUs of the central government and its regional agencies resulting to, among
others, inability of the LGUs to deliver on the devolved services such as curative and preventive
healthcare, and the ―hands-off attitude‖ of DOH on those devolved functions despite dismal
performance of the LGUs to ensure improved maternal and child health in particular and health care in
general; (vi) lack of active involvement and effective leadership of local chief executives in fully
realizing the benefits of maternal and child health services; (vii) too much or too little Magna Carta
Benefits for health workers; (viii) the contentious role of traditional birth attendants (TBAs). Based on
sectoral analysis on the performance of LSD areas in terms of maternal and child health, the key
policy, institutional, and financial issues are: (i) the disconnect between policy and local situations in
terms of availability, access, affordability and effectiveness of facility delivery in hard-to-reach
barangays in Agusan del Sur; (ii) lack of link between budgets and accomplishments; (iii) inadequate
resources for non-DOH supported programs such as iron supplements for antenatal care; (iv) problem
of sustainability and coherence between two programs such as Pantawid Pamilyang Pilipino Program
(4Ps) and provision of prenatal care; (v) charging of user fees by RHUs to all patients regardless of
capacity to pay; (vi) problem of membership, expansion of coverage, and ensuring Philhealth benefits
to indigent population, as well as discouraging LGU‘s community health insurance programs such as
the one in Negros Oriental; (vii) ambiguous role of barangay in health financing; (viii) shortage of
health workers and lack of funds for their incentives and benefits; and (ix) inefficient local
procurement of medicines and not fully maximizing the benefits of ILHZ.
The key sector reforms and recommendations for improving maternal and child health are: (i)
unambiguous understanding of LGU roles in health care provision in order to perform better in their
devolve functions such as in improving their provision of health commodities (e.g. iron
supplementation and family planning); (ii) the need for a data collection efficiency and accuracy,
especially for Field Health Services Information System (FHSIS), with the provision of creating
incentives for Barangay Health Workers (BHWs) and compulsory submission of data by the private
sector; (iii) address shortage of health workers by encouraging LGUs to raise revenues and reward
them through performance-based grants for improved revenue generation; (iv) mobilizing societies by
(a) strengthening the role of BHWs or the grassroots health workers, and (b) creating an environment
for private sector to fill in areas not undertaken by the government such as in providing modern
contraceptives, etc.; (v) the need for sustainable and accountable financing by linking planning and
budgeting as well as performance targets and results; (vi) identification of the true poor for Philhealth
memberships beyond political expediency; (vii) not levying user fees to all clients, that is, giving
exemptions to poor clients for maternal and child health programs, as well giving outpatient benefit
package to the indigents; (viii) investing in infrastructure, logistics, facilities, and management
capacity to ensure efficient and effective use of scarce resources such as in less costly procurement of
medicines of LGUS from the National Drug Program-Project Management Unit (NDP-PMU) than
from medical representatives; (ix) avoidance of one-size-fits-all strategy for the health sector without
taking cognizance of the geographic, socio-economic, cultural nuances of local practices such as the
DOH policy of facility-based delivery whose effective implementation takes time for the locals; (xi)
enhancing the quality of maternal and child health by strengthening the role of the provincial health
officer (PHO) in monitoring and evaluating the provision of services by all providers; and (xii)
rethinking decentralization-cum-devolution of health sector, with hybrid decentralization as an
alternative that may well be the suitable design of decentralization as far as the health sector is
concerned.
In water supply, the key policy, institutional, and financial issues and challenges viewed from the
national level are, inter alia: (i) the problem of access and coverage of households with safe drinking
water; (ii) problem of waterlessness that is not adequately addressed by the President‘s Priority
Program on Water (P3W); (iii) the low quality of service in terms of continuity of water supply and the
inefficient LGU-managed water systems; (iv) water inadequacies for families, especially the poor in
rural areas; (v) the multiplicity of water-related institutions resulting to lacking clear assignment of
duties, overlapping functions, and uncoordinated planning and monitoring; (vi) high degree of
uncertainty in implementing EO 279, specifically Section 12 (d) that mandates LGUs to support LGU-
managed water systems in their jurisdiction, as well as limited investment into the water sector; (vii)
weak regulatory framework owing to unclear assignment of powers and functions, lack of capacities of
regulatory authorities, and fragmented accountabilities due to lack of transparency in sector
performance, among others.
In light of sector analysis of the performance of LSD areas, the key sectoral policy, institutional, and
financial issues facing the LGUs are: (i) limited financial resources resulting to poor local public water
service delivery in many areas; (ii) graft and corruption which significantly limits public resources
allocated to local water service delivery; (iii) low compensation in government which does not
motivate personnel to perform effectively; (iv) lack of emphasis on sanitation as a public function
related to water service delivery; (v) weak and fragmented organizational structures resulting to
unstreamlined local water service delivery; (vi) gender-blind planning and implementation of local
water service delivery projects; (vii) limited overall support for BWASAs and similar other rural local
water providers; and (viii) limited tie-ups and partnerships with the private sector, NGOs and other
players in local water service delivery. The key policy, institutional and financial challenges facing the
whole local water service delivery sector of Dumaguete City and Agusan del Sur are: (i) promoting the
institutional capacity of local water service delivery providers through consistent capacity building
programs; (ii) enhancing the management and regulatory functions of local public institutions through
appropriate legislation; (iii) improving the financial performance of local water service delivery
providers through the development of cost-effective technologies and other means; (iv) promoting
integration and streamlining of activities through strong cooperation among involved institutions; (v)
exploring other sources of financing and investment through the involvement of the private sector,
donors and other fund sources; and (vi) promoting equity and fairness by considering gender and
waterless communities in local water service delivery.
The needed key policy, institutional, and financial reforms and recommendations at least for the LGUs
in light of sector analysis of the performance of LSD areas are: (i) LGUs should prioritize and provide
more of its own funding to local public water service delivery; (ii) LGUs must develop a local moral
recovery program and an effective local check and balance system that will penalize offending and
corrupt public officials and employees; (iii) LGUs must develop forms of incentives so that its
personnel will perform effectively in their respective functions; (iv) Since sanitation is directly related
to water provision, it should be given emphasis by LGUs; (v) The establishment and strengthening of
provincial, municipal, and barangay Watsan units to integrate the function of water and sanitation
under one roof will address the fragmentation in functions in local water service delivery at all levels ;
(vi) Gender issues must be considered in the planning and implementation of local water service
delivery projects; (vii) BWASAs and water providers in rural areas must be strongly supported; and
(viii) Tie-ups and partnerships with other sectors must be established.
The study highlights major findings and provides some conclusions and cross-cutting
recommendations. The major findings are: (i) seeming universal espousal of LCEs of people-centered
concept of service delivery; (ii) critical role of LCEs in improving local service delivery as an evidence
to the argument that institutional actors should take a primordial role in local governance for effective
service delivery systems and practices; (iii) scarcity of resources (e.g.―soft‖ and ―hard infrastructure‖
and financing) which serves more of a challenge than an intractable problem hindering innovative
ways of delivering services; (iv) the practice of needs-based prioritization of local officials, that is,
prioritizing development plans that cater to the needs of constituents; (v) the need for constant capacity
development of local governments in Agusan del Sur and Dumaguete City given their all-important
function as one of the frontline service providers; (vi) the crucial role of government in providing or
enhancing financial, technical, and institutional development to LGUs and other service providers;
(vii) the imperative to balance national and local development plans as a way of enhancing rather than
retarding local autonomy; (viii) the presence of success and failure factors in measuring up to service
standards such as MDGs and national targets embodied in MTPDP 2004-2010; (ix) the nexus of
supply-side and demand-side of governance where both local service providers, particularly local
public officials, are duty-bound to provide services to the public as empowered right-holders and co-
beneficiaries of effective service delivery; (x) the omnipresence of politics even in matters of local
service delivery where it can have both good and bad effects depending on how it is used; and (xii) the
limited availment of opportunities that public-private partnerships can bring about as a catalyst for
effecting change systems and desirable outcomes.
Five conclusions are arrived at based on the discussions and key findings from survey results, focus
group discussions, key informants interviews, and literature review. These conclusions, which are not
in order of importance, are: (i) that the three sectors, i.e. education, health, and water supply, are
complementarities as human development priorities, and therefore, require holistic policy, institutional,
and financing frameworks; (ii) that decentralization can only create an enabling environment for local
service delivery if and only if it is designed properly, with rightsizing and proper phasing; (iii) that the
improvement of local service delivery systems and practices depends greatly on the logic of
interdependence of policy, institutions, and finance, each of which contributes and impacts
synergistically on one another; (iv) that accountability – be it in its ―for whom‖, ―to whom‖, upward
and downward characteristics – is in and by itself could serve as an analytic framework of local service
delivery, highlighting demand-side accountability or the people‘s rights-based demand for better
services and supply-side accountability or the service providers‘ duty to provide service that impact on
people‘s lives; and (v) that local service delivery systems do not exist in vacuums but are played out in
oftentimes not favourable political, economic, and social milieu, and whose dynamics underpin the
success and failure factors of delivering for the people.
Out of the major findings and analyses, cross-cutting recommendations are formulated that bear impact
on policy, institutions, and finance for an improved local service delivery. For policy effectiveness,
these are: (i) the need for an adaptive and responsive approach rather than prescriptive approach to
policy-making and implementation; (ii) the adoption of an inclusive human development approach that
guarantees targeting the real beneficiaries - the poor; (iii) the need for aggressive promotion and
effective implementation of performance-based and results-oriented incentive system; and (iv) the
imperative to link local development plans with those of the regional and national for greater
development impacts. For institutional governance, the recommendations are: (i) creating champions
and ensuring local leadership and ownership of local service delivery agenda; (ii) enhancing strategic
alliances and partnerships with civil society, private sectors, and donors for synergistic collaborative
undertakings that reap development dividends sustainably; and (iii) strengthening LGU capacities and
capabilities commensurate to the demand for effective local service delivery. For the
recommendations to ensure financial sustainability, these are: (i) rational spending and investing on
human development priority concerns, such as primary and secondary education, maternal and child
health, and water supply, ensures long-term development impacts; (ii) practicing allocative and
operational efficiency addresses the problems of resources constraints; (iii) enhancing resources
management and fiscal capacity out of LGU‘s own-source revenues guarantees financial self-
sufficiency than IRA dependency; thus, giving substance to local autonomy beyond what is embodied
in the constitutional and statutory provisions.
Contents List of Tables
List of Figures
List of Boxes
Abbreviations
1. Introduction 1
2. Policy and Institutional Analysis: Primary and Secondary Education 15
3. Policy and Institutional Analysis: Maternal and Child Health 50
4. Policy and Institutional Analysis: Potable Water 79
5. Analysis of National Government and Local Government Spending on
Millennium Development Goals (MDGs) 98
6. Sector Analysis: Primary and Secondary Education 125
7. Sector Analysis: Maternal and Child Health 176
8. Sector Analysis: Potable Water Supply 204
9. Comparative Assessment 227
10. Key Findings, Conclusions, and Policy Recommendations 235
11. Areas for Further Research 259
Statistical Annexes 263
References 268
Tables
2.1 Responsibilities and Management in the Philippine Education System 21
2.2 Early Childhood and Basic Education Plan Target, Philippines , 2005-2010 24
2.3 EFA in the Philippine National Plans 26
2.4 BESRA in a Nutshell 27
2.5 Classrooms built, 2004-2007 29
2.6 Number of Textbooks Per Student, 2004-2008 29
2.7 Teacher and Principal Items, 2004-2008 30
2.8 Education Service Contracting (ESC) and Education Vouchers System (EVS) 30
2.9 School Feeding Program 31
2.10 Major Programs Involving Private Sector and Civil Society in the
Provision of Critical School Resources, 2000-2006 33
2.11 Philippine Basic Education Sector ODA Portfolio, 2006 34
2.12 Selected Performance Indicators in Elementary Education, 2002-2007 37
2.13 Selected Performance Indicators in Secondary Schools, 2002-2007 37
2.14 Nutritional Status of Public Elementary School Children 39
2.15 Prevalence of underweight 0-to5-year Old Children 39
2.16 Achievement Level in Elementary (in percent) 39
2.17 Achievement Level in Secondary Schools 40
2.18 Addressing Input Gaps in Basic Education, 2003-2007 42
2.19 Textbook Ratio, SY 2007 43
2.20 Summary of Funding Support to Basic Education 44
2.21 Per Capita Cost of Basic Education 45
2.22 Public Expenditure on Education in Southeast Asia 45
3.1 Devolved Health Services to LGUs 53
3.2 MMR of Southeast Asian Countries, 2000 and 2005 61
3.3 Maternal Mortality by Cause, 1998 62
3.4 Health-Related Practices Affecting Maternal Health Philippines, 1998 and 2003 63
3.5 Wanted Fertility Rate, Total Fertility Rate and Mean Number of Children Ever
Born to Women Age 40-49 Years by Region, Philippines, 2003 64
3.6 Percentage of Contraceptive Usage Among Women by Age Group 65
3.7 Early Child Mortality Rates, Philippines, 1993, 1998, 2003 66
3.8 Leading Causes of Death Among Infants, Under Five year Old Children and
Children Aged 5 to 9 years, Philippines, 2000 67
3.9 Number and Bed Capacity of Government and Private Hospitals,
Philippines, 1980-2002 70
3.10 Number and Bed Capacity of Government Hospitals by Region Philippines, 2004 70
3.11 Number of Rural Health Units and Barangay Health Stations by Region
Philippines, 2001-2002 71
3.12 Number of Local Government Health Practitioners by Region Philippines, 2002 72
3.13 Utilization of Health Facilities by Area Philippines, 2000 73
3.14 Type of Services Provided by Health Facility Philippines, 2000 73
3.15 Net Satisfaction with Most Used Health Facility by Area Philippines, 2000 74
4.1 Key Water Supply Sector : Delineated Roles and Responsibilities 81
4.2 Water Supply Providers (WSPs) (as of 2005) 82
4.3 Access to Water and Sanitation in the Philippines (2004) 86
4.4 Access to Drinking water: Cross-country comparison 87
4.5 The proportion of people without sustainable access to safe drinking water 87
4.6 Population Served by Water Service Providers, by Region, as of 2007 88
4.7 Water Supply Coverage, as of 2000 89
4.8 Summary of the 432 Waterless Municipalities and Percent Change in Household
Access to Potable Water, as of September 30, 2008 90
4.9 Overall Improvement in Access to Water 91
4.10 432 Waterless Municipalities and Percent Change in Household Access to
Potable Water per Region, as of September 30, 2008 91
4.11 P3W Problems or Issues Encountered and Action Taken/Status 93
4.12 Performance Indicators of the Manila water concessionaires, 1997-2003 95
1 Philippines MDG Rate of Progress at the National Level 101
2 Selected Education Indicator for Local Service Delivery (LSD) Areas ,
SY 2005-2006 102
3 Selected Health Indicator, 2005 102
4 National Government Fiscal Position (Cash Basis) as a Percent of GDP, 1990-2007 105
5 National Government Expenditures (Obligation Basis) as a Percent of GDP, 1990-2007 107
6 Real Per Capita MDG Expenditure of Central Government (in 2000 prices) 109
7 Education Expenditure (in thousands) 111
9 LGU income in LSD study areas, 2003-2007 116
10 Real Per Capita Expenditures in Basic Social Services of LGUs (in 2000 pesos) 121
11 Percent distribution of total LGU spending in LSD areas, 2006-2007 121
12 Real per capita LGU spending in LSD areas, 2006-2007 122
1 Monthly Salaries of School, District and Division Officials / Personnel 137
2 Monthly salaries / wages / honoraria of locally-paid teachers,
Dumaguete City (2006-2008) 138
3 Sources and Uses of School Funds, Prosperidad NHS, Agusan del Sur (SY 2008-2009) 147
4 Annual Education Expenditure, by type of school, SY 2007-2008 148
5 Share (%) in annual education expenditure, by type of school, SY 2007-2008 148
6 Number and proportion of locally- and nationally-funded secondary teachers,
Agusan del Sur (SY 2007-2008) 155
7 Total LGU, General Fund Spending on Education by level: Prosperidad - 2004, 2006 155
8 Basic Education Information System 158
9 Key School Statistics in Elementary School, SY 2007-2008 159
10 Key School Statistics in Secondary School, SY 2007-2008 161
11 Participation Rates – Elementary (SY 2003-2004, SY 2006-2007) 162
12 Primary Net Enrolment Rates by region, gender and
urbanity (SY 2005-2006, SY 2007-2008) 163
13 Participation Rates – Secondary (SY 2003-2004, SY 2006-2007) 164
14 Secondary Net Enrolment Rates by region, gender and
urbanity (SY 2005-2006, SY 2007-2008) 164
15 Promotion and Drop-out Rates in Elementary (SY 2003-2004, SY 2006-2007) 164
16 Promotion and Drop-out Rates in Secondary level (SY 2003-2004, SY 2006-2007)
167
17 National Achievement Test – Mean Percentage Scores in Grade 6,
SY 2004-2005 / SY 2006-2007, SY 2007-2008 169
18 National Achievement Test – Mean Percentage Scores in 2nd Year,
SY 2006-2007, SY 2007-2008 170
19 Key Education Indicators in CPC-6 Areas, Agusan del Sur and Negros Oriental: 2007 171
7.1 Type of Services Utilized, by Health Facility, Agusan del Sur 180
7.2 Type of Services Utilized, by Health Facility, Dumaguete City 180
7.3 Bypassing of Nearest Health Facility, number of households 181
7.4 Facility Satisfaction Ratings, Agusan del Sur 182
7.5 Facility Satisfaction Ratings, Dumaguete City 183
7.6 Health, Nutrition and Population Control Expenditure as
Percentage of Total LGU Expenditure 184
7.7 Expenditure on Health, Nutrition and Population Control, in 2000 prices 185
7.8 Health, Nutrition and Population Expenditure per Capita, in 2000 prices 185
7.9 Percentage of Health Expenditure to Total Expenditure (General Fund), 2006 186
7.10 Total Health Expenditures, 2006 (2000 Prices) 186
7.11 Total Health Expenditures Per Capita, 2006 (2000 Prices) 187
7.12 Health Workers at the LGU Level 187
7.13 Health Workers at the Barangay Level 188
7.14 Composition of the Local Health Boards 189
7.15 Antenatal Care Coverage, in percentages 192
7.16 Average Expenditure in Pre-natal Care, by service provider 192
7.17 Iron Supplementation of Pregnant Woman, in percentages 193
7.18 Vitamin-A Supplementation for Lactating Mother 193
7.19 Skilled Birth Attendance, in percentages 194
7.20 Births in a Medical Facility, in percentages 195
7.21 Average Child Birth Expenditure, by service provider 195
7.22 Fully Immunized Children, in percentages 196
7.23 Average Expenditure in Immunization, by service provider 197
7.24 Vitamin-A Supplementation of Children (in percentages) 197
7.25 Child Deworming, in percentages 197
7.26 Source of Supplementation 198
7.27 Family Planning 198
7.28 Average Expenditure in Family Planning Commodities, by service provider 199
8.1 Tariff Structure of the Dumaguete City Water District 206
8.2 Construction/Installation and Rehabilitation of Water Facilities
by the Watsan Center, Agusan del Sur, by Municipality, 2007-2008 209
8.3 Number and Percentage of BWASAs in Agusan del Sur Since 1999, by Municipality 211
8.4 Tariff Structure of the Patin-ay Waterworks System, 2009 212
8.5 Tariff Structure of the Bayugan Water District, 2009 214
8.6 Tariff Structure of the Prosperidad Water District, 2009 215
8.7 Statements of Income and Expenditures, Waterworks System of Sibagat, 2003-2007 216
8.8 Water Systems and Households Served in Dumaguete City, 2007 218
8.9 Water Systems and Households Served in Agusan del Sur, 2007 219
8.10 Households in Agusan del Sur with No Access to Safe Water, 2005 220
10.1 Summary of resource requirements, achievements, and bottlenecks in
selected maternal and child care programs 245
10.2 Simplified Stakeholder Analysis of Key Health Actors 245
Figures
1.1 Structure of Local Governments in the Philippines 6
1.2 Triangulation Framework of Local Service Delivery 10
2.1 Organizational Chart, Department of Education 20
2.2 Functional Arrangement of Institutional Actors of the Education Sector 23
2.3 2003 TIMMS Average Science and Math Scale Scores of Fourth-Grade Students 41
2.4 2003 TIMMS Average Science and Math Scale Scores of Eight-Grade Students 41
3.1 Organizational Chart of the Health Service 52
3.2 Trends in Maternal Mortality Ratio (MMR), Philippines (1993-2003) 60
3.3 Maternal Mortality Ratio by Region (2007) 61
3.4 Percentage Distribution of the Main Causes of Maternal Mortality, 2000 63
3.5 Trends in Infant and Child Mortality Rates, Philippines 2003 66
3.6 Breastfeeding Practices among 6-Month Old Infants, 2003 68
3.7 Reasons for not Breastfeeding or Stopping Breastfeeding, 2003 69
4.1 Access to Safe Drinking Water and Sanitary Toilet Facility 86
1 Type of Development Expenditure 103
2 Percent Share to Total Central Government Expenditures, 1996-2007 108
3 Share of Basic Social Services to Central Government Spending on
Total Social Services (1996-2007) 108
4 Composition of Basic Social Services of Central Government 110
5 DepEd Expenditures Per Pupil, 1996-2007 110
6 Percent Distribution of Health Expenditures of Central Government, 1998-2006 112
7 Composition of LGU income, 2001-2007 115
8 Percent to GDP of Total LGU Income, 1996-2007 115
9 Real Total LGU Income Per Capita, 1996-2007 (in 2000 prices) 116
10 LGU Expenditures as % of GDP, 1996-2007 117
11 Sectoral Distribution of Local Government Expenditures, 1996-2007 118
12 Real per capita LGU spending, 1996-2007 (in 2000 prices) 119
13 Share of Basic Social Services to Total LGU Social Services, 1996-2007 119
14 Percent Share of Basic Social Services to Total LGU Expenditure, 1996-2007 120
1 Basic Education Budget as percentage of GDP, 1999-2008 141
2 Distribution of Education Spending – National level 143
3 Distribution of Education Spending – Regional level 143
4 Distribution of Education Spending – Division level 144
5 Distribution of Education Spending - Elementary Schools 144
6 Distribution of Education Spending - Secondary Schools 145
7 Allocation of Special Education Fund 154
7.1 Maternal Mortality Rate, LSD Areas 178
7.2 Infant Mortality Rate, LSD Areas 179
7.3 Summary of Maternal and Child Health Issues in the Study Areas 203
8.1 Percentage of households whose location of the primary drinking water source
is within the neighborhood, took 0 minutes to get drinking water and walked to
get drinking water in Dumaguete City and Agusan del Sur 2008 222
8.2 Percentage of households with adult male, adult female, male children, female
children members who are in charge of getting drinking water from the primary
source in Dumaguete City and Agusan del Sur, 2008 222
8.3 Percentage of households who treated their drinking water and who used boiling
as form of treatment in Dumaguete City and Agusan del Sur, 2008 223
8.4 Percentage of households who are willing to pay a maximum additional amount for
the improvement of drinking water in Dumaguete City and Agusan del Sur, 2008 223
Boxes 1 Elasticity of Social Sector Spending of LGUs with respect to Changes
in Own-Source Revenue (OSR) and IRA 114
2 School Feeding Program 157


1
CHAPTER 1
Introduction
1. Background, Purpose, and Three Core Ideas of the Study
1.1 Background and Purpose of the Study. The rationale for undertaking research into
local service delivery (LSD) in the Philippines is premised on the salient need for major
improvements in the delivery of public goods and services, especially to poor people, as a
way of achieving the Millennium Development Goals (MDGs). This requires analyzing
decentralized arrangements to better understand and improve on local service delivery
systems and policies, their financing characteristics and institutional set-up, as well as
alternative modalities of service delivery. But in order to better analyze and understand
decentralization as a key factor for an improved LSD, it has to be studied vis-à-vis a set
of specific public services such as education, health, and water. This will provide for a
more focused discussion and analysis, which in turn, can highlight the success and failure
factors as determinants of the efficacy of decentralizing services within particular sectors
such as primary and secondary education for education sector, maternal and child health
for health sector, and potable water supply and sanitation for water sector. Appropriate
sectoral decentralization policy frameworks could result from such sector-specific
discussions and analyses, and therefore, could impact on national development policies
and plans.
In specific terms, the aims of the study are three-fold, i.e.:
1) to analyze and conduct a comparative assessment of (i) key issues, (ii)
background and rationale to decentralization and other local services policies, (iii)
legal and policy frameworks concerning government functions at different
administrative levels, (iv) role of government in policy and administration at
different administrative levels, (v) sector financing and inter-government fiscal
transfers, (vi) local service delivery systems, and (vii) services monitoring
systems in the three sectors;
2) to assess local services policies on actual service delivery in two CPC 6 focus
areas, i.e. Agusan del Sur and Dumaguete City, based on household and facility
mapping surveys, as well as focus groups discussions (FGDs) and key informant
interviews (KIIs). The focus shall be on identifying health, education and potable
water systems; good practices on and bottlenecks which hamper the local delivery
of services particularly in terms of (i) availability of basic supplies e.g. essential
medicines, textbooks and human resources, (ii) accessibility and utilization of
services, (iii) adequacy of coverage relative to service standards, and (iv)
effectiveness of quality of care and services;
2
3) to identify key findings and recommend policy reforms, program corrections and
resource re-allocation to generate better outcomes.
1.2 Three Core Ideas of the Study. This study works on the following assumptive
ideas:
i. That decentralization, though not an end in itself and not a panacea, is a work
in progress and a pivotal means in attaining better development outcomes
such as improved service delivery and accountable governance for a better
quality of life among Filipinos, especially the poor;
ii. That an improved local service delivery system depends on a logic of
trigulation-cum-interdependence of policy, institutions, and finance, but that
institutional actors take a primordial role in filling in the policy and financial
gaps as the usual constraints attending local service delivery via local
governance for the MDGs;
iii. That an identification, analysis, and comparative assessment of the key issues
and challenges of the three sectors on education, health, and water does not
provide for an impact assessment of decentralization in general but only a
framework of analysis for an improved service delivery of MDG-critical
sectors which may provide for appropriate sectoral decentralization policy
frameworks as inputs to national development policies, plans, and priorities
and MDG strategies.
First, decentralization –defined as the transfer of authority and power from central to
subnational tiers of governments - holds great potential in improving the delivery of
public services and the attainment of the MDGs. Though not a sufficient condition and
not a panacea to development problems, it is a necessary condition in helping catalyze
meaningful change processes geared towards poverty reduction. Its designs – political,
administrative, fiscal, and market-driven – and its required institutional governance
would necessarily impact into its implementation and desired results. This would also
hinge on its proper phasing and rightsizing; the capacities of local governments and their
political will to bring about development change and outcomes; their cooperation,
coordination, and collaboration with civil society groups and private sector; the efficient
fulfillment of new supervisory and regulatory roles of the national government (NG),
among others. In other words, the need for an effective decentralization for an improved
LSD entails not only that functionaries, functions and funds (3Fs) are transferred to local
governments but also that powers, authority, and resources are devolved to the extent that
are commensurate to roles, responsibilities, and capacities enabling LGUs in achieving
better development outcomes.
Second, as would be explicated in the local service delivery framework (LSDF) below,
local service delivery is a triangulation of policy, institutions, and finances based on their
logic of interdependence, with institutions, specifically institutional actors, taking a
central role in addressing key development issues and constraints as a result of policy and
3
financial gaps. Three reasons are advanced why institutional actors are pivotal: (i) local
institutional actors such as local government units (LGUs) are at the forefront of service
provision; (ii) despite financial constraints and policy gaps, local institutional actors can
deliver out of innovative practices; and (iii) local institutional agency entails
empowerment and accountability of different actors, which when tapped, can deliver
desired outcomes.
Third, an assessment of LSD in a way provides for an assessment of decentralization in
the Philippines. A caveat is in order though: Decentralization is multi-faceted and LSD is
only one among its complex dimensions; hence, to assess it in light of the latter would be
too myopic, if not problematic. For a comprehensive and in-depth assessment, the other
two aspects-cum-rationales for decentralization, i.e., democratic governance and local
development which are in themselves, like local service delivery, a composite of
variegated policy, institutional, and financial characteristics, would have to be factored in
and their complex dynamics considered. Further, examining the effects of
decentralization via local service delivery would require a comparative nationwide data
in a disaggregated level in order to make a comparative assessment of the LSD-related
performance of LGUs in the country. The present quantitative and qualitative surveys do
no amount to such needed data. Moreover, assessing the effects of decentralization vis-à-
vis LSD would require baseline information (i.e. data before decentralization) and
complete results chain (inputs, output, outcomes, and impacts) of all decentralized sectors
or services that is simply absent – at least so far. At best, what can be understood,
analyzed, and assessed are the processes as well as partial results chain (inputs, outputs,
and to some extent outcomes depending on what is achievable) of local service delivery
under a decentralized set-up. For example, the focus is on understanding how the process
of service delivery converts funds into outputs, and analyzing the different factors –
found in both supply and demand side - that intervene between funding (or expenditures),
inputs, outputs, and, to a much lesser extent, outcomes. In other words, local service
delivery (based on some measurable results chain) is only an indicator of the effects of
decentralization. The issues, challenges, and problems of local service delivery, together
with the normative principles and values underpinning them, only provide for a
framework of analysis for an improved service delivery of MDG-related services and not
a framework for impact assessment of decentralization in general. The evidence and
lessons from the study will therefore be suggestive rather than conclusive of the effects of
decentralization.
1.3 Organization of the Report. This report is organized as having two major parts.
Part one is about the policy, institutional and financial analyses of basic education,
maternal and child health, and potable water, with discussions on their respective policy
and legal frameworks, major strategies and programs, and trends and challenges. The
analysis is found in the discussion on trends and challenges, and not on the preceding
discussions on policy and legal frameworks and major strategies and programs which
merely lay down key policies and laws as well as strategies and programs (hence, no
impact assessment as might be expected) akin to three sectors. The rationale is premised
on the idea of interrogating the outcomes despite the plethora of policies and programs.
4
The same is true with Part Two where sectoral analyses on primary and secondary
education, maternal and child health, and potable water are juxtaposed with the
discussions on the empirics on household surveys, facility mapping surveys, public data
and documents, focus group discussions (FGDs), and key informant interviews (KIIs) in
two CPC 6 areas of Agusan del Sur and Dumaguete City. The reasons for choosing these
areas have to do with their rural and urban make-up, political subdivision (municipalities
of Agusan del Sur and capital city of Negros Oriental), geographical location (one in
Mindanao and another one in Visayas both in the southern part of the Philippine
archipelago).
The report begins with an introductory chapter, highlighting the three core ideas of the
study, overview of decentralization in the Philippines, and the triangulation framework
for local service delivery. This introductory chapter is necessary for a regional study of
which this study forms a part in that it informs about the problems and challenges of
decentralization in the Philippines, as well as the triangulation framework for local
service delivery – the framework of analysis PIDS developed just for this study.
Chapters 2, 3, 4 provide for the policy and institutional analysis of primary and secondary
education, maternal and child health, and potable water supply respectively. Chapter 5
provides for financial analysis of LSD, highlighting the national government and LGU
spending for MDGs in the LSD study areas. Chapters 6, 7, and 8 discuss the local service
delivery of education, health, and water respectively, highlighting the survey results -
both household surveys and facility mapping surveys - as well as the FGDs and KIIs.
Sectoral programs, activities, and projects (PAPs); sectoral performance; and key issues
and challenges are also discussed in these chapters. Chapter 9 provides for a comparative
assessment based on the sectoral analyses of the three sectors in chapters 5, 6, and 7,
highlighting key policy, institutional, and financial cross-cutting issues and challenges.
Chapter 10 concludes with key findings and provides for policy reforms and
recommendations. Chapter 11 provides for some areas for further research per sector.
2. Overview of Decentralization in the Philippines
2.1 The 1991 Local Government Code1. In 1991, the Philippines enacted a Local
Government Code (LGC) or RA 71602, the key instrument of decentralization in the
1 1991 LGC is a legal culmination of a struggle for local autonomy and democratic governance of Filipinos.
Although the evolution of local government system in the Philippines started during three centuries of
Spanish colonization, where a highly centralized regime headed by Spanish Governor General in Manila
governed local governments [barangays (village), pueblos (municipalities), cabildos (cities), provinces
(provincias)] around the country, it was only in the 1950s onwards when incremental national legislations
on decentralization saw the light of day, to wit: Local Autonomy Act of 1959, the Barrio Charter Act of
1959, the Decentralization Act of 1967, the 1973 Philippine Constitution, and 1983 Local Government
Code. The 1987 Constitution, which was crafted after the famous 1986 People Power Revolution deposing
Ferdinand Marcos, was key to the realization of political devolution. See Capuno (2005: 204-44),
Brillantes (1998: 38-57), and Tapales (1998:113-23). 2 LGC of 1991 or R.A. 7160 was approved on October 10, 1991 and was implemented on January 1, 1992.
The Department of Interior and Local Government (DILG) provided for the LGC‘s Implementing Rules
and Regulations (IRR) on April 2002.
5
country.3 This LGC is ―considered to be one of the far-reaching decentralization reforms
in the developing world (World Bank 2003:117).‖ It transferred to sub-national tiers of
government – provinces, cities4, municipalities, barangays
5 – important powers and
functions previously mandated to the central government.
The promulgation of LGC 1991 was in accordance with Section 3, Article X of the 1987
Philippine Constitution which declares that:
"The Congress shall enact a local government code which shall provide
for a more responsive and accountable local government structure
instituted through a system of decentralization with effective mechanisms
of recall, initiative and referendum, allocate among the different local
government units their powers, responsibilities and resources and provide
for the qualifications, election, appointment, removal, terms, salaries,
powers, functions and duties of local officials and all other matters relating
to the organization and operation of the local units".
Further, Section 5, Article XI, provides for local autonomy, to wit: ―The State shall
ensure the autonomy of local governments.‖ Local autonomy means, inter alia, granting
local government taxing authority and expenditure management responsibilities, as well
as powers for delivery of basic services. This local autonomy should be within legally
prescribed limits and under the general supervision of the president of the Philippines.
2.2 Subnational Tiers of Government. The structure of local governments in the
country is given in the figure below:
3 In light of three broad categories of different country approaches to decentralization, the Philippines, like
Indonesia, is considered to be a fast-starter compared with incrementalists (China and Vietnam) and caution
movers (Cambodia and Thailand). It is categorized as fast-starter for having introduced ―major structural,
institutional, and fiscal reforms in response to a sudden and far-reaching political stimulus‖ such as ―basic
elements of a decentralization framework, subnational democratic elections, and substantial resource
sharing…‖ (White and Smoke 2005: 6). 4 Cities are classified as either independent cities or component cities; the former are so-called because they
are highly-urbanized cities and are not part of their mother provinces, while the latter are so-called because
they are politically part of the provinces and are treated like municipalities. 5 A barangay is the Filipino equivalent of village. In the Philippines, it is the basic political unit of
government. Also, in the Philippines, the term LGU can refer to any of the subnational tiers of government,
i.e. province, city, municipality, and barangay.
6
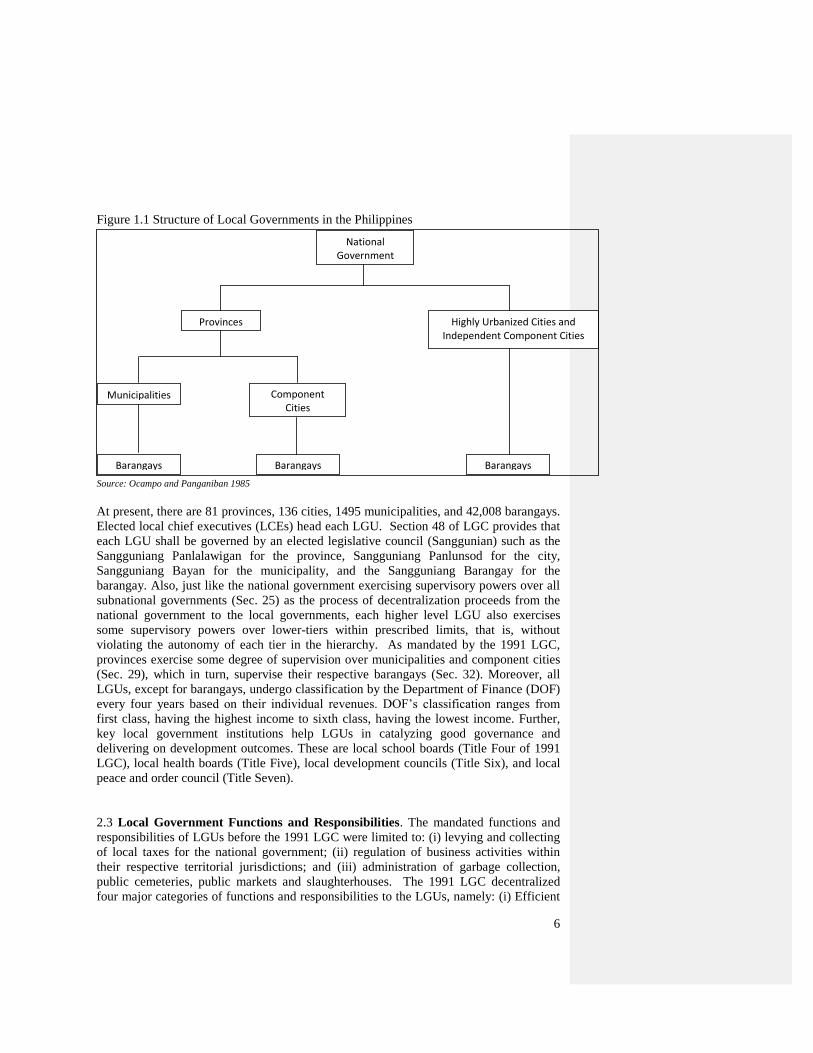
Figure 1.1 Structure of Local Governments in the Philippines
Source: Ocampo and Panganiban 1985
At present, there are 81 provinces, 136 cities, 1495 municipalities, and 42,008 barangays.
Elected local chief executives (LCEs) head each LGU. Section 48 of LGC provides that
each LGU shall be governed by an elected legislative council (Sanggunian) such as the
Sangguniang Panlalawigan for the province, Sangguniang Panlunsod for the city,
Sangguniang Bayan for the municipality, and the Sangguniang Barangay for the
barangay. Also, just like the national government exercising supervisory powers over all
subnational governments (Sec. 25) as the process of decentralization proceeds from the
national government to the local governments, each higher level LGU also exercises
some supervisory powers over lower-tiers within prescribed limits, that is, without
violating the autonomy of each tier in the hierarchy. As mandated by the 1991 LGC,
provinces exercise some degree of supervision over municipalities and component cities
(Sec. 29), which in turn, supervise their respective barangays (Sec. 32). Moreover, all
LGUs, except for barangays, undergo classification by the Department of Finance (DOF)
every four years based on their individual revenues. DOF‘s classification ranges from
first class, having the highest income to sixth class, having the lowest income. Further,
key local government institutions help LGUs in catalyzing good governance and
delivering on development outcomes. These are local school boards (Title Four of 1991
LGC), local health boards (Title Five), local development councils (Title Six), and local
peace and order council (Title Seven).
2.3 Local Government Functions and Responsibilities. The mandated functions and
responsibilities of LGUs before the 1991 LGC were limited to: (i) levying and collecting
of local taxes for the national government; (ii) regulation of business activities within
their respective territorial jurisdictions; and (iii) administration of garbage collection,
public cemeteries, public markets and slaughterhouses. The 1991 LGC decentralized
four major categories of functions and responsibilities to the LGUs, namely: (i) Efficient
National Government
Provinces Highly Urbanized Cities and Independent Component Cities
Municipalities Component Cities
Barangays Barangays Barangays
7
service delivery; (ii) Management of the environment; (iii) Economic development; and
(iv) Poverty alleviation. More specifically, as provided for in Section 17 of the 1991 LGC
on ―Basic Services and Facilities‖, these devolved functions and responsibilities are in
the areas of (i) agricultural extension and research; (ii) social forestry; (iii) environmental
management and pollution control; (iv) primary health and hospital care; (v) social
welfare services; (vi) repair and maintenance of infrastructure; (vi) water supply and
communal irrigation; and (vii) land use planning. Further, 1991 LGC section 447
(Municipal Governments), section 458 (City Governments) and section 468 (Provincial
Governments) define the functions and powers of the different local authorities. In terms
of service delivery, one of the main tasks of the provincial government is to coordinate
the delivery of basic services since they are assigned functions that require inter-
jurisdictional provision of services such as district and provincial hospital; while the
cities and municipalities directly manage, implement, monitor, and evaluate service
provision to the barangays such as primary health care, construction, repair, and
maintenance of public school buildings and facilities.
2.4 Local Government Financing. 1991 LGC provides for intergovernmental fiscal
relations between NG and LGUs (Vertical fiscal relation) and between and among LGUs
(horizontal fiscal relation). Vertical fiscal relation between NG and LGUs are in the
areas of: (i) Shares in internal revenue taxes (Sec. 284); (ii) Shares (40% other than the
40% internal revenue allotment) of LGUs of the gross collection in the exploitation of
national wealth within their respective areas preceding the fiscal year (Sec. 290); (iii)
Shares from the proceeds of government agencies or government-owned or controlled
corporations in utilizing and developing national wealth (Sec. 291); (iv) borrowings of
LGUs either from private or public sources (Sec 297); and (v) local budgets submission
and review. Section 284 provides for the forty percent (40%) shares in the national
internal revenue taxes of local government units. A differentiated allotment scheme is
followed: (i) Provinces – Twenty-percent (23%); (ii) Cities - Twenty-percent (23%); (iii)
Municipalities – Thirty-four percent (34%); and (iv) Barangays – Twenty percent (20%).
This revenue-sharing is based on an allotment formula: (i) Population – Fifty percent
(50%), (ii) Land Area – Twenty-five percent (25%), and (iii) Equal Sharing – Twenty-
five percent (25%). Each barangay shall receive a minimum of eighty thousand pesos per
annum (P80,000) depending on its population to be charged against the twenty percent
(20%) share of the barangay from IRA.
Also, LGC grants LGUs credit financing powers ―to create indebtedness and to enter into
credit and other financial transactions‖ (Sec. 295) for human development and other
purposes. These may be in the form of loans and credits with any government or
domestic private bank and other lending institutions (Sec. 297); issuance of bonds and
other long-term securities subject to the rules and regulations of the Central Bank and the
Securities and Exchange Commission (Sec. 299); inter-LGU loans, grants, and subsidies
(Sec. 300); loans from foreign sources through national government (Sec. 301); and
contracts with the private sector (Sec. 302).
In Book II of 1991 LGC, LGUs are granted taxing and revenue-raising powers. Section
129 states that ―Each local government unit shall exercise its power to create its own
8
sources of revenue and levy taxes, fees, and charges subject to the provisions herein,
consistent with the basic policy of local autonomy.‖ Examples of local revenue-
generating sources are: (a) Province: Real property tax, Tax on transfer of real property
ownership, Tax on business of printing and publication, Franchise tax, Sand and gravel
tax, Professional tax, Amusement tax on admission, and Annual fixed tax per delivery
truck or van of manufacturers or producers of or dealers in certain products; (b)
Municipalities: Tax on business, Fees and charges, Fishery rental or fees and charges,
Fees for sealing and licensing of weights and measures, and Community tax; (c) Cities:
The cities –either highly-urbanized or independent component cities - may levy and
collect among others any of the taxes, fees and other impositions which the province or
municipality may impose; and (d) Barangays: Taxes and fees, Service charges, and
Contributions.
2.5 Decentralization as an enabling policy environment for Local Service Delivery.
In the Philippines, one promise of decentralization is better local service delivery for an
improved quality of life (de Leon 2005: 319-20; Manasan 2007: 275). However, for
decentralization to realize this, certain prerequisites – which are mainly about policy,
institutions, and finance - must be met. First, the design of decentralization – its 3 Ds
(deconcentration, delegation, devolution) and/or its political, administrative, financial,
and market-based characteristics– needs to be based on rightsizing and proper phasing of
intergovernmental transfer of powers, functions, and responsibilities. The abrupt transfer
of powers, functions, and responsibilities, especially on the decentralization of certain
sectors such as health, social services, and agriculture, has created a mismatch between
LGUs‘ powers and their responsibilities and their institutional and financial capacities.
This has impacted on the delivery of services and public goods. In health for example,
the cost of devolution (PS and MOOE), has made the LGUs, particularly the provinces,
incapable of delivering public goods and services; hence, the clamor to return health
service responsibilities to the national government. Second, the institutional actors – both
local and national – should be capacitated and be imbued with a sense of urgency to own
up the local service delivery agenda as a way to make decentralization work for the
people through their innovative ideas, capabilities, and political will. With many LCEs
not having the required capabilities and political will to own up the local service delivery
agenda, people suffer from poor quality of education and poor health and sanitation. A
Filipino child, who cannot wait for improved services to ensure his right to a bright future
and healthy life, becomes a victim of ineptitude, political grandstanding, and
indifference. Third, the 3Fs – functions, functionaries, and funds – demand no less than
commensurate transfer and burden-sharing of the required capacity-building, institutional
development, and financial sustainability. The resultant resource constraints and
institutional deficits experienced by LGUs, mostly by 5th
and 6th
municipalities and their
barangays, as well as the low-income provinces, greatly impact on the quality and
quantity of services delivered. Saddling these resource-starved LGUs with costly
devolved functions in health, education, and water for example, compounds their inability
as institutional functionaries in meeting the supply-side of governance and the basic
needs of their people. Given these problems of decentralization and their impact on local
service delivery systems and practices, the challenge is to address them in a manner that
9
puts premium on the logic of interdependence of policy, institutions, and finance. This by
no means argues that decentralization is the all-sufficient reason for an improved local
service delivery. For the relationship between decentralization and effective service
delivery is only associative than causative especially when the policy, institutional, and
financial components are not really attended to and valued as interrelated.
3. Triangulation Framework of Local Service Delivery
3.1 Triangulating Local Service Delivery. The literature on local service delivery
identifies its linkages with local governance and local development (World Bank 2004).
This study identifies it as being triangulated by policy, institutions, and finance, and more
specifically, by good policy environment and effectiveness, efficient intergovernmental
fiscal and financial system, and accountable institutional actors, shown diagrammatically
in Figure 1.2. Triangulating LSD provides for a framework of analysis on how to better
understand the dynamics of local service delivery systems and the requirements for
improving them, with a view to replicating best practices and learning from dysfunctional
ones.
10
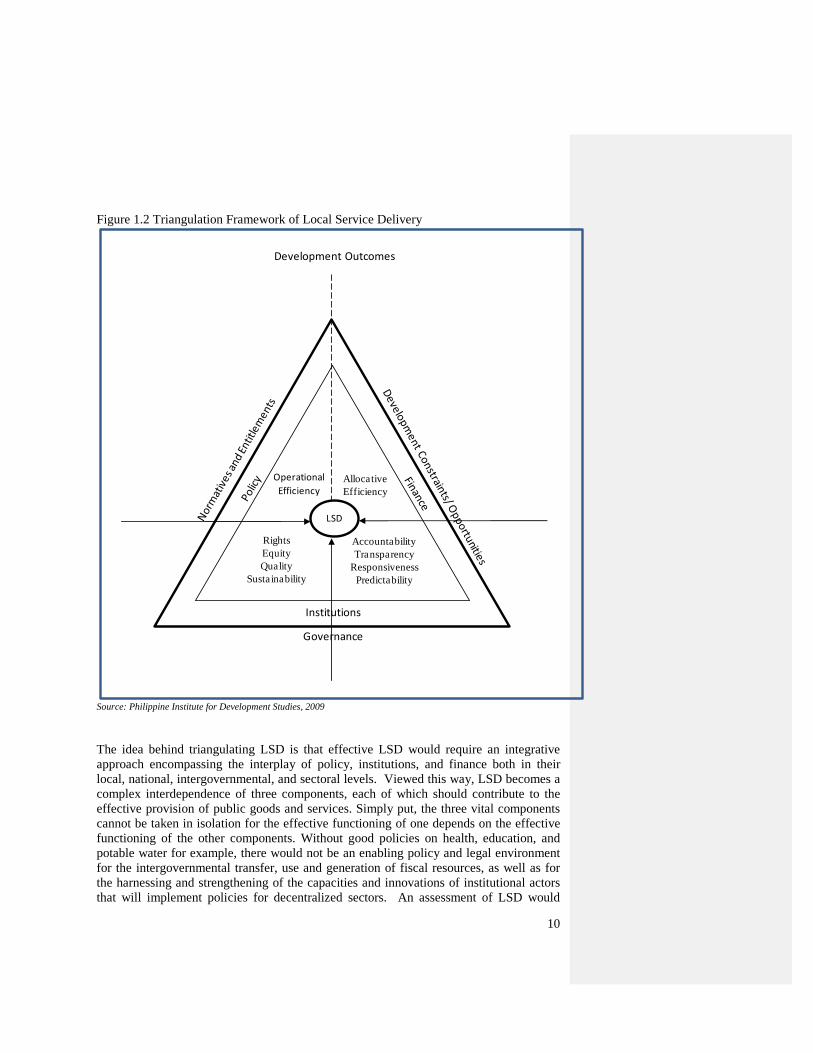
Figure 1.2 Triangulation Framework of Local Service Delivery
Source: Philippine Institute for Development Studies, 2009
The idea behind triangulating LSD is that effective LSD would require an integrative
approach encompassing the interplay of policy, institutions, and finance both in their
local, national, intergovernmental, and sectoral levels. Viewed this way, LSD becomes a
complex interdependence of three components, each of which should contribute to the
effective provision of public goods and services. Simply put, the three vital components
cannot be taken in isolation for the effective functioning of one depends on the effective
functioning of the other components. Without good policies on health, education, and
potable water for example, there would not be an enabling policy and legal environment
for the intergovernmental transfer, use and generation of fiscal resources, as well as for
the harnessing and strengthening of the capacities and innovations of institutional actors
that will implement policies for decentralized sectors. An assessment of LSD would
Operational
EfficiencyAllocative
Efficiency
Rights
Equity
Quality
Sustainability
Accountability
Transparency
Responsiveness
Predictability
LSD
Institutions
Governance
Development Outcomes
11
therefore entail policy, institutional, and financial analyses, each providing a perspective
on how LSD should be practiced under decentralization. Such triangulated analysis
would serve as the overarching framework on how to examine and improve the three
sectors‘ performance, their issues and challenges, and their needed policy reforms.
3.2 Primacy of Institutions (or Local Institutional Actors). Underlying the normative
argument of LSDF is the claim that institutions or local institutional actors are the key
driving forces for effective LSD. Institutions, following Douglas North (1990, 2005), are
defined as ―the humanly devised constraints that shape human interaction.‖ Johannes
Jutting (2003: 13-4) classifies them into four divisions, namely: economic institutions,
political institutions, legal institutions, and social institutions. In this study, institutions
are equated with the actors that breathe life into them. The idea is that institutions serve
the very purpose for which they are created when the actors – say bureaucrats, public
administrators, local chief executives and other local officials, national political
appointees and elected officials - make them work for the common good, or in the case of
service delivery, for better and quality services to their public clientele. Institutions, then,
taken in their agential characteristic, that is, through their actors than simply in their
organizational or structural characteristics, become nothing but the actors that make
them work. The sustainability of good practices, reforms, and normative trajectories, for
example, will greatly hinge on the actors‘ agency (e.g. ingenuity, leadership, political
will, synergy) to institutionalize them beyond their administration, regime, or stay in
office.
Aside from the household survey and cross-sectoral issues on maternal and child health,
primary and secondary education, and potable water as the value added of this study, the
claim on the primordial import of institutional actors serves as its other value added.
There are at least three reasons why this is the case, i.e. (i) local institutional actors such
as local government units (LGUs) are at the forefront of service provision; (ii) despite
financial constraints and policy gaps, local institutional actors can deliver out of
innovative practices; and (iii) local institutional agency entails empowerment and
accountability of different actors –civil society, LGUs, private sector – that can be
galvanized and held accountable in light of the common purpose of providing local
public goods in the most efficient, equitable, and sustainable manner.
These reasons need further explanation. First, as enshrined in Article X of the 1987
Philippine Constitution and the 1991 LGC, local institutional actors, mainly LGUs, are
the key players in delivering local public goods such as health, education, and water.
National actors such as government departments and agencies such as DepEd, DOH,
DENR, DOF, DBM, DILG, DPWH, DSWD, NEDA, COA, NWRB, LWUA, NAPC, and
Congress just to name a few, as well as international donors such as UNICEF, USAID,
World Bank, and ADB among others, may be partners for effective service delivery, but
the main actors responsible for the same lies with the local institutional actors who are
presumed to know the local solutions to local problems best. Second, and most
importantly, when there are policy gaps and limited budget, or when incentives from the
national level are wanting, the more that local institutional actors are needed to
experiment, innovate, and create opportunities such as resource generation and rational
12
spending for effective LSD. Local autonomy would be more meaningful if it is made to
assume responsibilities otherwise reneged from the top leadership. Third, the collective
agency of different institutional actors at the local level, i.e. LCEs, legislative bodies such
as sanggunians, local health and school boards, CBOs, FBOs, NGOs, and the private
sector, can be harnessed as an empowerment tool for LSD as well as a performance-
based accountability mechanism of local constituents.
3.3 Values and Principles of Triangulation Framework. Local service delivery must
be value-based, i.e. rights-based, gender-responsive, equity-oriented, and sustainability-
grounded. The right to education, health, and water must be an acknowledged right of
every Filipino. It must be an entitlement that duty-bearers or service providers must
respect by way of providing for the objects of such a right – education, health, and water.
They must not foist off their responsibilities in providing for ECCD, elementary
education, and secondary education to every Filipino child especially in poorer areas such
as CARAGA and Autonomous Region of Muslim Mindanao (ARMM). Gender-
responsiveness must also underpin policies for LSD. Every woman, mother and child
deserves no less than the same rights and entitlements as every man. Duty-bearers must
be gender sensitive to all right-holders, especially so when human development that can
be achieved through education and health outcomes, ought to be provided and harnessed
to every Filipino regardless of gender. There must also be social bias towards the poor
not in paper but in ―doable‖ policies, activities, and programs, (PAPs) such as ECCD,
maternal and child health program, potable water supply and sanitation. Decentralization
must work towards the poorest of the poor so much so that those who have less in life
should have more in human development-based PAPs. An equity-oriented LSD
guarantees that decentralization is pro-poor, that is, it is able to reach the ―unreachable‖
or the marginalized despite ethnic diversities and socio-economic factors. Lack of
financial resources should not be the lame excuse to not do anything to cater to the needs
and interests of the poor. Duty-bearers or service providers should find ways on how to
provide local public goods to the poor, especially in the poorest areas in Mindanao,
despite poverty, lack of human and financial resources, low IRA, lack of investments, etc.
Further, sustainability should be the hallmark of LSD in order for PAPs to have a lasting
development impact despite changing political leaderships, for example. A good
indicator on how to ensure sustainable PAPs is when communities and beneficiaries
themselves become partners of development, that is, when they are empowered to
participate in the planning, implementing, monitoring, evaluating of the PAPs that bear
impact on their lives. Community-based development PAPs therefore would imbue a
sense of ownership and develop social capital among local communities that could give
them reasons to take good care of PAPs benefiting them as well as holding local
leadership accountable in doing the same.
3.4 Principles of Decentralization. Effective LSD should cohere with decentralization
theorem: ―each public service should be provided by the jurisdiction having control over
the minimum geographic area that would internalize the benefits and costs of such a
provision‖ (Oates 1972: 35). It must also be in conformance with the principle of
subsidiarity where services are deemed to be delivered effectively by lower levels unless
the higher levels make a better job.
13
3.5 Governance as a Key Factor to Effective LSD. This study defines governance as
the sound institutional management of decentralization process for development vis-à-vis
local service delivery. It builds on ADB‘s institutionalist understanding of governance as
―the institutional environment in which citizens interact among themselves and with
government agencies/officials‖ (ADB 2004:3). Hence, in relation to LSD, it develops
―institutional governance‖ as an effective modality of LSD by virtue of (i) the
triangulation of policy environment and effectiveness, intergovernmental fiscal and
financial system, and institutional functionaries; (ii) primacy of local institutional actors
as main drivers of LSD; (iii) interaction of decentralization (decentralization theorem and
principle of subsidiarity) and governance (efficiency, transparency, accountability,
participation, and predictability/rule of law) principles and values (rights, gender-
responsiveness, equity, and sustainability) for effective LSD. Institutional governance
links itself up with LSD and local development outcomes as the foundation for effective
LSD. In laying the groundwork for effective LSD, it is guided by key governance
principles as efficiency (allocative and operational), accountability, transparency,
participation, and predictability.
Allocative efficiency refers to the way by which scarce resources are properly distributed
or allocated where they are expected to produce the optimum desirable development
impact. Operational efficiency is based on allocative efficiency only that it refers to
sound ―operations‖ or modalities, and not on allocations per se, in which resources are
maximally used without wastage and for greater outputs out of minimum inputs.
Accountability, according to World Bank (2004), means more than ‗answerability‘ and
‗enforceability‘ as it ―implies a set of relationships between principals and agents
encompassing five main features: delegation, finance, performance, information about
performance, and enforceability‖. Further, accountability has three characteristics:
upward, horizontal, and downward. Upward accountability refers to central supervision
of local service delivery. Horizontal accountability refers to local oversight or monitoring
among local institutional actors such as by local politicians of local bureaucrats and
sanggunians and local courts of LGUs. Downward accountability is about responding to
local needs and the power of citizens to hold local leaders to account on their
development promises (World Bank 2005: 19).
Transparency is about the availability and accessibility of accurate and timely
information about PAPs on service provision to the local public. It may also be about
unambiguous specification of implementing rules and regulations of LSD policies.
Further, transparency empowers the local public by giving them the power to hold
accountable local service providers such as in procurement concerns, and in the process,
lessen corruption.
Participation highlights the fact that the people are at the heart of development and
therefore are important partners/agents of development than mere beneficiaries.
Participation is correlative to empowerment and accountability in the sense that local
constituents have the power to participate in designing, implementing, and assessing
14
PAPs for effective LSD and can take service providers and politicians to account for their
policies, programs, and projects.
Predictability means that local service delivery is governed by strict implementation of
laws, regulations, and policies and not by adhocracy, or the whims of the powers that be.
15
CHAPTER 2
Policy and Institutional Analysis: Primary and
Secondary Education
1. Policy and Legal Framework
1.1 1987 Philippine Constitution. In the Philippines, the legal mandate to provide for
education6 in general and primary and secondary education
7 in particular is enshrined as a
state obligation in the 1987 Constitution. Section 1 of Article 14 states that ―The State
shall protect and promote the right of all citizens to quality education at all levels and
shall take appropriate steps to make such education accessible to all.‖ Section 2
elaborates on the state duty to provide and the citizen‘s right to claim quality education
on the following provisions:
―The state shall:
(1) Establish, maintain, and support complete, adequate, and
integrated system of education relevant to the needs of the people and
society;
(2) Establish and maintain a system of free education in the
elementary and high school levels. Without limiting the national right of
6 The Philippines‘ education system took a trifocalized structure in 1994/1995 – that is, having three-
layered system composed of basic education, vocational education, and higher education with three
government agencies being responsible for each layer: Department of Education (DepEd) for basic
education, Technical Education and Skills Development Authority (TESDA) for technical and vocational
education, and Commission on Higher Education (CHED) for higher education. DepEd‘s mandate covers
elementary, secondary, and nonformal education, including culture and sports. RA 7796 of 1994 mandates
TESDA to supervise post-secondary, middle-level manpower training and development. RA 7722 of 1994
mandates CHED to administer tertiary education in the country. (See Manasan, et.al., 2008: 9; Soliven, P.
and Reyes, M. 2008:5) 7 The Implementing Rules and Regulations of RA 9155 defines basic education, early childhood,
elementary education, and secondary education: ―Basic Education is the education intended to meet basic
learning needs which lays the foundation on which subsequent learning can be based. It encompasses early
childhood, elementary and high school education as well as alternative learning systems for out-of-school
youth and adult learners and includes education for those with special needs. Early Childhood refers to the
level of education that intends to prepare 5-6 year old children (one year before Grade One) for formal
schooling and at the same time narrow down adjustment and learning gaps. This level focuses on the
physical, social, moral and intellectual development through socialization and communication processes.
Elementary education shall refer to the first stage of free and compulsory, formal education primarily
concerned with providing basic education and usually corresponding to six or seven grades. Elementary
education can likewise be attained through alternative learning system. Secondary education shall refer to
the stage of free formal education following the elementary level concerned primarily with continuing basic
education usually corresponding to four years of high school. Secondary education can likewise be attained
through alternative learning system‖ (IRR of RA 9155). At present, 3-5 year old children are prepared for
Early Childhood, instead of 5-6 year old that used to be the age eligibility.
16
parents to rear their children, elementary education is compulsory for all
children of school age;
(3) Establish and maintain a system of scholarship grants, student
loan programs, subsidies, and other incentives which shall be available to
deserving students in both public and private schools, especially to the
underprivileged;
(4) Encourage non-formal, informal, and indigenous learning
systems, as well as self-learning, independent, and out-of-school study
programs particularly those that respond to community needs; and
(5) Provide adult citizens, the disabled, and out-of-school youth
with training in civics, vocational efficiency, and other skills.‖
Further, and most important for the financial aspect of education is Section 5 which states
that: ―The State shall assign the highest budgetary priority to education and ensure that
teaching will attract and retain its rightful share of the best available talents through
adequate remuneration and other means of job satisfaction and fulfillment.‖
1.2. 1991 Local Government Code. Since education sector is not one of the devolved
sectors8, there are only limited functions for the delivery of education services for the
LGUs. Sec. 17 of the 1991 LGC mandates provision of education services per LGU. For
a barangay, the main service provision is the maintenance of day care center. For a
municipality and a city construction, maintenance, and repair of infrastructure facilities
aimed at serving the needs of constituents such as school buildings and other facilities for
public elementary and secondary schools (LGC 1991: 7-8). Also, municipalities have
indirect education functions given their responsibility for social programs and projects on
child and youth welfare, street children, and juvenile delinquents. There is no mention of
education services for the province except for general provisions on social welfare
services, specifically ―Industrial research and development services, as well as the
transfer of technology (LGC 1991: 8).‖ Further, by virtue of Sec. 98 of the 1991 LGC, a
Local School Board (LSB), which is headed by the local chief executive, shall be
established in every province, city, or municipality. The primary task9 of a LSB is to
8 Education has not been devolved in the Philippines because of political reason, i.e. public schoolteachers,
who have traditionally served during elections by counting votes, would be made vulnerable to local
politics, thus compromising the election results in particular and integrity of the election system in general.
(King and Guerra 2005: 181-2, Loehr and Manasan 1999). 9 As spelled out in Sec. 99 of the 1991 LGC, the functions of local school boards are: ―(a) Determine, in
accordance with the criteria set by the Department of Education, Culture, and Sports, the annual
supplementary budgetary needs for the operation and maintenance of public schools with the province, city,
or municipality as the case may be, and the supplementary local cost of meeting such needs which shall be
reflected in the form of an annual school board budget corresponding to its share of the proceeds of the
special levy on real property constituting the Special Education Fund and such other sources of revenue as
this Code and other laws or ordinances may provide; (b) Authorize the provincial, city or municipal
treasurer, as the case may be, to disburse funds from the Special Education Fund pursuant to the budget
prepared and in accordance with existing rules and regulations; (c) Serve as an advisory committee to the
sanggunian concerned on education matters such as, but not limited to, the necessity for and the uses of
local appropriations for education purposes; and (d) Recommend changes in the names of public schools
17
administer, supervise, regulate the use of Special Education Fund (SEF) sourced from the
1% special levy on real property tax collected by the LGUs. This is for the purpose of
bettering education services of public schools by making it accessible and of high
standard quality. SEF may be appropriated for the following: ―(1) Construction, repair,
and maintenance of school buildings and other facilities of public elementary and
secondary schools; (2) Establishment and maintenance of extension classes when
necessary; and (3) Sports activities at the division, districts, municipal, and barangay
levels (LGC 1991: 35-36).‖
1.3. Basic Education-Related Laws. There is an assortment of laws related to basic
education. There are those relating to early childhood care education (ECCE). RA 6972,
―Day Care Law‖, which was enacted in 1992, mandates the establishment of one day care
center in every barangay nationwide to make education accessible especially to poor
families in remote areas. Complementing RA 6972 is RA 8980, ―ECCD Act‖, enacted in
2000, providing for a comprehensive policy and a National System for Early Childhood
Care and Development (ECCD).
Education Act of 1982 is a law that applies to both formal and non-formal systems in
public and private schools in all levels of the education system of the country.
This law fulfills the constitutional provision of the state‘s duty to promote every Filipino
child‘s right to relevant quality education based on the principle of equality in providing
access to, and equity, in quality of basic education, regardless of sex, creed, religion,
socio-economic status, political leanings, cultural or ethnic backgrounds, physical and
psychological makeup.
RA 7798, ―An Act Amending Section 25 of Education Act of 1982‖, provides for the
legal establishment of new national schools and the conversion of existing schools from
elementary to national elementary schools or from secondary to national secondary
schools or tertiary schools. This law takes a differential treatment of any school that is
organized as a stock corporation, exempting it from enjoying government subsidy,
incentive, assistance, except those given to individual students and teachers in the form of
scholarship, student loans or other forms of subsidy.
Geared towards infrastructure development related to education services, RA 7880 or the
―Roxas Law‖ titled as ―The Fair and Equitable Allocation of the DECS‘ Budget for
Capital Outlay‖ mandates that DepEd‘s budget for capital outlay shall be appropriated
following the principle of allocative efficiency and equity, that is, taking into account the
number of school children in all legislative districts and the number of usable classrooms
except the 10% to be allocated in accordance with the implementation of the policy as
may be determined by DepEd.
Related to Sec. 235 of 1991 LGC pertaining to ―Additional Levy on Real Property for the
Special Education Fund (SEF)‖, there is a complementary RA 5547 or ―An Act Creating
a Special Education Fund to be Constituted from the proceeds of An Additional Real
within the territorial jurisdiction of the local government unit for enactment by the sanggunian concerned
(LGC 1991: 35-36).‖
18
Property Tax and a Certain Portion of the Taxes on Virginia-Type Cigarettes and Duties
on Imported Leaf Tobacco.‖
Involving the private sector in the education service provision, RA 8525, ―An Act
Establishing an Adopt-A-School-Program‖, allows private entities to assist a public
school, whether elementary, secondary, or tertiary, especially those located in any of the
20 poorest provinces identified by the government agencies such as Presidential Council
for Countryside Development. Assistance from the private sector could be in the areas
of staff and faculty development for training and further education; construction of
facilities; upgrading of existing facilities; provision of books, publications and other
instructional materials; and modernization of instructional technologies. Government
Assistance to Students and Teachers in Private Education (GASTPE Program) is the
other law mandating private sector participation in basic education. Tuition subsidies are
provided to students who wish to enroll in private high schools.
Addressing equity issue, especially those related to Indigenous Peoples (IPs), RA 8371,
―Indigenous People‘s Right Act‖ mandates the state‘s duty to provide children from
indigenous people‘s communities the right to education in any form and at any level of
the education system. Catering to the special needs of children whose rights have been
violated, RA 7610, ―Special Protection Children Act‖ seeks to provide special education
to children who are victims of abuse, exploitation, discrimination, and violence.
Mindful of the important role that teachers play in basic education, RA 7784, ―An Act
Strengthening Teacher Education in the Philippines‖ seeks to establish Centers of
Excellence based on the principle of healthy competition among schools and universities
for teaching effectiveness. Also, in making teaching a fulfilling profession as a state duty
by virtue of Sec. 5, Article 14 of 1987 Constitution, RA 4670, ―Magna Carta for
Teachers‖ provides for just compensation and decent benefits to teachers.
One of the most important laws having to do with the governance of basic education is
RA 9155 enacted in 2001.
1.4 Governance of Basic Education Act of 2001 (RA 9155). This law renames the
Department of Education, Culture, and Sports (DECS) to Department of Education
(DepEd)10
. As the major policy reform initiated by the Philippine Government
immediately after the World Education Forum in 2000 in Dakar where the second
10
The history of education in the Philippines, and its central education authority for that matter, dates back
to the Spanish, American, and Japanese colonialism. After the post-World War II, the central education
authority was named Department of Education, replacing Department of Instruction through Executive
Order No. 94 of 1947. During this period, the Bureau of Public and Private Schools regulated and
supervised public and private schools in the country. When Martial Law was promulgated by then
President Marcos, the Ministry of Education and Culture was instituted, thirteen (13) regional offices were
established, and other major organizational makeovers were implemented in the whole educational system.
This was done through Proclamation 1081 of 1972. Education Act of 1982 (Batas Pambansa Blg. 232)
renamed the Martial Law Education Ministry into Ministry of Education, Culture and Sports, which later
became the Department of Education, Culture and Sports (DECS) in 1987 by virtue of Executive order No.
117. DECS was further changed into Department of Education through RA 9155 of 2001.
19
Education For All (2001-2015) goals were set, this law provides for a new governance
framework for basic education that is built on decentralization. This ―new governance
framework supports decentralization by empowering field offices and, especially, the
schools to take a more active role in initiating and undertaking cost-effective
innovations at the local level, based on the premise that decision-making at the lowest
level will result in greater efficiency, accountability and manageability (Emphasis in
original; Caoli-Rodriguez 2008: 4).‖ This law therefore adheres to the principles of
shared governance, principal empowerment, school-based management, and inclusion.
Shared governance because the provision of basic education is the responsibility by both
the national and field offices composed of regions, divisions, schools, and learning
centers. DepEd is mandated to ―set the general directions for educational policies and
standards and establish authority, accountability and responsibility for achieving higher
learning outcomes‖ while field offices are required to translate the national policies into
programs, projects, services that are developed, adapted and offered to cater to local
needs. Also, it is based on principals‘ empowerment because their leadership roles are
acknowledged as a key factor in improving education outcomes, and therefore, need to be
strengthened. Further, it is based on school –based management because only when
schools are empowered to concentrate on actual delivery of education services within the
context of transparency and accountability, can access and quality of education be
guaranteed. Lastly, it is premised on the principle of inclusion in that its definition of
basic education encompasses early childhood education, elementary and secondary
education as well as alternative learning systems (ALS) for out-of-school youth and adult
learners, and special education for those with special needs.
2. Institutions: Actors and Their Roles and Responsibilities
2.1. Organizational Chart of DepEd. Since education sector is not yet a devolved sector
in the Philippines, the institutional arrangement is still one of a hierarchical structure,
with DepEd at the top of the hierarchy, and its Secretary with most power and authority
supervising the field offices such as regional offices, school divisions, district offices, and
private and public schools as shown in the organizational chart below:
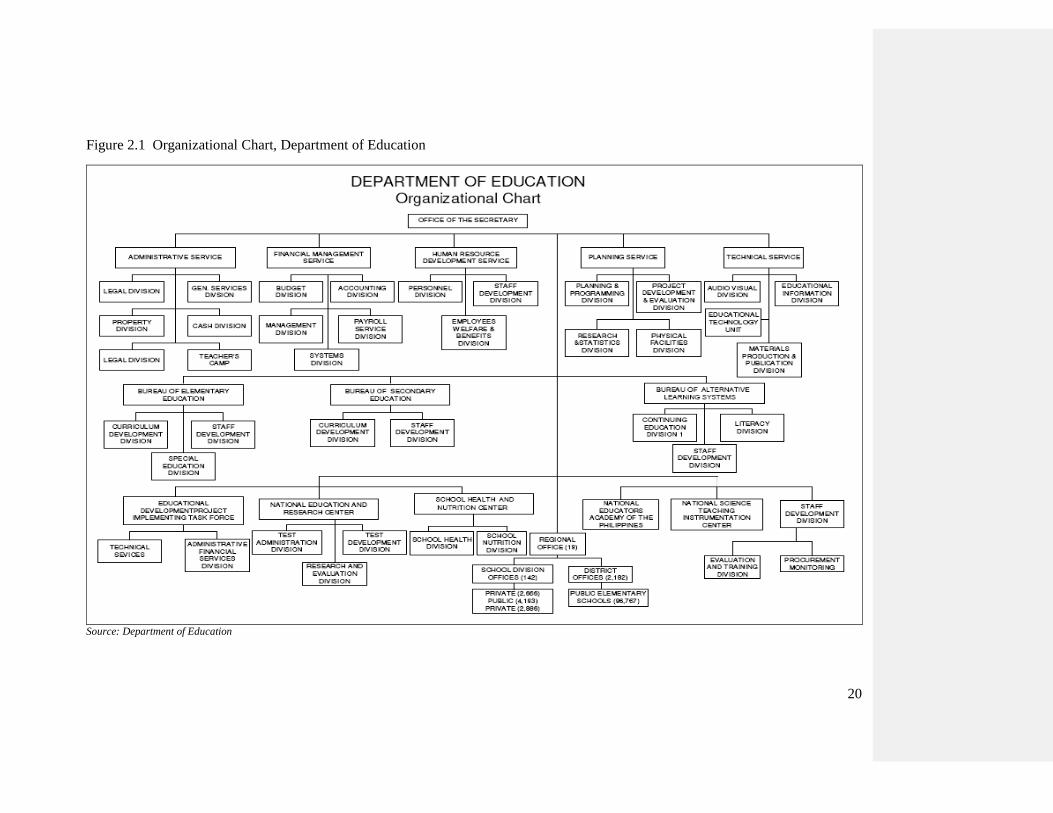
20
Figure 2.1 Organizational Chart, Department of Education
Source: Department of Education
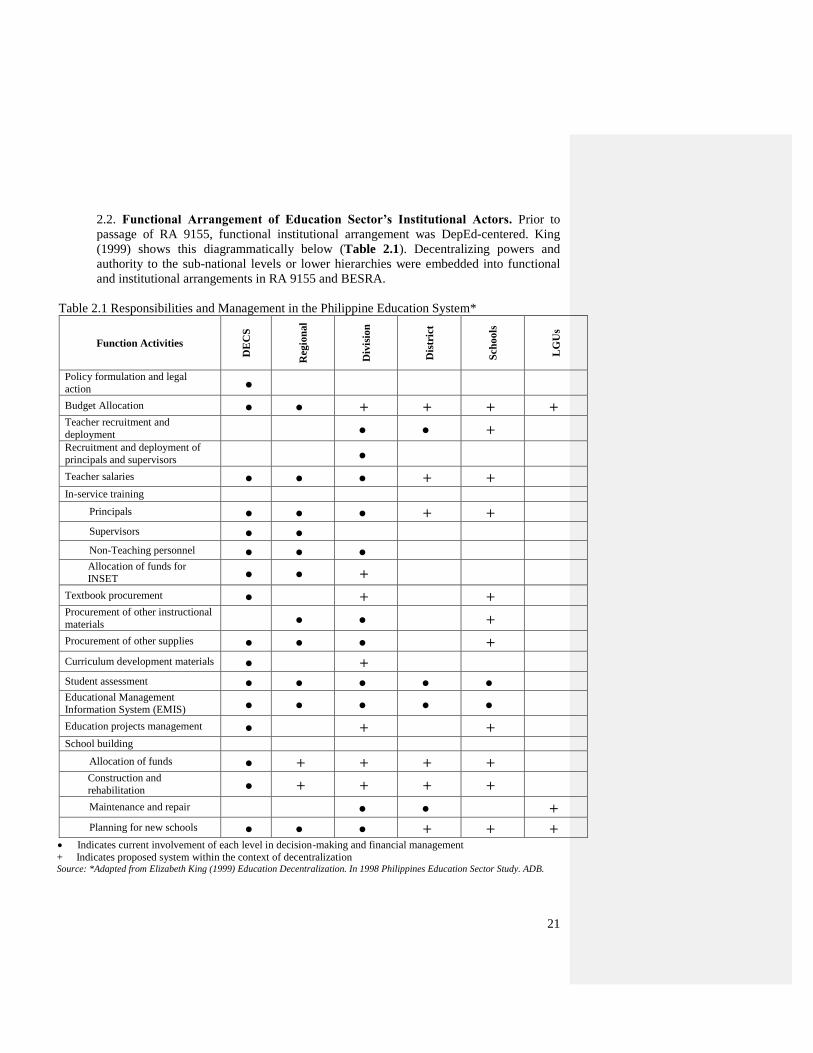
21
2.2. Functional Arrangement of Education Sector’s Institutional Actors. Prior to
passage of RA 9155, functional institutional arrangement was DepEd-centered. King
(1999) shows this diagrammatically below (Table 2.1). Decentralizing powers and
authority to the sub-national levels or lower hierarchies were embedded into functional
and institutional arrangements in RA 9155 and BESRA.
Table 2.1 Responsibilities and Management in the Philippine Education System*
Function Activities
DE
CS
Reg
ion
al
Div
isio
n
Dis
tric
t
Sch
oo
ls
LG
Us
Policy formulation and legal
action
Budget Allocation + + + +
Teacher recruitment and
deployment +
Recruitment and deployment of
principals and supervisors
Teacher salaries + +
In-service training
Principals + +
Supervisors
Non-Teaching personnel
Allocation of funds for
INSET +
Textbook procurement + +
Procurement of other instructional
materials +
Procurement of other supplies +
Curriculum development materials +
Student assessment
Educational Management
Information System (EMIS)
Education projects management + +
School building
Allocation of funds + + + +
Construction and
rehabilitation + + + +
Maintenance and repair +
Planning for new schools + + +
Indicates current involvement of each level in decision-making and financial management
+ Indicates proposed system within the context of decentralization Source: *Adapted from Elizabeth King (1999) Education Decentralization. In 1998 Philippines Education Sector Study. ADB.
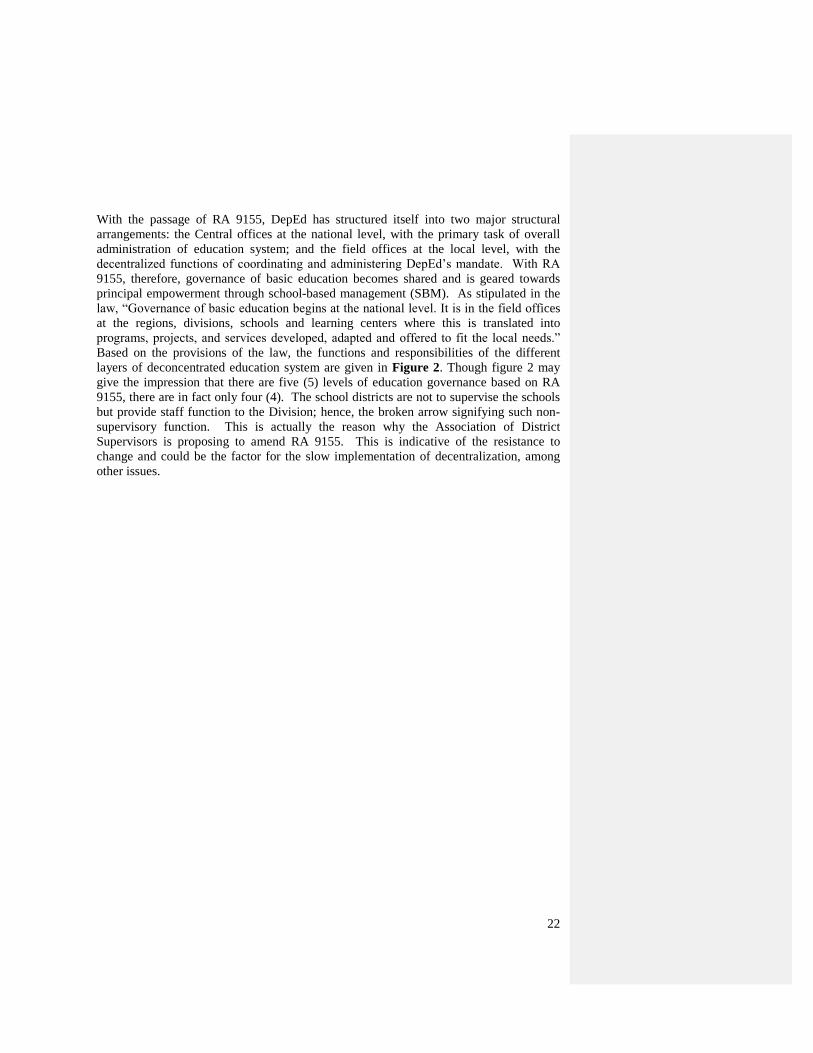
22
With the passage of RA 9155, DepEd has structured itself into two major structural
arrangements: the Central offices at the national level, with the primary task of overall
administration of education system; and the field offices at the local level, with the
decentralized functions of coordinating and administering DepEd‘s mandate. With RA
9155, therefore, governance of basic education becomes shared and is geared towards
principal empowerment through school-based management (SBM). As stipulated in the
law, ―Governance of basic education begins at the national level. It is in the field offices
at the regions, divisions, schools and learning centers where this is translated into
programs, projects, and services developed, adapted and offered to fit the local needs.‖
Based on the provisions of the law, the functions and responsibilities of the different
layers of deconcentrated education system are given in Figure 2. Though figure 2 may
give the impression that there are five (5) levels of education governance based on RA
9155, there are in fact only four (4). The school districts are not to supervise the schools
but provide staff function to the Division; hence, the broken arrow signifying such non-
supervisory function. This is actually the reason why the Association of District
Supervisors is proposing to amend RA 9155. This is indicative of the resistance to
change and could be the factor for the slow implementation of decentralization, among
other issues.
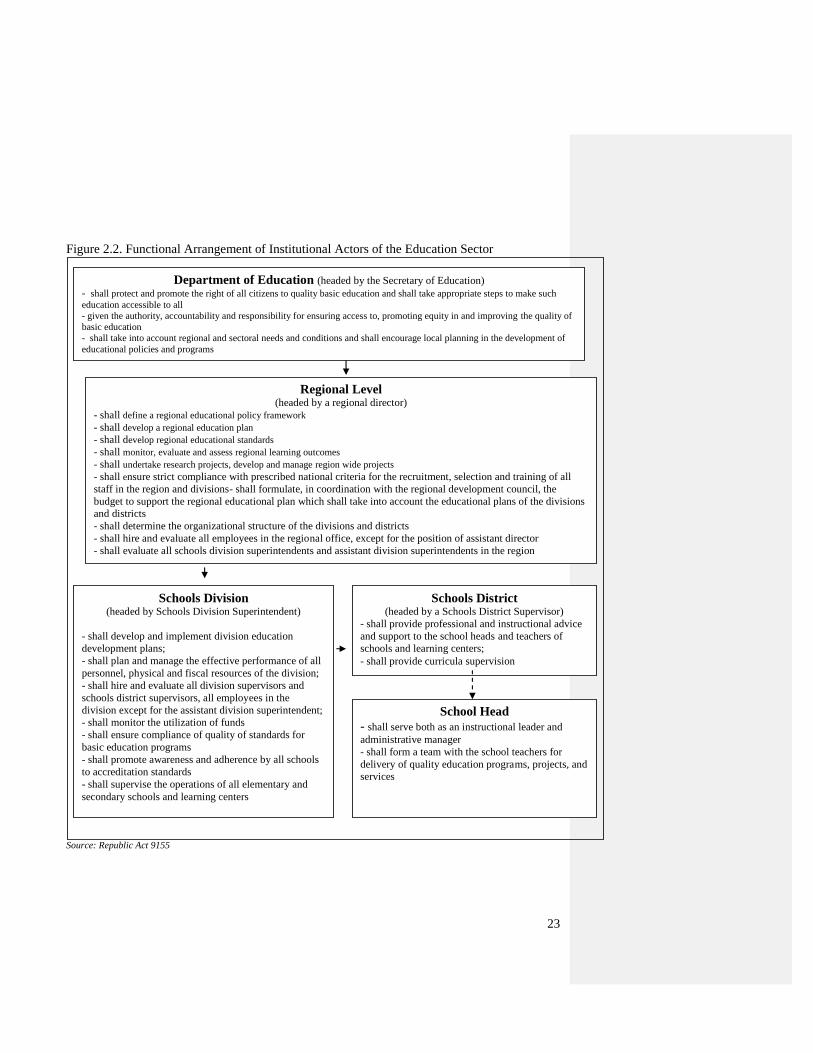
23
Figure 2.2. Functional Arrangement of Institutional Actors of the Education Sector
Source: Republic Act 9155
Department of Education (headed by the Secretary of Education)
- shall protect and promote the right of all citizens to quality basic education and shall take appropriate steps to make such
education accessible to all - given the authority, accountability and responsibility for ensuring access to, promoting equity in and improving the quality of
basic education
- shall take into account regional and sectoral needs and conditions and shall encourage local planning in the development of
educational policies and programs
Regional Level (headed by a regional director)
- shall define a regional educational policy framework
- shall develop a regional education plan
- shall develop regional educational standards
- shall monitor, evaluate and assess regional learning outcomes
- shall undertake research projects, develop and manage region wide projects
- shall ensure strict compliance with prescribed national criteria for the recruitment, selection and training of all
staff in the region and divisions- shall formulate, in coordination with the regional development council, the
budget to support the regional educational plan which shall take into account the educational plans of the divisions
and districts
- shall determine the organizational structure of the divisions and districts
- shall hire and evaluate all employees in the regional office, except for the position of assistant director
- shall evaluate all schools division superintendents and assistant division superintendents in the region
Schools Division
(headed by Schools Division Superintendent)
- shall develop and implement division education
development plans;
- shall plan and manage the effective performance of all
personnel, physical and fiscal resources of the division;
- shall hire and evaluate all division supervisors and
schools district supervisors, all employees in the
division except for the assistant division superintendent;
- shall monitor the utilization of funds
- shall ensure compliance of quality of standards for
basic education programs
- shall promote awareness and adherence by all schools
to accreditation standards
- shall supervise the operations of all elementary and
secondary schools and learning centers
Schools District (headed by a Schools District Supervisor)
- shall provide professional and instructional advice
and support to the school heads and teachers of
schools and learning centers;
- shall provide curricula supervision
School Head
- shall serve both as an instructional leader and
administrative manager
- shall form a team with the school teachers for
delivery of quality education programs, projects, and
services
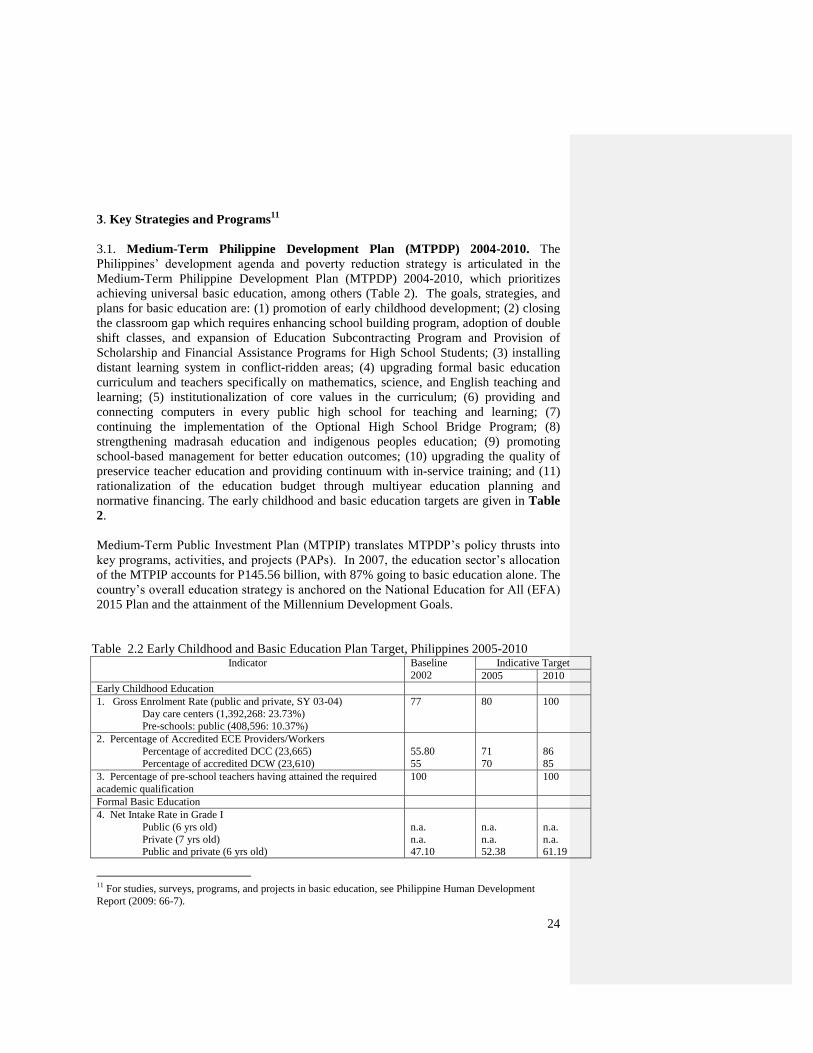
24
3. Key Strategies and Programs11
3.1. Medium-Term Philippine Development Plan (MTPDP) 2004-2010. The
Philippines‘ development agenda and poverty reduction strategy is articulated in the
Medium-Term Philippine Development Plan (MTPDP) 2004-2010, which prioritizes
achieving universal basic education, among others (Table 2). The goals, strategies, and
plans for basic education are: (1) promotion of early childhood development; (2) closing
the classroom gap which requires enhancing school building program, adoption of double
shift classes, and expansion of Education Subcontracting Program and Provision of
Scholarship and Financial Assistance Programs for High School Students; (3) installing
distant learning system in conflict-ridden areas; (4) upgrading formal basic education
curriculum and teachers specifically on mathematics, science, and English teaching and
learning; (5) institutionalization of core values in the curriculum; (6) providing and
connecting computers in every public high school for teaching and learning; (7)
continuing the implementation of the Optional High School Bridge Program; (8)
strengthening madrasah education and indigenous peoples education; (9) promoting
school-based management for better education outcomes; (10) upgrading the quality of
preservice teacher education and providing continuum with in-service training; and (11)
rationalization of the education budget through multiyear education planning and
normative financing. The early childhood and basic education targets are given in Table
2.
Medium-Term Public Investment Plan (MTPIP) translates MTPDP‘s policy thrusts into
key programs, activities, and projects (PAPs). In 2007, the education sector‘s allocation
of the MTPIP accounts for P145.56 billion, with 87% going to basic education alone. The
country‘s overall education strategy is anchored on the National Education for All (EFA)
2015 Plan and the attainment of the Millennium Development Goals.
Table 2.2 Early Childhood and Basic Education Plan Target, Philippines 2005-2010 Indicator Baseline
2002
Indicative Target
2005 2010
Early Childhood Education
1. Gross Enrolment Rate (public and private, SY 03-04)
Day care centers (1,392,268: 23.73%)
Pre-schools: public (408,596: 10.37%)
77 80 100
2. Percentage of Accredited ECE Providers/Workers
Percentage of accredited DCC (23,665)
Percentage of accredited DCW (23,610)
55.80
55
71
70
86
85
3. Percentage of pre-school teachers having attained the required
academic qualification
100 100
Formal Basic Education
4. Net Intake Rate in Grade I
Public (6 yrs old)
Private (7 yrs old)
Public and private (6 yrs old)
n.a.
n.a.
47.10
n.a.
n.a.
52.38
n.a.
n.a.
61.19
11
For studies, surveys, programs, and projects in basic education, see Philippine Human Development
Report (2009: 66-7).
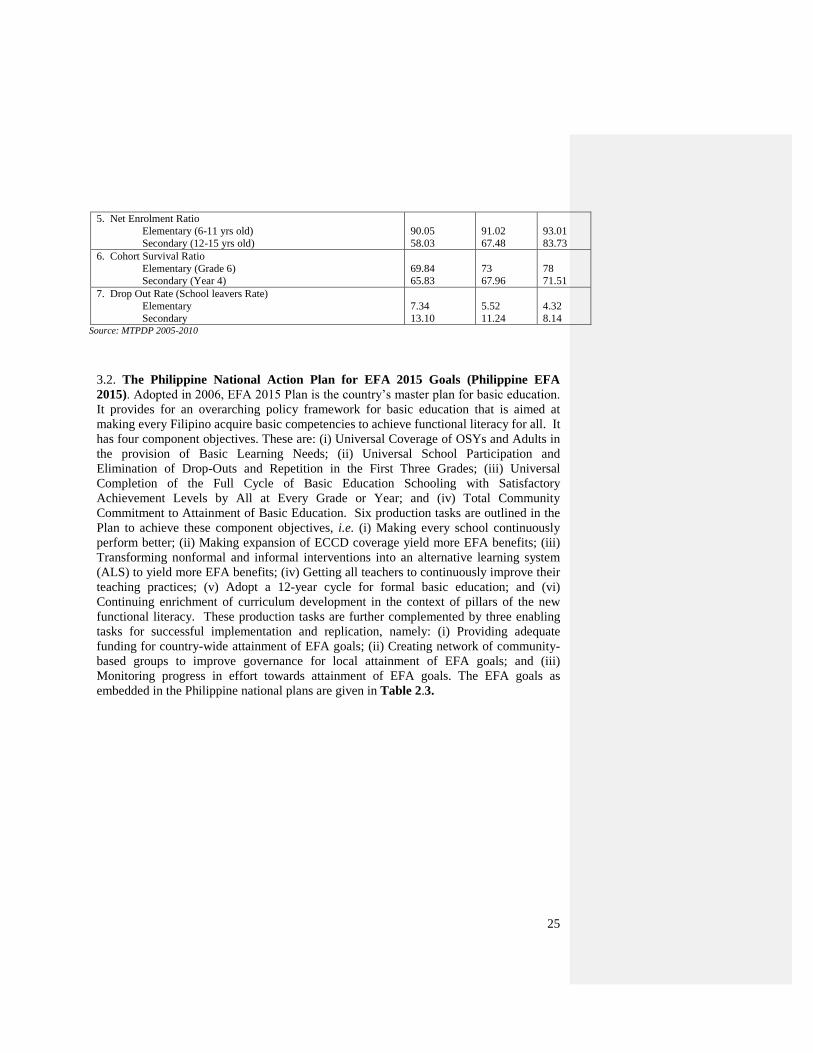
25
5. Net Enrolment Ratio
Elementary (6-11 yrs old)
Secondary (12-15 yrs old)
90.05
58.03
91.02
67.48
93.01
83.73
6. Cohort Survival Ratio
Elementary (Grade 6)
Secondary (Year 4)
69.84
65.83
73
67.96
78
71.51
7. Drop Out Rate (School leavers Rate)
Elementary
Secondary
7.34
13.10
5.52
11.24
4.32
8.14 Source: MTPDP 2005-2010
3.2. The Philippine National Action Plan for EFA 2015 Goals (Philippine EFA
2015). Adopted in 2006, EFA 2015 Plan is the country‘s master plan for basic education.
It provides for an overarching policy framework for basic education that is aimed at
making every Filipino acquire basic competencies to achieve functional literacy for all. It
has four component objectives. These are: (i) Universal Coverage of OSYs and Adults in
the provision of Basic Learning Needs; (ii) Universal School Participation and
Elimination of Drop-Outs and Repetition in the First Three Grades; (iii) Universal
Completion of the Full Cycle of Basic Education Schooling with Satisfactory
Achievement Levels by All at Every Grade or Year; and (iv) Total Community
Commitment to Attainment of Basic Education. Six production tasks are outlined in the
Plan to achieve these component objectives, i.e. (i) Making every school continuously
perform better; (ii) Making expansion of ECCD coverage yield more EFA benefits; (iii)
Transforming nonformal and informal interventions into an alternative learning system
(ALS) to yield more EFA benefits; (iv) Getting all teachers to continuously improve their
teaching practices; (v) Adopt a 12-year cycle for formal basic education; and (vi)
Continuing enrichment of curriculum development in the context of pillars of the new
functional literacy. These production tasks are further complemented by three enabling
tasks for successful implementation and replication, namely: (i) Providing adequate
funding for country-wide attainment of EFA goals; (ii) Creating network of community-
based groups to improve governance for local attainment of EFA goals; and (iii)
Monitoring progress in effort towards attainment of EFA goals. The EFA goals as
embedded in the Philippine national plans are given in Table 2.3.
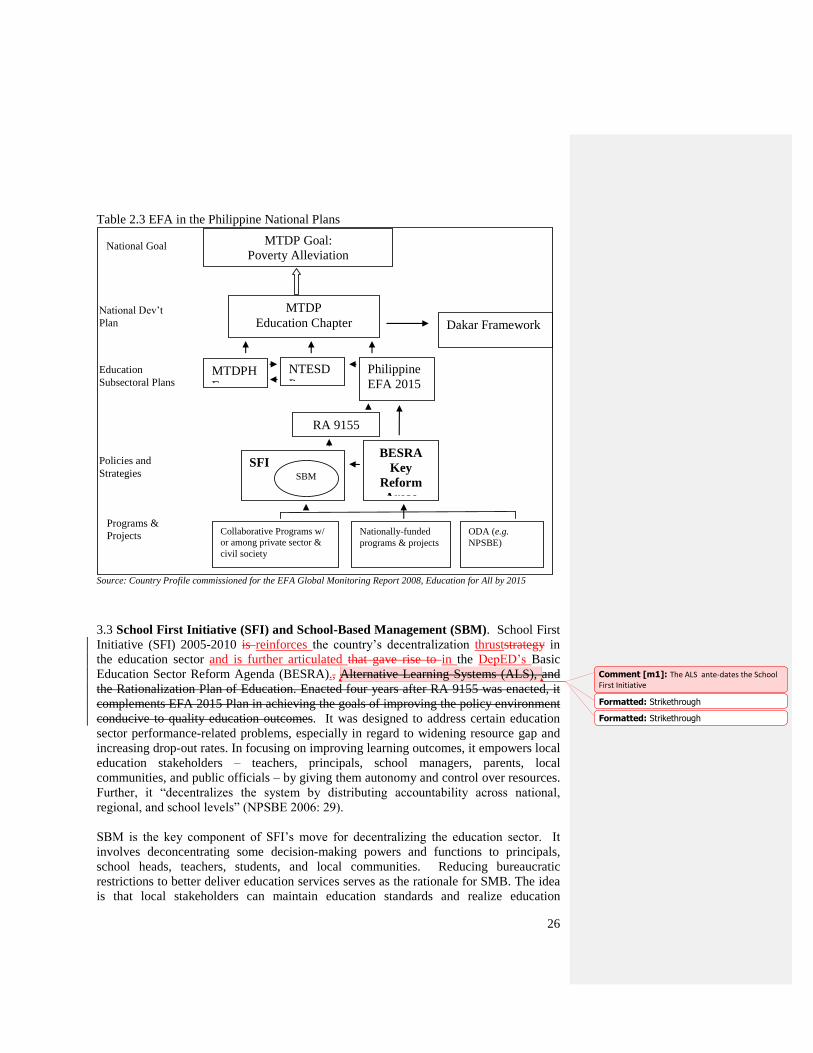
26
Table 2.3 EFA in the Philippine National Plans
Source: Country Profile commissioned for the EFA Global Monitoring Report 2008, Education for All by 2015
3.3 School First Initiative (SFI) and School-Based Management (SBM). School First
Initiative (SFI) 2005-2010 is reinforces the country‘s decentralization thruststrategy in
the education sector and is further articulated that gave rise to in the DepED‘s Basic
Education Sector Reform Agenda (BESRA)., Alternative Learning Systems (ALS), and
the Rationalization Plan of Education. Enacted four years after RA 9155 was enacted, it
complements EFA 2015 Plan in achieving the goals of improving the policy environment
conducive to quality education outcomes. It was designed to address certain education
sector performance-related problems, especially in regard to widening resource gap and
increasing drop-out rates. In focusing on improving learning outcomes, it empowers local
education stakeholders – teachers, principals, school managers, parents, local
communities, and public officials – by giving them autonomy and control over resources.
Further, it ―decentralizes the system by distributing accountability across national,
regional, and school levels‖ (NPSBE 2006: 29).
SBM is the key component of SFI‘s move for decentralizing the education sector. It
involves deconcentrating some decision-making powers and functions to principals,
school heads, teachers, students, and local communities. Reducing bureaucratic
restrictions to better deliver education services serves as the rationale for SMB. The idea
is that local stakeholders can maintain education standards and realize education
MTDP Goal:
Poverty Alleviation National Goal
National Dev‘t
Plan
Education
Subsectoral Plans
MTDP
Education Chapter
MTDPH
E
NTESD
P
Dakar Framework
Philippine
EFA 2015
RA 9155
BESRA
Key
Reform
Areas
SFI SBM
Policies and
Strategies
Programs &
Projects Collaborative Programs w/
or among private sector &
civil society
Nationally-funded
programs & projects
ODA (e.g.
NPSBE)
Formatted: Strikethrough
Comment [m1]: The ALS ante-dates the School First Initiative
Formatted: Strikethrough
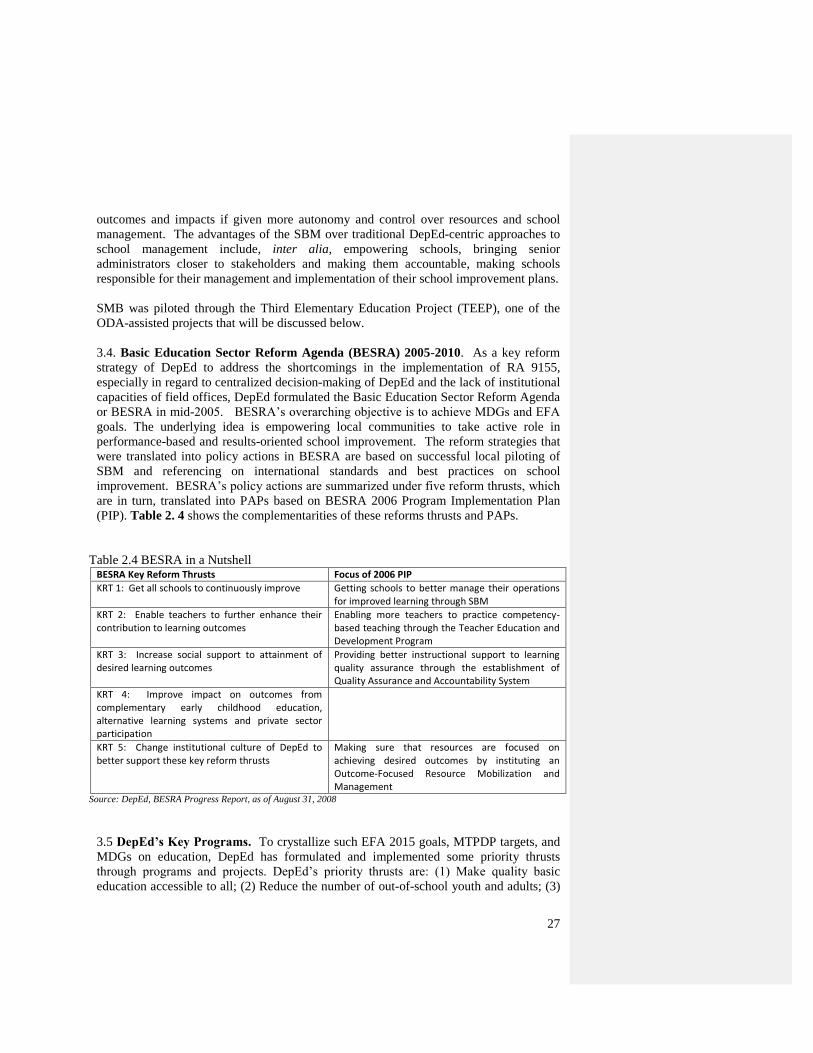
27
outcomes and impacts if given more autonomy and control over resources and school
management. The advantages of the SBM over traditional DepEd-centric approaches to
school management include, inter alia, empowering schools, bringing senior
administrators closer to stakeholders and making them accountable, making schools
responsible for their management and implementation of their school improvement plans.
SMB was piloted through the Third Elementary Education Project (TEEP), one of the
ODA-assisted projects that will be discussed below.
3.4. Basic Education Sector Reform Agenda (BESRA) 2005-2010. As a key reform
strategy of DepEd to address the shortcomings in the implementation of RA 9155,
especially in regard to centralized decision-making of DepEd and the lack of institutional
capacities of field offices, DepEd formulated the Basic Education Sector Reform Agenda
or BESRA in mid-2005. BESRA‘s overarching objective is to achieve MDGs and EFA
goals. The underlying idea is empowering local communities to take active role in
performance-based and results-oriented school improvement. The reform strategies that
were translated into policy actions in BESRA are based on successful local piloting of
SBM and referencing on international standards and best practices on school
improvement. BESRA‘s policy actions are summarized under five reform thrusts, which
are in turn, translated into PAPs based on BESRA 2006 Program Implementation Plan
(PIP). Table 2. 4 shows the complementarities of these reforms thrusts and PAPs.
Table 2.4 BESRA in a Nutshell BESRA Key Reform Thrusts Focus of 2006 PIP
KRT 1: Get all schools to continuously improve Getting schools to better manage their operations for improved learning through SBM
KRT 2: Enable teachers to further enhance their contribution to learning outcomes
Enabling more teachers to practice competency-based teaching through the Teacher Education and Development Program
KRT 3: Increase social support to attainment of desired learning outcomes
Providing better instructional support to learning quality assurance through the establishment of Quality Assurance and Accountability System
KRT 4: Improve impact on outcomes from complementary early childhood education, alternative learning systems and private sector participation
KRT 5: Change institutional culture of DepEd to better support these key reform thrusts
Making sure that resources are focused on achieving desired outcomes by instituting an Outcome-Focused Resource Mobilization and Management
Source: DepEd, BESRA Progress Report, as of August 31, 2008
3.5 DepEd’s Key Programs. To crystallize such EFA 2015 goals, MTPDP targets, and
MDGs on education, DepEd has formulated and implemented some priority thrusts
through programs and projects. DepEd‘s priority thrusts are: (1) Make quality basic
education accessible to all; (2) Reduce the number of out-of-school youth and adults; (3)
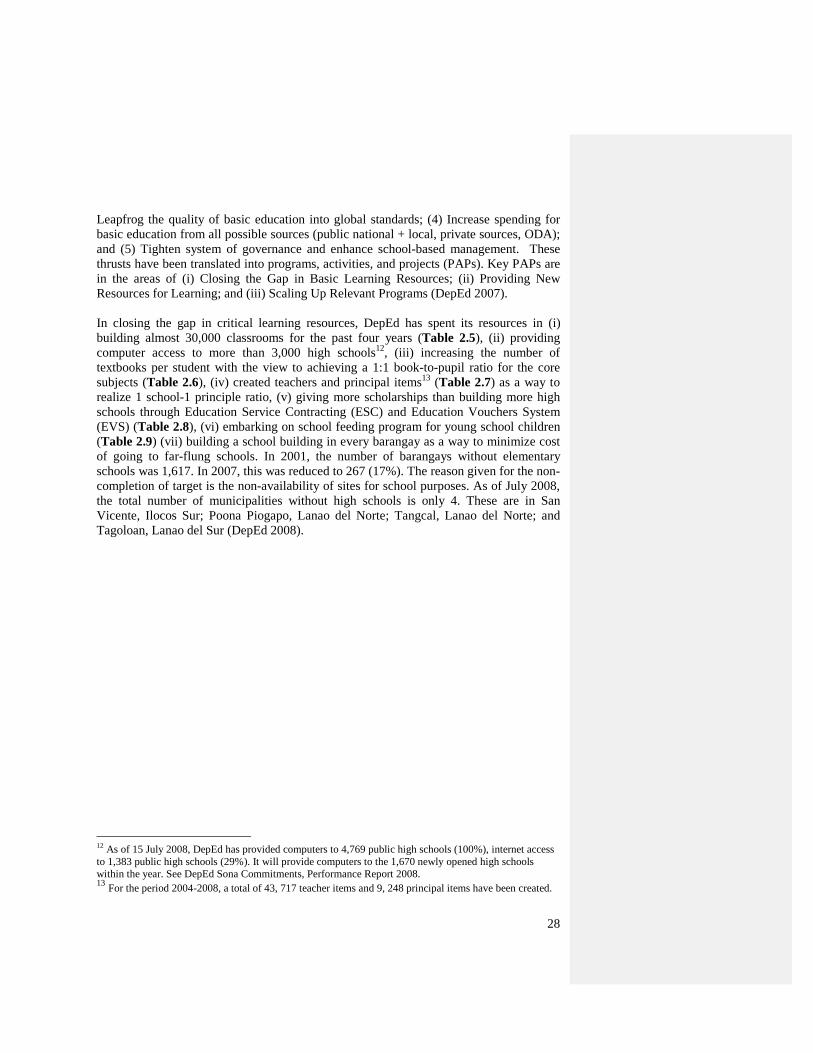
28
Leapfrog the quality of basic education into global standards; (4) Increase spending for
basic education from all possible sources (public national + local, private sources, ODA);
and (5) Tighten system of governance and enhance school-based management. These
thrusts have been translated into programs, activities, and projects (PAPs). Key PAPs are
in the areas of (i) Closing the Gap in Basic Learning Resources; (ii) Providing New
Resources for Learning; and (iii) Scaling Up Relevant Programs (DepEd 2007).
In closing the gap in critical learning resources, DepEd has spent its resources in (i)
building almost 30,000 classrooms for the past four years (Table 2.5), (ii) providing
computer access to more than 3,000 high schools12
, (iii) increasing the number of
textbooks per student with the view to achieving a 1:1 book-to-pupil ratio for the core
subjects (Table 2.6), (iv) created teachers and principal items13
(Table 2.7) as a way to
realize 1 school-1 principle ratio, (v) giving more scholarships than building more high
schools through Education Service Contracting (ESC) and Education Vouchers System
(EVS) (Table 2.8), (vi) embarking on school feeding program for young school children
(Table 2.9) (vii) building a school building in every barangay as a way to minimize cost
of going to far-flung schools. In 2001, the number of barangays without elementary
schools was 1,617. In 2007, this was reduced to 267 (17%). The reason given for the non-
completion of target is the non-availability of sites for school purposes. As of July 2008,
the total number of municipalities without high schools is only 4. These are in San
Vicente, Ilocos Sur; Poona Piogapo, Lanao del Norte; Tangcal, Lanao del Norte; and
Tagoloan, Lanao del Sur (DepEd 2008).
12
As of 15 July 2008, DepEd has provided computers to 4,769 public high schools (100%), internet access
to 1,383 public high schools (29%). It will provide computers to the 1,670 newly opened high schools
within the year. See DepEd Sona Commitments, Performance Report 2008. 13
For the period 2004-2008, a total of 43, 717 teacher items and 9, 248 principal items have been created.
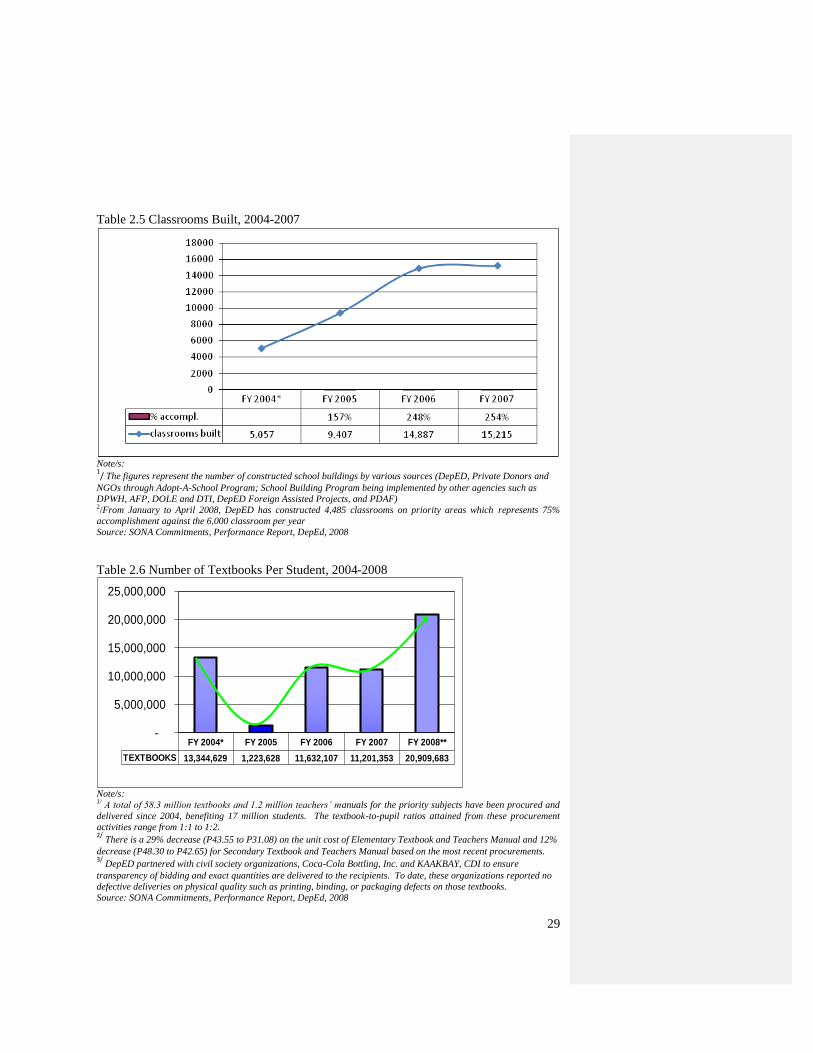
29
Table 2.5 Classrooms Built, 2004-2007
Note/s: 1/ The figures represent the number of constructed school buildings by various sources (DepED, Private Donors and
NGOs through Adopt-A-School Program; School Building Program being implemented by other agencies such as
DPWH, AFP, DOLE and DTI, DepED Foreign Assisted Projects, and PDAF) 2/From January to April 2008, DepED has constructed 4,485 classrooms on priority areas which represents 75%
accomplishment against the 6,000 classroom per year
Source: SONA Commitments, Performance Report, DepEd, 2008
Table 2.6 Number of Textbooks Per Student, 2004-2008
FY 2004* FY 2005 FY 2006 FY 2007 FY 2008**
TEXTBOOKS 13,344,629 1,223,628 11,632,107 11,201,353 20,909,683
-
5,000,000
10,000,000
15,000,000
20,000,000
25,000,000
Note/s: 1/ A total of 58.3 million textbooks and 1.2 million teachers’ manuals for the priority subjects have been procured and
delivered since 2004, benefiting 17 million students. The textbook-to-pupil ratios attained from these procurement
activities range from 1:1 to 1:2. 2/
There is a 29% decrease (P43.55 to P31.08) on the unit cost of Elementary Textbook and Teachers Manual and 12%
decrease (P48.30 to P42.65) for Secondary Textbook and Teachers Manual based on the most recent procurements. 3/
DepED partnered with civil society organizations, Coca-Cola Bottling, Inc. and KAAKBAY, CDI to ensure
transparency of bidding and exact quantities are delivered to the recipients. To date, these organizations reported no
defective deliveries on physical quality such as printing, binding, or packaging defects on those textbooks.
Source: SONA Commitments, Performance Report, DepEd, 2008
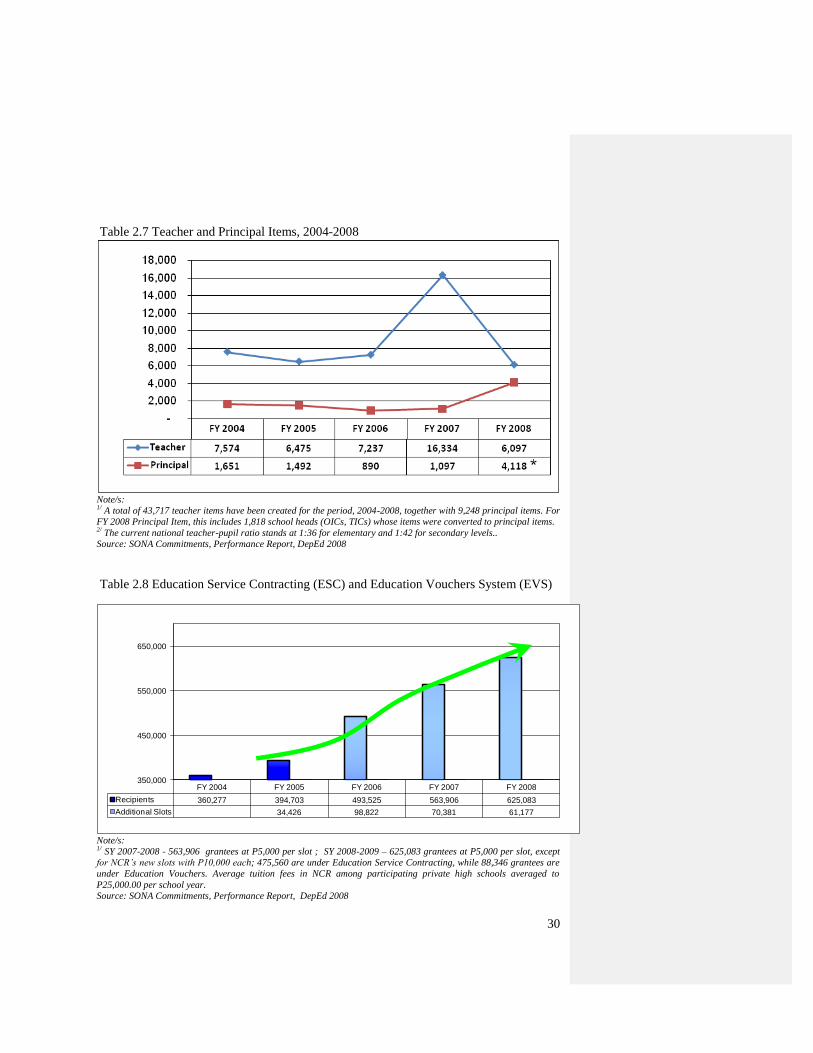
30
Table 2.7 Teacher and Principal Items, 2004-2008
Note/s: 1/ A total of 43,717 teacher items have been created for the period, 2004-2008, together with 9,248 principal items. For
FY 2008 Principal Item, this includes 1,818 school heads (OICs, TICs) whose items were converted to principal items. 2/ The current national teacher-pupil ratio stands at 1:36 for elementary and 1:42 for secondary levels..
Source: SONA Commitments, Performance Report, DepEd 2008
Table 2.8 Education Service Contracting (ESC) and Education Vouchers System (EVS)
FY 2004 FY 2005 FY 2006 FY 2007 FY 2008
Recipients 360,277 394,703 493,525 563,906 625,083
Additional Slots 34,426 98,822 70,381 61,177
350,000
450,000
550,000
650,000
Note/s: 1/ SY 2007-2008 - 563,906 grantees at P5,000 per slot ; SY 2008-2009 – 625,083 grantees at P5,000 per slot, except
for NCR’s new slots with P10,000 each; 475,560 are under Education Service Contracting, while 88,346 grantees are
under Education Vouchers. Average tuition fees in NCR among participating private high schools averaged to
P25,000.00 per school year.
Source: SONA Commitments, Performance Report, DepEd 2008
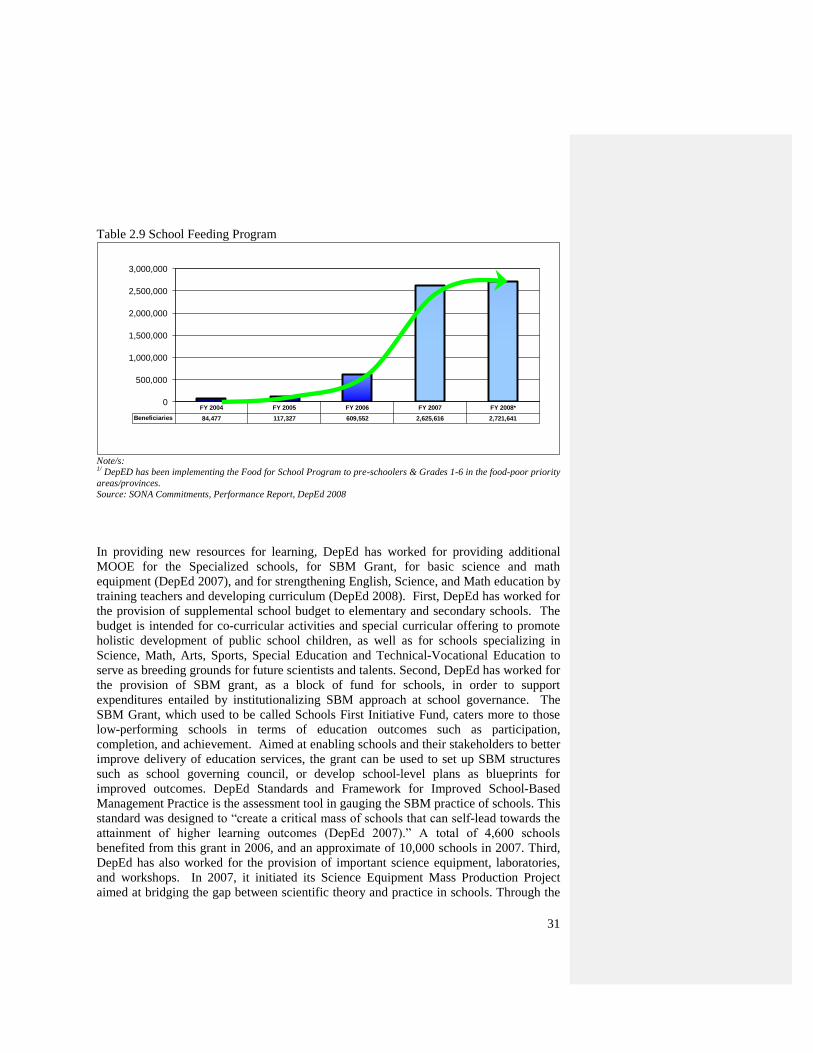
31
Table 2.9 School Feeding Program
FY 2004 FY 2005 FY 2006 FY 2007 FY 2008*
Beneficiaries 84,477 117,327 609,552 2,625,616 2,721,641
0
500,000
1,000,000
1,500,000
2,000,000
2,500,000
3,000,000
Note/s: 1/ DepED has been implementing the Food for School Program to pre-schoolers & Grades 1-6 in the food-poor priority
areas/provinces.
Source: SONA Commitments, Performance Report, DepEd 2008
In providing new resources for learning, DepEd has worked for providing additional
MOOE for the Specialized schools, for SBM Grant, for basic science and math
equipment (DepEd 2007), and for strengthening English, Science, and Math education by
training teachers and developing curriculum (DepEd 2008). First, DepEd has worked for
the provision of supplemental school budget to elementary and secondary schools. The
budget is intended for co-curricular activities and special curricular offering to promote
holistic development of public school children, as well as for schools specializing in
Science, Math, Arts, Sports, Special Education and Technical-Vocational Education to
serve as breeding grounds for future scientists and talents. Second, DepEd has worked for
the provision of SBM grant, as a block of fund for schools, in order to support
expenditures entailed by institutionalizing SBM approach at school governance. The
SBM Grant, which used to be called Schools First Initiative Fund, caters more to those
low-performing schools in terms of education outcomes such as participation,
completion, and achievement. Aimed at enabling schools and their stakeholders to better
improve delivery of education services, the grant can be used to set up SBM structures
such as school governing council, or develop school-level plans as blueprints for
improved outcomes. DepEd Standards and Framework for Improved School-Based
Management Practice is the assessment tool in gauging the SBM practice of schools. This
standard was designed to ―create a critical mass of schools that can self-lead towards the
attainment of higher learning outcomes (DepEd 2007).‖ A total of 4,600 schools
benefited from this grant in 2006, and an approximate of 10,000 schools in 2007. Third,
DepEd has also worked for the provision of important science equipment, laboratories,
and workshops. In 2007, it initiated its Science Equipment Mass Production Project
aimed at bridging the gap between scientific theory and practice in schools. Through the
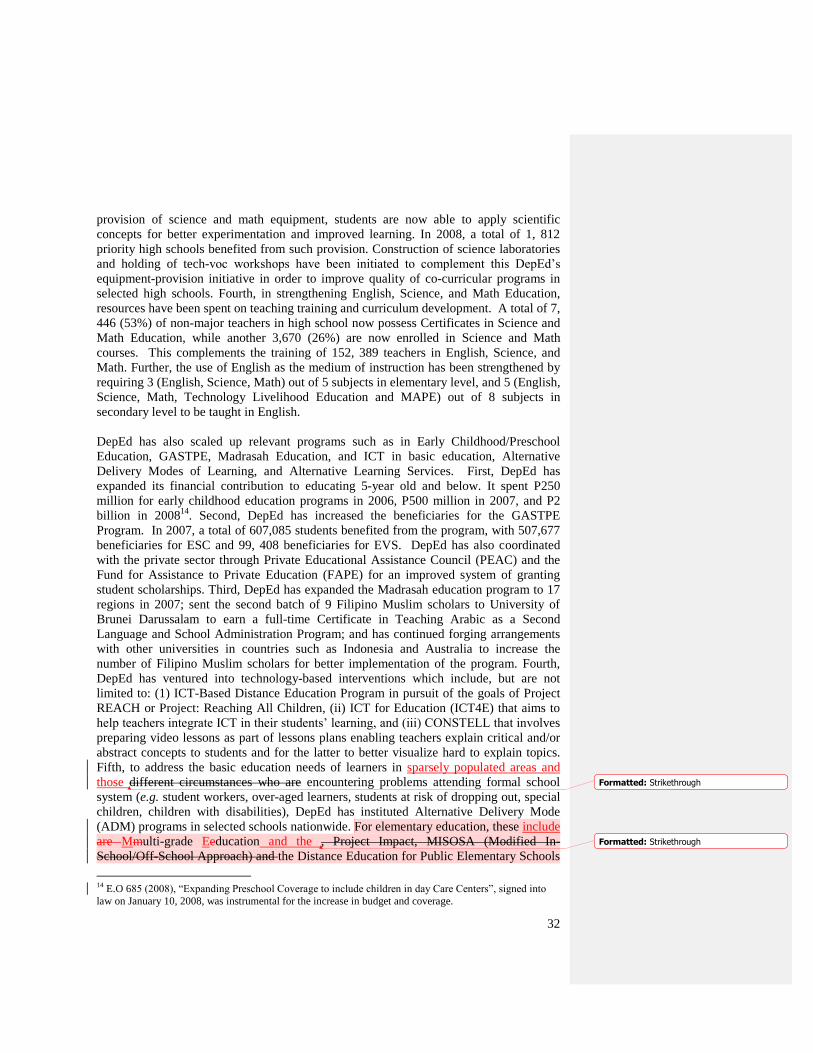
32
provision of science and math equipment, students are now able to apply scientific
concepts for better experimentation and improved learning. In 2008, a total of 1, 812
priority high schools benefited from such provision. Construction of science laboratories
and holding of tech-voc workshops have been initiated to complement this DepEd‘s
equipment-provision initiative in order to improve quality of co-curricular programs in
selected high schools. Fourth, in strengthening English, Science, and Math Education,
resources have been spent on teaching training and curriculum development. A total of 7,
446 (53%) of non-major teachers in high school now possess Certificates in Science and
Math Education, while another 3,670 (26%) are now enrolled in Science and Math
courses. This complements the training of 152, 389 teachers in English, Science, and
Math. Further, the use of English as the medium of instruction has been strengthened by
requiring 3 (English, Science, Math) out of 5 subjects in elementary level, and 5 (English,
Science, Math, Technology Livelihood Education and MAPE) out of 8 subjects in
secondary level to be taught in English.
DepEd has also scaled up relevant programs such as in Early Childhood/Preschool
Education, GASTPE, Madrasah Education, and ICT in basic education, Alternative
Delivery Modes of Learning, and Alternative Learning Services. First, DepEd has
expanded its financial contribution to educating 5-year old and below. It spent P250
million for early childhood education programs in 2006, P500 million in 2007, and P2
billion in 200814
. Second, DepEd has increased the beneficiaries for the GASTPE
Program. In 2007, a total of 607,085 students benefited from the program, with 507,677
beneficiaries for ESC and 99, 408 beneficiaries for EVS. DepEd has also coordinated
with the private sector through Private Educational Assistance Council (PEAC) and the
Fund for Assistance to Private Education (FAPE) for an improved system of granting
student scholarships. Third, DepEd has expanded the Madrasah education program to 17
regions in 2007; sent the second batch of 9 Filipino Muslim scholars to University of
Brunei Darussalam to earn a full-time Certificate in Teaching Arabic as a Second
Language and School Administration Program; and has continued forging arrangements
with other universities in countries such as Indonesia and Australia to increase the
number of Filipino Muslim scholars for better implementation of the program. Fourth,
DepEd has ventured into technology-based interventions which include, but are not
limited to: (1) ICT-Based Distance Education Program in pursuit of the goals of Project
REACH or Project: Reaching All Children, (ii) ICT for Education (ICT4E) that aims to
help teachers integrate ICT in their students‘ learning, and (iii) CONSTELL that involves
preparing video lessons as part of lessons plans enabling teachers explain critical and/or
abstract concepts to students and for the latter to better visualize hard to explain topics.
Fifth, to address the basic education needs of learners in sparsely populated areas and
those different circumstances who are encountering problems attending formal school
system (e.g. student workers, over-aged learners, students at risk of dropping out, special
children, children with disabilities), DepEd has instituted Alternative Delivery Mode
(ADM) programs in selected schools nationwide. For elementary education, these include
are Mmulti-grade Eeducation and the , Project Impact, MISOSA (Modified In-
School/Off-School Approach) and the Distance Education for Public Elementary Schools
14
E.O 685 (2008), ―Expanding Preschool Coverage to include children in day Care Centers‖, signed into
law on January 10, 2008, was instrumental for the increase in budget and coverage.
Formatted: Strikethrough
Formatted: Strikethrough
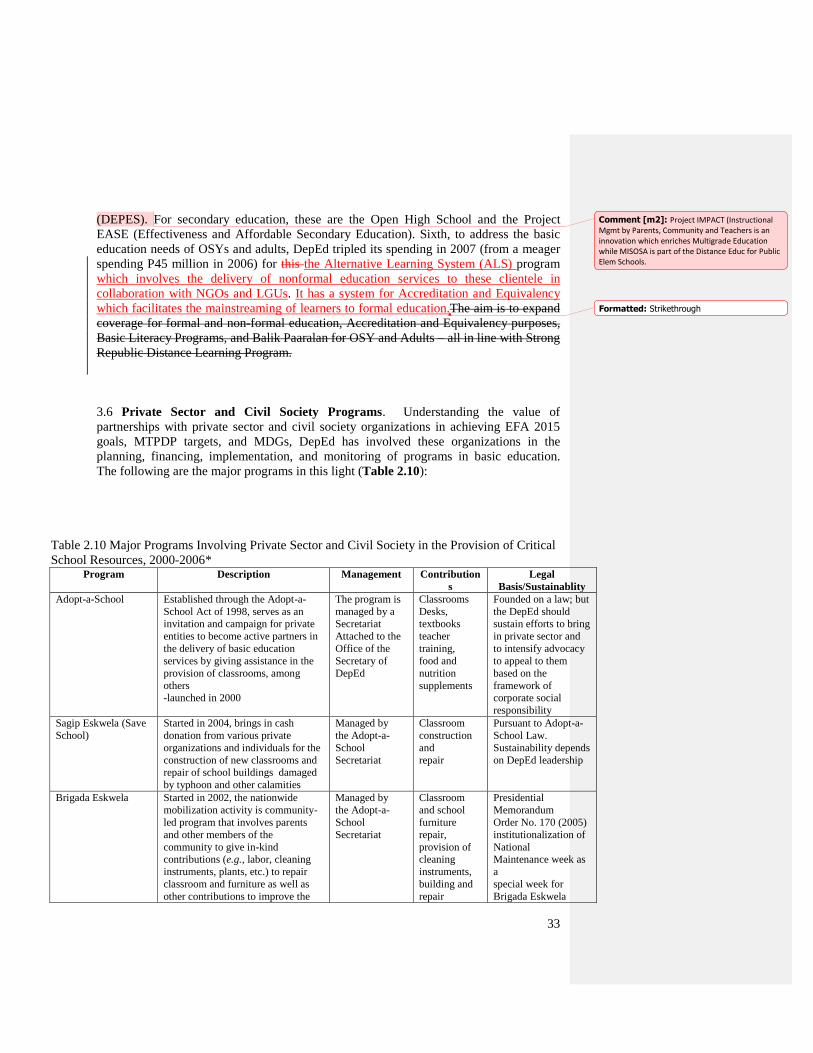
33
(DEPES). For secondary education, these are the Open High School and the Project
EASE (Effectiveness and Affordable Secondary Education). Sixth, to address the basic
education needs of OSYs and adults, DepEd tripled its spending in 2007 (from a meager
spending P45 million in 2006) for this the Alternative Learning System (ALS) program
which involves the delivery of nonformal education services to these clientele in
collaboration with NGOs and LGUs. It has a system for Accreditation and Equivalency
which facilitates the mainstreaming of learners to formal education.The aim is to expand
coverage for formal and non-formal education, Accreditation and Equivalency purposes,
Basic Literacy Programs, and Balik Paaralan for OSY and Adults – all in line with Strong
Republic Distance Learning Program.
3.6 Private Sector and Civil Society Programs. Understanding the value of
partnerships with private sector and civil society organizations in achieving EFA 2015
goals, MTPDP targets, and MDGs, DepEd has involved these organizations in the
planning, financing, implementation, and monitoring of programs in basic education.
The following are the major programs in this light (Table 2.10):
Table 2.10 Major Programs Involving Private Sector and Civil Society in the Provision of Critical
School Resources, 2000-2006* Program Description Management Contribution
s
Legal
Basis/Sustainablity
Adopt-a-School Established through the Adopt-a-
School Act of 1998, serves as an
invitation and campaign for private
entities to become active partners in
the delivery of basic education
services by giving assistance in the
provision of classrooms, among
others
-launched in 2000
The program is
managed by a
Secretariat
Attached to the
Office of the
Secretary of
DepEd
Classrooms
Desks,
textbooks
teacher
training,
food and
nutrition
supplements
Founded on a law; but
the DepEd should
sustain efforts to bring
in private sector and
to intensify advocacy
to appeal to them
based on the
framework of
corporate social
responsibility
Sagip Eskwela (Save
School)
Started in 2004, brings in cash
donation from various private
organizations and individuals for the
construction of new classrooms and
repair of school buildings damaged
by typhoon and other calamities
Managed by
the Adopt-a-
School
Secretariat
Classroom
construction
and
repair
Pursuant to Adopt-a-
School Law.
Sustainability depends
on DepEd leadership
Brigada Eskwela Started in 2002, the nationwide
mobilization activity is community-
led program that involves parents
and other members of the
community to give in-kind
contributions (e.g., labor, cleaning
instruments, plants, etc.) to repair
classroom and furniture as well as
other contributions to improve the
Managed by
the Adopt-a-
School
Secretariat
Classroom
and school
furniture
repair,
provision of
cleaning
instruments,
building and
repair
Presidential
Memorandum
Order No. 170 (2005)
institutionalization of
National
Maintenance week as
a
special week for
Brigada Eskwela
Comment [m2]: Project IMPACT (Instructional Mgmt by Parents, Community and Teachers is an innovation which enriches Multigrade Education while MISOSA is part of the Distance Educ for Public Elem Schools.
Formatted: Strikethrough
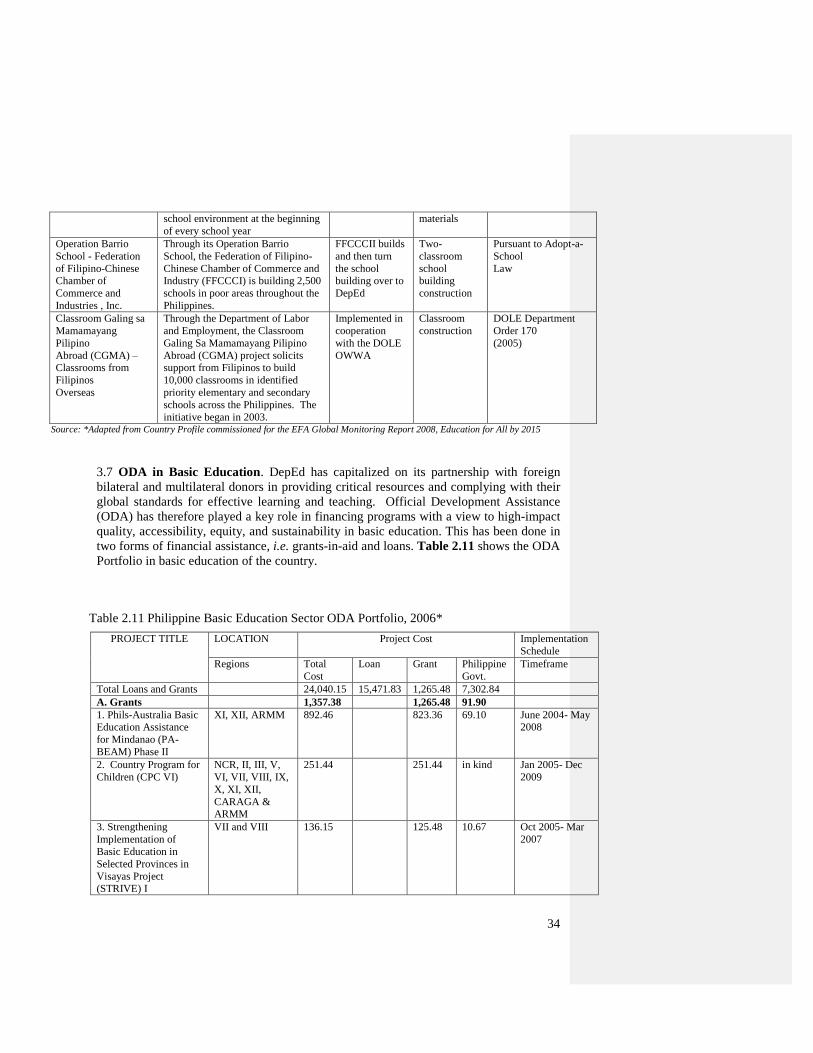
34
school environment at the beginning
of every school year
materials
Operation Barrio
School - Federation
of Filipino-Chinese
Chamber of
Commerce and
Industries , Inc.
Through its Operation Barrio
School, the Federation of Filipino-
Chinese Chamber of Commerce and
Industry (FFCCCI) is building 2,500
schools in poor areas throughout the
Philippines.
FFCCCII builds
and then turn
the school
building over to
DepEd
Two-
classroom
school
building
construction
Pursuant to Adopt-a-
School
Law
Classroom Galing sa
Mamamayang
Pilipino
Abroad (CGMA) –
Classrooms from
Filipinos
Overseas
Through the Department of Labor
and Employment, the Classroom
Galing Sa Mamamayang Pilipino
Abroad (CGMA) project solicits
support from Filipinos to build
10,000 classrooms in identified
priority elementary and secondary
schools across the Philippines. The
initiative began in 2003.
Implemented in
cooperation
with the DOLE
OWWA
Classroom
construction
DOLE Department
Order 170
(2005)
Source: *Adapted from Country Profile commissioned for the EFA Global Monitoring Report 2008, Education for All by 2015
3.7 ODA in Basic Education. DepEd has capitalized on its partnership with foreign
bilateral and multilateral donors in providing critical resources and complying with their
global standards for effective learning and teaching. Official Development Assistance
(ODA) has therefore played a key role in financing programs with a view to high-impact
quality, accessibility, equity, and sustainability in basic education. This has been done in
two forms of financial assistance, i.e. grants-in-aid and loans. Table 2.11 shows the ODA
Portfolio in basic education of the country.
Table 2.11 Philippine Basic Education Sector ODA Portfolio, 2006*
PROJECT TITLE LOCATION Project Cost Implementation
Schedule
Regions Total
Cost
Loan Grant Philippine
Govt.
Timeframe
Total Loans and Grants 24,040.15 15,471.83 1,265.48 7,302.84
A. Grants 1,357.38 1,265.48 91.90
1. Phils-Australia Basic
Education Assistance
for Mindanao (PA-
BEAM) Phase II
XI, XII, ARMM 892.46 823.36 69.10 June 2004- May
2008
2. Country Program for
Children (CPC VI)
NCR, II, III, V,
VI, VII, VIII, IX,
X, XI, XII,
CARAGA &
ARMM
251.44 251.44 in kind Jan 2005- Dec
2009
3. Strengthening
Implementation of
Basic Education in
Selected Provinces in
Visayas Project
(STRIVE) I
VII and VIII 136.15 125.48 10.67
Oct 2005- Mar
2007
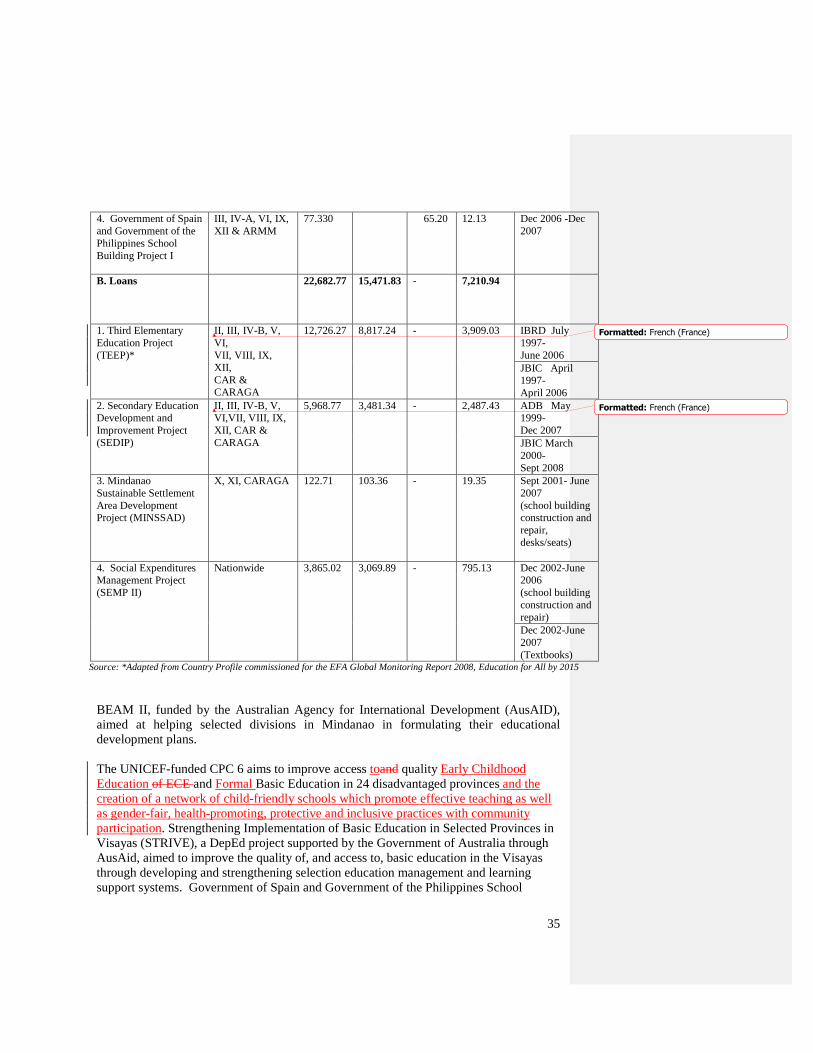
35
4. Government of Spain
and Government of the
Philippines School
Building Project I
III, IV-A, VI, IX,
XII & ARMM
77.330 65.20 12.13 Dec 2006 -Dec
2007
B. Loans 22,682.77 15,471.83 - 7,210.94
1. Third Elementary
Education Project
(TEEP)*
II, III, IV-B, V,
VI,
VII, VIII, IX,
XII,
CAR &
CARAGA
12,726.27 8,817.24
- 3,909.03
IBRD July
1997-
June 2006
JBIC April
1997-
April 2006
2. Secondary Education
Development and
Improvement Project
(SEDIP)
II, III, IV-B, V,
VI,VII, VIII, IX,
XII, CAR &
CARAGA
5,968.77 3,481.34
- 2,487.43
ADB May
1999-
Dec 2007
JBIC March
2000-
Sept 2008
3. Mindanao
Sustainable Settlement
Area Development
Project (MINSSAD)
X, XI, CARAGA 122.71 103.36 - 19.35
Sept 2001- June
2007
(school building
construction and
repair,
desks/seats)
4. Social Expenditures
Management Project
(SEMP II)
Nationwide 3,865.02 3,069.89
- 795.13
Dec 2002-June
2006
(school building
construction and
repair)
Dec 2002-June
2007
(Textbooks) Source: *Adapted from Country Profile commissioned for the EFA Global Monitoring Report 2008, Education for All by 2015
BEAM II, funded by the Australian Agency for International Development (AusAID),
aimed at helping selected divisions in Mindanao in formulating their educational
development plans.
The UNICEF-funded CPC 6 aims to improve access toand quality Early Childhood
Education of ECE and Formal Basic Education in 24 disadvantaged provinces and the
creation of a network of child-friendly schools which promote effective teaching as well
as gender-fair, health-promoting, protective and inclusive practices with community
participation. Strengthening Implementation of Basic Education in Selected Provinces in
Visayas (STRIVE), a DepEd project supported by the Government of Australia through
AusAid, aimed to improve the quality of, and access to, basic education in the Visayas
through developing and strengthening selection education management and learning
support systems. Government of Spain and Government of the Philippines School
Formatted: French (France)
Formatted: French (France)
36
Building Project 1, a joint project by DepEd and the Spanish Government, was intended
to build classrooms in certain areas in the Philippines and improve teaching strategies and
strengthen management capabilities of teachers and school managers as a way to attain
quality education for Filipino school children.
Mindanao Sustainable Settlement Area Development Project (MINSSAD), under JBIC
assistance implemented in selected provinces in Mindanao, was implemented by the
Department of Agriculture with DepEd providing supervision and technical assistance on
the education component of the program. Third Elementary Education Project, funded by
the World Bank and Japan Bank for International Cooperation (JBIC), was instrumental
for the piloting of SBM and its eventual inclusion as both a principle of education
governance and policy initiative in RA 9155. Secondary Education Development and
Improvement Project (SEDIP I & II), funded by Asian Development Bank (ADB) and
JBIC, adapts TEEP in secondary education, and hence, another initiative in decentralized
governance in education. Social Expenditures Management Project (SEMP II), financed
by the World Bank and implemented by DepEd, DOH, DSWD, and DPWH, aimed to
provide for quality inputs to social services such as education, health and social welfare,
as well as enhance performance and governance quality through systems improvement
and reforms such as in procurement, financial management and information technology
reforms. Most of these ODA programs have been extended beyond the first phase.
4. Trends and Challenges
Policy Gaps in Basic Education Governance
4.1. Sustainability of Performance Gains. On a positive note, owing to the
government‘s policy actions, there has been a modicum of progress in some education
outcomes (Tables 2.12 and 2.13), albeit far from achieving goal 2 of the MDGs, i.e.
achieve universal primary education in light of the targets on net enrollment rate (NER)
or participation rate, cohort survival rate, and completion rate. It is noteworthy that for
both elementary and secondary education, participation rates, cohort survival rates
(CSR), completion rates, school leavers rates improved in SY2007-2008, drop rates
declined, and total enrolments improved. Sustaining such performance gains will help
achieve the MTPDP targets, EFA Goals, and MDGs. For example, participation rate in
elementary education, though may have improved in SY 2007-2008, has yet to regain its
highest rate of 89% in SY2003-2004. Moreover, the declining rates on gross enrolment
ratio (GER) since 2006 for both elementary and secondary levels need to be addressed.15
15
While there is no dearth of conventional data that could explain the declining trend in gross enrolment
rates (i.e., increase in the number of barangays without elementary schools, dilapidated school facilities,
etc), Albert and Maligalig (2008) offers an alternative view insofar as explaining decreasing school
attendance is concerned. Based on the results of the 2002 and 2004 APIS, 29% of children in the
elementary age group (6-11 years old) have no personal interest to attend school. The study cited a number
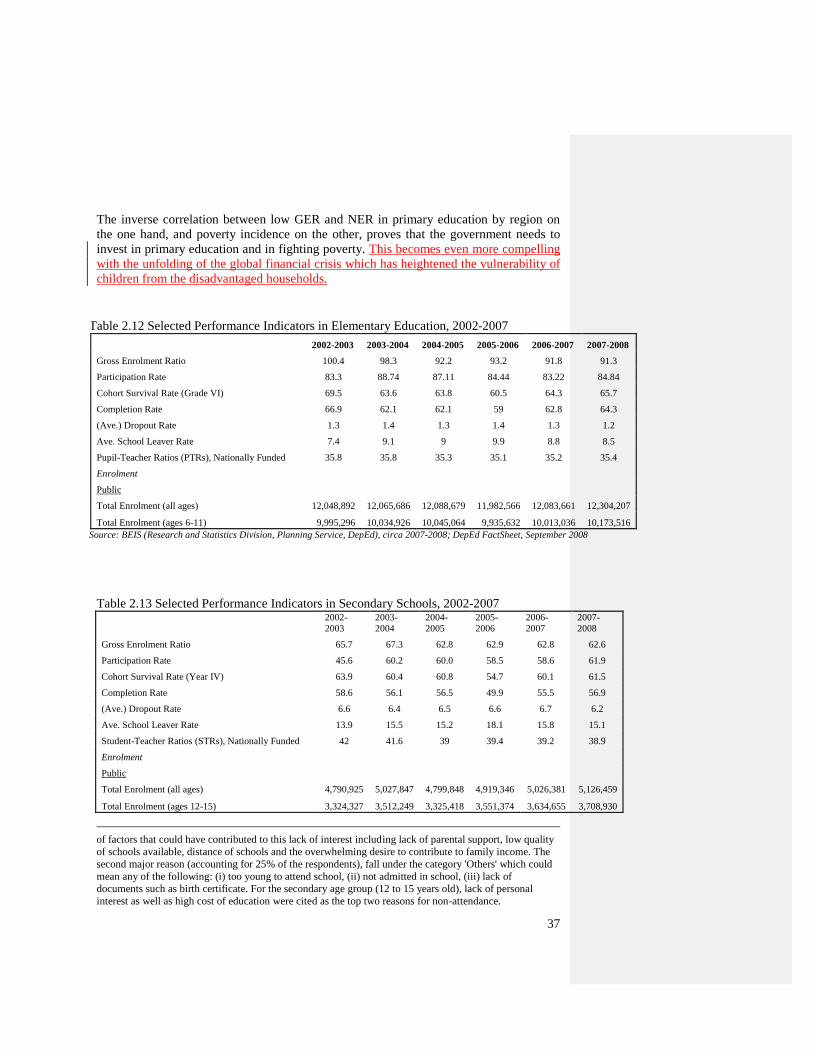
37
The inverse correlation between low GER and NER in primary education by region on
the one hand, and poverty incidence on the other, proves that the government needs to
invest in primary education and in fighting poverty. This becomes even more compelling
with the unfolding of the global financial crisis which has heightened the vulnerability of
children from the disadvantaged households.
Table 2.12 Selected Performance Indicators in Elementary Education, 2002-2007
2002-2003 2003-2004 2004-2005 2005-2006 2006-2007 2007-2008
Gross Enrolment Ratio 100.4 98.3 92.2 93.2 91.8 91.3
Participation Rate 83.3 88.74 87.11 84.44 83.22 84.84
Cohort Survival Rate (Grade VI) 69.5 63.6 63.8 60.5 64.3 65.7
Completion Rate 66.9 62.1 62.1 59 62.8 64.3
(Ave.) Dropout Rate 1.3 1.4 1.3 1.4 1.3 1.2
Ave. School Leaver Rate 7.4 9.1 9 9.9 8.8 8.5
Pupil-Teacher Ratios (PTRs), Nationally Funded 35.8 35.8 35.3 35.1 35.2 35.4
Enrolment
Public
Total Enrolment (all ages) 12,048,892 12,065,686 12,088,679 11,982,566 12,083,661 12,304,207
Total Enrolment (ages 6-11) 9,995,296 10,034,926 10,045,064 9,935,632 10,013,036 10,173,516
Source: BEIS (Research and Statistics Division, Planning Service, DepEd), circa 2007-2008; DepEd FactSheet, September 2008
Table 2.13 Selected Performance Indicators in Secondary Schools, 2002-2007
2002-
2003
2003-
2004
2004-
2005
2005-
2006
2006-
2007
2007-
2008
Gross Enrolment Ratio 65.7 67.3 62.8 62.9 62.8 62.6
Participation Rate 45.6 60.2 60.0 58.5 58.6 61.9
Cohort Survival Rate (Year IV) 63.9 60.4 60.8 54.7 60.1 61.5
Completion Rate 58.6 56.1 56.5 49.9 55.5 56.9
(Ave.) Dropout Rate 6.6 6.4 6.5 6.6 6.7 6.2
Ave. School Leaver Rate 13.9 15.5 15.2 18.1 15.8 15.1
Student-Teacher Ratios (STRs), Nationally Funded 42 41.6 39 39.4 39.2 38.9
Enrolment
Public
Total Enrolment (all ages) 4,790,925 5,027,847 4,799,848 4,919,346 5,026,381 5,126,459
Total Enrolment (ages 12-15) 3,324,327 3,512,249 3,325,418 3,551,374 3,634,655 3,708,930
of factors that could have contributed to this lack of interest including lack of parental support, low quality
of schools available, distance of schools and the overwhelming desire to contribute to family income. The
second major reason (accounting for 25% of the respondents), fall under the category 'Others' which could
mean any of the following: (i) too young to attend school, (ii) not admitted in school, (iii) lack of
documents such as birth certificate. For the secondary age group (12 to 15 years old), lack of personal
interest as well as high cost of education were cited as the top two reasons for non-attendance.
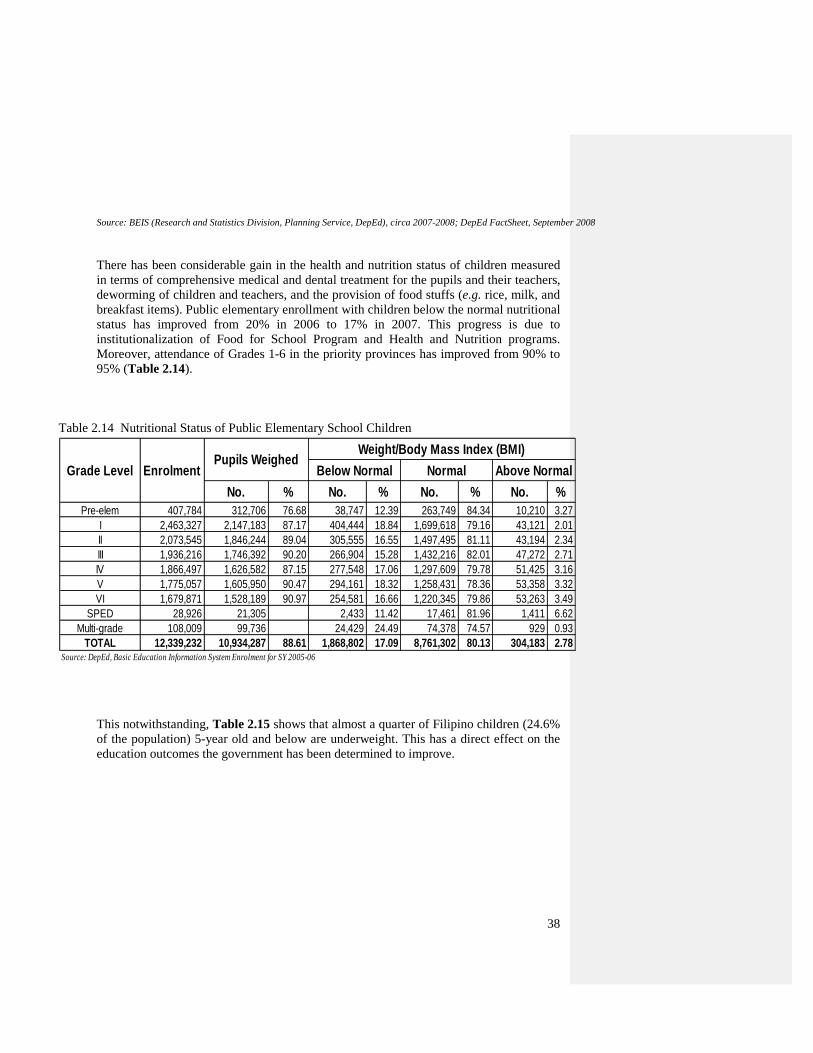
38
Source: BEIS (Research and Statistics Division, Planning Service, DepEd), circa 2007-2008; DepEd FactSheet, September 2008
There has been considerable gain in the health and nutrition status of children measured
in terms of comprehensive medical and dental treatment for the pupils and their teachers,
deworming of children and teachers, and the provision of food stuffs (e.g. rice, milk, and
breakfast items). Public elementary enrollment with children below the normal nutritional
status has improved from 20% in 2006 to 17% in 2007. This progress is due to
institutionalization of Food for School Program and Health and Nutrition programs.
Moreover, attendance of Grades 1-6 in the priority provinces has improved from 90% to
95% (Table 2.14).
Table 2.14 Nutritional Status of Public Elementary School Children
This notwithstanding, Table 2.15 shows that almost a quarter of Filipino children (24.6%
of the population) 5-year old and below are underweight. This has a direct effect on the
education outcomes the government has been determined to improve.
No. % No. % No. % No. %
Pre-elem 407,784 312,706 76.68 38,747 12.39 263,749 84.34 10,210 3.27
I 2,463,327 2,147,183 87.17 404,444 18.84 1,699,618 79.16 43,121 2.01
II 2,073,545 1,846,244 89.04 305,555 16.55 1,497,495 81.11 43,194 2.34
III 1,936,216 1,746,392 90.20 266,904 15.28 1,432,216 82.01 47,272 2.71
IV 1,866,497 1,626,582 87.15 277,548 17.06 1,297,609 79.78 51,425 3.16
V 1,775,057 1,605,950 90.47 294,161 18.32 1,258,431 78.36 53,358 3.32
VI 1,679,871 1,528,189 90.97 254,581 16.66 1,220,345 79.86 53,263 3.49
SPED 28,926 21,305 2,433 11.42 17,461 81.96 1,411 6.62
Multi-grade 108,009 99,736 24,429 24.49 74,378 74.57 929 0.93
TOTAL 12,339,232 10,934,287 88.61 1,868,802 17.09 8,761,302 80.13 304,183 2.78Source: DepEd, Basic Education Information System Enrolment for SY 2005-06
Weight/Body Mass Index (BMI)
Below Normal Normal Above NormalGrade Level EnrolmentPupils Weighed
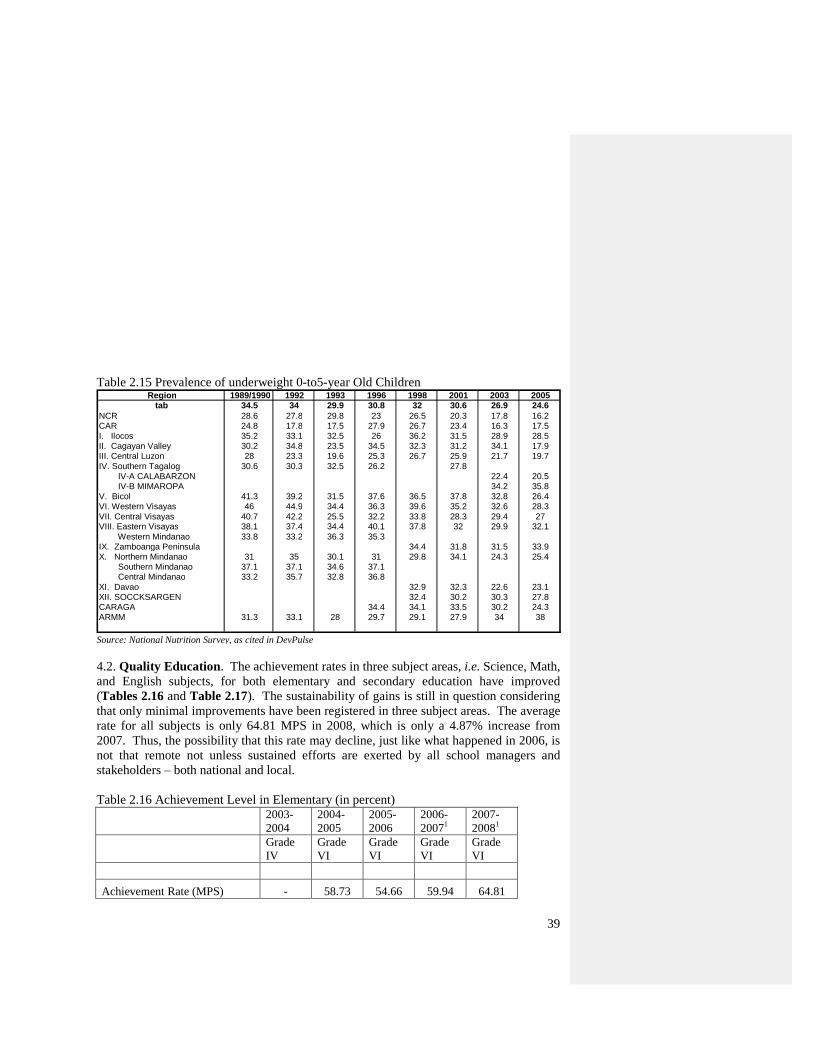
39
Table 2.15 Prevalence of underweight 0-to5-year Old Children
4.2. Quality Education. The achievement rates in three subject areas, i.e. Science, Math,
and English subjects, for both elementary and secondary education have improved
(Tables 2.16 and Table 2.17). The sustainability of gains is still in question considering
that only minimal improvements have been registered in three subject areas. The average
rate for all subjects is only 64.81 MPS in 2008, which is only a 4.87% increase from
2007. Thus, the possibility that this rate may decline, just like what happened in 2006, is
not that remote not unless sustained efforts are exerted by all school managers and
stakeholders – both national and local.
Table 2.16 Achievement Level in Elementary (in percent)
2003-
2004
2004-
2005
2005-
2006
2006-
20071
2007-
20081
Grade
IV
Grade
VI
Grade
VI
Grade
VI
Grade
VI
Achievement Rate (MPS) - 58.73 54.66 59.94 64.81
Region 1989/1990 1992 1993 1996 1998 2001 2003 2005 tab 34.5 34 29.9 30.8 32 30.6 26.9 24.6
NCR 28.6 27.8 29.8 23 26.5 20.3 17.8 16.2 CAR 24.8 17.8 17.5 27.9 26.7 23.4 16.3 17.5 I. Ilocos 35.2 33.1 32.5 26 36.2 31.5 28.9 28.5 II. Cagayan Valley 30.2 34.8 23.5 34.5 32.3 31.2 34.1 17.9 III. Central Luzon 28 23.3 19.6 25.3 26.7 25.9 21.7 19.7 IV. Southern Tagalog 30.6 30.3 32.5 26.2 27.8 IV-A CALABARZON 22.4 20.5 IV-B MIMAROPA 34.2 35.8 V. Bicol 41.3 39.2 31.5 37.6 36.5 37.8 32.8 26.4 VI. Western Visayas 46 44.9 34.4 36.3 39.6 35.2 32.6 28.3 VII. Central Visayas 40.7 42.2 25.5 32.2 33.8 28.3 29.4 27 VIII. Eastern Visayas 38.1 37.4 34.4 40.1 37.8 32 29.9 32.1 Western Mindanao 33.8 33.2 36.3 35.3 IX. Zamboanga Peninsula 34.4 31.8 31.5 33.9 X. Northern Mindanao 31 35 30.1 31 29.8 34.1 24.3 25.4 Southern Mindanao 37.1 37.1 34.6 37.1 Central Mindanao 33.2 35.7 32.8 36.8 XI. Davao 32.9 32.3 22.6 23.1 XII. SOCCKSARGEN 32.4 30.2 30.3 27.8 CARAGA 34.4 34.1 33.5 30.2 24.3 ARMM 31.3 33.1 28 29.7 29.1 27.9 34 38
Source: National Nutrition Survey, as cited in DevPulse
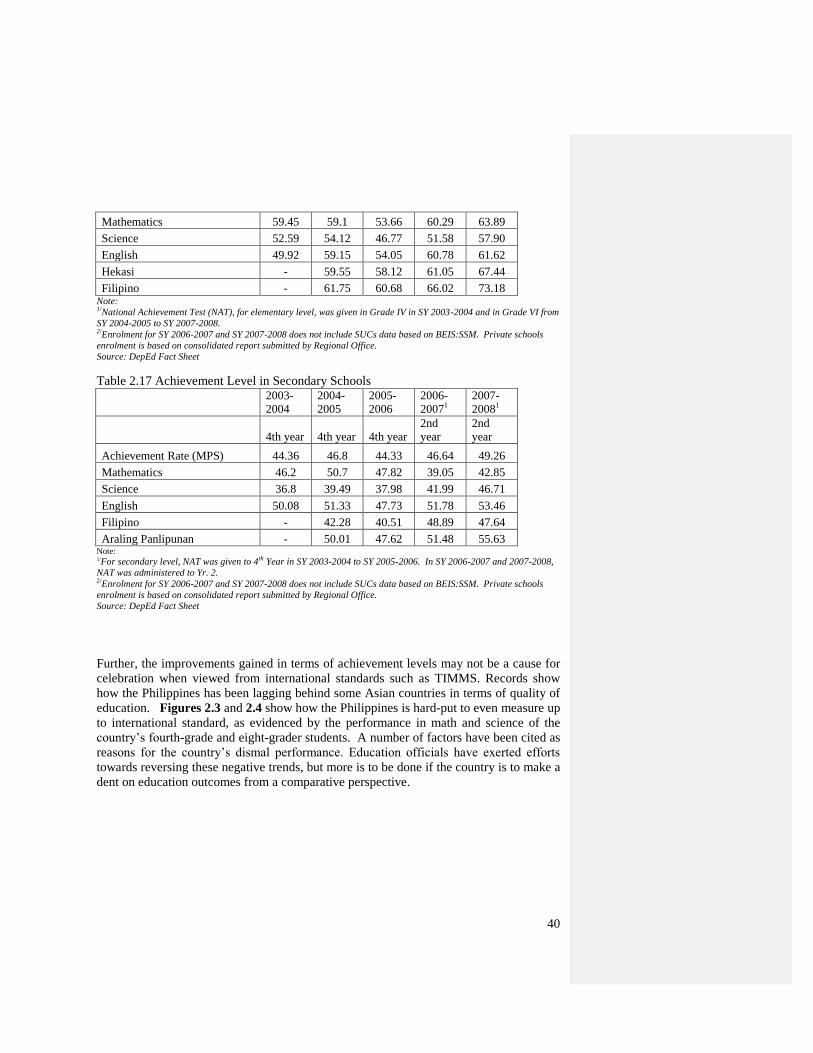
40
Mathematics 59.45 59.1 53.66 60.29 63.89
Science 52.59 54.12 46.77 51.58 57.90
English 49.92 59.15 54.05 60.78 61.62
Hekasi - 59.55 58.12 61.05 67.44
Filipino - 61.75 60.68 66.02 73.18 Note: 1/National Achievement Test (NAT), for elementary level, was given in Grade IV in SY 2003-2004 and in Grade VI from
SY 2004-2005 to SY 2007-2008. 2/Enrolment for SY 2006-2007 and SY 2007-2008 does not include SUCs data based on BEIS:SSM. Private schools
enrolment is based on consolidated report submitted by Regional Office.
Source: DepEd Fact Sheet
Table 2.17 Achievement Level in Secondary Schools
2003-
2004
2004-
2005
2005-
2006
2006-
20071
2007-
20081
4th year 4th year 4th year
2nd
year
2nd
year
Achievement Rate (MPS) 44.36 46.8 44.33 46.64 49.26
Mathematics 46.2 50.7 47.82 39.05 42.85
Science 36.8 39.49 37.98 41.99 46.71
English 50.08 51.33 47.73 51.78 53.46
Filipino - 42.28 40.51 48.89 47.64
Araling Panlipunan - 50.01 47.62 51.48 55.63 Note: 1/For secondary level, NAT was given to 4th Year in SY 2003-2004 to SY 2005-2006. In SY 2006-2007 and 2007-2008,
NAT was administered to Yr. 2.
2/Enrolment for SY 2006-2007 and SY 2007-2008 does not include SUCs data based on BEIS:SSM. Private schools
enrolment is based on consolidated report submitted by Regional Office.
Source: DepEd Fact Sheet
Further, the improvements gained in terms of achievement levels may not be a cause for
celebration when viewed from international standards such as TIMMS. Records show
how the Philippines has been lagging behind some Asian countries in terms of quality of
education. Figures 2.3 and 2.4 show how the Philippines is hard-put to even measure up
to international standard, as evidenced by the performance in math and science of the
country‘s fourth-grade and eight-grader students. A number of factors have been cited as
reasons for the country‘s dismal performance. Education officials have exerted efforts
towards reversing these negative trends, but more is to be done if the country is to make a
dent on education outcomes from a comparative perspective.
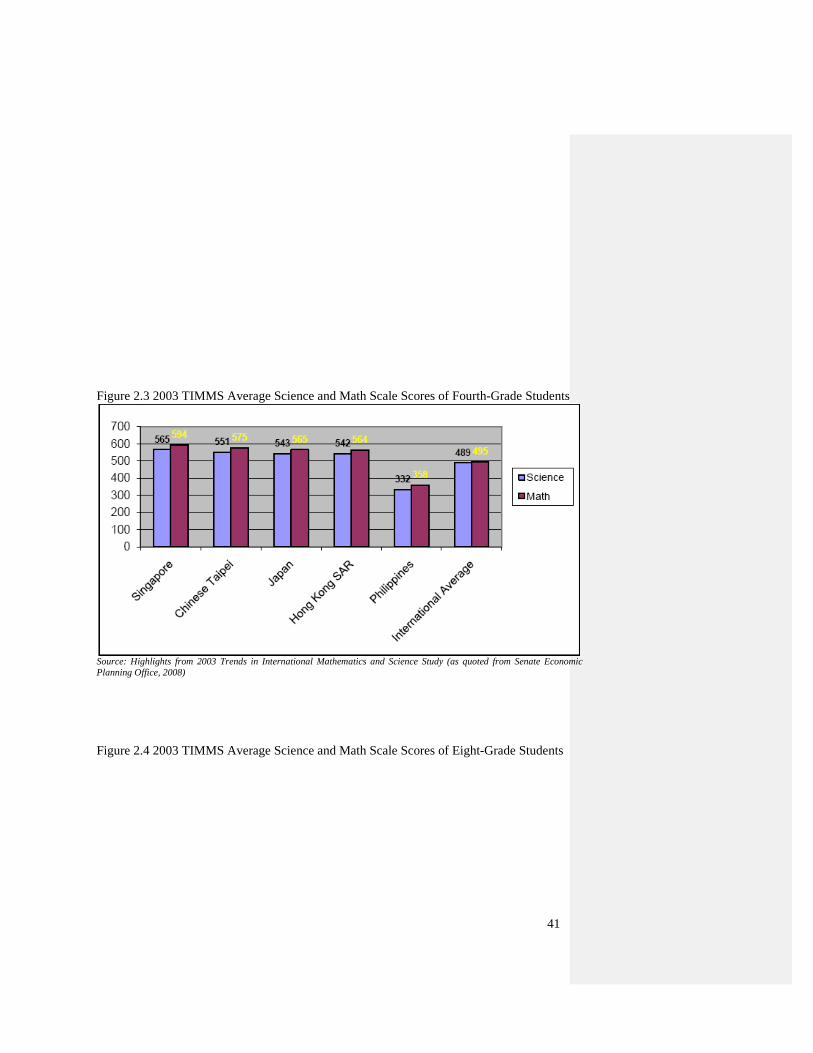
41
Figure 2.3 2003 TIMMS Average Science and Math Scale Scores of Fourth-Grade Students
Source: Highlights from 2003 Trends in International Mathematics and Science Study (as quoted from Senate Economic
Planning Office, 2008)
Figure 2.4 2003 TIMMS Average Science and Math Scale Scores of Eight-Grade Students
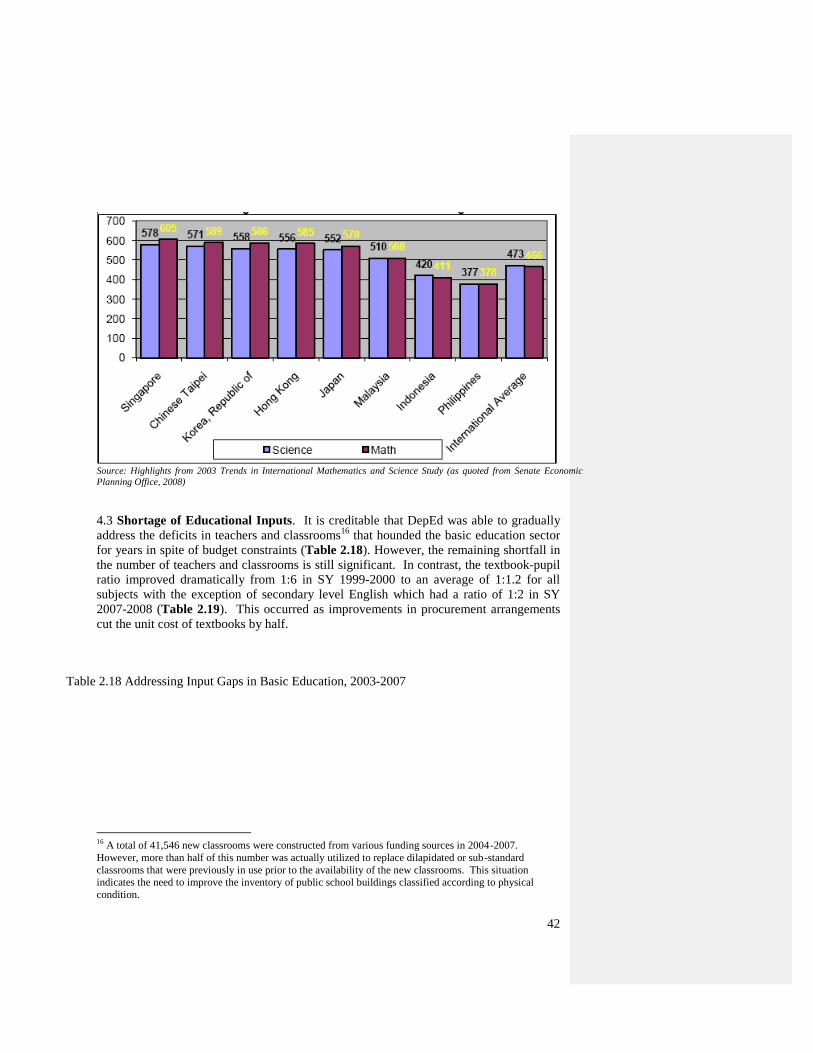
42
Source: Highlights from 2003 Trends in International Mathematics and Science Study (as quoted from Senate Economic
Planning Office, 2008)
4.3 Shortage of Educational Inputs. It is creditable that DepEd was able to gradually
address the deficits in teachers and classrooms16
that hounded the basic education sector
for years in spite of budget constraints (Table 2.18). However, the remaining shortfall in
the number of teachers and classrooms is still significant. In contrast, the textbook-pupil
ratio improved dramatically from 1:6 in SY 1999-2000 to an average of 1:1.2 for all
subjects with the exception of secondary level English which had a ratio of 1:2 in SY
2007-2008 (Table 2.19). This occurred as improvements in procurement arrangements
cut the unit cost of textbooks by half.
Table 2.18 Addressing Input Gaps in Basic Education, 2003-2007
16
A total of 41,546 new classrooms were constructed from various funding sources in 2004-2007.
However, more than half of this number was actually utilized to replace dilapidated or sub-standard
classrooms that were previously in use prior to the availability of the new classrooms. This situation
indicates the need to improve the inventory of public school buildings classified according to physical
condition.
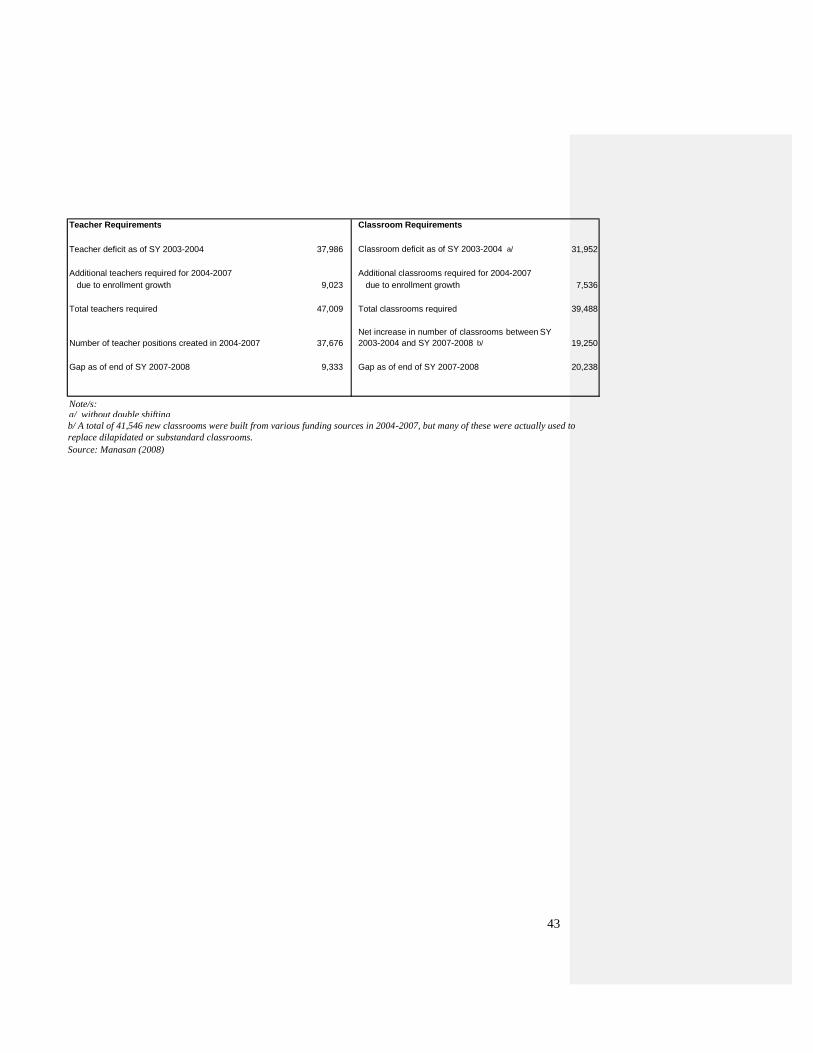
43
Teacher Requirements Classroom Requirements
Teacher deficit as of SY 2003-2004 37,986 Classroom deficit as of SY 2003-2004 a/ 31,952
Additional teachers required for 2004-2007 Additional classrooms required for 2004-2007 due to enrollment growth 9,023 due to enrollment growth 7,536
Total teachers required 47,009 Total classrooms required 39,488
Number of teacher positions created in 2004-2007 37,676 Net increase in number of classrooms between SY 2003-2004 and SY 2007-2008 b/ 19,250
Gap as of end of SY 2007-2008 9,333 Gap as of end of SY 2007-2008 20,238
a/ without double shifting
Source: Manasan (2008)
b/ A total of 41,546 new classrooms were built from various funding sources in 2004-2007, but many of these were actually used to
replace dilapidated or substandard classrooms.
Note/s:
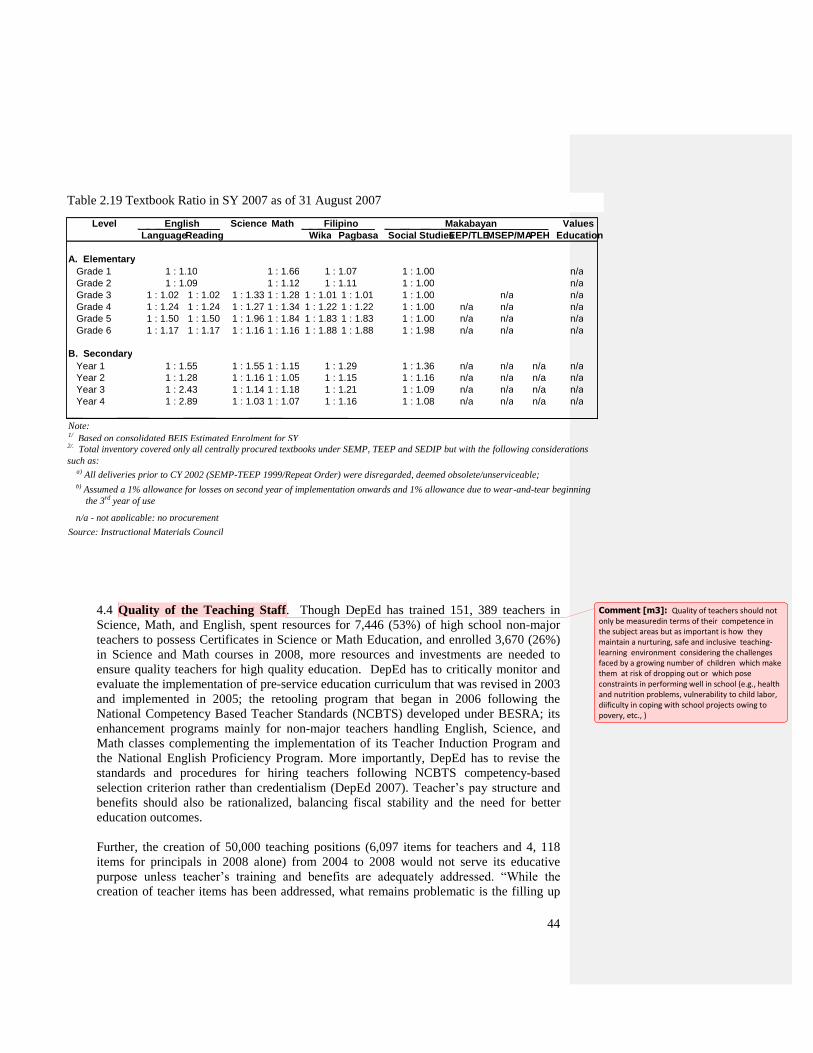
44
4.4 Quality of the Teaching Staff. Though DepEd has trained 151, 389 teachers in
Science, Math, and English, spent resources for 7,446 (53%) of high school non-major
teachers to possess Certificates in Science or Math Education, and enrolled 3,670 (26%)
in Science and Math courses in 2008, more resources and investments are needed to
ensure quality teachers for high quality education. DepEd has to critically monitor and
evaluate the implementation of pre-service education curriculum that was revised in 2003
and implemented in 2005; the retooling program that began in 2006 following the
National Competency Based Teacher Standards (NCBTS) developed under BESRA; its
enhancement programs mainly for non-major teachers handling English, Science, and
Math classes complementing the implementation of its Teacher Induction Program and
the National English Proficiency Program. More importantly, DepEd has to revise the
standards and procedures for hiring teachers following NCBTS competency-based
selection criterion rather than credentialism (DepEd 2007). Teacher‘s pay structure and
benefits should also be rationalized, balancing fiscal stability and the need for better
education outcomes.
Further, the creation of 50,000 teaching positions (6,097 items for teachers and 4, 118
items for principals in 2008 alone) from 2004 to 2008 would not serve its educative
purpose unless teacher‘s training and benefits are adequately addressed. ―While the
creation of teacher items has been addressed, what remains problematic is the filling up
Level English Science Math Filipino Makabayan Values Language Reading Wika Pagbasa Social Studies EEP/TLE MSEP/MA PEH Education
A. Elementary Grade 1 1 : 1.10 1 : 1.66 1 : 1.07 1 : 1.00 n/a Grade 2 1 : 1.09 1 : 1.12 1 : 1.11 1 : 1.00 n/a Grade 3 1 : 1.02 1 : 1.02 1 : 1.33 1 : 1.28 1 : 1.01 1 : 1.01 1 : 1.00 n/a n/a Grade 4 1 : 1.24 1 : 1.24 1 : 1.27 1 : 1.34 1 : 1.22 1 : 1.22 1 : 1.00 n/a n/a n/a Grade 5 1 : 1.50 1 : 1.50 1 : 1.96 1 : 1.84 1 : 1.83 1 : 1.83 1 : 1.00 n/a n/a n/a Grade 6 1 : 1.17 1 : 1.17 1 : 1.16 1 : 1.16 1 : 1.88 1 : 1.88 1 : 1.98 n/a n/a n/a
B. Secondary Year 1 1 : 1.55 1 : 1.55 1 : 1.15 1 : 1.29 1 : 1.36 n/a n/a n/a n/a Year 2 1 : 1.28 1 : 1.16 1 : 1.05 1 : 1.15 1 : 1.16 n/a n/a n/a n/a Year 3 1 : 2.43 1 : 1.14 1 : 1.18 1 : 1.21 1 : 1.09 n/a n/a n/a n/a Year 4 1 : 2.89 1 : 1.03 1 : 1.07 1 : 1.16 1 : 1.08 n/a n/a n/a n/a
Note: 1/ Based on consolidated BEIS Estimated Enrolment for SY
2007-2008. 2/. Total inventory covered only all centrally procured textbooks under SEMP, TEEP and SEDIP but with the following considerations
such as:
n/a - not applicable; no procurement
undertaken yet Source: Instructional Materials Council
Secretariat
Table 2.19 Textbook Ratio in SY 2007 as of 31 August 2007
a) All deliveries prior to CY 2002 (SEMP-TEEP 1999/Repeat Order) were disregarded, deemed obsolete/unserviceable;
b) Assumed a 1% allowance for losses on second year of implementation onwards and 1% allowance due to wear-and-tear beginning
the 3rd year of use
Comment [m3]: Quality of teachers should not only be measuredin terms of their competence in the subject areas but as important is how they maintain a nurturing, safe and inclusive teaching-learning environment considering the challenges faced by a growing number of children which make them at risk of dropping out or which pose constraints in performing well in school (e.g., health and nutrition problems, vulnerability to child labor, diificulty in coping with school projects owing to povery, etc., )
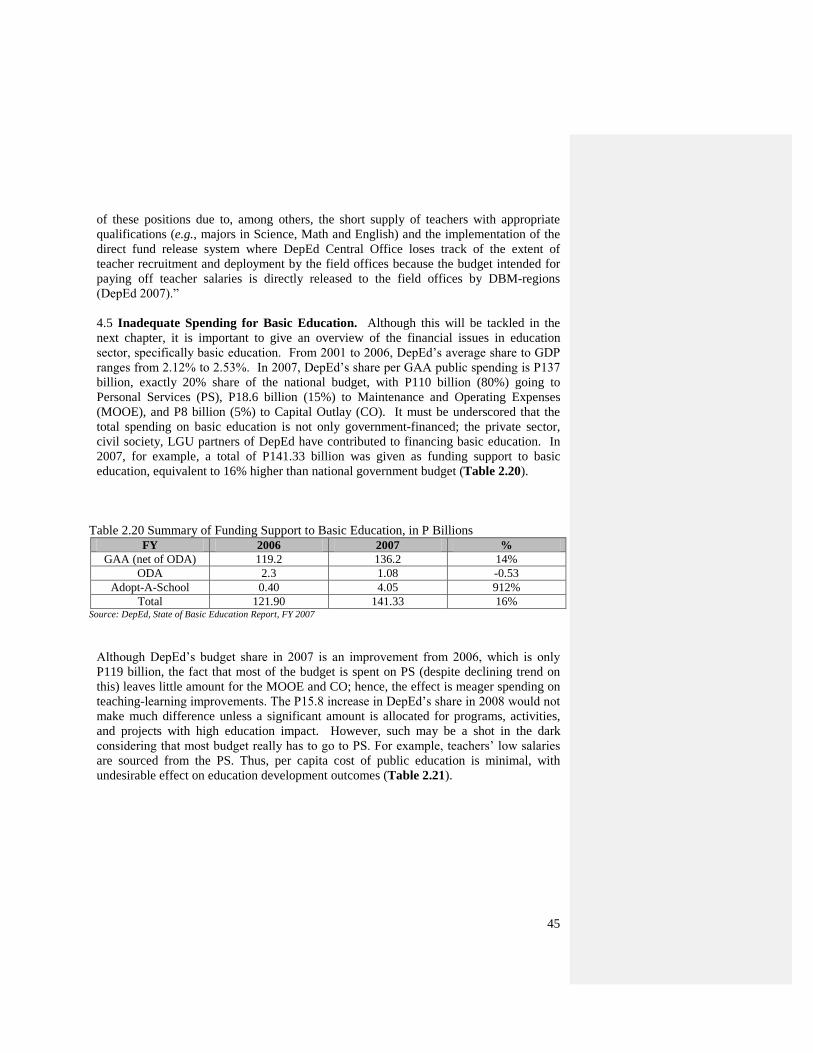
45
of these positions due to, among others, the short supply of teachers with appropriate
qualifications (e.g., majors in Science, Math and English) and the implementation of the
direct fund release system where DepEd Central Office loses track of the extent of
teacher recruitment and deployment by the field offices because the budget intended for
paying off teacher salaries is directly released to the field offices by DBM-regions
(DepEd 2007).‖
4.5 Inadequate Spending for Basic Education. Although this will be tackled in the
next chapter, it is important to give an overview of the financial issues in education
sector, specifically basic education. From 2001 to 2006, DepEd‘s average share to GDP
ranges from 2.12% to 2.53%. In 2007, DepEd‘s share per GAA public spending is P137
billion, exactly 20% share of the national budget, with P110 billion (80%) going to
Personal Services (PS), P18.6 billion (15%) to Maintenance and Operating Expenses
(MOOE), and P8 billion (5%) to Capital Outlay (CO). It must be underscored that the
total spending on basic education is not only government-financed; the private sector,
civil society, LGU partners of DepEd have contributed to financing basic education. In
2007, for example, a total of P141.33 billion was given as funding support to basic
education, equivalent to 16% higher than national government budget (Table 2.20).
Table 2.20 Summary of Funding Support to Basic Education, in P Billions
FY 2006 2007 %
GAA (net of ODA) 119.2 136.2 14%
ODA 2.3 1.08 -0.53
Adopt-A-School 0.40 4.05 912%
Total 121.90 141.33 16% Source: DepEd, State of Basic Education Report, FY 2007
Although DepEd‘s budget share in 2007 is an improvement from 2006, which is only
P119 billion, the fact that most of the budget is spent on PS (despite declining trend on
this) leaves little amount for the MOOE and CO; hence, the effect is meager spending on
teaching-learning improvements. The P15.8 increase in DepEd‘s share in 2008 would not
make much difference unless a significant amount is allocated for programs, activities,
and projects with high education impact. However, such may be a shot in the dark
considering that most budget really has to go to PS. For example, teachers‘ low salaries
are sourced from the PS. Thus, per capita cost of public education is minimal, with
undesirable effect on education development outcomes (Table 2.21).
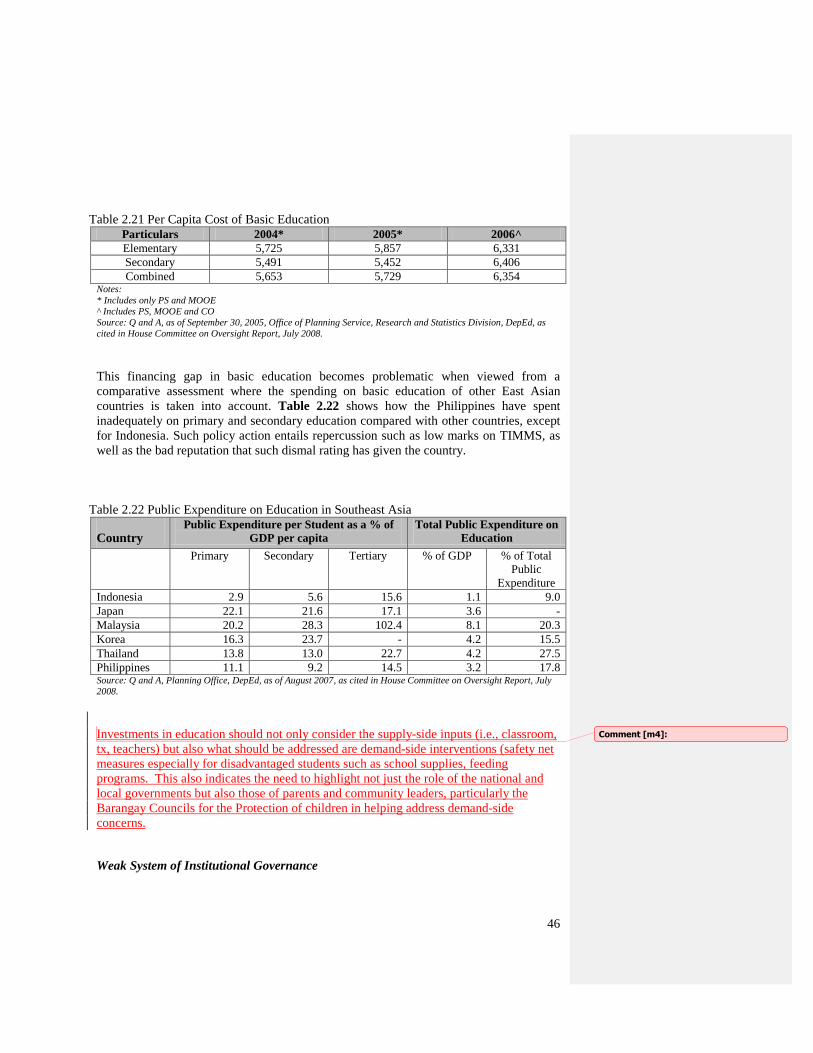
46
Table 2.21 Per Capita Cost of Basic Education
Particulars 2004* 2005* 2006^
Elementary 5,725 5,857 6,331
Secondary 5,491 5,452 6,406
Combined 5,653 5,729 6,354 Notes:
* Includes only PS and MOOE
^ Includes PS, MOOE and CO
Source: Q and A, as of September 30, 2005, Office of Planning Service, Research and Statistics Division, DepEd, as
cited in House Committee on Oversight Report, July 2008.
This financing gap in basic education becomes problematic when viewed from a
comparative assessment where the spending on basic education of other East Asian
countries is taken into account. Table 2.22 shows how the Philippines have spent
inadequately on primary and secondary education compared with other countries, except
for Indonesia. Such policy action entails repercussion such as low marks on TIMMS, as
well as the bad reputation that such dismal rating has given the country.
Table 2.22 Public Expenditure on Education in Southeast Asia
Country Public Expenditure per Student as a % of
GDP per capita
Total Public Expenditure on
Education
Primary Secondary Tertiary % of GDP % of Total
Public
Expenditure
Indonesia 2.9 5.6 15.6 1.1 9.0
Japan 22.1 21.6 17.1 3.6 -
Malaysia 20.2 28.3 102.4 8.1 20.3
Korea 16.3 23.7 - 4.2 15.5
Thailand 13.8 13.0 22.7 4.2 27.5
Philippines 11.1 9.2 14.5 3.2 17.8 Source: Q and A, Planning Office, DepEd, as of August 2007, as cited in House Committee on Oversight Report, July
2008.
Investments in education should not only consider the supply-side inputs (i.e., classroom,
tx, teachers) but also what should be addressed are demand-side interventions (safety net
measures especially for disadvantaged students such as school supplies, feeding
programs. This also indicates the need to highlight not just the role of the national and
local governments but also those of parents and community leaders, particularly the
Barangay Councils for the Protection of children in helping address demand-side
concerns.
Weak System of Institutional Governance
Comment [m4]:
47
4.6 Slow Implementation of RA 9155, Philippine EFA 2015, and BESRA. The weak
system of institutional governance in the country has greatly affected the performance of
its basic education sector. RA 9155, together with Philippine EFA 2015, and BESRA,
was meant to address such institutional deficit. However, with the slow implementation
of the law, plans, and strategies, the delivery of education services has been hampered;
thus, the debilitating effects on much-needed competitive education outcomes. While
RA 9155 was enacted in 2001, BESRA was only implemented in 2006. The country took
five years to formulate its Philippine National Action Plan for EFA 2015 (Philippine EFA
2015) when it was approved and adopted only in February 2006.
4.7 Strengthening School-Based Management. Although RA 9155 has paved the way
for decentralizing education sector, at least in its deconcentration sense, empowering
divisions and schools in the process, decision-making remains largely centralized with
DepEd central at the helm. One issue is that DepEd has yet to fully adopt itself to a
decentralized set-up and just supervise, administer, monitor, and evaluate the assumption
of its traditional powers and functions by the field offices. It must adjust to its new
functions of policy formulation, setting strategic direction, establishing national standards
and outcomes specification. Corollary to this is the issue of unclear assignment of duties
and functions which makes it difficult to assign accountability to different levels of the
organizational structures of basic education. Also, the limited, if not lack of, technical,
managerial, institutional capacities of the existing structures and agencies such as
regions, divisions and schools of DepEd, hamper their abilities to better deliver in a
decentralized arrangement (World Bank 2006: 34).
Moreover, field offices do not have sufficient decision-making authority and control.
Though school divisions have the power and responsibilities in education sector planning
and delivery, in practice this does not happen. School divisions are mere implementers of
the decisions from DepEd. In fact, it only receives directions from the regional offices
and information from the school districts that it transmits to the regional and DepEd
central. Due to limited travel funds, supervisory support of division superintendents to
districts is also restricted. And the policy and plans that they usually implement are not
adapted to local needs and conditions. Improving delivery of education service through
strengthening the decentralized role of schools divisions would have to include the
following:
Development of education plans for the division, including school wide
allocation of resources according to local needs (based on transparent
criteria) within the allocations from DepEd, the regional development
councils (RDCs) and the provincial school boards.
Monitoring implementation of division education plans according to
agreed performance indicators.
Procurement of equipment, materials and supplies for the division office
and authorization to schools to select and procure textbooks and school
supplies
Encouraging schools to undertake innovative projects based on relevance
to school division needs.
48
Determining staff requirements, appointment and deployment (Macasaet
2002: 309).
Like school divisions, the regional offices should also adapt to their new functions. Other
than implementing education policy and plans from DepEd central and overseeing the
enforcement of standards and quality assurance among divisions, while the schools
divisions focus on resources, authority and information management, they can perform
the following other functions:
Advise DepEd to be aware of specific education needs of the region and
formulate policies accordingly (e.g. recognition of education needs of
tribal children or children with physical disabilities).
Mobilize funds from the RDCs and NGOs and allocate to the divisions.
Establish a technical resource group to work on learning materials
development specific to the region.
Monitor and evaluate programs in the divisions (Macasaet 2002: 309).
There has been an issue with regard to the role and functions of district supervisors. For
one, principals or head teachers perform more than 50 percent of their functions. Further,
just like the division superintendent, their supervisory support to schools is restricted by
limited travel funds and geographical hindrances. In order to address these and other
issues, and further strengthen the role and functions of district supervisors, amendments
to RA 9155 are being proposed in Congress. One of the proposed amendments is
embodied in House Bill 3505. The bill seeks to provide district supervisor with
administrative and supervisory line functions as a head of a separate unit or level in the
organizational structure of DepEd for effective delivery of education services. Also, the
bill finds fault in the Implementing Rules and Regulations (IRR) of RA 9155 that
removes the original functions of a district supervisor – i.e. educational leader, organizer,
and administrator – that were provided in the law. Dr. Reynaldo Sagum, President of the
Public Schools District Supervisors, has pointed out the inconsistency of the law by citing
the specific provision of the IRR which states that: ―The school district supervisor shall
primarily perform staff functions and shall not exercise administrative supervision over
school principals, unless specifically authorized by proper authorities. The main focus of
his/her functions shall be instructional and curricula supervision aimed at raising the
academic standards at the school level.‖ The bill is presently under consideration by the
Committee on Basic Education and Culture.
With regard to the role and functions of the principal, RA 9155 aims for principal
empowerment, that is, empowering principals to assume a more active role in school
management and delivery of quality education services. In practice, the principals are not
as empowered as mandated by law. For one, the principal has no decision-making power
and authority over allocations for basic education from the central government budget.
Second, the fact that elementary school principals do not get cash advances from the
division offices and are only provided with assistance in kind such as school supplies and
the like makes their instructional leadership and financial management responsibilities
suffer as a result. They cannot raise their own funds, access discretionary resources, or
49
have maintenance expenses that they can manage in accordance to their school needs and
local situations. Third, the detailed specification of the proposed expenditure items for
education as required by Congress leaves little or no room for DepEd or school principals
to change or redirect spending within the budget. Though Congress justifies this as
limiting the opportunities for corruption, it also gives the impression that congresspersons
micromanage the budget allocations of the schools and municipalities within their
political jurisdictions; thus, the role of politics in the basic education governance. The
adverse effect is the inability of principals to manage resources according to changing
requirements of their schools.
It must be underscored that principal empowerment does not only mean attaining a
1school-1 principal ratio, albeit such goal is worthy to attain. It has to do more with
building capacities and capabilities of school principals so that they can effectively and
efficiently perform their duties and functions in improving the quality of graduates within
the framework of transparency and accountability of decentralized governance. As a way
to address this capacity development deficit, DepEd has made the capacity building of
school heads as a priority focus of BESRA through SBM frameworks and standards.
4.8 Tension between the central and local authorities or field offices. The tension
between DepEd and the LGUs in determining education outcomes and priorities has
become an institutional issue. The limited powers, duties, and functions of LGUs, since
education is not yet a devolved sector, enables DepEd to gain the upperhand in most
decision-making. However, the limited powers and functions of LGUs should not make
them incapacitated. Drawing from other provisions of the 1991 LGC, LGUs can
contribute to better local service delivery of basic education by doing the following:
a) To increase investment and allocate more resources to support the provision of
quality education;
b) To mobilize other LGU resources through closer coordination with Sangguniang
Bayan, Sangguniang Kabataan and Sangguniang Barangay;
c) To reinvent and strengthen the Local School Boards into functional bodies that
will catalyze the community into working together to improve the learning
performance of students;
d) To create a strong constituency for education by building stakeholdership and
community participation in improving the quality of basic education in every
locality; and
e) To pass or promulgate ordinances that will institutionalize reform processes in
improving the governance of education (EQR Updates 2008: 15).
Equally important to consider is the internal tension between DepEd and the field offices
as a result of the changing roles of these institutional actors. For example, the
decentralized education governance has increased the Division‘s powers and functions
while diminishing those of the regional and district levels. With regard to BESRA‘s
KRT5 on Institutional Cultural Change, cultural change between and amongst regions,
divisions, districts, and schools has yet to keep pace with their changing roles towards
greater responsiveness to reforms thrusts on basic education. This cultural change entails
Comment [m5]: Agree. In particular, there is a need to strengthen the relationship between the school and the Barangay Council for the Protection of Children (e.g., in enforcing the Anti-Truancy law at the community level)
Comment [m6]: In addition, the role of the DepED Central Office, particularly the Bureaus of Elementary and Secondary Education needs to shift from piloting of projects to that of sector management and scaling up of tested pilot innovations and reforms, in the context of BESRA.
50
improvement in operation capacity of DepEd and its field offices which, in turn, requires
modernization of their staff and facilities and increasing the transparency, accountability,
and integrity of its units within the context of newly rationalized structure and operations.
4.9 Strengthening of Local School Boards and School Governing Councils. The
reinvention and strengthening of LSBs should be underscored. The sad reality in the
Philippines is that the dysfunction or ineffectiveness of most LSBs does not help in
creating a broad-based stakeholdership and democratic representation in the delivery of
basic education services in every locality. As Mayor Jesse Robredo of Naga City puts it:
―On paper, the LSB seems well represented; but in reality most of them are not
functioning well. Decision making has been confined to this eight-person board where
most often, ‗educational priorities‘ are being defined by its two most powerful members:
the local chief executive and the division superintendent. Because of its limited
involvement, the LSB budget is used mostly for discrete and disparate activities,
particularly infrastructure (where the possibility of corruption is strong) and regular
sports events (Robredo, no date).‖ The key findings and recommendations of Mayor
Robredo on reinventing LSB are a good source of best practices to make LSBs worth the
money allocated to them. One key factor is to empower LSB by giving it more power in,
for example, redirection of DepEd budget and the hiring, firing, and deployment of
teachers. As the coordinator for the education sector between the central and local
government, it may well function well if it is given authority to influence how budgets
are allocated across schools and across expenditure items.
Complementing LSBs should be School Governing Councils, composed of school
principals, teachers, local communities, parents, and students. It remains to be seen
whether these School Governing Councils can deliver on their mandate to improve
service delivery, especially on the ―quality and quantity of educational inputs, and the
efficiency with which these inputs are used (King 1999: 29).‖
51
CHAPTER 3
Policy and Institutional Analysis: Maternal and
Child Health
1. Policy and Legislative Framework
1.1 1987 Philippine Constitution. The Philippine government recognizes the
importance of health17
both to personal well-being and national development. Though
not directly specifying the state duty on maternal and child health as one of the MDGs,
the 1987 Philippine Constitution clearly mandates the government to promote it by
fulfilling its mandate on the health of the people in general. As the declaration of
principles and state policies, Section 15 of Article II expresses this state‘s duty: ―The
state shall protect and promote the right to health of the people and instill health
consciousness among them.‖ In the fulfillment of this duty, Sections 11 and 12 of Article
XIII, specify what the state has to do, viz:
SEC 11. The State shall adopt an integrated and comprehensive approach
to health development which shall endeavor to make essential goods, health and
other social services available to all the people at affordable cost. There shall be
priority for the needs of the underprivileged sick, elderly, disabled, women, and
children. The state shall endeavor to provide free medical care to paupers.
SEC 12. The State shall establish and maintain an effective food and drug
regulatory system and undertake appropriate health manpower development and
research, responsive to the country‘s health needs and problems.
1.2 1991 Local Government Code. With the passage of the 1991 LGC, health was
devolved to the LGUs. Corresponding to the new powers and functions of the different
structures of the health sector are the new responsibilities that each one should assume to
ensure quality healthcare for all. This assumption of new power, functions, and
responsibilities (which will be discussed later in the institutional analysis) entailed a
public sector institutional restructuring of the Department of Health as the main national
agency responsible for overseeing health delivery services, financing, regulation,
governance of the health sector; its line agencies from regional to barangay in carrying
17
It is only in the 1987 Philippine Constitution where health was enshrined as a fundamental right of all
Filipinos particularly the poor. In the 1973 Constitution, it was only included as part of the social services.
In the 1935 Constitution, there was no mention of it.
52
out policies and implementing them; and the LGUs (from provincial to barangay) in
being the frontline service providers of health services and implementers of health
policies and PAPs. The 1991 LGC mandates DOH to continue to ―formulate policies,
standards and regulations, as well as provide tertiary care in tertiary hospitals and special
hospitals, while the LGUs are responsible for the primary and secondary cases in the
hospitals and some of the general tertiary hospitals, which are provided by the provincial
hospitals (Gako 2007: 54).‖
Complementing the new functionality of the LGUs are the local health boards. These are
special bodies that exist in all levels of LGUs expect in the barangays. An LHB is
composed of the local chief executive (i.e. governor for the provincial health board, city
mayor for the city, and municipal mayor for the municipality) as chair, local health
officer (i.e. provincial / city / municipal health officer) as vice-chairperson, the committee
chair on health of every local legislative body (sangguniang panlalawigan, sangguniang
panlunsod, and sangguniang bayan), a representative from private sector or non-
government organizations involved in health services, and DOH representative
(provincial / city / municipality). The main function of the LHB is to formulate policies
on budget allocations and act as advisory committee for the sanggunian18
.
1.3 Maternal and Child Health-Related Laws and Issuances. National laws and
issuances support maternal and child health interventions and services in particular, as
well as public health affecting maternal and child health in general. Among these are:
rooming-in and breastfeeding (RA 7600), milk code (EO 51), increase in maternity
benefits for women workers (RA 7322), Magna Carta for Public Health Workers (RA
7305), benefits and incentives for barangay health workers (RA 7883), grant of paternity
leave (RA 8187), Philippine Midwifery Act (RA 7392), Early Childhood Care and
Development (RA 8980), the Newborn Screening Law (RA 9288), national insurance
(RA 7875), adequate supply, distribution, use and acceptance of drugs and medicines
identified by their generics (RA 6675), accelerating the development of traditional and
alternative health care (RA 8423). Some issuances are: maternal package for normal
spontaneous vaginal delivery in non-hospital facilities (PhilHealth Circular No. 6),
supplemental guide for Garantisadong Pambata (DOH Circular 265-A), setting standard
labeling for breastmilk substitutes, infant formula, other milk products, foods and
beverages (DOH Circular 2008-0006), Bright Child Program (EO 286), national
commitment for ―Bakuna and Una sa Sanggol at Ina‖ (EO 663). Some administrative
orders (AOs) from the DOH related to maternal and child health that specify some of the
roles of LGUs are found in Annex A.
18
Section 102, Title Five of the 1991 LGC specifies the functions of LHB. These are: ―(1) To propose to
the sanggunian concerned, in accordance with standards and criteria set by the Department of Health,
annual budgetary allocations for the operation and maintenance of health facilities and services within the
municipality, city or province, as the case may be; (2) To serve as an advisory committee to the sanggunian
concerned on health matters such as, but not limited to, the necessity for, and application of, local
appropriations for public health purposes, and, (3) Consistent with the technical and administrative
standards of the Department of Health, create committees which shall advise local health agencies on
matters such, but not limited to personnel selection and promotion, bids and awards, grievance and
complaints, personnel discipline, budget review, operations review and similar functions.‖
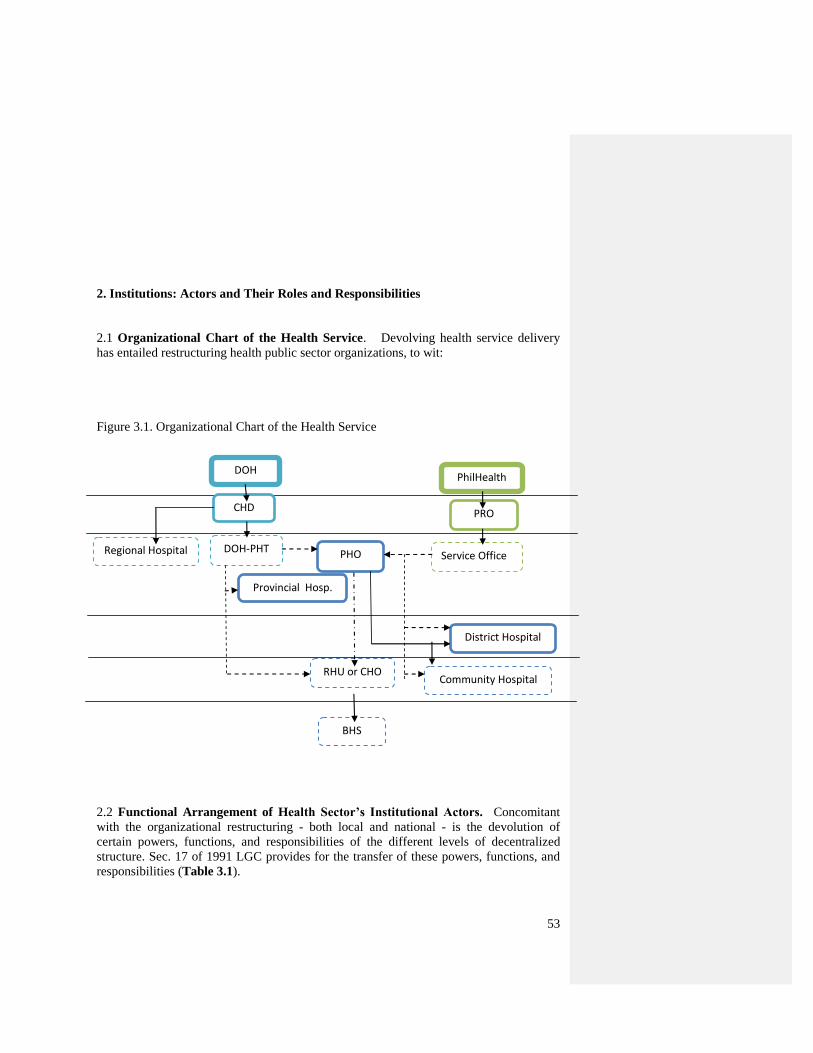
53
DOH PhilHealth
CHD PRO
PHO DOH-PHT Service Office
Community Hospital
District Hospital
BHS
RHU or CHO
Provincial Hosp.
Regional Hospital
2. Institutions: Actors and Their Roles and Responsibilities
2.1 Organizational Chart of the Health Service. Devolving health service delivery
has entailed restructuring health public sector organizations, to wit:
Figure 3.1. Organizational Chart of the Health Service
2.2 Functional Arrangement of Health Sector’s Institutional Actors. Concomitant
with the organizational restructuring - both local and national - is the devolution of
certain powers, functions, and responsibilities of the different levels of decentralized
structure. Sec. 17 of 1991 LGC provides for the transfer of these powers, functions, and
responsibilities (Table 3.1).
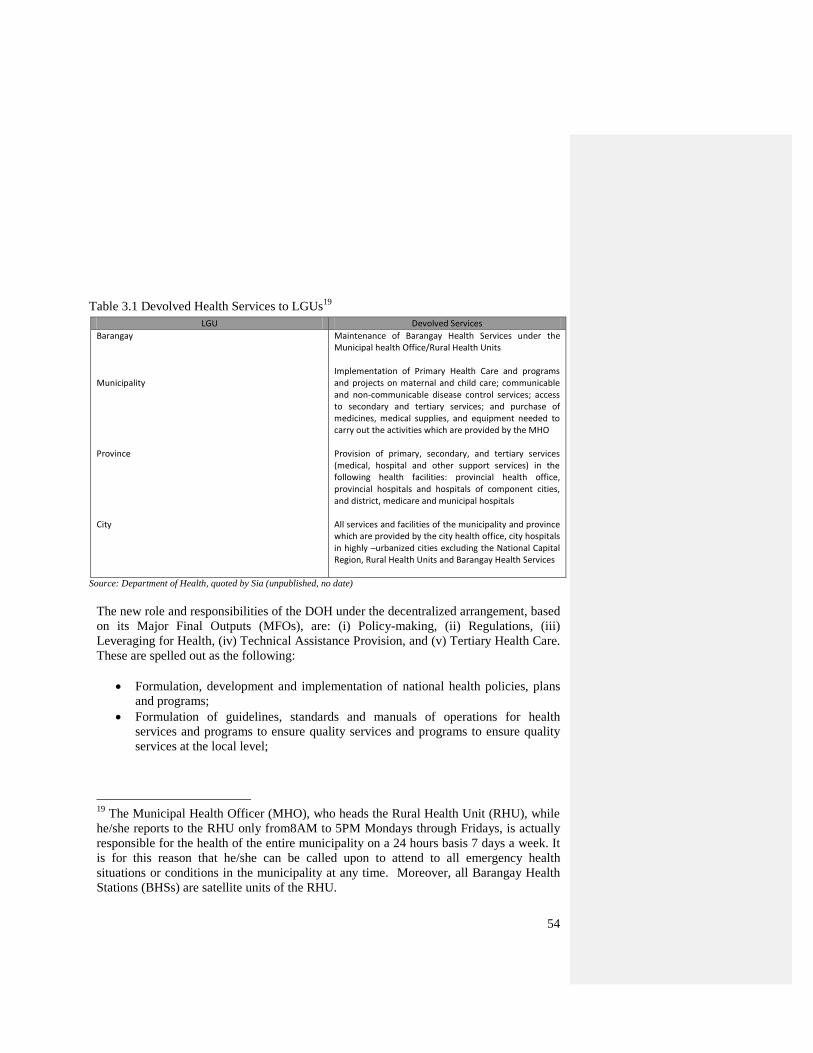
54
Table 3.1 Devolved Health Services to LGUs19
LGU Devolved Services
Barangay Municipality Province City
Maintenance of Barangay Health Services under the Municipal health Office/Rural Health Units Implementation of Primary Health Care and programs and projects on maternal and child care; communicable and non-communicable disease control services; access to secondary and tertiary services; and purchase of medicines, medical supplies, and equipment needed to carry out the activities which are provided by the MHO Provision of primary, secondary, and tertiary services (medical, hospital and other support services) in the following health facilities: provincial health office, provincial hospitals and hospitals of component cities, and district, medicare and municipal hospitals All services and facilities of the municipality and province which are provided by the city health office, city hospitals in highly –urbanized cities excluding the National Capital Region, Rural Health Units and Barangay Health Services
Source: Department of Health, quoted by Sia (unpublished, no date)
The new role and responsibilities of the DOH under the decentralized arrangement, based
on its Major Final Outputs (MFOs), are: (i) Policy-making, (ii) Regulations, (iii)
Leveraging for Health, (iv) Technical Assistance Provision, and (v) Tertiary Health Care.
These are spelled out as the following:
Formulation, development and implementation of national health policies, plans
and programs;
Formulation of guidelines, standards and manuals of operations for health
services and programs to ensure quality services and programs to ensure quality
services at the local level;
19
The Municipal Health Officer (MHO), who heads the Rural Health Unit (RHU), while
he/she reports to the RHU only from8AM to 5PM Mondays through Fridays, is actually
responsible for the health of the entire municipality on a 24 hours basis 7 days a week. It
is for this reason that he/she can be called upon to attend to all emergency health
situations or conditions in the municipality at any time. Moreover, all Barangay Health
Stations (BHSs) are satellite units of the RHU.
55
Issuance of rules and regulations, licenses and accreditation pursuant to existing
laws and promulgation of national health standards, goals, priorities and
indicators;
Development of special health programs and projects; and
Advocacy for legislation on health policies and programs (Torres and Lorenzo
n.d.)
In more concrete terms, some of the retained powers, functions, and responsibilities of
the DOH are the following:
Components of national programs which are funded from foreign sources;
Nationally-funded programs which are in the process of being pilot-
tested/experimented or developed;
Health services and disease control programs which are covered by the
international agreements such as quarantineable diseases and disease eradication
programs;
Regulatory, licensing, and accreditation functions which are currently exercised
by the DOH pursuant to the existing laws; and,
Regional hospitals, medical centers and specialized health facilities (Dela Cruz
2002:100-1)
In relation to the LGUs, DOH provides technical and financial assistance to them. It does
this in the following areas:
Monitor and evaluate local health programs, projects, facilities, services and
research studies;
Provide health information, statistics and other data to LGUs which may either be
helpful in their operations or serve as periodic health indicators;
Install referral mechanisms and ensure that the public has access, when necessary,
to higher and more advanced health facilities under the control of the DOH; and
Extend support services and other forms of assistance to LGUs which come in the
form of:
1. Technical Support for information, education, and communication development;
health research and development; health intelligence, international and national;
2. Administrative support services for program and project management;
interagency coordination; networking; information and record management; and
other administrative services;
3. Budget preparation assistance as well as logistics and financial support services
for bulk procurement of drugs, medicines and medical equipment and supplies;
and
4. Resource mobilization from the national government, non-governmental
organizations (NGOs), and international funding agencies; other financial and
resource management services; and extension of other support services which are
specific components of national health programs (Torres and Lorenzo n.d.).
56
The reengineering brought about by 1991 LGC has also created and redefined certain
institutions with varying powers, functions, and responsibilities. The Local Development
Council (LDC), the planning arm of each LGU in-charge of the overall socio-economic
planning and development in every LGU, provides for inter-agency collaboration at the
local level. Also, various sectors of the civil society and private sector serve as active
partners for local health development and better delivery of health services. These sectors
perform the function of being representatives or voice of the people in LHBs or by
entering into joint ventures with LGUs in providing maternal and child services directly
to the people. Moreover, international donors such World Health Organization (WHO),
United Nations Funds for Population Activities (UNFPA), World Bank, UNICEF,
AUSAID, ADB, USAID support LGUs in the delivery of maternal and child programs
either directly to them or through the DOH. Women‘s Health and Safe Motherhood
Project 1 & 2 (WHSMP 1& 2) is an example of a project with international donor
support.
3. Key Strategies and Programs
3.1 Medium-Term Philippine Development Plan (MTPDP) 2004-2010. Health is one
of the essential services the government aims to provide to all, especially the poor, in its
commitment to ensure social justice and meet the basic needs of every Filipino. To
improve accessibility and affordability of quality health service, particularly maternal and
child health services, the government lays down its health priorities in the MTPDP. These
health priorities are: (i) Reduce the cost of medicines commonly bought by the poor to
half of their 2004 prices and make these available nationwide through a distribution
network as determined by the DOH, in coordination with the PITC; (ii) Expand health
insurance particularly for indigents through premium subsidy; (iii) Strengthen national
and local health systems through the implementation of the Health Sector Reform
Agenda (HSRA); (iv) Improve the Health Care Management System; and (v) Improve
health and productivity through research and development.
3.2 National Objectives for Health (NOH) 2005-2010. As a sequel to the first NOH
(1999-2004), this NOH aims at unifying the Philippine health sector towards improving
health delivery based on a common direction and achievable health outcomes with
greatest health impacts to all Filipinos. It serves as the roadmap for the achievement of
the overarching goal of ―Health for all Filipinos‖ by containing key ideas, targets,
indicators, and strategies for improved health service delivery and sustainability of gains.
It institutionalizes inter-agency and inter-local cooperation of different stakeholders or
actors of the health system – i.e. policy makers, program managers and projects
implementers, service providers, LGUs, development partners such as donors, academe,
private sector and civil society groups - in working for the achievement of health-related
MDGs for the Filipinos. In ensuring improved maternal and child health, NOH 2005-
2010 is anchored on the guiding philosophy and strategic approach of Fourmula One.
57
3.3 FOURmula ONE for Health. Fourmula One for Health or F1 was adopted as a
reform initiative starting June 2005. As the new implementation framework for all health
sector reforms, it aims to achieve three major goals for the entire health care system in
consonance with goals identified by the WHO, MDGs, MTPDP, and NOH: (i) better
health outcomes, (ii) more responsive health system, and (iii) more equitable healthcare
financing. Designed to implement critical interventions for critical health reforms, its
major thrusts or four implementation components are: ―healthcare financing (public
financing for health and social health insurance), health regulation (quality assurance of
health goods and services, and cost containment of essential medicines), health delivery
(delivery of public health programs and hospital services) and good governance (local
health systems development, human resource development, financial and procurement
management, and knowledge management) (NOH 2005: v).‖ Guided by its general
objective of realizing critical reforms with ―speed, precision and effectiveness‖ to
improve the ―quality, efficiency, effectiveness and equity‖ of the entire health system, it
strives to achieve medium-term goals (2006-2010) in the areas of: (i) securing more,
better and sustained financing for health; (ii) assuring the quality and affordability of
health goods and services; (iii) ensuring access to and availability of essential and basic
health packages; and (iv) improving performance of the health system.
In implementing health reforms package for improved maternal and child health, F1 is
supported by management infrastructure from the national to the local levels, as well as
financial arrangements such grants, local counterpart, national government counterpart,
and international donations or loans. To ensure effective implementation, sustainability of
gains, and institutionalization of ownership, it engages major stakeholders in the
management and implementation of the needed reforms. These include public and private
sectors, national agencies and local government units, external development agencies,
civil society, and local communities. LGUs‘ role and responsibilities vis-à-vis F1‘s
requisite functional arrangement are: (i) delivery of basic health service packages to
constituents; (ii) inter-local cooperation through Inter-Local Health Zones for an
integrative implementation of Fourmula One health reform strategies; (iii) issuance of
ordinances and resolutions for local implementation of Fourmula One; (iv) provision of
local counterpart funds for local implementation of Fourmula One based on their
investment plan; (v) promotion and advocacy of the local implementation of Fourmula
One as the health sector reform implementation framework.
3.4 Maternal and Child Health Programs. Based on the 2007 Annual Report of DOH,
the package of services for the Child Health Programs rendered among under 5-year old
children were: Expanded Immunization Program (EPI), Integrated Management of
Childhood Illnesses (IMCI), Newborn Screening (NBS), and Nutrition services. For the
EPI, the Fully Immunized Child (FIC) achieved 91% immunization coverage for the
following antigens: 90% BCG, 87% OPV, 87% DPT, 92% Measles and 87% Hepatitis B.
The Knock-Out Tigdas (KOT) campaign achieved 95% for the 9 months to 48 months
old children. The improvements with regard to IMCI include its integration into the
medical courses such as medicine, nursing, and midwifery; institutionalization of the
IMCI into the curriculum of selected universities/schools; and training of school deans.
For the NBS, as a public health strategy aimed at detecting and managing several inborn
58
errors of metabolism that could lead to mental retardation and death, a total of 1,502 NBS
facilities have been registered, with 941 going for private facilities, 58 as DOH retained,
401 for LGUs, and 102 for special and other Government agencies. In terms of Nutrition
Services, the first round of Garantisadong Pambata (GP) in 2007 was able to provide
Vitamin A to 86% target beneficiaries, deworming to 61% pre-school children and 43%
among school children. For the second round of GP in 2007, Vitamin A supplementation
and deworming of pre-school children increased to 88% coverage and 73% respectively,
while deworming of school children decreased 42%. During the KOT campaign, 85%
were given Vitamin A while 67% were given deworming tablet. Institutionalization of
cultural beliefs and practices sensitive to child health required the conduct of training of
trainers and children themselves. These included the training of trainers on Infant and
Young Child Feeding (IYCF) Counseling, Social Marketing and Study on Strategies to
Promote Mother Baby Friendly Community and Workplace, as well as provision to
under-five children of safety tips, growth monitoring and promotion of good nutrition and
other health services. To work closely with faith-based organizations and fast track
implementation of hunger mitigation efforts, Anti-Hunger Task Force was created
through EO 616. As the lead agency of Inter-agency Task Force, National Nutrition
Council (NNC) oversee the implementation of Accelerated Hunger-Mitigation Program,
and through its collaboration with DepEd, DSWD, and LGUs attempts to improve food
security through better incomes and food supply.
For maternal health, package of services were provided to women. In 2007, two major
programs in the areas of reproductive health and nutrition services were proven to be
critical interventions in improving maternal health. For the reproductive health program
that included Family Planning and Adolescent Health, the major PAPs with greater health
impact on women of reproductive age were on a paradigm shift in maternal care from the
risk approach to the Emergency Obstetric Care (EmOC) approach. The latter approach,
which has been based from the lessons learned in Women‘s Health and Safe Motherhood
Projects, treats all pregnant women to be at risk of complications at childbirth. EmOC
includes two facilities for improved maternal health: the Basic Emergency Obstetric Care
(BEmOC) and the Comprehensive Emergency Obstetric Care (CEmOC). BEmOC
facilities provide three services: (i) parenteral care (intravenous or by injection)
antibiotics, (ii) parenteral oxytocic drugs, and (iii) parenteral anticonvulsants. CEmOC
facilities provide three services: (i) all functions of BEmOC, (ii) surgery function
(caesarian section), and (iii) blood transfusion service. The initiatives in 2007 were
mainly upgrading of these two maternal care facilities: 36 CEmOC and 180 BEmOC
facilities. For an improved quality of EmOC services, three EmOC training centers were
established in Luzon, Visayas, and Mindanao. To address equity and provide quality
BEmOC services, a total of 111 health facilities were capacitated to provide BEmOC
services around the country. There were also an upgrading of BEmOC facilities in 12
provinces and three cities. These included Agusan del Sur, South Cotabato, North
Cotabato, Eastern Samar, Masbate, Legaspi City, Capiz, Mindoro Oriental, Albay,
Aurora Province, Catanduanes, Mountain Province, Ifugao, Manila and Quezon City.
Other initiatives included the issuance of AO on Public-Private Partnership for Women‘s
Health and Safe Motherhood and the formulation of AO on Facility-Based Delivery
59
Protocol and EmOC Guidelines. Development of the guideline for the transfer of funds
to LGUs from the DOH to leverage the implementation of modern family planning
method has also been undertaken. Committed to normative maternal health care, DOH
formulated the Gender-Responsive and Rights-Based Integrated Reproductive Health
Modules. DOH also conducted the orientation and training of hospital administrators and
staff on putting up Women and Child Protection Units in all government hospitals in
Luzon and Metro Manila. Congress has contributed to maternal health care through its
proposed Population and RH bills that include, among others, the creation of an RH and
Population Management Council. With regard to the second program on nutrition
services, 58% of lactating mothers received Vitamin A, while 0.3% of target beneficiaries
(women 15-45 years old) received iodized oil capsules.
Since 2008, one of the important strategies DOH has been developing to address the risk
of maternal and neonatal deaths, which comprise half of reported infant mortalities, is an
integrated Maternal, Neonatal and Child Health and Nutrition (MNCHN) Strategy. This
was made possible through the issuance of AO 2008-0009, titled ―Implementing Health
Reforms for Rapid Reduction of Maternal and Neonatal Mortality.‖ This strategy is
designed to empower LGUs and other local institutional actors since it is aimed at an
effective local implementation of MNCHN strategy towards rapid reduction of maternal
and neonatal mortality. This local empowerment includes private-public partnerships
such as in ILHZ, demand-side interventions of local stakeholders, and supply-side
interventions from community level providers such as Barangay Health Stations (BHS),
and its health staff (e.g. midwives), and volunteer health workers (e.g. barangay health
workers, traditional birth attendants). The MNCHN Strategy also redefines Emergency
Obstretric Care (EmOC), with the inclusion of newborn care services to its EmOC
facilities; hence, Basic Emergency Obstretric Care (BEmOC) was changed to Basic
Emergency Obstretric and Newborn Care (BEmONC) while Comprehensive Emergency
Obstretric Care (CEmOC) became Comprehensive Emergency Obstretric and Newborn
Care (CEmONC). The new functions/services (AO 2008-0009) of these facilities
include:
BEmONC
Six signal obstetric functions:
(i) parenteral administration of oxytocin in the third stage of labor;
(ii) parenteral administration of loading dose of anti-convulsants;
(iii) parenteral administration of initial dose of antibiotics;
(iv) performance of assisted deliveries
(v) removal of retained products of conception; and
(vi) manual removal of retained placenta
Neonatal emergency interventions:
(i) newborn resuscitation,
(ii) treatment of neonatal sepsis/infection, and
(iii) oxygen support
60
CEmONC
(i) six signal obstetric functions of BEmONC,
(ii) perform caesarian section
(iii) provide blood banking and transfusion services along with other highly
specialized obstetric functions
Neonatal emergency interventions:
(i) newborn resuscitation,
(ii) treatment of neonatal sepsis/infection, and
(iii) oxygen support for neonates
(iv) management of low birth weight or premature newborn, along with other
specialized services
4. Trends and Challenges
Policy gaps and weaknesses
4.1 Slow Reduction of Maternal Mortality Ratio. Maternal mortality refers to deaths
of women during pregnancy, at childbirth, or post-childbirth. Despite increased efforts
towards improving maternal health, maternal mortality ratio is still worrisome. Figure
2.2 shows how maternal mortality has been decreasing at a slow pace. Between 1991 and
1997, maternal mortality rate (MMR) was estimated at 172 maternal deaths per 100,000
live births, which was an improvement20
from 209 deaths per 100,000 live births in the
period between 1987 to 1993 (NDHS 2003). Ericta‘s finding puts it at 138 maternal
deaths per 100,000 live births in 2002 (Figure 3.2). The 2006 level of 162 per 100,000
live births, based on Family Planning Survey (FPS), is still far from the 2015 target of 52
deaths per 100,000 live births, or just the 2010 target of 90 deaths per 100,000 live births
(NEDA 2007). This portends a low probability, if not impossibility, of attaining Goal 5
of the MDGs.
20
Analysis must take into account possible sampling errors. According to NEDA, maternal deaths ―are rare
such that MMR estimates from sample surveys are subject to sampling errors, and differences in estimates
are always statistically significant (NEDA 2007: 52). In another report, NEDA‘s caveat is: ―However, due
to large sampling errors associated with these estimates, it is difficult to conclude that the MMR has really
declined. Furthermore, the absence of no new official data makes the assessment of maternal health doubly
difficult (NEDA 2005: 74).
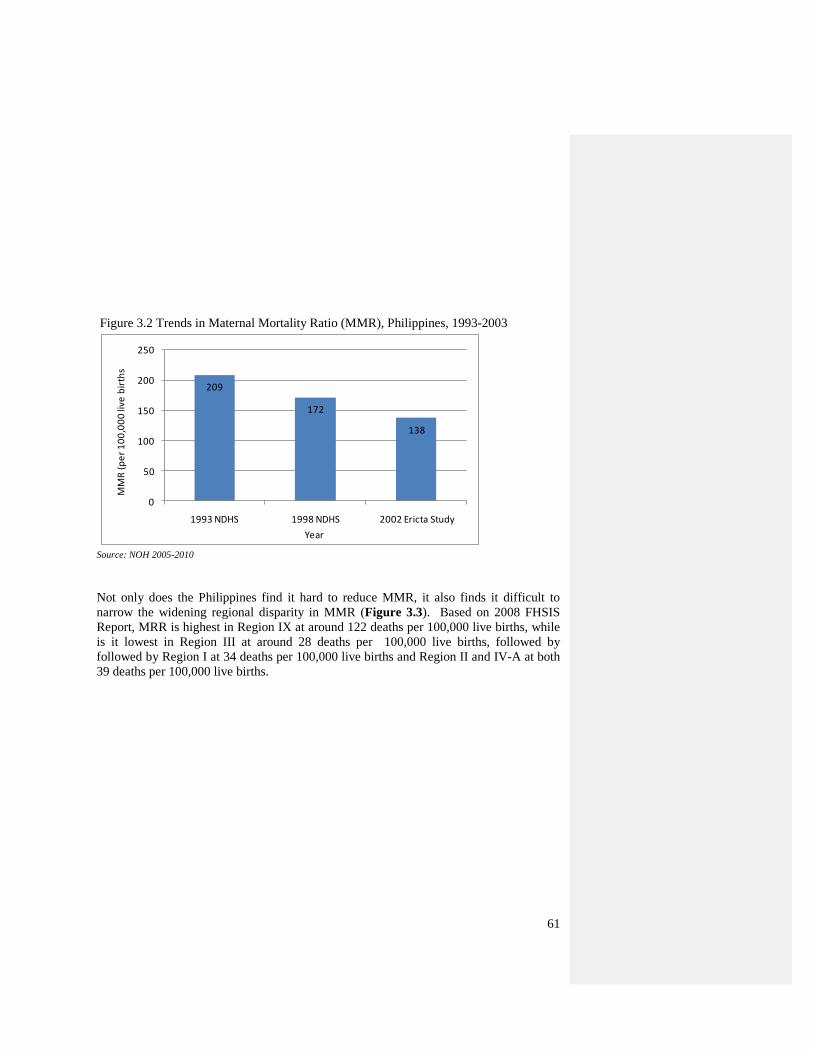
61
Figure 3.2 Trends in Maternal Mortality Ratio (MMR), Philippines, 1993-2003
209
172
138
0
50
100
150
200
250
1993 NDHS 1998 NDHS 2002 Ericta Study
MM
R (
pe
r 1
00
,00
0 li
ve b
irth
s
Year
Source: NOH 2005-2010
Not only does the Philippines find it hard to reduce MMR, it also finds it difficult to
narrow the widening regional disparity in MMR (Figure 3.3). Based on 2008 FHSIS
Report, MRR is highest in Region IX at around 122 deaths per 100,000 live births, while
is it lowest in Region III at around 28 deaths per 100,000 live births, followed by
followed by Region I at 34 deaths per 100,000 live births and Region II and IV-A at both
39 deaths per 100,000 live births.
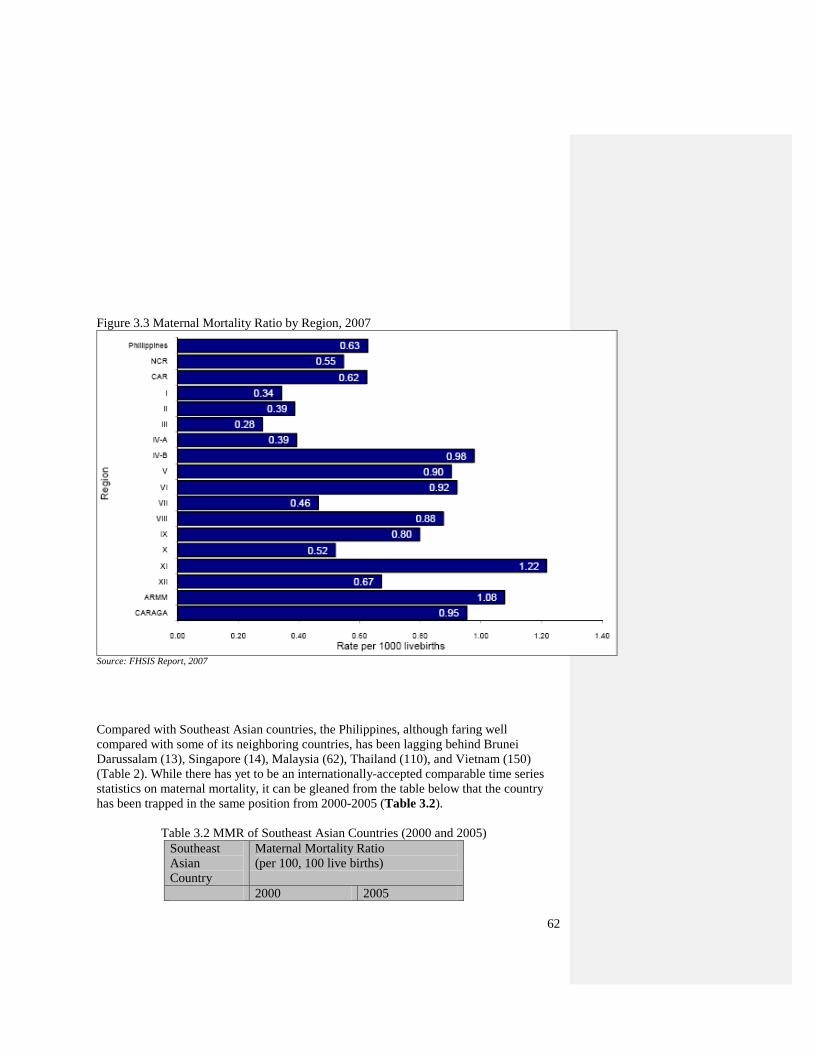
62
Figure 3.3 Maternal Mortality Ratio by Region, 2007
Source: FHSIS Report, 2007
Compared with Southeast Asian countries, the Philippines, although faring well
compared with some of its neighboring countries, has been lagging behind Brunei
Darussalam (13), Singapore (14), Malaysia (62), Thailand (110), and Vietnam (150)
(Table 2). While there has yet to be an internationally-accepted comparable time series
statistics on maternal mortality, it can be gleaned from the table below that the country
has been trapped in the same position from 2000-2005 (Table 3.2).
Table 3.2 MMR of Southeast Asian Countries (2000 and 2005)
Southeast
Asian
Country
Maternal Mortality Ratio
(per 100, 100 live births)
2000 2005
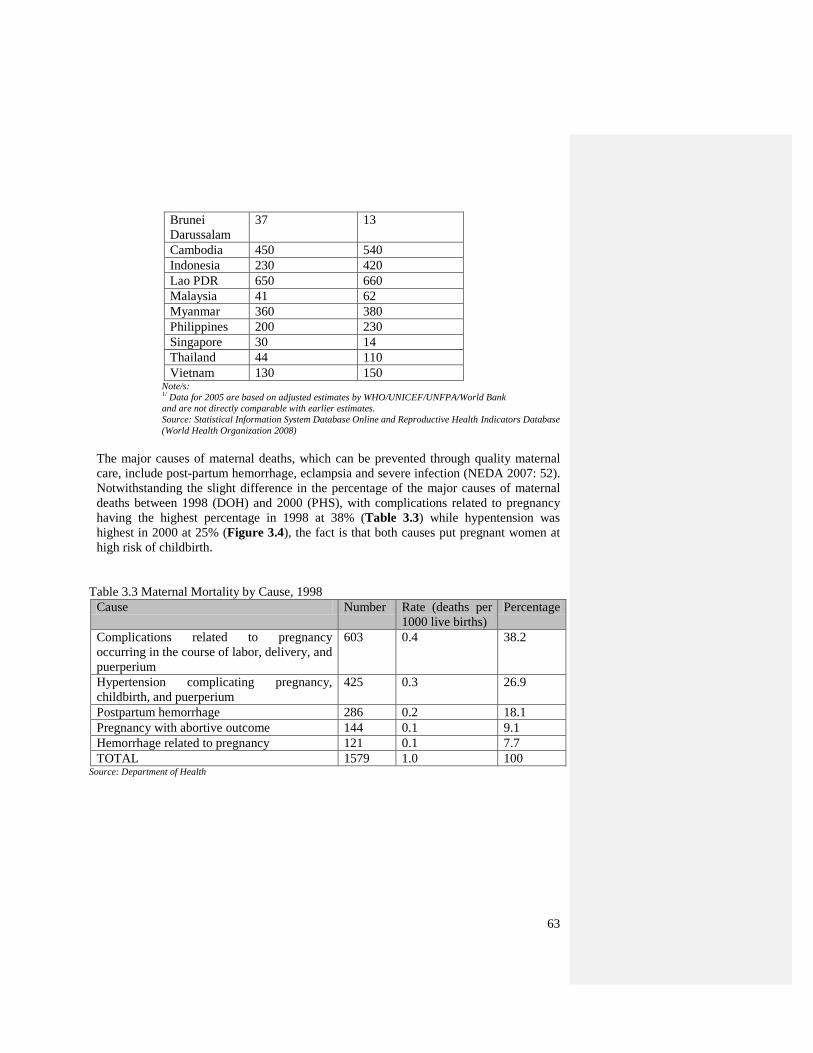
63
Brunei
Darussalam
37 13
Cambodia 450 540
Indonesia 230 420
Lao PDR 650 660
Malaysia 41 62
Myanmar 360 380
Philippines 200 230
Singapore 30 14
Thailand 44 110
Vietnam 130 150 Note/s:
1/ Data for 2005 are based on adjusted estimates by WHO/UNICEF/UNFPA/World Bank
and are not directly comparable with earlier estimates.
Source: Statistical Information System Database Online and Reproductive Health Indicators Database
(World Health Organization 2008)
The major causes of maternal deaths, which can be prevented through quality maternal
care, include post-partum hemorrhage, eclampsia and severe infection (NEDA 2007: 52).
Notwithstanding the slight difference in the percentage of the major causes of maternal
deaths between 1998 (DOH) and 2000 (PHS), with complications related to pregnancy
having the highest percentage in 1998 at 38% (Table 3.3) while hypentension was
highest in 2000 at 25% (Figure 3.4), the fact is that both causes put pregnant women at
high risk of childbirth.
Table 3.3 Maternal Mortality by Cause, 1998
Cause Number Rate (deaths per
1000 live births)
Percentage
Complications related to pregnancy
occurring in the course of labor, delivery, and
puerperium
603 0.4 38.2
Hypertension complicating pregnancy,
childbirth, and puerperium
425 0.3 26.9
Postpartum hemorrhage 286 0.2 18.1
Pregnancy with abortive outcome 144 0.1 9.1
Hemorrhage related to pregnancy 121 0.1 7.7
TOTAL 1579 1.0 100 Source: Department of Health
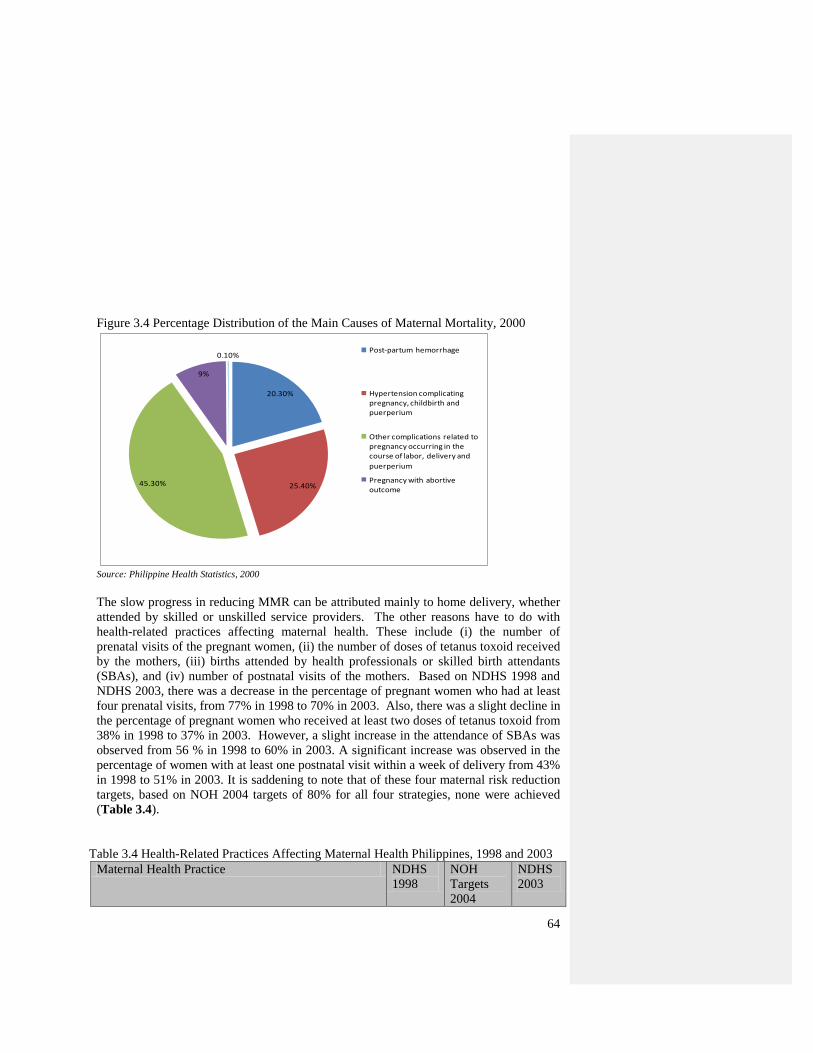
64
Figure 3.4 Percentage Distribution of the Main Causes of Maternal Mortality, 2000
20.30%
25.40%45.30%
9%
0.10%Post-partum hemorrhage
Hypertension complicating pregnancy, childbirth and puerperium
Other complications related to pregnancy occurring in the course of labor, delivery and
puerperium
Pregnancy with abortive outcome
Source: Philippine Health Statistics, 2000
The slow progress in reducing MMR can be attributed mainly to home delivery, whether
attended by skilled or unskilled service providers. The other reasons have to do with
health-related practices affecting maternal health. These include (i) the number of
prenatal visits of the pregnant women, (ii) the number of doses of tetanus toxoid received
by the mothers, (iii) births attended by health professionals or skilled birth attendants
(SBAs), and (iv) number of postnatal visits of the mothers. Based on NDHS 1998 and
NDHS 2003, there was a decrease in the percentage of pregnant women who had at least
four prenatal visits, from 77% in 1998 to 70% in 2003. Also, there was a slight decline in
the percentage of pregnant women who received at least two doses of tetanus toxoid from
38% in 1998 to 37% in 2003. However, a slight increase in the attendance of SBAs was
observed from 56 % in 1998 to 60% in 2003. A significant increase was observed in the
percentage of women with at least one postnatal visit within a week of delivery from 43%
in 1998 to 51% in 2003. It is saddening to note that of these four maternal risk reduction
targets, based on NOH 2004 targets of 80% for all four strategies, none were achieved
(Table 3.4).
Table 3.4 Health-Related Practices Affecting Maternal Health Philippines, 1998 and 2003
Maternal Health Practice NDHS
1998
NOH
Targets
2004
NDHS
2003
65
Pregnant women with at least 4 prenatal visits 77% 80% 70%
Pregnant women with at least 2 doses of tetanus toxoid 38% 80% 37%
Births attended by professional health providers 56% 80% 60%
Women with at least 1 postnatal visit within one week
of delivery
43% 80% 51%
Source: National Center for Disease and Prevention and Control, DOH, 2005
Further, though the total fertility rate (TFR) of the Philippines is in the decline, estimated
to be at 6 births per Filipino woman in 1973 to 3.7 in 1998 and 3.5 in 2003, it is high
compared with the TFR of most Southeast Asian countries: Malaysia (2.9), Indonesia
(2.3), Thailand (1.9), and Singapore (1.3). The only countries that have higher TFR than
the Philippines are Laos (4.7 children per woman) and Cambodia (4.0 children per
woman) (NDHS 2003). Further, the 2003 TFR of 3.5 children per Filipino woman is too
high compared with average wanted fertility rate (WTR) of 2.7 children per woman. This
means that the average number of children born to every woman upon reaching age 40-49
years is 4.3. Regional comparisons show that MIMAROPA is the region with the highest
TFR of 5.0 followed by Eastern Visayas at 4.6. NCR has the lowest TFR of only 2.8
(Table 3.5). The implication of high TFR makes it difficult for the government to reduce
MMR. With more women getting pregnant due to high fertility rate, more maternal care
services should be made available. The increase in percentage of childbirth being
attended by medical professionals or SBAs requires an increase in the number of SBAs
and quality maternal care services, among others. This is so because all pregnancies are
considered at risk.
Table 3.5 Wanted Fertility Rate, Total Fertility Rate and Mean Number of Children Ever
Born to Women Age 40-49 Years by Region, Philippines, 2003
Region Wanted Fertility
Rate Total Fertility Rate Mean Number of
Children Ever
Born to Women
Age 40-49 Years
NCR 2.0 2.8 3.2
CAR 2.7 3.8 4.7
Ilocos 3.0 3.8 3.9
Cagayan Valley 2.6 3.4 4.1
Central Luzon 2.4 3.1 4.1
CALABARZON 2.3 3.2 3.8
MIMAROPA 3.6 5.0 5.1
Bicol 2.6 4.3 5.5
Western Visayas 2.7 4.0 4.9
Central Visayas 2.6 3.6 4.4
Eastern Visayas 2.9 4.6 5.4
Zamboanga
Peninsula
2.6 4.2 4.9
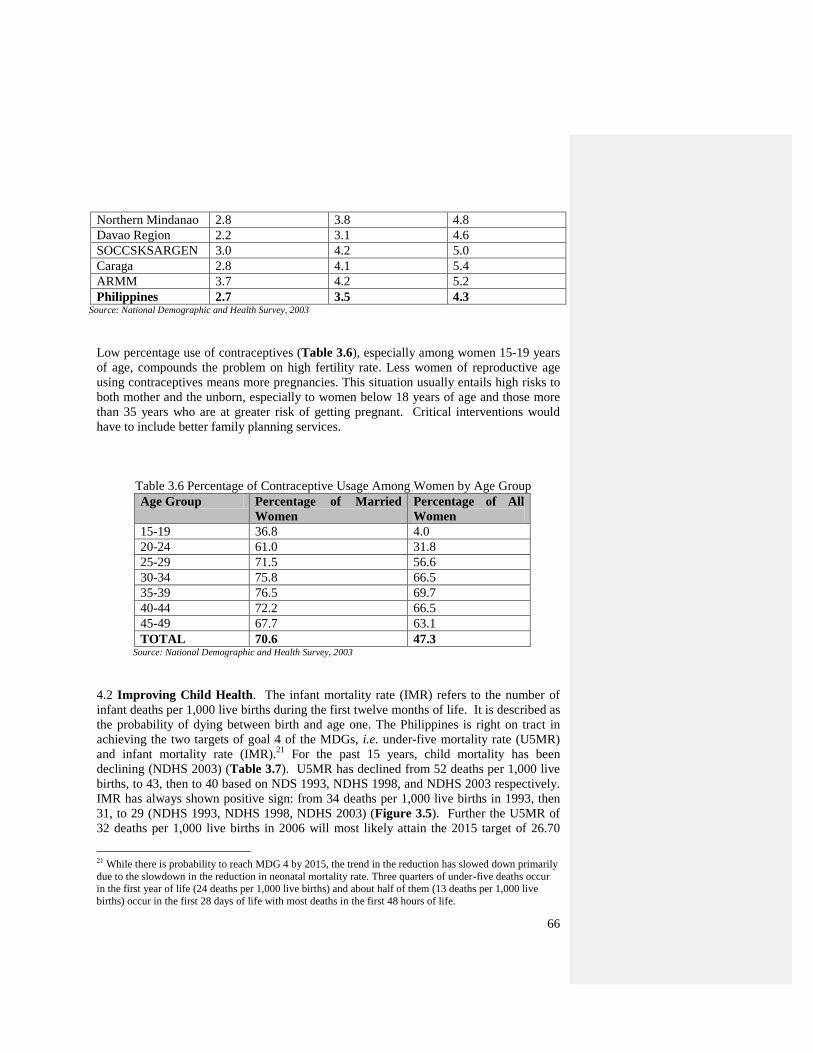
66
Northern Mindanao 2.8 3.8 4.8
Davao Region 2.2 3.1 4.6
SOCCSKSARGEN 3.0 4.2 5.0
Caraga 2.8 4.1 5.4
ARMM 3.7 4.2 5.2
Philippines 2.7 3.5 4.3 Source: National Demographic and Health Survey, 2003
Low percentage use of contraceptives (Table 3.6), especially among women 15-19 years
of age, compounds the problem on high fertility rate. Less women of reproductive age
using contraceptives means more pregnancies. This situation usually entails high risks to
both mother and the unborn, especially to women below 18 years of age and those more
than 35 years who are at greater risk of getting pregnant. Critical interventions would
have to include better family planning services.
Table 3.6 Percentage of Contraceptive Usage Among Women by Age Group
Age Group Percentage of Married
Women
Percentage of All
Women
15-19 36.8 4.0
20-24 61.0 31.8
25-29 71.5 56.6
30-34 75.8 66.5
35-39 76.5 69.7
40-44 72.2 66.5
45-49 67.7 63.1
TOTAL 70.6 47.3 Source: National Demographic and Health Survey, 2003
4.2 Improving Child Health. The infant mortality rate (IMR) refers to the number of
infant deaths per 1,000 live births during the first twelve months of life. It is described as
the probability of dying between birth and age one. The Philippines is right on tract in
achieving the two targets of goal 4 of the MDGs, i.e. under-five mortality rate (U5MR)
and infant mortality rate (IMR).21
For the past 15 years, child mortality has been
declining (NDHS 2003) (Table 3.7). U5MR has declined from 52 deaths per 1,000 live
births, to 43, then to 40 based on NDS 1993, NDHS 1998, and NDHS 2003 respectively.
IMR has always shown positive sign: from 34 deaths per 1,000 live births in 1993, then
31, to 29 (NDHS 1993, NDHS 1998, NDHS 2003) (Figure 3.5). Further the U5MR of
32 deaths per 1,000 live births in 2006 will most likely attain the 2015 target of 26.70
21
While there is probability to reach MDG 4 by 2015, the trend in the reduction has slowed down primarily
due to the slowdown in the reduction in neonatal mortality rate. Three quarters of under-five deaths occur
in the first year of life (24 deaths per 1,000 live births) and about half of them (13 deaths per 1,000 live
births) occur in the first 28 days of life with most deaths in the first 48 hours of life.
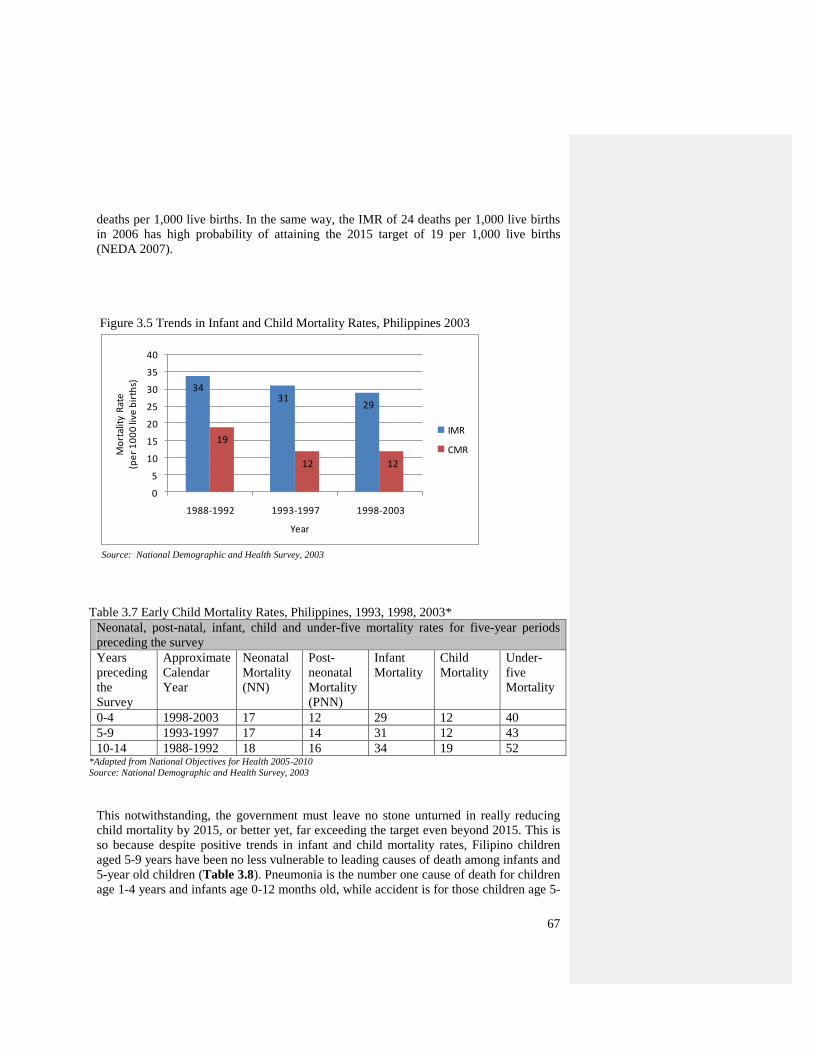
67
deaths per 1,000 live births. In the same way, the IMR of 24 deaths per 1,000 live births
in 2006 has high probability of attaining the 2015 target of 19 per 1,000 live births
(NEDA 2007).
Figure 3.5 Trends in Infant and Child Mortality Rates, Philippines 2003
3431
29
19
12 12
0
5
10
15
20
25
30
35
40
1988-1992 1993-1997 1998-2003
Mo
rtal
ity
Rat
e(p
er
10
00
live
bir
ths)
Year
IMR
CMR
Source: National Demographic and Health Survey, 2003
Table 3.7 Early Child Mortality Rates, Philippines, 1993, 1998, 2003*
Neonatal, post-natal, infant, child and under-five mortality rates for five-year periods
preceding the survey
Years
preceding
the
Survey
Approximate
Calendar
Year
Neonatal
Mortality
(NN)
Post-
neonatal
Mortality
(PNN)
Infant
Mortality
Child
Mortality
Under-
five
Mortality
0-4 1998-2003 17 12 29 12 40
5-9 1993-1997 17 14 31 12 43
10-14 1988-1992 18 16 34 19 52 *Adapted from National Objectives for Health 2005-2010
Source: National Demographic and Health Survey, 2003
This notwithstanding, the government must leave no stone unturned in really reducing
child mortality by 2015, or better yet, far exceeding the target even beyond 2015. This is
so because despite positive trends in infant and child mortality rates, Filipino children
aged 5-9 years have been no less vulnerable to leading causes of death among infants and
5-year old children (Table 3.8). Pneumonia is the number one cause of death for children
age 1-4 years and infants age 0-12 months old, while accident is for those children age 5-
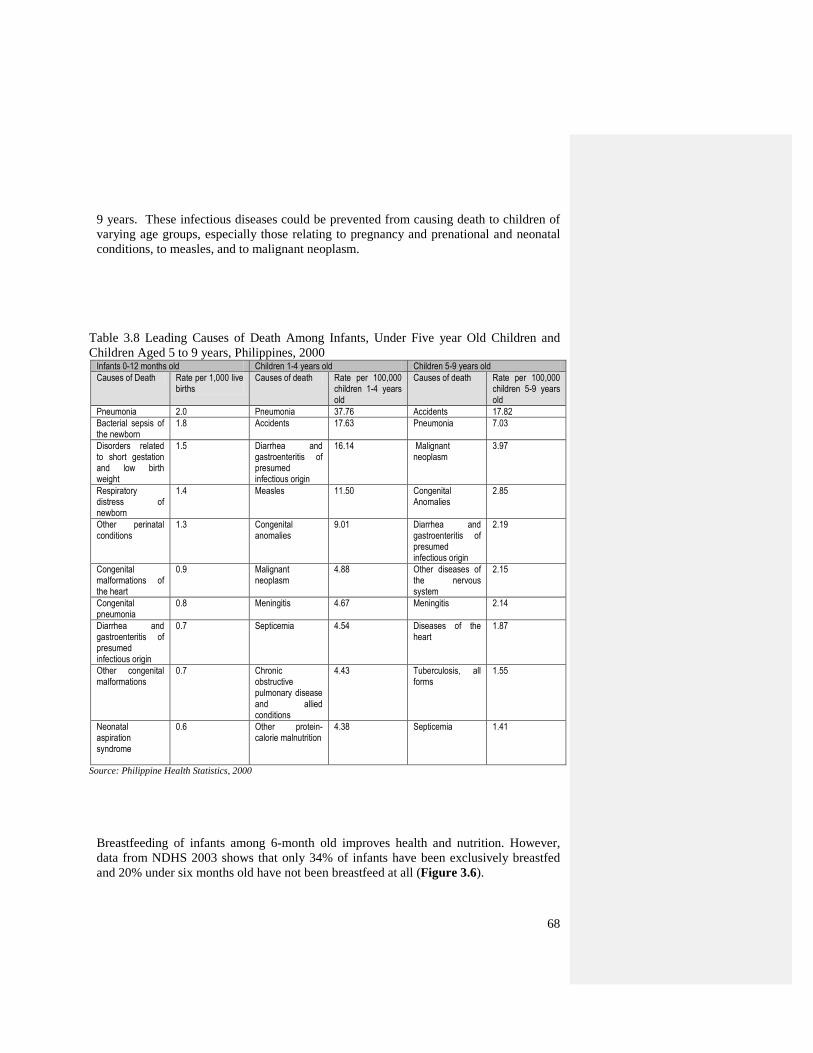
68
9 years. These infectious diseases could be prevented from causing death to children of
varying age groups, especially those relating to pregnancy and prenational and neonatal
conditions, to measles, and to malignant neoplasm.
Table 3.8 Leading Causes of Death Among Infants, Under Five year Old Children and
Children Aged 5 to 9 years, Philippines, 2000 Infants 0-12 months old Children 1-4 years old Children 5-9 years old
Causes of Death Rate per 1,000 live births
Causes of death Rate per 100,000 children 1-4 years old
Causes of death Rate per 100,000 children 5-9 years old
Pneumonia 2.0 Pneumonia 37.76 Accidents 17.82
Bacterial sepsis of the newborn
1.8
Accidents 17.63 Pneumonia 7.03
Disorders related to short gestation and low birth weight
1.5 Diarrhea and gastroenteritis of presumed infectious origin
16.14 Malignant neoplasm
3.97
Respiratory distress of newborn
1.4 Measles 11.50 Congenital Anomalies
2.85
Other perinatal conditions
1.3 Congenital anomalies
9.01 Diarrhea and gastroenteritis of presumed infectious origin
2.19
Congenital malformations of the heart
0.9 Malignant neoplasm
4.88 Other diseases of the nervous system
2.15
Congenital pneumonia
0.8 Meningitis 4.67 Meningitis 2.14
Diarrhea and gastroenteritis of presumed infectious origin
0.7 Septicemia 4.54 Diseases of the heart
1.87
Other congenital malformations
0.7 Chronic obstructive pulmonary disease and allied conditions
4.43 Tuberculosis, all forms
1.55
Neonatal aspiration syndrome
0.6 Other protein-calorie malnutrition
4.38 Septicemia 1.41
Source: Philippine Health Statistics, 2000
Breastfeeding of infants among 6-month old improves health and nutrition. However,
data from NDHS 2003 shows that only 34% of infants have been exclusively breastfed
and 20% under six months old have not been breastfeed at all (Figure 3.6).
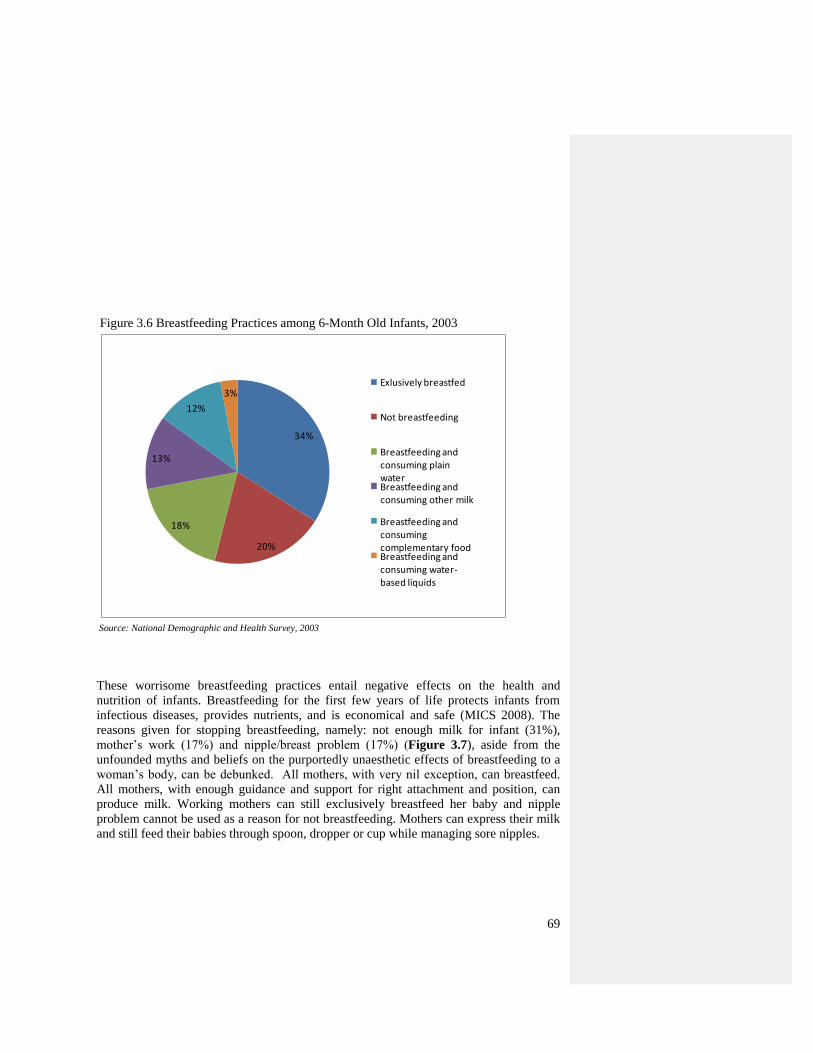
69
Figure 3.6 Breastfeeding Practices among 6-Month Old Infants, 2003
34%
20%
18%
13%
12%
3%Exlusively breastfed
Not breastfeeding
Breastfeeding and consuming plain waterBreastfeeding and consuming other milk
Breastfeeding and consuming complementary foodBreastfeeding and consuming water-based liquids
Source: National Demographic and Health Survey, 2003
These worrisome breastfeeding practices entail negative effects on the health and
nutrition of infants. Breastfeeding for the first few years of life protects infants from
infectious diseases, provides nutrients, and is economical and safe (MICS 2008). The
reasons given for stopping breastfeeding, namely: not enough milk for infant (31%),
mother‘s work (17%) and nipple/breast problem (17%) (Figure 3.7), aside from the
unfounded myths and beliefs on the purportedly unaesthetic effects of breastfeeding to a
woman‘s body, can be debunked. All mothers, with very nil exception, can breastfeed.
All mothers, with enough guidance and support for right attachment and position, can
produce milk. Working mothers can still exclusively breastfeed her baby and nipple
problem cannot be used as a reason for not breastfeeding. Mothers can express their milk
and still feed their babies through spoon, dropper or cup while managing sore nipples.
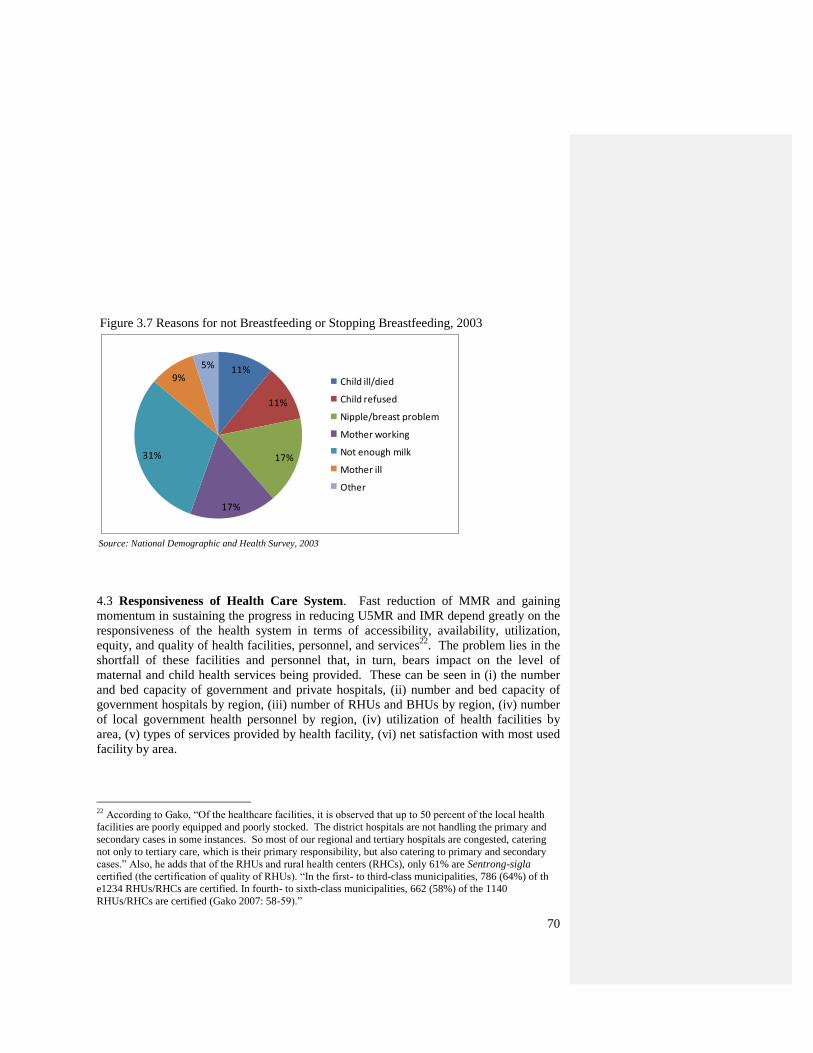
70
Figure 3.7 Reasons for not Breastfeeding or Stopping Breastfeeding, 2003
11%
11%
17%
17%
31%
9%5%
Child ill/died
Child refused
Nipple/breast problem
Mother working
Not enough milk
Mother ill
Other
Source: National Demographic and Health Survey, 2003
4.3 Responsiveness of Health Care System. Fast reduction of MMR and gaining
momentum in sustaining the progress in reducing U5MR and IMR depend greatly on the
responsiveness of the health system in terms of accessibility, availability, utilization,
equity, and quality of health facilities, personnel, and services22
. The problem lies in the
shortfall of these facilities and personnel that, in turn, bears impact on the level of
maternal and child health services being provided. These can be seen in (i) the number
and bed capacity of government and private hospitals, (ii) number and bed capacity of
government hospitals by region, (iii) number of RHUs and BHUs by region, (iv) number
of local government health personnel by region, (iv) utilization of health facilities by
area, (v) types of services provided by health facility, (vi) net satisfaction with most used
facility by area.
22
According to Gako, ―Of the healthcare facilities, it is observed that up to 50 percent of the local health
facilities are poorly equipped and poorly stocked. The district hospitals are not handling the primary and
secondary cases in some instances. So most of our regional and tertiary hospitals are congested, catering
not only to tertiary care, which is their primary responsibility, but also catering to primary and secondary
cases.‖ Also, he adds that of the RHUs and rural health centers (RHCs), only 61% are Sentrong-sigla
certified (the certification of quality of RHUs). ―In the first- to third-class municipalities, 786 (64%) of th
e1234 RHUs/RHCs are certified. In fourth- to sixth-class municipalities, 662 (58%) of the 1140
RHUs/RHCs are certified (Gako 2007: 58-59).‖
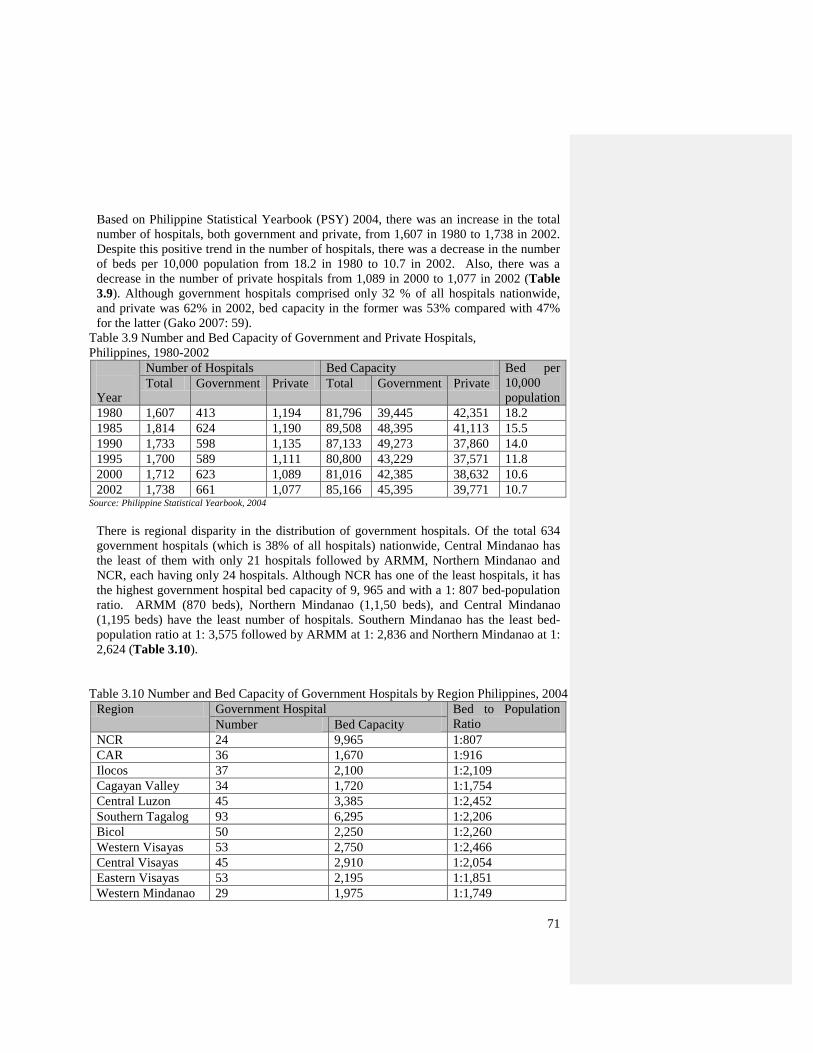
71
Based on Philippine Statistical Yearbook (PSY) 2004, there was an increase in the total
number of hospitals, both government and private, from 1,607 in 1980 to 1,738 in 2002.
Despite this positive trend in the number of hospitals, there was a decrease in the number
of beds per 10,000 population from 18.2 in 1980 to 10.7 in 2002. Also, there was a
decrease in the number of private hospitals from 1,089 in 2000 to 1,077 in 2002 (Table
3.9). Although government hospitals comprised only 32 % of all hospitals nationwide,
and private was 62% in 2002, bed capacity in the former was 53% compared with 47%
for the latter (Gako 2007: 59).
Table 3.9 Number and Bed Capacity of Government and Private Hospitals,
Philippines, 1980-2002
Year
Number of Hospitals Bed Capacity Bed per
10,000
population Total Government Private Total Government Private
1980 1,607 413 1,194 81,796 39,445 42,351 18.2
1985 1,814 624 1,190 89,508 48,395 41,113 15.5
1990 1,733 598 1,135 87,133 49,273 37,860 14.0
1995 1,700 589 1,111 80,800 43,229 37,571 11.8
2000 1,712 623 1,089 81,016 42,385 38,632 10.6
2002 1,738 661 1,077 85,166 45,395 39,771 10.7 Source: Philippine Statistical Yearbook, 2004
There is regional disparity in the distribution of government hospitals. Of the total 634
government hospitals (which is 38% of all hospitals) nationwide, Central Mindanao has
the least of them with only 21 hospitals followed by ARMM, Northern Mindanao and
NCR, each having only 24 hospitals. Although NCR has one of the least hospitals, it has
the highest government hospital bed capacity of 9, 965 and with a 1: 807 bed-population
ratio. ARMM (870 beds), Northern Mindanao (1,1,50 beds), and Central Mindanao
(1,195 beds) have the least number of hospitals. Southern Mindanao has the least bed-
population ratio at 1: 3,575 followed by ARMM at 1: 2,836 and Northern Mindanao at 1:
2,624 (Table 3.10).
Table 3.10 Number and Bed Capacity of Government Hospitals by Region Philippines, 2004
Region Government Hospital Bed to Population
Ratio Number Bed Capacity
NCR 24 9,965 1:807
CAR 36 1,670 1:916
Ilocos 37 2,100 1:2,109
Cagayan Valley 34 1,720 1:1,754
Central Luzon 45 3,385 1:2,452
Southern Tagalog 93 6,295 1:2,206
Bicol 50 2,250 1:2,260
Western Visayas 53 2,750 1:2,466
Central Visayas 45 2,910 1:2,054
Eastern Visayas 53 2,195 1:1,851
Western Mindanao 29 1,975 1:1,749
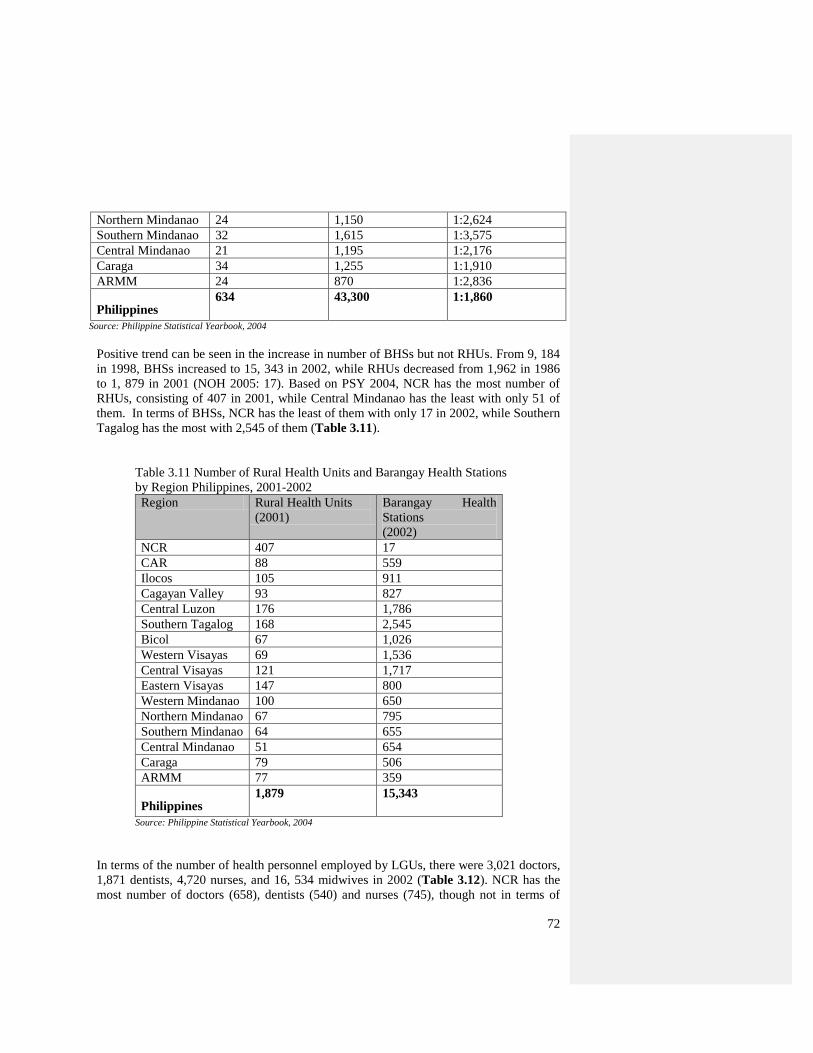
72
Northern Mindanao 24 1,150 1:2,624
Southern Mindanao 32 1,615 1:3,575
Central Mindanao 21 1,195 1:2,176
Caraga 34 1,255 1:1,910
ARMM 24 870 1:2,836
Philippines 634 43,300 1:1,860
Source: Philippine Statistical Yearbook, 2004
Positive trend can be seen in the increase in number of BHSs but not RHUs. From 9, 184
in 1998, BHSs increased to 15, 343 in 2002, while RHUs decreased from 1,962 in 1986
to 1, 879 in 2001 (NOH 2005: 17). Based on PSY 2004, NCR has the most number of
RHUs, consisting of 407 in 2001, while Central Mindanao has the least with only 51 of
them. In terms of BHSs, NCR has the least of them with only 17 in 2002, while Southern
Tagalog has the most with 2,545 of them (Table 3.11).
Table 3.11 Number of Rural Health Units and Barangay Health Stations
by Region Philippines, 2001-2002
Region Rural Health Units
(2001)
Barangay Health
Stations
(2002)
NCR 407 17
CAR 88 559
Ilocos 105 911
Cagayan Valley 93 827
Central Luzon 176 1,786
Southern Tagalog 168 2,545
Bicol 67 1,026
Western Visayas 69 1,536
Central Visayas 121 1,717
Eastern Visayas 147 800
Western Mindanao 100 650
Northern Mindanao 67 795
Southern Mindanao 64 655
Central Mindanao 51 654
Caraga 79 506
ARMM 77 359
Philippines 1,879 15,343
Source: Philippine Statistical Yearbook, 2004
In terms of the number of health personnel employed by LGUs, there were 3,021 doctors,
1,871 dentists, 4,720 nurses, and 16, 534 midwives in 2002 (Table 3.12). NCR has the
most number of doctors (658), dentists (540) and nurses (745), though not in terms of
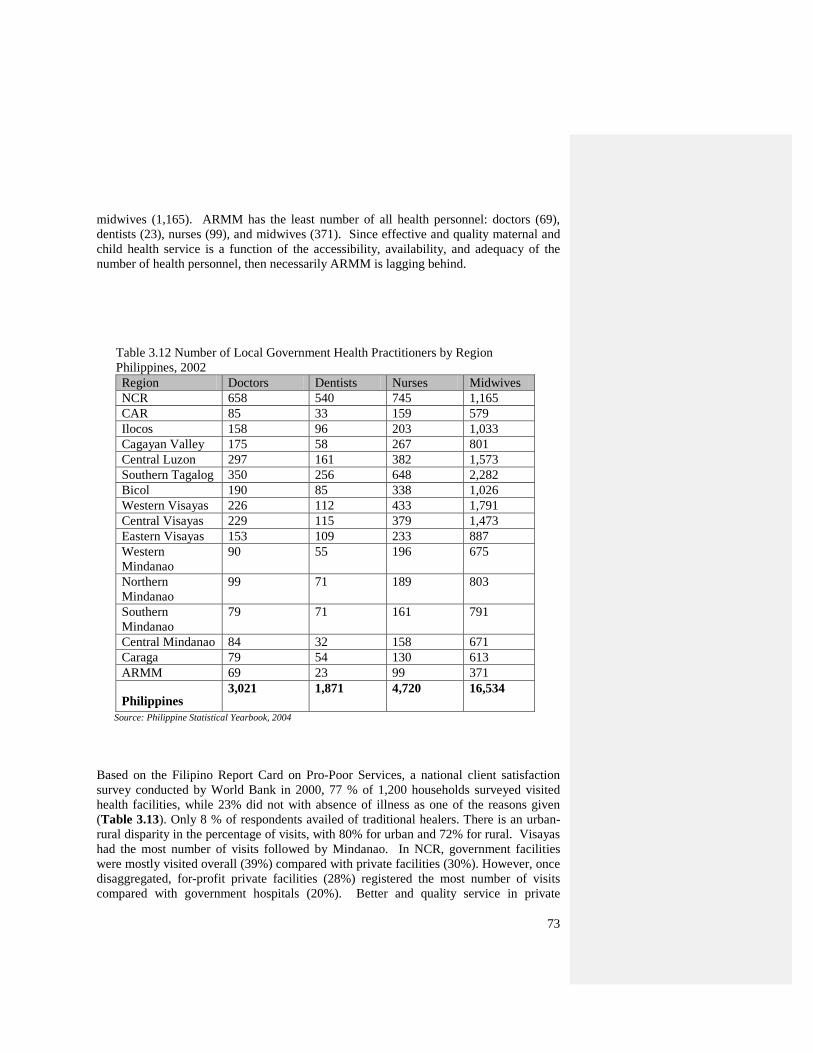
73
midwives (1,165). ARMM has the least number of all health personnel: doctors (69),
dentists (23), nurses (99), and midwives (371). Since effective and quality maternal and
child health service is a function of the accessibility, availability, and adequacy of the
number of health personnel, then necessarily ARMM is lagging behind.
Table 3.12 Number of Local Government Health Practitioners by Region
Philippines, 2002
Region Doctors Dentists Nurses Midwives
NCR 658 540 745 1,165
CAR 85 33 159 579
Ilocos 158 96 203 1,033
Cagayan Valley 175 58 267 801
Central Luzon 297 161 382 1,573
Southern Tagalog 350 256 648 2,282
Bicol 190 85 338 1,026
Western Visayas 226 112 433 1,791
Central Visayas 229 115 379 1,473
Eastern Visayas 153 109 233 887
Western
Mindanao
90 55 196 675
Northern
Mindanao
99 71 189 803
Southern
Mindanao
79 71 161 791
Central Mindanao 84 32 158 671
Caraga 79 54 130 613
ARMM 69 23 99 371
Philippines 3,021 1,871 4,720 16,534
Source: Philippine Statistical Yearbook, 2004
Based on the Filipino Report Card on Pro-Poor Services, a national client satisfaction
survey conducted by World Bank in 2000, 77 % of 1,200 households surveyed visited
health facilities, while 23% did not with absence of illness as one of the reasons given
(Table 3.13). Only 8 % of respondents availed of traditional healers. There is an urban-
rural disparity in the percentage of visits, with 80% for urban and 72% for rural. Visayas
had the most number of visits followed by Mindanao. In NCR, government facilities
were mostly visited overall (39%) compared with private facilities (30%). However, once
disaggregated, for-profit private facilities (28%) registered the most number of visits
compared with government hospitals (20%). Better and quality service in private
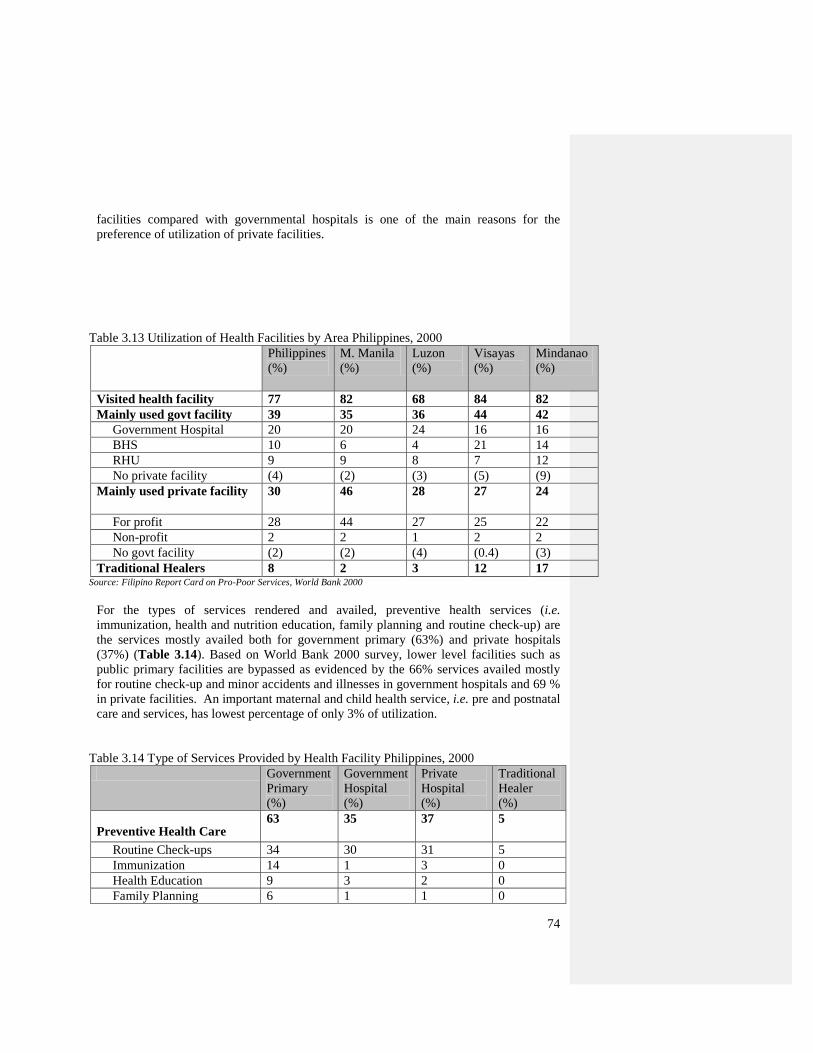
74
facilities compared with governmental hospitals is one of the main reasons for the
preference of utilization of private facilities.
Table 3.13 Utilization of Health Facilities by Area Philippines, 2000
Philippines
(%)
M. Manila
(%)
Luzon
(%)
Visayas
(%)
Mindanao
(%)
Visited health facility 77 82 68 84 82
Mainly used govt facility 39 35 36 44 42
Government Hospital 20 20 24 16 16
BHS 10 6 4 21 14
RHU 9 9 8 7 12
No private facility (4) (2) (3) (5) (9)
Mainly used private facility 30 46 28 27 24
For profit 28 44 27 25 22
Non-profit 2 2 1 2 2
No govt facility (2) (2) (4) (0.4) (3)
Traditional Healers 8 2 3 12 17 Source: Filipino Report Card on Pro-Poor Services, World Bank 2000
For the types of services rendered and availed, preventive health services (i.e.
immunization, health and nutrition education, family planning and routine check-up) are
the services mostly availed both for government primary (63%) and private hospitals
(37%) (Table 3.14). Based on World Bank 2000 survey, lower level facilities such as
public primary facilities are bypassed as evidenced by the 66% services availed mostly
for routine check-up and minor accidents and illnesses in government hospitals and 69 %
in private facilities. An important maternal and child health service, i.e. pre and postnatal
care and services, has lowest percentage of only 3% of utilization.
Table 3.14 Type of Services Provided by Health Facility Philippines, 2000
Government
Primary
(%)
Government
Hospital
(%)
Private
Hospital
(%)
Traditional
Healer
(%)
Preventive Health Care 63 35 37 5
Routine Check-ups 34 30 31 5
Immunization 14 1 3 0
Health Education 9 3 2 0
Family Planning 6 1 1 0
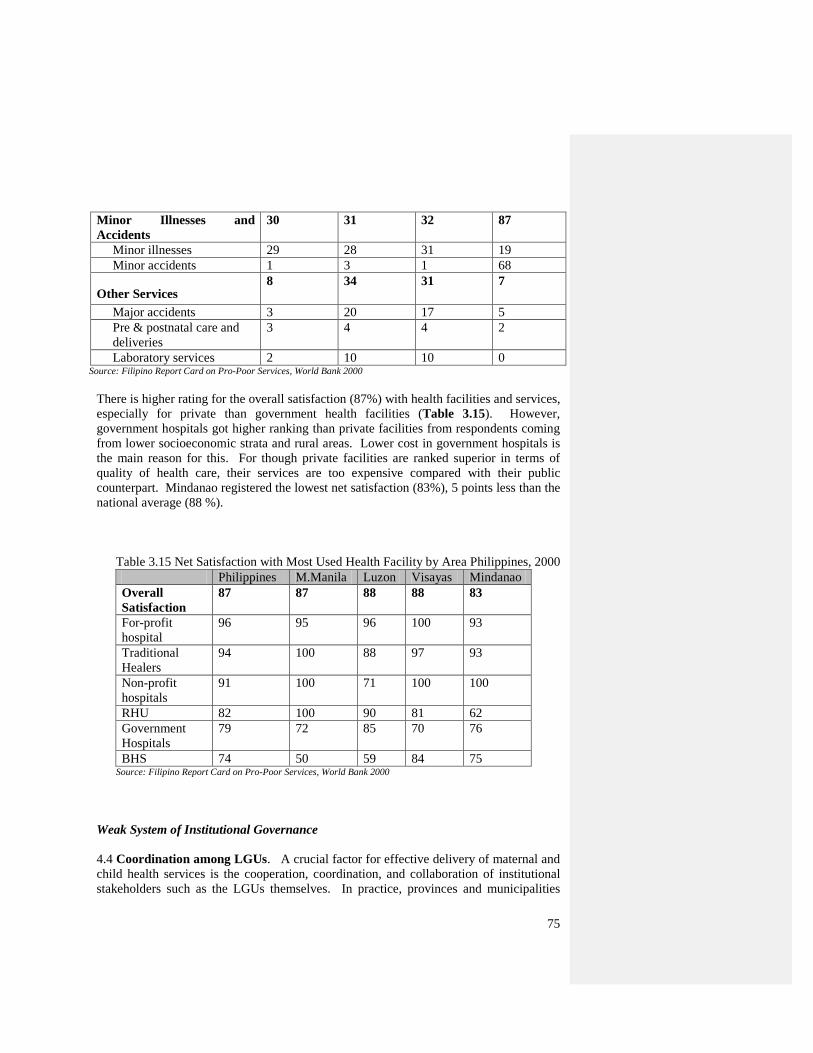
75
Minor Illnesses and
Accidents
30 31 32 87
Minor illnesses 29 28 31 19
Minor accidents 1 3 1 68
Other Services 8 34 31 7
Major accidents 3 20 17 5
Pre & postnatal care and
deliveries
3 4 4 2
Laboratory services 2 10 10 0 Source: Filipino Report Card on Pro-Poor Services, World Bank 2000
There is higher rating for the overall satisfaction (87%) with health facilities and services,
especially for private than government health facilities (Table 3.15). However,
government hospitals got higher ranking than private facilities from respondents coming
from lower socioeconomic strata and rural areas. Lower cost in government hospitals is
the main reason for this. For though private facilities are ranked superior in terms of
quality of health care, their services are too expensive compared with their public
counterpart. Mindanao registered the lowest net satisfaction (83%), 5 points less than the
national average (88 %).
Table 3.15 Net Satisfaction with Most Used Health Facility by Area Philippines, 2000
Philippines M.Manila Luzon Visayas Mindanao
Overall
Satisfaction
87 87 88 88 83
For-profit
hospital
96 95 96 100 93
Traditional
Healers
94 100 88 97 93
Non-profit
hospitals
91 100 71 100 100
RHU 82 100 90 81 62
Government
Hospitals
79 72 85 70 76
BHS 74 50 59 84 75 Source: Filipino Report Card on Pro-Poor Services, World Bank 2000
Weak System of Institutional Governance
4.4 Coordination among LGUs. A crucial factor for effective delivery of maternal and
child health services is the cooperation, coordination, and collaboration of institutional
stakeholders such as the LGUs themselves. In practice, provinces and municipalities
76
operate exclusively without common purpose and directions in operating within their
own part of the public health system. ―As a result, it has become more difficult to
achieve coordination of community-based, clinic-based and hospital based health services
serving common population within a geographic area. This situation prevents effective
triage, routinely appropriate referral, and cost-effective targeting of multi-level
interventions‖ (WHSMP: 58). Mechanisms to bridge the gaps in health governance and
operations between and among LGUs are necessary in view of the benefits of a well-
coordinated delivery system of maternal and child health services. The fact that LGUs are
at the forefront of service delivery makes this requirement no less immediate.
4.5 Lack of Institutional Capacities. An effective service delivery of maternal and
child health services requires enhanced institutional capacities of different levels of
government. Less than two decades after the devolution of health sector, the lack of such
capacities both of the LGUs and the DOH and its central and regional agencies is still a
problem. LGUs have been struggling to effectively deliver maternal and child services
in particular, and manage funding health care in general in spite of inadequate, if not lack,
of technical, financial, institutional, and managerial capacities. In the same vein, DOH
and its central and regional agencies as well as department representatives at the local
levels have yet to fulfill effectively and efficiently their devolved responsibilities of
policy-making, standard setting, and providing of technical, managerial, and institutional
assistance to LGUs. ―The post-devolution performance of DOH in project management
has been dismal. Many large projects were hobbled by symptoms of weak performance
such as slow start after approval, delayed decision-making, high incidence of poor quality
work and paralyzing organizational conflicts, among others. These symptoms led to a
cycle of lagging physical accomplishments and slow fund disbursement leading to
unwanted cutbacks in allocated investments and ultimately to failure to realize full
benefits from projects (WHSMP n.d: 58).‖ It is for these reasons that DOH has moved
into the Sector Development Approach for Health or the Sector-Wide Approach whereby,
among others, External Aid or Foreign Assisted Projects (FAPs) are mobilized and
implemented in full harmonization and alignment with the Health Sector Program which
has been branded as F1. Nonetheless, capacity-building for an improved implementation,
monitoring and evaluation of policies, programs, and projects related to maternal and
child health needs further improvement.
The institutional capacity deficit for an improved delivery of maternal and child health
services is a microcosm of a general problem in local delivery of better health service.
For the past 15-20 years, the best health programs in the Philippines are those that have
been provided by the central government, and the worst, are those by the LGUs.
Examples of the former are TB, malaria, EPI, and of the latter is iron provision. This
creates the impetus and the imperative to define critical public health functions which
should be the sole responsibility of the central government to ensure effectiveness, rather
than be left to the ―political discretion‖ of unaware and amateur LCEs. The lesson to be
learned is that if LGUs cannot perform the health functions assigned to them, then central
government must do something to address this; otherwise, the former will continue to fall
short of expectations as children and mothers die of preventable diseases. Congress, for
example, may legislate for clearly defining critical public health functions and those who
77
will be responsible to them. This will ensure transparency and accountability as the
assignment of functions will be clearly delineated, and those with specific responsibilities
be held accountable. In other words, the functions that should be devolved to the LGUs
and those to be handled by the DOH are those that they can better perform respectively,
but with the caveat that should the former falter in their performance, the latter should not
only provide the much-needed assistance, but also to redesign health devolution if need
be. Ergo, health decentralization would be about what LGUs and DOHs are capable of
effectively delivering within the context of expanded concept of right-based public health
good. The challenge therefore is to design health decentralization by building on the
capacities and capabilities of LGUs and DOH for optimum health benefit such as
maternal and child health services, especially to those who need them most – the Filipino
poor.
4.6 Active Involvement and Effective Leadership of Local Chief Executives (LCEs).
One key institutional actor that can make a big difference in fully realizing the benefits of
maternal and child health services is the LCE, either the governor or the mayor. But this
does not happen when the LCE, inter alia, (i) does not make maternal and child health
services in particular or public health in general as one of his/her priorities, (ii) demand
for capital funds to invest in expanded capacities of health services through improvement
of health facilities but does not increase operating budgets for these facilities, and (iii)
does not practice democratic governance in helping to strengthen LHBs through strong
and effective community participation by NGOs or local communities themselves, and
(iv) does not practice effective financial administration for improved health services by
not rationalizing the use of IRA and their own-source revenues, as well as tapping other
sources and harmonizing their effective use such as grants, loans, and donations. Absent
active involvement, effective leadership, political will, and enlarged sense of public
service, LCEs would be a liability than an asset in contributing to the fast reduction of
MMR and sustaining the gains in UM5R and IMR. For example, in health financing, if
the LCEs are not able, with NG not providing any technical and capacity-building
assistance, to estimate investments for children and mothers as a basis for targets in
revenue generation, then they would not be able to expand the fiscal space needed for
more resources to health services. Lack of idea of an ideal investment for maternal and
child health translates into lack of better financed maternal and child health services.
4.7 Too Much or Too Little Magna Carta Benefits? Human resource is key to
effective management and implementation of maternal and child health services.
Although the country produces more and better health human resource compared to other
Asian countries, being the lead global exporter of nurses (Aiken 2004) and second major
exporter of physicians (Bach 2003), these human resources are unevenly distributed in
the country. Most of them are in Metro Manila and urban centers. The exodus of skilled
nurses (85% of all Filipino nurses work in 46 countries), for example, including medical
doctors, compounds this regional disparity. RA 7305 or Magna Carta for Public Health
Workers is supposed to address these human resource issues to make these medical
professionals stay in the BHUs and RHUs, but the benefits seem not enough compared to
a work abroad or even compared to other LGUs and regions in the country. At present the
Magna Carta benefits are:
78
97% to 98% of municipalities provide subsistence and laundry allowance,
87% of municipalities provide representation and travel allowance,
22% of municipalities provide hazard pay, 11% provide medico-legal and
longevity allowances,
1.5% provide remote assignment pay,
Not all LGUs that provide Magna Carta benefits provide them in full,
Practically, all municipalities, regardless of income class, provide subsistence and
laundry allowances (Gako 2007:60-61)
Other issues and challenges that must be addressed include: (i) full implementation of the
Magna Carta benefits not only by public health workers of the central office of the DOH
but also its regional hospitals, (ii) balancing the funding of Magna Carta benefits out of
MOOE and the timely and effective provision of medical care activities/programs and
medical supplies, (iii) unequal provision of Magna Carta benefits (e.g. hazard allowance
of medical personnel) based on the hospitals‘ ability to generate savings and unfair
prioritization, (iv) uneven provision in the release of benefits which hinges on the ability
to generate income (e.g. monthly release of hazard allowance of specialty hospitals unlike
the quarterly basis for DOH central office personnel), and (v) inconsistency in applying
RA 7305 on paying for on call status only when actual service is rendered, not the ―on
call‖ pay equivalent to fifty percent of the medical personnel‘s regular wage as provided
for in the law (Garcia and Cabegin 2008: 30-31).
4.8 The Contentious Role of TBAs. The government has utilized a two-pronged
strategy in addressing maternal health concerns, i.e. safe motherhood and reproductive
health services. In its commitment to reduce MMR, it has adopted a paradigm shift in
childbirth, from the ―risk approach‖ (which considers all high-risk pregnancies for
referral during prenatal period) to the ―EmOC approach‖ (which considers all
pregnancies to be high-risk). This paradigm shift has also entailed a policy shift from
promoting home-based childbirth delivery to facility-based delivery. As this policy has
been issued very recently, TBAs have still been attending childbirths.
. Considered to be older women and illiterate (UNFPA 1997), the World Health
Organization defines a TBA as a ―person who assists the mother during childbirth and
who initially acquired skills by delivering babies herself or by working with other TBAs
(Ledham 1985).‖ Despite attendance to TBA training, they are still unable to comply
with basic standards of quality care; instead, they can only provide some basic essential
obstetric care services. Also, TBAs, like Barangay Health Workers (BHWs), are not
allowed to dispense iron supplements, but can only replenish iron tablets supply subject
to instructions and supervision by public health nurse or physician. Further, ―there is
mounting scientific evidence that some time-honored traditional interventions such as
provision of antenatal care and TBA training are not effective linkages with emergency
obstetric care services‖ (WHSMP2: 9). Moreover, TBAs are found to have no skills in
lifesaving, and therefore cannot be relied upon in dealing with life-threatening cases such
as hemorrhage, eclampsia or obstructed labor.
79
The continued attendance of TBAs in childbirths around the country not only makes
national practice at variance with international practice of requiring skilled attendants at
birth (nurse, doctor, midwives), but also puts every pregnant woman at risk. Reliance on
TBAs usually causes delay in referral for a pregnant woman to be in the care of a reliable
health facility such as BEmOC and CEmOC depending on the degree of health risks.
However, reliance on TBAs is the poor woman‘s only alternative for delivery. Unless the
government creates mechanisms on how to enlighten women about the limitations of
TBAs, helps create livelihood to uplift their standard of living and level of health
consciousness, empowers them to demand for quality health care, and makes BeMocs
accessible to all women, then the poor women would always be left with no choice but to
settle with TBAs and home-based delivery. This should not be interpreted as highlighting
the need to strengthen the capacities of TBA rather than expending resources on
sidestepping them.
80
CHAPTER 4
Policy and Institutional Analysis: Potable Water
1. Policy and Legislative Framework
1.1 1987 Philippine Constitution. Although not directly specifying the state‘s duty on
water supply, Section 16, Article II of the 1987 Philippine Constitution mandates a
relevant provision on the people‘s right to a balanced and healthy ecology, to wit:
SEC 16. The state shall protect and advance the right of the people to a balanced
and healthful ecology in accord with the rhythm and harmony of nature.
Correlative with the state‘s duty for the people‘s right to a balanced and healthy ecology
is the people‘s right to safe water supply both as a public good and an economic good. As
a public good, water is treated as a means to sustainable human development and well-
being. And as an economic good, water has a price tag, based on production and
distribution costs for example, either by the government or private sectors for human
consumption. Also, as an economic good, water is a crucial factor for the country‘s
socioeconomic development and global competitiveness. Viewed as such, the state‘s
duty therefore should be based on this rights-based treatment of water, that is, both as a
public good and an economic good.
1.2 1991 Local Government Code. The 1991 LGC mandates the sharing of
responsibility (i) in providing basic services such as water supply, sanitation, and flood
control, (ii) in being responsible for infrastructure facilities such as waterworks, drainage
and sewerage, irrigation systems, and (iii) in enforcing sanitation and potable water-
related laws. Sec. 17 of the 1991 LGC mandates provision of potable water supply and
sanitation, as well as water-related services and facilities: (i) For a Barangay: the mandate
is to maintain roads and bridges and water supply systems; (ii) For a Municipality and
City: the mandate is to be responsible for infrastructure facilities that will be financed
through city/municipal funds which include small water impounding projects, artesian
wells, spring development, rainwater collectors and water supply systems; seawalls,
dikes, drainage and sewerage, flood control; inter-barangay irrigation systems; and water
resources utilization and conservation projects (iii) For a Province: the mandate is to be
responsible for infrastructure facilities intended to serve the needs of the residents of the
81
province that are financed through provincial funds such as inter-municipal waterworks,
drainage and sewerage, flood control, and irrigation systems (LGC 1991: 8-9). The 1991
LGC also mandates LGUs to undertake watershed-related activities that used to be
confined to community-based management, social forestry and watershed projects. The
role of the barangays depends on the discretion of the LGU executives. Further, GOCCs
have to consult LGUs for the purpose of establishing safeguards for environmental
sustainability.
In this devolved set-up, the mandated roles and responsibilities of the national
government through its line agencies (primarily National Water Resources Board or
NWRB and Local Water Utilities Administration or LWUA) are, inter alia: policy
formulation, directives issuance, standard-setting, economic regulator (for NWRB),
technical, financial assistance / loan guarantor, and institutional development (for
LWUA), and financial assistance (for Municipal Development Fund Office,
Development Bank of the Philippines, and Land Bank of the Philippines).
1.3 Water Supply-Related Laws and Issuances. There are laws and issuances that
pertain to water supply per se, the establishment of institutions for its provision,
distribution, and regulation, and those that have to do with sanitation.
For the laws on institutions related to water supply, these are: RA 6234 of 1971 for
abolishing National Waterworks and Sewerage Authority (NAWASA), creating of
MWSS, and making it responsible for water supply in Metro Manila (which was
privatized in 1997 under a 25-year concession contract with MWSI and MWCI); PD 198
(Provincial Water Utilities Act of 1973) for establishing of local water districts (WDs)
and creating LWUA as a specialized lending institution responsible for resource,
technical, institutional development, and financing assistance to water districts; PD 424
of 1974 for creating the National Water Resources Council (NWRC), now NWRB),
attaching it to DPWH, and mandating it to be responsible in coordinating, planning, and
integrating of 30 water government‘s resource agencies in particular and water resource
development and management in general.
For the specific water codes, these include: PD 1067 of 1976 (Water Code of the
Philippines) for providing an implementation framework for the constitutional provisions
on water resources development and water quality management, and RA 9275 (Philippine
Clean Water Act of 2004) for providing for comprehensive water quality management
and consolidating the fragmented Philippine laws on water resources management,
quality control, and sanitation.
For laws on sanitation and pollution control, some of these are: PD 856 (Sanitation Code
of the Philippines of 1975) for codifying and enforcing the numerous sanitation policies
of the government such as standards for water supply; PD 1096 (National Building Code
of 1977) for requiring connection of new buildings to a waterborne sewerage system; PD
1151 of 1978 (Environmental Policy) for recognizing the right of the people to a healthy
environment; PD 1586 of 1978 (Environmental Impact Statement System) for mandating
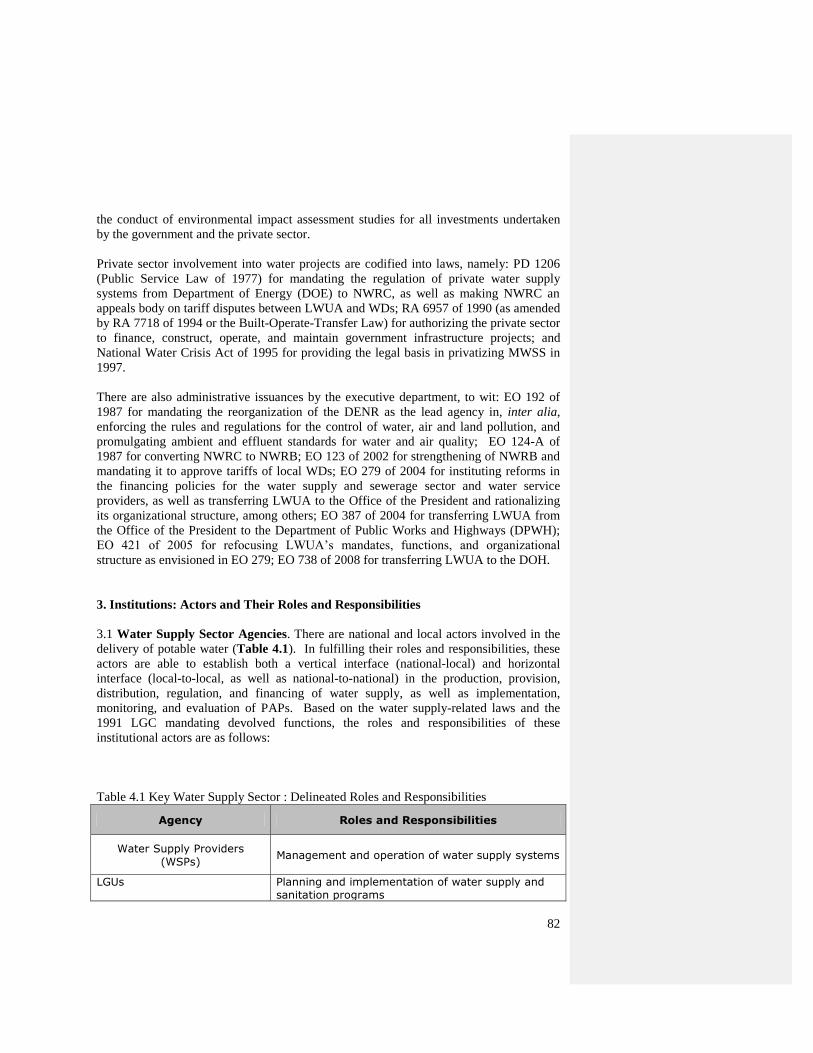
82
the conduct of environmental impact assessment studies for all investments undertaken
by the government and the private sector.
Private sector involvement into water projects are codified into laws, namely: PD 1206
(Public Service Law of 1977) for mandating the regulation of private water supply
systems from Department of Energy (DOE) to NWRC, as well as making NWRC an
appeals body on tariff disputes between LWUA and WDs; RA 6957 of 1990 (as amended
by RA 7718 of 1994 or the Built-Operate-Transfer Law) for authorizing the private sector
to finance, construct, operate, and maintain government infrastructure projects; and
National Water Crisis Act of 1995 for providing the legal basis in privatizing MWSS in
1997.
There are also administrative issuances by the executive department, to wit: EO 192 of
1987 for mandating the reorganization of the DENR as the lead agency in, inter alia,
enforcing the rules and regulations for the control of water, air and land pollution, and
promulgating ambient and effluent standards for water and air quality; EO 124-A of
1987 for converting NWRC to NWRB; EO 123 of 2002 for strengthening of NWRB and
mandating it to approve tariffs of local WDs; EO 279 of 2004 for instituting reforms in
the financing policies for the water supply and sewerage sector and water service
providers, as well as transferring LWUA to the Office of the President and rationalizing
its organizational structure, among others; EO 387 of 2004 for transferring LWUA from
the Office of the President to the Department of Public Works and Highways (DPWH);
EO 421 of 2005 for refocusing LWUA‘s mandates, functions, and organizational
structure as envisioned in EO 279; EO 738 of 2008 for transferring LWUA to the DOH.
3. Institutions: Actors and Their Roles and Responsibilities
3.1 Water Supply Sector Agencies. There are national and local actors involved in the
delivery of potable water (Table 4.1). In fulfilling their roles and responsibilities, these
actors are able to establish both a vertical interface (national-local) and horizontal
interface (local-to-local, as well as national-to-national) in the production, provision,
distribution, regulation, and financing of water supply, as well as implementation,
monitoring, and evaluation of PAPs. Based on the water supply-related laws and the
1991 LGC mandating devolved functions, the roles and responsibilities of these
institutional actors are as follows:
Table 4.1 Key Water Supply Sector : Delineated Roles and Responsibilities
Agency Roles and Responsibilities
Water Supply Providers
(WSPs) Management and operation of water supply systems
LGUs Planning and implementation of water supply and
sanitation programs
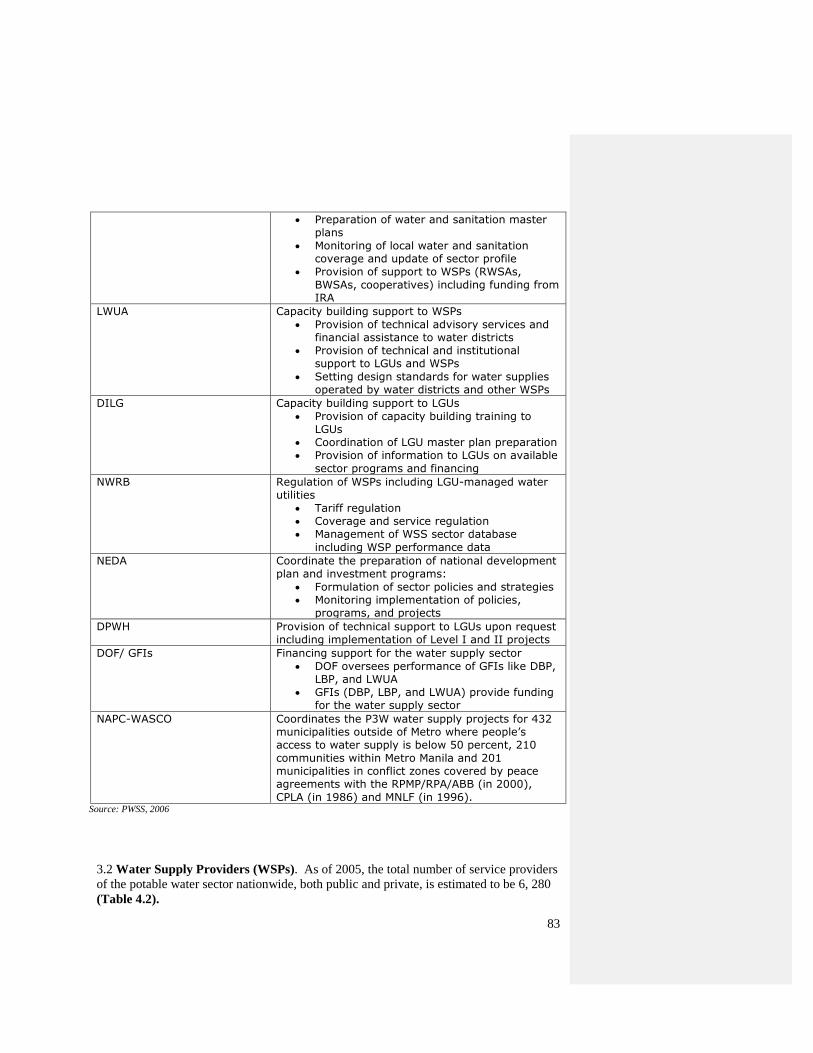
83
Preparation of water and sanitation master
plans
Monitoring of local water and sanitation coverage and update of sector profile
Provision of support to WSPs (RWSAs,
BWSAs, cooperatives) including funding from
IRA
LWUA Capacity building support to WSPs
Provision of technical advisory services and
financial assistance to water districts
Provision of technical and institutional
support to LGUs and WSPs
Setting design standards for water supplies
operated by water districts and other WSPs
DILG Capacity building support to LGUs
Provision of capacity building training to LGUs
Coordination of LGU master plan preparation Provision of information to LGUs on available
sector programs and financing
NWRB Regulation of WSPs including LGU-managed water
utilities
Tariff regulation
Coverage and service regulation
Management of WSS sector database
including WSP performance data
NEDA Coordinate the preparation of national development
plan and investment programs:
Formulation of sector policies and strategies Monitoring implementation of policies,
programs, and projects
DPWH Provision of technical support to LGUs upon request
including implementation of Level I and II projects
DOF/ GFIs Financing support for the water supply sector
DOF oversees performance of GFIs like DBP, LBP, and LWUA
GFIs (DBP, LBP, and LWUA) provide funding for the water supply sector
NAPC-WASCO Coordinates the P3W water supply projects for 432 municipalities outside of Metro where people’s
access to water supply is below 50 percent, 210
communities within Metro Manila and 201
municipalities in conflict zones covered by peace
agreements with the RPMP/RPA/ABB (in 2000),
CPLA (in 1986) and MNLF (in 1996). Source: PWSS, 2006
3.2 Water Supply Providers (WSPs). As of 2005, the total number of service providers
of the potable water sector nationwide, both public and private, is estimated to be 6, 280
(Table 4.2).
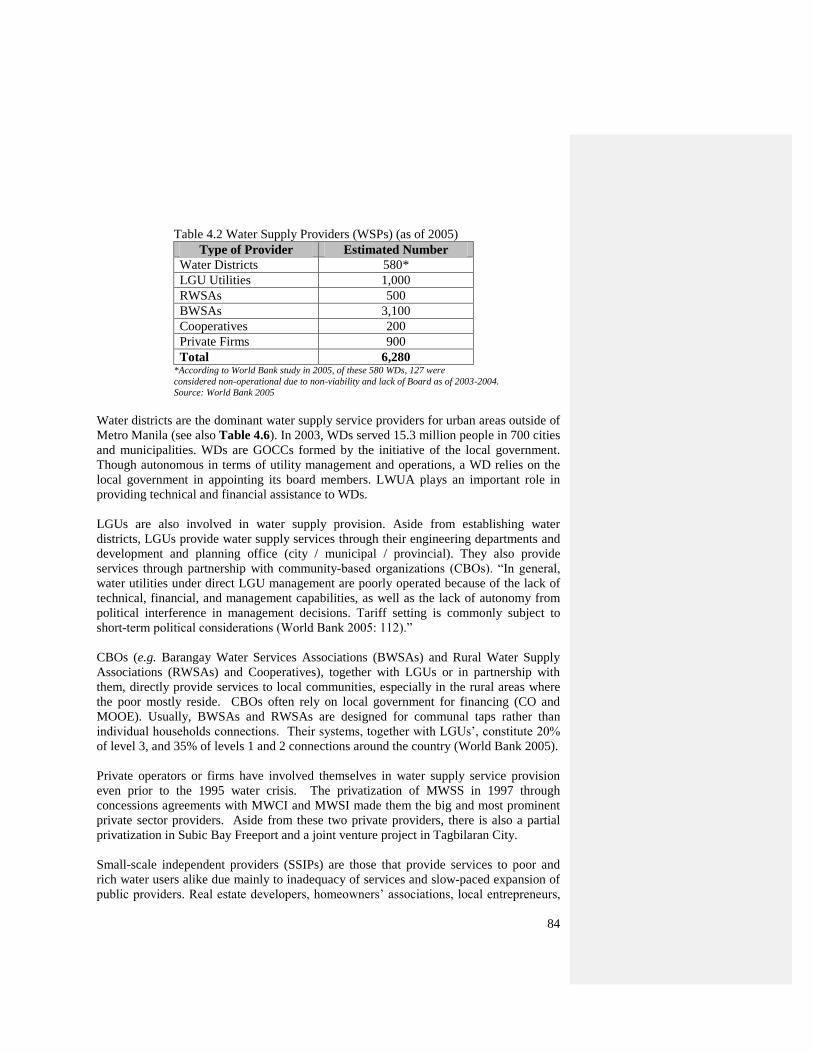
84
Table 4.2 Water Supply Providers (WSPs) (as of 2005)
Type of Provider Estimated Number
Water Districts 580*
LGU Utilities 1,000
RWSAs 500
BWSAs 3,100
Cooperatives 200
Private Firms 900
Total 6,280 *According to World Bank study in 2005, of these 580 WDs, 127 were
considered non-operational due to non-viability and lack of Board as of 2003-2004.
Source: World Bank 2005
Water districts are the dominant water supply service providers for urban areas outside of
Metro Manila (see also Table 4.6). In 2003, WDs served 15.3 million people in 700 cities
and municipalities. WDs are GOCCs formed by the initiative of the local government.
Though autonomous in terms of utility management and operations, a WD relies on the
local government in appointing its board members. LWUA plays an important role in
providing technical and financial assistance to WDs.
LGUs are also involved in water supply provision. Aside from establishing water
districts, LGUs provide water supply services through their engineering departments and
development and planning office (city / municipal / provincial). They also provide
services through partnership with community-based organizations (CBOs). ―In general,
water utilities under direct LGU management are poorly operated because of the lack of
technical, financial, and management capabilities, as well as the lack of autonomy from
political interference in management decisions. Tariff setting is commonly subject to
short-term political considerations (World Bank 2005: 112).‖
CBOs (e.g. Barangay Water Services Associations (BWSAs) and Rural Water Supply
Associations (RWSAs) and Cooperatives), together with LGUs or in partnership with
them, directly provide services to local communities, especially in the rural areas where
the poor mostly reside. CBOs often rely on local government for financing (CO and
MOOE). Usually, BWSAs and RWSAs are designed for communal taps rather than
individual households connections. Their systems, together with LGUs‘, constitute 20%
of level 3, and 35% of levels 1 and 2 connections around the country (World Bank 2005).
Private operators or firms have involved themselves in water supply service provision
even prior to the 1995 water crisis. The privatization of MWSS in 1997 through
concessions agreements with MWCI and MWSI made them the big and most prominent
private sector providers. Aside from these two private providers, there is also a partial
privatization in Subic Bay Freeport and a joint venture project in Tagbilaran City.
Small-scale independent providers (SSIPs) are those that provide services to poor and
rich water users alike due mainly to inadequacy of services and slow-paced expansion of
public providers. Real estate developers, homeowners‘ associations, local entrepreneurs,
85
and mobile water truckers and haulers comprise SSIPs. The market size share of SSIPs is
inestimable because of lack of data. However, it is estimated that 30% of the population
of Metro Manila depended on SSIPs in 1996, while about 30% of the 1.5 million
population of Cebu is served by SSIPs (David and Inocencio 2001, McIntosh 2003,
World Bank 2005: 116).
Household self-providers are those who resort to self-provision for lack of access to
formal water system due to low income. Depending on their income, they use either
shallow well (for the poor) or deep wells (for those with higher incomes). Comprising
20-30% of the population, they constitute 20% of the market size in urban areas and 25%
in rural areas together with SSIPs (World Bank 2005).
4. Key Strategies and Programs
4.1. Medium-Term Philippine Development Plan (MTPDP) 2004-2010. The
government recognizes potable water supply as a key factor for human development and
economic sustainability. It commits itself to realizing potable water supply for the entire
country by 2010 through specific strategies as laid down in the MTPDP 2004-2010.
These specific strategies are the following: (i) making potable water available nationwide
by 2010 through P3W, with priority given to at least 200 ―waterless‖ barangays in Metro
Manila and 200 ―waterless‖ municipalities in conflict zones outside of Metro Manila
through private sector or public investment; (ii) ensuring that the LGUs that will be
provided with water supply services will also have sanitation facilities; (iii) continuing to
provide capacity building programs and technical assistance to WSPs that need assistance
on WATSAN planning, management, and project implementation; (iv) developing and
managing technology options for water supply such as solar desalination for isolated
islands, windmill technology, etc.; (v) promote private-public partnerships (PPPs) for
increased investment in water provision to waterless LGUs, especially remote barangays
and municipalities; (vi) conducting and assessing groundwater resources and
vulnerability for 310 priority LGUs; (vii) monitoring of potable water of select poor
communities through Tap Watch Program; (viii) completing ―the groundwater resource
inventory/assessment in major urban areas and surface water in rural areas, control
extraction through moratorium/stringent requirements in the grant of water permits in
water-deficient areas and complete registration of all water pumps, metering of water
pumps, etc. (MTPDP 2004: 53).‖
4.2 Potable Water Supply Programs. Based on 2007 Midterm Progress Report on the
MDGs, the government prioritizes five PAPs as measures in addressing the water issues
and concerns, primarily on waterlessness of some barangays and municipalities. These
PAPs are: (i) focusing on waterless areas, (ii) establishment of groundwater monitoring
system, (iii) provision of safe drinking water by installing low cost water supply, (iv)
conservation of water for sustainable water quality and supply, and (v) development
/construction of low-cost sanitation facilities.
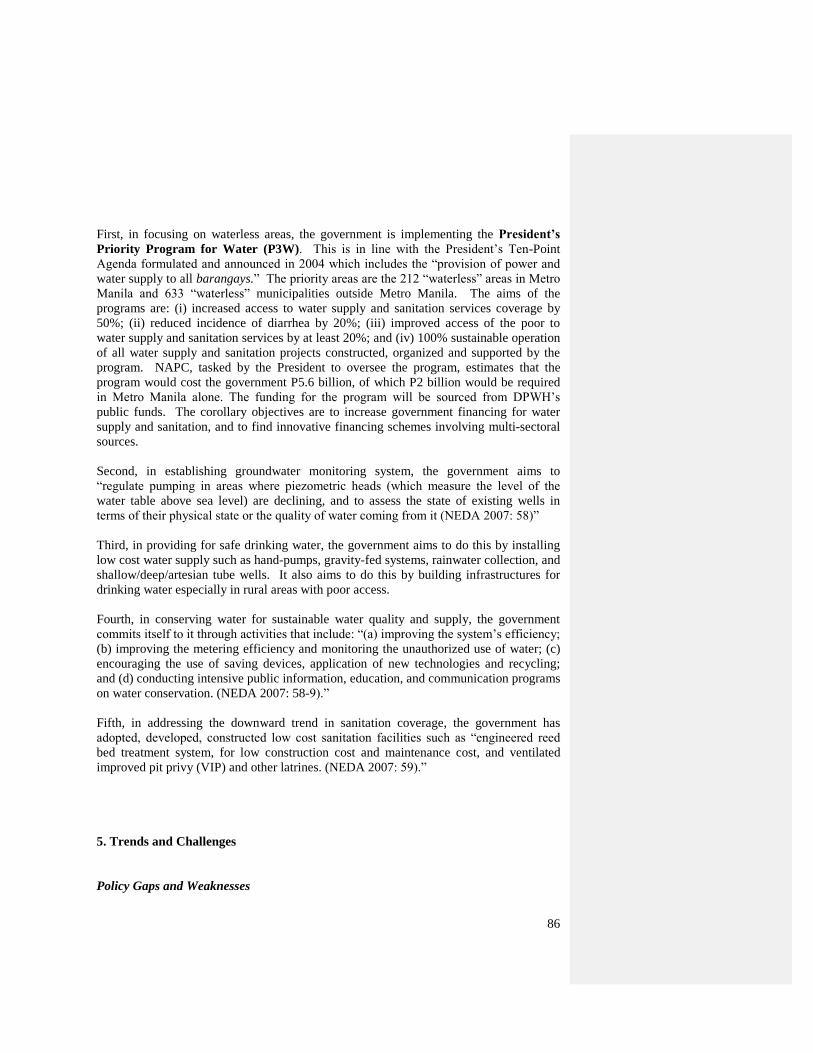
86
First, in focusing on waterless areas, the government is implementing the President’s
Priority Program for Water (P3W). This is in line with the President‘s Ten-Point
Agenda formulated and announced in 2004 which includes the ―provision of power and
water supply to all barangays.‖ The priority areas are the 212 ―waterless‖ areas in Metro
Manila and 633 ―waterless‖ municipalities outside Metro Manila. The aims of the
programs are: (i) increased access to water supply and sanitation services coverage by
50%; (ii) reduced incidence of diarrhea by 20%; (iii) improved access of the poor to
water supply and sanitation services by at least 20%; and (iv) 100% sustainable operation
of all water supply and sanitation projects constructed, organized and supported by the
program. NAPC, tasked by the President to oversee the program, estimates that the
program would cost the government P5.6 billion, of which P2 billion would be required
in Metro Manila alone. The funding for the program will be sourced from DPWH‘s
public funds. The corollary objectives are to increase government financing for water
supply and sanitation, and to find innovative financing schemes involving multi-sectoral
sources.
Second, in establishing groundwater monitoring system, the government aims to
―regulate pumping in areas where piezometric heads (which measure the level of the
water table above sea level) are declining, and to assess the state of existing wells in
terms of their physical state or the quality of water coming from it (NEDA 2007: 58)‖
Third, in providing for safe drinking water, the government aims to do this by installing
low cost water supply such as hand-pumps, gravity-fed systems, rainwater collection, and
shallow/deep/artesian tube wells. It also aims to do this by building infrastructures for
drinking water especially in rural areas with poor access.
Fourth, in conserving water for sustainable water quality and supply, the government
commits itself to it through activities that include: ―(a) improving the system‘s efficiency;
(b) improving the metering efficiency and monitoring the unauthorized use of water; (c)
encouraging the use of saving devices, application of new technologies and recycling;
and (d) conducting intensive public information, education, and communication programs
on water conservation. (NEDA 2007: 58-9).‖
Fifth, in addressing the downward trend in sanitation coverage, the government has
adopted, developed, constructed low cost sanitation facilities such as ―engineered reed
bed treatment system, for low construction cost and maintenance cost, and ventilated
improved pit privy (VIP) and other latrines. (NEDA 2007: 59).‖
5. Trends and Challenges
Policy Gaps and Weaknesses
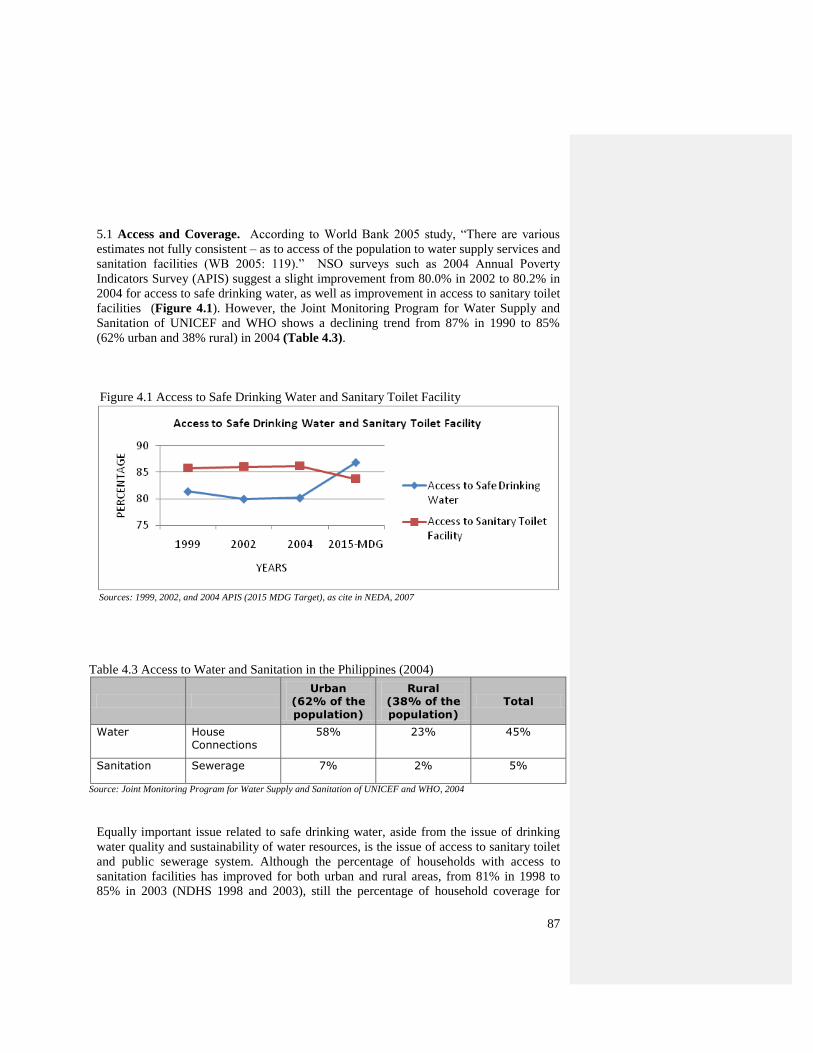
87
5.1 Access and Coverage. According to World Bank 2005 study, ―There are various
estimates not fully consistent – as to access of the population to water supply services and
sanitation facilities (WB 2005: 119).‖ NSO surveys such as 2004 Annual Poverty
Indicators Survey (APIS) suggest a slight improvement from 80.0% in 2002 to 80.2% in
2004 for access to safe drinking water, as well as improvement in access to sanitary toilet
facilities (Figure 4.1). However, the Joint Monitoring Program for Water Supply and
Sanitation of UNICEF and WHO shows a declining trend from 87% in 1990 to 85%
(62% urban and 38% rural) in 2004 (Table 4.3).
Figure 4.1 Access to Safe Drinking Water and Sanitary Toilet Facility
Sources: 1999, 2002, and 2004 APIS (2015 MDG Target), as cite in NEDA, 2007
Table 4.3 Access to Water and Sanitation in the Philippines (2004)
Urban
(62% of the
population)
Rural
(38% of the
population)
Total
Water House
Connections
58% 23% 45%
Sanitation Sewerage 7% 2% 5%
Source: Joint Monitoring Program for Water Supply and Sanitation of UNICEF and WHO, 2004
Equally important issue related to safe drinking water, aside from the issue of drinking
water quality and sustainability of water resources, is the issue of access to sanitary toilet
and public sewerage system. Although the percentage of households with access to
sanitation facilities has improved for both urban and rural areas, from 81% in 1998 to
85% in 2003 (NDHS 1998 and 2003), still the percentage of household coverage for
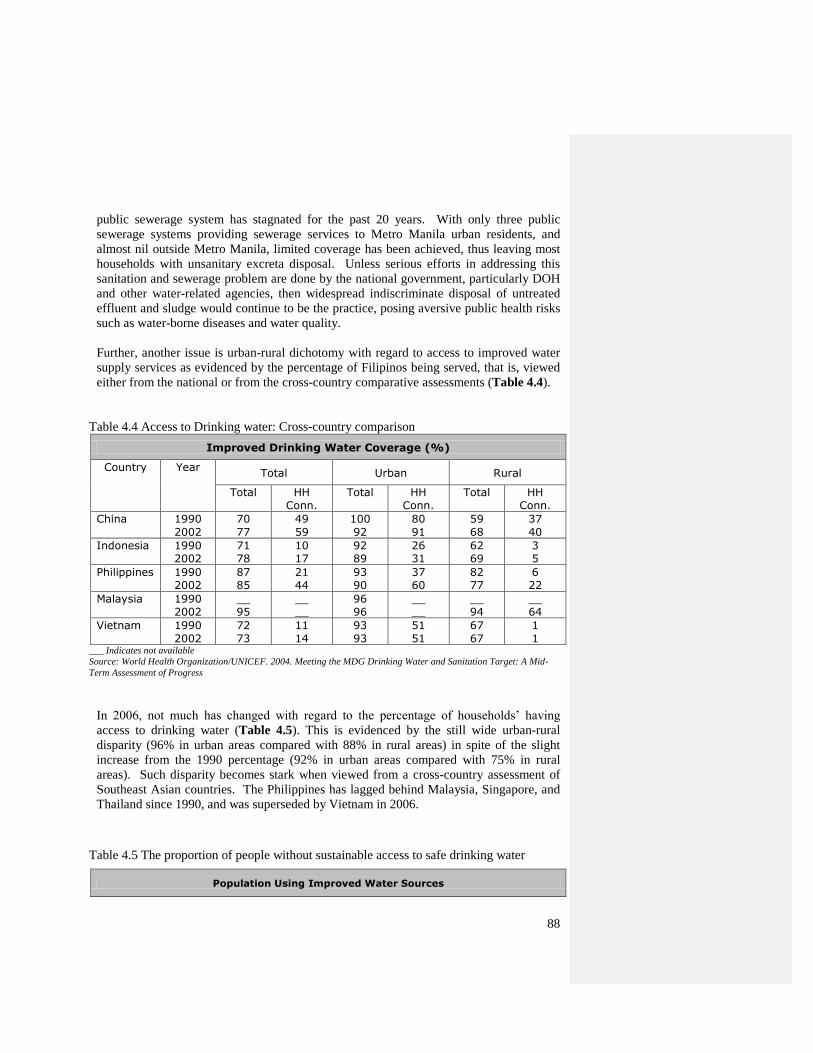
88
public sewerage system has stagnated for the past 20 years. With only three public
sewerage systems providing sewerage services to Metro Manila urban residents, and
almost nil outside Metro Manila, limited coverage has been achieved, thus leaving most
households with unsanitary excreta disposal. Unless serious efforts in addressing this
sanitation and sewerage problem are done by the national government, particularly DOH
and other water-related agencies, then widespread indiscriminate disposal of untreated
effluent and sludge would continue to be the practice, posing aversive public health risks
such as water-borne diseases and water quality.
Further, another issue is urban-rural dichotomy with regard to access to improved water
supply services as evidenced by the percentage of Filipinos being served, that is, viewed
either from the national or from the cross-country comparative assessments (Table 4.4).
Table 4.4 Access to Drinking water: Cross-country comparison
Improved Drinking Water Coverage (%)
Country Year Total Urban Rural
Total HH
Conn.
Total HH
Conn.
Total HH
Conn.
China 1990
2002
70
77
49
59
100
92
80
91
59
68
37
40
Indonesia 1990
2002
71
78
10
17
92
89
26
31
62
69
3
5
Philippines 1990
2002
87
85
21
44
93
90
37
60
82
77
6
22
Malaysia 1990
2002
__
95
__
__
96
96
__
__
__
94
__
64
Vietnam 1990
2002
72
73
11
14
93
93
51
51
67
67
1
1 ___ Indicates not available
Source: World Health Organization/UNICEF. 2004. Meeting the MDG Drinking Water and Sanitation Target: A Mid-
Term Assessment of Progress
In 2006, not much has changed with regard to the percentage of households‘ having
access to drinking water (Table 4.5). This is evidenced by the still wide urban-rural
disparity (96% in urban areas compared with 88% in rural areas) in spite of the slight
increase from the 1990 percentage (92% in urban areas compared with 75% in rural
areas). Such disparity becomes stark when viewed from a cross-country assessment of
Southeast Asian countries. The Philippines has lagged behind Malaysia, Singapore, and
Thailand since 1990, and was superseded by Vietnam in 2006.
Table 4.5 The proportion of people without sustainable access to safe drinking water
Population Using Improved Water Sources
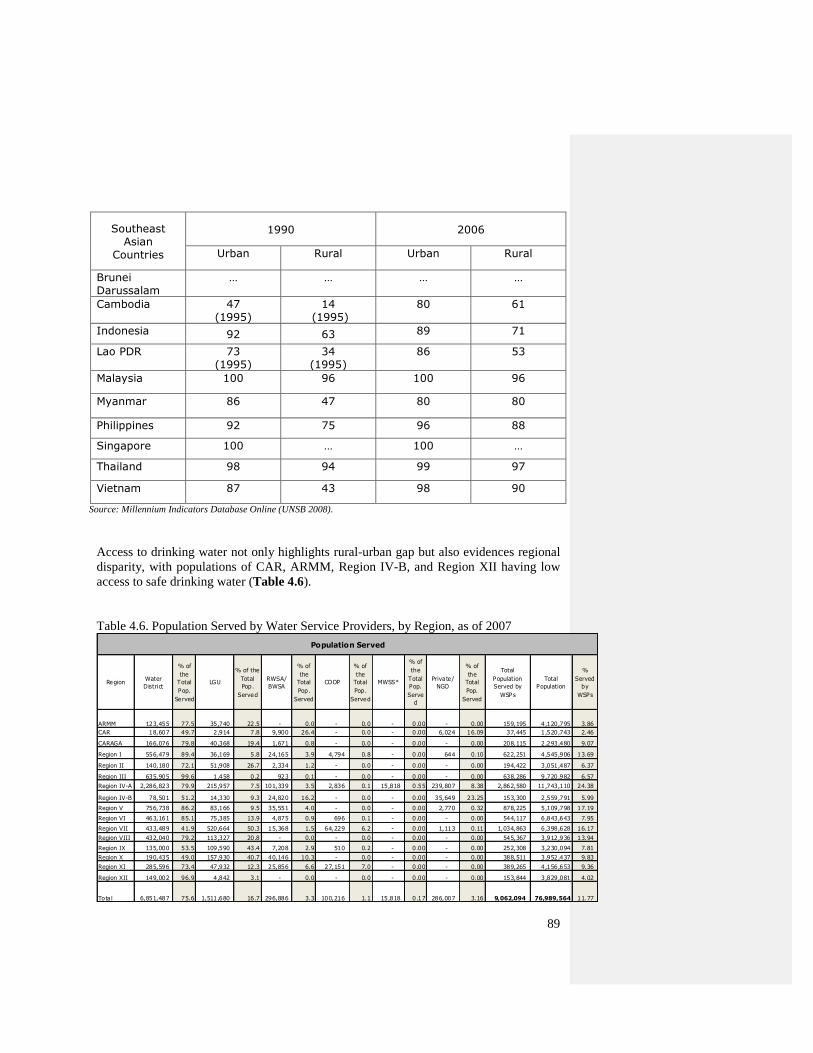
89
Southeast
Asian
Countries
1990 2006
Urban Rural Urban Rural
Brunei
Darussalam
… … … …
Cambodia 47
(1995)
14
(1995)
80 61
Indonesia 92 63 89 71
Lao PDR 73
(1995)
34
(1995)
86 53
Malaysia 100 96 100 96
Myanmar 86 47 80 80
Philippines 92 75 96 88
Singapore 100 … 100 …
Thailand 98 94 99 97
Vietnam 87 43 98 90
Source: Millennium Indicators Database Online (UNSB 2008).
Access to drinking water not only highlights rural-urban gap but also evidences regional
disparity, with populations of CAR, ARMM, Region IV-B, and Region XII having low
access to safe drinking water (Table 4.6).
Table 4.6. Population Served by Water Service Providers, by Region, as of 2007
RegionWater
District
% of
the
Total
Pop.
Served
LGU
% of the
Total
Pop.
Served
RWSA/
BWSA
% of
the
Total
Pop.
Served
COOP
% of
the
Total
Pop.
Served
MWSS*
% of
the
Total
Pop.
Serve
d
Private/
NGO
% of
the
Total
Pop.
Served
Total
Population
Served by
WSPs
Total
Population
%
Served
by
WSPs
ARMM 123,455 77.5 35,740 22.5 - 0.0 - 0.0 - 0.00 - 0.00 159,195 4,120,795 3.86
CAR 18,607 49.7 2,914 7.8 9,900 26.4 - 0.0 - 0.00 6,024 16.09 37,445 1,520,743 2.46
CARAGA 166,076 79.8 40,368 19.4 1,671 0.8 - 0.0 - 0.00 - 0.00 208,115 2,293,480 9.07
Region I 556,479 89.4 36,169 5.8 24,165 3.9 4,794 0.8 - 0.00 644 0.10 622,251 4,545,906 13.69
Region II 140,180 72.1 51,908 26.7 2,334 1.2 - 0.0 - 0.00 - 0.00 194,422 3,051,487 6.37
Region III 635,905 99.6 1,458 0.2 923 0.1 - 0.0 - 0.00 - 0.00 638,286 9,720,982 6.57
Region IV-A 2,286,823 79.9 215,957 7.5 101,339 3.5 2,836 0.1 15,818 0.55 239,807 8.38 2,862,580 11,743,110 24.38
Region IV-B 78,501 51.2 14,330 9.3 24,820 16.2 - 0.0 - 0.00 35,649 23.25 153,300 2,559,791 5.99
Region V 756,738 86.2 83,166 9.5 35,551 4.0 - 0.0 - 0.00 2,770 0.32 878,225 5,109,798 17.19
Region VI 463,161 85.1 75,385 13.9 4,875 0.9 696 0.1 - 0.00 - 0.00 544,117 6,843,643 7.95
Region VII 433,489 41.9 520,664 50.3 15,368 1.5 64,229 6.2 - 0.00 1,113 0.11 1,034,863 6,398,628 16.17
Region VIII 432,040 79.2 113,327 20.8 - 0.0 - 0.0 - 0.00 - 0.00 545,367 3,912,936 13.94
Region IX 135,000 53.5 109,590 43.4 7,208 2.9 510 0.2 - 0.00 - 0.00 252,308 3,230,094 7.81
Region X 190,435 49.0 157,930 40.7 40,146 10.3 - 0.0 - 0.00 - 0.00 388,511 3,952,437 9.83
Region XI 285,596 73.4 47,932 12.3 25,856 6.6 27,151 7.0 - 0.00 - 0.00 389,265 4,156,653 9.36
Region XII 149,002 96.9 4,842 3.1 - 0.0 - 0.0 - 0.00 - 0.00 153,844 3,829,081 4.02
Total 6,851,487 75.6 1,511,680 16.7 296,886 3.3 100,216 1.1 15,818 0.17 286,007 3.16 9,062,094 76,989,564 11.77
Population Served
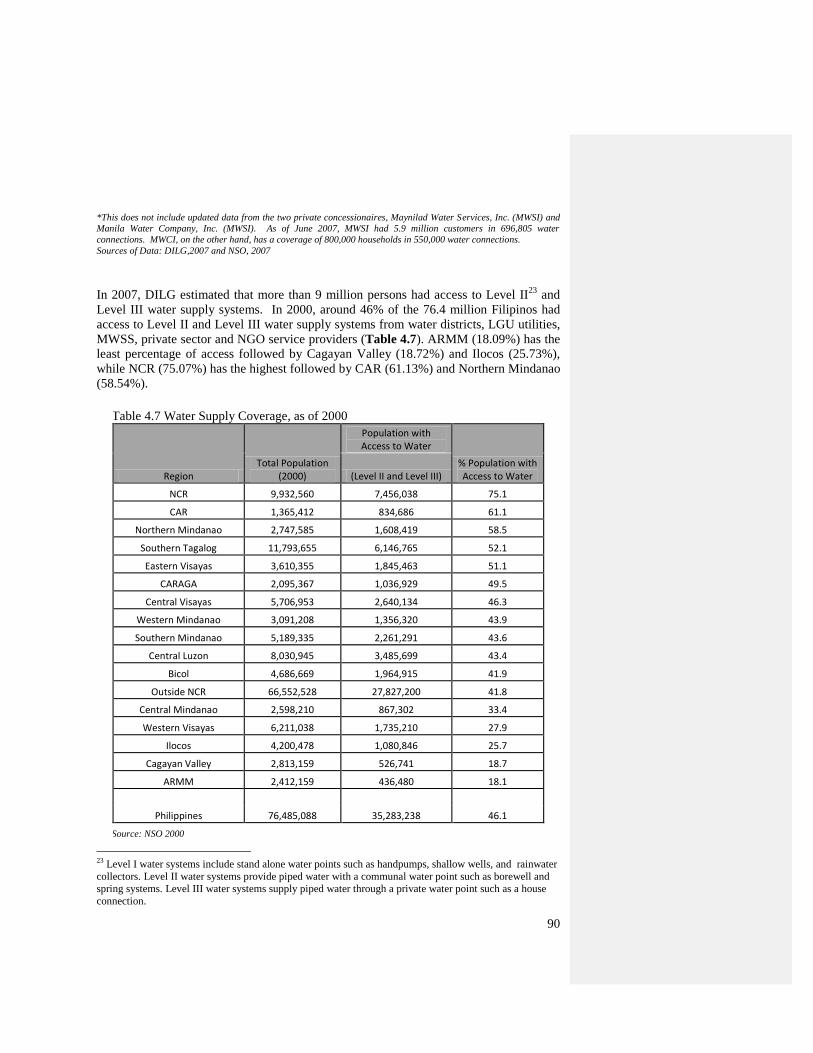
90
*This does not include updated data from the two private concessionaires, Maynilad Water Services, Inc. (MWSI) and
Manila Water Company, Inc. (MWSI). As of June 2007, MWSI had 5.9 million customers in 696,805 water
connections. MWCI, on the other hand, has a coverage of 800,000 households in 550,000 water connections.
Sources of Data: DILG,2007 and NSO, 2007
In 2007, DILG estimated that more than 9 million persons had access to Level II23
and
Level III water supply systems. In 2000, around 46% of the 76.4 million Filipinos had
access to Level II and Level III water supply systems from water districts, LGU utilities,
MWSS, private sector and NGO service providers (Table 4.7). ARMM (18.09%) has the
least percentage of access followed by Cagayan Valley (18.72%) and Ilocos (25.73%),
while NCR (75.07%) has the highest followed by CAR (61.13%) and Northern Mindanao
(58.54%).
Table 4.7 Water Supply Coverage, as of 2000
Region Total Population
(2000)
Population with Access to Water
% Population with Access to Water (Level II and Level III)
NCR 9,932,560 7,456,038 75.1
CAR 1,365,412 834,686 61.1
Northern Mindanao 2,747,585 1,608,419 58.5
Southern Tagalog 11,793,655 6,146,765 52.1
Eastern Visayas 3,610,355 1,845,463 51.1
CARAGA 2,095,367 1,036,929 49.5
Central Visayas 5,706,953 2,640,134 46.3
Western Mindanao 3,091,208 1,356,320 43.9
Southern Mindanao 5,189,335 2,261,291 43.6
Central Luzon 8,030,945 3,485,699 43.4
Bicol 4,686,669 1,964,915 41.9
Outside NCR 66,552,528 27,827,200 41.8
Central Mindanao 2,598,210 867,302 33.4
Western Visayas 6,211,038 1,735,210 27.9
Ilocos 4,200,478 1,080,846 25.7
Cagayan Valley 2,813,159 526,741 18.7
ARMM 2,412,159 436,480 18.1
Philippines 76,485,088 35,283,238 46.1
Source: NSO 2000
23
Level I water systems include stand alone water points such as handpumps, shallow wells, and rainwater
collectors. Level II water systems provide piped water with a communal water point such as borewell and
spring systems. Level III water systems supply piped water through a private water point such as a house
connection.
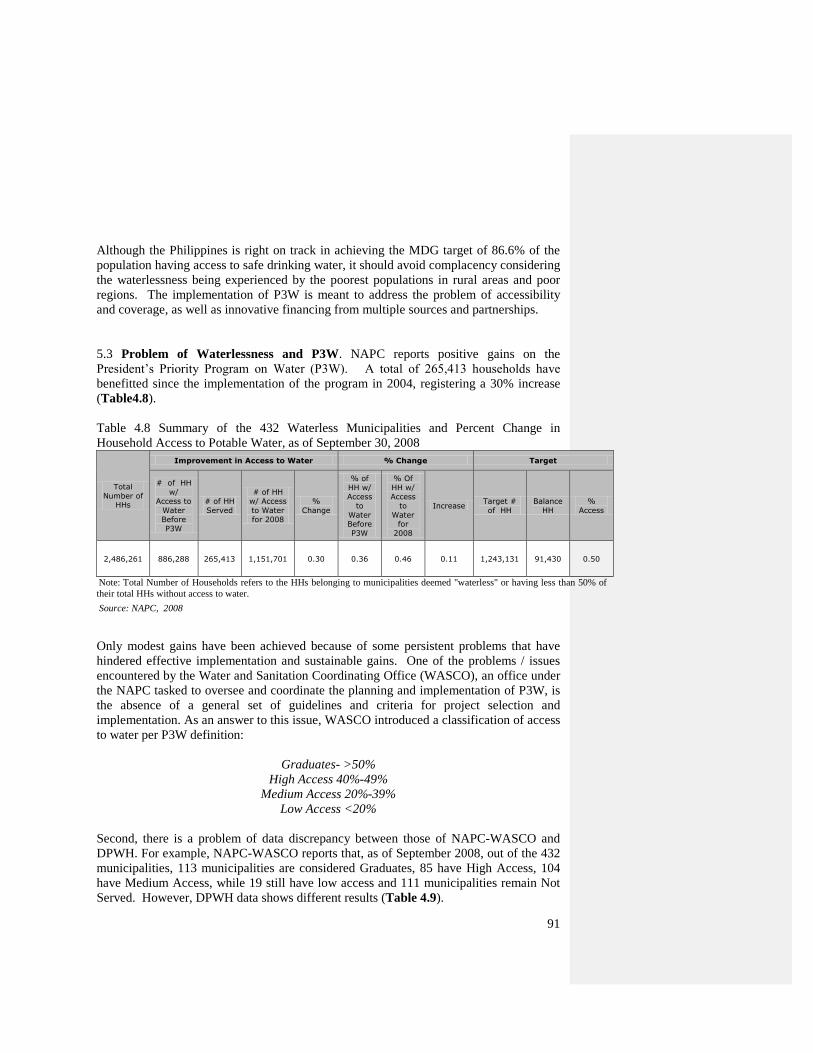
91
Although the Philippines is right on track in achieving the MDG target of 86.6% of the
population having access to safe drinking water, it should avoid complacency considering
the waterlessness being experienced by the poorest populations in rural areas and poor
regions. The implementation of P3W is meant to address the problem of accessibility
and coverage, as well as innovative financing from multiple sources and partnerships.
5.3 Problem of Waterlessness and P3W. NAPC reports positive gains on the
President‘s Priority Program on Water (P3W). A total of 265,413 households have
benefitted since the implementation of the program in 2004, registering a 30% increase
(Table4.8).
Table 4.8 Summary of the 432 Waterless Municipalities and Percent Change in
Household Access to Potable Water, as of September 30, 2008
Total
Number of HHs
Improvement in Access to Water % Change Target
# of HH
w/
Access to
Water
Before
P3W
# of HH
Served
# of HH
w/ Access
to Water
for 2008
%
Change
% of
HH w/
Access
to
Water Before
P3W
% Of
HH w/
Access
to
Water for
2008
Increase Target #
of HH
Balance
HH
%
Access
2,486,261 886,288 265,413 1,151,701 0.30 0.36 0.46 0.11 1,243,131 91,430 0.50
Note: Total Number of Households refers to the HHs belonging to municipalities deemed "waterless" or having less than 50% of
their total HHs without access to water.
Source: NAPC, 2008
Only modest gains have been achieved because of some persistent problems that have
hindered effective implementation and sustainable gains. One of the problems / issues
encountered by the Water and Sanitation Coordinating Office (WASCO), an office under
the NAPC tasked to oversee and coordinate the planning and implementation of P3W, is
the absence of a general set of guidelines and criteria for project selection and
implementation. As an answer to this issue, WASCO introduced a classification of access
to water per P3W definition:
Graduates- >50%
High Access 40%-49%
Medium Access 20%-39%
Low Access <20%
Second, there is a problem of data discrepancy between those of NAPC-WASCO and
DPWH. For example, NAPC-WASCO reports that, as of September 2008, out of the 432
municipalities, 113 municipalities are considered Graduates, 85 have High Access, 104
have Medium Access, while 19 still have low access and 111 municipalities remain Not
Served. However, DPWH data shows different results (Table 4.9).
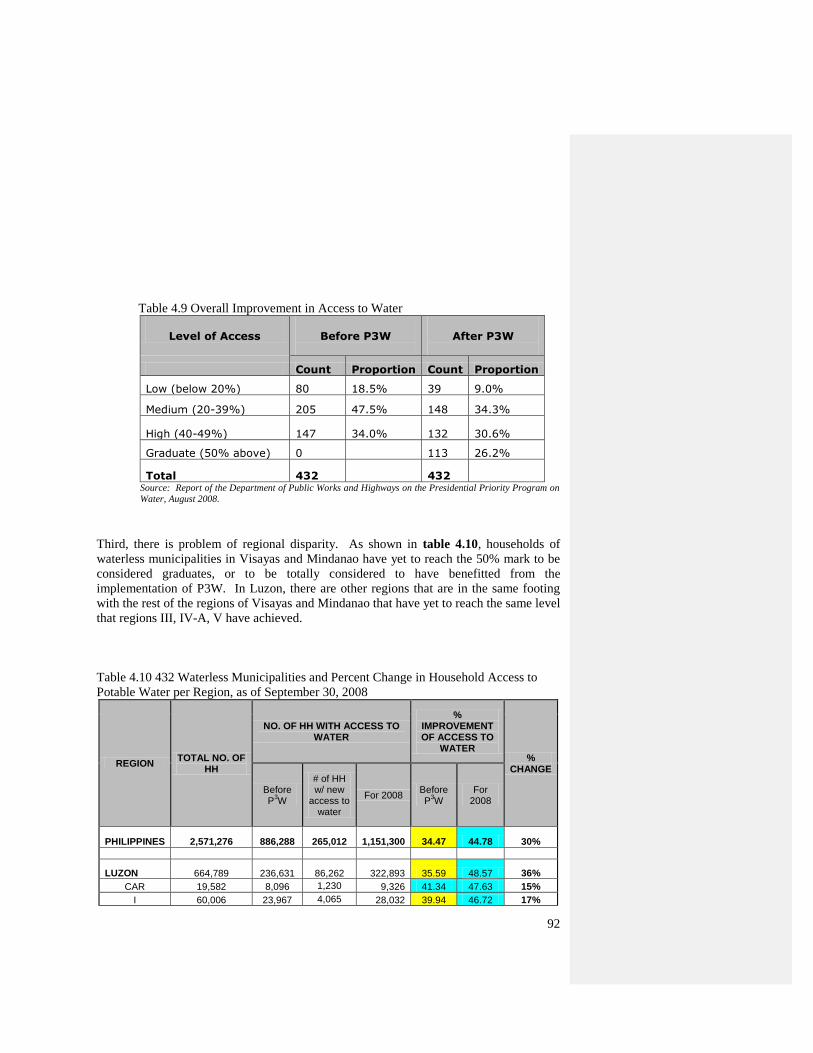
92
Table 4.9 Overall Improvement in Access to Water
Level of Access
Before P3W
After P3W
Count Proportion Count Proportion
Low (below 20%) 80 18.5% 39 9.0%
Medium (20-39%) 205 47.5% 148 34.3%
High (40-49%) 147 34.0% 132 30.6%
Graduate (50% above) 0 113 26.2%
Total 432 432 Source: Report of the Department of Public Works and Highways on the Presidential Priority Program on
Water, August 2008.
Third, there is problem of regional disparity. As shown in table 4.10, households of
waterless municipalities in Visayas and Mindanao have yet to reach the 50% mark to be
considered graduates, or to be totally considered to have benefitted from the
implementation of P3W. In Luzon, there are other regions that are in the same footing
with the rest of the regions of Visayas and Mindanao that have yet to reach the same level
that regions III, IV-A, V have achieved.
Table 4.10 432 Waterless Municipalities and Percent Change in Household Access to
Potable Water per Region, as of September 30, 2008
REGION TOTAL NO. OF
HH
NO. OF HH WITH ACCESS TO WATER
% IMPROVEMENT OF ACCESS TO
WATER %
CHANGE
Before P
3W
# of HH w/ new
access to water
For 2008 Before P
3W
For 2008
PHILIPPINES 2,571,276 886,288 265,012 1,151,300 34.47 44.78 30%
LUZON 664,789 236,631 86,262 322,893 35.59 48.57 36%
CAR 19,582 8,096 1,230 9,326 41.34 47.63 15%
I 60,006 23,967 4,065 28,032 39.94 46.72 17%
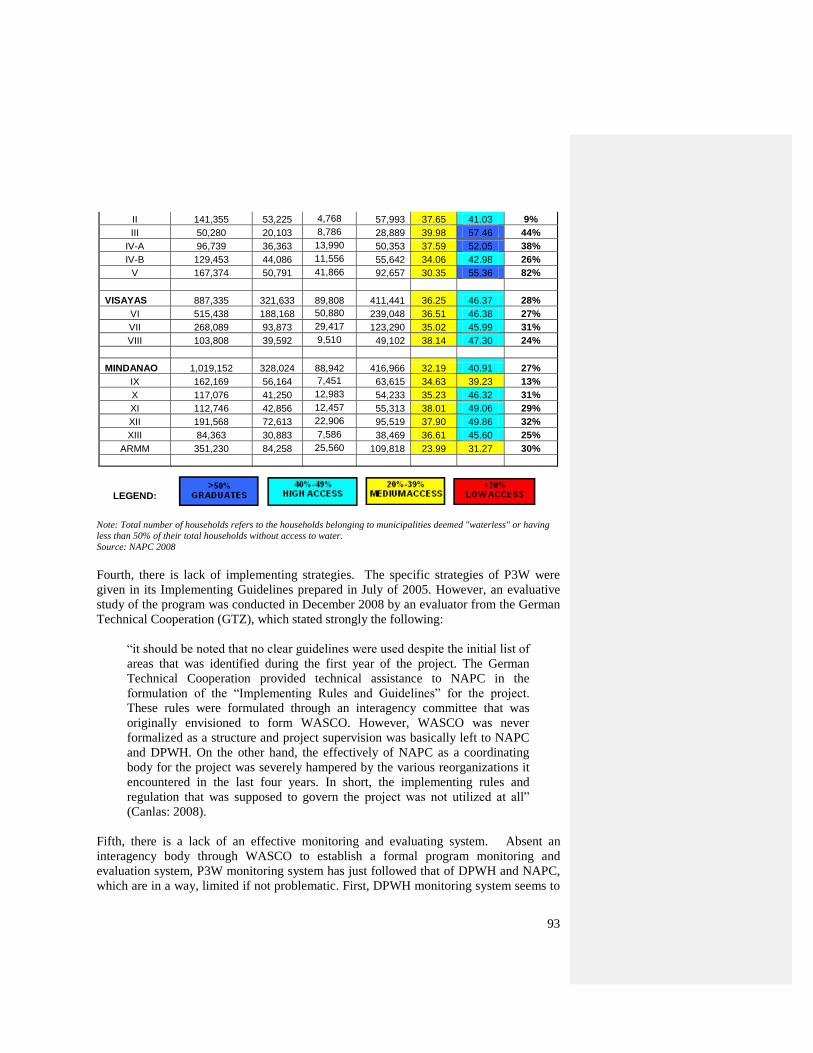
93
II 141,355 53,225 4,768 57,993 37.65 41.03 9%
III 50,280 20,103 8,786 28,889 39.98 57.46 44%
IV-A 96,739 36,363 13,990 50,353 37.59 52.05 38%
IV-B 129,453 44,086 11,556 55,642 34.06 42.98 26%
V 167,374 50,791 41,866 92,657 30.35 55.36 82%
VISAYAS 887,335 321,633 89,808 411,441 36.25 46.37 28%
VI 515,438 188,168 50,880 239,048 36.51 46.38 27%
VII 268,089 93,873 29,417 123,290 35.02 45.99 31%
VIII 103,808 39,592 9,510 49,102 38.14 47.30 24%
MINDANAO 1,019,152 328,024 88,942 416,966 32.19 40.91 27%
IX 162,169 56,164 7,451 63,615 34.63 39.23 13%
X 117,076 41,250 12,983 54,233 35.23 46.32 31%
XI 112,746 42,856 12,457 55,313 38.01 49.06 29%
XII 191,568 72,613 22,906 95,519 37.90 49.86 32%
XIII 84,363 30,883 7,586 38,469 36.61 45.60 25%
ARMM 351,230 84,258 25,560 109,818 23.99 31.27 30%
LEGEND:
Note: Total number of households refers to the households belonging to municipalities deemed "waterless" or having
less than 50% of their total households without access to water.
Source: NAPC 2008
Fourth, there is lack of implementing strategies. The specific strategies of P3W were
given in its Implementing Guidelines prepared in July of 2005. However, an evaluative
study of the program was conducted in December 2008 by an evaluator from the German
Technical Cooperation (GTZ), which stated strongly the following:
―it should be noted that no clear guidelines were used despite the initial list of
areas that was identified during the first year of the project. The German
Technical Cooperation provided technical assistance to NAPC in the
formulation of the ―Implementing Rules and Guidelines‖ for the project.
These rules were formulated through an interagency committee that was
originally envisioned to form WASCO. However, WASCO was never
formalized as a structure and project supervision was basically left to NAPC
and DPWH. On the other hand, the effectively of NAPC as a coordinating
body for the project was severely hampered by the various reorganizations it
encountered in the last four years. In short, the implementing rules and
regulation that was supposed to govern the project was not utilized at all‖
(Canlas: 2008).
Fifth, there is a lack of an effective monitoring and evaluating system. Absent an
interagency body through WASCO to establish a formal program monitoring and
evaluation system, P3W monitoring system has just followed that of DPWH and NAPC,
which are in a way, limited if not problematic. First, DPWH monitoring system seems to
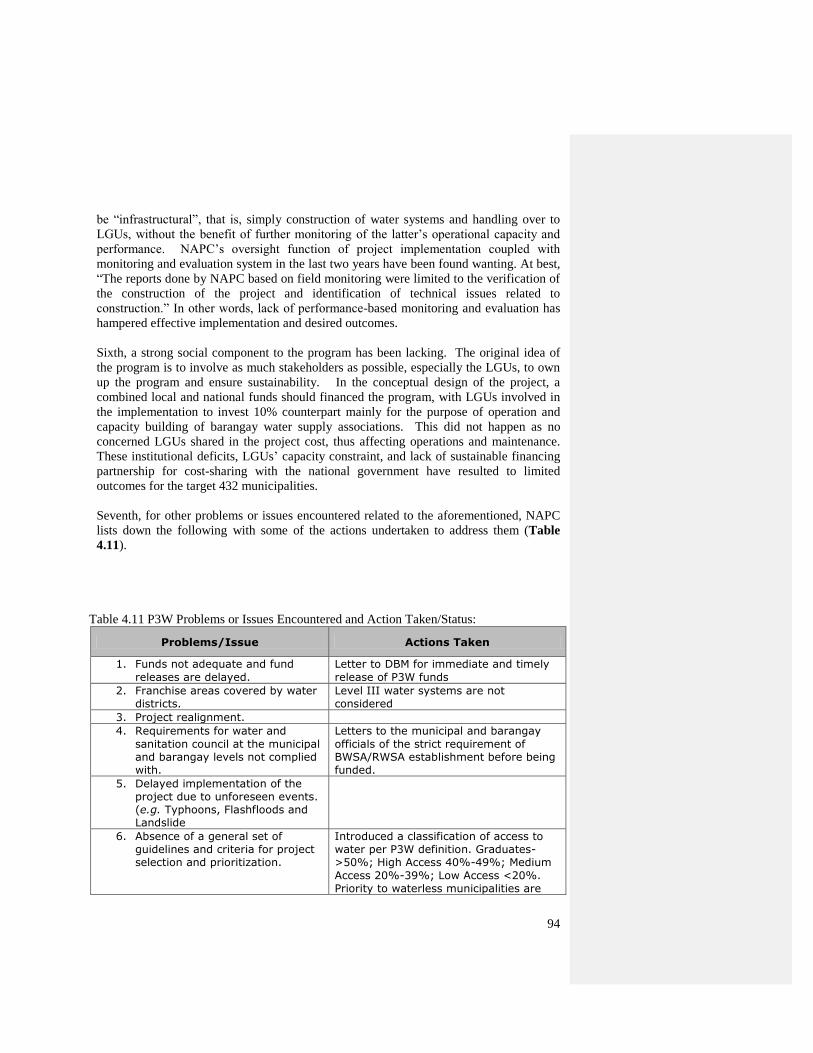
94
be ―infrastructural‖, that is, simply construction of water systems and handling over to
LGUs, without the benefit of further monitoring of the latter‘s operational capacity and
performance. NAPC‘s oversight function of project implementation coupled with
monitoring and evaluation system in the last two years have been found wanting. At best,
―The reports done by NAPC based on field monitoring were limited to the verification of
the construction of the project and identification of technical issues related to
construction.‖ In other words, lack of performance-based monitoring and evaluation has
hampered effective implementation and desired outcomes.
Sixth, a strong social component to the program has been lacking. The original idea of
the program is to involve as much stakeholders as possible, especially the LGUs, to own
up the program and ensure sustainability. In the conceptual design of the project, a
combined local and national funds should financed the program, with LGUs involved in
the implementation to invest 10% counterpart mainly for the purpose of operation and
capacity building of barangay water supply associations. This did not happen as no
concerned LGUs shared in the project cost, thus affecting operations and maintenance.
These institutional deficits, LGUs‘ capacity constraint, and lack of sustainable financing
partnership for cost-sharing with the national government have resulted to limited
outcomes for the target 432 municipalities.
Seventh, for other problems or issues encountered related to the aforementioned, NAPC
lists down the following with some of the actions undertaken to address them (Table
4.11).
Table 4.11 P3W Problems or Issues Encountered and Action Taken/Status:
Problems/Issue Actions Taken
1. Funds not adequate and fund
releases are delayed.
Letter to DBM for immediate and timely
release of P3W funds
2. Franchise areas covered by water
districts.
Level III water systems are not
considered
3. Project realignment.
4. Requirements for water and
sanitation council at the municipal
and barangay levels not complied
with.
Letters to the municipal and barangay
officials of the strict requirement of
BWSA/RWSA establishment before being
funded.
5. Delayed implementation of the
project due to unforeseen events.
(e.g. Typhoons, Flashfloods and
Landslide
6. Absence of a general set of
guidelines and criteria for project
selection and prioritization.
Introduced a classification of access to
water per P3W definition. Graduates-
>50%; High Access 40%-49%; Medium
Access 20%-39%; Low Access <20%.
Priority to waterless municipalities are
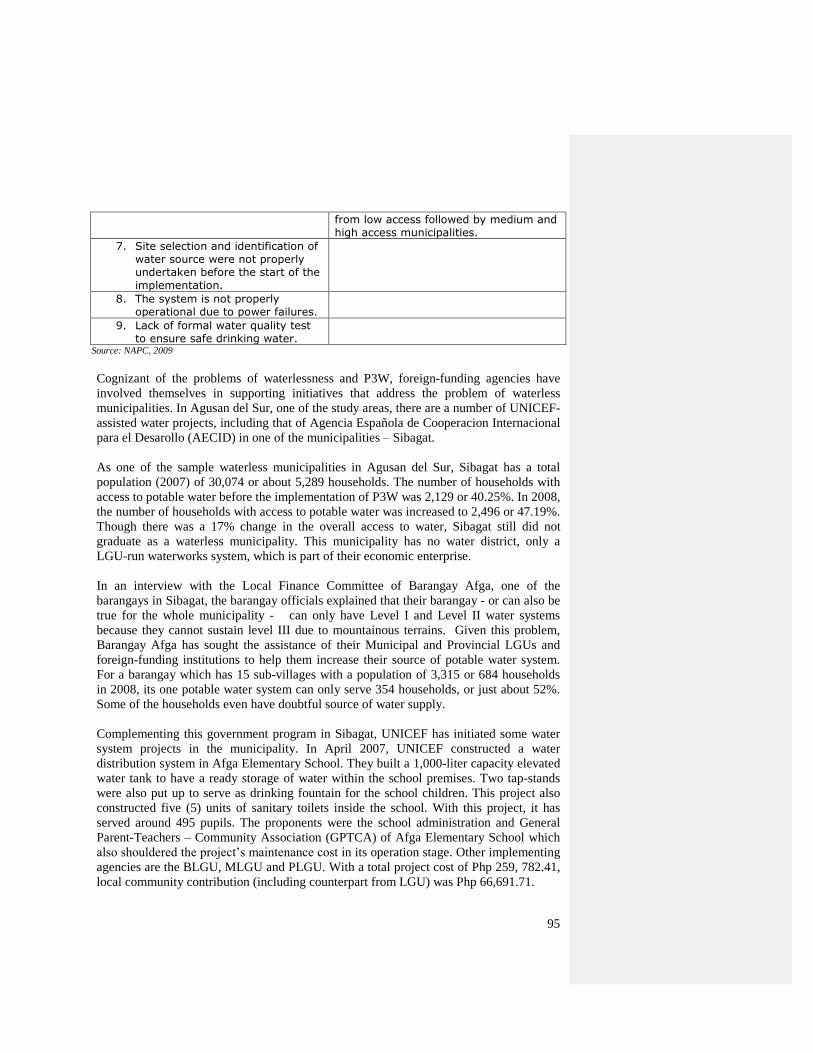
95
from low access followed by medium and
high access municipalities.
7. Site selection and identification of
water source were not properly
undertaken before the start of the
implementation.
8. The system is not properly
operational due to power failures.
9. Lack of formal water quality test
to ensure safe drinking water.
Source: NAPC, 2009
Cognizant of the problems of waterlessness and P3W, foreign-funding agencies have
involved themselves in supporting initiatives that address the problem of waterless
municipalities. In Agusan del Sur, one of the study areas, there are a number of UNICEF-
assisted water projects, including that of Agencia Española de Cooperacion Internacional
para el Desarollo (AECID) in one of the municipalities – Sibagat.
As one of the sample waterless municipalities in Agusan del Sur, Sibagat has a total
population (2007) of 30,074 or about 5,289 households. The number of households with
access to potable water before the implementation of P3W was 2,129 or 40.25%. In 2008,
the number of households with access to potable water was increased to 2,496 or 47.19%.
Though there was a 17% change in the overall access to water, Sibagat still did not
graduate as a waterless municipality. This municipality has no water district, only a
LGU-run waterworks system, which is part of their economic enterprise.
In an interview with the Local Finance Committee of Barangay Afga, one of the
barangays in Sibagat, the barangay officials explained that their barangay - or can also be
true for the whole municipality - can only have Level I and Level II water systems
because they cannot sustain level III due to mountainous terrains. Given this problem,
Barangay Afga has sought the assistance of their Municipal and Provincial LGUs and
foreign-funding institutions to help them increase their source of potable water system.
For a barangay which has 15 sub-villages with a population of 3,315 or 684 households
in 2008, its one potable water system can only serve 354 households, or just about 52%.
Some of the households even have doubtful source of water supply.
Complementing this government program in Sibagat, UNICEF has initiated some water
system projects in the municipality. In April 2007, UNICEF constructed a water
distribution system in Afga Elementary School. They built a 1,000-liter capacity elevated
water tank to have a ready storage of water within the school premises. Two tap-stands
were also put up to serve as drinking fountain for the school children. This project also
constructed five (5) units of sanitary toilets inside the school. With this project, it has
served around 495 pupils. The proponents were the school administration and General
Parent-Teachers – Community Association (GPTCA) of Afga Elementary School which
also shouldered the project‘s maintenance cost in its operation stage. Other implementing
agencies are the BLGU, MLGU and PLGU. With a total project cost of Php 259, 782.41,
local community contribution (including counterpart from LGU) was Php 66,691.71.
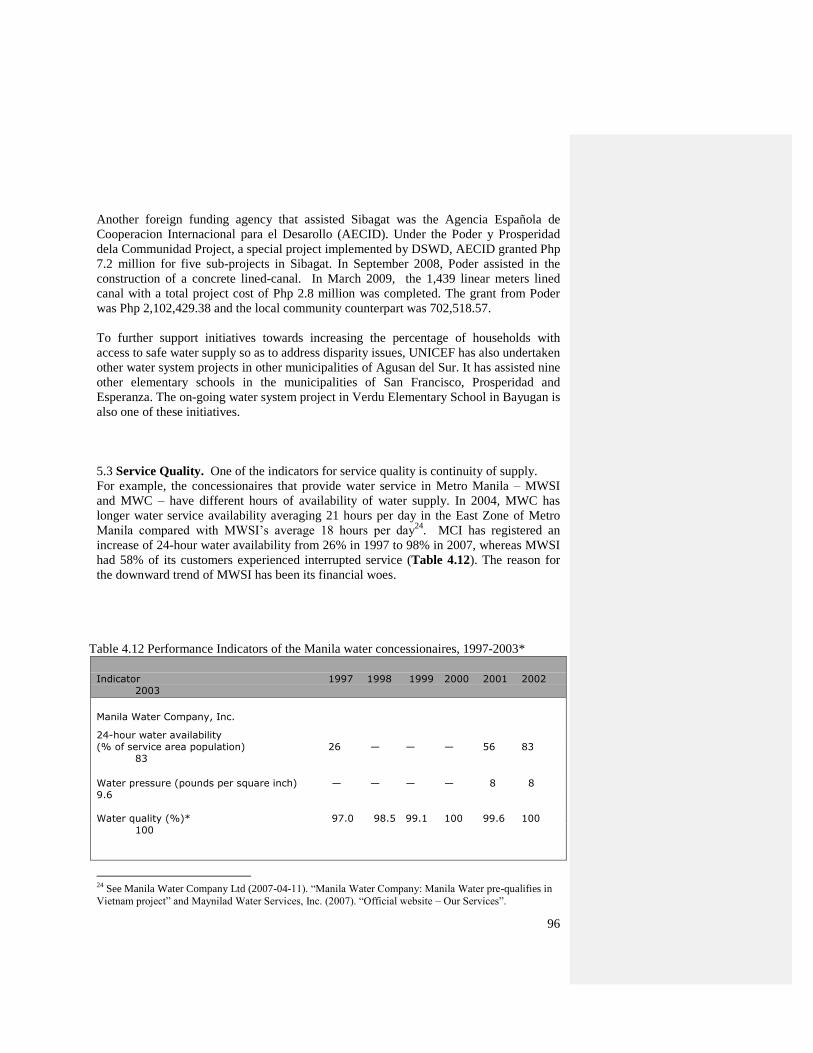
96
Another foreign funding agency that assisted Sibagat was the Agencia Española de
Cooperacion Internacional para el Desarollo (AECID). Under the Poder y Prosperidad
dela Communidad Project, a special project implemented by DSWD, AECID granted Php
7.2 million for five sub-projects in Sibagat. In September 2008, Poder assisted in the
construction of a concrete lined-canal. In March 2009, the 1,439 linear meters lined
canal with a total project cost of Php 2.8 million was completed. The grant from Poder
was Php 2,102,429.38 and the local community counterpart was 702,518.57.
To further support initiatives towards increasing the percentage of households with
access to safe water supply so as to address disparity issues, UNICEF has also undertaken
other water system projects in other municipalities of Agusan del Sur. It has assisted nine
other elementary schools in the municipalities of San Francisco, Prosperidad and
Esperanza. The on-going water system project in Verdu Elementary School in Bayugan is
also one of these initiatives.
5.3 Service Quality. One of the indicators for service quality is continuity of supply.
For example, the concessionaires that provide water service in Metro Manila – MWSI
and MWC – have different hours of availability of water supply. In 2004, MWC has
longer water service availability averaging 21 hours per day in the East Zone of Metro
Manila compared with MWSI‘s average 18 hours per day24
. MCI has registered an
increase of 24-hour water availability from 26% in 1997 to 98% in 2007, whereas MWSI
had 58% of its customers experienced interrupted service (Table 4.12). The reason for
the downward trend of MWSI has been its financial woes.
Table 4.12 Performance Indicators of the Manila water concessionaires, 1997-2003*
Indicator 1997 1998 1999 2000 2001 2002
2003
Manila Water Company, Inc.
24-hour water availability
(% of service area population) 26 — — — 56 83
83
Water pressure (pounds per square inch) — — — — 8 8
9.6
Water quality (%)* 97.0 98.5 99.1 100 99.6 100
100
24
See Manila Water Company Ltd (2007-04-11). ―Manila Water Company: Manila Water pre-qualifies in
Vietnam project‖ and Maynilad Water Services, Inc. (2007). ―Official website – Our Services‖.
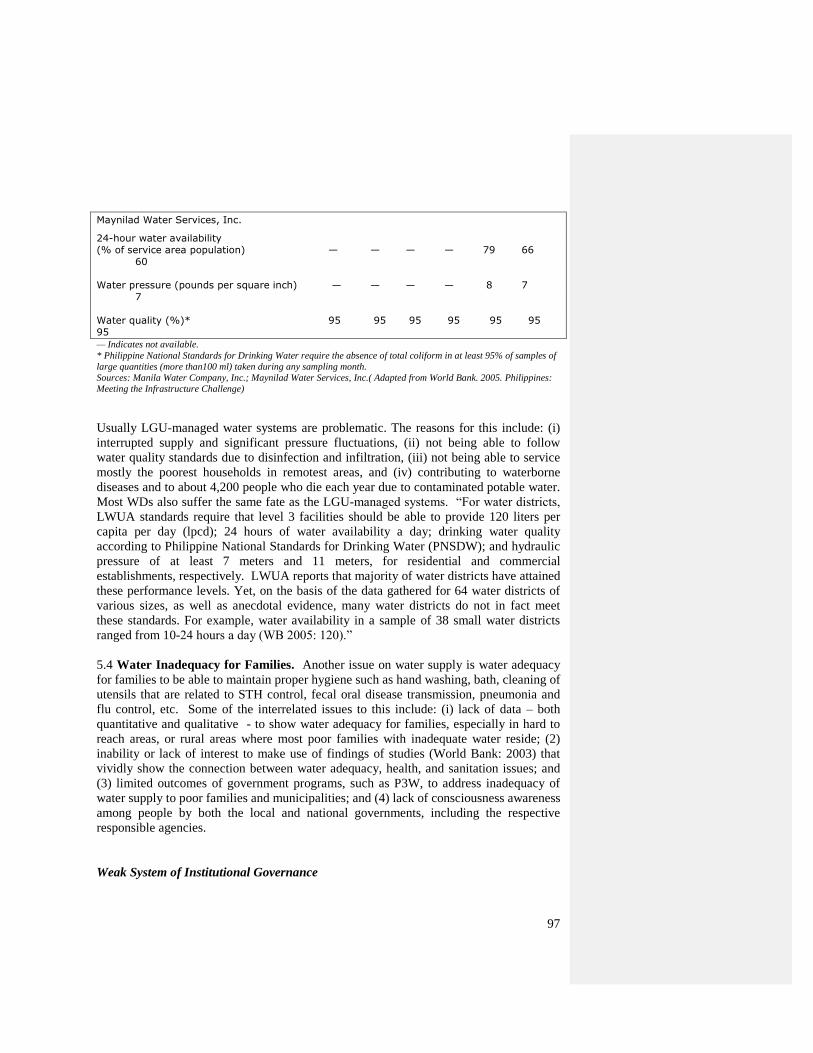
97
Maynilad Water Services, Inc.
24-hour water availability
(% of service area population) — — — — 79 66
60
Water pressure (pounds per square inch) — — — — 8 7
7
Water quality (%)* 95 95 95 95 95 95
95
— Indicates not available.
* Philippine National Standards for Drinking Water require the absence of total coliform in at least 95% of samples of
large quantities (more than100 ml) taken during any sampling month.
Sources: Manila Water Company, Inc.; Maynilad Water Services, Inc.( Adapted from World Bank. 2005. Philippines:
Meeting the Infrastructure Challenge)
Usually LGU-managed water systems are problematic. The reasons for this include: (i)
interrupted supply and significant pressure fluctuations, (ii) not being able to follow
water quality standards due to disinfection and infiltration, (iii) not being able to service
mostly the poorest households in remotest areas, and (iv) contributing to waterborne
diseases and to about 4,200 people who die each year due to contaminated potable water.
Most WDs also suffer the same fate as the LGU-managed systems. ―For water districts,
LWUA standards require that level 3 facilities should be able to provide 120 liters per
capita per day (lpcd); 24 hours of water availability a day; drinking water quality
according to Philippine National Standards for Drinking Water (PNSDW); and hydraulic
pressure of at least 7 meters and 11 meters, for residential and commercial
establishments, respectively. LWUA reports that majority of water districts have attained
these performance levels. Yet, on the basis of the data gathered for 64 water districts of
various sizes, as well as anecdotal evidence, many water districts do not in fact meet
these standards. For example, water availability in a sample of 38 small water districts
ranged from 10-24 hours a day (WB 2005: 120).‖
5.4 Water Inadequacy for Families. Another issue on water supply is water adequacy
for families to be able to maintain proper hygiene such as hand washing, bath, cleaning of
utensils that are related to STH control, fecal oral disease transmission, pneumonia and
flu control, etc. Some of the interrelated issues to this include: (i) lack of data – both
quantitative and qualitative - to show water adequacy for families, especially in hard to
reach areas, or rural areas where most poor families with inadequate water reside; (2)
inability or lack of interest to make use of findings of studies (World Bank: 2003) that
vividly show the connection between water adequacy, health, and sanitation issues; and
(3) limited outcomes of government programs, such as P3W, to address inadequacy of
water supply to poor families and municipalities; and (4) lack of consciousness awareness
among people by both the local and national governments, including the respective
responsible agencies.
Weak System of Institutional Governance
98
5.3 Multiplicity of Institutions. The water supply sector is highly fragmented due to a
plethora of institutions lacking clear assignment of duties, overlapping functions, and
uncoordinated planning and monitoring. As World Bank (2008) opines: ―The sector is
extremely fragmented. The proliferation of actors is a result of successive waves of
reforms that have added new layers without completely doing away with the old. Thus,
while the WD model was introduced to move away from political problems inherent in
LGU-run systems, the latter continue to serve the majority of urban population. And,
there are no fewer than 20 government agencies presently involved in the sector (WB
2008).‖ Absent clear lines of responsibilities of the different institutional actors blurs the
lines of accountabilities for better performance.
5.4 Implementation of EO 279. There is a high degree of uncertainty of how EO 279 is
to be implemented. Part IV of EO 279 spells out the roles and responsibilities of LGUs,
DILG, LWUA, MDFO, GFIs and other financial institutions vis-à-vis WDs and WSPs.
However, the required institutional capacities to carry out these new mandated functions
seem insufficient. For example, in Sec 12d of EO 279, the LGUs are encouraged to
provide financial and operational assistance to non-creditworthy WDs and other WSPs
within their respective jurisdiction. At present, LGUs find it hard in assisting even the
LGU-managed water systems in their respective areas. Also, the private lending to LGUs,
WDs, and WSPs is a welcome move. But unless the GFIs cease monopolizing lending
and allow private financial institutions to share in granting loans for water supply
projects, then limited investment into the water sector would continue to characterize it
(ADB-WB 2005).
5.5 Weak Regulatory Framework. The water supply sector lacks coherent and robust
regulatory framework due to (i) fragmented regulatory oversight by different line
agencies, (ii) lack of capacities to perform regulatory functions, and (iii) lack of
transparency in sector performance that impedes effective regulation. Though NWRB
has taken on the regulatory oversight function of LWUA to address the latter‘s
conflicting role as both financier and regulator (influence in the WD‘s Board) for water
districts, it has not yet built the capacity to perform effectively based on its new mandate.
Also, NWRB‘s role vis-à-vis LGUs has yet to be spelled out. Further, the lack of reliable
benchmarking information at the service provider level makes it difficult for NWRB,
LWUA, NEDA, and DILG to regulate effectively and make accountable different
categories of WSPs and WDs for improved sector performance.
This weak regulatory framework has resulted to weak accountability system. It has
become too difficult to hold agency accountable for certain functions that are mandated
ambiguously. In order to address this, some recommendations are in order: (1) A specific
national agency with clearly defined roles and responsibilities will have to provide
technical assistance to LGUs on water availability mapping, promotion of new
technology and low cost point of use or household water treatment, to use data packaged
simply as advocacy tool for LGUs to easily understand; (2) A specific national agency
with clearly defined roles and responsibilities will have to check regularly LGUs and
water districts the water quality monitoring system, provide / augment water treatment
supplies, and capacity strengthening. For the latter‘s recommendations, DOH should be
99
reminded to perform these functions and not rely to LGUs; otherwise, LGUs will do
―business as usual‖ until outbreaks surface. DOH, for example, can revive its pre-
devolution primary health care program on ―Rapid Testing for Drinking Water Source‖
where water systems of LGUs were monitored to ensure safe water supply and sanitation.
CHAPTER 5
Analysis of National Government and LGU
Spending for the MDGs
This chapter aims to review and analyze the trend in MDG expenditures of both the
central and local governments units, particularly the LSD study areas. It argues that
without adequate funding support, the achievement of the MDGs, particularly those goals
where the Philippines is lagging behind, may not be likely. It cannot be denied that
financing does not automatically translate into outcomes. However, while financing may
not be a sufficient condition, it is to a large extent a necessary condition for the
attainment of the MDGs. In this sense, securing government‘s commitment to provide
adequate budgetary support for the MDGs may be seen as an important first step towards
the attainment of the following Goals and their more specific targets:
Goal 1: Eradicate extreme poverty and hunger
Halve the proportion of population living
o below the food threshold between 1990 and 2015
o below the overall poverty threshold between 1990 and 2015
Halve the proportion of households with per capita intake below 100%
of the dietary energy requirement between 1990 and 2015
Halve the prevalence of malnutrition among 0-5 year old children
between 1990 and 2015
Goal 2: Achieve universal primary education
Achieve 100% participation rate by 2015
Achieve 84.7% cohort survival rate at the elementary level by 2015
Goal 3: Promote gender equality and empower women
Eliminate gender disparity in primary and secondary education,
preferably by 2005, and in all levels of education no later than 2015
Goal 4: Reduce child mortality
Reduce by two-thirds the infant mortality rate by 2015
Reduce by two-thirds the under-5 mortality rate by 2015
100
Goal 5: Improve maternal health
Reduce the maternal mortality rate by three-quarters by 2015
Increase the prevalence of couples practicing responsible parenthood
to 70% by 2015
Goal 6: Combat HIV/ AIDS, malaria and other diseases
Maintain prevalence of HIV/ AIDS at less than 1 up to 2015
Reduce malaria morbidity rate from 123 per 100,000 population in
1990 to 24 per 100,000 in 2015
Goal 7: Ensure environmental sustainability
Increase the proportion of households with access to safe drinking
water from 73.7% in 1990 to 86.8% in 2015
Increase the proportion of households with access to sanitary toilet
facilities from 67.6% to 83.8% in 2015
Goal 8: Develop a global partnership for development
Develop further an open, rules-based, predictable, non-discriminatory
trading and financial system, including a commitment to good
governance
Deal comprehensively with debt problems of developing countries
through national and international measures in order to make debts
sustainable in the long-term
Table 1 summarizes the average rate of progress towards the achievement of the MDGs
to date (1990-2005/6) and compares it with the rate of progress that is required in 2005/6-
2015 if the MDG targets are to be met. It indicates that maintaining the current rate of
progress is sufficient to bring about the achievement of the MDGs for the reduction of
poverty incidence,25
the reduction of the infant mortality rate and the under-5 mortality
rate, the reduction in HIV/AIDS prevalence, and the increase in access to sanitary toilet
facilities. In contrast, the rate of progress required to meet the MDG targets with respect
to the under-5 malnutrition rate, the per capita dietary energy intake requirement, malaria
morbidity, access to safe drinking water, the elementary participation rate, the elementary
cohort survival rate, gender equality in education, the maternal mortality rate and the
contraceptive prevalence rate are all higher than the actual rate of progress to date.26
In
25
The 2015 target for subsistence poverty has already been reached in 2003. 26
The Philippines Midterm Progress Report on the MDGs (2007), however, note that gap between the
required rate of progress and the actual rate of progress to date with respect to the first four of these targets
are not so large such that the 2015 targets for these indicators are still likely to be met.
101
other words, the country has to do better than its historical performance in certain aspects
of all of the seven quantifiable goals, namely: Goal 1 (poverty and hunger), Goal 2
(education), Goal 3 (gender equality), Goal 5 (maternal health), Goal 6 (control of
communicable diseases), and Goal 7 (environmental sustainability).
At the same time, the national averages for the MDG indicators shown in Table 1 mask
glaring disparities across regions. Table 2 and Table 3 show the LSD study areas to be
lagging behind the national average performance in achieving the education, health and
water/ sanitation targets. In particular, Agusan del Sur fell short of the national average
performance in terms of the net enrollment rate, cohort survival rate and households‘
access to safe water and sanitary toilets while posting a higher than average maternal
death rate in 2005. In like manner, Dumaguete City did poorly relative to the national
average in terms of the net enrollment rate, infant death rate and households‘ access to
safe water and sanitary toilets in 2005.
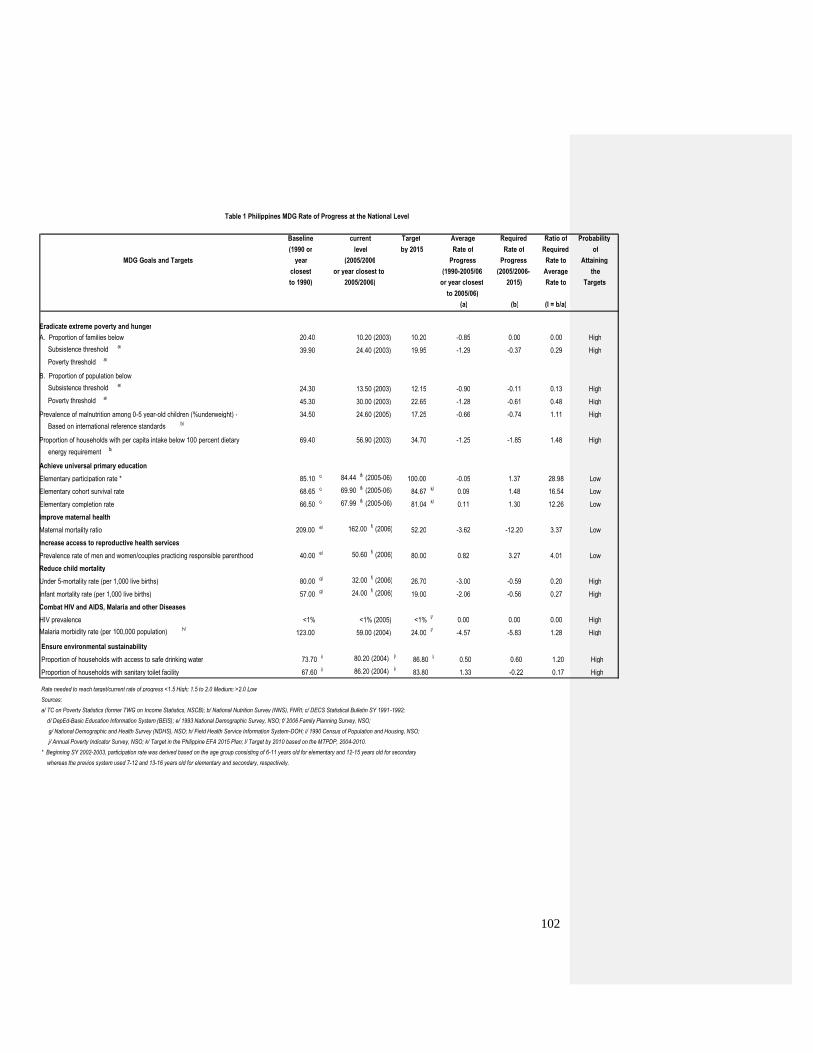
102
Table 1 Philippines MDG Rate of Progress at the National Level
Baseline current Target Average Required Ratio of Probability (1990 or level by 2015 Rate of Rate of Required of
MDG Goals and Targets year (2005/2006 Progress Progress Rate to Attaining closest or year closest to (1990-2005/06 (2005/2006- Average the to 1990) 2005/2006) or year closest 2015) Rate to Targets
to 2005/06) (a) (b) (I = b/a)
Eradicate extreme poverty and hunger A. Proportion of families below 20.40 10.20 (2003) 10.20 -0.85 0.00 0.00 High Subsistence threshold a/
39.90 24.40 (2003) 19.95 -1.29 -0.37 0.29 High Poverty threshold a/
B. Proportion of population below Subsistence threshold a/
24.30 13.50 (2003) 12.15 -0.90 -0.11 0.13 High Poverty threshold a/
45.30 30.00 (2003) 22.65 -1.28 -0.61 0.48 High Prevalence of malnutrition among 0-5 year-old children (%underweight) - 34.50 24.60 (2005) 17.25 -0.66 -0.74 1.11 High Based on international reference standards b/
Proportion of households with per capita intake below 100 percent dietary 69.40 56.90 (2003) 34.70 -1.25 -1.85 1.48 High energy requirement b/
Achieve universal primary education Elementary participation rate * 85.10 c/ 84.44 d/ (2005-06) 100.00 -0.05 1.37 28.98 Low Elementary cohort survival rate 68.65 c/ 69.90 d/ (2005-06) 84.67 k/ 0.09 1.48 16.54 Low Elementary completion rate 66.50 c/ 67.99 d/ (2005-06) 81.04 k/ 0.11 1.30 12.26 Low Improve maternal health Maternal mortality ratio 209.00 e/ 162.00 f/ (2006) 52.20 -3.62 -12.20 3.37 Low Increase access to reproductive health services Prevalence rate of men and women/couples practicing responsible parenthood 40.00 e/ 50.60 f/ (2006) 80.00 0.82 3.27 4.01 Low Reduce child mortality Under 5-mortality rate (per 1,000 live births) 80.00 g/ 32.00 f/ (2006) 26.70 -3.00 -0.59 0.20 High Infant mortality rate (per 1,000 live births) 57.00 g/ 24.00 f/ (2006) 19.00 -2.06 -0.56 0.27 High Combat HIV and AIDS, Malaria and other Diseases HIV prevalence <1% <1% (2005) <1% l/ 0.00 0.00 0.00 High Malaria morbidity rate (per 100,000 population) h/
123.00 59.00 (2004) 24.00 l/ -4.57 -5.83 1.28 High Ensure environmental sustainability Proportion of households with access to safe drinking water 73.70 i/ 80.20 (2004) j/
86.80 l/ 0.50 0.60 1.20 High Proportion of households with sanitary toilet facility 67.60 i/ 86.20 (2004) j/
83.80 1.33 -0.22 0.17 High
Rate needed to reach target/current rate of progress <1.5 High; 1.5 to 2.0 Medium; >2.0 Low Sources: a/ TC on Poverty Statistics (former TWG on Income Statistics, NSCB); b/ National Nutrition Survey (NNS), FNRI; c/ DECS Statistical Bulletin SY 1991-1992; d/ DepEd-Basic Education Information System (BEIS); e/ 1993 National Demographic Survey, NSO; f/ 2006 Family Planning Survey, NSO; g/ National Demographic and Health Survey (NDHS), NSO; h/ Field Health Service Information System-DOH; i/ 1990 Census of Population and Housing, NSO; j/ Annual Poverty Indicator Survey, NSO; k/ Target in the Philippine EFA 2015 Plan; l/ Target by 2010 based on the MTPDP, 2004-2010. * Beginning SY 2002-2003, participation rate was derived based on the age group consisting of 6-11 years old for elementary and 12-15 years old for secondary whereas the previos system used 7-12 and 13-16 years old for elementary and secondary, respectively.
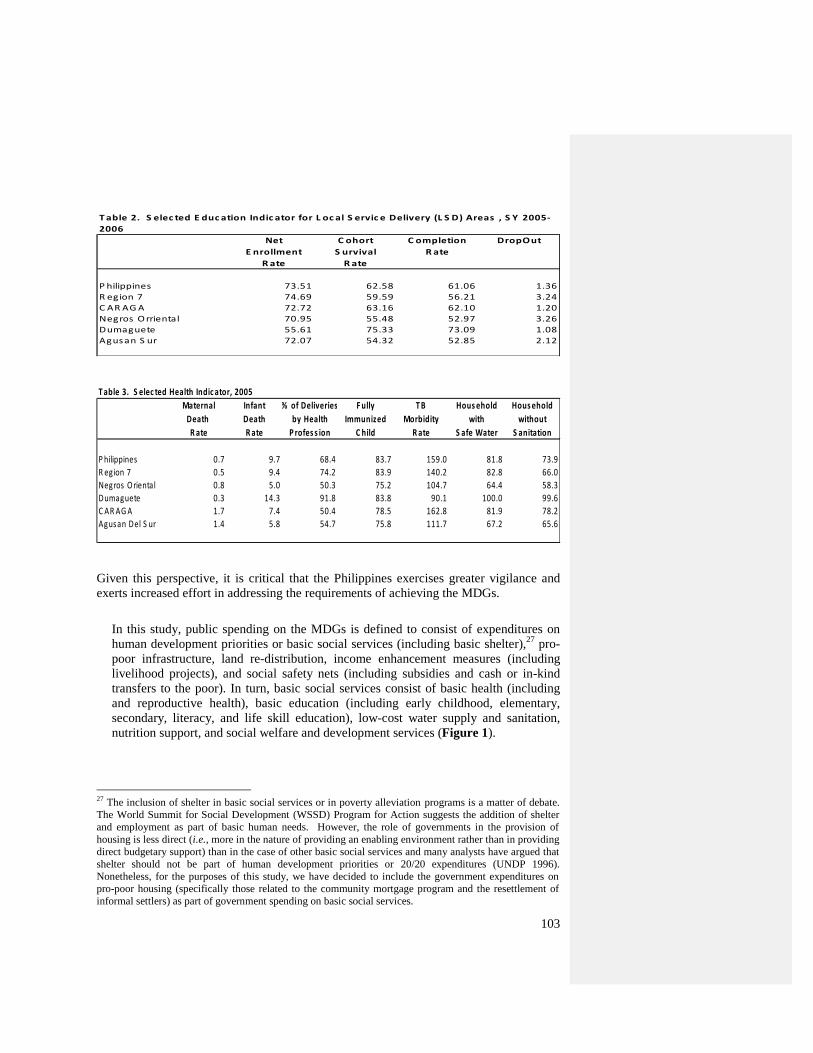
103
Net C ohort C ompletion DropOut
E nrollment S urvival R ate
R ate R ate
P hilippines 73.51 62.58 61.06 1.36
R egion 7 74.69 59.59 56.21 3.24
C AR AG A 72.72 63.16 62.10 1.20
Negros O rriental 70.95 55.48 52.97 3.26
Dumaguete 55.61 75.33 73.09 1.08
Agusan S ur 72.07 54.32 52.85 2.12
T able 2. S elec ted E duc ation Indic ator for L oc al S ervic e Delivery (L S D) Areas , S Y 2005-
2006
T able 3. S elec ted Health Indic ator, 2005
Maternal Infant % of Deliveries F ully T B Hous ehold Hous ehold
Death Death by Health Immunized Morbidity with without
R ate R ate P rofes s ion C hild R ate S afe Water S anitation
P hilippines 0.7 9.7 68.4 83.7 159.0 81.8 73.9
R egion 7 0.5 9.4 74.2 83.9 140.2 82.8 66.0
Negros O riental 0.8 5.0 50.3 75.2 104.7 64.4 58.3
Dumaguete 0.3 14.3 91.8 83.8 90.1 100.0 99.6
C AR AG A 1.7 7.4 50.4 78.5 162.8 81.9 78.2
Agusan Del S ur 1.4 5.8 54.7 75.8 111.7 67.2 65.6
Given this perspective, it is critical that the Philippines exercises greater vigilance and
exerts increased effort in addressing the requirements of achieving the MDGs.
In this study, public spending on the MDGs is defined to consist of expenditures on
human development priorities or basic social services (including basic shelter),27
pro-
poor infrastructure, land re-distribution, income enhancement measures (including
livelihood projects), and social safety nets (including subsidies and cash or in-kind
transfers to the poor). In turn, basic social services consist of basic health (including
and reproductive health), basic education (including early childhood, elementary,
secondary, literacy, and life skill education), low-cost water supply and sanitation,
nutrition support, and social welfare and development services (Figure 1).
27
The inclusion of shelter in basic social services or in poverty alleviation programs is a matter of debate.
The World Summit for Social Development (WSSD) Program for Action suggests the addition of shelter
and employment as part of basic human needs. However, the role of governments in the provision of
housing is less direct (i.e., more in the nature of providing an enabling environment rather than in providing
direct budgetary support) than in the case of other basic social services and many analysts have argued that
shelter should not be part of human development priorities or 20/20 expenditures (UNDP 1996).
Nonetheless, for the purposes of this study, we have decided to include the government expenditures on
pro-poor housing (specifically those related to the community mortgage program and the resettlement of
informal settlers) as part of government spending on basic social services.
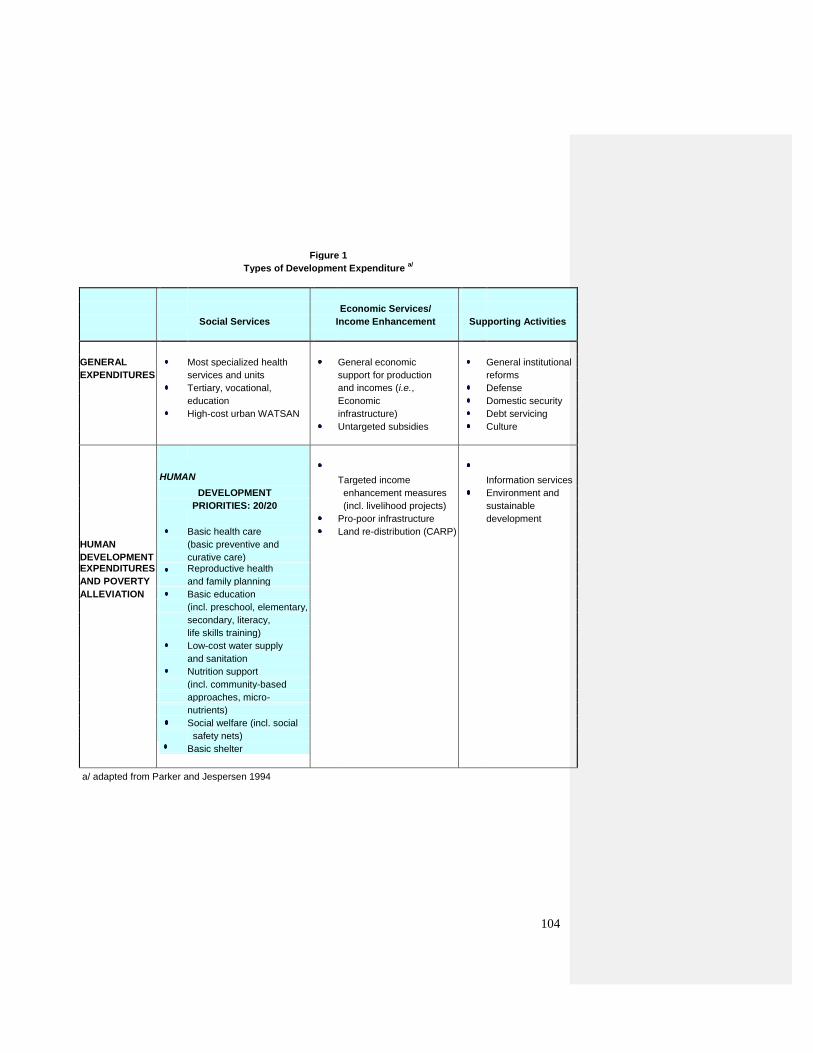
104
Figure 1
Types of Development Expenditure a/
Economic Services/
Social Services Income Enhancement Supporting Activities
GENERAL Most specialized health General economic General institutional
EXPENDITURES services and units support for production reforms
Tertiary, vocational, and incomes (i.e., Defense
education Economic Domestic security
High-cost urban WATSAN infrastructure) Debt servicing
Untargeted subsidies Culture
HUMAN
Targeted income
Information services
DEVELOPMENT enhancement measures Environment and
PRIORITIES: 20/20 (incl. livelihood projects) sustainable
Pro-poor infrastructure development
Basic health care Land re-distribution (CARP)
HUMAN (basic preventive and
DEVELOPMENT curative care) EXPENDITURES Reproductive health
AND POVERTY and family planning
ALLEVIATION Basic education
(incl. preschool, elementary,
secondary, literacy,
life skills training)
Low-cost water supply
and sanitation
Nutrition support
(incl. community-based
approaches, micro-
nutrients)
Social welfare (incl. social
safety nets)
Basic shelter
a/ adapted from Parker and Jespersen 1994
105
Expenditure indicators. The following indicators are used in designing and
monitoring expenditure programs that are highly focused on the attainment of human
development objectives:
Public expenditure ratio – the proportion of GDP that goes into the overall
government expenditure program;
Social allocation ratio – the proportion of government expenditures set aside for
social services;
Social priority ratio – the proportion of government social sector spending
allocated for human priority concerns;
Human development expenditure ratio – the proportion of GDP earmarked for
human priority concerns;28
and
Human development priority ratio - the proportion of total government
expenditure that is allocated to human development priorities.29
These indicators are helpful in decomposing the trend in government spending on
human priority concerns. As such, they naturally suggest changes in policies that are
needed in order to increase the amount of resources available for human development
priorities and the attainment of the MDGs.
Over and above the expenditure ratios discussed above, the present study also tracks
per capita public sector expenditures on the basic social sectors and on other MDG-
related interventions. This is made in view of the usefulness of said indicator in
measuring the overall adequacy of government spending and serving as a proxy for the
amount of the amount of resources available to fund service levels relative to some
benchmark year.
Central-local relations in financing and service delivery. The financing and
delivery of basic social services is effectively a responsibility shared by the central
government and local government units. Thus, it is important that the trends in the
size and composition of both central government and LGU spending be analyzed.
28
The human expenditure ratio is a product of the first three ratios, i.e.,: (1) the public expenditure ratio, (2)
the social allocation ratio and (3) the social priority ratio. The 1991 HDR noted that the human expenditure
ratio may need to be in the vicinity of 5% if a country wishes to perform well in terms of human
development. Various combinations of values for the public expenditure ratio, the social allocation ratio
and the social priority ratio will yield the targeted human expenditure ratio. However, the report pointed
out that ―a preferred option is to keep the public expenditure ratio moderate (around 25%), allocate much of
this to the social sectors (more than 40%), and focus on human priority areas (giving them more than 50%
of total social sector expenditures).‖ 29
In this paper, ―basic social services,‖ ―human development priority concerns‖ and ―20/20 items‖ are used
interchangeably.
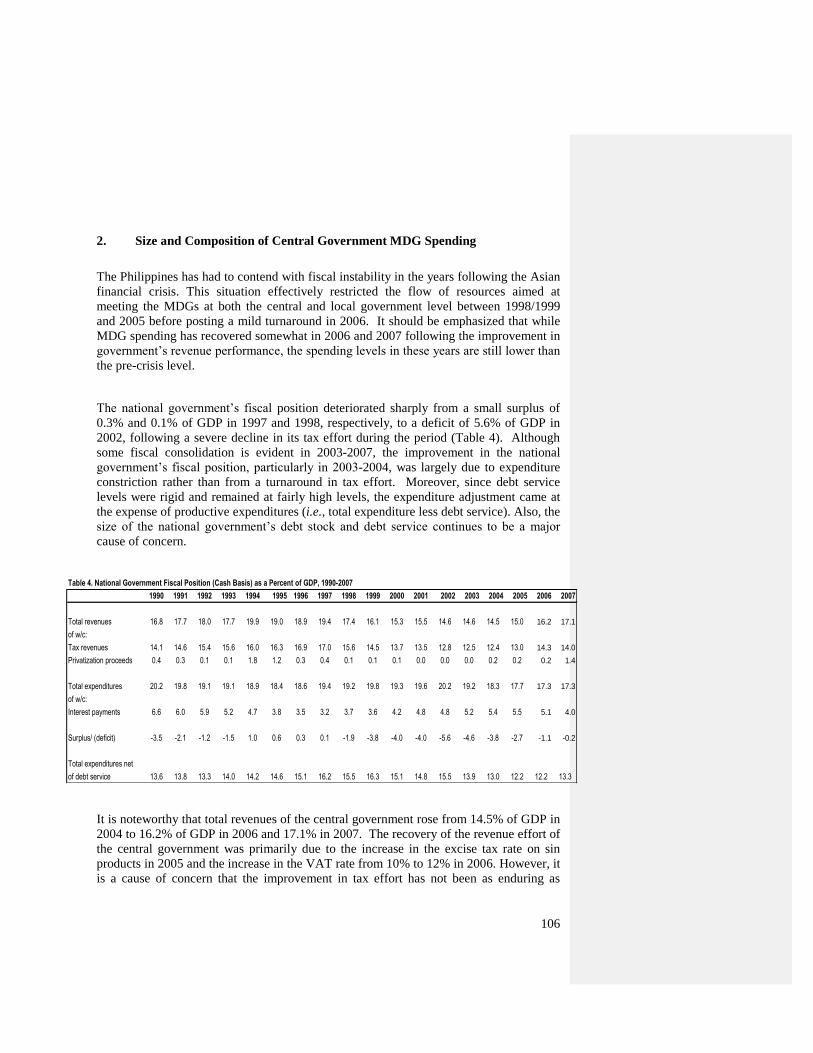
106
2. Size and Composition of Central Government MDG Spending
The Philippines has had to contend with fiscal instability in the years following the Asian
financial crisis. This situation effectively restricted the flow of resources aimed at
meeting the MDGs at both the central and local government level between 1998/1999
and 2005 before posting a mild turnaround in 2006. It should be emphasized that while
MDG spending has recovered somewhat in 2006 and 2007 following the improvement in
government‘s revenue performance, the spending levels in these years are still lower than
the pre-crisis level.
The national government‘s fiscal position deteriorated sharply from a small surplus of
0.3% and 0.1% of GDP in 1997 and 1998, respectively, to a deficit of 5.6% of GDP in
2002, following a severe decline in its tax effort during the period (Table 4). Although
some fiscal consolidation is evident in 2003-2007, the improvement in the national
government‘s fiscal position, particularly in 2003-2004, was largely due to expenditure
constriction rather than from a turnaround in tax effort. Moreover, since debt service
levels were rigid and remained at fairly high levels, the expenditure adjustment came at
the expense of productive expenditures (i.e., total expenditure less debt service). Also, the
size of the national government‘s debt stock and debt service continues to be a major
cause of concern.
Table 4. National Government Fiscal Position (Cash Basis) as a Percent of GDP, 1990-2007
1990 1991 1992 1993 1994 1995 1996 1997 1998 1999 2000 2001 2002 2003 2004 2005 2006 2007
Total revenues 16.8 17.7 18.0 17.7 19.9 19.0 18.9 19.4 17.4 16.1 15.3 15.5 14.6 14.6 14.5 15.0 16.2 17.1
of w/c:
Tax revenues 14.1 14.6 15.4 15.6 16.0 16.3 16.9 17.0 15.6 14.5 13.7 13.5 12.8 12.5 12.4 13.0 14.3 14.0
Privatization proceeds 0.4 0.3 0.1 0.1 1.8 1.2 0.3 0.4 0.1 0.1 0.1 0.0 0.0 0.0 0.2 0.2 0.2 1.4
Total expenditures 20.2 19.8 19.1 19.1 18.9 18.4 18.6 19.4 19.2 19.8 19.3 19.6 20.2 19.2 18.3 17.7 17.3 17.3
of w/c:
Interest payments 6.6 6.0 5.9 5.2 4.7 3.8 3.5 3.2 3.7 3.6 4.2 4.8 4.8 5.2 5.4 5.5 5.1 4.0
Surplus/ (deficit) -3.5 -2.1 -1.2 -1.5 1.0 0.6 0.3 0.1 -1.9 -3.8 -4.0 -4.0 -5.6 -4.6 -3.8 -2.7 -1.1 -0.2
Total expenditures net
of debt service 13.6 13.8 13.3 14.0 14.2 14.6 15.1 16.2 15.5 16.3 15.1 14.8 15.5 13.9 13.0 12.2 12.2 13.3
It is noteworthy that total revenues of the central government rose from 14.5% of GDP in
2004 to 16.2% of GDP in 2006 and 17.1% in 2007. The recovery of the revenue effort of
the central government was primarily due to the increase in the excise tax rate on sin
products in 2005 and the increase in the VAT rate from 10% to 12% in 2006. However, it
is a cause of concern that the improvement in tax effort has not been as enduring as
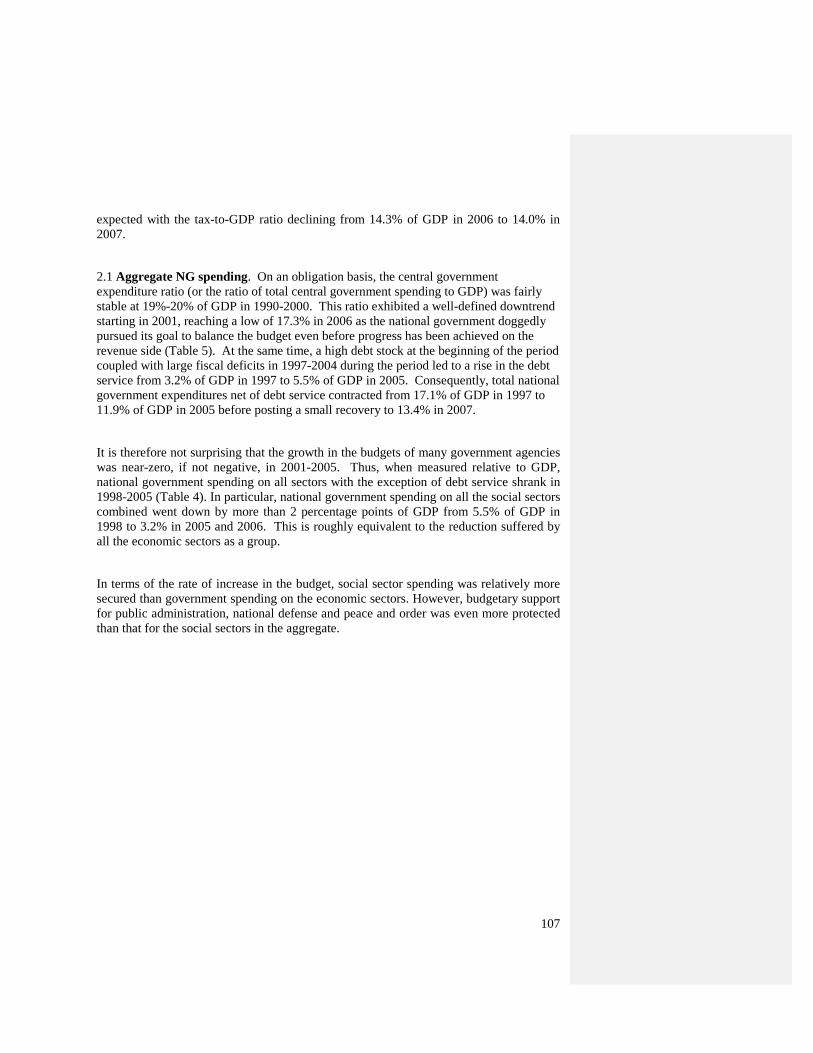
107
expected with the tax-to-GDP ratio declining from 14.3% of GDP in 2006 to 14.0% in
2007.
2.1 Aggregate NG spending. On an obligation basis, the central government
expenditure ratio (or the ratio of total central government spending to GDP) was fairly
stable at 19%-20% of GDP in 1990-2000. This ratio exhibited a well-defined downtrend
starting in 2001, reaching a low of 17.3% in 2006 as the national government doggedly
pursued its goal to balance the budget even before progress has been achieved on the
revenue side (Table 5). At the same time, a high debt stock at the beginning of the period
coupled with large fiscal deficits in 1997-2004 during the period led to a rise in the debt
service from 3.2% of GDP in 1997 to 5.5% of GDP in 2005. Consequently, total national
government expenditures net of debt service contracted from 17.1% of GDP in 1997 to
11.9% of GDP in 2005 before posting a small recovery to 13.4% in 2007.
It is therefore not surprising that the growth in the budgets of many government agencies
was near-zero, if not negative, in 2001-2005. Thus, when measured relative to GDP,
national government spending on all sectors with the exception of debt service shrank in
1998-2005 (Table 4). In particular, national government spending on all the social sectors
combined went down by more than 2 percentage points of GDP from 5.5% of GDP in
1998 to 3.2% in 2005 and 2006. This is roughly equivalent to the reduction suffered by
all the economic sectors as a group.
In terms of the rate of increase in the budget, social sector spending was relatively more
secured than government spending on the economic sectors. However, budgetary support
for public administration, national defense and peace and order was even more protected
than that for the social sectors in the aggregate.
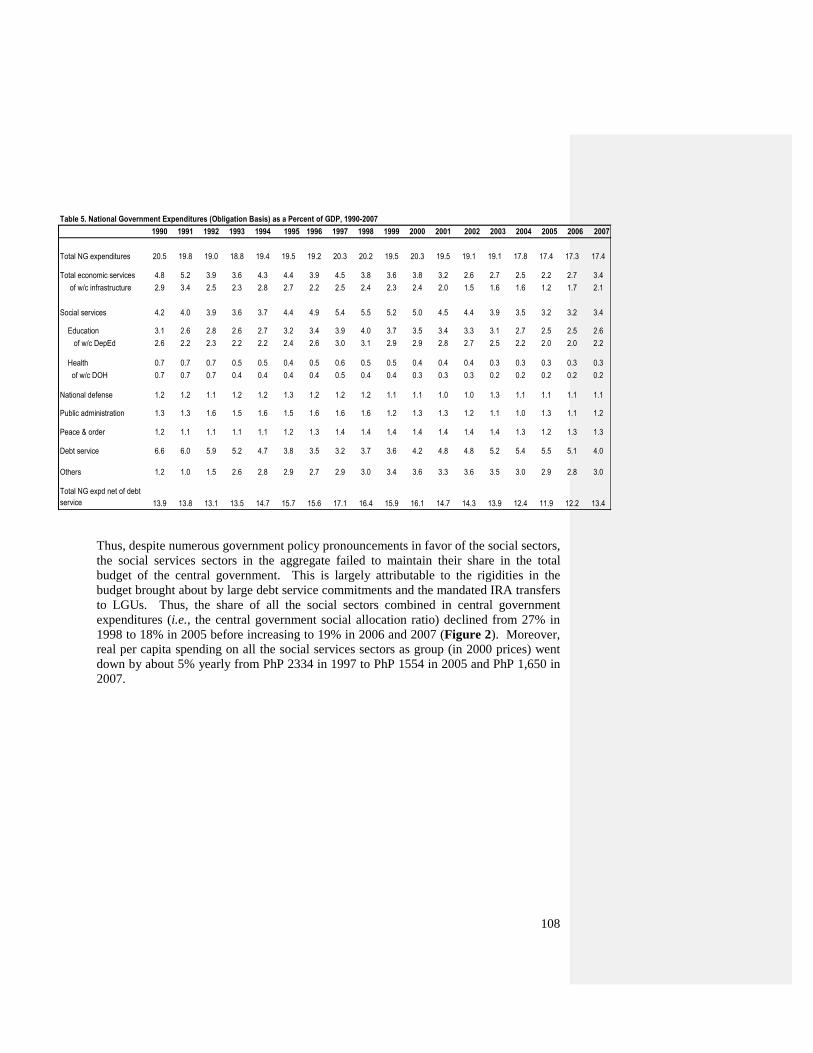
108
Table 5. National Government Expenditures (Obligation Basis) as a Percent of GDP, 1990-2007
1990 1991 1992 1993 1994 1995 1996 1997 1998 1999 2000 2001 2002 2003 2004 2005 2006 2007
Total NG expenditures 20.5 19.8 19.0 18.8 19.4 19.5 19.2 20.3 20.2 19.5 20.3 19.5 19.1 19.1 17.8 17.4 17.3 17.4
Total economic services 4.8 5.2 3.9 3.6 4.3 4.4 3.9 4.5 3.8 3.6 3.8 3.2 2.6 2.7 2.5 2.2 2.7 3.4
of w/c infrastructure 2.9 3.4 2.5 2.3 2.8 2.7 2.2 2.5 2.4 2.3 2.4 2.0 1.5 1.6 1.6 1.2 1.7 2.1
Social services 4.2 4.0 3.9 3.6 3.7 4.4 4.9 5.4 5.5 5.2 5.0 4.5 4.4 3.9 3.5 3.2 3.2 3.4
Education 3.1 2.6 2.8 2.6 2.7 3.2 3.4 3.9 4.0 3.7 3.5 3.4 3.3 3.1 2.7 2.5 2.5 2.6
of w/c DepEd 2.6 2.2 2.3 2.2 2.2 2.4 2.6 3.0 3.1 2.9 2.9 2.8 2.7 2.5 2.2 2.0 2.0 2.2
Health 0.7 0.7 0.7 0.5 0.5 0.4 0.5 0.6 0.5 0.5 0.4 0.4 0.4 0.3 0.3 0.3 0.3 0.3
of w/c DOH 0.7 0.7 0.7 0.4 0.4 0.4 0.4 0.5 0.4 0.4 0.3 0.3 0.3 0.2 0.2 0.2 0.2 0.2
National defense 1.2 1.2 1.1 1.2 1.2 1.3 1.2 1.2 1.2 1.1 1.1 1.0 1.0 1.3 1.1 1.1 1.1 1.1
Public administration 1.3 1.3 1.6 1.5 1.6 1.5 1.6 1.6 1.6 1.2 1.3 1.3 1.2 1.1 1.0 1.3 1.1 1.2
Peace & order 1.2 1.1 1.1 1.1 1.1 1.2 1.3 1.4 1.4 1.4 1.4 1.4 1.4 1.4 1.3 1.2 1.3 1.3
Debt service 6.6 6.0 5.9 5.2 4.7 3.8 3.5 3.2 3.7 3.6 4.2 4.8 4.8 5.2 5.4 5.5 5.1 4.0
Others 1.2 1.0 1.5 2.6 2.8 2.9 2.7 2.9 3.0 3.4 3.6 3.3 3.6 3.5 3.0 2.9 2.8 3.0
Total NG expd net of debt
service 13.9 13.8 13.1 13.5 14.7 15.7 15.6 17.1 16.4 15.9 16.1 14.7 14.3 13.9 12.4 11.9 12.2 13.4
Thus, despite numerous government policy pronouncements in favor of the social sectors,
the social services sectors in the aggregate failed to maintain their share in the total
budget of the central government. This is largely attributable to the rigidities in the
budget brought about by large debt service commitments and the mandated IRA transfers
to LGUs. Thus, the share of all the social sectors combined in central government
expenditures (i.e., the central government social allocation ratio) declined from 27% in
1998 to 18% in 2005 before increasing to 19% in 2006 and 2007 (Figure 2). Moreover,
real per capita spending on all the social services sectors as group (in 2000 prices) went
down by about 5% yearly from PhP 2334 in 1997 to PhP 1554 in 2005 and PhP 1,650 in
2007.
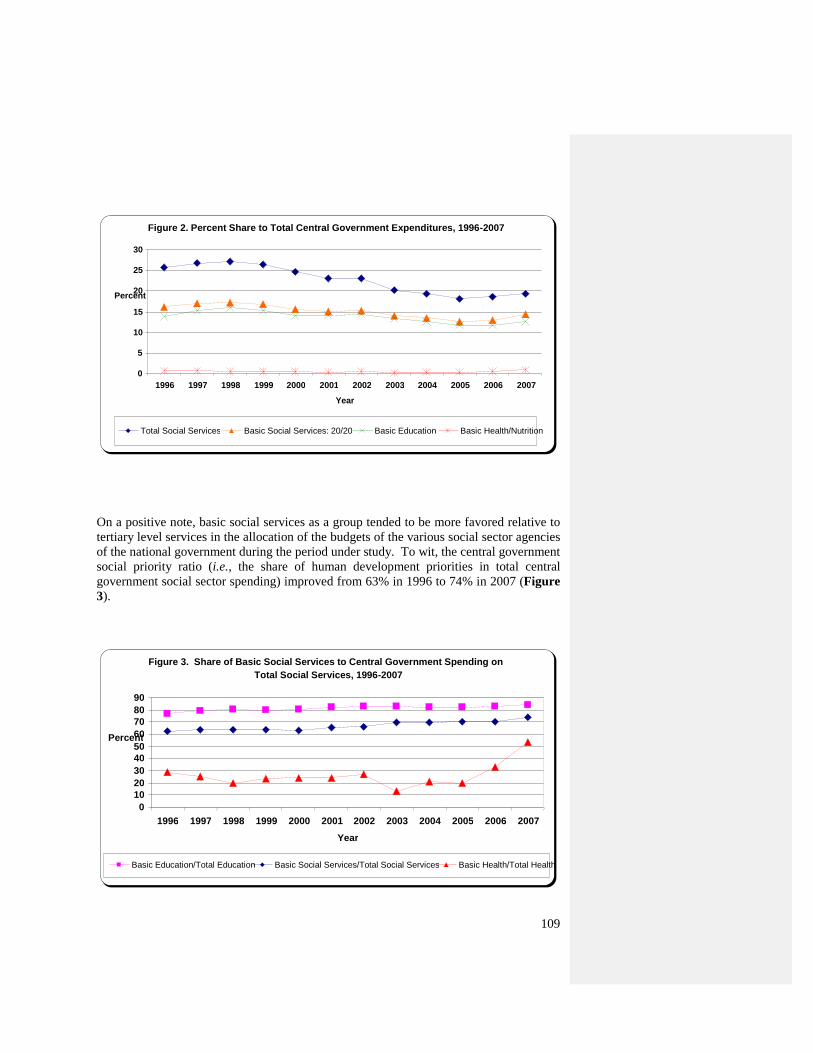
109
On a positive note, basic social services as a group tended to be more favored relative to
tertiary level services in the allocation of the budgets of the various social sector agencies
of the national government during the period under study. To wit, the central government
social priority ratio (i.e., the share of human development priorities in total central
government social sector spending) improved from 63% in 1996 to 74% in 2007 (Figure
3).
Figure 2. Percent Share to Total Central Government Expenditures, 1996-2007
0
5
10
15
20
25
30
1996 1997 1998 1999 2000 2001 2002 2003 2004 2005 2006 2007
Year
Percent
Total Social Services Basic Social Services: 20/20 Basic Education Basic Health/Nutrition
Figure 3. Share of Basic Social Services to Central Government Spending on Total Social Services, 1996-2007
0 10 20 30 40 50 60 70 80 90
1996 1997 1998 1999 2000 2001 2002 2003 2004 2005 2006 2007
Year
Percent
Basic Education/Total Education Basic Social Services/Total Social Services Basic Health/Total Health
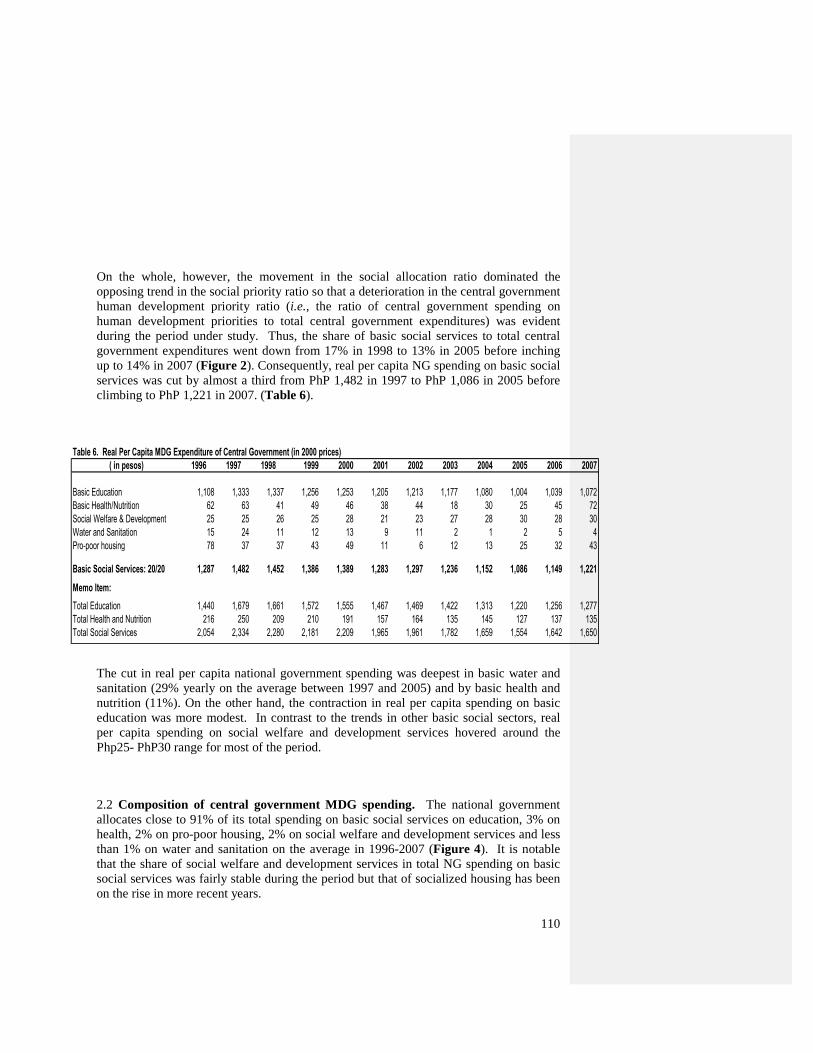
110
On the whole, however, the movement in the social allocation ratio dominated the
opposing trend in the social priority ratio so that a deterioration in the central government
human development priority ratio (i.e., the ratio of central government spending on
human development priorities to total central government expenditures) was evident
during the period under study. Thus, the share of basic social services to total central
government expenditures went down from 17% in 1998 to 13% in 2005 before inching
up to 14% in 2007 (Figure 2). Consequently, real per capita NG spending on basic social
services was cut by almost a third from PhP 1,482 in 1997 to PhP 1,086 in 2005 before
climbing to PhP 1,221 in 2007. (Table 6).
Table 6. Real Per Capita MDG Expenditure of Central Government (in 2000 prices)
( in pesos) 1996 1997 1998 1999 2000 2001 2002 2003 2004 2005 2006 2007
Basic Education 1,108 1,333 1,337 1,256 1,253 1,205 1,213 1,177 1,080 1,004 1,039 1,072
Basic Health/Nutrition 62 63 41 49 46 38 44 18 30 25 45 72
Social Welfare & Development 25 25 26 25 28 21 23 27 28 30 28 30
Water and Sanitation 15 24 11 12 13 9 11 2 1 2 5 4
Pro-poor housing 78 37 37 43 49 11 6 12 13 25 32 43
Basic Social Services: 20/20 1,287 1,482 1,452 1,386 1,389 1,283 1,297 1,236 1,152 1,086 1,149 1,221
Memo Item:
Total Education 1,440 1,679 1,661 1,572 1,555 1,467 1,469 1,422 1,313 1,220 1,256 1,277
Total Health and Nutrition 216 250 209 210 191 157 164 135 145 127 137 135
Total Social Services 2,054 2,334 2,280 2,181 2,209 1,965 1,961 1,782 1,659 1,554 1,642 1,650
The cut in real per capita national government spending was deepest in basic water and
sanitation (29% yearly on the average between 1997 and 2005) and by basic health and
nutrition (11%). On the other hand, the contraction in real per capita spending on basic
education was more modest. In contrast to the trends in other basic social sectors, real
per capita spending on social welfare and development services hovered around the
Php25- PhP30 range for most of the period.
2.2 Composition of central government MDG spending. The national government
allocates close to 91% of its total spending on basic social services on education, 3% on
health, 2% on pro-poor housing, 2% on social welfare and development services and less
than 1% on water and sanitation on the average in 1996-2007 (Figure 4). It is notable
that the share of social welfare and development services in total NG spending on basic
social services was fairly stable during the period but that of socialized housing has been
on the rise in more recent years.
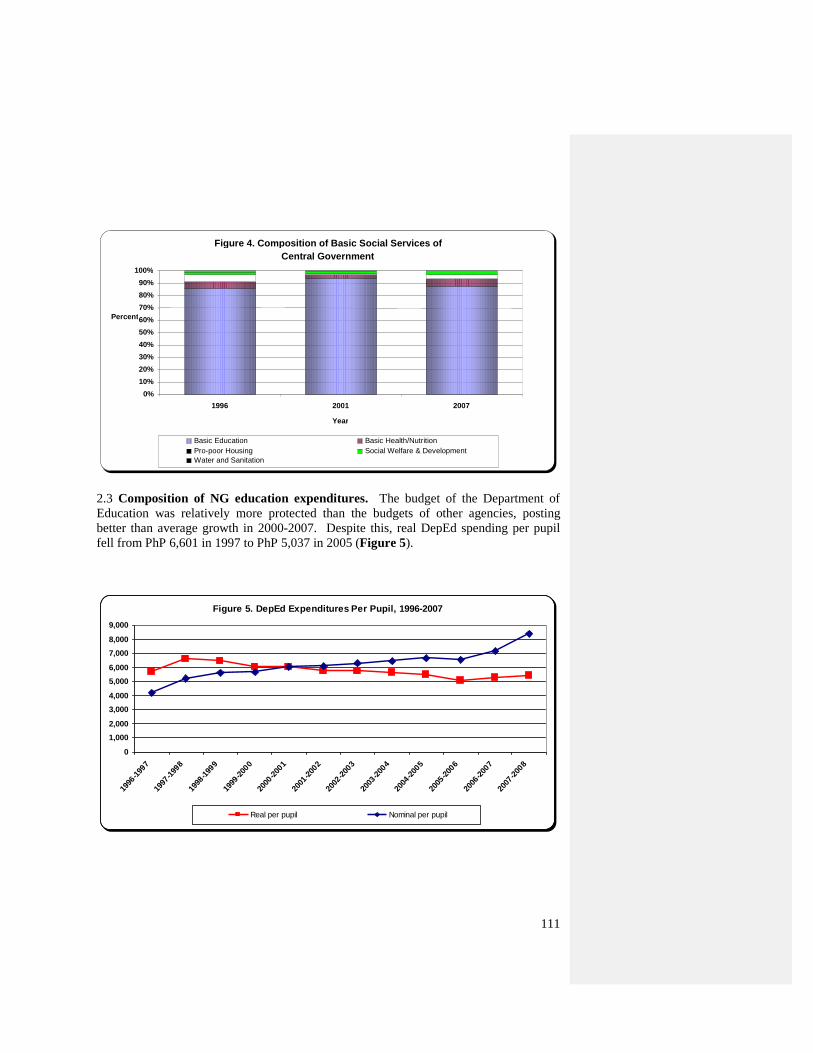
111
2.3 Composition of NG education expenditures. The budget of the Department of
Education was relatively more protected than the budgets of other agencies, posting
better than average growth in 2000-2007. Despite this, real DepEd spending per pupil
fell from PhP 6,601 in 1997 to PhP 5,037 in 2005 (Figure 5).
Figure 5. DepEd Expenditures Per Pupil, 1996-2007
0
1,000
2,000
3,000
4,000
5,000
6,000
7,000
8,000
9,000
1996
-199
7
1997
-199
8
1998
-199
9
1999
-200
0
2000
-200
1
2001
-200
2
2002
-200
3
2003
-200
4
2004
-200
5
2005
-200
6
2006
-200
7
2007
-200
8
Real per pupil Nominal per pupil
Figure 4. Composition of Basic Social Services of Central Government
0% 10% 20% 30% 40% 50% 60% 70% 80% 90%
100%
1996 2001 2007
Year
Percent
Basic Education Basic Health/Nutrition Pro-poor Housing Social Welfare & Development Water and Sanitation
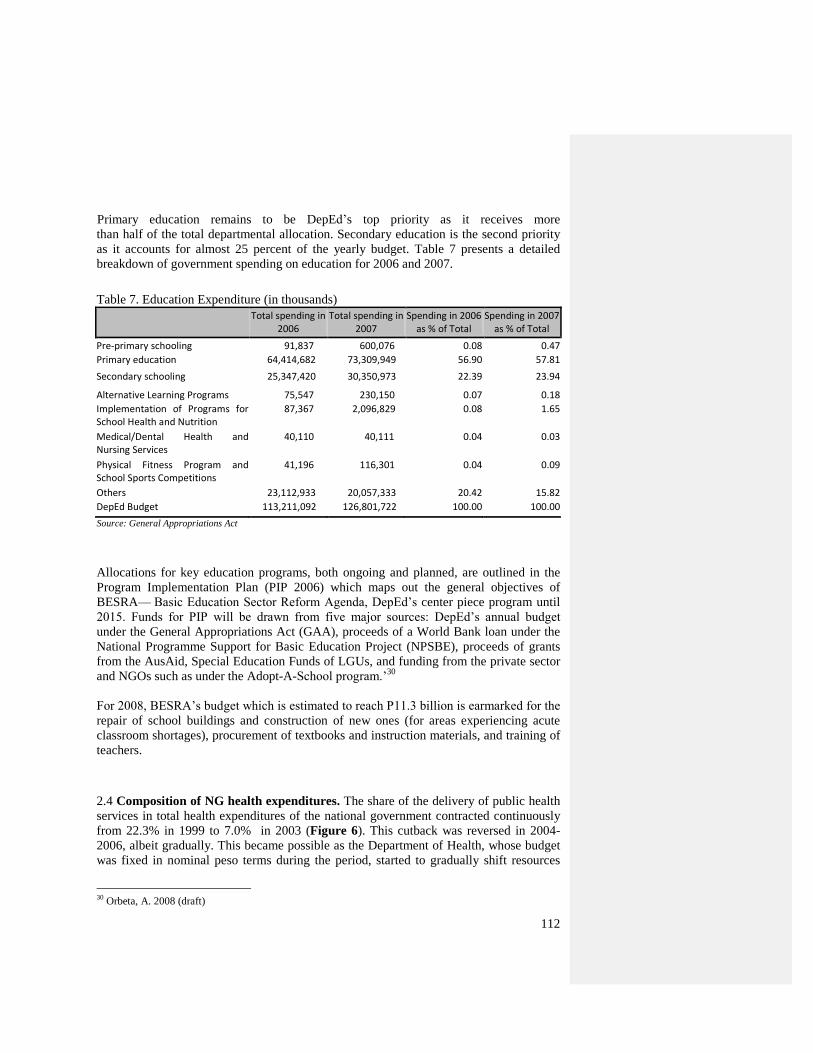
112
Primary education remains to be DepEd‘s top priority as it receives more
than half of the total departmental allocation. Secondary education is the second priority
as it accounts for almost 25 percent of the yearly budget. Table 7 presents a detailed
breakdown of government spending on education for 2006 and 2007.
Table 7. Education Expenditure (in thousands)
Total spending in 2006
Total spending in 2007
Spending in 2006 as % of Total
Spending in 2007 as % of Total
Pre-primary schooling 91,837 600,076 0.08 0.47
Primary education 64,414,682 73,309,949 56.90 57.81
Secondary schooling 25,347,420 30,350,973 22.39 23.94
Alternative Learning Programs 75,547 230,150 0.07 0.18
Implementation of Programs for School Health and Nutrition
87,367 2,096,829 0.08 1.65
Medical/Dental Health and Nursing Services
40,110 40,111 0.04 0.03
Physical Fitness Program and School Sports Competitions
41,196 116,301 0.04 0.09
Others 23,112,933 20,057,333 20.42 15.82
DepEd Budget 113,211,092 126,801,722 100.00 100.00
Source: General Appropriations Act
Allocations for key education programs, both ongoing and planned, are outlined in the
Program Implementation Plan (PIP 2006) which maps out the general objectives of
BESRA— Basic Education Sector Reform Agenda, DepEd‘s center piece program until
2015. Funds for PIP will be drawn from five major sources: DepEd‘s annual budget
under the General Appropriations Act (GAA), proceeds of a World Bank loan under the
National Programme Support for Basic Education Project (NPSBE), proceeds of grants
from the AusAid, Special Education Funds of LGUs, and funding from the private sector
and NGOs such as under the Adopt-A-School program.‘30
For 2008, BESRA‘s budget which is estimated to reach P11.3 billion is earmarked for the
repair of school buildings and construction of new ones (for areas experiencing acute
classroom shortages), procurement of textbooks and instruction materials, and training of
teachers.
2.4 Composition of NG health expenditures. The share of the delivery of public health
services in total health expenditures of the national government contracted continuously
from 22.3% in 1999 to 7.0% in 2003 (Figure 6). This cutback was reversed in 2004-
2006, albeit gradually. This became possible as the Department of Health, whose budget
was fixed in nominal peso terms during the period, started to gradually shift resources
30
Orbeta, A. 2008 (draft)
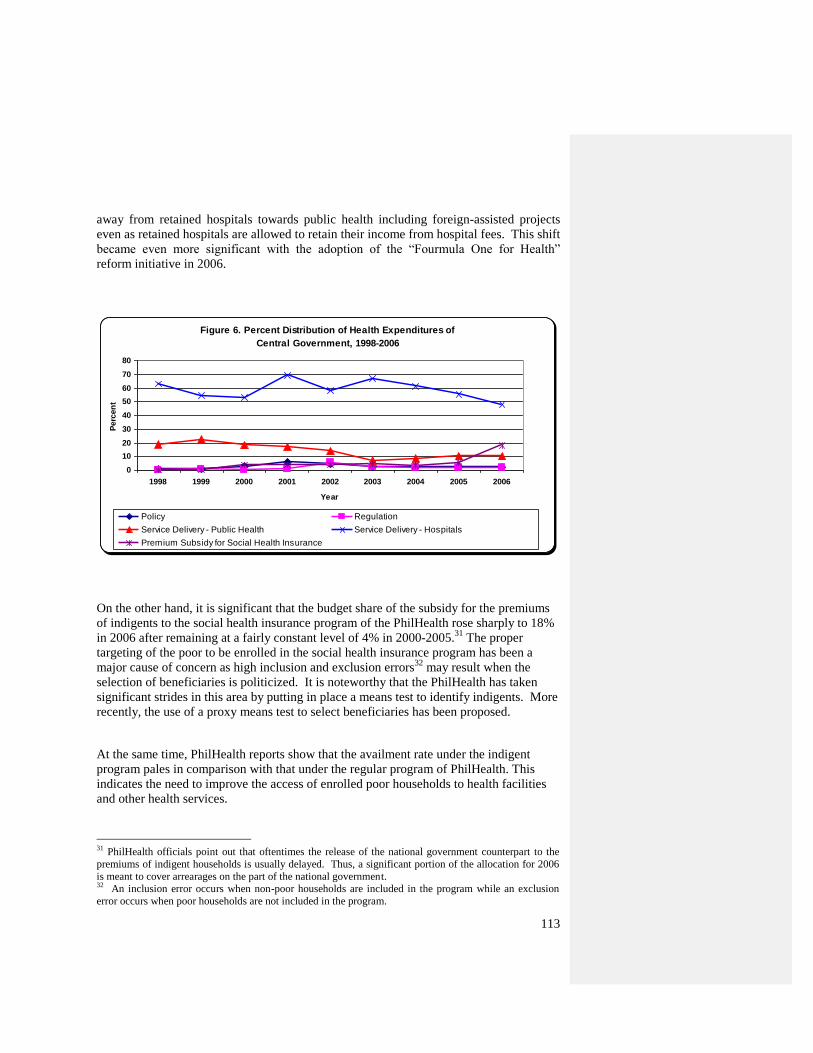
113
away from retained hospitals towards public health including foreign-assisted projects
even as retained hospitals are allowed to retain their income from hospital fees. This shift
became even more significant with the adoption of the ―Fourmula One for Health‖
reform initiative in 2006.
Figure 6. Percent Distribution of Health Expenditures of
Central Government, 1998-2006
0
10
20
30
40
50
60
70
80
1998 1999 2000 2001 2002 2003 2004 2005 2006
Year
Perc
en
t
Policy Regulation
Service Delivery - Public Health Service Delivery - Hospitals
Premium Subsidy for Social Health Insurance
On the other hand, it is significant that the budget share of the subsidy for the premiums
of indigents to the social health insurance program of the PhilHealth rose sharply to 18%
in 2006 after remaining at a fairly constant level of 4% in 2000-2005.31
The proper
targeting of the poor to be enrolled in the social health insurance program has been a
major cause of concern as high inclusion and exclusion errors32
may result when the
selection of beneficiaries is politicized. It is noteworthy that the PhilHealth has taken
significant strides in this area by putting in place a means test to identify indigents. More
recently, the use of a proxy means test to select beneficiaries has been proposed.
At the same time, PhilHealth reports show that the availment rate under the indigent
program pales in comparison with that under the regular program of PhilHealth. This
indicates the need to improve the access of enrolled poor households to health facilities
and other health services.
31
PhilHealth officials point out that oftentimes the release of the national government counterpart to the
premiums of indigent households is usually delayed. Thus, a significant portion of the allocation for 2006
is meant to cover arrearages on the part of the national government. 32
An inclusion error occurs when non-poor households are included in the program while an exclusion
error occurs when poor households are not included in the program.
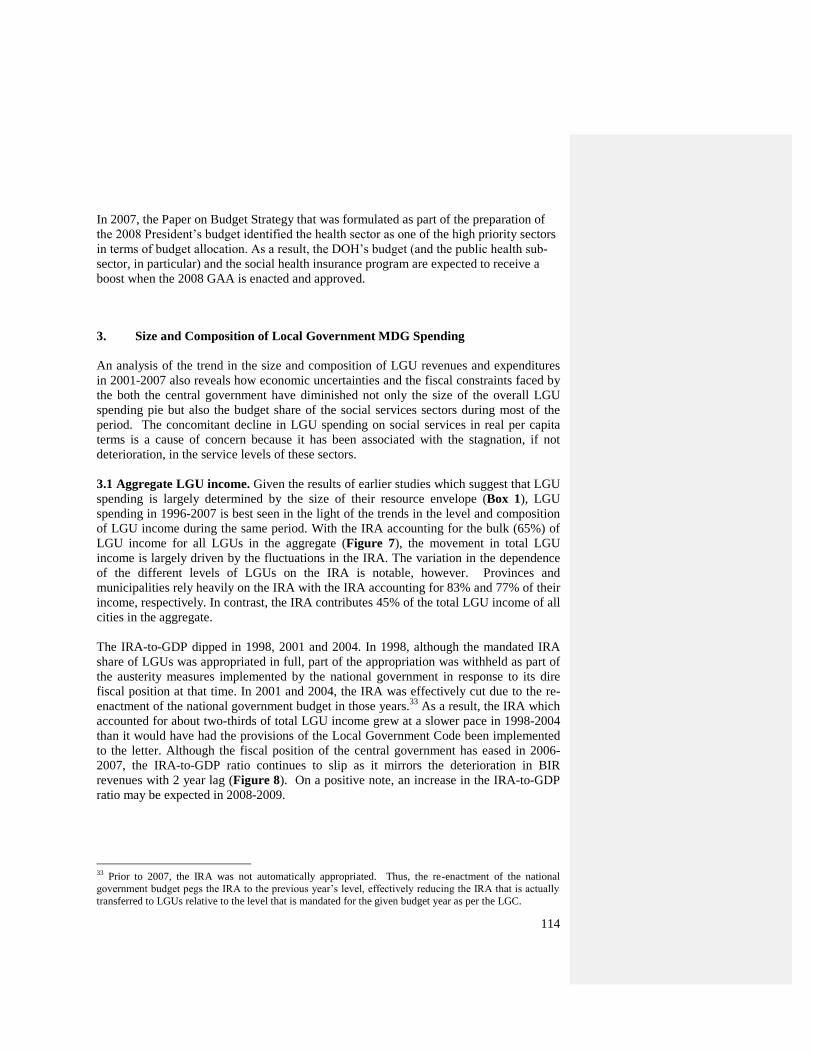
114
In 2007, the Paper on Budget Strategy that was formulated as part of the preparation of
the 2008 President‘s budget identified the health sector as one of the high priority sectors
in terms of budget allocation. As a result, the DOH‘s budget (and the public health sub-
sector, in particular) and the social health insurance program are expected to receive a
boost when the 2008 GAA is enacted and approved.
3. Size and Composition of Local Government MDG Spending
An analysis of the trend in the size and composition of LGU revenues and expenditures
in 2001-2007 also reveals how economic uncertainties and the fiscal constraints faced by
the both the central government have diminished not only the size of the overall LGU
spending pie but also the budget share of the social services sectors during most of the
period. The concomitant decline in LGU spending on social services in real per capita
terms is a cause of concern because it has been associated with the stagnation, if not
deterioration, in the service levels of these sectors.
3.1 Aggregate LGU income. Given the results of earlier studies which suggest that LGU
spending is largely determined by the size of their resource envelope (Box 1), LGU
spending in 1996-2007 is best seen in the light of the trends in the level and composition
of LGU income during the same period. With the IRA accounting for the bulk (65%) of
LGU income for all LGUs in the aggregate (Figure 7), the movement in total LGU
income is largely driven by the fluctuations in the IRA. The variation in the dependence
of the different levels of LGUs on the IRA is notable, however. Provinces and
municipalities rely heavily on the IRA with the IRA accounting for 83% and 77% of their
income, respectively. In contrast, the IRA contributes 45% of the total LGU income of all
cities in the aggregate.
The IRA-to-GDP dipped in 1998, 2001 and 2004. In 1998, although the mandated IRA
share of LGUs was appropriated in full, part of the appropriation was withheld as part of
the austerity measures implemented by the national government in response to its dire
fiscal position at that time. In 2001 and 2004, the IRA was effectively cut due to the re-
enactment of the national government budget in those years.33
As a result, the IRA which
accounted for about two-thirds of total LGU income grew at a slower pace in 1998-2004
than it would have had the provisions of the Local Government Code been implemented
to the letter. Although the fiscal position of the central government has eased in 2006-
2007, the IRA-to-GDP ratio continues to slip as it mirrors the deterioration in BIR
revenues with 2 year lag (Figure 8). On a positive note, an increase in the IRA-to-GDP
ratio may be expected in 2008-2009.
33
Prior to 2007, the IRA was not automatically appropriated. Thus, the re-enactment of the national
government budget pegs the IRA to the previous year‘s level, effectively reducing the IRA that is actually
transferred to LGUs relative to the level that is mandated for the given budget year as per the LGC.
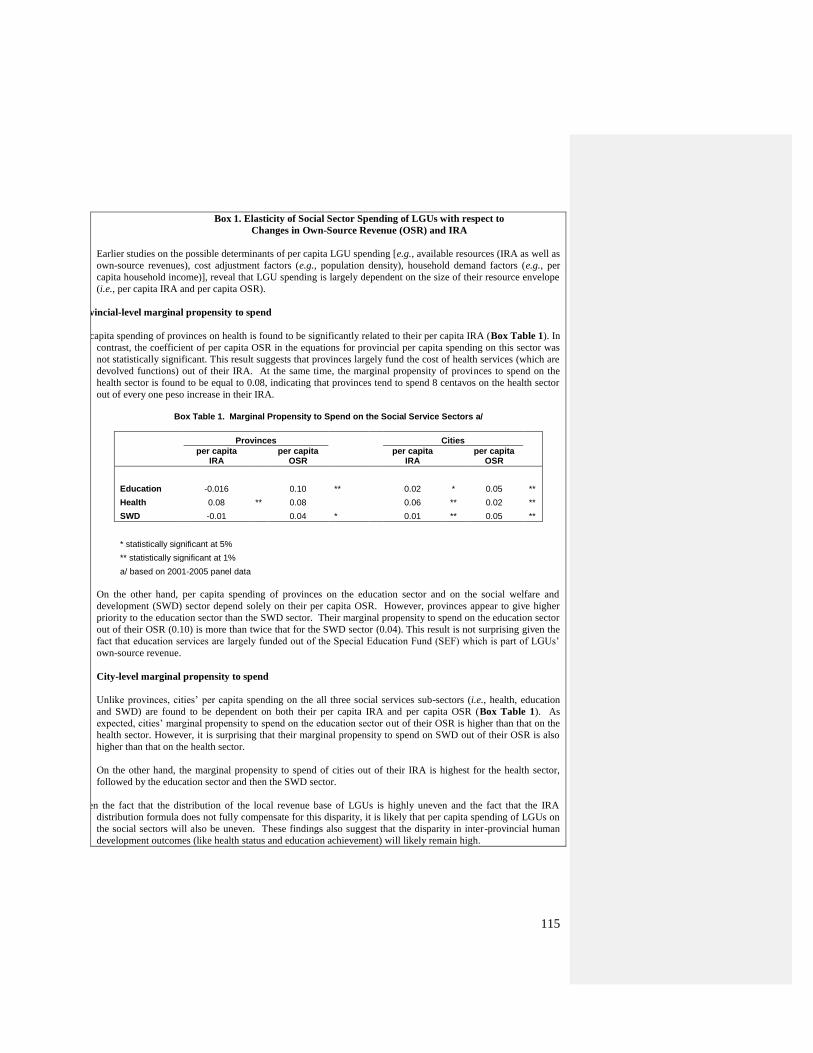
115
Box 1. Elasticity of Social Sector Spending of LGUs with respect to
Changes in Own-Source Revenue (OSR) and IRA
Earlier studies on the possible determinants of per capita LGU spending [e.g., available resources (IRA as well as
own-source revenues), cost adjustment factors (e.g., population density), household demand factors (e.g., per
capita household income)], reveal that LGU spending is largely dependent on the size of their resource envelope
(i.e., per capita IRA and per capita OSR).
Provincial-level marginal propensity to spend
Per capita spending of provinces on health is found to be significantly related to their per capita IRA (Box Table 1). In
contrast, the coefficient of per capita OSR in the equations for provincial per capita spending on this sector was
not statistically significant. This result suggests that provinces largely fund the cost of health services (which are
devolved functions) out of their IRA. At the same time, the marginal propensity of provinces to spend on the
health sector is found to be equal to 0.08, indicating that provinces tend to spend 8 centavos on the health sector
out of every one peso increase in their IRA.
Box Table 1. Marginal Propensity to Spend on the Social Service Sectors a/
Provinces Cities
per capita
IRA per capita
OSR per capita
IRA per capita
OSR
Education -0.016 0.10 ** 0.02 * 0.05 **
Health 0.08 ** 0.08 0.06 ** 0.02 **
SWD -0.01 0.04 * 0.01 ** 0.05 **
* statistically significant at 5%
** statistically significant at 1%
a/ based on 2001-2005 panel data
On the other hand, per capita spending of provinces on the education sector and on the social welfare and
development (SWD) sector depend solely on their per capita OSR. However, provinces appear to give higher
priority to the education sector than the SWD sector. Their marginal propensity to spend on the education sector
out of their OSR (0.10) is more than twice that for the SWD sector (0.04). This result is not surprising given the
fact that education services are largely funded out of the Special Education Fund (SEF) which is part of LGUs‘
own-source revenue.
City-level marginal propensity to spend
Unlike provinces, cities‘ per capita spending on the all three social services sub-sectors (i.e., health, education
and SWD) are found to be dependent on both their per capita IRA and per capita OSR (Box Table 1). As
expected, cities‘ marginal propensity to spend on the education sector out of their OSR is higher than that on the
health sector. However, it is surprising that their marginal propensity to spend on SWD out of their OSR is also
higher than that on the health sector.
On the other hand, the marginal propensity to spend of cities out of their IRA is highest for the health sector,
followed by the education sector and then the SWD sector.
Given the fact that the distribution of the local revenue base of LGUs is highly uneven and the fact that the IRA
distribution formula does not fully compensate for this disparity, it is likely that per capita spending of LGUs on
the social sectors will also be uneven. These findings also suggest that the disparity in inter-provincial human
development outcomes (like health status and education achievement) will likely remain high.
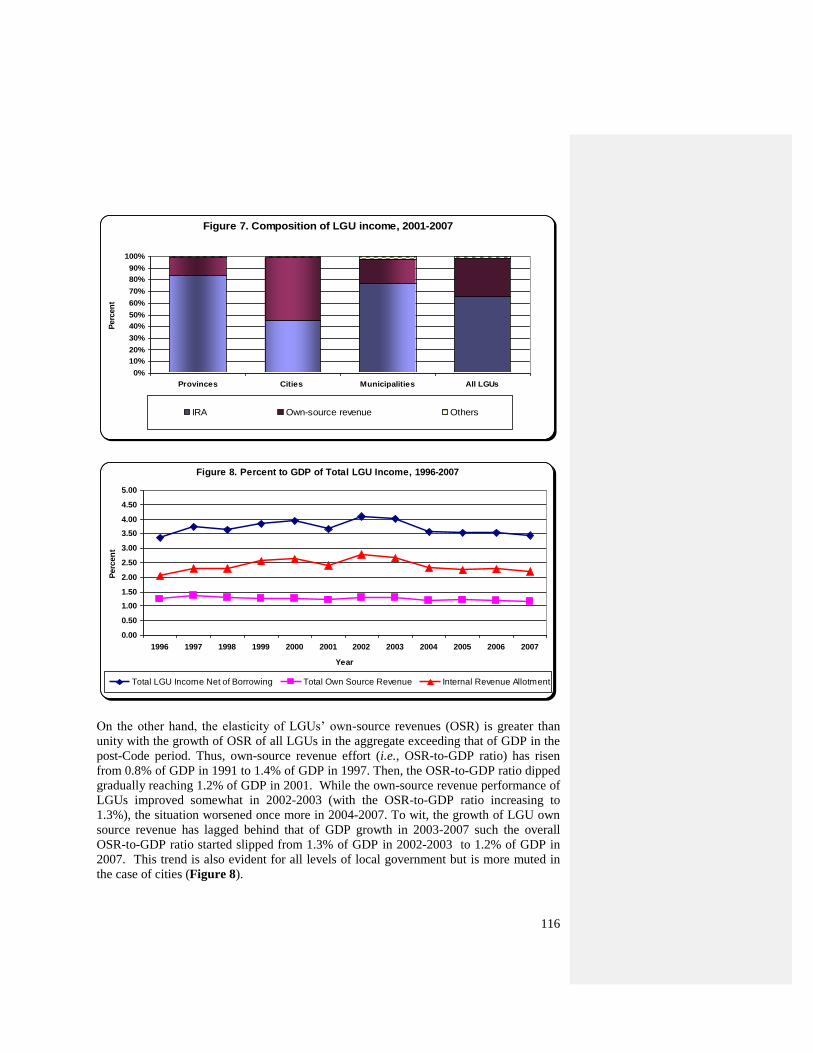
116
Figure 7. Composition of LGU income, 2001-2007
0%
10%
20%
30%
40%
50%
60%
70%
80%
90%
100%
Provinces Cities Municipalities All LGUs
Perc
en
t
IRA Own-source revenue Others
Figure 8. Percent to GDP of Total LGU Income, 1996-2007
0.00
0.50
1.00
1.50
2.00
2.50
3.00
3.50
4.00
4.50
5.00
1996 1997 1998 1999 2000 2001 2002 2003 2004 2005 2006 2007
Year
Perc
en
t
Total LGU Income Net of Borrowing Total Own Source Revenue Internal Revenue Allotment
On the other hand, the elasticity of LGUs‘ own-source revenues (OSR) is greater than
unity with the growth of OSR of all LGUs in the aggregate exceeding that of GDP in the
post-Code period. Thus, own-source revenue effort (i.e., OSR-to-GDP ratio) has risen
from 0.8% of GDP in 1991 to 1.4% of GDP in 1997. Then, the OSR-to-GDP ratio dipped
gradually reaching 1.2% of GDP in 2001. While the own-source revenue performance of
LGUs improved somewhat in 2002-2003 (with the OSR-to-GDP ratio increasing to
1.3%), the situation worsened once more in 2004-2007. To wit, the growth of LGU own
source revenue has lagged behind that of GDP growth in 2003-2007 such the overall
OSR-to-GDP ratio started slipped from 1.3% of GDP in 2002-2003 to 1.2% of GDP in
2007. This trend is also evident for all levels of local government but is more muted in
the case of cities (Figure 8).
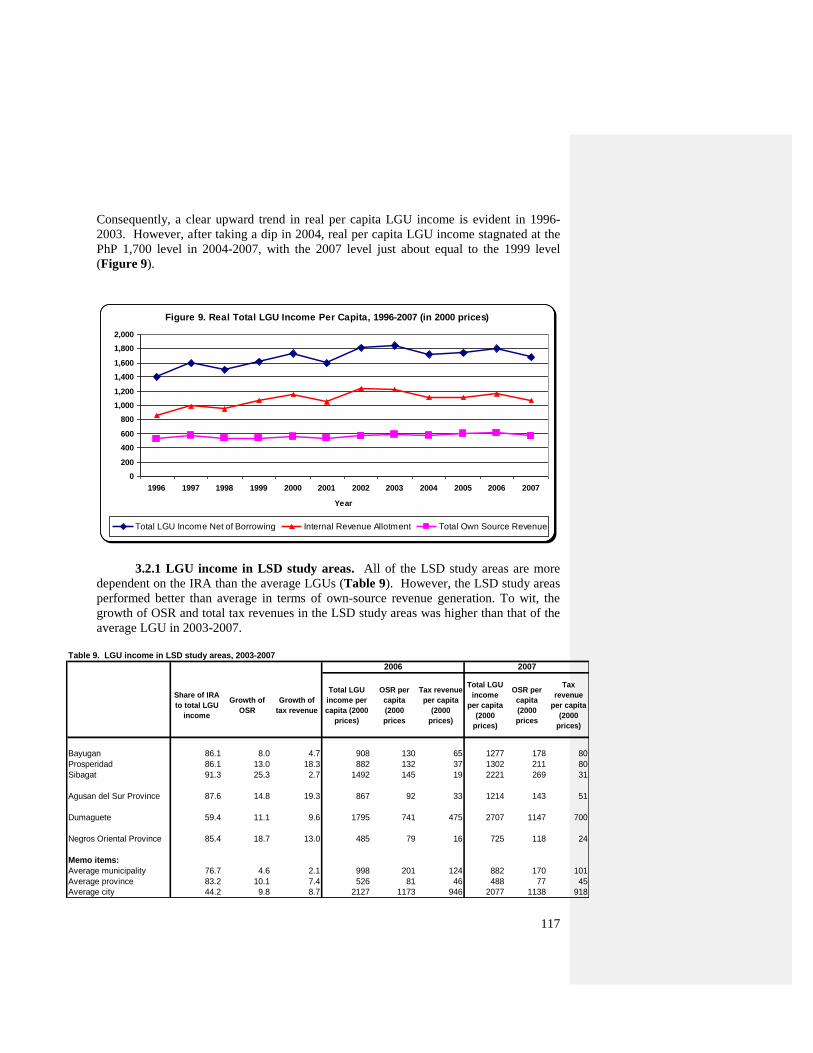
117
Consequently, a clear upward trend in real per capita LGU income is evident in 1996-
2003. However, after taking a dip in 2004, real per capita LGU income stagnated at the
PhP 1,700 level in 2004-2007, with the 2007 level just about equal to the 1999 level
(Figure 9).
Figure 9. Real Total LGU Income Per Capita, 1996-2007 (in 2000 prices)
0
200
400
600
800
1,000
1,200
1,400
1,600
1,800
2,000
1996 1997 1998 1999 2000 2001 2002 2003 2004 2005 2006 2007
Year
Total LGU Income Net of Borrowing Internal Revenue Allotment Total Own Source Revenue
3.2.1 LGU income in LSD study areas. All of the LSD study areas are more
dependent on the IRA than the average LGUs (Table 9). However, the LSD study areas
performed better than average in terms of own-source revenue generation. To wit, the
growth of OSR and total tax revenues in the LSD study areas was higher than that of the
average LGU in 2003-2007.
Table 9. LGU income in LSD study areas, 2003-2007
Share of IRA
to total LGU
income
Growth of
OSR
Growth of
tax revenue
Total LGU
income per
capita (2000
prices)
OSR per
capita
(2000
prices
Tax revenue
per capita
(2000
prices)
Total LGU
income
per capita
(2000
prices)
OSR per
capita
(2000
prices
Tax
revenue
per capita
(2000
prices)
Bayugan 86.1 8.0 4.7 908 130 65 1277 178 80
Prosperidad 86.1 13.0 18.3 882 132 37 1302 211 80
Sibagat 91.3 25.3 2.7 1492 145 19 2221 269 31
Agusan del Sur Province 87.6 14.8 19.3 867 92 33 1214 143 51
Dumaguete 59.4 11.1 9.6 1795 741 475 2707 1147 700
Negros Oriental Province 85.4 18.7 13.0 485 79 16 725 118 24
Memo items:
Average municipality 76.7 4.6 2.1 998 201 124 882 170 101
Average province 83.2 10.1 7.4 526 81 46 488 77 45
Average city 44.2 9.8 8.7 2127 1173 946 2077 1138 918
2006 2007
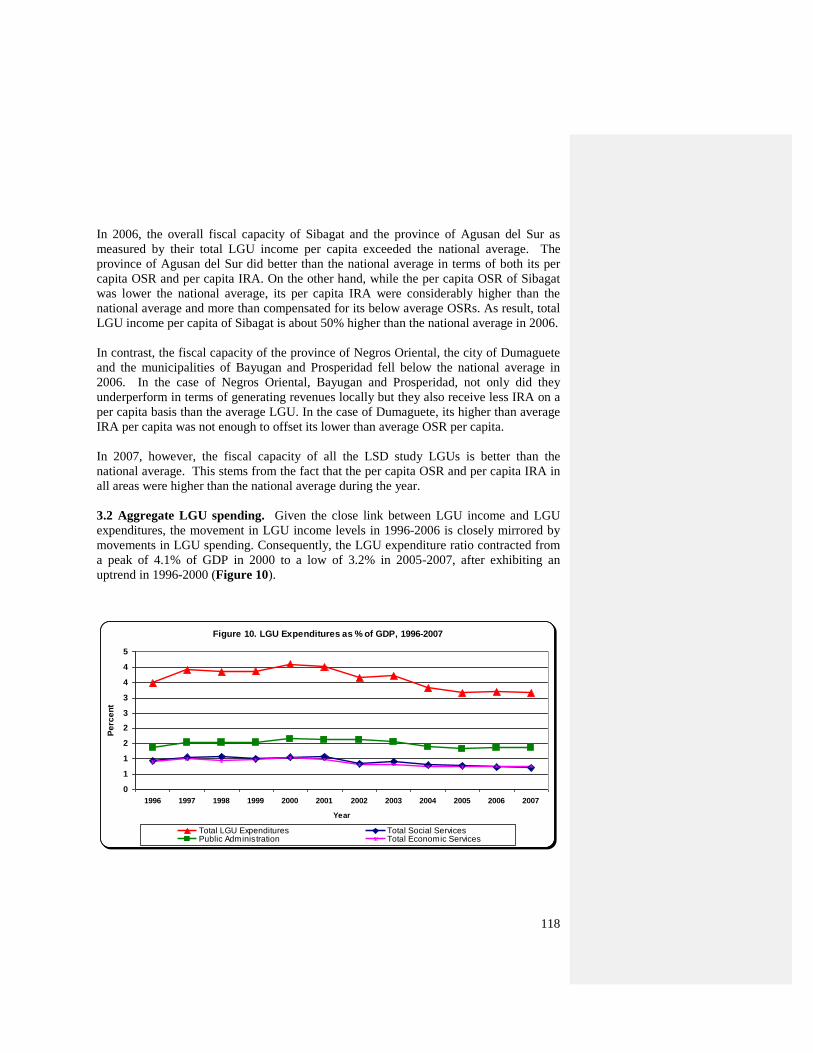
118
In 2006, the overall fiscal capacity of Sibagat and the province of Agusan del Sur as
measured by their total LGU income per capita exceeded the national average. The
province of Agusan del Sur did better than the national average in terms of both its per
capita OSR and per capita IRA. On the other hand, while the per capita OSR of Sibagat
was lower the national average, its per capita IRA were considerably higher than the
national average and more than compensated for its below average OSRs. As result, total
LGU income per capita of Sibagat is about 50% higher than the national average in 2006.
In contrast, the fiscal capacity of the province of Negros Oriental, the city of Dumaguete
and the municipalities of Bayugan and Prosperidad fell below the national average in
2006. In the case of Negros Oriental, Bayugan and Prosperidad, not only did they
underperform in terms of generating revenues locally but they also receive less IRA on a
per capita basis than the average LGU. In the case of Dumaguete, its higher than average
IRA per capita was not enough to offset its lower than average OSR per capita.
In 2007, however, the fiscal capacity of all the LSD study LGUs is better than the
national average. This stems from the fact that the per capita OSR and per capita IRA in
all areas were higher than the national average during the year.
3.2 Aggregate LGU spending. Given the close link between LGU income and LGU
expenditures, the movement in LGU income levels in 1996-2006 is closely mirrored by
movements in LGU spending. Consequently, the LGU expenditure ratio contracted from
a peak of 4.1% of GDP in 2000 to a low of 3.2% in 2005-2007, after exhibiting an
uptrend in 1996-2000 (Figure 10).
Figure 10. LGU Expenditures as % of GDP, 1996-2007
0
1
1
2
2
3
3
4
4
5
1996 1997 1998 1999 2000 2001 2002 2003 2004 2005 2006 2007
Year
Pe
rce
nt
Total LGU Expenditures Total Social ServicesPublic Administration Total Economic Services
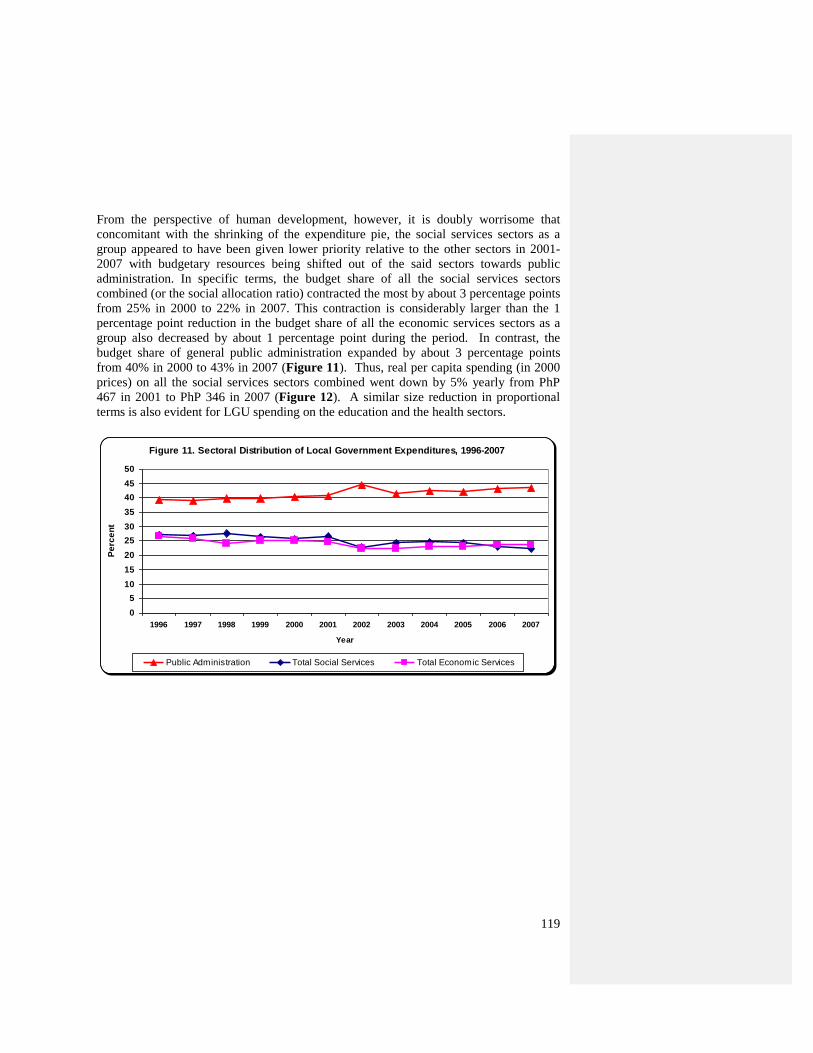
119
From the perspective of human development, however, it is doubly worrisome that
concomitant with the shrinking of the expenditure pie, the social services sectors as a
group appeared to have been given lower priority relative to the other sectors in 2001-
2007 with budgetary resources being shifted out of the said sectors towards public
administration. In specific terms, the budget share of all the social services sectors
combined (or the social allocation ratio) contracted the most by about 3 percentage points
from 25% in 2000 to 22% in 2007. This contraction is considerably larger than the 1
percentage point reduction in the budget share of all the economic services sectors as a
group also decreased by about 1 percentage point during the period. In contrast, the
budget share of general public administration expanded by about 3 percentage points
from 40% in 2000 to 43% in 2007 (Figure 11). Thus, real per capita spending (in 2000
prices) on all the social services sectors combined went down by 5% yearly from PhP
467 in 2001 to PhP 346 in 2007 (Figure 12). A similar size reduction in proportional
terms is also evident for LGU spending on the education and the health sectors.
Figure 11. Sectoral Distribution of Local Government Expenditures, 1996-2007
0
5
10
15
20
25
30
35
40
45
50
1996 1997 1998 1999 2000 2001 2002 2003 2004 2005 2006 2007
Year
Pe
rce
nt
Public Administration Total Social Services Total Economic Services
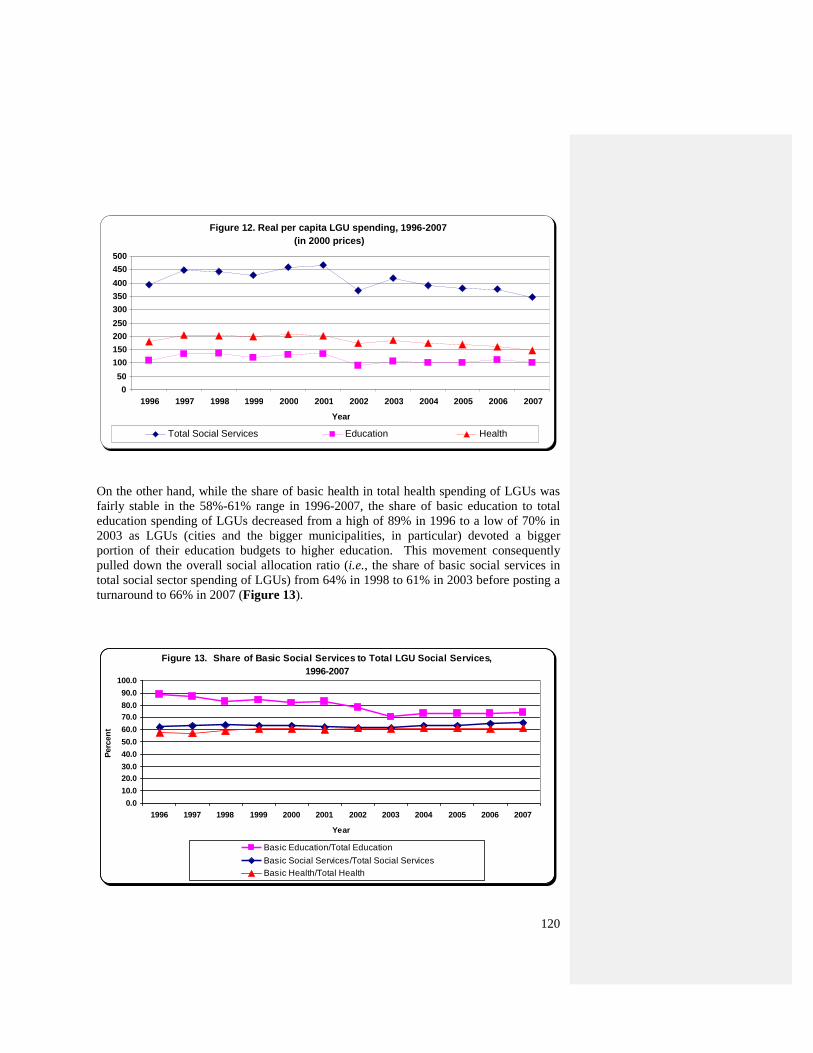
120
On the other hand, while the share of basic health in total health spending of LGUs was
fairly stable in the 58%-61% range in 1996-2007, the share of basic education to total
education spending of LGUs decreased from a high of 89% in 1996 to a low of 70% in
2003 as LGUs (cities and the bigger municipalities, in particular) devoted a bigger
portion of their education budgets to higher education. This movement consequently
pulled down the overall social allocation ratio (i.e., the share of basic social services in
total social sector spending of LGUs) from 64% in 1998 to 61% in 2003 before posting a
turnaround to 66% in 2007 (Figure 13).
Figure 13. Share of Basic Social Services to Total LGU Social Services,
1996-2007
0.0
10.0
20.0
30.0
40.0
50.0
60.0
70.0
80.0
90.0
100.0
1996 1997 1998 1999 2000 2001 2002 2003 2004 2005 2006 2007
Year
Perc
en
t
Basic Education/Total Education
Basic Social Services/Total Social Services
Basic Health/Total Health
Figure 12. Real per capita LGU spending, 1996-2007 (in 2000 prices)
0 50
100 150 200 250 300 350 400 450 500
1996 1997 1998 1999 2000 2001 2002 2003 2004 2005 2006 2007
Year
Total Social Services Education Health
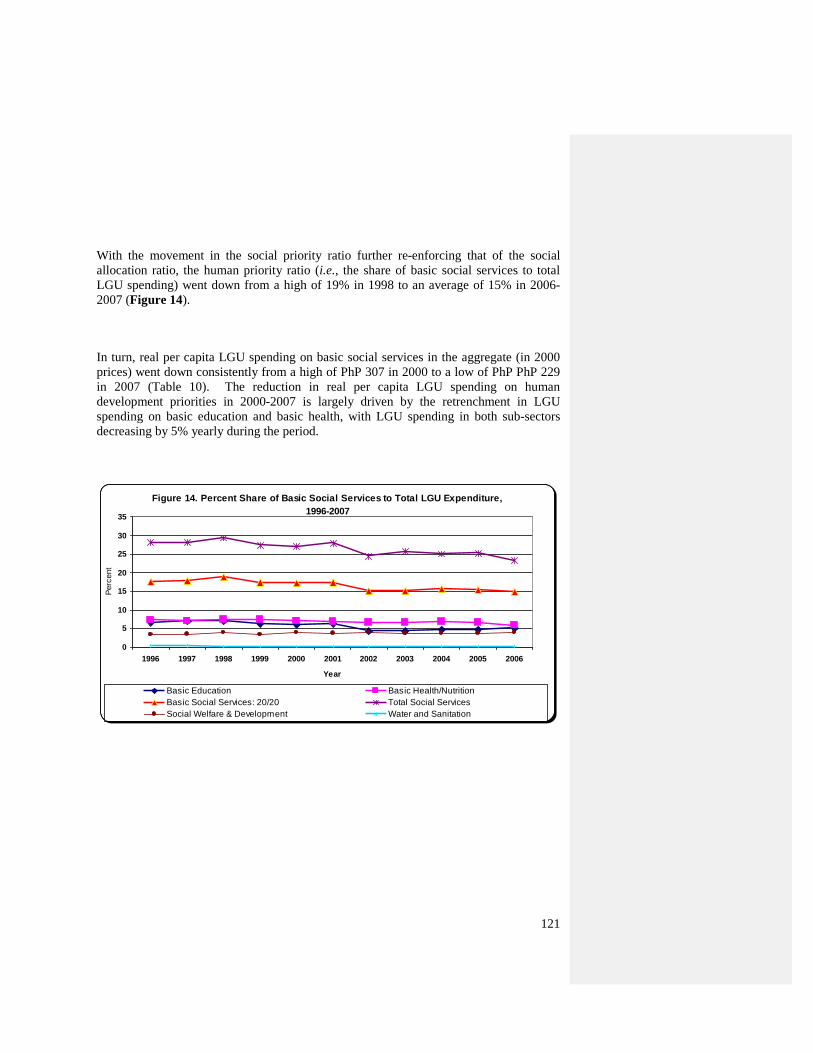
121
With the movement in the social priority ratio further re-enforcing that of the social
allocation ratio, the human priority ratio (i.e., the share of basic social services to total
LGU spending) went down from a high of 19% in 1998 to an average of 15% in 2006-
2007 (Figure 14).
In turn, real per capita LGU spending on basic social services in the aggregate (in 2000
prices) went down consistently from a high of PhP 307 in 2000 to a low of PhP PhP 229
in 2007 (Table 10). The reduction in real per capita LGU spending on human
development priorities in 2000-2007 is largely driven by the retrenchment in LGU
spending on basic education and basic health, with LGU spending in both sub-sectors
decreasing by 5% yearly during the period.
Figure 14. Percent Share of Basic Social Services to Total LGU Expenditure,
1996-2007
0
5
10
15
20
25
30
35
1996 1997 1998 1999 2000 2001 2002 2003 2004 2005 2006
Year
Perc
ent
Basic Education Basic Health/Nutrition
Basic Social Services: 20/20 Total Social Services
Social Welfare & Development Water and Sanitation
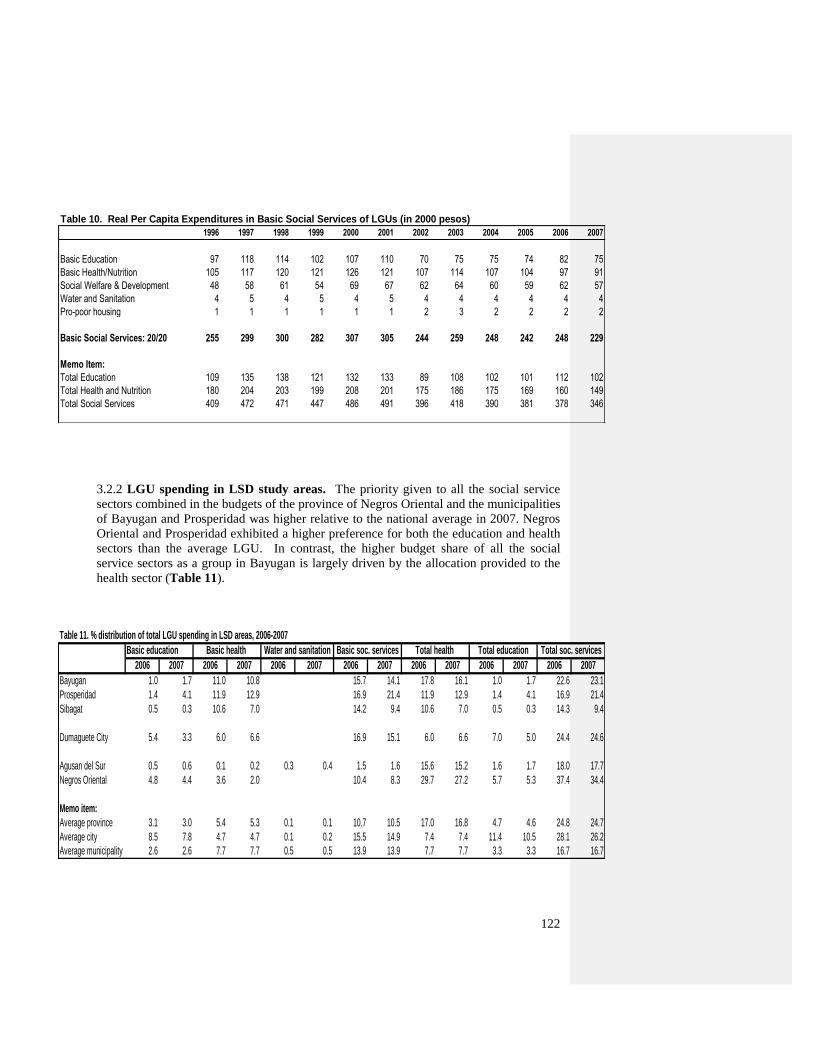
122
Table 10. Real Per Capita Expenditures in Basic Social Services of LGUs (in 2000 pesos)
1996 1997 1998 1999 2000 2001 2002 2003 2004 2005 2006 2007
Basic Education 97 118 114 102 107 110 70 75 75 74 82 75
Basic Health/Nutrition 105 117 120 121 126 121 107 114 107 104 97 91
Social Welfare & Development 48 58 61 54 69 67 62 64 60 59 62 57
Water and Sanitation 4 5 4 5 4 5 4 4 4 4 4 4
Pro-poor housing 1 1 1 1 1 1 2 3 2 2 2 2
Basic Social Services: 20/20 255 299 300 282 307 305 244 259 248 242 248 229
Memo Item:
Total Education 109 135 138 121 132 133 89 108 102 101 112 102
Total Health and Nutrition 180 204 203 199 208 201 175 186 175 169 160 149
Total Social Services 409 472 471 447 486 491 396 418 390 381 378 346
3.2.2 LGU spending in LSD study areas. The priority given to all the social service
sectors combined in the budgets of the province of Negros Oriental and the municipalities
of Bayugan and Prosperidad was higher relative to the national average in 2007. Negros
Oriental and Prosperidad exhibited a higher preference for both the education and health
sectors than the average LGU. In contrast, the higher budget share of all the social
service sectors as a group in Bayugan is largely driven by the allocation provided to the
health sector (Table 11).
Table 11. % distribution of total LGU spending in LSD areas, 2006-2007
2006 2007 2006 2007 2006 2007 2006 2007 2006 2007 2006 2007 2006 2007
Bayugan 1.0 1.7 11.0 10.8 15.7 14.1 17.8 16.1 1.0 1.7 22.6 23.1
Prosperidad 1.4 4.1 11.9 12.9 16.9 21.4 11.9 12.9 1.4 4.1 16.9 21.4
Sibagat 0.5 0.3 10.6 7.0 14.2 9.4 10.6 7.0 0.5 0.3 14.3 9.4
Dumaguete City 5.4 3.3 6.0 6.6 16.9 15.1 6.0 6.6 7.0 5.0 24.4 24.6
Agusan del Sur 0.5 0.6 0.1 0.2 0.3 0.4 1.5 1.6 15.6 15.2 1.6 1.7 18.0 17.7
Negros Oriental 4.8 4.4 3.6 2.0 10.4 8.3 29.7 27.2 5.7 5.3 37.4 34.4
Memo item:
Average province 3.1 3.0 5.4 5.3 0.1 0.1 10.7 10.5 17.0 16.8 4.7 4.6 24.8 24.7
Average city 8.5 7.8 4.7 4.7 0.1 0.2 15.5 14.9 7.4 7.4 11.4 10.5 28.1 26.2
Average municipality 2.6 2.6 7.7 7.7 0.5 0.5 13.9 13.9 7.7 7.7 3.3 3.3 16.7 16.7
Total health Total education Total soc. servicesBasic education Basic health Water and sanitation Basic soc. services
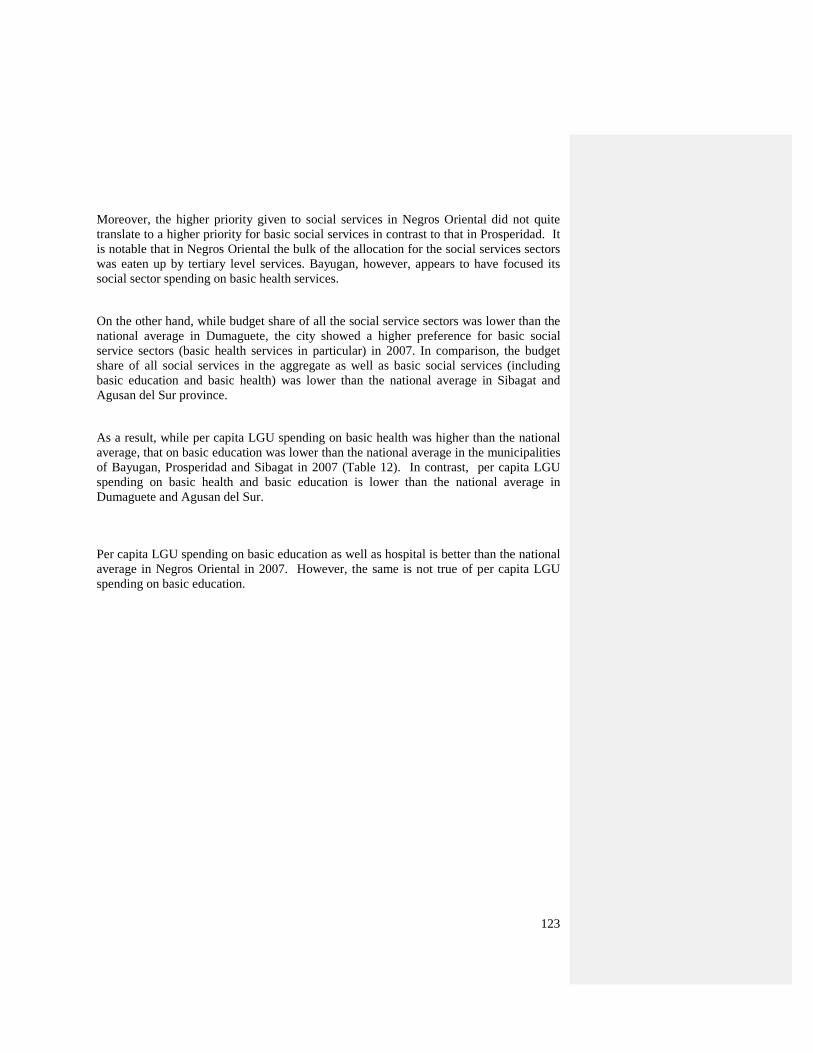
123
Moreover, the higher priority given to social services in Negros Oriental did not quite
translate to a higher priority for basic social services in contrast to that in Prosperidad. It
is notable that in Negros Oriental the bulk of the allocation for the social services sectors
was eaten up by tertiary level services. Bayugan, however, appears to have focused its
social sector spending on basic health services.
On the other hand, while budget share of all the social service sectors was lower than the
national average in Dumaguete, the city showed a higher preference for basic social
service sectors (basic health services in particular) in 2007. In comparison, the budget
share of all social services in the aggregate as well as basic social services (including
basic education and basic health) was lower than the national average in Sibagat and
Agusan del Sur province.
As a result, while per capita LGU spending on basic health was higher than the national
average, that on basic education was lower than the national average in the municipalities
of Bayugan, Prosperidad and Sibagat in 2007 (Table 12). In contrast, per capita LGU
spending on basic health and basic education is lower than the national average in
Dumaguete and Agusan del Sur.
Per capita LGU spending on basic education as well as hospital is better than the national
average in Negros Oriental in 2007. However, the same is not true of per capita LGU
spending on basic education.
124
Table 12. Real per capita LGU spending in LSD areas, 2006-2007
2006 2007 2006 2007 2006 2007 2006 2007 2006 2007 2006 2007 2006 2007 2006 2007
Bayugan 8 13 91 84 0 0 141 127 142 123 8 13 180 176 796 764
Prosperidad 7 23 64 71 0 0 97 131 64 71 7 23 90 118 535 551
Sibagat 7 5 144 120 0 0 207 182 144 120 7 5 194 172 1358 1203
Dumaguete City 94 61 115 82 0 0 324 312 115 112 122 93 424 461 1738 1876
Agusan del Sur 5 4 1 2 3 3 18 19 137 116 14 13 158 135 878 764
Negros Oriental 27 27 20 12 0 0 62 56 166 164 32 32 208 208 557 604
Memo item:
Average province 15 13 27 24 0 0 53 47 85 75 24 20 123 110 497 446
Average city 157 143 87 87 3 3 288 273 137 136 211 193 521 481 1852 1837
Average municipality 24 22 71 65 5 4 127 118 71 65 30 28 153 141 917 847
Total soc. services Total LGU expdBasic education Basic health Water and sanitation Basic soc. services Total health Total education
4. Conclusion
The efficacy of public expenditure policy in supporting the attainment of the MDGs
depends on three important factors (Bird, Litvack and Rao 1995). First, how much is
spent on MDG programs? Second, where is it spent? That is, to what extent are these
expenditures directed to areas which are lagging behind in terms of the MDG targets?
Third, how well is it spent? That is, to what extent are policies implemented so that the
intended benefits and outcomes are attained?
On the one hand, governments have to ensure that the size and the composition of the
public expenditure program are geared towards the provision of the basic social services
and pro-poor infrastructure and investments. Although it cannot be denied that the
government‘s expenditure program has a direct effect on human development outcomes,
increased government spending on basic social services is not a guarantee for
improvements in the well-being of the population, in general, and poor people, particular.
Non-budgetary policies, including the governance framework that defines how
government resources are spent, are just as important as the amount of budgetary support.
The same is true of the targeting mechanisms employed to implement income
enhancement measures and social safety net measures for the poor. These issues will be
discussed in the sectoral chapters.
125
Finally, in allocating resources to MDG-related programs and activities, it is important to
remember that basic social services are characterized by strong complementarities. That
is, the impact and effectiveness of each basic social service component is enhanced by
the availability of other basic social services (UNDP 1996).
126
CHAPTER 6
Sector Analysis: Primary and Secondary
Education
1. Introduction
1.1 Objective
This study examines the current system of institutional and fiscal arrangements for
primary and secondary levels of education sector and how that affects the actual
functioning of the sector. It has benefited from consultations with key informants and
stakeholders on how future improvements could be achieved.
The study also identifies the informal arrangements that exist in the delivery of
education-related services (e.g. parents-teachers-community associations and NGOs) that
are not captured and dealt with by the current formal system of institutional and fiscal
arrangements, with the view of informing policy decisions of the need for their
regularization and effective involvement in the education sector.
The findings of the study are meant to support the government and its partners in
strengthening the education sector. The objective is therefore not merely to produce a few
short-lived, limited proposals. The study is concerned with links to national policies,
institutions, and programs, as well as sustainability.
1.2 Approach
A specific consultative process has been adopted, to include relevant stakeholders in the
study, so that the government has led the process as far as possible, and that during the
process of mapping and analyzing the current context and situation, areas for reforms and
change naturally emerged.
Key informants included primarily government staff involved in providing the service.
Stakeholders also included teachers, school principals, parents-teachers-community
associations, education line agency staff, and local government functionaries.
1.3 Triangulation Framework
Consistent with the Triangulation Framework in Chapter 1, the developments in the three
elements of the local service delivery framework - policy, institutions and finance –
pertaining to the basic education sector is presented in this section.
Comment [m7]: This Chapter of the study still needs sharpening in its analytical content – on the whole, it seems largely a review of the movements toward decentralization but it needs to bring the readers to a better appreciation of how these impact on the school system, the stakeholders and the children. For instance, as the MOOE has become more decentralized and managed at the school level, is there a sense among the interviewed school heads that they are able to introduce more relevant and responsive interventions?
127
2. Policy
2.1.1 History and current status of education decentralization efforts
As mentioned in Chapter 1, the 1991 LGC did not include education among the devolved
services. However, this did not prevent the sector from undertaking decentralization
efforts where it was deemed beneficial for its operations. This section describes these
efforts. On the whole, however, institutional reforms, in terms of transfer of
administrative roles and functions, seem to be slow-moving. Much of the key functions
remain with the central office. Similarly, fiscal reform has not been as swift as policy
changes.
Efforts toward increasing the power of field units34
are embodied in the framework of
shared governance, the institution of school-based management, the increasing role of
parent-teacher-community associations, and the use of local languages as medium of
instruction.
The Governance of Basic Education Act asserts the centrality of the school in the formal
education system and mandates the field offices, including the schools, to translate basic
education policy into programs, projects and services adapted to local needs. It empowers
schools and learning centers to decide in the best interest of the students. The Act aims to
provide school teachers and staff flexibility in the service, encourage initiative for school
improvement and provide means to do and sustain this, among others.
In view of achieving the Education for All (EFA) goals, the DepEd is undertaking the
Basic Education Sector Reform Agenda (BESRA). Among the Key Reform Thrusts
(KRTs) is getting all schools to continuously improve. This entails a head for every
school, a continuous school improvement process, school-based resource management,
and representation in local school boards. The school improvement process involves the
establishment of a school governing council and the development of a school
improvement plan to address the needs of the school. The school‘s ability to act on its
needs suggests decentralization of political power.
Towards empowering schools and their communities to improve the learning of students,
the Department of Education aims to institute school-based management (SBM) in all
public schools in the country. School-based management is defined as ―the
decentralization of decision-making authority from central, regional and division levels to
the individual schools, with the intent of bringing together the school heads; teachers,
students as well as parents, the local government units and the community at large in
promoting effective schools.‖ SBM has four objectives, namely:
34
This is called political decentralization in the study protocol
128
i. Empower the school heads to lead their teachers and students in a
continuous school improvement process leading to higher learning outcomes;
ii. Bring resources, including funds, within the control of schools to support
the delivery of quality educational services;
iii. Strengthen partnerships with the communities and LGUs to encourage
them to invest time, money, and other resources in providing a better school
learning environment; and
iv. Institutionalize participatory and knowledge-based continuous school
improvement process.
Notwithstanding the empowerment of schools, educational standards continue to be set at
the national and regional levels. The central office also sets the school curriculum,
prescribing the subject areas and their content, the time allotment, the medium of
instruction, and the grading system and reporting of pupil performance.35
Schools head
only implement the school curriculum with supervision from the district supervisor.
The Department of Education encourages the organization of parents-teachers-
community associations in public schools, recognizing their role in mobilizing
community support for schools. They are authorized to collect contributions from parent-
members to implement their programs and projects for the benefit of the school and to
hold office in their respective schools. However, PTCAs are prohibited from ―(d)irectly
interfering in the academic and administrative management and operation of the
school.‖36
Notwithstanding the policy strengthening the use of the English language as a medium of
instruction in the educational system, the Department of Education authorized the use of
local languages as auxiliary medium of instruction for the formal education and the
alternative learning system and ordered the integration of the use of the mother tongue as
the language of instruction in school improvement plans. This is in recognition of
evidence-based findings of international and local researches/studies pointing to the
benefits of using the mother tongue in enhancing children‘s learning.
Although much of the administrative decisions remain with the central government,
certain decisions are deconcentrated to regional and division offices while others are
devolved to local government units.37
Key administrative decisions, particularly on school building and hiring are decentralized
at the division level. The prioritization of school-building projects lies at the division
office. However, the school only participates in monitoring and evaluating the school
35
DepEd (2002) The 2002 Basic Education Curriculum; DepEd (2003) Revised Implementing Guidelines
of the 2002 Secondary Education Curriculum Effective School Year 2003-2004 36
DepEd (2003) Revised Guidelines Governing PTAs/PTCAs at the School Level 37
This is called administrative decentralization in the study protocol.
129
buildings. Hiring of school teaching and non-teaching personnel is the responsibility of
the division superintendent as well as the firing of non-teaching personnel. The firing of
teaching personnel rests with the regional office. In 2004, in line with the school-based
management policy, the school head did the recruitment, and together with a school-
based committee, the ranking of teacher-applicants. Since 2006, the school selection
committee led by the school head only receives applications and verifies the documents
and recommends qualified applicants to the division superintendent. The division office
evaluates and ranks the applicants and selects from among them.
While the 1991 Local Government Code (LGC) has assigned to local government units
the administration of health, agriculture and social welfare, the administration of
educational services largely remains with the national government. A few education
functions are assigned to the local governments. The Local Government Code assigns
responsibility over day-care centers to barangays; school buildings and other facilities for
public elementary and secondary schools to municipalities; and support for education
facilities to cities. However, municipalities also have indirect education functions given
their responsibility for social programs and projects on child and youth welfare, street
children, and juvenile delinquents.
In ARMM, as per Republic Act 9054, regional powers in education are devolved to local
government units. On the other hand, ―(t)he regional government shall adopt educational
policies that shall perpetuate Filipino and Islamic values and ideals and the just
aspirations of the Bangsa Moro…‖
Fiscal decentralization has been undertaken with the direct release of resources to field
offices and implementing units and the authorization of parent-teacher-community
associations to mobilize resources for schools.
The Rules and Regulations of RA 9155 provides for the ―equitable, direct and immediate
release of resources to the field offices.‖ Aimed at decentralizing fiscal management, it
tasks the Secretary to formulate a system of equitably allocating resources to field offices,
establish a process of directly and immediately releasing the relevant appropriations to
them including personnel services and maintenance and operating expenses (MOOE),
desks, textbooks and repair and maintenance of school buildings; and establish a system
of financial reporting. This is aimed at delineating the responsibilities of the DepEd
central office, regional offices, division offices and secondary schools as well as the
DBM central office and regional offices regarding the direct release of funds, and
improving the flow of funds so as to ensure the timely payment of personnel benefits and
the implementation of projects and activities of DepEd. Secondary schools with financial
personnel can spend their own MOOE. Elementary schools and secondary schools
without financial personnel receive their MOOE the form of which is under the discretion
of the division.
Although school personnel are restricted from collecting school fees, PTCAs are
authorized to collect fees as needed by schools.
130
The complementation of private schools to public schools and the increasing use of
resources of private schools are also evident.38
The Constitution declares State recognition of the complementarity of private to public
educational institutions but mandates State supervision and regulation of the same.
Filipino citizens should have at least 60 percent ownership of educational institutions.
Educational institutions may not be set up solely for non-Filipinos and foreigners
generally may not comprise more than a third of the enrolment in any school.
Private provision of elementary education has increased over the past 36 years.
Enrolment in private elementary schools has risen from 4.9 percent of total elementary
enrolment in 1970 to 7.9 percent in 2006. Private provision of secondary education, on
the other hand, has decreased. Enrolment in private schools has decreased from 55.6 of
total secondary enrolment in 1970 to 20.4 percent in 2006. This could be attributed to the
passage of free secondary schooling in 1988(?) which encouraged more parents to shift
their children to public secondary schools.
Republic Act 6728 mandates the State to ―provide the mechanisms to improve quality in
private education by maximizing the use of existing resources of private education.‖
Assistance is provided to students in private institutions whose family income is no more
than P36,000. Assistance to private education shall consist of:
(1) Tuition fee supplements for students in private high schools, including
students in vocational and technical courses;
(2) High School Textbook Assistance Fund: students in public schools shall be
provided a comprehensive textbook program under the Secondary Education
Development Program (SEDP);
(3) Expansion of the existing Educational Service Contracting (ESC) Scheme;
(4) The voucher system of the Private Education Student Financial Assistance
Program (PESFA);
(5) Scholarship grants to students graduating as valedictorians and salutatorians
from secondary schools;
(6) Tuition fee supplements to students in private colleges and universities;
(7) Education Loan Fund; and
(8) College Faculty Development Fund.
The Department of Education‘s Budget Strategy for 2007 provides 30 percent coverage
of private secondary school enrolment through the GASTPE.
2.1.2 Legal and policy frameworks
The right to education is enshrined in Article XIV of the Philippine Constitution of 1987
which mandates the State to ―protect and promote the right of all citizens to quality
education at all levels‖ and to ―take appropriate steps to make such education accessible
to all.‖ Toward this end, it provides for the establishment of ―a system of free public
38
This is called market decentralization in the study protocol.
131
education in the elementary and high school levels‖ and for ―compulsory elementary
education.‖ The Constitution provides for compulsory elementary education for all
children of school-age, notwithstanding parents‘ rights in taking care of their children.
Republic Act 9155 confirms the State policy of protecting and promoting ―the right of all
citizens to quality basic education and to make such education accessible to all‖ including
alternative learning systems. It provides the Department of Education ―authority,
accountability and responsibility for ensuring access to, promoting equity in, and
improving the quality of basic education.‖
Pursuant to the Constitutional mandate of free basic education and in view of the
Education for All targets and Millennium Development Goals, the Department of
Education prohibits the collection of school fees from school children from the pre-
school level up to Grade 4. School fees may be collected from school children from
Grade 5 up but on a voluntary basis and starting only on the second month of school
particularly avoiding collection at the time of enrollment which may drive away
prospective pupils. In 2008, the President, through the DepEd Secretary also ordered that
the wearing of uniform in public schools shall no longer be required.39
These are
designed to remove financial obstacles to enrolment in public schools.
The Department of Education Basic Education Information System assesses net
enrolment in elementary among children 6 to 11 years old. According to the National
Statistics Office, the labor force includes ―persons 15 years old and over who are either
employed or unemployed‖ based on certain definitions. The Constitution mandates
compulsory elementary education for all children of school age. Considering the
definition of net enrolment, the age of compulsory education and the minimum age for
entering the labor force has a gap of four years.
In 2001, the department has authorized the collection of voluntary contributions for BSP,
GSP, Anti-TB, Red Cross,40
school publication41
and PTCA fee.42
However, in 2002, the
department prohibited the collection of these contributions during enrolment and
prescribed collection between September and November.43
In 2003, the new Secretary
authorized the collection of fees during enrolment ―provided that the student has already
enrolled.‖44
In 2005, the department issued an order prohibiting the consideration of
payment of voluntary contributions as requirement for admission, release of report card
or test result and clearance.45
It also prohibited teachers and other school personnel from
collecting the contributions. It advised the collecting organizations to assign
representatives or the PTCA collect in their behalf. It also authorized the PTA/PTCA to
collect contributions from its members for its programs and projects. In 2008, pursuant to
the Constitutional mandate of free basic education and in view of the Education for All
targets and Millennium Development Goals, the Department of Education prohibited the
39
Department Order No. 45, s. 2008 40
Department Order No. 31, s. 2001 41
Department Order No. 51, s. 2001 42
Department Order No. 26, s. 2001 43
Department Order No. 12, s. 2002 and Department Order No. 42, s. 2002 44
Department Order No. 38, s. 2003 45
Department Order No. 22, s. 2005
132
collection school fees from school children from the pre-school level up to Grade 4.46
School fees may be collected from school children from Grade 5 up but on a voluntary
basis and starting only on the second month of school.
Evidence suggests several instances of divergence from policy. Apparently, school
personnel are still collecting contributions themselves. Schools also collect fees other
than those authorized but respond to the needs and mandates of the school. These can be
addressed with the help of the PTCA which is authorized to collect. It is also likely that
school fees are being collected during enrolment, and being used as a requirement, for
examination for instance.
While the constitutional provision for free education has been pursued by the department,
the compulsory feature of elementary education lacks attention. It has been argued that
schools focus on keeping enrolled students in school while missing to bring all eligible
students to school. The department should conceive of strategies that would enhance
school participation for legislation by Congress. Such a law should identify the roles of
education personnel across the bureaucracy and the local government and create new
institutions as may be necessary for the purpose.
Executive Order 210 directs the teaching of English as a second language starting in
Grade 1, its use as a medium of instruction for English, Mathematics, and Science
starting in Grade 3 and as the primary medium of instruction in high school with learning
conducted in English 70% of the time. Filipino shall continue to be the medium of
instruction for Filipino and Araling Panlipunan.
The Implementing Rules and Regulations of Executive Order 210 provide for the use of
local languages as auxiliary medium of instruction for the formal education and the
alternative learning system.47
Recognizing that the ―use the of the mother tongue in as the
language of instruction beginning in Grade 1… as the most effective way to improve
student learning and… serve as a strong bridge language to learn a second language‖, the
Secretary ordered the provision of successful models of language of learning to field
offices and the integration of the use of the mother tongue as the language of instruction
in school improvement plans, and permitted the use of school MOOE in the development
and distribution of relevant instructional materials.
The Department of Education also recognizes the significant role of Islamic education in
providing access to education, particularly among Muslim children. In consultation with
the relevant stakeholders, the Department of Education formulated a standard curriculum
for public schools and private Madaris in Muslim communities including the Arabic
language, Islamic studies, and Islamic values.48
Islamic education has also been provided
in some schools in predominantly non-Muslim communities with migrant Muslims such
46
Department Order No. 19, s. 2008 47
DepEd (2006) Implementing Rules and Regulations on Executive Order No. 210 (Establishing the Policy
to Strengthen the Use of the English Language as a Medium of Instruction in the Educational System; as
amended by DepEd (2008) Addendum to DepEd Order No. 36, s. 2006 48
DepEd (2004) Standard Curriculum for Elementary Public Schools and Private Madaris
Comment [m8]: There are existing laws, including Anti-Truancy Law to address this. Perhaps what should be pursued is how these can be enforced at the local level in collaboration with LGUs, through local ordinances. Schools should also be encouraged to collaborate with the Barangay Council for the Protection of Children to enforce this law.
133
as Agusan del Sur. However, its implementation may suffer from lack of certified
teachers.
3. Institutions: Actors and their roles and responsibilities
The department has four levels of governance: the national level headed by the Secretary,
the regional, division offices and the school. RA 9155 defines the assignment of
responsibility across the agency based on the principle of shared governance with each
unit having a role and being accountable for corresponding outcomes. The principle of
shared governance is defined by the law as follows:
a) Shared governance is a principle which recognizes that every unit in the
education bureaucracy has a particular role, task and responsibility inherent in the
office and for which it is principally accountable for outcomes;
b) The process of democratic consultation shall be observed in the decision-
making process at appropriate levels. Feedback mechanisms shall be established
to ensure coordination and open communication of the central office with the
regional, division and school levels;
c) The principles of accountability and transparency shall be operationalized
in the performance of functions and responsibilities at all levels; and
d) The communication channels of field offices shall be strengthened to
facilitate flow of information and expand linkages with other government
agencies, local government units and nongovernmental organizations for effective
governance;
The Governance of Basic Education Act assigns the responsibility for policy-making
primarily to the national level, with the Secretary formulating national education policies.
However, regional offices are also mandated to define a regional framework for
education policy that is sensitive to local values, needs and expectations. National
educational standards are set by law and merely implemented by the department.
Regional offices may, however, develop regional standards in view of measuring
international competitiveness. The monitoring of education outcomes is shared by the
national level and regional offices and includes the conduct of research.
Provision and administration of education services are undertaken at all levels. Planning
is done at the national level, by the regional, division and district offices, and the school
with its development of a school education program and school improvement plan.
Moreover, the regional offices formulate the budget corresponding to regional education
plans including the division and district plans. The law does not provide for budgeting
from the school up. It, however, mandates the school to mobilize resources by accepting
donations and grants to improve its teaching capacities, facilities and provide for its
material needs. Supervision is undertaken by the regional and division offices.
The regional director has appointive and disciplinary authority over the personnel of the
regional office except the assistant regional director. Regional offices evaluate the
134
division superintendents and assistant superintendents but their selection and promotion
is done by a board created by the Secretary. Division offices supervise the operation of
schools, both public and private at elementary and secondary levels, integrated schools
and learning centers, ensuring compliance with quality standards. The schools division
superintendent exercises appointive authority over the teaching and non-teaching
personnel of the division including division supervisors, school district supervisors and
school heads; as well as disciplinary authority over non-teaching personnel. However,
disciplinary authority over teaching personnel lies with the regional director.
Local governments have had an increasing role in the provision of education, assuming a
greater role in financing local education needs.
Production or actual delivery of educational services is done at the division offices and
schools. Actual service delivery is undertaken by the school, led by the school head.
Educational services are provided by school teachers while administrative functions are
carried out by non-teaching staff. In 2004, in line with the school-based management
policy, the school head did the recruitment, and together with a school-based committee,
the ranking of teacher-applicants.49
Since 2006, the school selection committee led by the
school head only receives applications and verifies the documents and recommends
qualified applicants to the division superintendent.50
The division office evaluates and
ranks the applicants and selects from among them.
The school principal administers and manages the school personnel as well as the
physical and financial resources of the school. Schools are at the forefront of service
delivery, implementing the school curriculum and offering education programs, projects
and services. The division supervisors provide subject area supervision while district
supervisors provide professional and instructional advice and support to the school heads
and teachers/facilitators of schools and learning centers.
As per RA 7880 also known as the "Fair and Equitable Access to Education Act," 90
percent of the budget for the construction of school buildings is administered by the
Department of Public Works and Highways. The remaining 10 percent is administered by
the DepEd. In 2005, a separate budget for the construction of school buildings in areas
experiencing acute classroom shortage was administered by the DepEd and implemented
by NGOs, LGUs and PTCA, and the DepEd through contracting.51
School repair and maintenance is principal-led and administered by the school. The
school proposes and submits a scope of work to the division office which evaluates the
same and submits the list of approved proposals to the regional office for the release of
allotment. The funds are released by the DBM regional office directly to secondary
schools with financial staff and through the division office for elementary schools and
secondary schools without financial staff. The repair and maintenance is implemented
with community participation. The regional and division offices assist in and supervise
49
DepEd Order No. 1, s. 2004 50
DepEd Order No. 17, s. 2006 as revised by DepEd Order No. 4, 2007 51
DepEd (2005) Submission of List of Recipient Schools to be funded under the CY 2005 School Building
Program for Areas Experiencing Acute Classroom Shortage
135
the implementation. The school head submits a liquidation report to the division
superintendent. Between 2006 and 2008, the allotment to schools increased from 80% to
90% while that for regional and division offices declined from 20% to 10 percent. For
schools, priority was given to the improvement of water and electrical systems.
The desk allocation across congressional districts is determined by the central office. The
regional / division office determines the distribution between elementary and secondary
levels based on actual needs. The division office undertakes the procurement in
accordance with the Government Procurement Act. It also determines the distribution
across schools considering the construction of new classrooms under the school building
program and the shortage of classroom seats based on the Basic Education Information
System. In 2007, private sector participation in the procurement process was
institutionalized.
The procurement of textbooks is undertaken by the central office following the
Government Procurement Reform Act. The department recommends that local
governments purchase supplementary materials rather than textbooks.52
Field offices,
particularly the regional offices only monitor the delivery of textbooks to district offices
and secondary schools.53
The functions undertaken by field offices are largely consistent with policy. The division
office Agusan del Sur, for instance claims responsibility for overseeing the performance /
achievement of the whole division; staff / personnel development; financial management;
physical facility improvement; management and supervision of programs and projects. In
Dumaguete City, the division superintendent is the overall manager of the division, doing
supervisory and administrative functions including looking into financial matters, hiring
and firing, teacher training, achievement of children, personnel problem, and school
problems (physical, teachers). She also promotes good governance, taking care of
schools‘ well-being in terms of human relationships, honesty, and integrity. The
superintendent also does linkaging with LGUs (Congressmen, Governor and Mayors) and
the community to seek assistance in the hiring of teachers, building construction /
classroom repairs to be funded from the General Fund (apart from the SEF). As per RA
9155, however, resource mobilization is the school head‘s role.
In Prosperidad, Agusan del Sur, the district supervisors serve as instructional leaders.
They assist school heads in running school and implementing DepEd programs. They
also state engagement in curriculum development although policy assigns them only
supervision. In Bayugan North District, district supervisors supervise schools (especially
multi-grade schools headed by Teachers-in-Charge). They also coordinate with Barangay
Officials for the Alternative Learning System. They look into the improvement of student
performance and help implement the projects of DepEd and other agencies. In
Dumaguete City, the district supervisors oversee, monitor, and evaluate performance of
pupils (NAT), and the instruction / teaching – learning process. They also provide
instructional leadership, observing classes and providing mentoring.
52
DepEd (2004) Textbook Policy 53
DECS (2000) Amendments to DECS Memorandums No. 59, s. 2000 and 509, s. 1999 (Re
Implementation of SEMP Textbook Component)
136
The proximity of schools and teacher openness are helpful to district supervisors.
Spending at the district level depends on the collection of real property for the special
education fund. District supervisors also encounter some problems. One supervisor
complains that the local government disallowed the proposed SEF budget for travel,
hampering their ability to assist schools in remote areas. Some private schools question
why the district does not allot a budget for them. Some private schools do not comply
with reporting requirements.
All of the schools visited are headed by a school principal. Most of the schools also have
school improvement plans. However, some elementary schools, notably those in poorer
areas cannot show a school improvement plan. The sample school improvement plans
obtained include vision, mission, goals and objectives. They also demonstrate the
participation community stakeholders such as the school governing councils, Barangay
councils, parents-teachers-community associations, teachers, and non-government
organizations. Most of the schools received support from the provincial and municipal
governments, the Barangay, PTCA as well as private donors. However, there were no
indications that these are being reported to district supervisors and the division
superintendent as the law would have it.
One function which schools have a problem fulfilling is creating an environment
conducive to teaching and learning. Some schools complain lack of classrooms,
equipment and facilities (e.g. gym, speech laboratory, computer room) textbooks,
supplies (e.g. medicines in clinic), and water supply. Other problems include lack of
teacher training and teacher absence. The general poverty in communities also make
learning difficult as students experience hunger, do not have uniforms, and run the risk of
dropping out. On the other hand, the otherwise well off may also be given to cutting
classes as they frequent internet cafes, billiard halls, and sing-along bars. The prohibition
on the collection of fees during enrolment has also hampered resource mobilization. In
the face of these problems, schools rely primarily on the support of their respective
communities. They believe school / community feeding programs, sponsorships and
scholarships would enhance school participation and reduce drop-out rates. Parents‘ and
businesses‘ cooperation and local government legislation against truancy would prevent
students from cutting classes. Barangay monitoring would discourage teacher absence.
The direct release of funds to schools enhances school management and administration as
it facilitates fund utilization. Independent schools have their own financial staff and draw
their funds directly from DBM. As such they are able to spend their funds with ease. In
Dumaguete City, an independent high school spent 92 percent of its MOOE for the
period 2006-2008. On the other hand, dependent schools do not have financial staff and
draw their MOOE from division offices either in cash or in kind as determined by the
latter. A dependent high school in Dumaguete draws some of its MOOE from the
division office in the form of cash advance by request according to its requirements. It
receives the rest in kind and has only moderate influence over the kind of items it
receives. The school‘s MOOE budget known to the principal is only 8 percent of the
actual figure from the division office and the actual amount drawn may even be less
Comment [m9]: Often it is not the lack of training that is the challengebut rather the weak follow through to ensure adoption of skills learned or acquired. There is inadequate support system (e.g., supplies and materials, follow up mentoring and coaching of teachers to build confidence in putting these skills into practice). These should be considered as the Education Budget becomes decentralized to the Divisions and schools.
Comment [m10]: Agree. Teacher absenteeism and tardiness is often ignored. Yet, it represents a major source of LEAKAGE in terms of investment in education and directly affects the children (reduced time on task).
137
depending on the processing and liquidation. During the first semester of SY 2007-2008,
the school has received cash advances of only about 6 percent of its allotment for the
period. As the foregoing shows, fiscal decentralization is hampered by institutional
constraints and in turn hinders political empowerment. The absence of financial staff
constrains the direct release of funds which in turn restricts the ability of schools to
address their needs.
The division superintendent undertakes the hiring, assignment and evaluation of
personnel in the division including the division and district supervisors, school heads,
teachers and non-teaching staff. Protests on the appointment or assignment of a public
teacher shall be filed with and decided by the regional director, whose decision is subject
to appeal to the Civil Service Commission. The division superintendent has disciplinary
authority only over non-teaching personnel under his jurisdiction.54
But the disciplinary
authority over teaching personnel is lodged with the Regional Director as per Magna
Carta for Public School Teachers (RA 4670). The promotion of teaching and non-
teaching personnel at the division, district and school levels is undertaken by provincial /
city board the composition of which is governed by guidelines issued by the Secretary.
The department may address the staffing needs in remote areas. According to the Magna
Carta for Public School Teachers, the school superintendent may effect the transfer of
teachers as necessary for the service. However, such transfer cannot be made without the
consent of the teacher. The government shall pay the transfer expenses of the teacher and
his/her family. There is no salary supplement for posting in remote areas. According to
the Magna Carta, the government shall provide for the transfer expenses of the teacher
and his/her family.
Salaries are nationally determined. A schedule of monthly salaries for school, district and
division officials is presented in Table 1. According to the Magna Carta for Public School
Teachers, salary scales of teachers funded by local governments should not be less than
those of teachers funded by the national government. However, given the huge demand
for teachers and the limited resources of local governments, LGUs are increasingly
unable to pay teachers‘ salaries as much as those paid by the national government. So,
instead of hiring teachers, local governments are increasingly supporting Para-teachers /
volunteers who are given lower wages and no benefits (see Table 2). In Dumaguete, the
LGU supported 8 Secondary School Teacher I items in 2006 and 2007. Each one was
paid P15,396 per month in 2007. In 2008, the LGU no longer supported these. Instead,
the number of Para-teachers was increased from 15 in 2007 to 22 in 2008. Each Para-
teacher was paid only P6,000 per month. Taclobo High School hosts 4 of these Para-
teachers. In Agusan del Sur, volunteer-teachers only receive from P4,000 to P4,500
compared to regular teachers who receive P10,000 to P12,000 per month plus allowances
(e.g. PERA, ACA). Volunteers do not receive allowances. Nevertheless, volunteers
accept the work hoping that their experience will give them an edge in the hiring should a
regular item be available in the future. In Sibagat, Agusan del Sur, SEF paid teachers also
receive P6,000 although the volunteer teacher in Sibagat High School only receives
P4,500 a month. The volunteer teachers in Bayugan National Comprehensive High
54
Sec 4.3 RA 9155 IRR
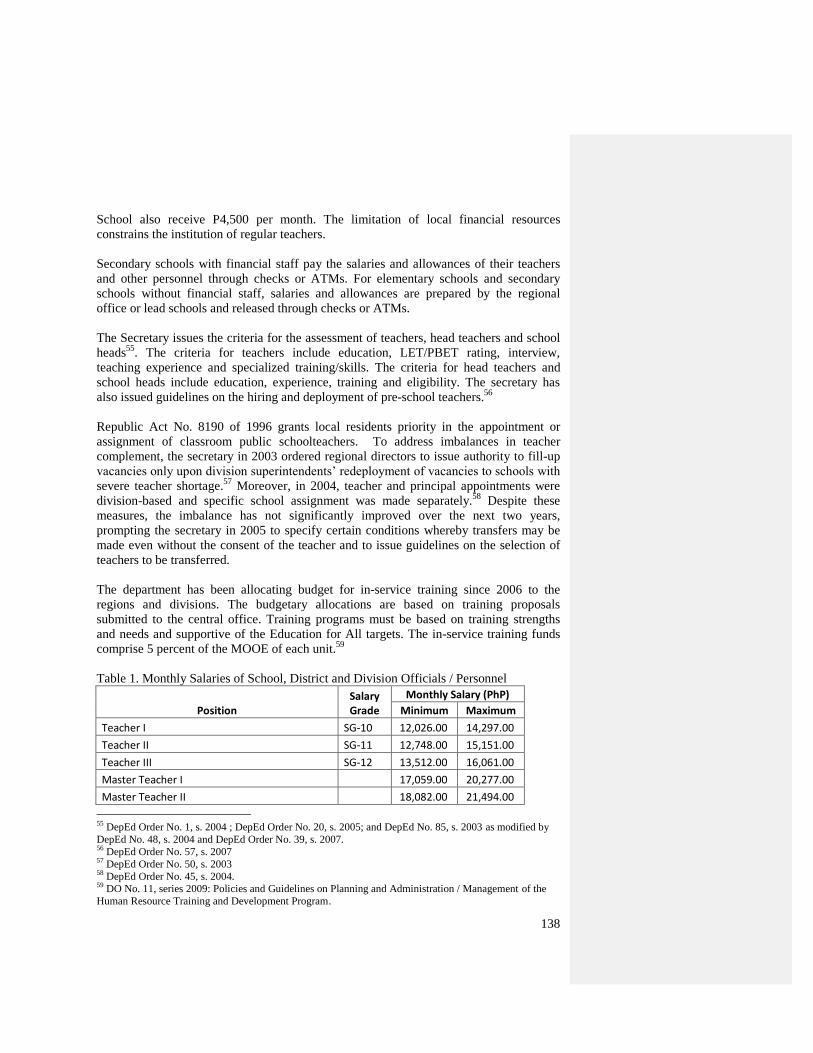
138
School also receive P4,500 per month. The limitation of local financial resources
constrains the institution of regular teachers.
Secondary schools with financial staff pay the salaries and allowances of their teachers
and other personnel through checks or ATMs. For elementary schools and secondary
schools without financial staff, salaries and allowances are prepared by the regional
office or lead schools and released through checks or ATMs.
The Secretary issues the criteria for the assessment of teachers, head teachers and school
heads55
. The criteria for teachers include education, LET/PBET rating, interview,
teaching experience and specialized training/skills. The criteria for head teachers and
school heads include education, experience, training and eligibility. The secretary has
also issued guidelines on the hiring and deployment of pre-school teachers.56
Republic Act No. 8190 of 1996 grants local residents priority in the appointment or
assignment of classroom public schoolteachers. To address imbalances in teacher
complement, the secretary in 2003 ordered regional directors to issue authority to fill-up
vacancies only upon division superintendents‘ redeployment of vacancies to schools with
severe teacher shortage.57
Moreover, in 2004, teacher and principal appointments were
division-based and specific school assignment was made separately.58
Despite these
measures, the imbalance has not significantly improved over the next two years,
prompting the secretary in 2005 to specify certain conditions whereby transfers may be
made even without the consent of the teacher and to issue guidelines on the selection of
teachers to be transferred.
The department has been allocating budget for in-service training since 2006 to the
regions and divisions. The budgetary allocations are based on training proposals
submitted to the central office. Training programs must be based on training strengths
and needs and supportive of the Education for All targets. The in-service training funds
comprise 5 percent of the MOOE of each unit.59
Table 1. Monthly Salaries of School, District and Division Officials / Personnel
Position Salary Grade
Monthly Salary (PhP)
Minimum Maximum
Teacher I SG-10 12,026.00 14,297.00
Teacher II SG-11 12,748.00 15,151.00
Teacher III SG-12 13,512.00 16,061.00
Master Teacher I 17,059.00 20,277.00
Master Teacher II 18,082.00 21,494.00
55
DepEd Order No. 1, s. 2004 ; DepEd Order No. 20, s. 2005; and DepEd No. 85, s. 2003 as modified by
DepEd No. 48, s. 2004 and DepEd Order No. 39, s. 2007. 56
DepEd Order No. 57, s. 2007 57
DepEd Order No. 50, s. 2003 58
DepEd Order No. 45, s. 2004. 59
DO No. 11, series 2009: Policies and Guidelines on Planning and Administration / Management of the
Human Resource Training and Development Program.
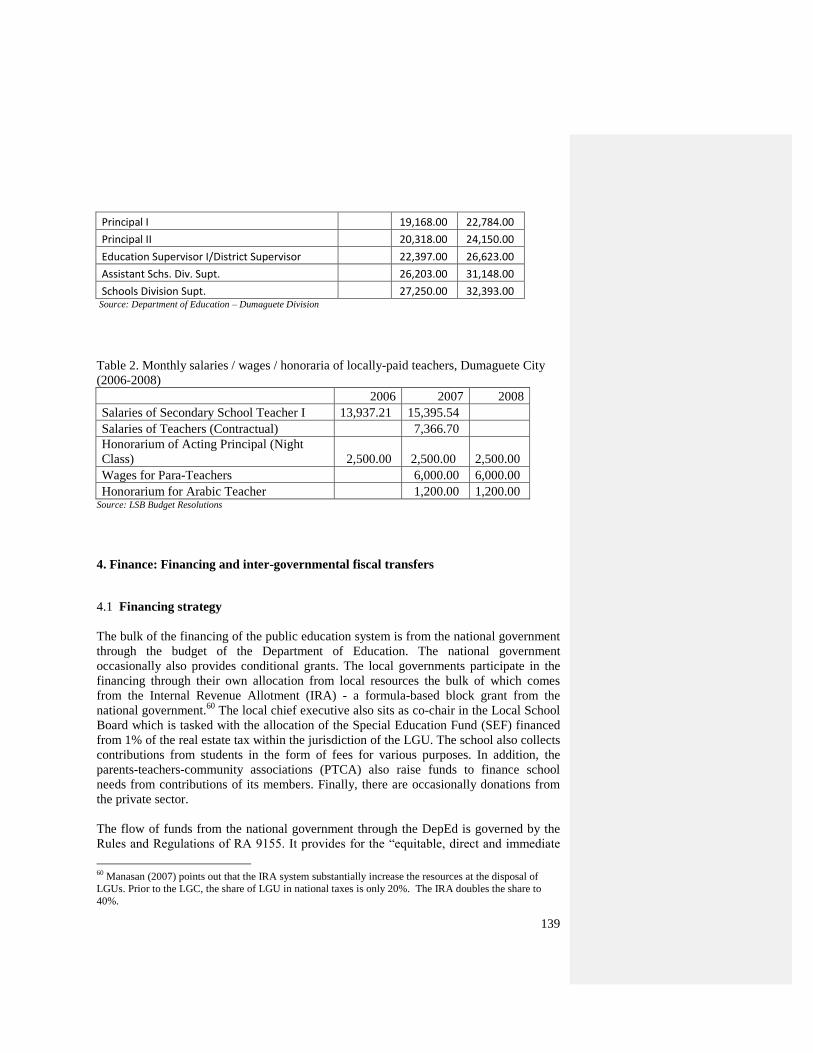
139
Principal I 19,168.00 22,784.00
Principal II 20,318.00 24,150.00
Education Supervisor I/District Supervisor 22,397.00 26,623.00
Assistant Schs. Div. Supt. 26,203.00 31,148.00
Schools Division Supt. 27,250.00 32,393.00 Source: Department of Education – Dumaguete Division
Table 2. Monthly salaries / wages / honoraria of locally-paid teachers, Dumaguete City
(2006-2008)
2006 2007 2008
Salaries of Secondary School Teacher I 13,937.21 15,395.54
Salaries of Teachers (Contractual) 7,366.70
Honorarium of Acting Principal (Night
Class) 2,500.00 2,500.00 2,500.00
Wages for Para-Teachers 6,000.00 6,000.00
Honorarium for Arabic Teacher 1,200.00 1,200.00 Source: LSB Budget Resolutions
4. Finance: Financing and inter-governmental fiscal transfers
4.1 Financing strategy
The bulk of the financing of the public education system is from the national government
through the budget of the Department of Education. The national government
occasionally also provides conditional grants. The local governments participate in the
financing through their own allocation from local resources the bulk of which comes
from the Internal Revenue Allotment (IRA) - a formula-based block grant from the
national government.60
The local chief executive also sits as co-chair in the Local School
Board which is tasked with the allocation of the Special Education Fund (SEF) financed
from 1% of the real estate tax within the jurisdiction of the LGU. The school also collects
contributions from students in the form of fees for various purposes. In addition, the
parents-teachers-community associations (PTCA) also raise funds to finance school
needs from contributions of its members. Finally, there are occasionally donations from
the private sector.
The flow of funds from the national government through the DepEd is governed by the
Rules and Regulations of RA 9155. It provides for the ―equitable, direct and immediate
60
Manasan (2007) points out that the IRA system substantially increase the resources at the disposal of
LGUs. Prior to the LGC, the share of LGU in national taxes is only 20%. The IRA doubles the share to
40%.
140
release of resources to the field offices.‖ Aimed at decentralizing fiscal management, it
tasks the Secretary to formulate a system of equitably allocating resources to field offices,
establish a process of directly and immediately releasing the relevant appropriations to
them including personnel services and maintenance and other operating expenses
(MOOE), desks, textbooks and repair and maintenance of school buildings; and establish
a system of financial reporting.
In a joint circular issued in 200461
, the DBM and the DepEd ordered the direct release of
funds from the DBM to the DepEd Central Office, regional offices and implementing
units (division offices and secondary schools with financial staff including lead schools
assisting secondary schools without financial staff). Elementary schools and secondary
schools without financial staff shall draw cash advances from their respective division
offices or lead schools subject to liquidation. The education secretary has ordered against
designating teachers to do cashiering and bookkeeping as it would interfere with their
teaching.
In Dumaguete, there are two ―independent schools‖ who receive their funds directly from
the DBM (having their own disbursement officer and bookkeeper). There are 18
elementary schools and five secondary schools – all fiscally dependent on the division
office. Until 2006, these schools received their MOOE in kind. In 2007 they started
receiving some of their MOOE in cash to cover for supplies and equipment. Cash
advances are given on a monthly basis subject to liquidation of earlier advances.
However, as practiced throughout the region, about 30 percent of the budget is still
provided in kind (covering travel and other supplies).
In Agusan del Sur, there are 29 ―empowered schools‖ who receive their MOOE directly
from DBM. 10 out of the 29 empowered secondary schools were provided disbursing
officers and bookkeepers. For others, some teachers were designated as disbursing
officers and bookkeepers, a practice discouraged by the department. In 2007, the division
started releasing MOOE funds in cash to elementary schools, with the empowerment of
schools based on the School-Based Management system. However, some MOOE are still
received in kind (e.g. supplies from DBM, instructional materials, textbooks and teachers
manuals). The division buys textbooks prescribed by the subject area supervisors
although schools may also purchase supplemental reference materials. For secondary
schools, the textbooks are provided by the central office through the Secondary
Education Development and Improvement Program. Textbooks are distributed according
to school needs based on the BEIS. The distribution of school MOOE is based on student
population. In 2007, elementary schools had an allotment of P250 per student while high
schools had an allotment of P500 per student. In 2008-2009, allotment to elementary
schools increased to P307 per student. However, the actual amount received by schools
depends on amounts released by DBM.
In 2008, the 2 independent schools of Dumaguete utilized an average of 96 percent of
their MOOE. On the other hand, dependent secondary schools received only 6.46 percent
of their MOOE allotment as of December 2008 while elementary schools received only
61
DepEd – DBM Joint Circular No. 2004-1
141
7.45 percent. In Agusan del Sur, the 5 (initially) independent schools utilized 92 percent
of their MOOE in 2007. On the other hand, of the cash allotments received between June
and November 2008 for elementary schools, only 77 percent were released. For
dependent secondary schools, only 74 percent were released and some 10 percent of the
MOOE for secondary education was not utilized. In short, fund utilization is higher
among independent schools who receive their funds directly from DBM. The low fund
utilization among dependent schools may be due either to delay in the release by DBM,
delay in the release by the division offices, and delay in liquidation by schools of cash
advances.
In 2007, the education secretary issued the ―Budget Strategy of 2007 for the Basic
Education Sector.‖62
Aimed at attaining the objectives of the Education for All 2015
National Plan, the strategy was prescribed to guide the execution of the 2007 budget and
the supplemental budget for 2006, as well as initiate forward planning and budgeting for
2008 to 2010. The budgeting was envisioned to be: performance-based; quality-oriented
in terms of inputs, processes and outputs; accountability-focused; and transparent.
To make the budgeting performance-based, the department installed a monitoring and
evaluation system using the Organizational Performance Indicators Framework (OPIF).
To ensure quality, it specified standards of inputs, processes and outputs with the
adoption of the Quality Assurance and Accountability Framework. It also holds units to
account for the performance of their functions, the formulation of their budget proposal,
its execution, and the reporting of their performance for monitoring and evaluation.
All central, regional, and division offices and schools are directed to prepare their
performance targets and budget proposals. The budget should be classified into direct
operating expenses and program expenses, with the former not exceeding 30 percent and
the latter making up at least 70 percent. The disclosure of off-budget resources such as
the SEF, donations and incomes is also encouraged.
The forward budgeting for 2008-2010, a first in the department, aims at improving
financial management and reporting, improving the quantity and quality of classrooms,
equipment, teachers and principals, solicits the support of the communities, local
governments, the private sector, and donor organizations. The forward budgets for
schools should be based on the SIP and on the same standard MOOE per capita.
However, high schools with improved technical-vocational curriculum would receive
P760 to P1000 per student. The budget also includes provisions for school repair and
maintenance and training and development.
Local governments and local education officials also play a role in determining local
budget allocations for education. As per the local government code, the local
government, through the local school board63
, determines the annual supplemental budget
62
Department Order No. 24 (s. 2007) 63
Local education officials act as co-chairmen of local school boards with the division superintendent, city
superintendent, and district supervisor being the co-chairs of the provincial, city and municipal school
boards, respectively. The allocation of the SEF is primarily prepared by the local education officials based
on school needs as requested by school heads, PTCAs, barangays or as the officials themselves deem
appropriate.
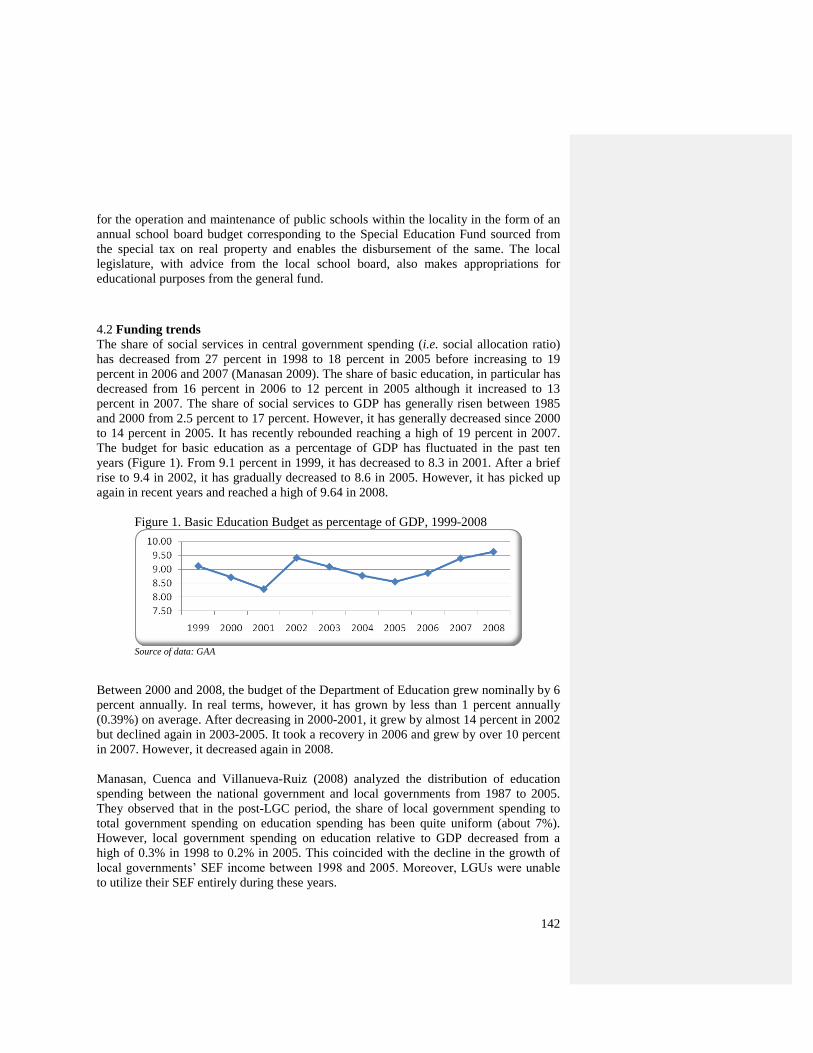
142
for the operation and maintenance of public schools within the locality in the form of an
annual school board budget corresponding to the Special Education Fund sourced from
the special tax on real property and enables the disbursement of the same. The local
legislature, with advice from the local school board, also makes appropriations for
educational purposes from the general fund.
4.2 Funding trends
The share of social services in central government spending (i.e. social allocation ratio)
has decreased from 27 percent in 1998 to 18 percent in 2005 before increasing to 19
percent in 2006 and 2007 (Manasan 2009). The share of basic education, in particular has
decreased from 16 percent in 2006 to 12 percent in 2005 although it increased to 13
percent in 2007. The share of social services to GDP has generally risen between 1985
and 2000 from 2.5 percent to 17 percent. However, it has generally decreased since 2000
to 14 percent in 2005. It has recently rebounded reaching a high of 19 percent in 2007.
The budget for basic education as a percentage of GDP has fluctuated in the past ten
years (Figure 1). From 9.1 percent in 1999, it has decreased to 8.3 in 2001. After a brief
rise to 9.4 in 2002, it has gradually decreased to 8.6 in 2005. However, it has picked up
again in recent years and reached a high of 9.64 in 2008.
Figure 1. Basic Education Budget as percentage of GDP, 1999-2008
Source of data: GAA
Between 2000 and 2008, the budget of the Department of Education grew nominally by 6
percent annually. In real terms, however, it has grown by less than 1 percent annually
(0.39%) on average. After decreasing in 2000-2001, it grew by almost 14 percent in 2002
but declined again in 2003-2005. It took a recovery in 2006 and grew by over 10 percent
in 2007. However, it decreased again in 2008.
Manasan, Cuenca and Villanueva-Ruiz (2008) analyzed the distribution of education
spending between the national government and local governments from 1987 to 2005.
They observed that in the post-LGC period, the share of local government spending to
total government spending on education spending has been quite uniform (about 7%).
However, local government spending on education relative to GDP decreased from a
high of 0.3% in 1998 to 0.2% in 2005. This coincided with the decline in the growth of
local governments‘ SEF income between 1998 and 2005. Moreover, LGUs were unable
to utilize their SEF entirely during these years.
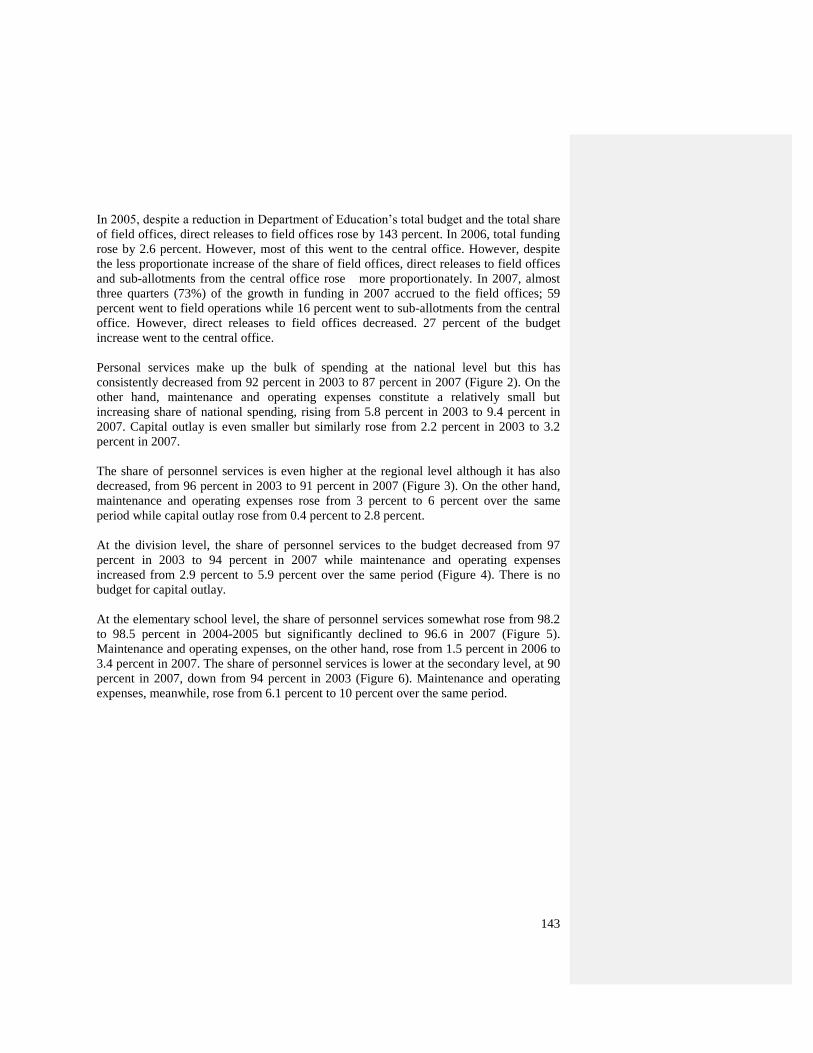
143
In 2005, despite a reduction in Department of Education‘s total budget and the total share
of field offices, direct releases to field offices rose by 143 percent. In 2006, total funding
rose by 2.6 percent. However, most of this went to the central office. However, despite
the less proportionate increase of the share of field offices, direct releases to field offices
and sub-allotments from the central office rose more proportionately. In 2007, almost
three quarters (73%) of the growth in funding in 2007 accrued to the field offices; 59
percent went to field operations while 16 percent went to sub-allotments from the central
office. However, direct releases to field offices decreased. 27 percent of the budget
increase went to the central office.
Personal services make up the bulk of spending at the national level but this has
consistently decreased from 92 percent in 2003 to 87 percent in 2007 (Figure 2). On the
other hand, maintenance and operating expenses constitute a relatively small but
increasing share of national spending, rising from 5.8 percent in 2003 to 9.4 percent in
2007. Capital outlay is even smaller but similarly rose from 2.2 percent in 2003 to 3.2
percent in 2007.
The share of personnel services is even higher at the regional level although it has also
decreased, from 96 percent in 2003 to 91 percent in 2007 (Figure 3). On the other hand,
maintenance and operating expenses rose from 3 percent to 6 percent over the same
period while capital outlay rose from 0.4 percent to 2.8 percent.
At the division level, the share of personnel services to the budget decreased from 97
percent in 2003 to 94 percent in 2007 while maintenance and operating expenses
increased from 2.9 percent to 5.9 percent over the same period (Figure 4). There is no
budget for capital outlay.
At the elementary school level, the share of personnel services somewhat rose from 98.2
to 98.5 percent in 2004-2005 but significantly declined to 96.6 in 2007 (Figure 5).
Maintenance and operating expenses, on the other hand, rose from 1.5 percent in 2006 to
3.4 percent in 2007. The share of personnel services is lower at the secondary level, at 90
percent in 2007, down from 94 percent in 2003 (Figure 6). Maintenance and operating
expenses, meanwhile, rose from 6.1 percent to 10 percent over the same period.
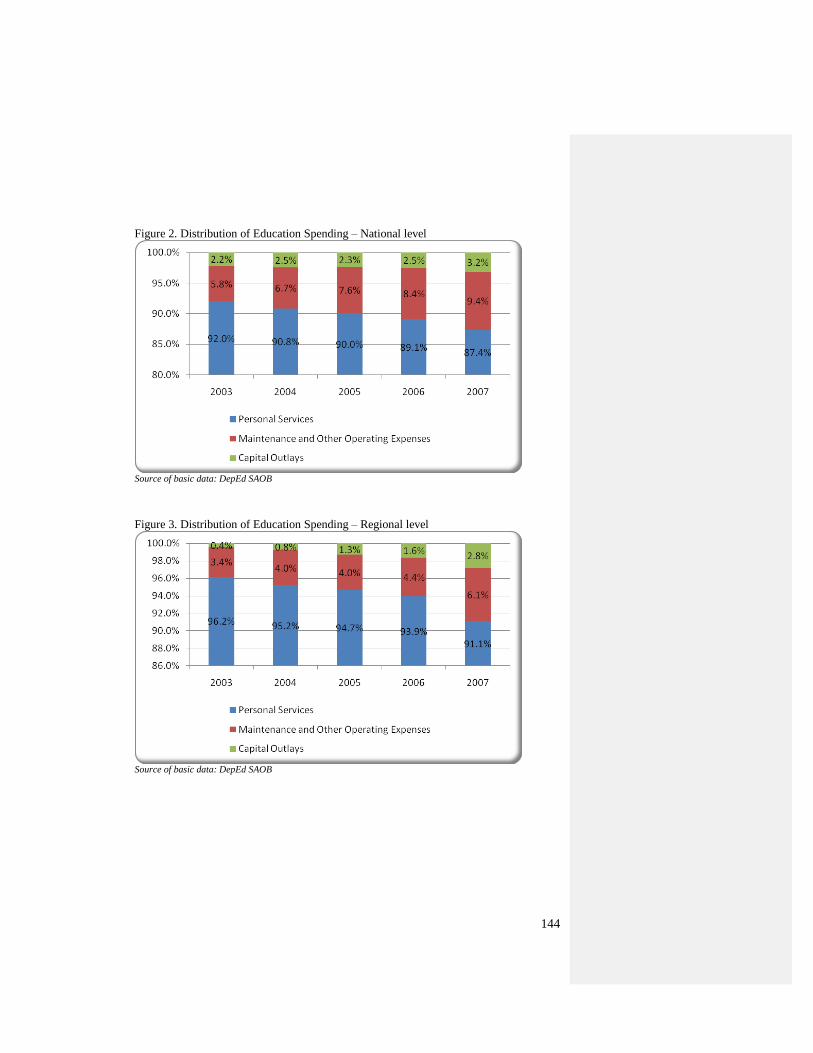
144
Figure 2. Distribution of Education Spending – National level
Source of basic data: DepEd SAOB
Figure 3. Distribution of Education Spending – Regional level
Source of basic data: DepEd SAOB
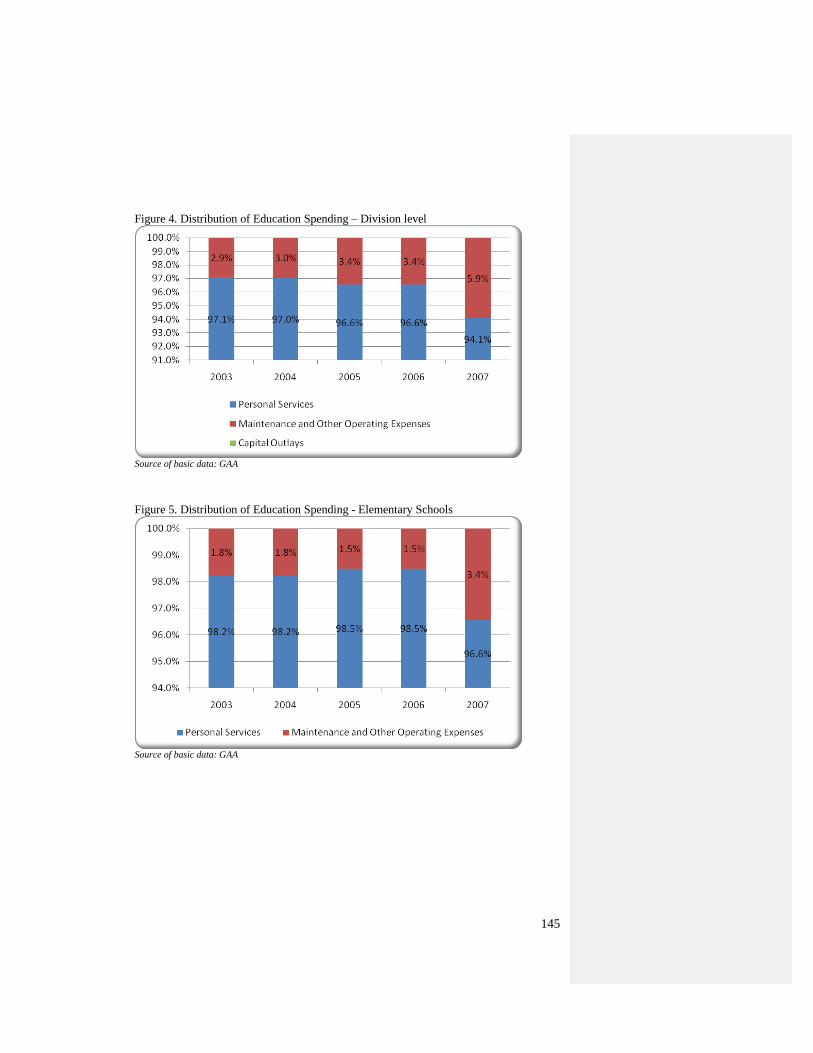
145
Figure 4. Distribution of Education Spending – Division level
Source of basic data: GAA
Figure 5. Distribution of Education Spending - Elementary Schools
Source of basic data: GAA
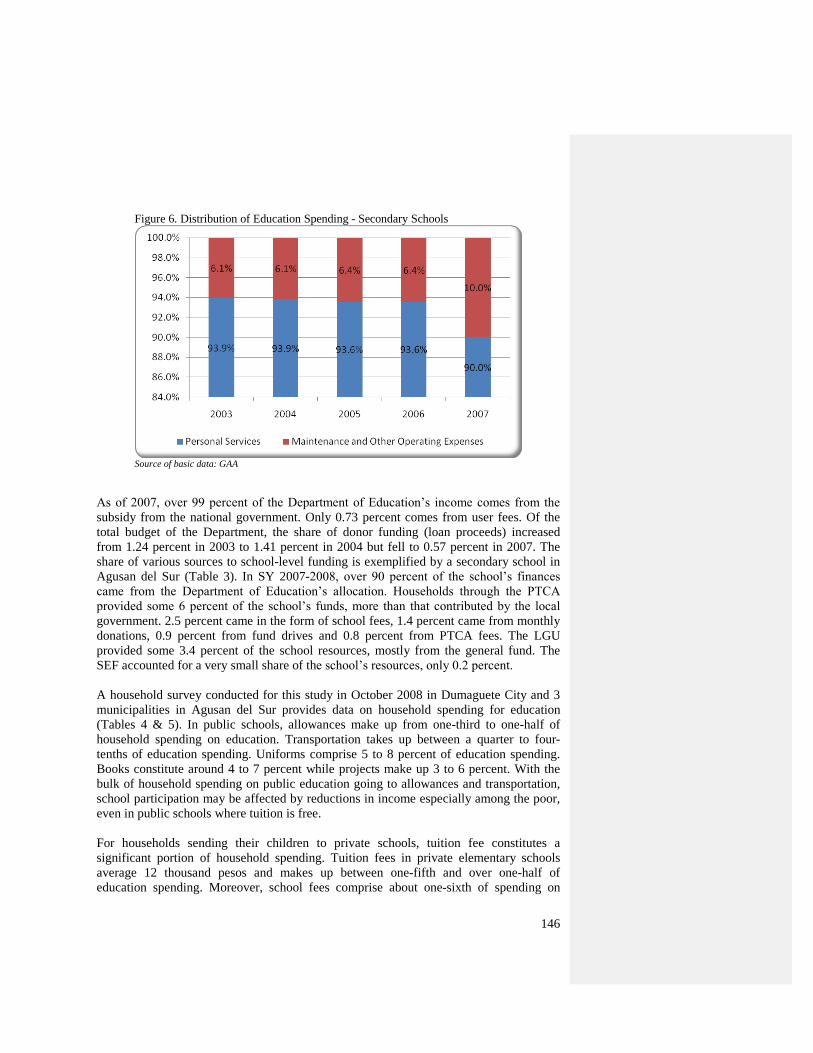
146
Figure 6. Distribution of Education Spending - Secondary Schools
Source of basic data: GAA
As of 2007, over 99 percent of the Department of Education‘s income comes from the
subsidy from the national government. Only 0.73 percent comes from user fees. Of the
total budget of the Department, the share of donor funding (loan proceeds) increased
from 1.24 percent in 2003 to 1.41 percent in 2004 but fell to 0.57 percent in 2007. The
share of various sources to school-level funding is exemplified by a secondary school in
Agusan del Sur (Table 3). In SY 2007-2008, over 90 percent of the school‘s finances
came from the Department of Education‘s allocation. Households through the PTCA
provided some 6 percent of the school‘s funds, more than that contributed by the local
government. 2.5 percent came in the form of school fees, 1.4 percent came from monthly
donations, 0.9 percent from fund drives and 0.8 percent from PTCA fees. The LGU
provided some 3.4 percent of the school resources, mostly from the general fund. The
SEF accounted for a very small share of the school‘s resources, only 0.2 percent.
A household survey conducted for this study in October 2008 in Dumaguete City and 3
municipalities in Agusan del Sur provides data on household spending for education
(Tables 4 & 5). In public schools, allowances make up from one-third to one-half of
household spending on education. Transportation takes up between a quarter to four-
tenths of education spending. Uniforms comprise 5 to 8 percent of education spending.
Books constitute around 4 to 7 percent while projects make up 3 to 6 percent. With the
bulk of household spending on public education going to allowances and transportation,
school participation may be affected by reductions in income especially among the poor,
even in public schools where tuition is free.
For households sending their children to private schools, tuition fee constitutes a
significant portion of household spending. Tuition fees in private elementary schools
average 12 thousand pesos and makes up between one-fifth and over one-half of
education spending. Moreover, school fees comprise about one-sixth of spending on
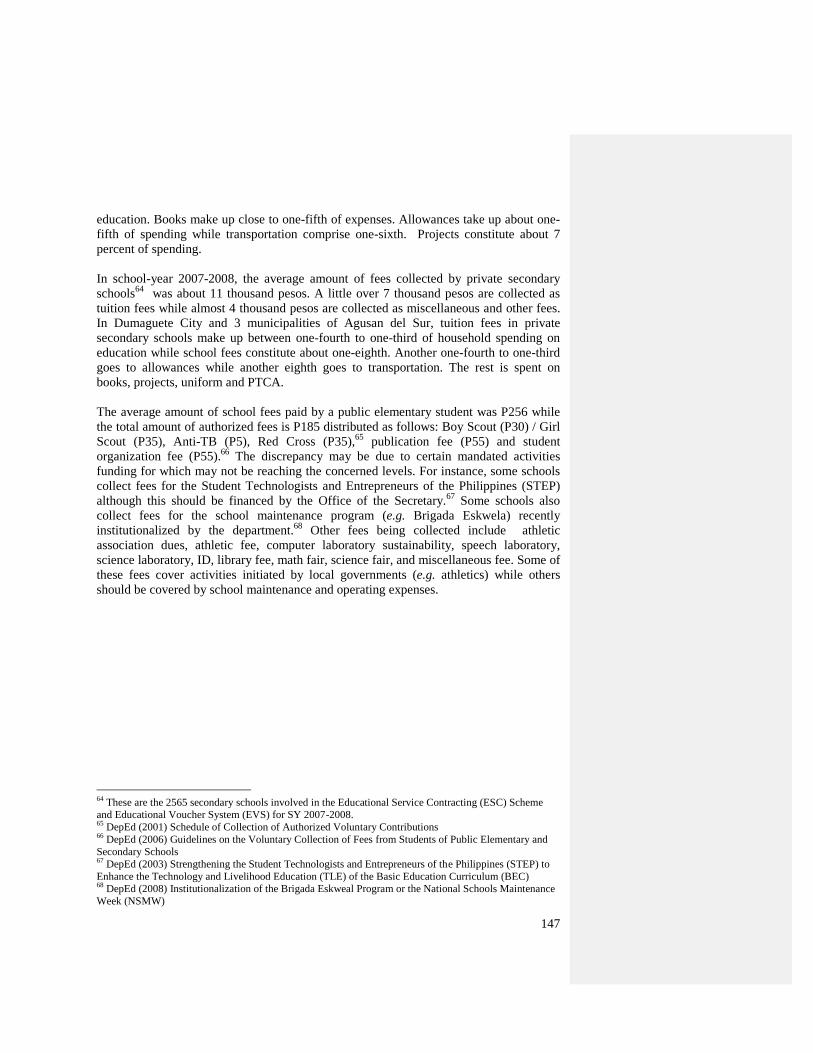
147
education. Books make up close to one-fifth of expenses. Allowances take up about one-
fifth of spending while transportation comprise one-sixth. Projects constitute about 7
percent of spending.
In school-year 2007-2008, the average amount of fees collected by private secondary
schools64
was about 11 thousand pesos. A little over 7 thousand pesos are collected as
tuition fees while almost 4 thousand pesos are collected as miscellaneous and other fees.
In Dumaguete City and 3 municipalities of Agusan del Sur, tuition fees in private
secondary schools make up between one-fourth to one-third of household spending on
education while school fees constitute about one-eighth. Another one-fourth to one-third
goes to allowances while another eighth goes to transportation. The rest is spent on
books, projects, uniform and PTCA.
The average amount of school fees paid by a public elementary student was P256 while
the total amount of authorized fees is P185 distributed as follows: Boy Scout (P30) / Girl
Scout (P35), Anti-TB (P5), Red Cross (P35),65
publication fee (P55) and student
organization fee (P55).66
The discrepancy may be due to certain mandated activities
funding for which may not be reaching the concerned levels. For instance, some schools
collect fees for the Student Technologists and Entrepreneurs of the Philippines (STEP)
although this should be financed by the Office of the Secretary.67
Some schools also
collect fees for the school maintenance program (e.g. Brigada Eskwela) recently
institutionalized by the department.68
Other fees being collected include athletic
association dues, athletic fee, computer laboratory sustainability, speech laboratory,
science laboratory, ID, library fee, math fair, science fair, and miscellaneous fee. Some of
these fees cover activities initiated by local governments (e.g. athletics) while others
should be covered by school maintenance and operating expenses.
64
These are the 2565 secondary schools involved in the Educational Service Contracting (ESC) Scheme
and Educational Voucher System (EVS) for SY 2007-2008. 65
DepEd (2001) Schedule of Collection of Authorized Voluntary Contributions 66
DepEd (2006) Guidelines on the Voluntary Collection of Fees from Students of Public Elementary and
Secondary Schools 67
DepEd (2003) Strengthening the Student Technologists and Entrepreneurs of the Philippines (STEP) to
Enhance the Technology and Livelihood Education (TLE) of the Basic Education Curriculum (BEC) 68
DepEd (2008) Institutionalization of the Brigada Eskweal Program or the National Schools Maintenance
Week (NSMW)
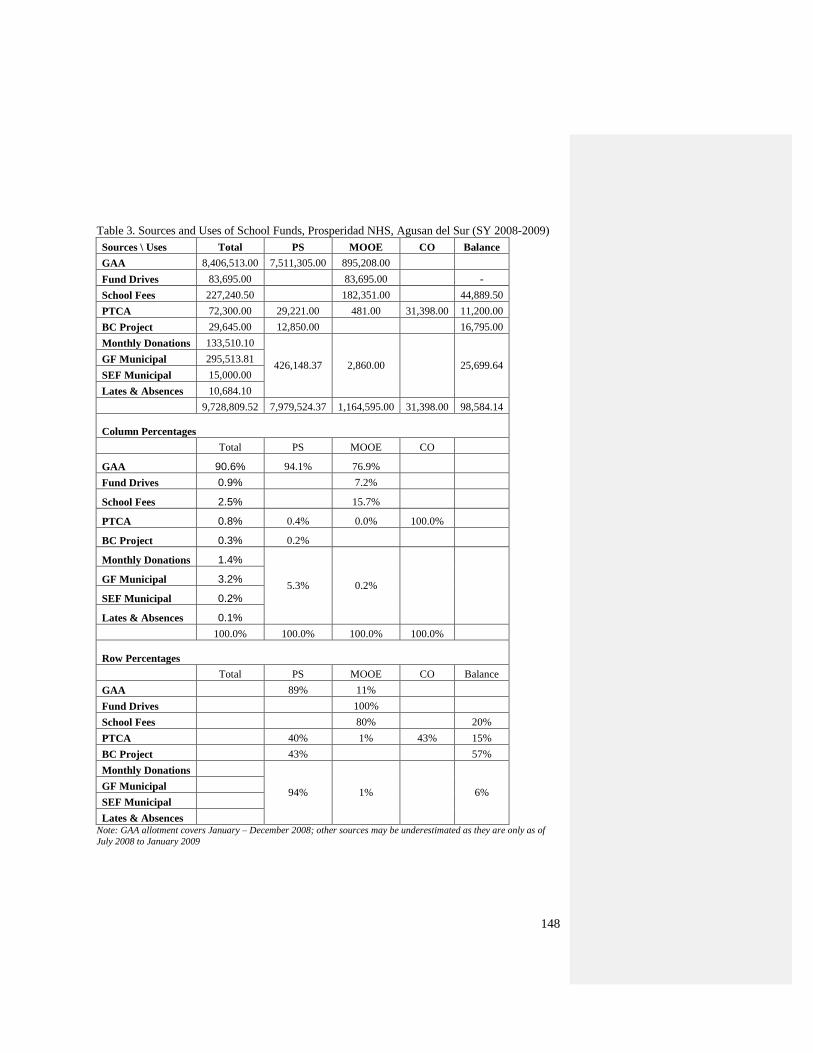
148
Table 3. Sources and Uses of School Funds, Prosperidad NHS, Agusan del Sur (SY 2008-2009)
Sources \ Uses Total PS MOOE CO Balance
GAA 8,406,513.00 7,511,305.00 895,208.00
Fund Drives 83,695.00 83,695.00 -
School Fees 227,240.50 182,351.00 44,889.50
PTCA 72,300.00 29,221.00 481.00 31,398.00 11,200.00
BC Project 29,645.00 12,850.00 16,795.00
Monthly Donations 133,510.10
426,148.37 2,860.00
25,699.64 GF Municipal 295,513.81
SEF Municipal 15,000.00
Lates & Absences 10,684.10
9,728,809.52 7,979,524.37 1,164,595.00 31,398.00 98,584.14
Column Percentages
Total PS MOOE CO
GAA 90.6% 94.1% 76.9%
Fund Drives 0.9% 7.2%
School Fees 2.5% 15.7%
PTCA 0.8% 0.4% 0.0% 100.0%
BC Project 0.3% 0.2%
Monthly Donations 1.4%
5.3% 0.2%
GF Municipal 3.2%
SEF Municipal 0.2%
Lates & Absences 0.1%
100.0% 100.0% 100.0% 100.0%
Row Percentages
Total PS MOOE CO Balance
GAA 89% 11%
Fund Drives 100%
School Fees 80% 20%
PTCA 40% 1% 43% 15%
BC Project 43% 57%
Monthly Donations
94% 1%
6% GF Municipal
SEF Municipal
Lates & Absences Note: GAA allotment covers January – December 2008; other sources may be underestimated as they are only as of
July 2008 to January 2009
149
Table 4. Annual Education Expenditure, by type of school, SY 2007-2008
Fees Tuition Books Project
s Unifor
m PTCA Cont
Transport
Allowance Total
Public
Prep 124 237.3 184.83 90.17 251.79 42.78 875.36 1,690.38
3,496.61
Elem 255.67 3.49 372.73 334.18 416.15 112.62 1,645.40 2,008.86
5,149.10
HS 346.24 681.17 404.32 455.09 453.73 170.57 3,639.20 3,170.71
9,321.03
Private, Non-sectarian
Prep 5,622.2
2 10,972.2
2 958.88 1,138.8
9 728.5 583.33 6,306.67 3,544.44
29,855.15
Elem 5,650.0
0 9,869.58 2,296.13 1,240.3
8 1,066.6
2 203.85 7,750.77 6,399.23
34,476.56
HS 4,820.0
0 20,187.5
0 3,098.89 1,555.5
6 2,023.2
2 322.22 4,937.78 20,806.7
8
57,751.95
Private, Sectarian
Prep 7,536.6
7 2,333.33 1,400.00 1,166.6
7 266.67 50 1,090.00 573.33
14,416.67
Elem 14,500.0
0 19,520.0
0 1,000.0
0 8,000.0
0 300 8,140.00 14,300.0
0
65,760.00
HS 3,641.6
7 6,029.29 1,438.57 827.14 1,008.2
1 91.79 4,070.00 5,531.43
22,638.10
Source: LSD Household survey
Table 5. Share (%) in annual education expenditure, by type of school, SY 007-2008
Fees Tuition Books Projects Uniform PTCA Cont Transport Allowance
Public
Prep 3.55 6.79 5.29 2.58 7.20 1.22 25.03 48.34
Elem 4.97 0.07 7.24 6.49 8.08 2.19 31.96 39.01
HS 3.71 7.31 4.34 4.88 4.87 1.83 39.04 34.02
Private, Non-sectarian
Prep 18.83 36.75 3.21 3.81 2.44 1.95 21.12 11.87
Elem 16.39 28.63 6.66 3.60 3.09 0.59 22.48 18.56
HS 8.35 34.96 5.37 2.69 3.50 0.56 8.55 36.03
Private, Sectarian
Prep 52.28 16.18 9.71 8.09 1.85 0.35 7.56 3.98
Elem - 22.05 29.68 1.52 12.17 0.46 12.38 21.75
HS 16.09 26.63 6.35 3.65 4.45 0.41 17.98 24.43
Source: LSD Household survey
150
4.3 Funding Flows
The allocation of resources / educational inputs across the department is guided by
various policies. The allocation of budget for classrooms / school buildings is guided by
RA 7880. 50 percent of the budget for classrooms is allocated to congressional districts
according to the student population. 40 percent is allocated only to districts with
classroom shortage and the allocation of the remaining 10 percent is determined by the
DepEd. The use of the budget should be based on ―educational priorities of the legislative
district, as determined by the DECS upon prior consultation with the representative of
each legislative district‖ with the principal goal of addressing classroom shortage. The
budget for capital outlay is directly released to and administered by the DBM.
The Commission on Audit (2007) reveals that the allocation of classrooms / school
buildings suffers from leakages as the prioritization based on classroom shortage has not
been complied with. This has been attributed to ―non-concurrence of the concerned
congressmen with the priority listings prepared by the division offices and intervention of
local government officials in the construction project…‖ This is because the law only
mandates the allocation of only 40 percent of the budget based on classroom shortage.
With the allocation of 50 percent based student population, half of the budget is liable to
be allocated to urban areas where there are more students.
Based on guidelines issued by the department in 2003, division offices prepare a priority
listing of school buildings based on the budget ceiling for their congressional district
provided by the central office, the classroom needs, and in consultation with the
congressman concerned.69
In a joint memorandum, the DepEd and DBM also issued
guidelines on the coordination and monitoring of DPWH-constructed school buildings. It
directs the DPWH to provide the DepEd division office and school head a copy of the
plans, specifications, program of works and schedules for complete school buildings.70
Bidding is administered by the DPWH and the DepEd division office is only invited for
the bid opening. The school head observes the critical stages of the construction and
invites a representative from community and professional organizations during the
inspection. An inspection is also done jointly by a DPWH representative, the DepEd
division representative, the school head, the community professional representative and
the contractor after the construction. An evaluation among teachers and students using
the building is also conducted one year after turn-over.
The Commission on Audit found cases of non-compliance to the guidelines in 10 regions,
both by the concerned DPWH and DepEd personnel. For instance, DPWH personnel
were not able to coordinate with DepEd personnel, provide them copies of program of
works, plans, specifications and schedule of construction projects. As a result, DepEd
69
DepEd (2003) Submission of the Priority List of School Buildings to be Funded under the CY 2003
DepEd Schoolbuilding Program 70
DepEd (2003) Guidelines for the Coordination and Monitoring of DPWH-constructed School Buildings
151
personnel were not able to witness critical stages of the construction, nor report delayed
or abandoned projects.
For the DepEd-administered school building projects, the priority is given to schools with
classroom-student ratio of 1:60 or worse, those with temporary / makeshift classrooms,
and those with no classroom at all.
In the distribution of desks/armchairs, the department policy gives first priority to schools
with new academic classrooms and school buildings; second priority is given to schools
with high shortage of classroom seats per the Basic Education Information System
(BEIS), i.e. those whose seating-pupil ratio is greater than 1.00.71
Each elementary school
should have no less than 25 sets of tables and chairs while each secondary school should
have at least 50 armchairs. The cost of each elementary desk should not be more than
P1,500 while each secondary school armchair should cost no more than P750.
The policy on prioritization has been grossly violated as ―(a)cute seat shortages in 2,764
elementary and secondary schools were not addressed because a total of 84,254 sets of
tables and chairs and 150,748 armchairs costing P197 Million were allocated to 2,777
elementary and 899 secondary schools identified as having adequate seat provisions for
School Years 2004-2007.‖72
Among the reasons for this are the allotment for the district
may not be distributed equitably, the distribution is based on requests rather than on
actual needs according to the BEIS, the seats were funded and distributed by LGUs, the
priority schools were difficult to reach. Also, the delay in budget releases and slow
procurement delayed the 2006 School Furniture Program. This, together with the
overlapping procurement among the central, regional and division offices has resulted in
excess seats for schools in NCR. This shows how institutional arrangements and actual
fiscal results defeat the intent of policy.
The department also directs the allocation of teachers. To address imbalances in teacher
complement, the secretary in 2003 ordered regional directors to issue authority to fill-up
vacancies only upon division superintendents‘ redeployment of vacancies to schools with
severe teacher shortage.73
Moreover, in 2004, teacher and principal appointments were
division-based and specific school assignment was made separately.74
Despite these
measures, the imbalance has not significantly improved over the next two years,
prompting the secretary in 2005 to specify certain conditions whereby transfers may be
made even without the consent of the teacher and to issue guidelines on the selection of
teachers to be transferred.
Among other policies, the allocation of textbooks is determined by the Textbook
Exchange Program (TEP). TEP aims to eliminate multiple textbooks and to transfer
surplus textbooks to schools with shortage within the district, division or region.75
The
Commission on Audit (2007) found that ―most school principals did not comply with the
71
DepEd (2004) 2004 Desks/Armchair Procurement Program 72
(Commission on Audit, 2007) 73
DepEd Order No. 50, s. 2003 74
DepEd Order No. 45, s. 2004. 75
DepEd (2003) The Textbook Exchange Program
152
textbook exchange program‖ resulting in ―unused and undistributed textbooks/manuals
totaling 1,275,056 with a total cost of P57,341,280.55 still stored in libraries and
storerooms in division offices, high schools and elementary schools.‖ Non-compliance
was primarily due to ―lack of knowledge or awareness of the Textbooks Exchange
Program (TEP) among school principals in the regions. In addition, common reasons
include excess deliveries, multiple titles, non-RBEC compliant, limited copies, lack of
funds to transfer, teachers refusal to accept for fear of losses, issued only when requested,
obsolescence, worn out and a few are kept as buffer stocks.‖ The policy on Textbooks
Exchange Program lacks institutional support in terms of information dissemination.
The department also guides the distribution of school funds, particularly MOOE. In 2004,
the department received additional MOOE from the DBM, an amount it lost in the
previous year due to a reenacted budget. This MOOE was divided between elementary
and secondary levels in proportion to enrolment. The allocation for elementary across
divisions considers the enrolment, the number of districts, the geographic conditions, and
travel time with respect to Manila. Of the MOOE budget, 5 percent is allotted to in-
service training. Of the remaining amount, 30 percent is allocated for division and district
MOOE while 70 percent goes to elementary schools. 40 percent of the budget for schools
is divided in proportion to enrolment. 60 percent is divided according to the class of
municipality, in favor of poorer municipalities. The school MOOE is released to the
division offices who may release to individual school in cash or in kind. For secondary
schools, priority is given to schools with less per student MOOE in the previous year and
to schools in lower-class municipalities. Of the additional MOOE, only half was allowed
to be spent as the other half was earlier declared as savings and committed as year-end
cash gift.
The Budget Strategy of 2007 directs the formulation of the school budget based on the
school improvement plan (SIP) and the standard MOOE per capita of P209 for
elementary and P507 for high school. The budget covers utilities, school supplies and
materials, training-related travelling, training (for secondary schools), meetings of school
governing councils, vehicle maintenance, rents, auditing, janitorial and security services.
Other expenses shall be financed by off-budget resources such as canteen income, PTCA
collections, local government and community support.
Apart from the regular MOOE, the central office has provided SBM Grants to schools
since 2006. The SBM Grant, ranging from P10,000 to P50,000, is aimed at assisting the
school in formulating its implementation plan (SIP). The allocation of the grant across
regions and divisions is determined by the central office while the allocation among
schools is determined by the division. Divisions are ranked in terms of participation,
completion, and achievement rates. Half of the SBM grant is distributed based on
performance in these indicators with divisions with the poorest performance getting more
grants. The other half of the grant is based on the number of elementary and secondary
schools within divisions. The grant will finance the establishment and strengthening of
school management structures and implementation, monitoring and reporting of school
improvement plans. The grant may finance supplies and materials, meals (not exceeding
10% of total grant); transportation expenses of resource persons; and reproduction cost. It
153
cannot be used for hiring and payment of salaries of additional staff, purchase of
equipment, payment of honorarium, training of school or cluster heads in SBM, and
school maintenance and operating expenses.
In 2008, the Division of Agusan del Sur received SBM grants totaling P3.5 million. The
30 percent of least performing elementary and secondary schools received such grants,
having high drop-out rates and low promotion, participation and retention rates. Within
the SBM Framework and Standards, these school are classified under Level I, complying
with only the minimum requirements of SBM. 65 percent other schools are in Level II;
apart from complying with minimum requirements, these schools intensify ―mobilization
of resources and maximize effort of the school to achieve the desired learning outcomes.‖
5 percent of the schools are in Level III, further ―maximizing efforts of the school and the
community/stakeholders to achieve higher learning outcomes. One high school visited is
a second-time recipient of the SBM grant. The first grant (worth P50,000) was used for
faculty training and equipment (all-in-one printer) while the second (also P50,000) was
used for NAT Review materials development76
. In October-December 2008, the school
received a grant of P5,488 and spent 91 percent of the grant by the end of the period. In
Dumaguete, one elementary school visited was a recipient of the SBM Grant. In July-
August 2008, it has received a grant of P10,000 which it used to purchase computer parts,
school supplies and digital camera.
The SBM Grant has been significant because although the amount of the Grant is small
relative to the school‘s MOOE allotment, it can be a lot bigger than the MOOE actually
received by the school in cash. However, it is not clear how differently the grant was
utilized compared to the regular MOOE. Contrary to the guidelines, the SBM has been
used for the purchase of equipment. In this case, if the utilization of the regular MOOE
can be facilitated, it may be sufficient to finance the requirements of the school, even
without an SBM grant. It is also not clear how much the grant has influenced the
empowerment of the school. The distribution of financial resources to pursue the policy
intent of the SBM grant depends on the institutional capability of division offices to
evaluate proposals and assist lagging school in this respect.
4.4 Local revenue and spending
Local sources of funds for education include real property taxes financing the local
governments‘ Special Education Fund, the local governments‘ 20% Development Fund,
PTCA collections, and private donations.
The Local Government Code authorizes provinces, cities and municipalities within the
Metropolitan Manila Area to impose and collect ―an annual tax of one percent (1%) on
the assessed value of real property… in addition to the basic real property tax. The
proceeds thereof shall exclusively accrue to the Special Education Fund (SEF).‖ 77
It also
76
It should be noted that Department Order No. 9, series of 2001 prohibited the conduct of NEAT and
NSAT (now NAT) review sessions. 77
Book 2, Chapter V, Section 235
154
directs the automatic release of the SEF to the local school boards. The SEF collected by
provinces shall be shared equally by the provincial and municipal school boards. 78
Local
governments can also finance education from the general fund, particularly the 20 percent
Development Fund.
The department of education encourages the operation of PTCAs in public schools as
these are important in mobilizing community support for schools. To ensure
accountability, the department required the registration of PTCAs with the appropriate
agencies (e.g. SEC, CDA). Registered associations are eligible for tax incentives in the
provision of staff and faculty development, construction and upgrading of facilities,
provision of books and instructional materials and equipment, and modernization of
instructional materials and technologies through computers, television, internet, satellite
programs, etc.
In 2001, the department issued guidelines in the collection of PTCA fees. The guidelines
encourage PTCAs to collect contributions in a socialized manner or according to capacity
to pay. PTCA contributions should be voluntary and teachers should not collect these
fees. To reduce the burden on their members, PTCAs are also encouraged to solicit
support from local governments and community organizations to augment the school
MOOE. The department has directed the treatment of PTCA collections as trust funds to
be deposited in a reputable bank and disbursed according to accepted accounting and
audit rules.79
PTCAs are also required to submit annual audited financial reports.
In Agusan del Sur, the PTCA contribution ranged from P25 to P565 per member. In one
school, the contribution includes the authorized fees. In Dumaguete City, the 2
secondary schools visited collected P50 per member. In Bayugan National
Comprehensive High School, the PTCA collected over 822 thousand pesos, equivalent to
26 percent of the school‘s MOOE provided by the department. Within seven months,
collection was already 90 percent of the target. Apart from the association dues, the
PTCA also collected other fees for feeding, Araling Panlipunan, mathematics, computer,
laboratory, English, reading materials, Filipino, science, MAPEH, NAMCYA and TLE
totaling over P1Million in seven months. The collection has satisfied the requirements for
the period and has a balance of 43 percent. In Sibagat National High School, the PTCA
collected 270 thousand pesos, equivalent to 21 percent of the school‘s MOOE provided
by the department.
The local government code provides that the SEF be used for the ―operation and
maintenance of public schools, construction and repair of school buildings, facilities and
equipment, educational research, purchase of books and periodicals, and sports
development as determined and approved by the Local School Board.‖ DECS-DBM-
DILG Joint Circular 1-B, series of 2001 includes ―the payment of salaries and authorized
allowances of teachers hired to handle new classes as extensions of existing public
elementary or secondary schools‖ as priority items for SEF funding.
78
Book 2, Chapter VII, Section 272 79
Department Order No. 23, s. 2003
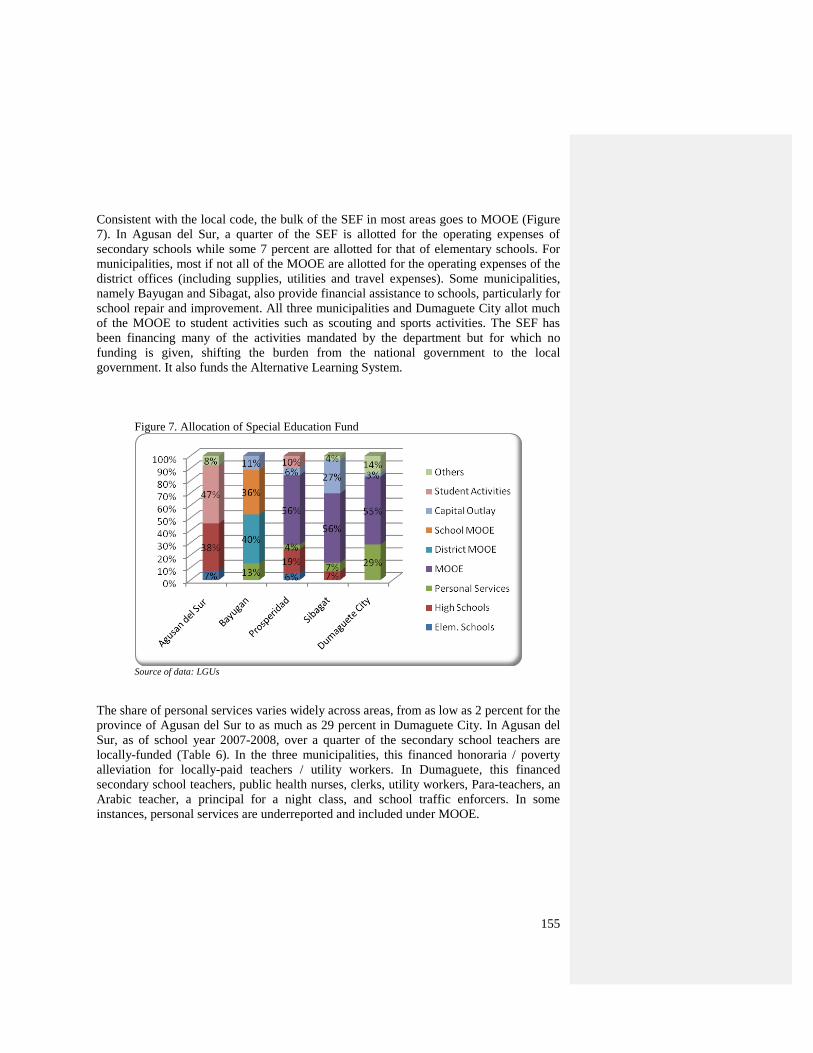
155
Consistent with the local code, the bulk of the SEF in most areas goes to MOOE (Figure
7). In Agusan del Sur, a quarter of the SEF is allotted for the operating expenses of
secondary schools while some 7 percent are allotted for that of elementary schools. For
municipalities, most if not all of the MOOE are allotted for the operating expenses of the
district offices (including supplies, utilities and travel expenses). Some municipalities,
namely Bayugan and Sibagat, also provide financial assistance to schools, particularly for
school repair and improvement. All three municipalities and Dumaguete City allot much
of the MOOE to student activities such as scouting and sports activities. The SEF has
been financing many of the activities mandated by the department but for which no
funding is given, shifting the burden from the national government to the local
government. It also funds the Alternative Learning System.
Figure 7. Allocation of Special Education Fund
Source of data: LGUs
The share of personal services varies widely across areas, from as low as 2 percent for the
province of Agusan del Sur to as much as 29 percent in Dumaguete City. In Agusan del
Sur, as of school year 2007-2008, over a quarter of the secondary school teachers are
locally-funded (Table 6). In the three municipalities, this financed honoraria / poverty
alleviation for locally-paid teachers / utility workers. In Dumaguete, this financed
secondary school teachers, public health nurses, clerks, utility workers, Para-teachers, an
Arabic teacher, a principal for a night class, and school traffic enforcers. In some
instances, personal services are underreported and included under MOOE.
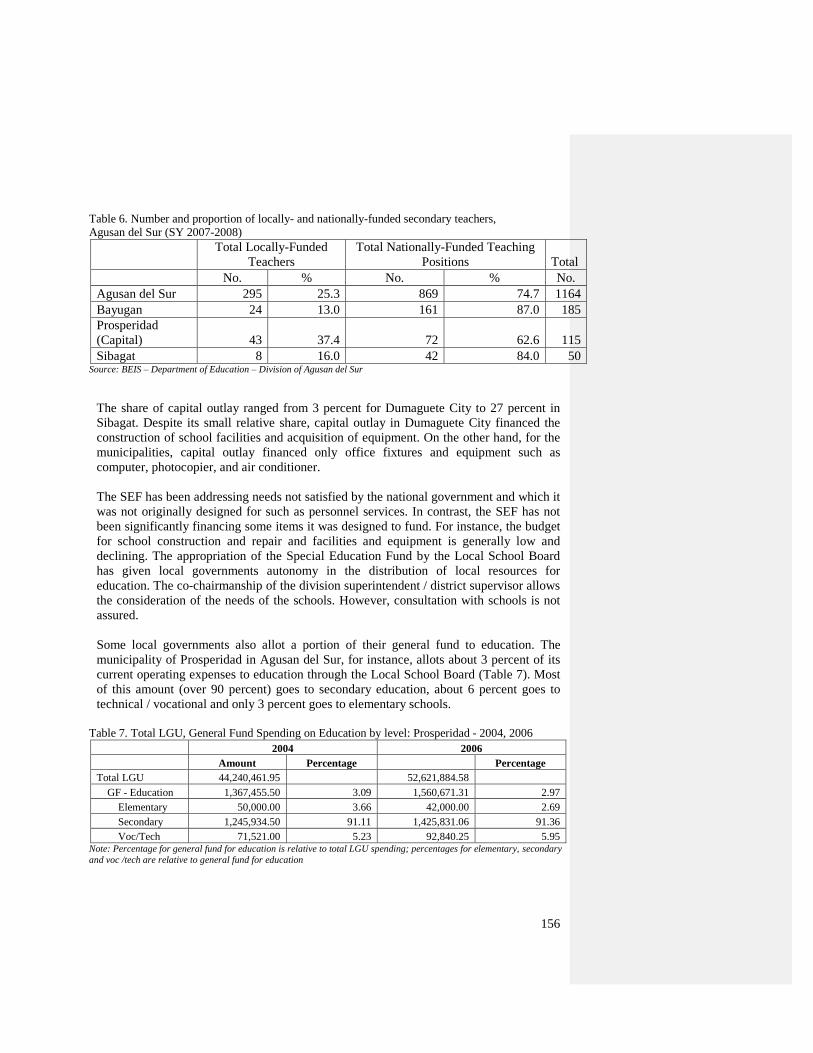
156
Table 6. Number and proportion of locally- and nationally-funded secondary teachers,
Agusan del Sur (SY 2007-2008)
Total Locally-Funded
Teachers
Total Nationally-Funded Teaching
Positions Total
No. % No. % No.
Agusan del Sur 295 25.3 869 74.7 1164
Bayugan 24 13.0 161 87.0 185
Prosperidad
(Capital) 43 37.4 72 62.6 115
Sibagat 8 16.0 42 84.0 50 Source: BEIS – Department of Education – Division of Agusan del Sur
The share of capital outlay ranged from 3 percent for Dumaguete City to 27 percent in
Sibagat. Despite its small relative share, capital outlay in Dumaguete City financed the
construction of school facilities and acquisition of equipment. On the other hand, for the
municipalities, capital outlay financed only office fixtures and equipment such as
computer, photocopier, and air conditioner.
The SEF has been addressing needs not satisfied by the national government and which it
was not originally designed for such as personnel services. In contrast, the SEF has not
been significantly financing some items it was designed to fund. For instance, the budget
for school construction and repair and facilities and equipment is generally low and
declining. The appropriation of the Special Education Fund by the Local School Board
has given local governments autonomy in the distribution of local resources for
education. The co-chairmanship of the division superintendent / district supervisor allows
the consideration of the needs of the schools. However, consultation with schools is not
assured.
Some local governments also allot a portion of their general fund to education. The
municipality of Prosperidad in Agusan del Sur, for instance, allots about 3 percent of its
current operating expenses to education through the Local School Board (Table 7). Most
of this amount (over 90 percent) goes to secondary education, about 6 percent goes to
technical / vocational and only 3 percent goes to elementary schools.
Table 7. Total LGU, General Fund Spending on Education by level: Prosperidad - 2004, 2006
2004 2006
Amount Percentage Percentage
Total LGU 44,240,461.95 52,621,884.58
GF - Education 1,367,455.50 3.09 1,560,671.31 2.97
Elementary 50,000.00 3.66 42,000.00 2.69
Secondary 1,245,934.50 91.11 1,425,831.06 91.36
Voc/Tech 71,521.00 5.23 92,840.25 5.95 Note: Percentage for general fund for education is relative to total LGU spending; percentages for elementary, secondary
and voc /tech are relative to general fund for education
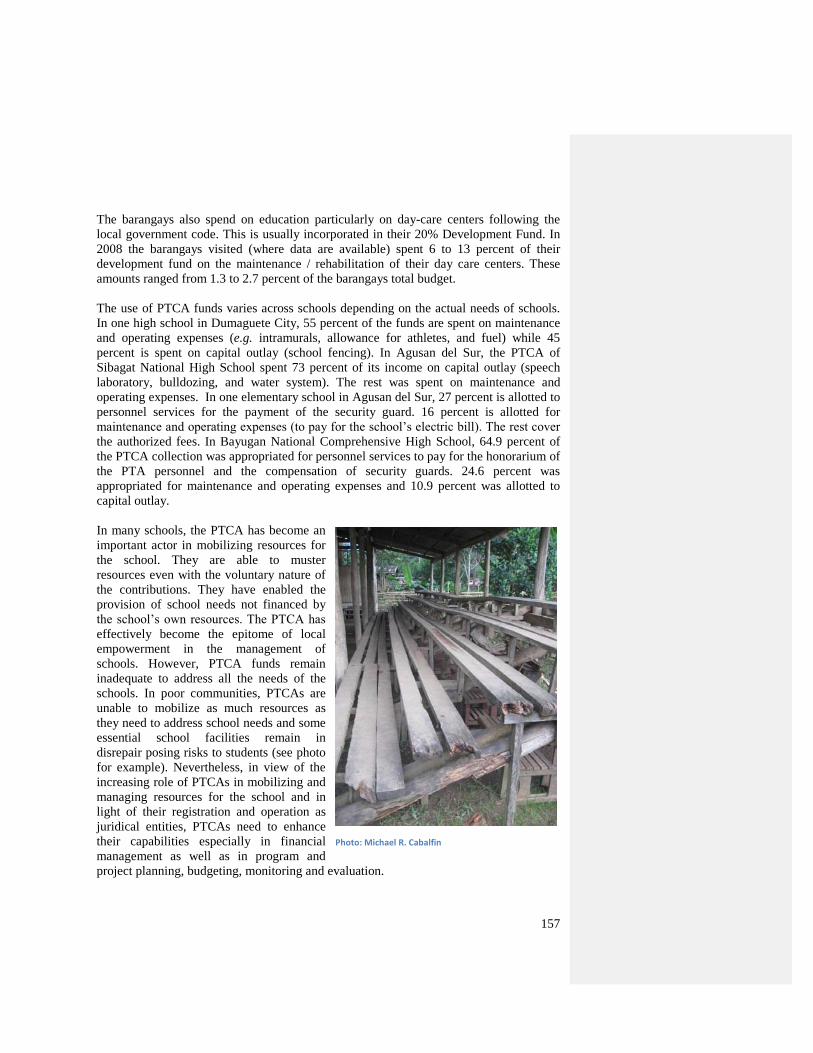
157
The barangays also spend on education particularly on day-care centers following the
local government code. This is usually incorporated in their 20% Development Fund. In
2008 the barangays visited (where data are available) spent 6 to 13 percent of their
development fund on the maintenance / rehabilitation of their day care centers. These
amounts ranged from 1.3 to 2.7 percent of the barangays total budget.
The use of PTCA funds varies across schools depending on the actual needs of schools.
In one high school in Dumaguete City, 55 percent of the funds are spent on maintenance
and operating expenses (e.g. intramurals, allowance for athletes, and fuel) while 45
percent is spent on capital outlay (school fencing). In Agusan del Sur, the PTCA of
Sibagat National High School spent 73 percent of its income on capital outlay (speech
laboratory, bulldozing, and water system). The rest was spent on maintenance and
operating expenses. In one elementary school in Agusan del Sur, 27 percent is allotted to
personnel services for the payment of the security guard. 16 percent is allotted for
maintenance and operating expenses (to pay for the school‘s electric bill). The rest cover
the authorized fees. In Bayugan National Comprehensive High School, 64.9 percent of
the PTCA collection was appropriated for personnel services to pay for the honorarium of
the PTA personnel and the compensation of security guards. 24.6 percent was
appropriated for maintenance and operating expenses and 10.9 percent was allotted to
capital outlay.
In many schools, the PTCA has become an
important actor in mobilizing resources for
the school. They are able to muster
resources even with the voluntary nature of
the contributions. They have enabled the
provision of school needs not financed by
the school‘s own resources. The PTCA has
effectively become the epitome of local
empowerment in the management of
schools. However, PTCA funds remain
inadequate to address all the needs of the
schools. In poor communities, PTCAs are
unable to mobilize as much resources as
they need to address school needs and some
essential school facilities remain in
disrepair posing risks to students (see photo
for example). Nevertheless, in view of the
increasing role of PTCAs in mobilizing and
managing resources for the school and in
light of their registration and operation as
juridical entities, PTCAs need to enhance
their capabilities especially in financial
management as well as in program and
project planning, budgeting, monitoring and evaluation.
Photo: Michael R. Cabalfin
158
Other sources of support to education include local chambers of commerce, national
associations of native-born individuals (e.g. Alliance of Bayuganon Nationwide), private
businesses, professional / civic organizations (e.g. Rotary) and international organizations
(e.g. Sir Medjugorje - see Box 1).
4.5 Assessment of trends in actual service delivery
4.5.1 Service standards
The Basic Education Information System (BEIS) is the primary Management Information
System of DepEd. It processes the data gathered from the ―Government Elementary
School Profile (GESP), Government Secondary School Profile (GSSP) and Unified
School Profile (USP) for planning, budget preparation, resource allocation and
performance monitoring. The system consists of three modules: the Quick Counts
Module, the School Statistics and the Performance Indicators Module. The BEIS Quick
Counts Module is used to process quick summaries on total enrolment, number of
nationally paid teachers, classrooms and furniture at every public elementary and
secondary school. It produces automated reports on pupil-teacher analysis, pupil-
classroom analysis and pupil-furniture analysis which are used for budgeting and
resource allocation. It is also capable of generating reports by school district,
municipality class and urban/rural classification. The reports generated by the system
utilize the color coding scheme (Table 8) to illustrate the adequacy of teachers,
classrooms or furniture in a particular area.‖
Box 1: School Feeding Program
In Dumaguete City, one source of educational assistance is Sir Medjugorje, a
Scottish international relief organization and funded by the church. This
organization conducts school feeding in the three most depressed areas of the
city (Looc, Calindagan and Batinguel). With a core staff of seven and 27
parent-volunteers, it feeds 200 Grade 1, 2 and 3 pupils each in elementary
schools. It does so simultaneously 3 times a week at 3 o‘clock in the
afternoon with nutritious food. It also feeds 200 street children 200.
However, it does not feed in the morning because there are no volunteers in
the morning. Volunteers are parents of school children and cook for their
families in the morning. According to a member of the core staff, if only
there are volunteers from the well off, morning feeding would be possible.
However, there are no volunteers from the well off. The program is now on
its 4th year in Calindagan, 2nd year in Amador Dagudag, and 1st year in
Batinguel.
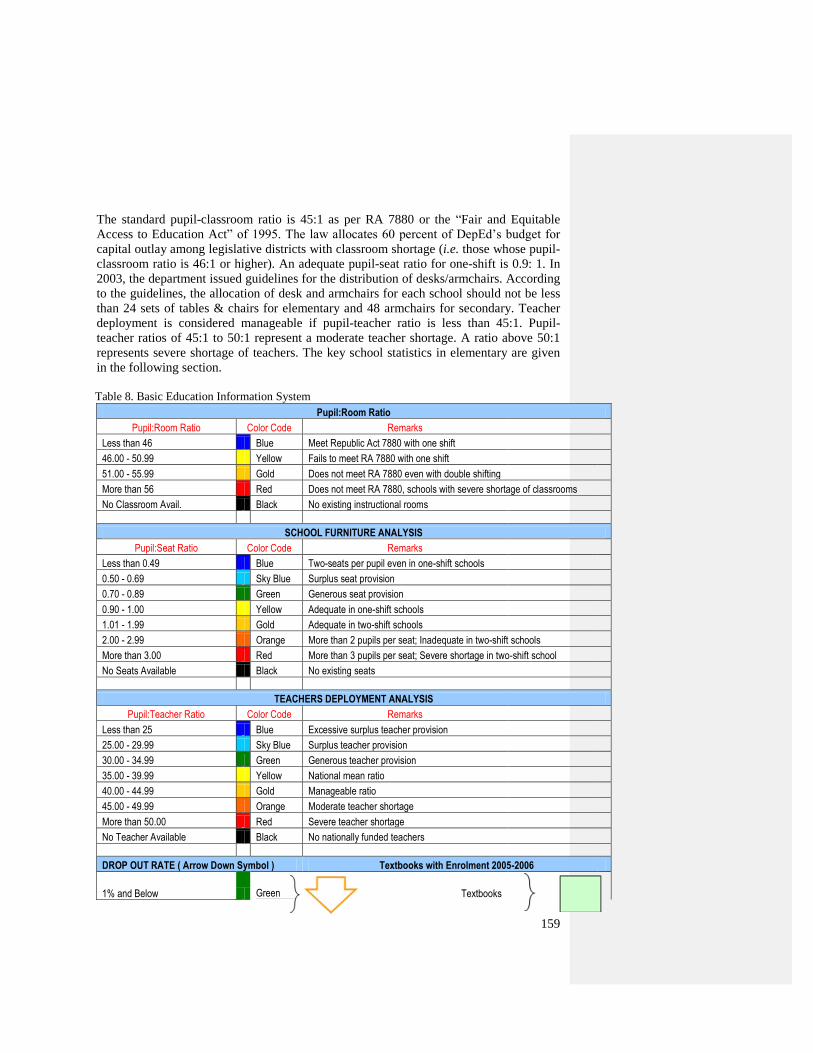
159
The standard pupil-classroom ratio is 45:1 as per RA 7880 or the ―Fair and Equitable
Access to Education Act‖ of 1995. The law allocates 60 percent of DepEd‘s budget for
capital outlay among legislative districts with classroom shortage (i.e. those whose pupil-
classroom ratio is 46:1 or higher). An adequate pupil-seat ratio for one-shift is 0.9: 1. In
2003, the department issued guidelines for the distribution of desks/armchairs. According
to the guidelines, the allocation of desk and armchairs for each school should not be less
than 24 sets of tables & chairs for elementary and 48 armchairs for secondary. Teacher
deployment is considered manageable if pupil-teacher ratio is less than 45:1. Pupil-
teacher ratios of 45:1 to 50:1 represent a moderate teacher shortage. A ratio above 50:1
represents severe shortage of teachers. The key school statistics in elementary are given
in the following section.
Table 8. Basic Education Information System
Pupil:Room Ratio
Pupil:Room Ratio Color Code Remarks
Less than 46 Blue Meet Republic Act 7880 with one shift
46.00 - 50.99 Yellow Fails to meet RA 7880 with one shift
51.00 - 55.99 Gold Does not meet RA 7880 even with double shifting
More than 56 Red Does not meet RA 7880, schools with severe shortage of classrooms
No Classroom Avail. Black No existing instructional rooms
SCHOOL FURNITURE ANALYSIS
Pupil:Seat Ratio Color Code Remarks
Less than 0.49 Blue Two-seats per pupil even in one-shift schools
0.50 - 0.69 Sky Blue Surplus seat provision
0.70 - 0.89 Green Generous seat provision
0.90 - 1.00 Yellow Adequate in one-shift schools
1.01 - 1.99 Gold Adequate in two-shift schools
2.00 - 2.99 Orange More than 2 pupils per seat; Inadequate in two-shift schools
More than 3.00 Red More than 3 pupils per seat; Severe shortage in two-shift school
No Seats Available Black No existing seats
TEACHERS DEPLOYMENT ANALYSIS
Pupil:Teacher Ratio Color Code Remarks
Less than 25 Blue Excessive surplus teacher provision
25.00 - 29.99 Sky Blue Surplus teacher provision
30.00 - 34.99 Green Generous teacher provision
35.00 - 39.99 Yellow National mean ratio
40.00 - 44.99 Gold Manageable ratio
45.00 - 49.99 Orange Moderate teacher shortage
More than 50.00 Red Severe teacher shortage
No Teacher Available Black No nationally funded teachers
DROP OUT RATE ( Arrow Down Symbol ) Textbooks with Enrolment 2005-2006
1% and Below
Green
Textbooks
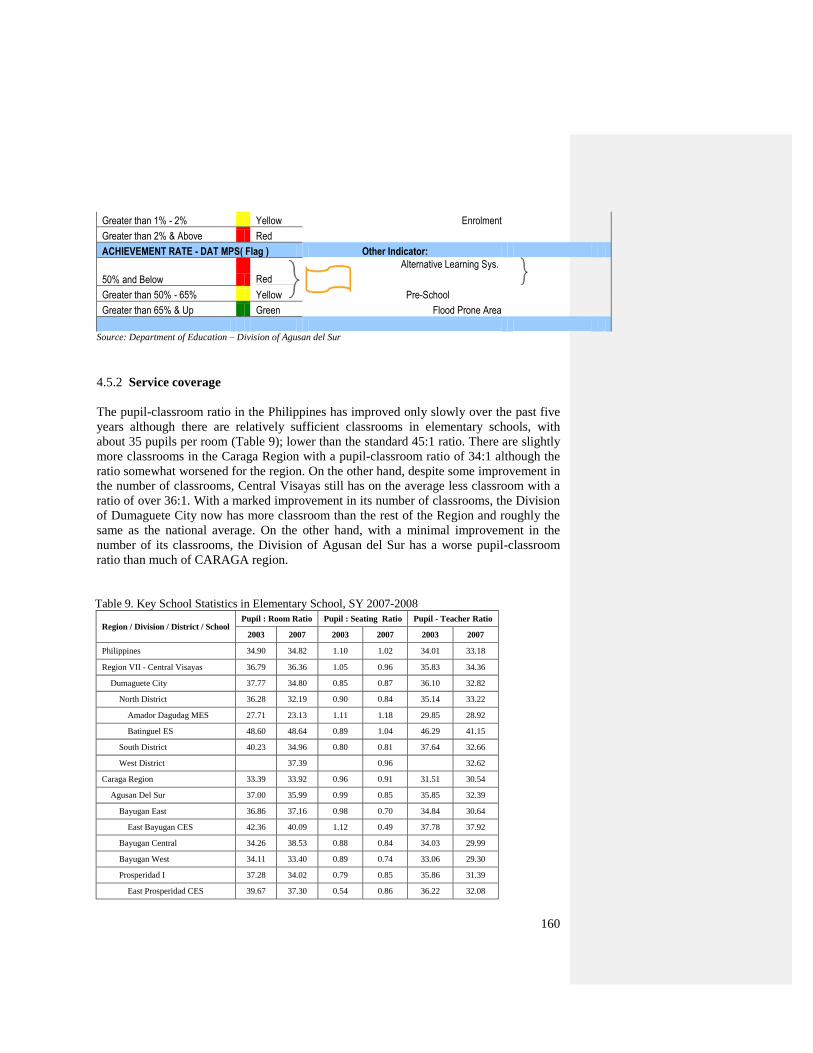
160
Greater than 1% - 2% Yellow Enrolment
Greater than 2% & Above Red
ACHIEVEMENT RATE - DAT MPS( Flag ) Other Indicator:
50% and Below
Red
Alternative Learning Sys.
Greater than 50% - 65% Yellow Pre-School
Greater than 65% & Up Green Flood Prone Area
Source: Department of Education – Division of Agusan del Sur
4.5.2 Service coverage
The pupil-classroom ratio in the Philippines has improved only slowly over the past five
years although there are relatively sufficient classrooms in elementary schools, with
about 35 pupils per room (Table 9); lower than the standard 45:1 ratio. There are slightly
more classrooms in the Caraga Region with a pupil-classroom ratio of 34:1 although the
ratio somewhat worsened for the region. On the other hand, despite some improvement in
the number of classrooms, Central Visayas still has on the average less classroom with a
ratio of over 36:1. With a marked improvement in its number of classrooms, the Division
of Dumaguete City now has more classroom than the rest of the Region and roughly the
same as the national average. On the other hand, with a minimal improvement in the
number of its classrooms, the Division of Agusan del Sur has a worse pupil-classroom
ratio than much of CARAGA region.
Table 9. Key School Statistics in Elementary School, SY 2007-2008
Region / Division / District / School Pupil : Room Ratio Pupil : Seating Ratio Pupil - Teacher Ratio
2003 2007 2003 2007 2003 2007
Philippines 34.90 34.82 1.10 1.02 34.01 33.18
Region VII - Central Visayas 36.79 36.36 1.05 0.96 35.83 34.36
Dumaguete City 37.77 34.80 0.85 0.87 36.10 32.82
North District 36.28 32.19 0.90 0.84 35.14 33.22
Amador Dagudag MES 27.71 23.13 1.11 1.18 29.85 28.92
Batinguel ES 48.60 48.64 0.89 1.04 46.29 41.15
South District 40.23 34.96 0.80 0.81 37.64 32.66
West District 37.39 0.96 32.62
Caraga Region 33.39 33.92 0.96 0.91 31.51 30.54
Agusan Del Sur 37.00 35.99 0.99 0.85 35.85 32.39
Bayugan East 36.86 37.16 0.98 0.70 34.84 30.64
East Bayugan CES 42.36 40.09 1.12 0.49 37.78 37.92
Bayugan Central 34.26 38.53 0.88 0.84 34.03 29.99
Bayugan West 34.11 33.40 0.89 0.74 33.06 29.30
Prosperidad I 37.28 34.02 0.79 0.85 35.86 31.39
East Prosperidad CES 39.67 37.30 0.54 0.86 36.22 32.08
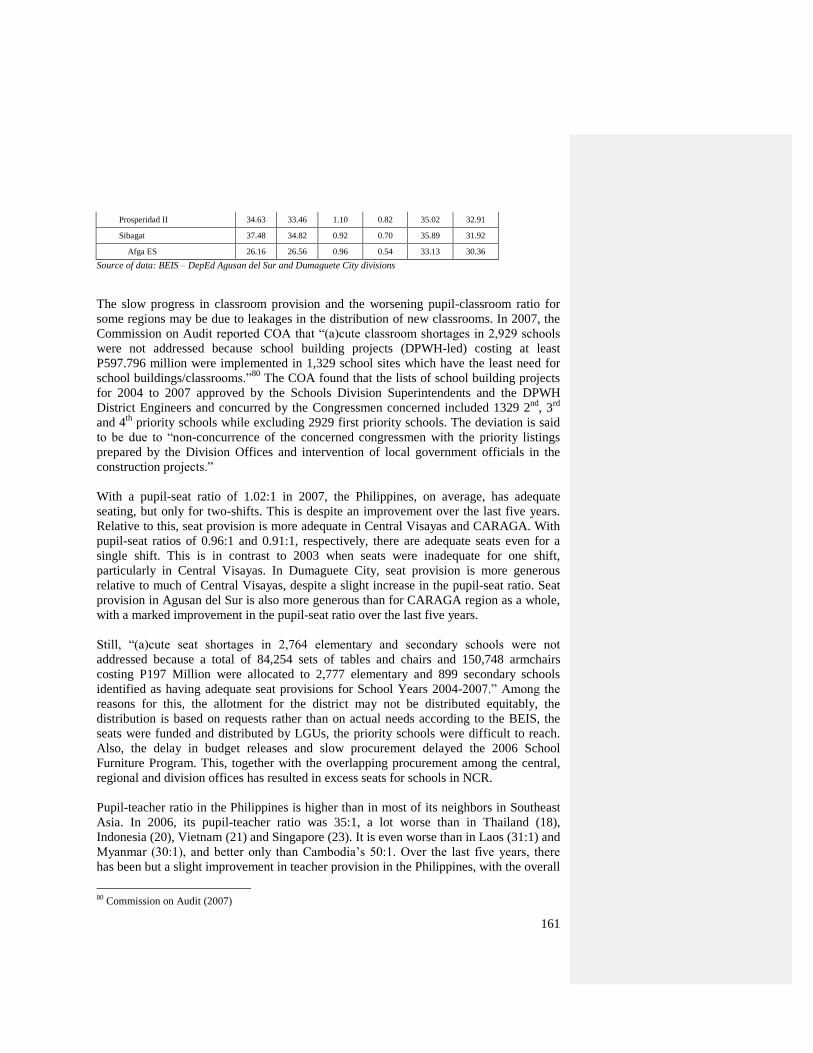
161
Prosperidad II 34.63 33.46 1.10 0.82 35.02 32.91
Sibagat 37.48 34.82 0.92 0.70 35.89 31.92
Afga ES 26.16 26.56 0.96 0.54 33.13 30.36
Source of data: BEIS – DepEd Agusan del Sur and Dumaguete City divisions
The slow progress in classroom provision and the worsening pupil-classroom ratio for
some regions may be due to leakages in the distribution of new classrooms. In 2007, the
Commission on Audit reported COA that ―(a)cute classroom shortages in 2,929 schools
were not addressed because school building projects (DPWH-led) costing at least
P597.796 million were implemented in 1,329 school sites which have the least need for
school buildings/classrooms.‖80
The COA found that the lists of school building projects
for 2004 to 2007 approved by the Schools Division Superintendents and the DPWH
District Engineers and concurred by the Congressmen concerned included 1329 2nd
, 3rd
and 4th
priority schools while excluding 2929 first priority schools. The deviation is said
to be due to ―non-concurrence of the concerned congressmen with the priority listings
prepared by the Division Offices and intervention of local government officials in the
construction projects.‖
With a pupil-seat ratio of 1.02:1 in 2007, the Philippines, on average, has adequate
seating, but only for two-shifts. This is despite an improvement over the last five years.
Relative to this, seat provision is more adequate in Central Visayas and CARAGA. With
pupil-seat ratios of 0.96:1 and 0.91:1, respectively, there are adequate seats even for a
single shift. This is in contrast to 2003 when seats were inadequate for one shift,
particularly in Central Visayas. In Dumaguete City, seat provision is more generous
relative to much of Central Visayas, despite a slight increase in the pupil-seat ratio. Seat
provision in Agusan del Sur is also more generous than for CARAGA region as a whole,
with a marked improvement in the pupil-seat ratio over the last five years.
Still, ―(a)cute seat shortages in 2,764 elementary and secondary schools were not
addressed because a total of 84,254 sets of tables and chairs and 150,748 armchairs
costing P197 Million were allocated to 2,777 elementary and 899 secondary schools
identified as having adequate seat provisions for School Years 2004-2007.‖ Among the
reasons for this, the allotment for the district may not be distributed equitably, the
distribution is based on requests rather than on actual needs according to the BEIS, the
seats were funded and distributed by LGUs, the priority schools were difficult to reach.
Also, the delay in budget releases and slow procurement delayed the 2006 School
Furniture Program. This, together with the overlapping procurement among the central,
regional and division offices has resulted in excess seats for schools in NCR.
Pupil-teacher ratio in the Philippines is higher than in most of its neighbors in Southeast
Asia. In 2006, its pupil-teacher ratio was 35:1, a lot worse than in Thailand (18),
Indonesia (20), Vietnam (21) and Singapore (23). It is even worse than in Laos (31:1) and
Myanmar (30:1), and better only than Cambodia‘s 50:1. Over the last five years, there
has been but a slight improvement in teacher provision in the Philippines, with the overall
80
Commission on Audit (2007)
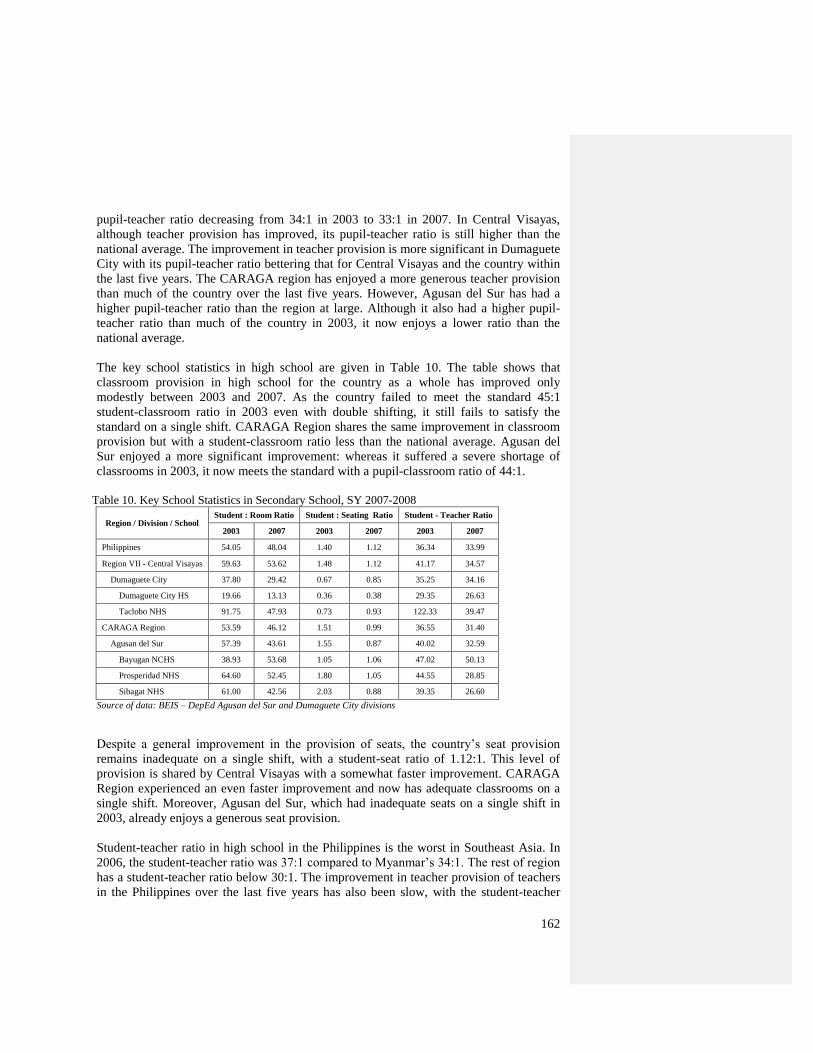
162
pupil-teacher ratio decreasing from 34:1 in 2003 to 33:1 in 2007. In Central Visayas,
although teacher provision has improved, its pupil-teacher ratio is still higher than the
national average. The improvement in teacher provision is more significant in Dumaguete
City with its pupil-teacher ratio bettering that for Central Visayas and the country within
the last five years. The CARAGA region has enjoyed a more generous teacher provision
than much of the country over the last five years. However, Agusan del Sur has had a
higher pupil-teacher ratio than the region at large. Although it also had a higher pupil-
teacher ratio than much of the country in 2003, it now enjoys a lower ratio than the
national average.
The key school statistics in high school are given in Table 10. The table shows that
classroom provision in high school for the country as a whole has improved only
modestly between 2003 and 2007. As the country failed to meet the standard 45:1
student-classroom ratio in 2003 even with double shifting, it still fails to satisfy the
standard on a single shift. CARAGA Region shares the same improvement in classroom
provision but with a student-classroom ratio less than the national average. Agusan del
Sur enjoyed a more significant improvement: whereas it suffered a severe shortage of
classrooms in 2003, it now meets the standard with a pupil-classroom ratio of 44:1.
Table 10. Key School Statistics in Secondary School, SY 2007-2008
Region / Division / School Student : Room Ratio Student : Seating Ratio Student - Teacher Ratio
2003 2007 2003 2007 2003 2007
Philippines 54.05 48.04 1.40 1.12 36.34 33.99
Region VII - Central Visayas 59.63 53.62 1.48 1.12 41.17 34.57
Dumaguete City 37.80 29.42 0.67 0.85 35.25 34.16
Dumaguete City HS 19.66 13.13 0.36 0.38 29.35 26.63
Taclobo NHS 91.75 47.93 0.73 0.93 122.33 39.47
CARAGA Region 53.59 46.12 1.51 0.99 36.55 31.40
Agusan del Sur 57.39 43.61 1.55 0.87 40.02 32.59
Bayugan NCHS 38.93 53.68 1.05 1.06 47.02 50.13
Prosperidad NHS 64.60 52.45 1.80 1.05 44.55 28.85
Sibagat NHS 61.00 42.56 2.03 0.88 39.35 26.60
Source of data: BEIS – DepEd Agusan del Sur and Dumaguete City divisions
Despite a general improvement in the provision of seats, the country‘s seat provision
remains inadequate on a single shift, with a student-seat ratio of 1.12:1. This level of
provision is shared by Central Visayas with a somewhat faster improvement. CARAGA
Region experienced an even faster improvement and now has adequate classrooms on a
single shift. Moreover, Agusan del Sur, which had inadequate seats on a single shift in
2003, already enjoys a generous seat provision.
Student-teacher ratio in high school in the Philippines is the worst in Southeast Asia. In
2006, the student-teacher ratio was 37:1 compared to Myanmar‘s 34:1. The rest of region
has a student-teacher ratio below 30:1. The improvement in teacher provision of teachers
in the Philippines over the last five years has also been slow, with the student-teacher
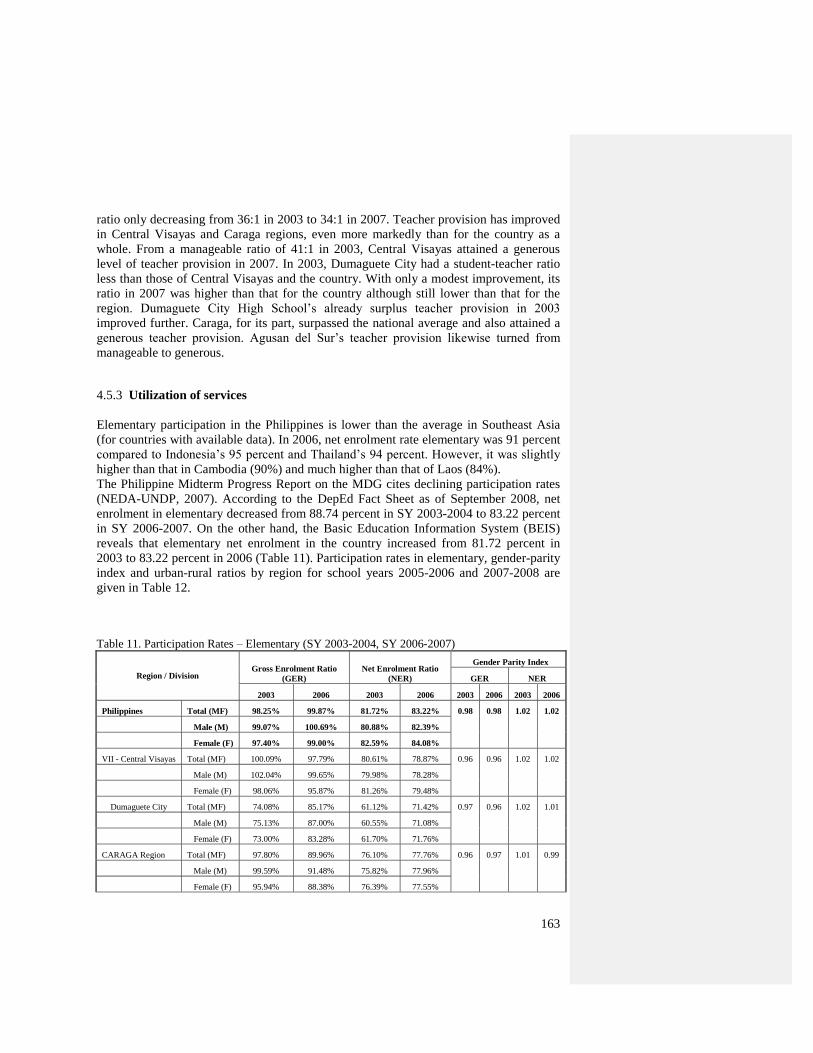
163
ratio only decreasing from 36:1 in 2003 to 34:1 in 2007. Teacher provision has improved
in Central Visayas and Caraga regions, even more markedly than for the country as a
whole. From a manageable ratio of 41:1 in 2003, Central Visayas attained a generous
level of teacher provision in 2007. In 2003, Dumaguete City had a student-teacher ratio
less than those of Central Visayas and the country. With only a modest improvement, its
ratio in 2007 was higher than that for the country although still lower than that for the
region. Dumaguete City High School‘s already surplus teacher provision in 2003
improved further. Caraga, for its part, surpassed the national average and also attained a
generous teacher provision. Agusan del Sur‘s teacher provision likewise turned from
manageable to generous.
4.5.3 Utilization of services
Elementary participation in the Philippines is lower than the average in Southeast Asia
(for countries with available data). In 2006, net enrolment rate elementary was 91 percent
compared to Indonesia‘s 95 percent and Thailand‘s 94 percent. However, it was slightly
higher than that in Cambodia (90%) and much higher than that of Laos (84%).
The Philippine Midterm Progress Report on the MDG cites declining participation rates
(NEDA-UNDP, 2007). According to the DepEd Fact Sheet as of September 2008, net
enrolment in elementary decreased from 88.74 percent in SY 2003-2004 to 83.22 percent
in SY 2006-2007. On the other hand, the Basic Education Information System (BEIS)
reveals that elementary net enrolment in the country increased from 81.72 percent in
2003 to 83.22 percent in 2006 (Table 11). Participation rates in elementary, gender-parity
index and urban-rural ratios by region for school years 2005-2006 and 2007-2008 are
given in Table 12.
Table 11. Participation Rates – Elementary (SY 2003-2004, SY 2006-2007)
Region / Division Gross Enrolment Ratio
(GER)
Net Enrolment Ratio
(NER)
Gender Parity Index
GER NER
2003 2006 2003 2006 2003 2006 2003 2006
Philippines Total (MF) 98.25% 99.87% 81.72% 83.22% 0.98 0.98 1.02 1.02
Male (M) 99.07% 100.69% 80.88% 82.39%
Female (F) 97.40% 99.00% 82.59% 84.08%
VII - Central Visayas Total (MF) 100.09% 97.79% 80.61% 78.87% 0.96 0.96 1.02 1.02
Male (M) 102.04% 99.65% 79.98% 78.28%
Female (F) 98.06% 95.87% 81.26% 79.48%
Dumaguete City Total (MF) 74.08% 85.17% 61.12% 71.42% 0.97 0.96 1.02 1.01
Male (M) 75.13% 87.00% 60.55% 71.08%
Female (F) 73.00% 83.28% 61.70% 71.76%
CARAGA Region Total (MF) 97.80% 89.96% 76.10% 77.76% 0.96 0.97 1.01 0.99
Male (M) 99.59% 91.48% 75.82% 77.96%
Female (F) 95.94% 88.38% 76.39% 77.55%
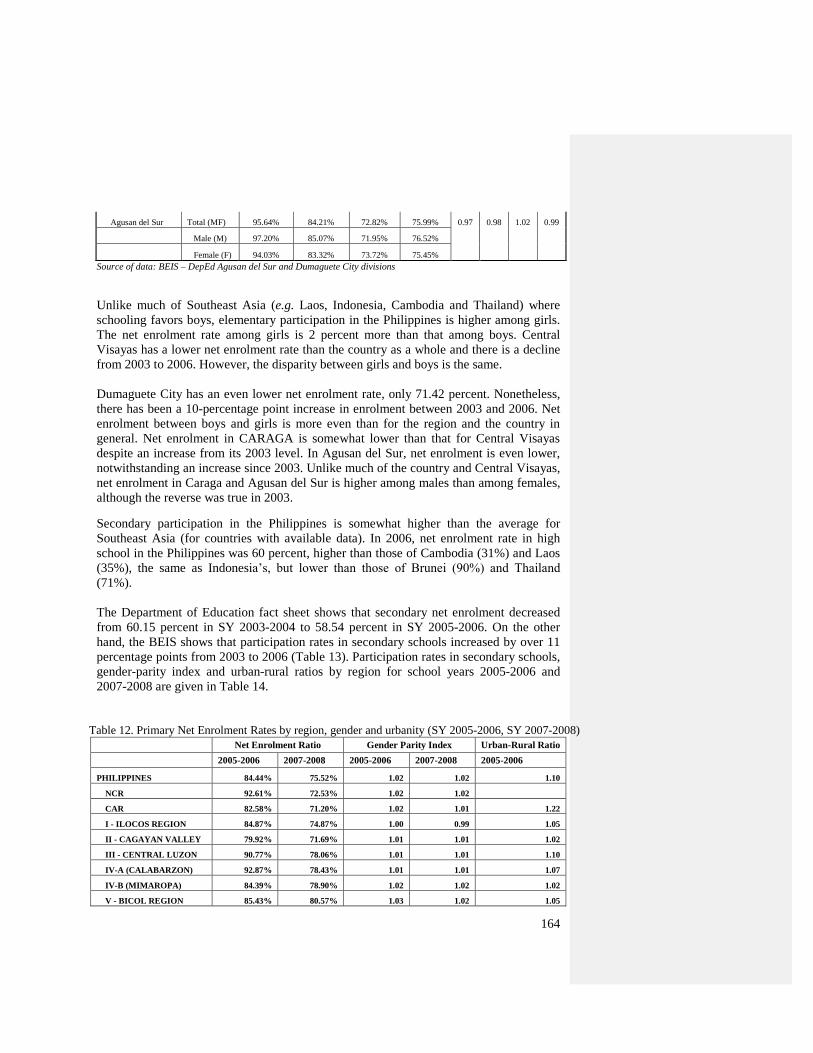
164
Agusan del Sur Total (MF) 95.64% 84.21% 72.82% 75.99% 0.97 0.98 1.02 0.99
Male (M) 97.20% 85.07% 71.95% 76.52%
Female (F) 94.03% 83.32% 73.72% 75.45%
Source of data: BEIS – DepEd Agusan del Sur and Dumaguete City divisions
Unlike much of Southeast Asia (e.g. Laos, Indonesia, Cambodia and Thailand) where
schooling favors boys, elementary participation in the Philippines is higher among girls.
The net enrolment rate among girls is 2 percent more than that among boys. Central
Visayas has a lower net enrolment rate than the country as a whole and there is a decline
from 2003 to 2006. However, the disparity between girls and boys is the same.
Dumaguete City has an even lower net enrolment rate, only 71.42 percent. Nonetheless,
there has been a 10-percentage point increase in enrolment between 2003 and 2006. Net
enrolment between boys and girls is more even than for the region and the country in
general. Net enrolment in CARAGA is somewhat lower than that for Central Visayas
despite an increase from its 2003 level. In Agusan del Sur, net enrolment is even lower,
notwithstanding an increase since 2003. Unlike much of the country and Central Visayas,
net enrolment in Caraga and Agusan del Sur is higher among males than among females,
although the reverse was true in 2003.
Secondary participation in the Philippines is somewhat higher than the average for
Southeast Asia (for countries with available data). In 2006, net enrolment rate in high
school in the Philippines was 60 percent, higher than those of Cambodia (31%) and Laos
(35%), the same as Indonesia‘s, but lower than those of Brunei (90%) and Thailand
(71%).
The Department of Education fact sheet shows that secondary net enrolment decreased
from 60.15 percent in SY 2003-2004 to 58.54 percent in SY 2005-2006. On the other
hand, the BEIS shows that participation rates in secondary schools increased by over 11
percentage points from 2003 to 2006 (Table 13). Participation rates in secondary schools,
gender-parity index and urban-rural ratios by region for school years 2005-2006 and
2007-2008 are given in Table 14.
Table 12. Primary Net Enrolment Rates by region, gender and urbanity (SY 2005-2006, SY 2007-2008)
Net Enrolment Ratio Gender Parity Index Urban-Rural Ratio
2005-2006 2007-2008 2005-2006 2007-2008 2005-2006
PHILIPPINES 84.44% 75.52% 1.02 1.02 1.10
NCR 92.61% 72.53% 1.02 1.02
CAR 82.58% 71.20% 1.02 1.01 1.22
I - ILOCOS REGION 84.87% 74.87% 1.00 0.99 1.05
II - CAGAYAN VALLEY 79.92% 71.69% 1.01 1.01 1.02
III - CENTRAL LUZON 90.77% 78.06% 1.01 1.01 1.10
IV-A (CALABARZON) 92.87% 78.43% 1.01 1.01 1.07
IV-B (MIMAROPA) 84.39% 78.90% 1.02 1.02 1.02
V - BICOL REGION 85.43% 80.57% 1.03 1.02 1.05
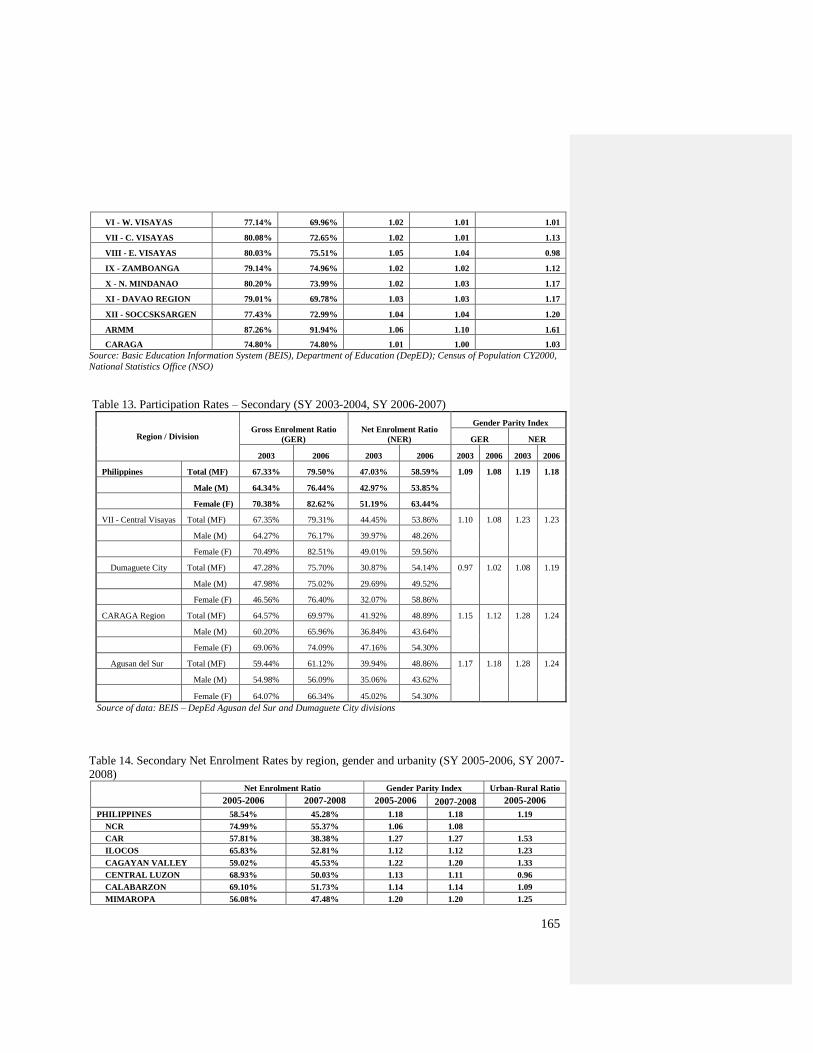
165
VI - W. VISAYAS 77.14% 69.96% 1.02 1.01 1.01
VII - C. VISAYAS 80.08% 72.65% 1.02 1.01 1.13
VIII - E. VISAYAS 80.03% 75.51% 1.05 1.04 0.98
IX - ZAMBOANGA 79.14% 74.96% 1.02 1.02 1.12
X - N. MINDANAO 80.20% 73.99% 1.02 1.03 1.17
XI - DAVAO REGION 79.01% 69.78% 1.03 1.03 1.17
XII - SOCCSKSARGEN 77.43% 72.99% 1.04 1.04 1.20
ARMM 87.26% 91.94% 1.06 1.10 1.61
CARAGA 74.80% 74.80% 1.01 1.00 1.03
Source: Basic Education Information System (BEIS), Department of Education (DepED); Census of Population CY2000,
National Statistics Office (NSO)
Table 13. Participation Rates – Secondary (SY 2003-2004, SY 2006-2007)
Region / Division Gross Enrolment Ratio
(GER)
Net Enrolment Ratio
(NER)
Gender Parity Index
GER NER
2003 2006 2003 2006 2003 2006 2003 2006
Philippines Total (MF) 67.33% 79.50% 47.03% 58.59% 1.09 1.08 1.19 1.18
Male (M) 64.34% 76.44% 42.97% 53.85%
Female (F) 70.38% 82.62% 51.19% 63.44%
VII - Central Visayas Total (MF) 67.35% 79.31% 44.45% 53.86% 1.10 1.08 1.23 1.23
Male (M) 64.27% 76.17% 39.97% 48.26%
Female (F) 70.49% 82.51% 49.01% 59.56%
Dumaguete City Total (MF) 47.28% 75.70% 30.87% 54.14% 0.97 1.02 1.08 1.19
Male (M) 47.98% 75.02% 29.69% 49.52%
Female (F) 46.56% 76.40% 32.07% 58.86%
CARAGA Region Total (MF) 64.57% 69.97% 41.92% 48.89% 1.15 1.12 1.28 1.24
Male (M) 60.20% 65.96% 36.84% 43.64%
Female (F) 69.06% 74.09% 47.16% 54.30%
Agusan del Sur Total (MF) 59.44% 61.12% 39.94% 48.86% 1.17 1.18 1.28 1.24
Male (M) 54.98% 56.09% 35.06% 43.62%
Female (F) 64.07% 66.34% 45.02% 54.30%
Source of data: BEIS – DepEd Agusan del Sur and Dumaguete City divisions
Table 14. Secondary Net Enrolment Rates by region, gender and urbanity (SY 2005-2006, SY 2007-
2008)
Net Enrolment Ratio Gender Parity Index Urban-Rural Ratio
2005-2006 2007-2008 2005-2006 2007-2008 2005-2006
PHILIPPINES 58.54% 45.28% 1.18 1.18 1.19
NCR 74.99% 55.37% 1.06 1.08
CAR 57.81% 38.38% 1.27 1.27 1.53
ILOCOS 65.83% 52.81% 1.12 1.12 1.23
CAGAYAN VALLEY 59.02% 45.53% 1.22 1.20 1.33
CENTRAL LUZON 68.93% 50.03% 1.13 1.11 0.96
CALABARZON 69.10% 51.73% 1.14 1.14 1.09
MIMAROPA 56.08% 47.48% 1.20 1.20 1.25
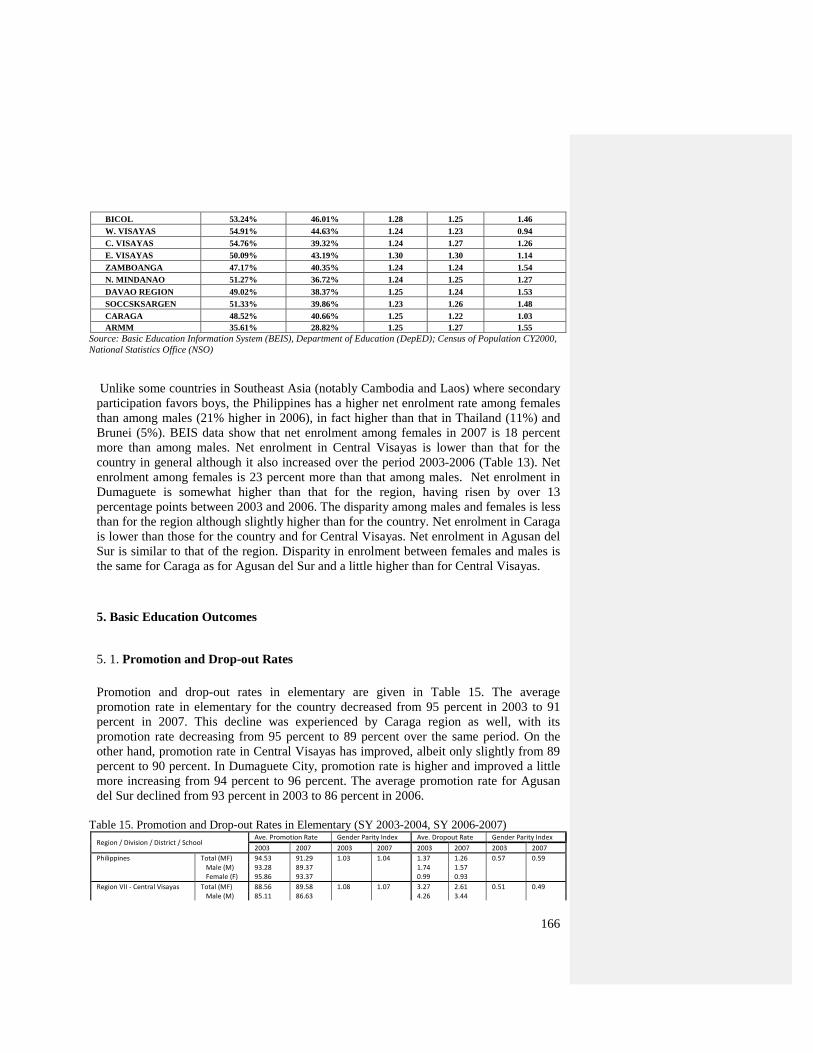
166
BICOL 53.24% 46.01% 1.28 1.25 1.46
W. VISAYAS 54.91% 44.63% 1.24 1.23 0.94
C. VISAYAS 54.76% 39.32% 1.24 1.27 1.26
E. VISAYAS 50.09% 43.19% 1.30 1.30 1.14
ZAMBOANGA 47.17% 40.35% 1.24 1.24 1.54
N. MINDANAO 51.27% 36.72% 1.24 1.25 1.27
DAVAO REGION 49.02% 38.37% 1.25 1.24 1.53
SOCCSKSARGEN 51.33% 39.86% 1.23 1.26 1.48
CARAGA 48.52% 40.66% 1.25 1.22 1.03
ARMM 35.61% 28.82% 1.25 1.27 1.55
Source: Basic Education Information System (BEIS), Department of Education (DepED); Census of Population CY2000,
National Statistics Office (NSO)
Unlike some countries in Southeast Asia (notably Cambodia and Laos) where secondary
participation favors boys, the Philippines has a higher net enrolment rate among females
than among males (21% higher in 2006), in fact higher than that in Thailand (11%) and
Brunei (5%). BEIS data show that net enrolment among females in 2007 is 18 percent
more than among males. Net enrolment in Central Visayas is lower than that for the
country in general although it also increased over the period 2003-2006 (Table 13). Net
enrolment among females is 23 percent more than that among males. Net enrolment in
Dumaguete is somewhat higher than that for the region, having risen by over 13
percentage points between 2003 and 2006. The disparity among males and females is less
than for the region although slightly higher than for the country. Net enrolment in Caraga
is lower than those for the country and for Central Visayas. Net enrolment in Agusan del
Sur is similar to that of the region. Disparity in enrolment between females and males is
the same for Caraga as for Agusan del Sur and a little higher than for Central Visayas.
5. Basic Education Outcomes
5. 1. Promotion and Drop-out Rates
Promotion and drop-out rates in elementary are given in Table 15. The average
promotion rate in elementary for the country decreased from 95 percent in 2003 to 91
percent in 2007. This decline was experienced by Caraga region as well, with its
promotion rate decreasing from 95 percent to 89 percent over the same period. On the
other hand, promotion rate in Central Visayas has improved, albeit only slightly from 89
percent to 90 percent. In Dumaguete City, promotion rate is higher and improved a little
more increasing from 94 percent to 96 percent. The average promotion rate for Agusan
del Sur declined from 93 percent in 2003 to 86 percent in 2006.
Table 15. Promotion and Drop-out Rates in Elementary (SY 2003-2004, SY 2006-2007)
Region / Division / District / School Ave. Promotion Rate Gender Parity Index Ave. Dropout Rate Gender Parity Index
2003 2007 2003 2007 2003 2007 2003 2007
Philippines Total (MF) 94.53 91.29 1.03 1.04 1.37 1.26 0.57 0.59 Male (M) 93.28 89.37 1.74 1.57 Female (F) 95.86 93.37 0.99 0.93
Region VII - Central Visayas Total (MF) 88.56 89.58 1.08 1.07 3.27 2.61 0.51 0.49 Male (M) 85.11 86.63 4.26 3.44
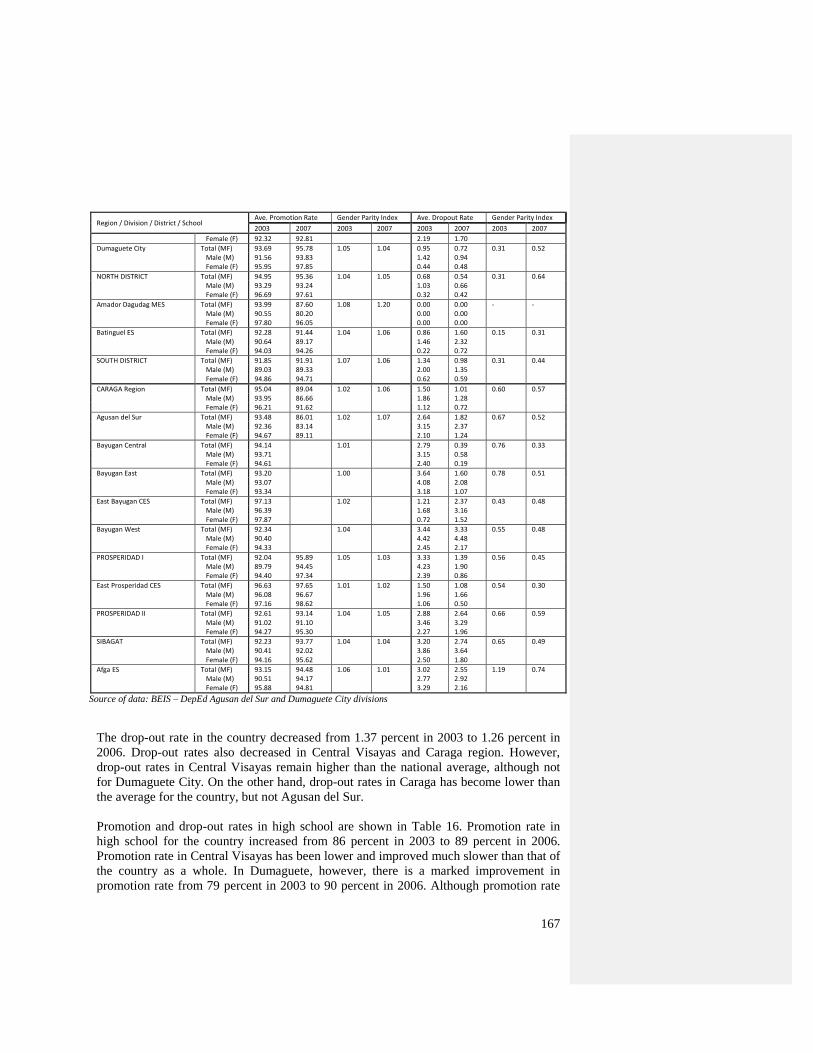
167
Region / Division / District / School Ave. Promotion Rate Gender Parity Index Ave. Dropout Rate Gender Parity Index
2003 2007 2003 2007 2003 2007 2003 2007
Female (F) 92.32 92.81 2.19 1.70
Dumaguete City Total (MF) 93.69 95.78 1.05 1.04 0.95 0.72 0.31 0.52 Male (M) 91.56 93.83 1.42 0.94 Female (F) 95.95 97.85 0.44 0.48
NORTH DISTRICT Total (MF) 94.95 95.36 1.04 1.05 0.68 0.54 0.31 0.64 Male (M) 93.29 93.24 1.03 0.66 Female (F) 96.69 97.61 0.32 0.42
Amador Dagudag MES Total (MF) 93.99 87.60 1.08 1.20 0.00 0.00 - - Male (M) 90.55 80.20 0.00 0.00 Female (F) 97.80 96.05 0.00 0.00
Batinguel ES Total (MF) 92.28 91.44 1.04 1.06 0.86 1.60 0.15 0.31 Male (M) 90.64 89.17 1.46 2.32 Female (F) 94.03 94.26 0.22 0.72
SOUTH DISTRICT Total (MF) 91.85 91.91 1.07 1.06 1.34 0.98 0.31 0.44 Male (M) 89.03 89.33 2.00 1.35 Female (F) 94.86 94.71 0.62 0.59
CARAGA Region Total (MF) 95.04 89.04 1.02 1.06 1.50 1.01 0.60 0.57 Male (M) 93.95 86.66 1.86 1.28 Female (F) 96.21 91.62 1.12 0.72
Agusan del Sur Total (MF) 93.48 86.01 1.02 1.07 2.64 1.82 0.67 0.52 Male (M) 92.36 83.14 3.15 2.37 Female (F) 94.67 89.11 2.10 1.24
Bayugan Central Total (MF) 94.14 1.01 2.79 0.39 0.76 0.33 Male (M) 93.71 3.15 0.58 Female (F) 94.61 2.40 0.19
Bayugan East Total (MF) 93.20 1.00 3.64 1.60 0.78 0.51 Male (M) 93.07 4.08 2.08 Female (F) 93.34 3.18 1.07
East Bayugan CES Total (MF) 97.13 1.02 1.21 2.37 0.43 0.48 Male (M) 96.39 1.68 3.16 Female (F) 97.87 0.72 1.52
Bayugan West Total (MF) 92.34 1.04 3.44 3.33 0.55 0.48 Male (M) 90.40 4.42 4.48 Female (F) 94.33 2.45 2.17
PROSPERIDAD I Total (MF) 92.04 95.89 1.05 1.03 3.33 1.39 0.56 0.45 Male (M) 89.79 94.45 4.23 1.90 Female (F) 94.40 97.34 2.39 0.86
East Prosperidad CES Total (MF) 96.63 97.65 1.01 1.02 1.50 1.08 0.54 0.30 Male (M) 96.08 96.67 1.96 1.66 Female (F) 97.16 98.62 1.06 0.50
PROSPERIDAD II Total (MF) 92.61 93.14 1.04 1.05 2.88 2.64 0.66 0.59 Male (M) 91.02 91.10 3.46 3.29 Female (F) 94.27 95.30 2.27 1.96
SIBAGAT Total (MF) 92.23 93.77 1.04 1.04 3.20 2.74 0.65 0.49 Male (M) 90.41 92.02 3.86 3.64 Female (F) 94.16 95.62 2.50 1.80
Afga ES Total (MF) 93.15 94.48 1.06 1.01 3.02 2.55 1.19 0.74 Male (M) 90.51 94.17 2.77 2.92 Female (F) 95.88 94.81 3.29 2.16
Source of data: BEIS – DepEd Agusan del Sur and Dumaguete City divisions
The drop-out rate in the country decreased from 1.37 percent in 2003 to 1.26 percent in
2006. Drop-out rates also decreased in Central Visayas and Caraga region. However,
drop-out rates in Central Visayas remain higher than the national average, although not
for Dumaguete City. On the other hand, drop-out rates in Caraga has become lower than
the average for the country, but not Agusan del Sur.
Promotion and drop-out rates in high school are shown in Table 16. Promotion rate in
high school for the country increased from 86 percent in 2003 to 89 percent in 2006.
Promotion rate in Central Visayas has been lower and improved much slower than that of
the country as a whole. In Dumaguete, however, there is a marked improvement in
promotion rate from 79 percent in 2003 to 90 percent in 2006. Although promotion rate
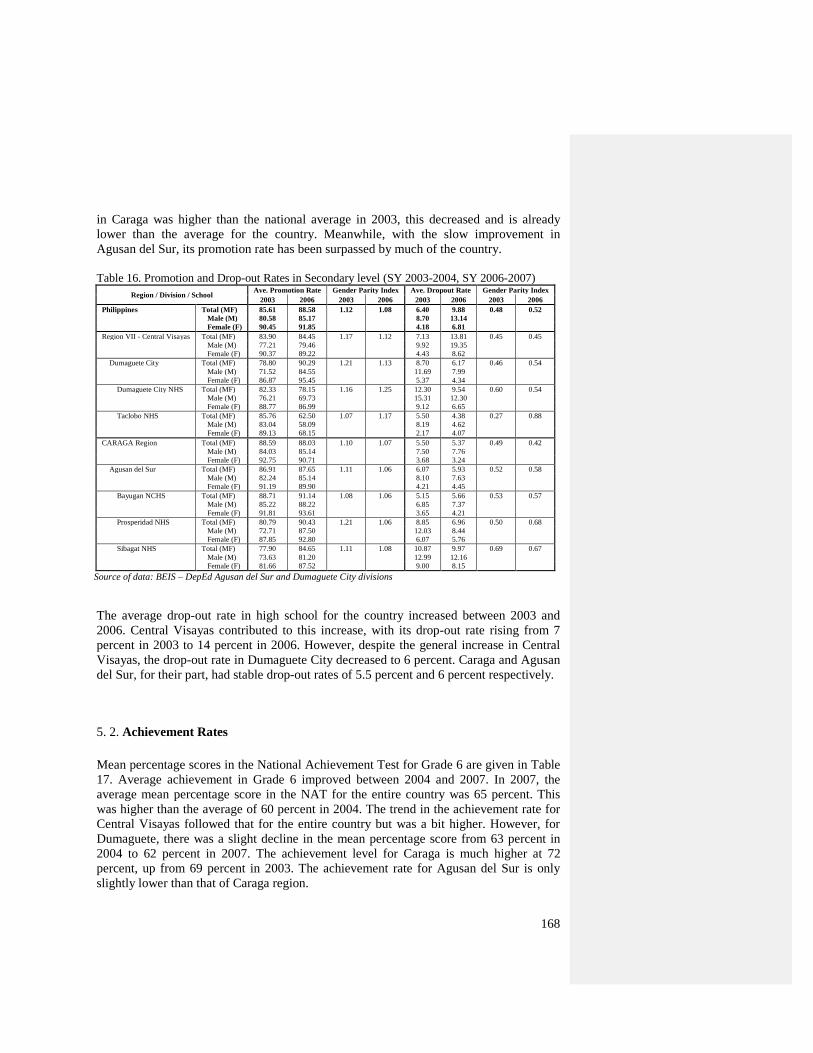
168
in Caraga was higher than the national average in 2003, this decreased and is already
lower than the average for the country. Meanwhile, with the slow improvement in
Agusan del Sur, its promotion rate has been surpassed by much of the country.
Table 16. Promotion and Drop-out Rates in Secondary level (SY 2003-2004, SY 2006-2007)
Region / Division / School Ave. Promotion Rate Gender Parity Index Ave. Dropout Rate Gender Parity Index
2003 2006 2003 2006 2003 2006 2003 2006
Philippines Total (MF) 85.61 88.58 1.12 1.08 6.40 9.88 0.48 0.52
Male (M) 80.58 85.17 8.70 13.14
Female (F) 90.45 91.85 4.18 6.81
Region VII - Central Visayas Total (MF) 83.90 84.45 1.17 1.12 7.13 13.81 0.45 0.45
Male (M) 77.21 79.46 9.92 19.35
Female (F) 90.37 89.22 4.43 8.62
Dumaguete City Total (MF) 78.80 90.29 1.21 1.13 8.70 6.17 0.46 0.54
Male (M) 71.52 84.55 11.69 7.99
Female (F) 86.87 95.45 5.37 4.34
Dumaguete City NHS Total (MF) 82.33 78.15 1.16 1.25 12.30 9.54 0.60 0.54
Male (M) 76.21 69.73 15.31 12.30
Female (F) 88.77 86.99 9.12 6.65
Taclobo NHS Total (MF) 85.76 62.50 1.07 1.17 5.50 4.38 0.27 0.88
Male (M) 83.04 58.09 8.19 4.62
Female (F) 89.13 68.15 2.17 4.07
CARAGA Region Total (MF) 88.59 88.03 1.10 1.07 5.50 5.37 0.49 0.42
Male (M) 84.03 85.14 7.50 7.76
Female (F) 92.75 90.71 3.68 3.24
Agusan del Sur Total (MF) 86.91 87.65 1.11 1.06 6.07 5.93 0.52 0.58
Male (M) 82.24 85.14 8.10 7.63
Female (F) 91.19 89.90 4.21 4.45
Bayugan NCHS Total (MF) 88.71 91.14 1.08 1.06 5.15 5.66 0.53 0.57
Male (M) 85.22 88.22 6.85 7.37
Female (F) 91.81 93.61 3.65 4.21
Prosperidad NHS Total (MF) 80.79 90.43 1.21 1.06 8.85 6.96 0.50 0.68
Male (M) 72.71 87.50 12.03 8.44
Female (F) 87.85 92.80 6.07 5.76
Sibagat NHS Total (MF) 77.90 84.65 1.11 1.08 10.87 9.97 0.69 0.67
Male (M) 73.63 81.20 12.99 12.16
Female (F) 81.66 87.52 9.00 8.15
Source of data: BEIS – DepEd Agusan del Sur and Dumaguete City divisions
The average drop-out rate in high school for the country increased between 2003 and
2006. Central Visayas contributed to this increase, with its drop-out rate rising from 7
percent in 2003 to 14 percent in 2006. However, despite the general increase in Central
Visayas, the drop-out rate in Dumaguete City decreased to 6 percent. Caraga and Agusan
del Sur, for their part, had stable drop-out rates of 5.5 percent and 6 percent respectively.
5. 2. Achievement Rates
Mean percentage scores in the National Achievement Test for Grade 6 are given in Table
17. Average achievement in Grade 6 improved between 2004 and 2007. In 2007, the
average mean percentage score in the NAT for the entire country was 65 percent. This
was higher than the average of 60 percent in 2004. The trend in the achievement rate for
Central Visayas followed that for the entire country but was a bit higher. However, for
Dumaguete, there was a slight decline in the mean percentage score from 63 percent in
2004 to 62 percent in 2007. The achievement level for Caraga is much higher at 72
percent, up from 69 percent in 2003. The achievement rate for Agusan del Sur is only
slightly lower than that of Caraga region.
169
The mean percentage scores in the National Achievement Test for Second Year are given
in Table 18. Achievement levels in high school improved for the country as a whole in
2007 compared to the previous year with the mean percentage score increasing from 47
percent to 49 percent. From almost the same footing in 2006, Central Visayas‘
achievement rate improved much higher reaching 53 percent in 2007. Dumaguete also
improved a bit higher than the national average but lower than the regional average.
Caraga region‘s mean percentage score was much higher than that of the country and of
Central Visayas at 63 percent. However, there was no improvement from the previous
year. There was even a 1-percent decline in the achievement rate for Agusan del Sur to
62 percent. The decline in achievement rate is shared by some schools like Bayugan
National Comprehensive School and Sibagat National High School.
Educational achievement / learning outcomes depend on the adequacy and quality of
educational inputs. As the allocation of much of these inputs is dependent on the
divisions, particularly classrooms, desks/armchairs, teachers and training, improvements
in learning outcomes very much depend on how well division offices allocate these
inputs. The adequacy and quality of instructional materials depends primarily on the
provision by the central office although divisions and schools can also influence this with
their participation in the textbook exchange program. The influence of school on
educational achievement relies primarily on their ability to maximize their MOOE.
Other indicators for Agusan del Sur, Negros Oriental and all CPC-6 (Sixth Country
Programme for Children) areas are given in Table 19. CPC-6 is supported by UNICEF to
improve the access and quality of Early Childhood Education and Basic Education in 24
disadvantaged provinces.
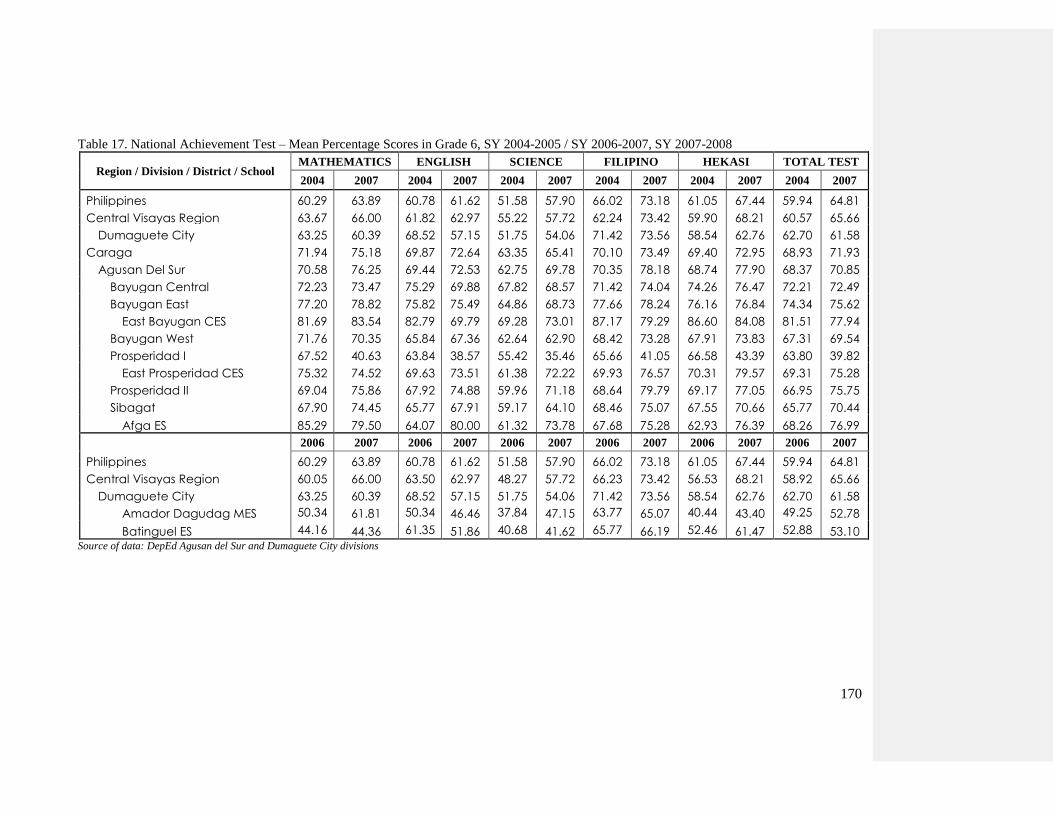
170
Table 17. National Achievement Test – Mean Percentage Scores in Grade 6, SY 2004-2005 / SY 2006-2007, SY 2007-2008
Region / Division / District / School MATHEMATICS ENGLISH SCIENCE FILIPINO HEKASI TOTAL TEST
2004 2007 2004 2007 2004 2007 2004 2007 2004 2007 2004 2007
Philippines 60.29 63.89 60.78 61.62 51.58 57.90 66.02 73.18 61.05 67.44 59.94 64.81
Central Visayas Region 63.67 66.00 61.82 62.97 55.22 57.72 62.24 73.42 59.90 68.21 60.57 65.66
Dumaguete City 63.25 60.39 68.52 57.15 51.75 54.06 71.42 73.56 58.54 62.76 62.70 61.58
Caraga 71.94 75.18 69.87 72.64 63.35 65.41 70.10 73.49 69.40 72.95 68.93 71.93
Agusan Del Sur 70.58 76.25 69.44 72.53 62.75 69.78 70.35 78.18 68.74 77.90 68.37 70.85
Bayugan Central 72.23 73.47 75.29 69.88 67.82 68.57 71.42 74.04 74.26 76.47 72.21 72.49
Bayugan East 77.20 78.82 75.82 75.49 64.86 68.73 77.66 78.24 76.16 76.84 74.34 75.62
East Bayugan CES 81.69 83.54 82.79 69.79 69.28 73.01 87.17 79.29 86.60 84.08 81.51 77.94
Bayugan West 71.76 70.35 65.84 67.36 62.64 62.90 68.42 73.28 67.91 73.83 67.31 69.54
Prosperidad I 67.52 40.63 63.84 38.57 55.42 35.46 65.66 41.05 66.58 43.39 63.80 39.82
East Prosperidad CES 75.32 74.52 69.63 73.51 61.38 72.22 69.93 76.57 70.31 79.57 69.31 75.28
Prosperidad II 69.04 75.86 67.92 74.88 59.96 71.18 68.64 79.79 69.17 77.05 66.95 75.75
Sibagat 67.90 74.45 65.77 67.91 59.17 64.10 68.46 75.07 67.55 70.66 65.77 70.44
Afga ES 85.29 79.50 64.07 80.00 61.32 73.78 67.68 75.28 62.93 76.39 68.26 76.99
2006 2007 2006 2007 2006 2007 2006 2007 2006 2007 2006 2007
Philippines 60.29 63.89 60.78 61.62 51.58 57.90 66.02 73.18 61.05 67.44 59.94 64.81
Central Visayas Region 60.05 66.00 63.50 62.97 48.27 57.72 66.23 73.42 56.53 68.21 58.92 65.66
Dumaguete City 63.25 60.39 68.52 57.15 51.75 54.06 71.42 73.56 58.54 62.76 62.70 61.58
Amador Dagudag MES 50.34 61.81 50.34 46.46 37.84 47.15 63.77 65.07 40.44 43.40 49.25 52.78
Batinguel ES 44.16 44.36 61.35 51.86 40.68 41.62 65.77 66.19 52.46 61.47 52.88 53.10 Source of data: DepEd Agusan del Sur and Dumaguete City divisions
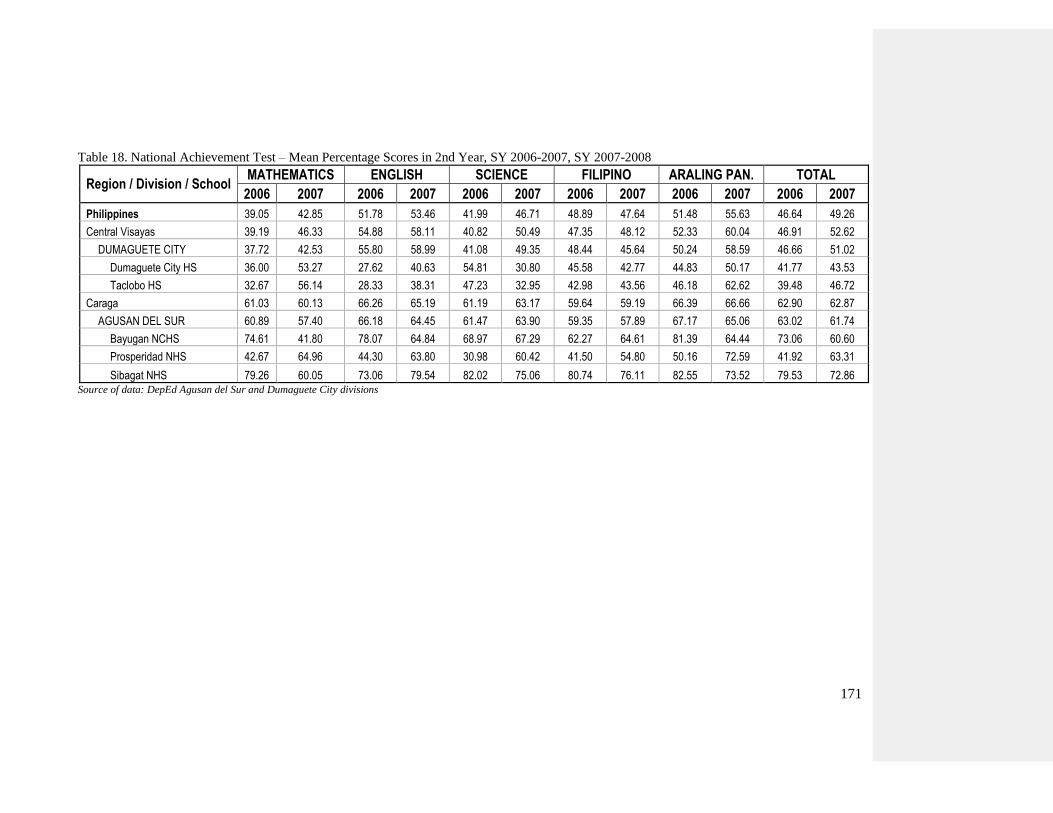
171
Table 18. National Achievement Test – Mean Percentage Scores in 2nd Year, SY 2006-2007, SY 2007-2008
Region / Division / School MATHEMATICS ENGLISH SCIENCE FILIPINO ARALING PAN. TOTAL
2006 2007 2006 2007 2006 2007 2006 2007 2006 2007 2006 2007
Philippines 39.05 42.85 51.78 53.46 41.99 46.71 48.89 47.64 51.48 55.63 46.64 49.26
Central Visayas 39.19 46.33 54.88 58.11 40.82 50.49 47.35 48.12 52.33 60.04 46.91 52.62
DUMAGUETE CITY 37.72 42.53 55.80 58.99 41.08 49.35 48.44 45.64 50.24 58.59 46.66 51.02
Dumaguete City HS 36.00 53.27 27.62 40.63 54.81 30.80 45.58 42.77 44.83 50.17 41.77 43.53
Taclobo HS 32.67 56.14 28.33 38.31 47.23 32.95 42.98 43.56 46.18 62.62 39.48 46.72
Caraga 61.03 60.13 66.26 65.19 61.19 63.17 59.64 59.19 66.39 66.66 62.90 62.87
AGUSAN DEL SUR 60.89 57.40 66.18 64.45 61.47 63.90 59.35 57.89 67.17 65.06 63.02 61.74
Bayugan NCHS 74.61 41.80 78.07 64.84 68.97 67.29 62.27 64.61 81.39 64.44 73.06 60.60
Prosperidad NHS 42.67 64.96 44.30 63.80 30.98 60.42 41.50 54.80 50.16 72.59 41.92 63.31
Sibagat NHS 79.26 60.05 73.06 79.54 82.02 75.06 80.74 76.11 82.55 73.52 79.53 72.86 Source of data: DepEd Agusan del Sur and Dumaguete City divisions
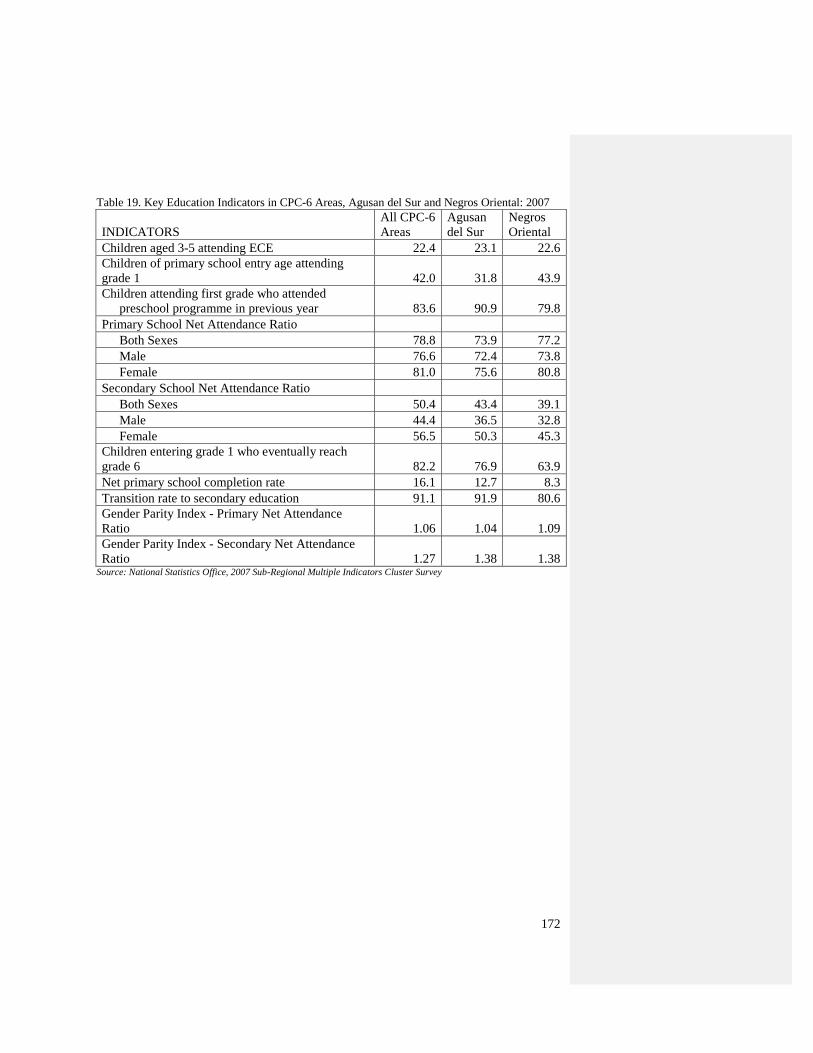
172
Table 19. Key Education Indicators in CPC-6 Areas, Agusan del Sur and Negros Oriental: 2007
INDICATORS
All CPC-6
Areas
Agusan
del Sur
Negros
Oriental
Children aged 3-5 attending ECE 22.4 23.1 22.6
Children of primary school entry age attending
grade 1 42.0 31.8 43.9
Children attending first grade who attended
preschool programme in previous year 83.6 90.9 79.8
Primary School Net Attendance Ratio
Both Sexes 78.8 73.9 77.2
Male 76.6 72.4 73.8
Female 81.0 75.6 80.8
Secondary School Net Attendance Ratio
Both Sexes 50.4 43.4 39.1
Male 44.4 36.5 32.8
Female 56.5 50.3 45.3
Children entering grade 1 who eventually reach
grade 6 82.2 76.9 63.9
Net primary school completion rate 16.1 12.7 8.3
Transition rate to secondary education 91.1 91.9 80.6
Gender Parity Index - Primary Net Attendance
Ratio 1.06 1.04 1.09
Gender Parity Index - Secondary Net Attendance
Ratio 1.27 1.38 1.38 Source: National Statistics Office, 2007 Sub-Regional Multiple Indicators Cluster Survey
173
6. Equity
Disparities in education outcomes can be observed in terms of individual, household and
community factors. Common indicators for these factors include age and sex for
individual factors, income for household factors and location for community factors.
Gender equality in education outcomes is one of the MDGs. Contrary to what is
commonly observed in other countries, e.g. South Asia, the educational performance of
girls surpasses that for boys in the Philippines. Enrolment ratios (both for gross and net),
particularly for the secondary level, cohort survival rates, graduation rates, transition rates
are higher rate for females compared to males. On the other hand, dropout rates are lower
for girls compared to those for boys. As for age, the 2006 LFS data reveals an inverted-U
curve relating attendance to age. School attendance rises from age 6 to about 10 or 11
then starts to decline. Male attendance rates are below those of females. Boys also leave
school earlier than the girls widening the disparity in attendance rates. Across ages,
attendance rates are higher in urban areas than rural areas. Attendance rates also increase
with income and the disparity across income levels is greater in secondary compared to
primary and among males compared to females.
Location also provides an important dimension of disparity. Location dimension is
usually discussed in terms geographic groupings such as administrative regions, rural –
urban location, ethnicity and language. What follows is a series of data and figures
depicting the disparities in various education indicators across administrative regions,
rural-urban location, and ethnicity as the data allows.
The latest data reveal that Davao region has the lowest net enrolment rate in elementary,
having decreased since 2005. Less than 7 out of 10 children aged 6-11 years old are
enrolled in grade school. This contrasts to ARMM where almost 92 percent of children
are enrolled, up from 87 percent in 2005. Western Visayas and CAR have the second and
third lowest net enrolment rates, at about 70 percent and 71 percent respectively. Most
other regions have net enrolment rates of between 70 and 80 percent. Apart from
ARMM, only Bicol has an enrolment rates above 80 percent.
Gender disparity in elementary enrolment decreased in all regions except ARMM where
it is also the highest. Participation among females in ARMM is 10 percent more than
among males. This is followed by Eastern Visayas and SOCCSKSARGEN where over 4
percent more females than males are enrolled. Gender parity is highest in Ilocos and
CARAGA where participation rates between males and females are roughly the same. It
even improved in favor of males. Gender parity is also high in Central Luzon and
Cagayan; female participation is only 1 percent more than that among males.
As of 2005, net elementary enrolment in urban areas is on average 10 percent higher than
in rural areas. The advantage of urban areas is most evident in Mindanao where
enrolment in urban areas in all regions is 12 to 18 percent more than in rural areas, except
in Caraga. In Luzon, enrolment in urban areas for most regions is only 2 to 10 percent
174
higher than in rural areas. However, the urban lead is 20 percent in Cordillera. For the
Visayas, enrolment rates in Western and Eastern Visayas are similar between urban and
rural areas. In Central Visayas, however, enrolment in urban areas is 13 percent more
than in rural areas.
Secondary participation remains lowest in ARMM, further decreasing from 36 percent in
2005 to 29 percent in 2007. Although net enrolment decreased in NCR, it is still the
highest at 55 percent. Whereas most regions had enrolment rates above 50 percent in
2005, most now have rates below this. Apart from NCR, only Ilocos, CALABARZON
and Central Luzon have enrolment rates above 50 percent.
On average, gender parity in secondary participation has not changed between 2005 and
2007. Net enrolment among females is still 18 percent higher than among males. Gender
disparity remains highest in Eastern Visayas and Cordillera, with female participation
higher than male participation by 30 percent and 27 percent, respectively. Gender
disparity in ARMM, Central Visayas and SOCCSKSARGEN also remains among the
highest and have risen further. On the other hand, disparity has decreased in Bicol,
Western Visayas, CARAGA and Cagayan Valley. Gender disparity remains lowest in
NCR, Ilocos, Central Luzon and Calabarzon.
The disparity between urban and rural areas is higher in secondary participation than in
elementary participation. On average, secondary enrolment in urban areas is 25 percent
higher than in rural areas. The disparity is highest in Mindanao where high school
participation in cities is 45 to 55 percent more than in towns for two-thirds of the regions,
namely ARMM, Zamboanga, Davao and SOCCSKSARGEN. In Luzon, the urban areas
better rural areas by 53 percent in the Cordillera and by 46 percent in Bicol. The
disparity is lower in the Visayas; the highest being that of Central Visayas, at 26 percent.
The inequity between urban and rural areas is lowest in Caraga (3%), Central Luzon (4%)
and Western Visayas (6%) with rural areas in the latter two even having higher enrolment
rates than urban areas.
7. Key Issues and Challenges
There are several barriers towards full and better utilization of MOOE allocated to
schools. The inadequacy of MOOE compels schools to collect fees despite the
prohibitions, often directly or through the PTCA. While secondary schools with financial
staff enjoy fiscal autonomy, elementary and secondary schools without financial staff
remain financially dependent on the division offices. This dependence tends to hamper
fund utilization and reduce the influence of schools over the kind and quality of
purchases. Moreover, the utilization of MOOE by dependent schools is often slow owing
to the requirement of monthly liquidation of cash advances.
Institutions, processes and instruments introduced from different perspectives have
resulted in overlapping roles. The LGC created the Local School Boards (LSB) at the
province, city and municipal levels which are geographic-centric. The BESRA created
175
school-centric institutions such as the School Governing Council (SGC) and the School
Improvement Plans (SIP). Another school-centric institution is the PTCA. As a
consequence, the assignment of roles, accountabilities and expenditure items is not clear.
Also, delineation of roles between the city/municipality LSBs and the provincial LSBs is
not clear. The roles of the different stakeholders – the PCTA, the school officials, LGU
officials and NGOs - vary from school to school and from one LGU to the next,
suggesting that the existing definitions may not be clear enough.
While the department has gone to great lengths in implementing the constitutional
guarantee of free basic education, the compulsory feature of elementary education has
largely been overlooked. Schools focus on keeping enrolled students in school while
missing to bring all eligible students to school. Meanwhile, although high school
education is free, it is not compulsory. Children / youth aged 12 to 15, whether having
taken elementary education or not, are not compelled to go to school and, especially the
poor, are more compelled to work, notwithstanding the prescribed working age. Thus,
measures to curb child labor are corollary to ensuring school participation as non-
participation in school is primarily attributed to poverty and hunger.
Policy prescribes budgeting from the district level up to the regional level. The education
department‘s budget strategy advises budgeting based on situational analysis and school
improvement plans. However, there is no evidence that varying school needs are
considered in the department budgeting. For one, school MOOE per capita is largely the
same across schools. Secondly, district offices rely practically entirely on the local
government special education fund. Thus, schools in poorer areas with lower real
property taxes suffer from less district supervision and assistance. Thirdly, voluntary
collection by PTCAs is also dependent on the spending capacity of households.
The education department‘s budget strategy provides a promising direction towards
performance-based and accountability-focused budgeting. However, although there are
clear organizational performance indicators, it is unclear whether there are guidelines on
setting targets and accountabilities at the regional, division, district and school levels. A
lot of resources are under the control of the Division Superintendent (an appointee of the
President) who is apparently not directly responsible for specific education outcomes. It
is not even clear how disciplinary actions for Division Superintendents are administered
and for which failures. Under RA 9155, the selection and promotion of division
superintendents and assistant superintendents are under the Secretary through a selection
and promotions board. However, it does not explicitly include disciplinary authority.
Only the Secretary of DepEd is clearly accountable for all education outcomes. Finally,
SBM accountabilities and corresponding disciplinary actions for school principals are
still unclear.
Notwithstanding the improvements in the empowerment of schools, there are indications
of side movements and even reversals. Firstly, although the SBM Grant has effectively
augmented the MOOE of schools, particularly dependent schools, it was utilized simply
as regular MOOE, contrary to the intent of establishing / strengthening school-based
management structure. Secondly, the influence given to school heads not long ago in the
evaluation of applicant-teachers was recently assigned back to the division. This
represents a regression in school empowerment.
Comment [m11]: The SIP is a tool for planning rather than an entity
Comment [m12]: There are areas which implement the intent of RA 9155 and here, the principals have opportunity to review (but not interview) the credentials of teacher applicants for endorsement to the Division Office. In other areas, there is no such observance of the law. So it is not consistent.
176
The prioritization of school buildings is too dependent on the division office and prone to
the political interference of congressmen, governors and mayors. The Department of
Education has very limited role in the bidding for the DPWH-led construction of
classrooms, only as observer. Moreover, there were failures in coordination between the
DPWH and DepEd personnel likely due to the nominal role of DepEd in the program. As
for school furniture, there are overlaps between the central, regional, and division offices
in the provision of school furniture.
Notwithstanding the greater role of local governments in financing local education needs,
there are indications that spending per capita is declining (Manasan, 2009). For instance,
given the huge and growing demand for teachers and the limited resources of some local
governments, some LGUs are increasingly unable to pay teachers‘ salaries as much as
those paid by the national government. So, instead of hiring teachers, local governments
are increasingly supporting Para-teachers / volunteers who are given lower wages and no
benefits.
PTCAs play a very important role in mobilizing resources for school administration and
improvement. However, their capacity to manage their finances and administer their
programs seems to be largely overlooked. This is evident in the absence / poor quality of
financial reports of many PTCAs which are critical in a voluntary contribution scheme.
Comment [m13]: The Division Office is supposed to be guided by the BEIS which has color –coding which help identify schools in need ot resources – teachers, classrooms, classroom seats. The DepED needs to invoke this more strongly during budget deliberations with members of Congress.
177
CHAPTER 7
Sector Analysis: Maternal and Child Health
1. Major Programs, Activities, and Projects (PAPs)
When the Philippine government signed to achieving the MDGs by 2015, it committed to
reducing child mortality and improving maternal health. To achieve this goal, the
Medium Term Philippine Development Plan 2005-2010 was designed to attain the
MDGs, along with the goal of addressing poverty. Health goals that are reflected in the
MTPDP include the expansion of the health insurance coverage and benefits especially
for indigents, strengthening of national and local health systems, improving health care
management system, and improving health and productivity through research and
development, among others.
With the passage of 1991 LGC, provinces, cities, and municipalities have been placed in
the frontline of delivery of health care services. Provinces are tasked to provide hospital
services through devolved provincial and district hospitals while cities and municipalities
are primarily tasked to provide public health programs through health centers and
barangay health stations.
In Agusan del Sur, the provincial government became responsible for overseeing the
health system in the entire province through the Provincial Health Office (PHO) and 5
public hospitals. The city and municipal governments manage the City and Municipal
Health Offices (CHO and MHO) respectively. The City Health Office is the main Health
Center (HC) in Bayugan City while the Rural Health Units (RHUs) in Prosperidad and
Sibagat are in-charge of providing public health in their respective municipalities. At the
barangay level, Barangay Health Stations (BHS) are the first level of care that a
community can access. Similarly, the Integrated Public Health Office in Negros Oriental
plans primary health care provision in the whole province. It also manages 7 hospitals,
one of which is located in Dumaguete City. Aside from supervising health services
provision in Dumaguete City, the City Health Office also serves as the de facto BHS of
barangays located in the Poblacion area.
After devolution, the main responsibility of the Department of Health (DOH) is to
provide national policy direction and develop national plans, technical standards, and
guidelines on health (DOH, 2005). DOH supports provinces with logistic support and
technical assistance for national programs through the Center for Health Development
(CHD). Administrative orders (AOs) are crafted to provide guidelines on implementation
of public health programs by the LGUs.
178
These AOs are echoed in various programs of the DOH which aim to protect the welfare
of mothers and children. The Maternal Health Program ensures that essential health
services are available at health facilities. Delivery itself should be conducted in health
facilities or birthing centers with a skilled professional birth attendant. Child Health
Programs are more diverse. The national programs that aim to protect newborns, infants,
and children are composed of: infant and young child feeding, newborn screening,
expanded program on immunization, integrated management of childhood illnesses,
micronutrient supplementation, dental health, early child development, and child health
injuries.
To assist the LGUs and to follow through the implementation of the programs, the CHD
has a team of DOH representatives stationed in each province called the Provincial
Health Team (DOH-PHT). PhilHealth assists provinces in the implementation of the
National Health Insurance Program through its PhilHealth Regional Offices. The national
government retained the responsibility for tertiary-level and specialty hospitals.
In consonance to the national program of the DOH on Maternal and Child Care, local
governments implement the Maternal, Neonatal Safe Motherhood and Women‘s Health
Program (SMWHP), Expanded Program on Immunization (EPI), Integrated Management
of Childhood Illnesses (IMCI), and Family Planning (FP). These programs are clearly
specified in the Functional Objectives at the Local Budget Preparation Form that the
PHO/CHO/MHO prepare every budget year.
2. Sector Performance on Maternal and Child Care
2.1 Outcome Indicators
2.1.1 Maternal Mortality Rate. Maternal mortality, a measure of death of women
during pregnancy, childbirth or after childbirth, is a reflection of how well-managed a
country‘s health system is. Since maternal deaths can be averted when certain protocols
are followed, a high maternal mortality rate reflects problems in implementing those
protocols within the system. National estimate from the Family Planning Survey in 2006
shows that 162 out of 100,000 women die due to pregnancy or childbirth.
Figures from the LSD areas (Figure 7.1) show that maternal mortality rates in Agusan
del Sur and Dumaguete City are significantly lower than the national average. From 139
in 2004, Agusan del Sur was able to reduce its MMR to 89 in 2007. The PHO attributes
this decrease to continuous effort exerted by health staff at the barangay, municipal, and
provincial levels in educating the mothers of the risks during pregnancy and advocacy
that childbirth should be handled by a skilled medical professional (PHO, 2008). They
also note that their existing policy of making sure that a skilled medical professional
supervises childbirth when it is conducted by a trained hilot helps in decreasing maternal
mortality rate.
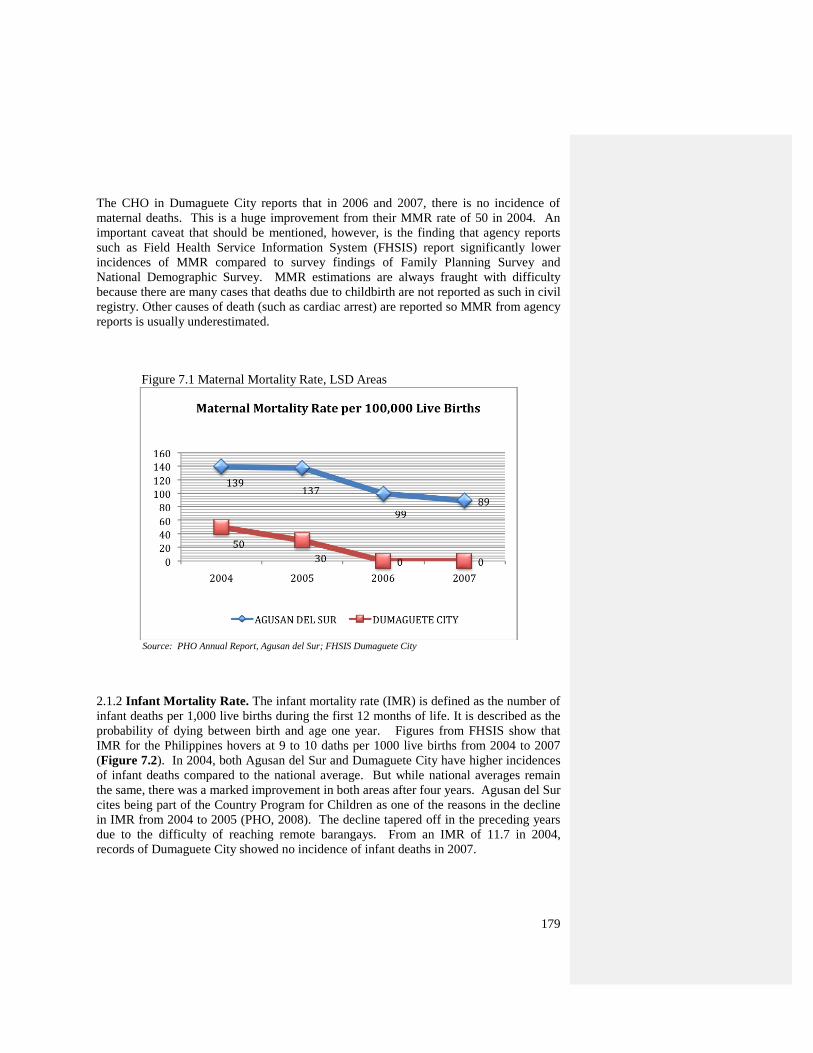
179
The CHO in Dumaguete City reports that in 2006 and 2007, there is no incidence of
maternal deaths. This is a huge improvement from their MMR rate of 50 in 2004. An
important caveat that should be mentioned, however, is the finding that agency reports
such as Field Health Service Information System (FHSIS) report significantly lower
incidences of MMR compared to survey findings of Family Planning Survey and
National Demographic Survey. MMR estimations are always fraught with difficulty
because there are many cases that deaths due to childbirth are not reported as such in civil
registry. Other causes of death (such as cardiac arrest) are reported so MMR from agency
reports is usually underestimated.
Figure 7.1 Maternal Mortality Rate, LSD Areas
Source: PHO Annual Report, Agusan del Sur; FHSIS Dumaguete City
2.1.2 Infant Mortality Rate. The infant mortality rate (IMR) is defined as the number of
infant deaths per 1,000 live births during the first 12 months of life. It is described as the
probability of dying between birth and age one year. Figures from FHSIS show that
IMR for the Philippines hovers at 9 to 10 daths per 1000 live births from 2004 to 2007
(Figure 7.2). In 2004, both Agusan del Sur and Dumaguete City have higher incidences
of infant deaths compared to the national average. But while national averages remain
the same, there was a marked improvement in both areas after four years. Agusan del Sur
cites being part of the Country Program for Children as one of the reasons in the decline
in IMR from 2004 to 2005 (PHO, 2008). The decline tapered off in the preceding years
due to the difficulty of reaching remote barangays. From an IMR of 11.7 in 2004,
records of Dumaguete City showed no incidence of infant deaths in 2007.
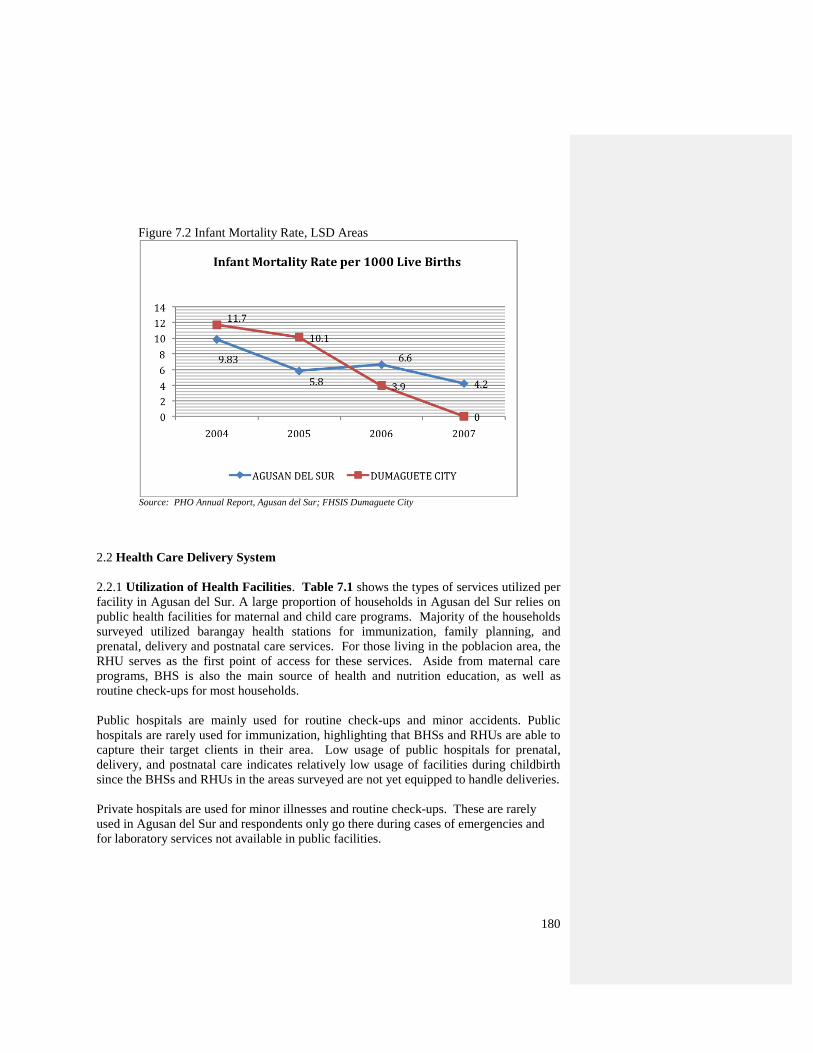
180
Figure 7.2 Infant Mortality Rate, LSD Areas
Source: PHO Annual Report, Agusan del Sur; FHSIS Dumaguete City
2.2 Health Care Delivery System
2.2.1 Utilization of Health Facilities. Table 7.1 shows the types of services utilized per
facility in Agusan del Sur. A large proportion of households in Agusan del Sur relies on
public health facilities for maternal and child care programs. Majority of the households
surveyed utilized barangay health stations for immunization, family planning, and
prenatal, delivery and postnatal care services. For those living in the poblacion area, the
RHU serves as the first point of access for these services. Aside from maternal care
programs, BHS is also the main source of health and nutrition education, as well as
routine check-ups for most households.
Public hospitals are mainly used for routine check-ups and minor accidents. Public
hospitals are rarely used for immunization, highlighting that BHSs and RHUs are able to
capture their target clients in their area. Low usage of public hospitals for prenatal,
delivery, and postnatal care indicates relatively low usage of facilities during childbirth
since the BHSs and RHUs in the areas surveyed are not yet equipped to handle deliveries.
Private hospitals are used for minor illnesses and routine check-ups. These are rarely
used in Agusan del Sur and respondents only go there during cases of emergencies and
for laboratory services not available in public facilities.
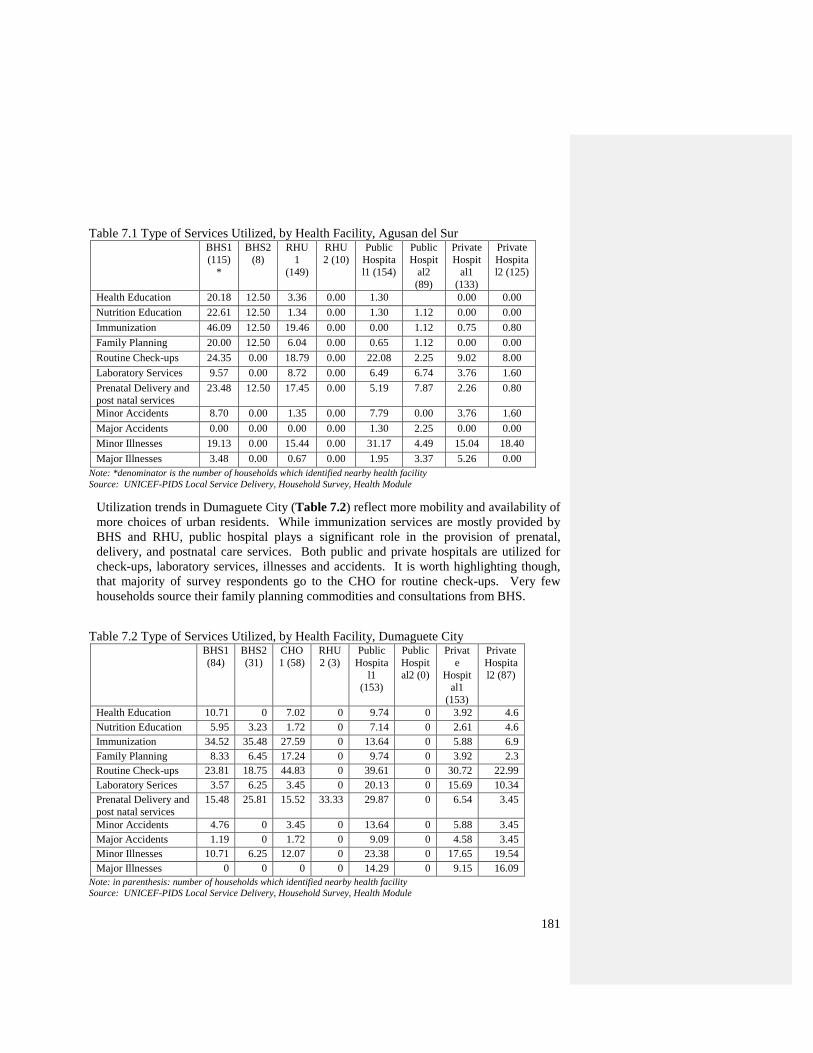
181
Table 7.1 Type of Services Utilized, by Health Facility, Agusan del Sur BHS1
(115)
*
BHS2
(8)
RHU
1
(149)
RHU
2 (10)
Public
Hospita
l1 (154)
Public
Hospit
al2
(89)
Private
Hospit
al1
(133)
Private
Hospita
l2 (125)
Health Education 20.18 12.50 3.36 0.00 1.30 0.00 0.00
Nutrition Education 22.61 12.50 1.34 0.00 1.30 1.12 0.00 0.00
Immunization 46.09 12.50 19.46 0.00 0.00 1.12 0.75 0.80
Family Planning 20.00 12.50 6.04 0.00 0.65 1.12 0.00 0.00
Routine Check-ups 24.35 0.00 18.79 0.00 22.08 2.25 9.02 8.00
Laboratory Services 9.57 0.00 8.72 0.00 6.49 6.74 3.76 1.60
Prenatal Delivery and
post natal services
23.48 12.50 17.45 0.00 5.19 7.87 2.26 0.80
Minor Accidents 8.70 0.00 1.35 0.00 7.79 0.00 3.76 1.60
Major Accidents 0.00 0.00 0.00 0.00 1.30 2.25 0.00 0.00
Minor Illnesses 19.13 0.00 15.44 0.00 31.17 4.49 15.04 18.40
Major Illnesses 3.48 0.00 0.67 0.00 1.95 3.37 5.26 0.00
Note: *denominator is the number of households which identified nearby health facility
Source: UNICEF-PIDS Local Service Delivery, Household Survey, Health Module
Utilization trends in Dumaguete City (Table 7.2) reflect more mobility and availability of
more choices of urban residents. While immunization services are mostly provided by
BHS and RHU, public hospital plays a significant role in the provision of prenatal,
delivery, and postnatal care services. Both public and private hospitals are utilized for
check-ups, laboratory services, illnesses and accidents. It is worth highlighting though,
that majority of survey respondents go to the CHO for routine check-ups. Very few
households source their family planning commodities and consultations from BHS.
Table 7.2 Type of Services Utilized, by Health Facility, Dumaguete City BHS1
(84)
BHS2
(31)
CHO
1 (58)
RHU
2 (3)
Public
Hospita
l1
(153)
Public
Hospit
al2 (0)
Privat
e
Hospit
al1
(153)
Private
Hospita
l2 (87)
Health Education 10.71 0 7.02 0 9.74 0 3.92 4.6
Nutrition Education 5.95 3.23 1.72 0 7.14 0 2.61 4.6
Immunization 34.52 35.48 27.59 0 13.64 0 5.88 6.9
Family Planning 8.33 6.45 17.24 0 9.74 0 3.92 2.3
Routine Check-ups 23.81 18.75 44.83 0 39.61 0 30.72 22.99
Laboratory Serices 3.57 6.25 3.45 0 20.13 0 15.69 10.34
Prenatal Delivery and
post natal services
15.48 25.81 15.52 33.33 29.87 0 6.54 3.45
Minor Accidents 4.76 0 3.45 0 13.64 0 5.88 3.45
Major Accidents 1.19 0 1.72 0 9.09 0 4.58 3.45
Minor Illnesses 10.71 6.25 12.07 0 23.38 0 17.65 19.54
Major Illnesses 0 0 0 0 14.29 0 9.15 16.09
Note: in parenthesis: number of households which identified nearby health facility
Source: UNICEF-PIDS Local Service Delivery, Household Survey, Health Module
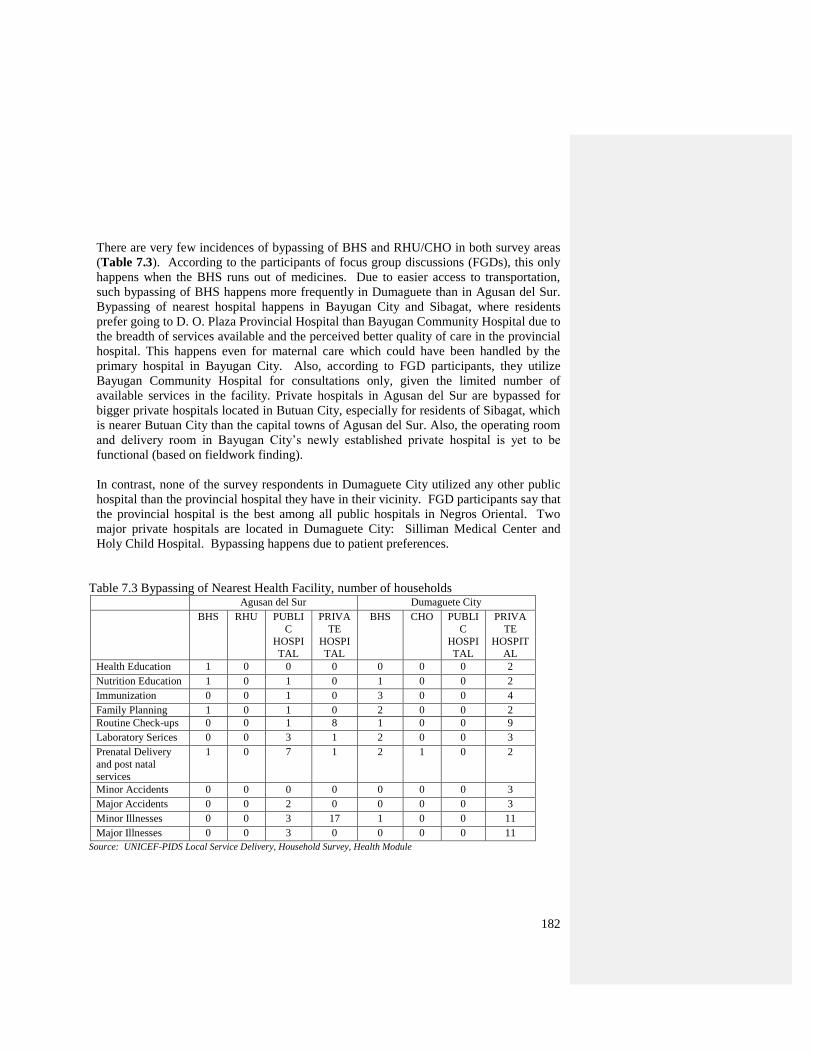
182
There are very few incidences of bypassing of BHS and RHU/CHO in both survey areas
(Table 7.3). According to the participants of focus group discussions (FGDs), this only
happens when the BHS runs out of medicines. Due to easier access to transportation,
such bypassing of BHS happens more frequently in Dumaguete than in Agusan del Sur.
Bypassing of nearest hospital happens in Bayugan City and Sibagat, where residents
prefer going to D. O. Plaza Provincial Hospital than Bayugan Community Hospital due to
the breadth of services available and the perceived better quality of care in the provincial
hospital. This happens even for maternal care which could have been handled by the
primary hospital in Bayugan City. Also, according to FGD participants, they utilize
Bayugan Community Hospital for consultations only, given the limited number of
available services in the facility. Private hospitals in Agusan del Sur are bypassed for
bigger private hospitals located in Butuan City, especially for residents of Sibagat, which
is nearer Butuan City than the capital towns of Agusan del Sur. Also, the operating room
and delivery room in Bayugan City‘s newly established private hospital is yet to be
functional (based on fieldwork finding).
In contrast, none of the survey respondents in Dumaguete City utilized any other public
hospital than the provincial hospital they have in their vicinity. FGD participants say that
the provincial hospital is the best among all public hospitals in Negros Oriental. Two
major private hospitals are located in Dumaguete City: Silliman Medical Center and
Holy Child Hospital. Bypassing happens due to patient preferences.
Table 7.3 Bypassing of Nearest Health Facility, number of households Agusan del Sur Dumaguete City
BHS RHU PUBLI
C
HOSPI
TAL
PRIVA
TE
HOSPI
TAL
BHS CHO PUBLI
C
HOSPI
TAL
PRIVA
TE
HOSPIT
AL
Health Education 1 0 0 0 0 0 0 2
Nutrition Education 1 0 1 0 1 0 0 2
Immunization 0 0 1 0 3 0 0 4
Family Planning 1 0 1 0 2 0 0 2
Routine Check-ups 0 0 1 8 1 0 0 9
Laboratory Serices 0 0 3 1 2 0 0 3
Prenatal Delivery
and post natal
services
1 0 7 1 2 1 0 2
Minor Accidents 0 0 0 0 0 0 0 3
Major Accidents 0 0 2 0 0 0 0 3
Minor Illnesses 0 0 3 17 1 0 0 11
Major Illnesses 0 0 3 0 0 0 0 11
Source: UNICEF-PIDS Local Service Delivery, Household Survey, Health Module
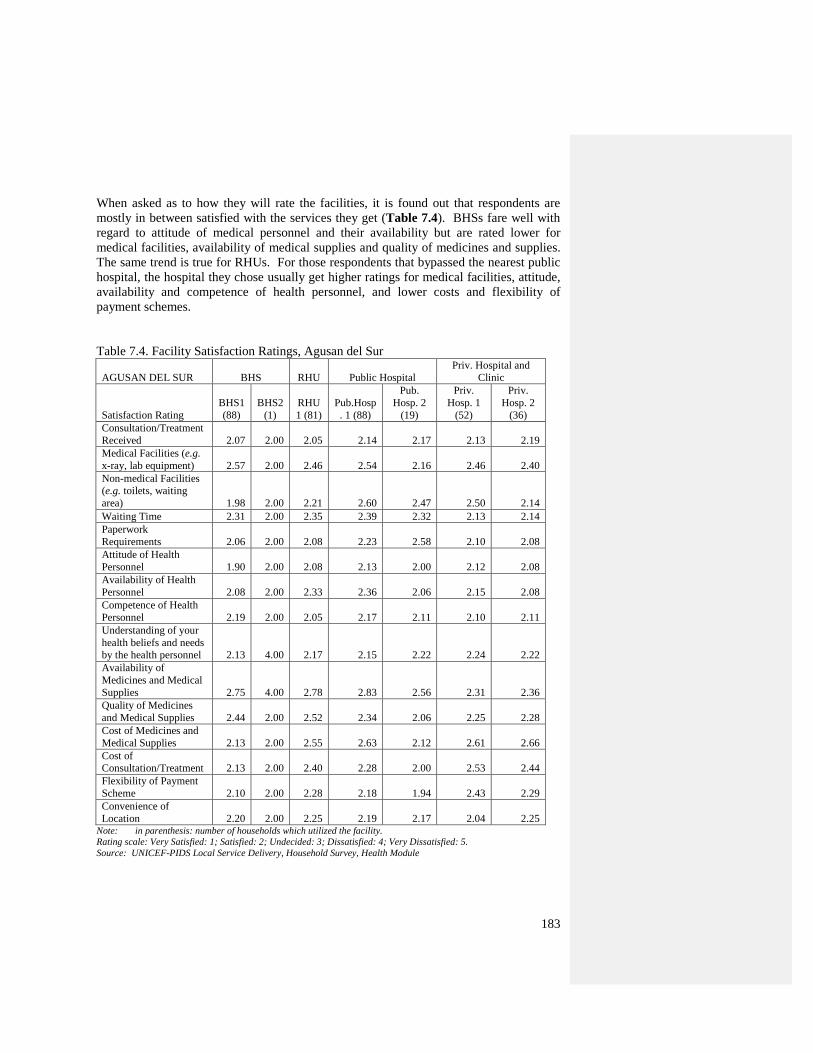
183
When asked as to how they will rate the facilities, it is found out that respondents are
mostly in between satisfied with the services they get (Table 7.4). BHSs fare well with
regard to attitude of medical personnel and their availability but are rated lower for
medical facilities, availability of medical supplies and quality of medicines and supplies.
The same trend is true for RHUs. For those respondents that bypassed the nearest public
hospital, the hospital they chose usually get higher ratings for medical facilities, attitude,
availability and competence of health personnel, and lower costs and flexibility of
payment schemes.
Table 7.4. Facility Satisfaction Ratings, Agusan del Sur
AGUSAN DEL SUR BHS RHU Public Hospital
Priv. Hospital and
Clinic
Satisfaction Rating
BHS1
(88)
BHS2
(1)
RHU
1 (81)
Pub.Hosp
. 1 (88)
Pub.
Hosp. 2
(19)
Priv.
Hosp. 1
(52)
Priv.
Hosp. 2
(36)
Consultation/Treatment
Received 2.07 2.00 2.05 2.14 2.17 2.13 2.19
Medical Facilities (e.g.
x-ray, lab equipment) 2.57 2.00 2.46 2.54 2.16 2.46 2.40
Non-medical Facilities
(e.g. toilets, waiting
area) 1.98 2.00 2.21 2.60 2.47 2.50 2.14
Waiting Time 2.31 2.00 2.35 2.39 2.32 2.13 2.14
Paperwork
Requirements 2.06 2.00 2.08 2.23 2.58 2.10 2.08
Attitude of Health
Personnel 1.90 2.00 2.08 2.13 2.00 2.12 2.08
Availability of Health
Personnel 2.08 2.00 2.33 2.36 2.06 2.15 2.08
Competence of Health
Personnel 2.19 2.00 2.05 2.17 2.11 2.10 2.11
Understanding of your
health beliefs and needs
by the health personnel 2.13 4.00 2.17 2.15 2.22 2.24 2.22
Availability of
Medicines and Medical
Supplies 2.75 4.00 2.78 2.83 2.56 2.31 2.36
Quality of Medicines
and Medical Supplies 2.44 2.00 2.52 2.34 2.06 2.25 2.28
Cost of Medicines and
Medical Supplies 2.13 2.00 2.55 2.63 2.12 2.61 2.66
Cost of
Consultation/Treatment 2.13 2.00 2.40 2.28 2.00 2.53 2.44
Flexibility of Payment
Scheme 2.10 2.00 2.28 2.18 1.94 2.43 2.29
Convenience of
Location 2.20 2.00 2.25 2.19 2.17 2.04 2.25 Note: in parenthesis: number of households which utilized the facility.
Rating scale: Very Satisfied: 1; Satisfied: 2; Undecided: 3; Dissatisfied: 4; Very Dissatisfied: 5.
Source: UNICEF-PIDS Local Service Delivery, Household Survey, Health Module
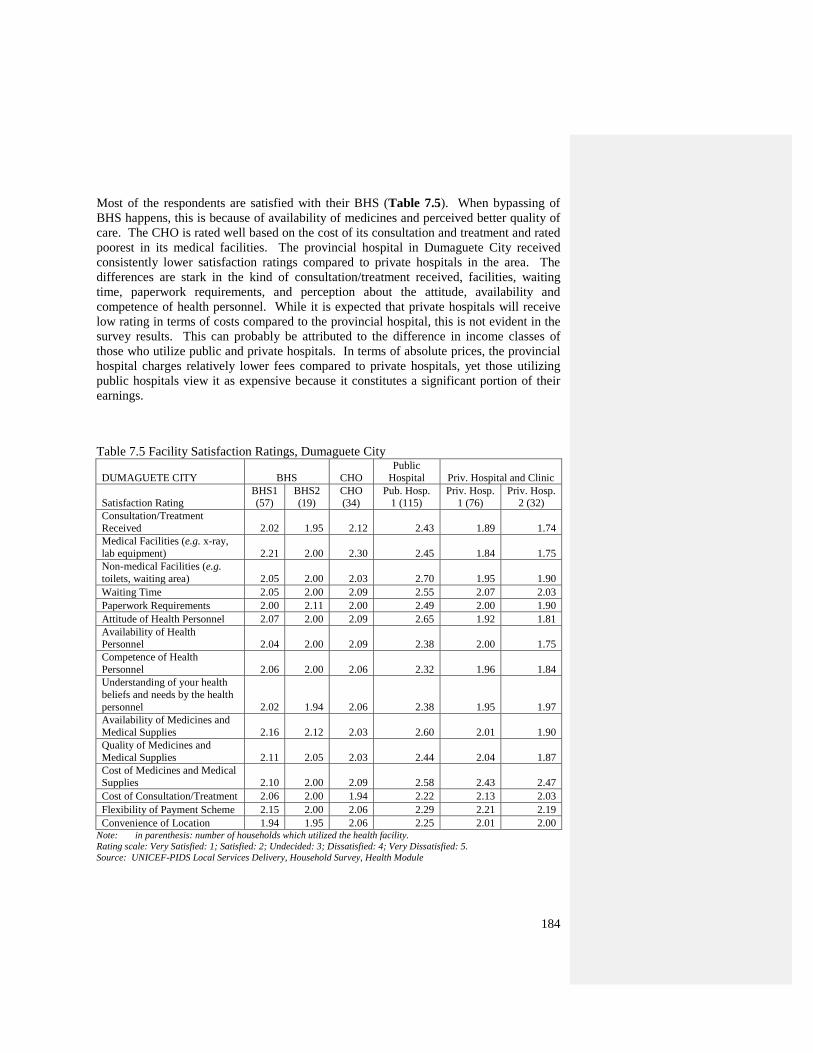
184
Most of the respondents are satisfied with their BHS (Table 7.5). When bypassing of
BHS happens, this is because of availability of medicines and perceived better quality of
care. The CHO is rated well based on the cost of its consultation and treatment and rated
poorest in its medical facilities. The provincial hospital in Dumaguete City received
consistently lower satisfaction ratings compared to private hospitals in the area. The
differences are stark in the kind of consultation/treatment received, facilities, waiting
time, paperwork requirements, and perception about the attitude, availability and
competence of health personnel. While it is expected that private hospitals will receive
low rating in terms of costs compared to the provincial hospital, this is not evident in the
survey results. This can probably be attributed to the difference in income classes of
those who utilize public and private hospitals. In terms of absolute prices, the provincial
hospital charges relatively lower fees compared to private hospitals, yet those utilizing
public hospitals view it as expensive because it constitutes a significant portion of their
earnings.
Table 7.5 Facility Satisfaction Ratings, Dumaguete City
DUMAGUETE CITY BHS CHO
Public
Hospital Priv. Hospital and Clinic
Satisfaction Rating
BHS1
(57)
BHS2
(19)
CHO
(34)
Pub. Hosp.
1 (115)
Priv. Hosp.
1 (76)
Priv. Hosp.
2 (32)
Consultation/Treatment
Received 2.02 1.95 2.12 2.43 1.89 1.74
Medical Facilities (e.g. x-ray,
lab equipment) 2.21 2.00 2.30 2.45 1.84 1.75
Non-medical Facilities (e.g.
toilets, waiting area) 2.05 2.00 2.03 2.70 1.95 1.90
Waiting Time 2.05 2.00 2.09 2.55 2.07 2.03
Paperwork Requirements 2.00 2.11 2.00 2.49 2.00 1.90
Attitude of Health Personnel 2.07 2.00 2.09 2.65 1.92 1.81
Availability of Health
Personnel 2.04 2.00 2.09 2.38 2.00 1.75
Competence of Health
Personnel 2.06 2.00 2.06 2.32 1.96 1.84
Understanding of your health
beliefs and needs by the health
personnel 2.02 1.94 2.06 2.38 1.95 1.97
Availability of Medicines and
Medical Supplies 2.16 2.12 2.03 2.60 2.01 1.90
Quality of Medicines and
Medical Supplies 2.11 2.05 2.03 2.44 2.04 1.87
Cost of Medicines and Medical
Supplies 2.10 2.00 2.09 2.58 2.43 2.47
Cost of Consultation/Treatment 2.06 2.00 1.94 2.22 2.13 2.03
Flexibility of Payment Scheme 2.15 2.00 2.06 2.29 2.21 2.19
Convenience of Location 1.94 1.95 2.06 2.25 2.01 2.00 Note: in parenthesis: number of households which utilized the health facility.
Rating scale: Very Satisfied: 1; Satisfied: 2; Undecided: 3; Dissatisfied: 4; Very Dissatisfied: 5.
Source: UNICEF-PIDS Local Services Delivery, Household Survey, Health Module
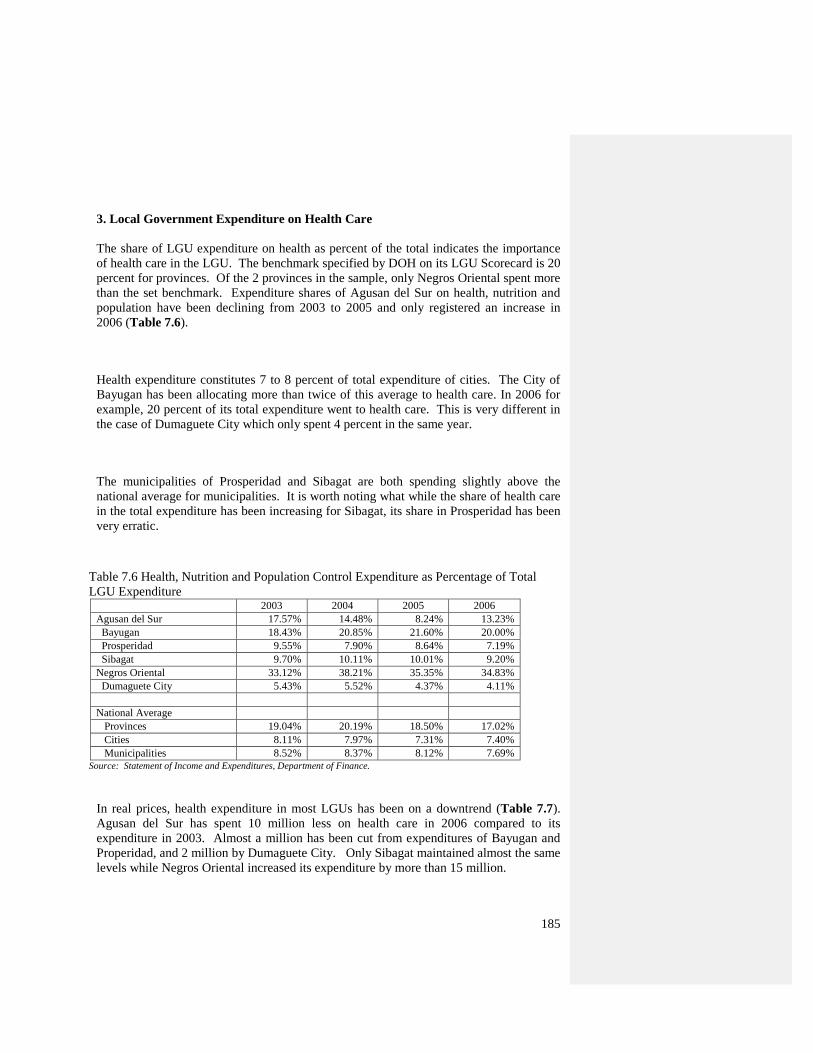
185
3. Local Government Expenditure on Health Care
The share of LGU expenditure on health as percent of the total indicates the importance
of health care in the LGU. The benchmark specified by DOH on its LGU Scorecard is 20
percent for provinces. Of the 2 provinces in the sample, only Negros Oriental spent more
than the set benchmark. Expenditure shares of Agusan del Sur on health, nutrition and
population have been declining from 2003 to 2005 and only registered an increase in
2006 (Table 7.6).
Health expenditure constitutes 7 to 8 percent of total expenditure of cities. The City of
Bayugan has been allocating more than twice of this average to health care. In 2006 for
example, 20 percent of its total expenditure went to health care. This is very different in
the case of Dumaguete City which only spent 4 percent in the same year.
The municipalities of Prosperidad and Sibagat are both spending slightly above the
national average for municipalities. It is worth noting what while the share of health care
in the total expenditure has been increasing for Sibagat, its share in Prosperidad has been
very erratic.
Table 7.6 Health, Nutrition and Population Control Expenditure as Percentage of Total
LGU Expenditure 2003 2004 2005 2006
Agusan del Sur 17.57% 14.48% 8.24% 13.23%
Bayugan 18.43% 20.85% 21.60% 20.00%
Prosperidad 9.55% 7.90% 8.64% 7.19%
Sibagat 9.70% 10.11% 10.01% 9.20%
Negros Oriental 33.12% 38.21% 35.35% 34.83%
Dumaguete City 5.43% 5.52% 4.37% 4.11%
National Average
Provinces 19.04% 20.19% 18.50% 17.02%
Cities 8.11% 7.97% 7.31% 7.40%
Municipalities 8.52% 8.37% 8.12% 7.69%
Source: Statement of Income and Expenditures, Department of Finance.
In real prices, health expenditure in most LGUs has been on a downtrend (Table 7.7).
Agusan del Sur has spent 10 million less on health care in 2006 compared to its
expenditure in 2003. Almost a million has been cut from expenditures of Bayugan and
Properidad, and 2 million by Dumaguete City. Only Sibagat maintained almost the same
levels while Negros Oriental increased its expenditure by more than 15 million.
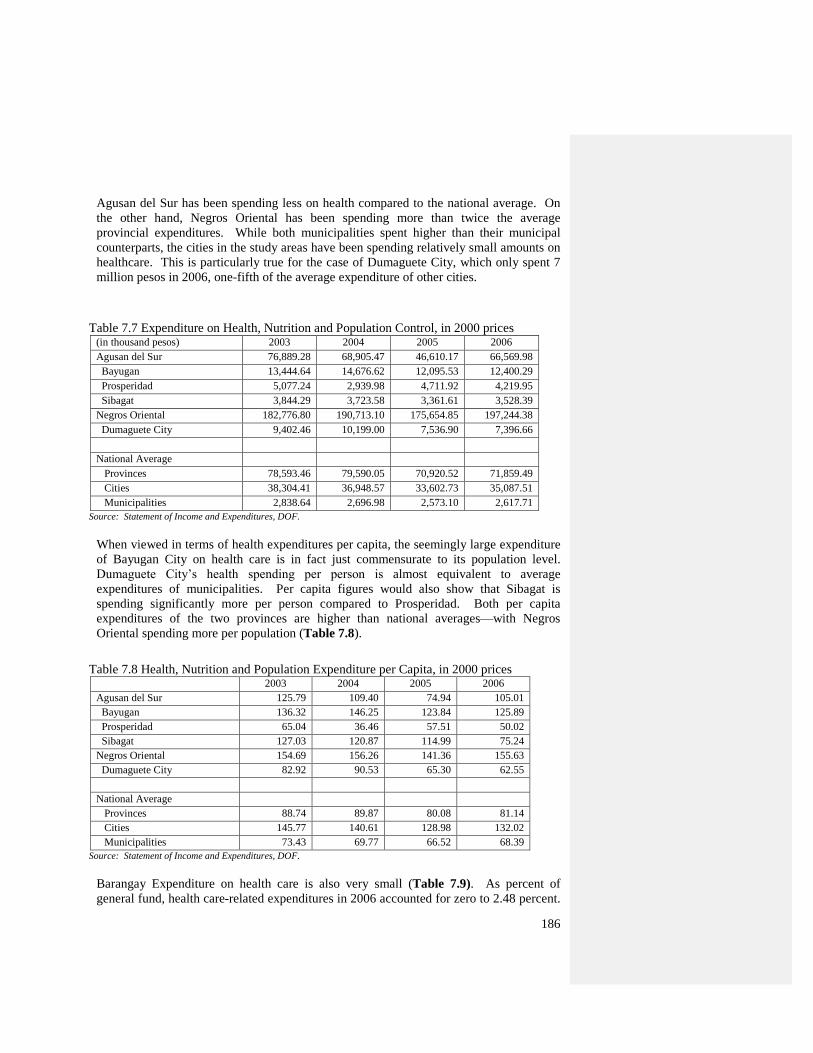
186
Agusan del Sur has been spending less on health compared to the national average. On
the other hand, Negros Oriental has been spending more than twice the average
provincial expenditures. While both municipalities spent higher than their municipal
counterparts, the cities in the study areas have been spending relatively small amounts on
healthcare. This is particularly true for the case of Dumaguete City, which only spent 7
million pesos in 2006, one-fifth of the average expenditure of other cities.
Table 7.7 Expenditure on Health, Nutrition and Population Control, in 2000 prices (in thousand pesos) 2003 2004 2005 2006
Agusan del Sur 76,889.28 68,905.47 46,610.17 66,569.98
Bayugan 13,444.64 14,676.62 12,095.53 12,400.29
Prosperidad 5,077.24 2,939.98 4,711.92 4,219.95
Sibagat 3,844.29 3,723.58 3,361.61 3,528.39
Negros Oriental 182,776.80 190,713.10 175,654.85 197,244.38
Dumaguete City 9,402.46 10,199.00 7,536.90 7,396.66
National Average
Provinces 78,593.46 79,590.05 70,920.52 71,859.49
Cities 38,304.41 36,948.57 33,602.73 35,087.51
Municipalities 2,838.64 2,696.98 2,573.10 2,617.71
Source: Statement of Income and Expenditures, DOF.
When viewed in terms of health expenditures per capita, the seemingly large expenditure
of Bayugan City on health care is in fact just commensurate to its population level.
Dumaguete City‘s health spending per person is almost equivalent to average
expenditures of municipalities. Per capita figures would also show that Sibagat is
spending significantly more per person compared to Prosperidad. Both per capita
expenditures of the two provinces are higher than national averages—with Negros
Oriental spending more per population (Table 7.8).
Table 7.8 Health, Nutrition and Population Expenditure per Capita, in 2000 prices 2003 2004 2005 2006
Agusan del Sur 125.79 109.40 74.94 105.01
Bayugan 136.32 146.25 123.84 125.89
Prosperidad 65.04 36.46 57.51 50.02
Sibagat 127.03 120.87 114.99 75.24
Negros Oriental 154.69 156.26 141.36 155.63
Dumaguete City 82.92 90.53 65.30 62.55
National Average
Provinces 88.74 89.87 80.08 81.14
Cities 145.77 140.61 128.98 132.02
Municipalities 73.43 69.77 66.52 68.39
Source: Statement of Income and Expenditures, DOF.
Barangay Expenditure on health care is also very small (Table 7.9). As percent of
general fund, health care-related expenditures in 2006 accounted for zero to 2.48 percent.
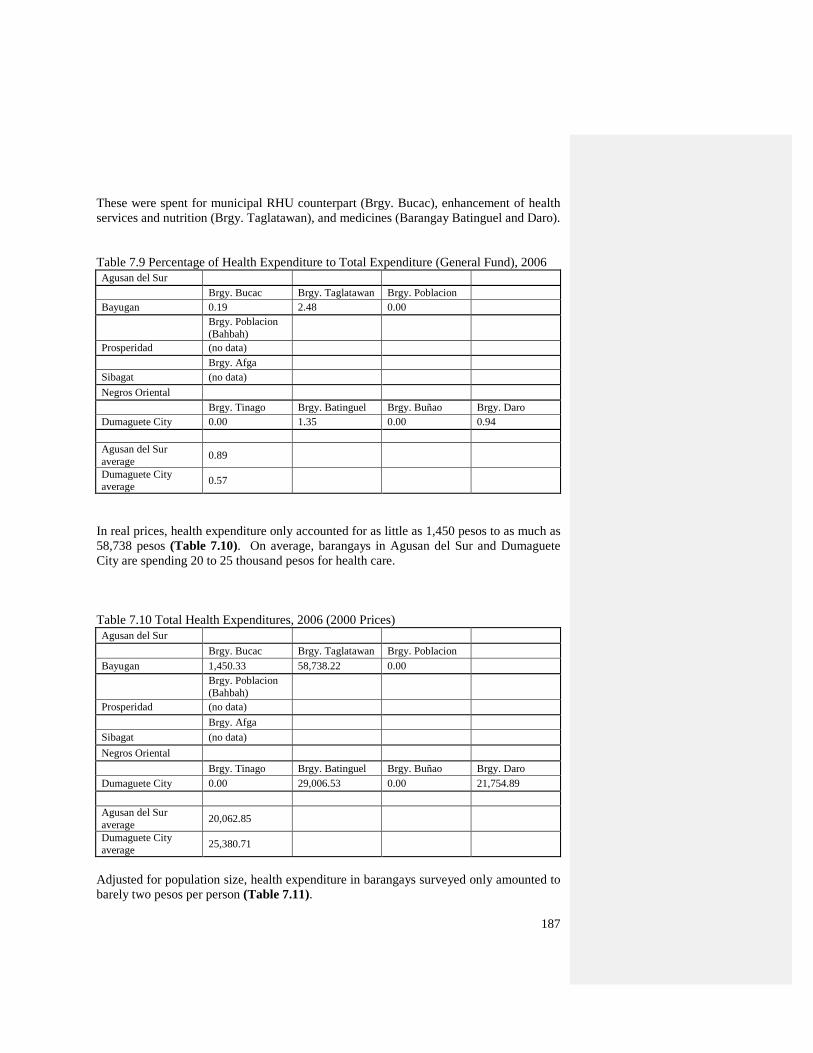
187
These were spent for municipal RHU counterpart (Brgy. Bucac), enhancement of health
services and nutrition (Brgy. Taglatawan), and medicines (Barangay Batinguel and Daro).
Table 7.9 Percentage of Health Expenditure to Total Expenditure (General Fund), 2006
Agusan del Sur
Brgy. Bucac Brgy. Taglatawan Brgy. Poblacion
Bayugan 0.19 2.48 0.00
Brgy. Poblacion
(Bahbah)
Prosperidad (no data)
Brgy. Afga
Sibagat (no data)
Negros Oriental
Brgy. Tinago Brgy. Batinguel Brgy. Buñao Brgy. Daro
Dumaguete City 0.00 1.35 0.00 0.94
Agusan del Sur
average 0.89
Dumaguete City
average 0.57
In real prices, health expenditure only accounted for as little as 1,450 pesos to as much as
58,738 pesos (Table 7.10). On average, barangays in Agusan del Sur and Dumaguete
City are spending 20 to 25 thousand pesos for health care.
Table 7.10 Total Health Expenditures, 2006 (2000 Prices)
Agusan del Sur
Brgy. Bucac Brgy. Taglatawan Brgy. Poblacion
Bayugan 1,450.33 58,738.22 0.00
Brgy. Poblacion
(Bahbah)
Prosperidad (no data)
Brgy. Afga
Sibagat (no data)
Negros Oriental
Brgy. Tinago Brgy. Batinguel Brgy. Buñao Brgy. Daro
Dumaguete City 0.00 29,006.53 0.00 21,754.89
Agusan del Sur
average 20,062.85
Dumaguete City
average 25,380.71
Adjusted for population size, health expenditure in barangays surveyed only amounted to
barely two pesos per person (Table 7.11).
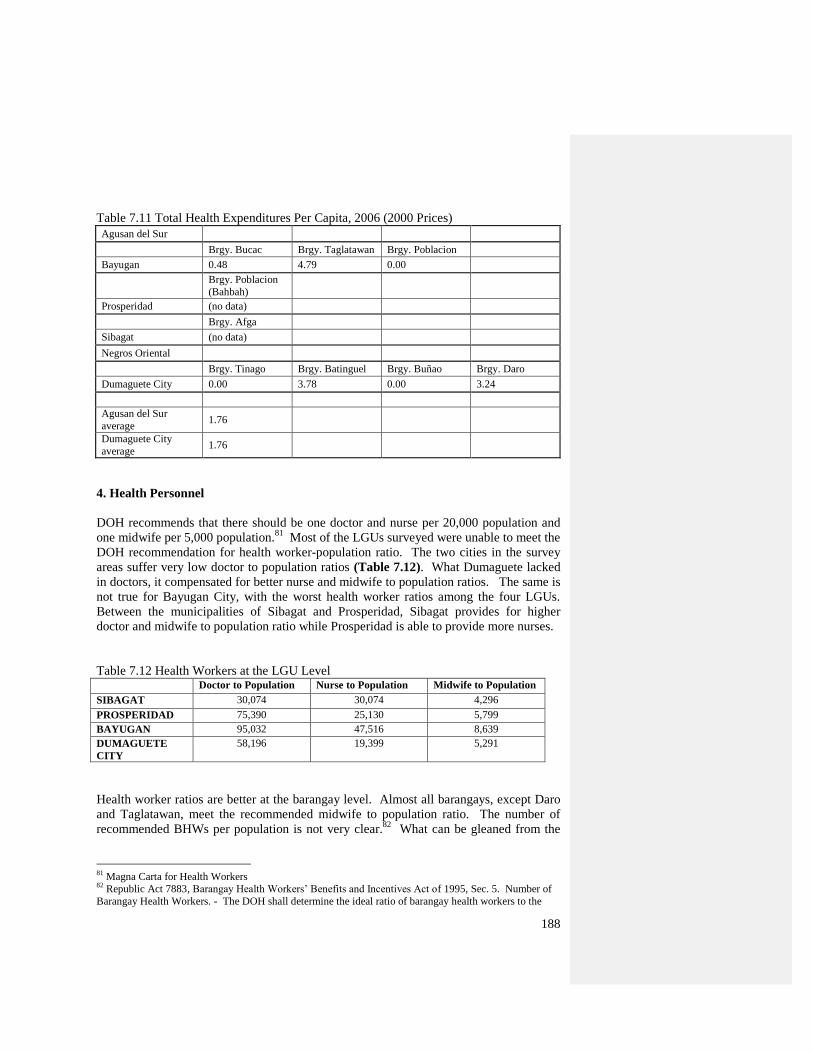
188
Table 7.11 Total Health Expenditures Per Capita, 2006 (2000 Prices)
Agusan del Sur
Brgy. Bucac Brgy. Taglatawan Brgy. Poblacion
Bayugan 0.48 4.79 0.00
Brgy. Poblacion
(Bahbah)
Prosperidad (no data)
Brgy. Afga
Sibagat (no data)
Negros Oriental
Brgy. Tinago Brgy. Batinguel Brgy. Buñao Brgy. Daro
Dumaguete City 0.00 3.78 0.00 3.24
Agusan del Sur
average 1.76
Dumaguete City
average 1.76
4. Health Personnel
DOH recommends that there should be one doctor and nurse per 20,000 population and
one midwife per 5,000 population.81
Most of the LGUs surveyed were unable to meet the
DOH recommendation for health worker-population ratio. The two cities in the survey
areas suffer very low doctor to population ratios (Table 7.12). What Dumaguete lacked
in doctors, it compensated for better nurse and midwife to population ratios. The same is
not true for Bayugan City, with the worst health worker ratios among the four LGUs.
Between the municipalities of Sibagat and Prosperidad, Sibagat provides for higher
doctor and midwife to population ratio while Prosperidad is able to provide more nurses.
Table 7.12 Health Workers at the LGU Level Doctor to Population Nurse to Population Midwife to Population
SIBAGAT 30,074 30,074 4,296
PROSPERIDAD 75,390 25,130 5,799
BAYUGAN 95,032 47,516 8,639
DUMAGUETE
CITY
58,196 19,399 5,291
Health worker ratios are better at the barangay level. Almost all barangays, except Daro
and Taglatawan, meet the recommended midwife to population ratio. The number of
recommended BHWs per population is not very clear.82
What can be gleaned from the
81
Magna Carta for Health Workers 82
Republic Act 7883, Barangay Health Workers‘ Benefits and Incentives Act of 1995, Sec. 5. Number of
Barangay Health Workers. - The DOH shall determine the ideal ratio of barangay health workers to the
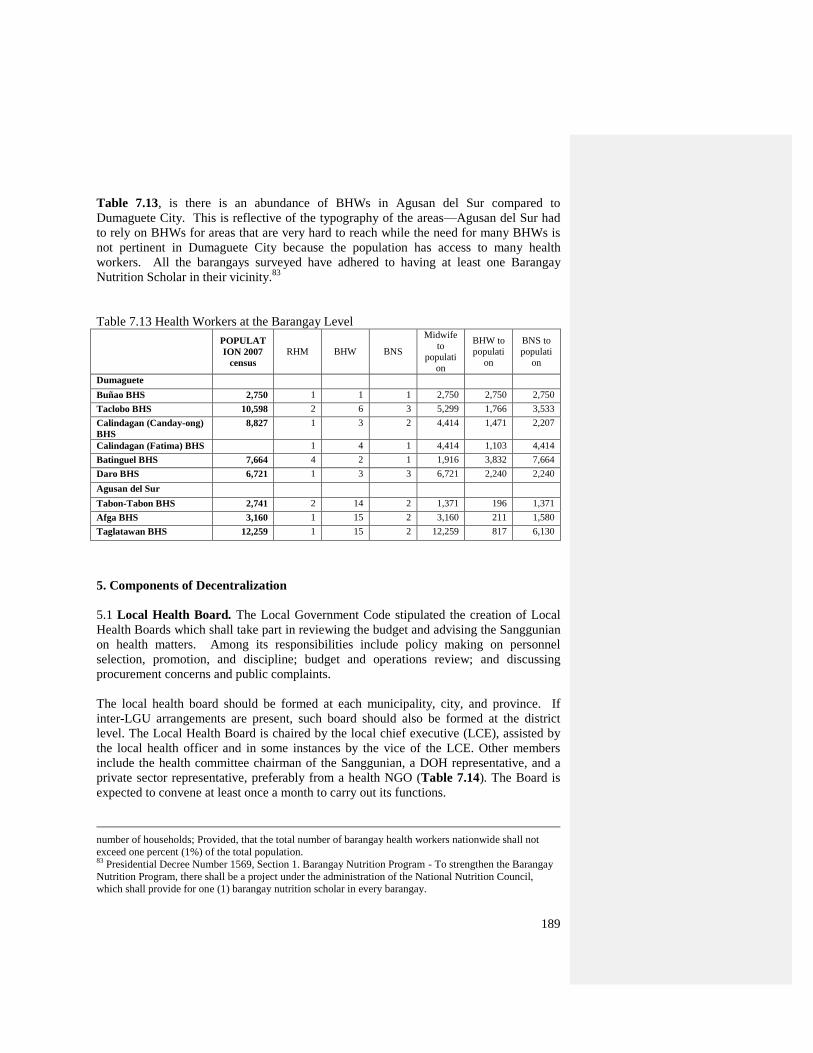
189
Table 7.13, is there is an abundance of BHWs in Agusan del Sur compared to
Dumaguete City. This is reflective of the typography of the areas—Agusan del Sur had
to rely on BHWs for areas that are very hard to reach while the need for many BHWs is
not pertinent in Dumaguete City because the population has access to many health
workers. All the barangays surveyed have adhered to having at least one Barangay
Nutrition Scholar in their vicinity.83
Table 7.13 Health Workers at the Barangay Level
POPULAT
ION 2007
census
RHM BHW BNS
Midwife
to
populati
on
BHW to
populati
on
BNS to
populati
on
Dumaguete
Buñao BHS 2,750 1 1 1 2,750 2,750 2,750
Taclobo BHS 10,598 2 6 3 5,299 1,766 3,533
Calindagan (Canday-ong)
BHS
8,827 1 3 2 4,414 1,471 2,207
Calindagan (Fatima) BHS 1 4 1 4,414 1,103 4,414
Batinguel BHS 7,664 4 2 1 1,916 3,832 7,664
Daro BHS 6,721 1 3 3 6,721 2,240 2,240
Agusan del Sur
Tabon-Tabon BHS 2,741 2 14 2 1,371 196 1,371
Afga BHS 3,160 1 15 2 3,160 211 1,580
Taglatawan BHS 12,259 1 15 2 12,259 817 6,130
5. Components of Decentralization
5.1 Local Health Board. The Local Government Code stipulated the creation of Local
Health Boards which shall take part in reviewing the budget and advising the Sanggunian
on health matters. Among its responsibilities include policy making on personnel
selection, promotion, and discipline; budget and operations review; and discussing
procurement concerns and public complaints.
The local health board should be formed at each municipality, city, and province. If
inter-LGU arrangements are present, such board should also be formed at the district
level. The Local Health Board is chaired by the local chief executive (LCE), assisted by
the local health officer and in some instances by the vice of the LCE. Other members
include the health committee chairman of the Sanggunian, a DOH representative, and a
private sector representative, preferably from a health NGO (Table 7.14). The Board is
expected to convene at least once a month to carry out its functions.
number of households; Provided, that the total number of barangay health workers nationwide shall not
exceed one percent (1%) of the total population. 83
Presidential Decree Number 1569, Section 1. Barangay Nutrition Program - To strengthen the Barangay
Nutrition Program, there shall be a project under the administration of the National Nutrition Council,
which shall provide for one (1) barangay nutrition scholar in every barangay.
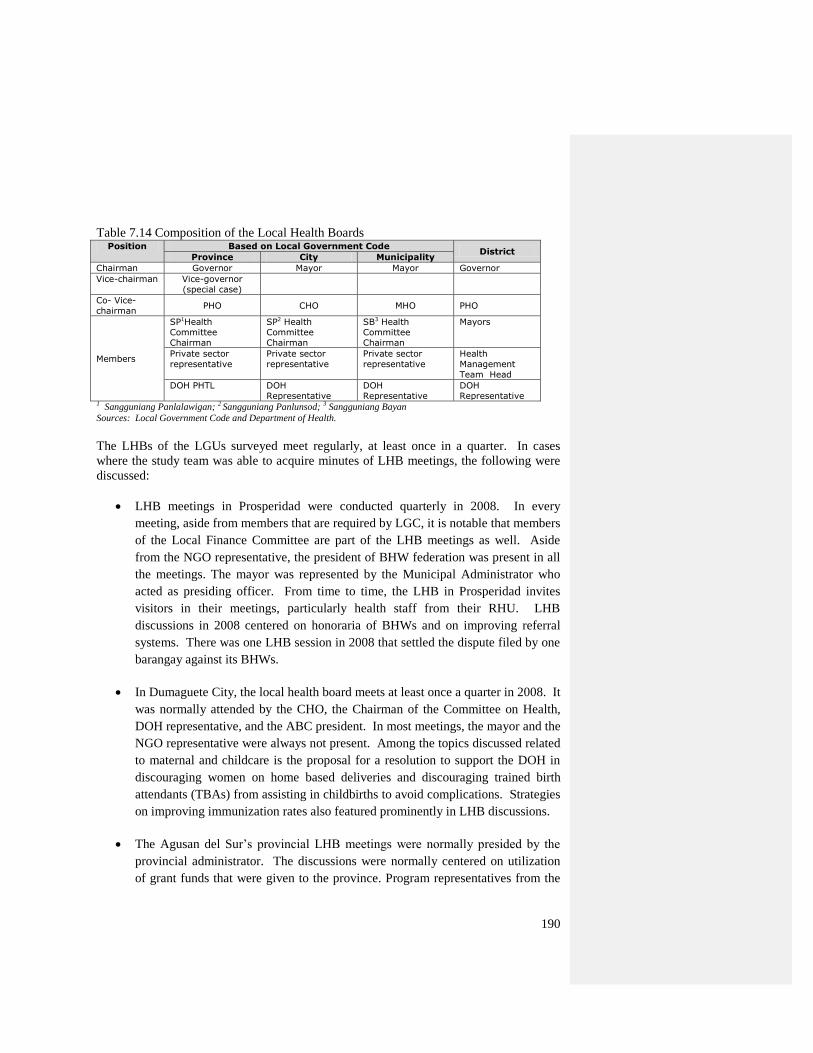
190
Table 7.14 Composition of the Local Health Boards Position Based on Local Government Code
District Province City Municipality
Chairman Governor Mayor Mayor Governor
Vice-chairman Vice-governor (special case)
Co- Vice-chairman
PHO CHO MHO PHO
Members
SP1Health Committee Chairman
SP2 Health Committee Chairman
SB3 Health Committee Chairman
Mayors
Private sector representative
Private sector representative
Private sector representative
Health Management Team Head
DOH PHTL DOH Representative
DOH Representative
DOH Representative
1 Sangguniang Panlalawigan; 2 Sangguniang Panlunsod; 3 Sangguniang Bayan
Sources: Local Government Code and Department of Health.
The LHBs of the LGUs surveyed meet regularly, at least once in a quarter. In cases
where the study team was able to acquire minutes of LHB meetings, the following were
discussed:
LHB meetings in Prosperidad were conducted quarterly in 2008. In every
meeting, aside from members that are required by LGC, it is notable that members
of the Local Finance Committee are part of the LHB meetings as well. Aside
from the NGO representative, the president of BHW federation was present in all
the meetings. The mayor was represented by the Municipal Administrator who
acted as presiding officer. From time to time, the LHB in Prosperidad invites
visitors in their meetings, particularly health staff from their RHU. LHB
discussions in 2008 centered on honoraria of BHWs and on improving referral
systems. There was one LHB session in 2008 that settled the dispute filed by one
barangay against its BHWs.
In Dumaguete City, the local health board meets at least once a quarter in 2008. It
was normally attended by the CHO, the Chairman of the Committee on Health,
DOH representative, and the ABC president. In most meetings, the mayor and the
NGO representative were always not present. Among the topics discussed related
to maternal and childcare is the proposal for a resolution to support the DOH in
discouraging women on home based deliveries and discouraging trained birth
attendants (TBAs) from assisting in childbirths to avoid complications. Strategies
on improving immunization rates also featured prominently in LHB discussions.
The Agusan del Sur‘s provincial LHB meetings were normally presided by the
provincial administrator. The discussions were normally centered on utilization
of grant funds that were given to the province. Program representatives from the
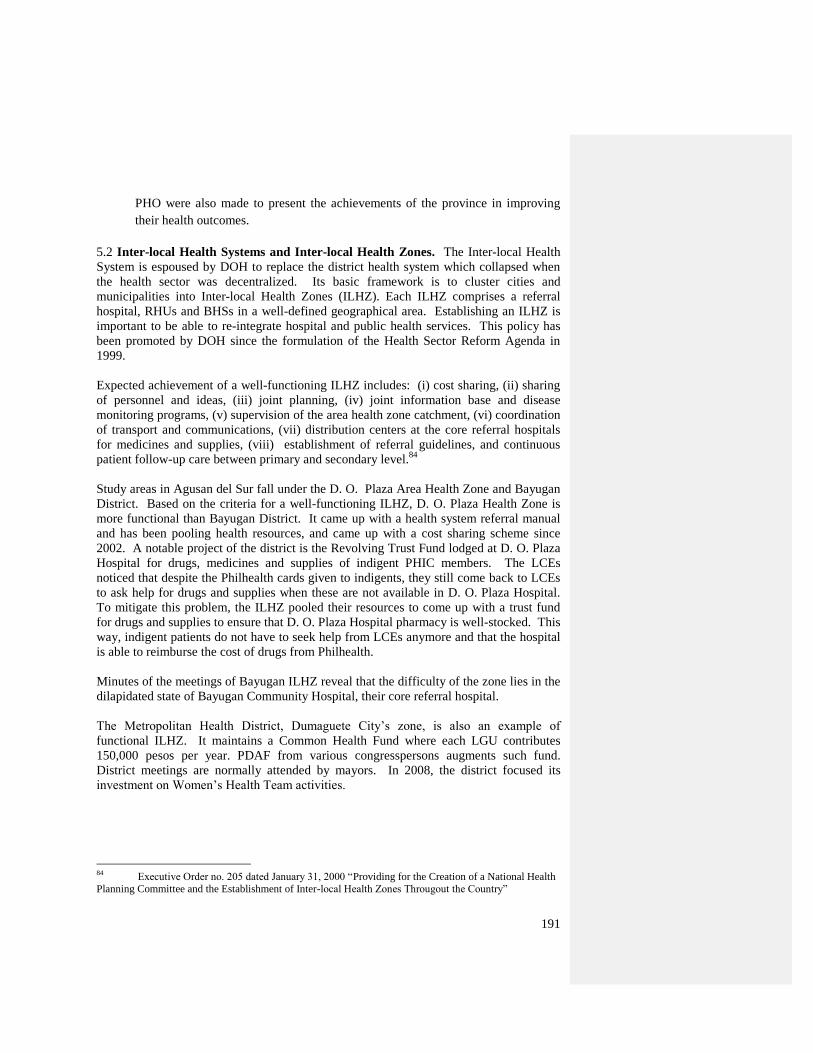
191
PHO were also made to present the achievements of the province in improving
their health outcomes.
5.2 Inter-local Health Systems and Inter-local Health Zones. The Inter-local Health
System is espoused by DOH to replace the district health system which collapsed when
the health sector was decentralized. Its basic framework is to cluster cities and
municipalities into Inter-local Health Zones (ILHZ). Each ILHZ comprises a referral
hospital, RHUs and BHSs in a well-defined geographical area. Establishing an ILHZ is
important to be able to re-integrate hospital and public health services. This policy has
been promoted by DOH since the formulation of the Health Sector Reform Agenda in
1999.
Expected achievement of a well-functioning ILHZ includes: (i) cost sharing, (ii) sharing
of personnel and ideas, (iii) joint planning, (iv) joint information base and disease
monitoring programs, (v) supervision of the area health zone catchment, (vi) coordination
of transport and communications, (vii) distribution centers at the core referral hospitals
for medicines and supplies, (viii) establishment of referral guidelines, and continuous
patient follow-up care between primary and secondary level.84
Study areas in Agusan del Sur fall under the D. O. Plaza Area Health Zone and Bayugan
District. Based on the criteria for a well-functioning ILHZ, D. O. Plaza Health Zone is
more functional than Bayugan District. It came up with a health system referral manual
and has been pooling health resources, and came up with a cost sharing scheme since
2002. A notable project of the district is the Revolving Trust Fund lodged at D. O. Plaza
Hospital for drugs, medicines and supplies of indigent PHIC members. The LCEs
noticed that despite the Philhealth cards given to indigents, they still come back to LCEs
to ask help for drugs and supplies when these are not available in D. O. Plaza Hospital.
To mitigate this problem, the ILHZ pooled their resources to come up with a trust fund
for drugs and supplies to ensure that D. O. Plaza Hospital pharmacy is well-stocked. This
way, indigent patients do not have to seek help from LCEs anymore and that the hospital
is able to reimburse the cost of drugs from Philhealth.
Minutes of the meetings of Bayugan ILHZ reveal that the difficulty of the zone lies in the
dilapidated state of Bayugan Community Hospital, their core referral hospital.
The Metropolitan Health District, Dumaguete City‘s zone, is also an example of
functional ILHZ. It maintains a Common Health Fund where each LGU contributes
150,000 pesos per year. PDAF from various congresspersons augments such fund.
District meetings are normally attended by mayors. In 2008, the district focused its
investment on Women‘s Health Team activities.
84
Executive Order no. 205 dated January 31, 2000 ―Providing for the Creation of a National Health
Planning Committee and the Establishment of Inter-local Health Zones Througout the Country‖
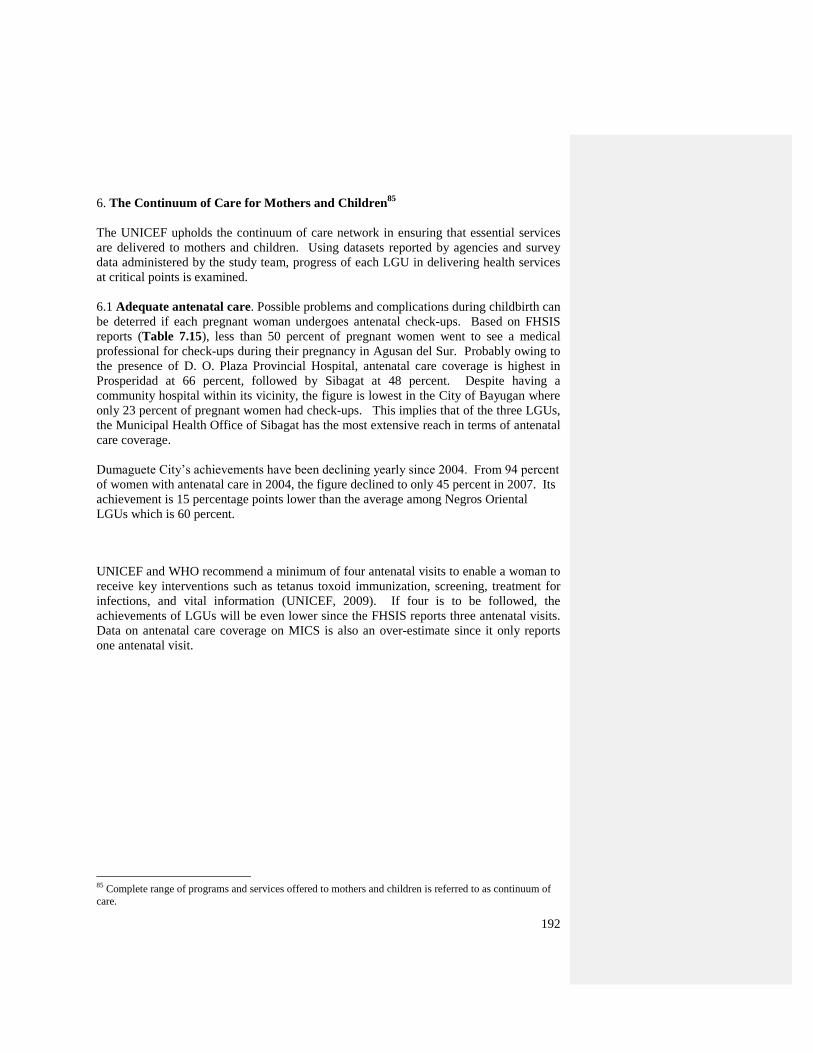
192
6. The Continuum of Care for Mothers and Children85
The UNICEF upholds the continuum of care network in ensuring that essential services
are delivered to mothers and children. Using datasets reported by agencies and survey
data administered by the study team, progress of each LGU in delivering health services
at critical points is examined.
6.1 Adequate antenatal care. Possible problems and complications during childbirth can
be deterred if each pregnant woman undergoes antenatal check-ups. Based on FHSIS
reports (Table 7.15), less than 50 percent of pregnant women went to see a medical
professional for check-ups during their pregnancy in Agusan del Sur. Probably owing to
the presence of D. O. Plaza Provincial Hospital, antenatal care coverage is highest in
Prosperidad at 66 percent, followed by Sibagat at 48 percent. Despite having a
community hospital within its vicinity, the figure is lowest in the City of Bayugan where
only 23 percent of pregnant women had check-ups. This implies that of the three LGUs,
the Municipal Health Office of Sibagat has the most extensive reach in terms of antenatal
care coverage.
Dumaguete City‘s achievements have been declining yearly since 2004. From 94 percent
of women with antenatal care in 2004, the figure declined to only 45 percent in 2007. Its
achievement is 15 percentage points lower than the average among Negros Oriental
LGUs which is 60 percent.
UNICEF and WHO recommend a minimum of four antenatal visits to enable a woman to
receive key interventions such as tetanus toxoid immunization, screening, treatment for
infections, and vital information (UNICEF, 2009). If four is to be followed, the
achievements of LGUs will be even lower since the FHSIS reports three antenatal visits.
Data on antenatal care coverage on MICS is also an over-estimate since it only reports
one antenatal visit.
85
Complete range of programs and services offered to mothers and children is referred to as continuum of
care.
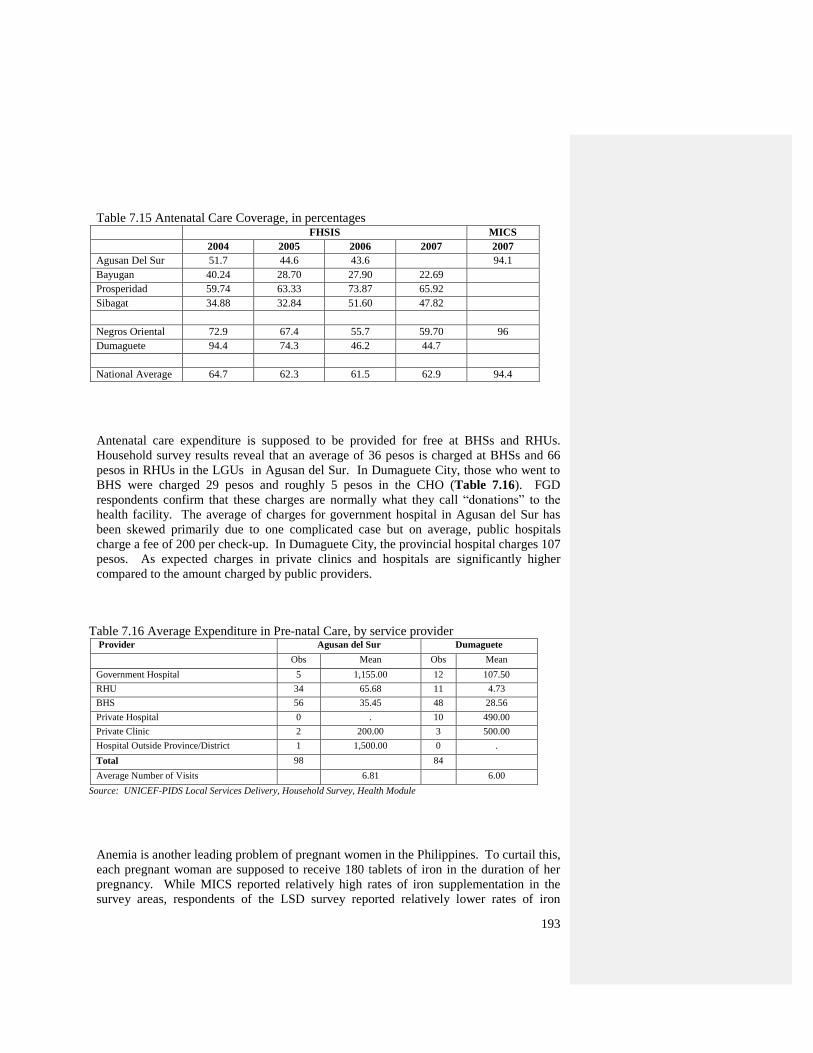
193
Table 7.15 Antenatal Care Coverage, in percentages FHSIS MICS
2004 2005 2006 2007 2007
Agusan Del Sur 51.7 44.6 43.6 94.1
Bayugan 40.24 28.70 27.90 22.69
Prosperidad 59.74 63.33 73.87 65.92
Sibagat 34.88 32.84 51.60 47.82
Negros Oriental 72.9 67.4 55.7 59.70 96
Dumaguete 94.4 74.3 46.2 44.7
National Average 64.7 62.3 61.5 62.9 94.4
Antenatal care expenditure is supposed to be provided for free at BHSs and RHUs.
Household survey results reveal that an average of 36 pesos is charged at BHSs and 66
pesos in RHUs in the LGUs in Agusan del Sur. In Dumaguete City, those who went to
BHS were charged 29 pesos and roughly 5 pesos in the CHO (Table 7.16). FGD
respondents confirm that these charges are normally what they call ―donations‖ to the
health facility. The average of charges for government hospital in Agusan del Sur has
been skewed primarily due to one complicated case but on average, public hospitals
charge a fee of 200 per check-up. In Dumaguete City, the provincial hospital charges 107
pesos. As expected charges in private clinics and hospitals are significantly higher
compared to the amount charged by public providers.
Table 7.16 Average Expenditure in Pre-natal Care, by service provider Provider Agusan del Sur Dumaguete
Obs Mean Obs Mean
Government Hospital 5 1,155.00 12 107.50
RHU 34 65.68 11 4.73
BHS 56 35.45 48 28.56
Private Hospital 0 . 10 490.00
Private Clinic 2 200.00 3 500.00
Hospital Outside Province/District 1 1,500.00 0 .
Total 98 84
Average Number of Visits 6.81 6.00
Source: UNICEF-PIDS Local Services Delivery, Household Survey, Health Module
Anemia is another leading problem of pregnant women in the Philippines. To curtail this,
each pregnant woman are supposed to receive 180 tablets of iron in the duration of her
pregnancy. While MICS reported relatively high rates of iron supplementation in the
survey areas, respondents of the LSD survey reported relatively lower rates of iron
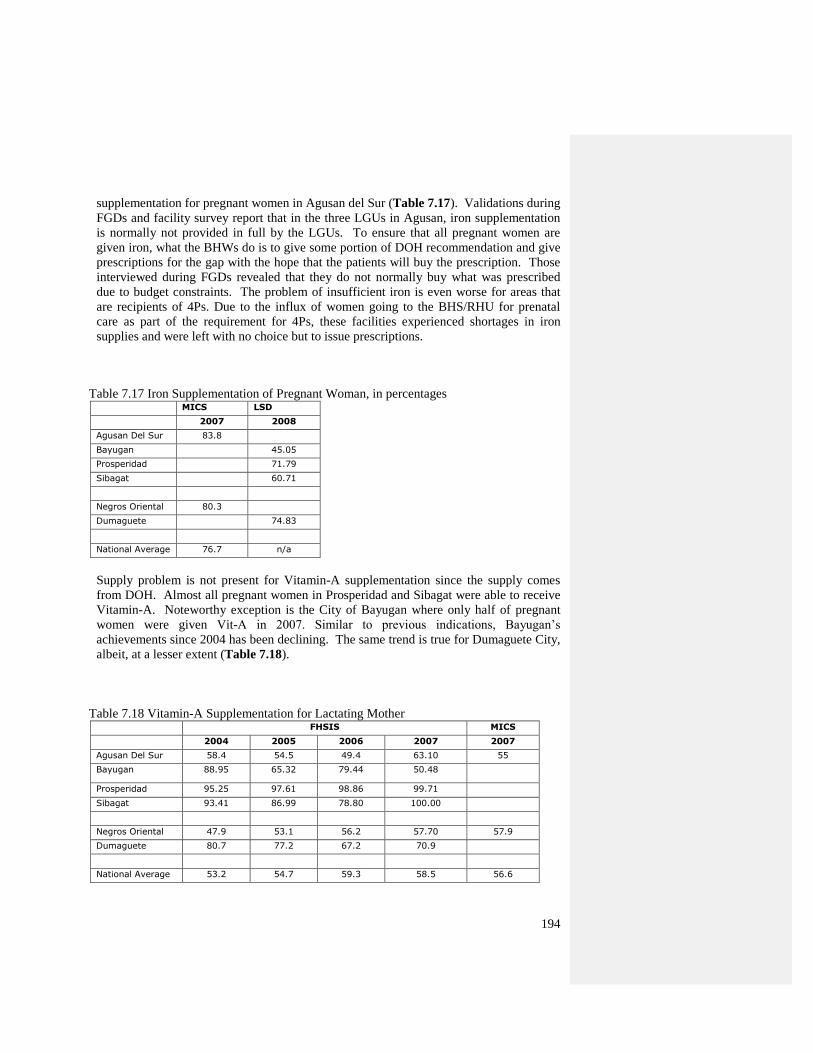
194
supplementation for pregnant women in Agusan del Sur (Table 7.17). Validations during
FGDs and facility survey report that in the three LGUs in Agusan, iron supplementation
is normally not provided in full by the LGUs. To ensure that all pregnant women are
given iron, what the BHWs do is to give some portion of DOH recommendation and give
prescriptions for the gap with the hope that the patients will buy the prescription. Those
interviewed during FGDs revealed that they do not normally buy what was prescribed
due to budget constraints. The problem of insufficient iron is even worse for areas that
are recipients of 4Ps. Due to the influx of women going to the BHS/RHU for prenatal
care as part of the requirement for 4Ps, these facilities experienced shortages in iron
supplies and were left with no choice but to issue prescriptions.
Table 7.17 Iron Supplementation of Pregnant Woman, in percentages MICS LSD
2007 2008
Agusan Del Sur 83.8
Bayugan 45.05
Prosperidad 71.79
Sibagat 60.71
Negros Oriental 80.3
Dumaguete 74.83
National Average 76.7 n/a
Supply problem is not present for Vitamin-A supplementation since the supply comes
from DOH. Almost all pregnant women in Prosperidad and Sibagat were able to receive
Vitamin-A. Noteworthy exception is the City of Bayugan where only half of pregnant
women were given Vit-A in 2007. Similar to previous indications, Bayugan‘s
achievements since 2004 has been declining. The same trend is true for Dumaguete City,
albeit, at a lesser extent (Table 7.18).
Table 7.18 Vitamin-A Supplementation for Lactating Mother FHSIS MICS
2004 2005 2006 2007 2007
Agusan Del Sur 58.4 54.5 49.4 63.10 55
Bayugan 88.95 65.32 79.44 50.48
Prosperidad 95.25 97.61 98.86 99.71
Sibagat 93.41 86.99 78.80 100.00
Negros Oriental 47.9 53.1 56.2 57.70 57.9
Dumaguete 80.7 77.2 67.2 70.9
National Average 53.2 54.7 59.3 58.5 56.6
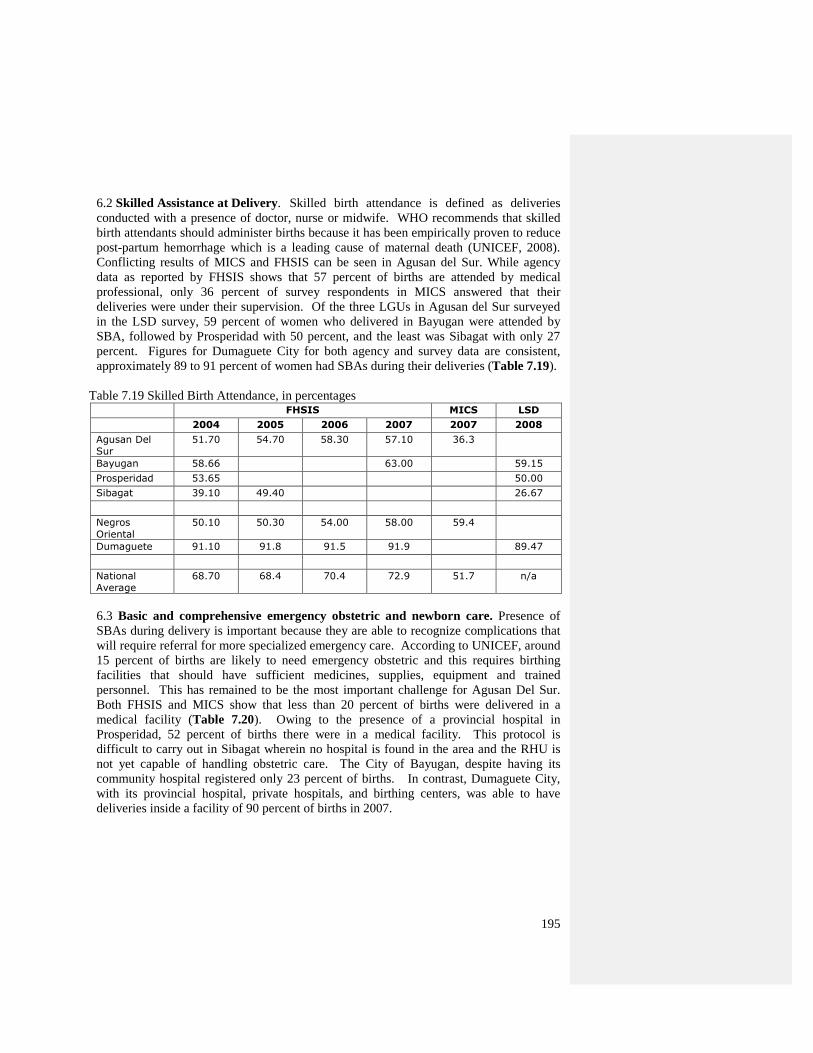
195
6.2 Skilled Assistance at Delivery. Skilled birth attendance is defined as deliveries
conducted with a presence of doctor, nurse or midwife. WHO recommends that skilled
birth attendants should administer births because it has been empirically proven to reduce
post-partum hemorrhage which is a leading cause of maternal death (UNICEF, 2008).
Conflicting results of MICS and FHSIS can be seen in Agusan del Sur. While agency
data as reported by FHSIS shows that 57 percent of births are attended by medical
professional, only 36 percent of survey respondents in MICS answered that their
deliveries were under their supervision. Of the three LGUs in Agusan del Sur surveyed
in the LSD survey, 59 percent of women who delivered in Bayugan were attended by
SBA, followed by Prosperidad with 50 percent, and the least was Sibagat with only 27
percent. Figures for Dumaguete City for both agency and survey data are consistent,
approximately 89 to 91 percent of women had SBAs during their deliveries (Table 7.19).
Table 7.19 Skilled Birth Attendance, in percentages FHSIS MICS LSD
2004 2005 2006 2007 2007 2008
Agusan Del Sur
51.70 54.70 58.30 57.10 36.3
Bayugan 58.66 63.00 59.15
Prosperidad 53.65 50.00
Sibagat 39.10 49.40 26.67
Negros
Oriental
50.10 50.30 54.00 58.00 59.4
Dumaguete 91.10 91.8 91.5 91.9 89.47
National
Average
68.70 68.4 70.4 72.9 51.7 n/a
6.3 Basic and comprehensive emergency obstetric and newborn care. Presence of
SBAs during delivery is important because they are able to recognize complications that
will require referral for more specialized emergency care. According to UNICEF, around
15 percent of births are likely to need emergency obstetric and this requires birthing
facilities that should have sufficient medicines, supplies, equipment and trained
personnel. This has remained to be the most important challenge for Agusan Del Sur.
Both FHSIS and MICS show that less than 20 percent of births were delivered in a
medical facility (Table 7.20). Owing to the presence of a provincial hospital in
Prosperidad, 52 percent of births there were in a medical facility. This protocol is
difficult to carry out in Sibagat wherein no hospital is found in the area and the RHU is
not yet capable of handling obstetric care. The City of Bayugan, despite having its
community hospital registered only 23 percent of births. In contrast, Dumaguete City,
with its provincial hospital, private hospitals, and birthing centers, was able to have
deliveries inside a facility of 90 percent of births in 2007.
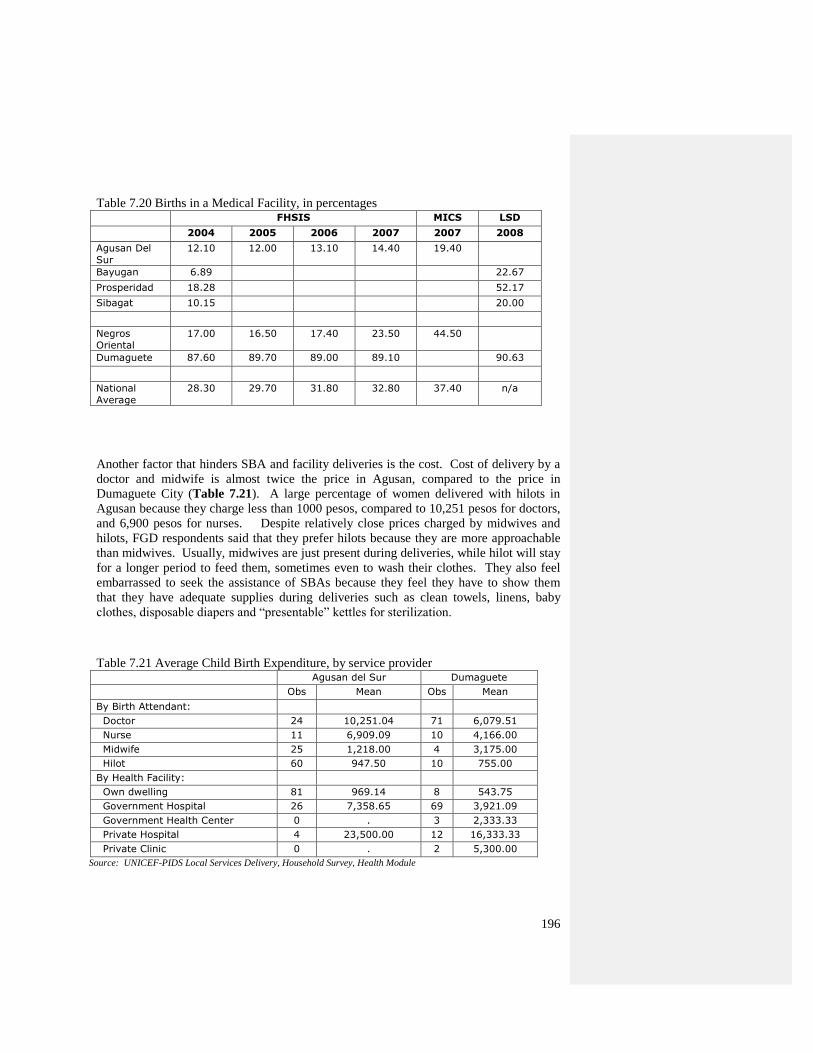
196
Table 7.20 Births in a Medical Facility, in percentages FHSIS MICS LSD
2004 2005 2006 2007 2007 2008
Agusan Del
Sur
12.10 12.00 13.10 14.40 19.40
Bayugan 6.89 22.67
Prosperidad 18.28 52.17
Sibagat 10.15 20.00
Negros Oriental
17.00 16.50 17.40 23.50 44.50
Dumaguete 87.60 89.70 89.00 89.10 90.63
National
Average
28.30 29.70 31.80 32.80 37.40 n/a
Another factor that hinders SBA and facility deliveries is the cost. Cost of delivery by a
doctor and midwife is almost twice the price in Agusan, compared to the price in
Dumaguete City (Table 7.21). A large percentage of women delivered with hilots in
Agusan because they charge less than 1000 pesos, compared to 10,251 pesos for doctors,
and 6,900 pesos for nurses. Despite relatively close prices charged by midwives and
hilots, FGD respondents said that they prefer hilots because they are more approachable
than midwives. Usually, midwives are just present during deliveries, while hilot will stay
for a longer period to feed them, sometimes even to wash their clothes. They also feel
embarrassed to seek the assistance of SBAs because they feel they have to show them
that they have adequate supplies during deliveries such as clean towels, linens, baby
clothes, disposable diapers and ―presentable‖ kettles for sterilization.
Table 7.21 Average Child Birth Expenditure, by service provider Agusan del Sur Dumaguete
Obs Mean Obs Mean
By Birth Attendant:
Doctor 24 10,251.04 71 6,079.51
Nurse 11 6,909.09 10 4,166.00
Midwife 25 1,218.00 4 3,175.00
Hilot 60 947.50 10 755.00
By Health Facility:
Own dwelling 81 969.14 8 543.75
Government Hospital 26 7,358.65 69 3,921.09
Government Health Center 0 . 3 2,333.33
Private Hospital 4 23,500.00 12 16,333.33
Private Clinic 0 . 2 5,300.00
Source: UNICEF-PIDS Local Services Delivery, Household Survey, Health Module
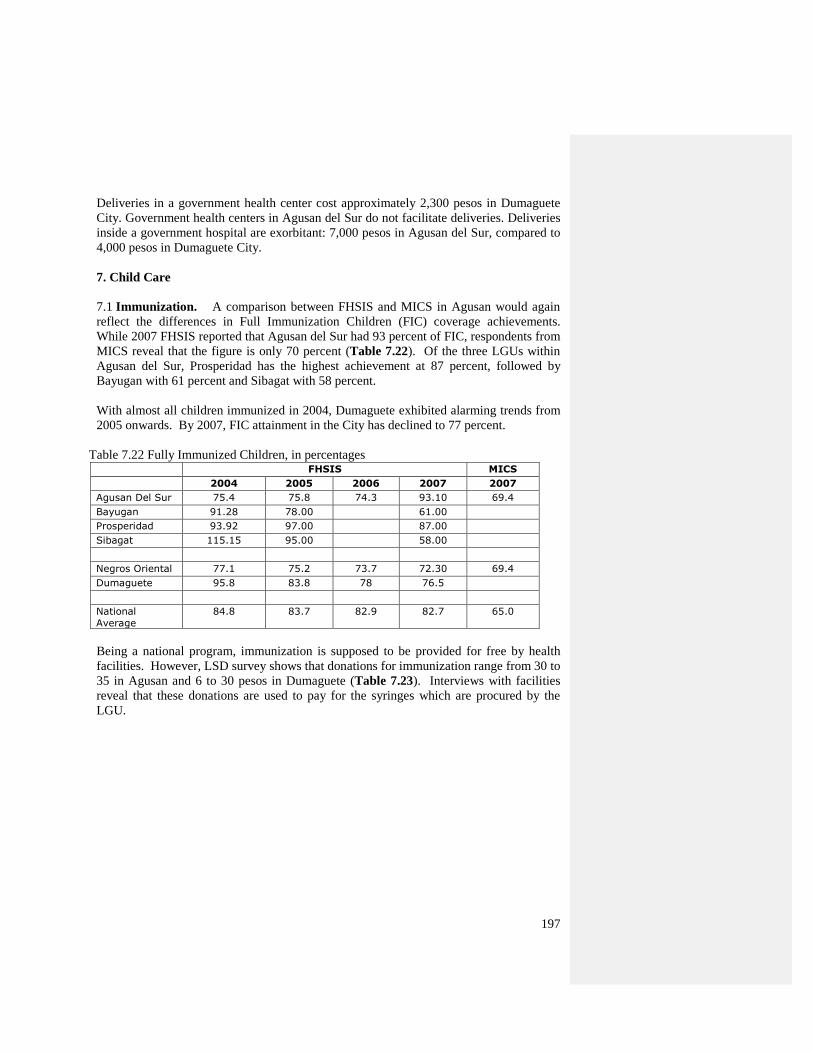
197
Deliveries in a government health center cost approximately 2,300 pesos in Dumaguete
City. Government health centers in Agusan del Sur do not facilitate deliveries. Deliveries
inside a government hospital are exorbitant: 7,000 pesos in Agusan del Sur, compared to
4,000 pesos in Dumaguete City.
7. Child Care
7.1 Immunization. A comparison between FHSIS and MICS in Agusan would again
reflect the differences in Full Immunization Children (FIC) coverage achievements.
While 2007 FHSIS reported that Agusan del Sur had 93 percent of FIC, respondents from
MICS reveal that the figure is only 70 percent (Table 7.22). Of the three LGUs within
Agusan del Sur, Prosperidad has the highest achievement at 87 percent, followed by
Bayugan with 61 percent and Sibagat with 58 percent.
With almost all children immunized in 2004, Dumaguete exhibited alarming trends from
2005 onwards. By 2007, FIC attainment in the City has declined to 77 percent.
Table 7.22 Fully Immunized Children, in percentages FHSIS MICS
2004 2005 2006 2007 2007
Agusan Del Sur 75.4 75.8 74.3 93.10 69.4
Bayugan 91.28 78.00 61.00
Prosperidad 93.92 97.00 87.00
Sibagat 115.15 95.00 58.00
Negros Oriental 77.1 75.2 73.7 72.30 69.4
Dumaguete 95.8 83.8 78 76.5
National Average
84.8 83.7 82.9 82.7 65.0
Being a national program, immunization is supposed to be provided for free by health
facilities. However, LSD survey shows that donations for immunization range from 30 to
35 in Agusan and 6 to 30 pesos in Dumaguete (Table 7.23). Interviews with facilities
reveal that these donations are used to pay for the syringes which are procured by the
LGU.
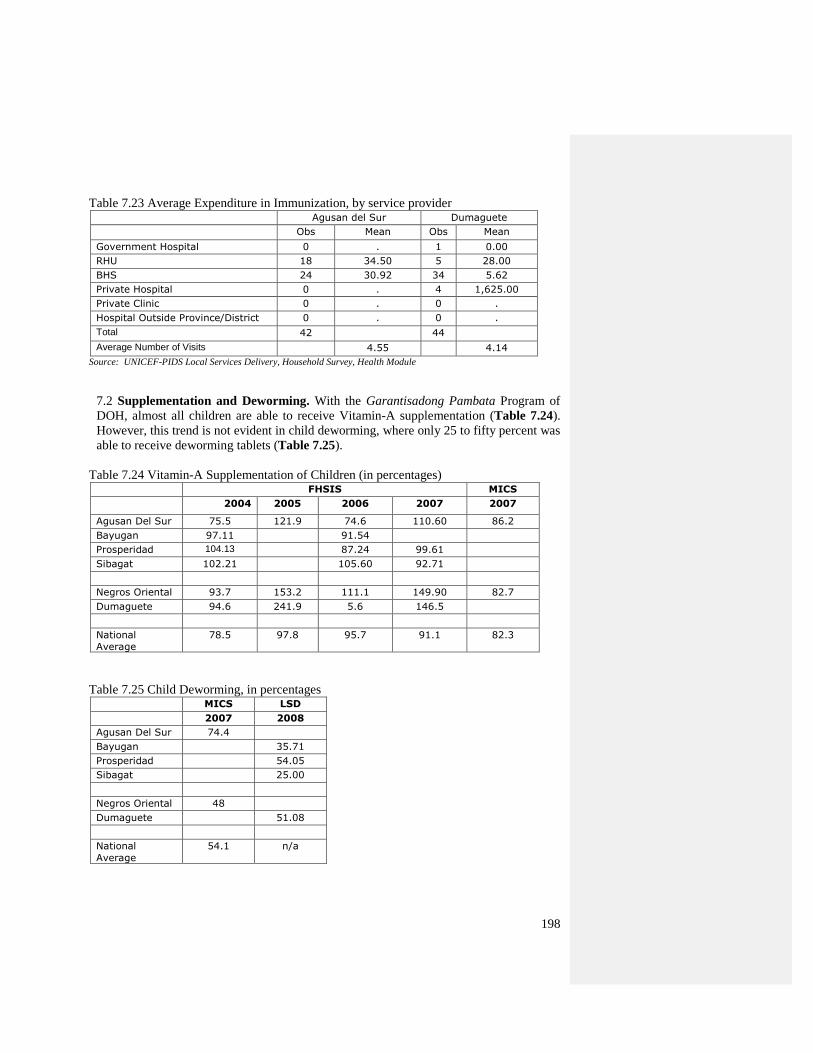
198
Table 7.23 Average Expenditure in Immunization, by service provider Agusan del Sur Dumaguete
Obs Mean Obs Mean
Government Hospital 0 . 1 0.00
RHU 18 34.50 5 28.00
BHS 24 30.92 34 5.62
Private Hospital 0 . 4 1,625.00
Private Clinic 0 . 0 .
Hospital Outside Province/District 0 . 0 .
Total 42 44
Average Number of Visits 4.55 4.14
Source: UNICEF-PIDS Local Services Delivery, Household Survey, Health Module
7.2 Supplementation and Deworming. With the Garantisadong Pambata Program of
DOH, almost all children are able to receive Vitamin-A supplementation (Table 7.24).
However, this trend is not evident in child deworming, where only 25 to fifty percent was
able to receive deworming tablets (Table 7.25).
Table 7.24 Vitamin-A Supplementation of Children (in percentages) FHSIS MICS
2004 2005 2006 2007 2007
Agusan Del Sur 75.5 121.9 74.6 110.60 86.2
Bayugan 97.11 91.54
Prosperidad 104.13 87.24 99.61
Sibagat 102.21 105.60 92.71
Negros Oriental 93.7 153.2 111.1 149.90 82.7
Dumaguete 94.6 241.9 5.6 146.5
National
Average
78.5 97.8 95.7 91.1 82.3
Table 7.25 Child Deworming, in percentages MICS LSD
2007 2008
Agusan Del Sur 74.4
Bayugan 35.71
Prosperidad 54.05
Sibagat 25.00
Negros Oriental 48
Dumaguete 51.08
National
Average
54.1 n/a
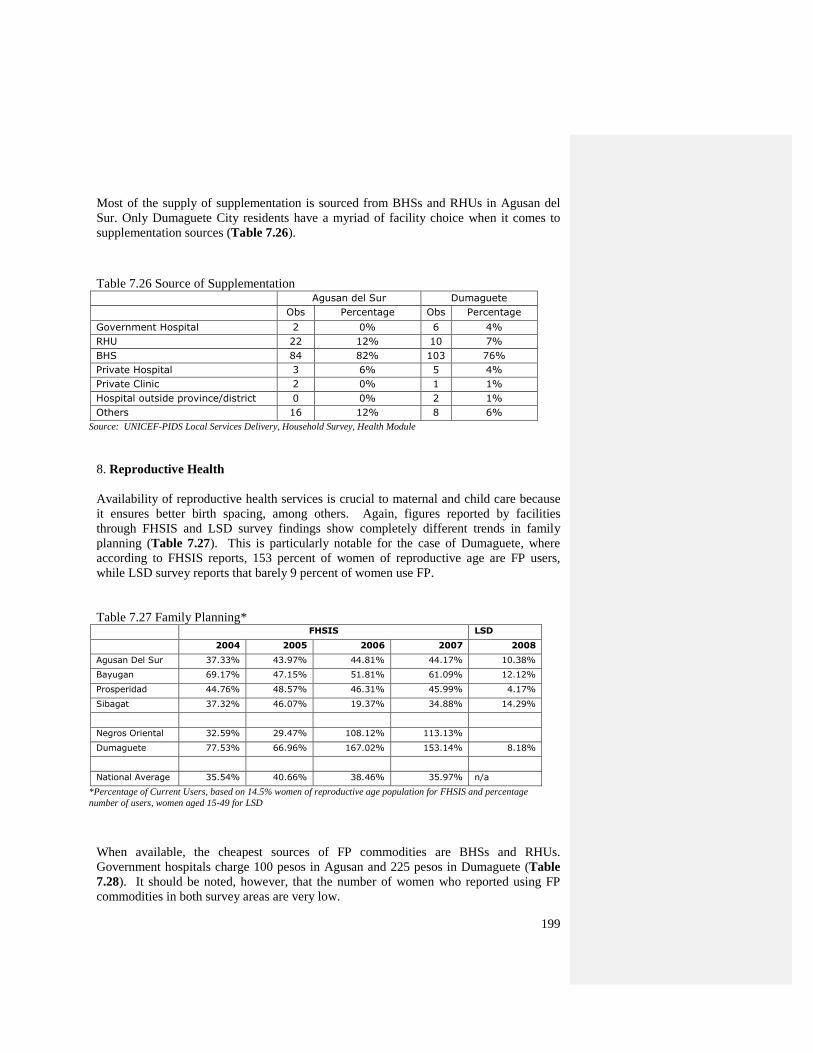
199
Most of the supply of supplementation is sourced from BHSs and RHUs in Agusan del
Sur. Only Dumaguete City residents have a myriad of facility choice when it comes to
supplementation sources (Table 7.26).
Table 7.26 Source of Supplementation Agusan del Sur Dumaguete
Obs Percentage Obs Percentage
Government Hospital 2 0% 6 4%
RHU 22 12% 10 7%
BHS 84 82% 103 76%
Private Hospital 3 6% 5 4%
Private Clinic 2 0% 1 1%
Hospital outside province/district 0 0% 2 1%
Others 16 12% 8 6%
Source: UNICEF-PIDS Local Services Delivery, Household Survey, Health Module
8. Reproductive Health
Availability of reproductive health services is crucial to maternal and child care because
it ensures better birth spacing, among others. Again, figures reported by facilities
through FHSIS and LSD survey findings show completely different trends in family
planning (Table 7.27). This is particularly notable for the case of Dumaguete, where
according to FHSIS reports, 153 percent of women of reproductive age are FP users,
while LSD survey reports that barely 9 percent of women use FP.
Table 7.27 Family Planning* FHSIS LSD
2004 2005 2006 2007 2008
Agusan Del Sur 37.33% 43.97% 44.81% 44.17% 10.38%
Bayugan 69.17% 47.15% 51.81% 61.09% 12.12%
Prosperidad 44.76% 48.57% 46.31% 45.99% 4.17%
Sibagat 37.32% 46.07% 19.37% 34.88% 14.29%
Negros Oriental 32.59% 29.47% 108.12% 113.13%
Dumaguete 77.53% 66.96% 167.02% 153.14% 8.18%
National Average 35.54% 40.66% 38.46% 35.97% n/a
*Percentage of Current Users, based on 14.5% women of reproductive age population for FHSIS and percentage
number of users, women aged 15-49 for LSD
When available, the cheapest sources of FP commodities are BHSs and RHUs.
Government hospitals charge 100 pesos in Agusan and 225 pesos in Dumaguete (Table
7.28). It should be noted, however, that the number of women who reported using FP
commodities in both survey areas are very low.
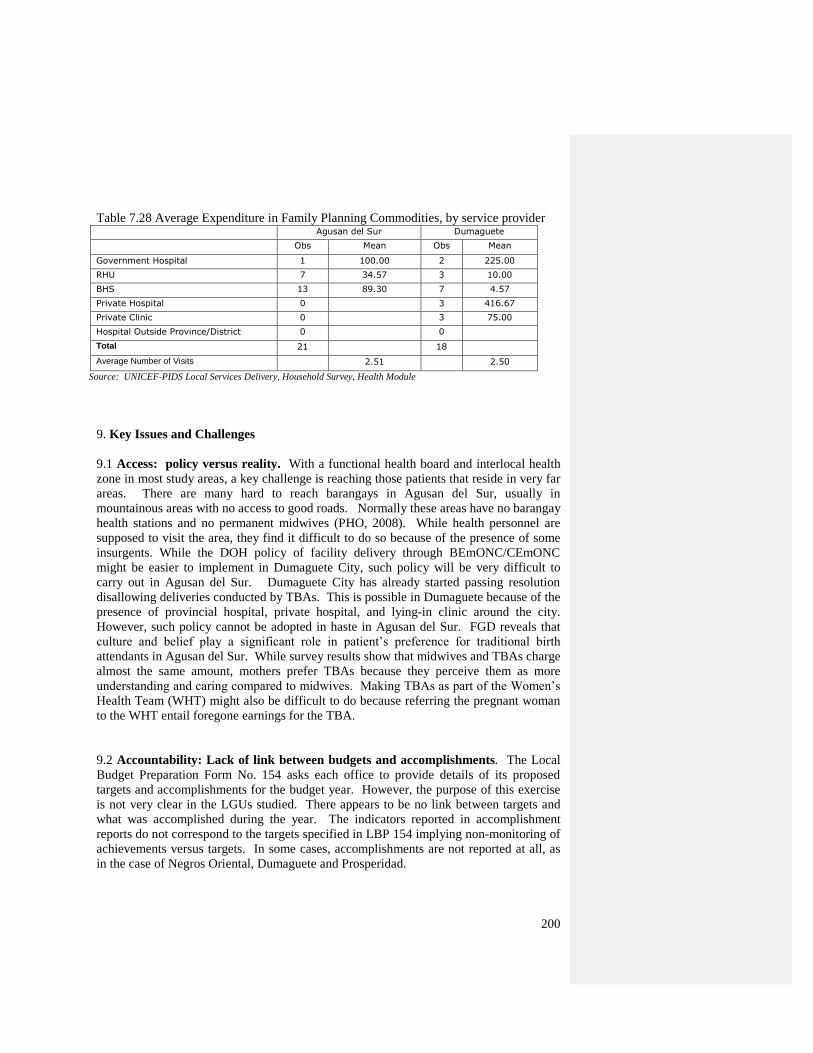
200
Table 7.28 Average Expenditure in Family Planning Commodities, by service provider Agusan del Sur Dumaguete
Obs Mean Obs Mean
Government Hospital 1 100.00 2 225.00
RHU 7 34.57 3 10.00
BHS 13 89.30 7 4.57
Private Hospital 0 3 416.67
Private Clinic 0 3 75.00
Hospital Outside Province/District 0 0
Total 21 18
Average Number of Visits 2.51 2.50
Source: UNICEF-PIDS Local Services Delivery, Household Survey, Health Module
9. Key Issues and Challenges
9.1 Access: policy versus reality. With a functional health board and interlocal health
zone in most study areas, a key challenge is reaching those patients that reside in very far
areas. There are many hard to reach barangays in Agusan del Sur, usually in
mountainous areas with no access to good roads. Normally these areas have no barangay
health stations and no permanent midwives (PHO, 2008). While health personnel are
supposed to visit the area, they find it difficult to do so because of the presence of some
insurgents. While the DOH policy of facility delivery through BEmONC/CEmONC
might be easier to implement in Dumaguete City, such policy will be very difficult to
carry out in Agusan del Sur. Dumaguete City has already started passing resolution
disallowing deliveries conducted by TBAs. This is possible in Dumaguete because of the
presence of provincial hospital, private hospital, and lying-in clinic around the city.
However, such policy cannot be adopted in haste in Agusan del Sur. FGD reveals that
culture and belief play a significant role in patient‘s preference for traditional birth
attendants in Agusan del Sur. While survey results show that midwives and TBAs charge
almost the same amount, mothers prefer TBAs because they perceive them as more
understanding and caring compared to midwives. Making TBAs as part of the Women‘s
Health Team (WHT) might also be difficult to do because referring the pregnant woman
to the WHT entail foregone earnings for the TBA.
9.2 Accountability: Lack of link between budgets and accomplishments. The Local
Budget Preparation Form No. 154 asks each office to provide details of its proposed
targets and accomplishments for the budget year. However, the purpose of this exercise
is not very clear in the LGUs studied. There appears to be no link between targets and
what was accomplished during the year. The indicators reported in accomplishment
reports do not correspond to the targets specified in LBP 154 implying non-monitoring of
achievements versus targets. In some cases, accomplishments are not reported at all, as
in the case of Negros Oriental, Dumaguete and Prosperidad.
201
9.3 Financing: Resources are not enough for non-DOH supported programs. An
inventory of supplies conducted at facilities utilized by household survey respondents
showed that facilities are well-stocked for vaccines, supplements and supplies that came
from DOH Central Office such as EPI vaccinations, Vit-A Supplements, Tetanus Toxoid
vaccines, and deworming tablets. However, for programs whose supplies are dependent
on LGU funds, availability is variable. For instance, based on the guidelines on antenatal
care, a pregnant woman should take at least 180 tablets of iron supplements to prevent
anemia. Most municipalities in the study areas find it difficult to comply with this
requirement due to limited funds. According to BHWs interviewed, what they normally
do when supplies are not enough is to give half and then issue a prescription for the
remaining tablets. Whether the patient will buy the prescription is left to their discretion.
9.4 Sustainability: Pantawid Pamilyang Pilipino Program (4Ps). The problem of
insufficient supply is evident in Sibagat, which is a pilot area of 4Ps. BHWs of recipient
barangays said that because of 4Ps, there was an influx of women who were subjecting
themselves to prenatal care as a condition to receive the cash transfer. This sudden
influx resulted to a lack of supply of iron supplements so much so that that most patients
were just given prescriptions.
9.5 Equity: User fees being charged by RHUs. To augment their limited funds for
health, Dumaguete City, Prosperidad and Sibagat issued resolutions to allow health
centers to collect user fees for some services offered by the CHO/RHU. In the case of
Sibagat, minimal fees are levied mostly for laboratory services, ranging from Php 5 for
urine analysis to Php 50 for pregnancy test. While the charges are minimal and are meant
to recover laboratory re-agents, they are charged to all patients, even to target clients such
as pregnant women. This is different in the case of Prosperidad that exempts target
clients from user fees.
9.6 Equity: Philhealth and the poor. According to PHO documents and interviews, of
the total indigent population identified from CBMS in Agusan del Sur, 34 percent were
enrolled in the sponsored program of Philhealth in 2008. Each of the provincial, city,
municipal government pays fifty percent of the LGU share to enroll indigents. While
official documents claim that 34 percent were enrolled in PHIC, it is difficult to ascertain
the strategy of LGUs in expanding coverage. It is possible that they are rotating handing
out of membership cards among indigent population. In the renewal of PHIC indigent
cards, sponsored members were normally asked to pay a counterpart amount of 300
pesos. Some FGD participants in Agusan del Sur reported that their counterpart was
collected from them but they were not issued any cards. There were also some
cardholders who were refused reimbursement by PHIC because their names were not
found in the membership roster. Stories like these make the villagers apprehensive in
renewing their membership.
PHIC beneficiaries also do not feel the benefits of Philhealth. OPB accreditation might
seem to benefit only the RHUs with the release of capitation fund per enrolled indigent.
In some RHUs, however, sponsored beneficiaries are not provided free preventive care
and laboratory services as stipulated in the package. This makes the sponsored indigent
feel that enrollment in Philhealth has no benefit.
202
Aside from this disincentive, Philhealth has been used as a tool for political patronage
and has aggravated inequality for subsidizing those who can afford to pay. While the
provision of the law engaging LGUs in the co-payment of indigents is laudable, the past
few years have shown that this program, when left to the hands of LCEs can become
another means of seeking political patronage. Past experiences have shown that indigent
enrollment rises during election years (such as in 2004). Also, there are numerous cases
that those given PHIC cards are not true indigents. This exacerbates inequality and
inefficiency because the government is subsidizing those who can afford.
9.7 Policy: LGU and Philhealth. Prior to PHIC indigent program, community health
insurance has been in existence in Negros Oriental. Called PESO for Health, the program
encourages members of the community to save in case of sickness in the future. When
PHIC cards were given in massive amounts in 2004, most of the members of PESO for
Health stopped contributing. Unfortunately, many of those who were given PHIC cards
were not renewed in 2005. The one time enrollment in PHIC not only destroyed the
PESO for Health Program, it also made many people uninsured.
During the time of interview, the provincial government of Negros Oriental was planning
to set-up their own health insurance. Rather than paying for PHIC LGU counterpart,
Negros Oriental will allocate that amount to set-up its own health insurance. This policy
of the province came about out of frustration with the changing rules in PHIC
accreditation.
9.8 Transparency: Barangay’s Role in Financing. The role that barangays have in the
provision of health care is not very clear. For barangays with very limited IRA, their role
is to pay for the utilities incurred by the BHS while for those with bigger budgets, they
are able to pay for the honoraria of their BHWs and BNSs, and procure drugs for their
constituents as well. Having an undefined role of the Barangay creates unnecessary
friction among health staff of different barangays.
9.9 Operational Efficiency: Personnel. Strategy papers and rationalization plans of
Agusan del Sur both highlighted shortage of personnel as main impediment to
implementation of maternal and child care programs. Due to shortage in nurses and
midwives, prenatal care services and immunization are scheduled only once a month.
With ceilings imposed by DBM on personal services, it is not possible for the LGUs to
create plantilla position to augment health staff. An interim solution is to hire casual
employees through job orders. The problem with this, however, is that casual employees
cannot be sent to DOH trainings. The temporary nature of their job also makes it difficult
to integrate them with the rest of health staff.
Barangay Health Workers in Agusan are required to report to BHS 23 times a year, or at
least once a week. The composition of their honoraria is partly from barangay, from the
203
city/municipality, and from the province. The main problem of BHWs in Agusan is the
security of tenure. There are cases that when a new Barangay official is elected in office,
they would also change their BHWs. According to midwives, this is an unfortunate
situation since training new BHWs takes a long time. It would also break the rapport that
the BHWs established with their clients already. This case does not happen in Dumaguete
City where there has been no case that Barangay Officials changed their BHWs. This is
because BHWs in the city are paid solely by the city. Unlike other LGUS, BHWs in
Dumaguete are not given honoraria, they are instead issued job order making them casual
employees of the city government. The BHWs in Dumaguete expressed that they believe
this system is better than the honoraria system they have before. The new arrangement
gives them incentive to report to work everyday given a no-work-no-pay scheme and to
follow-up all the patients in their target client list.
Unequal payments of magna carta benefits among LGUs also created some incentive
problems for health workers. For instance, health staff in Dumaguete feel underpaid
because they are one of the few LGUs in Negros Oriental who do not receive any magna
carta benefit, not even subsistence and laundry allowance. It appears that the issuance of
magna carta benefits is largely dependent on the priorities of the LCE and not on their
capacity to pay. It is notable that smaller municipalities like Sibagat and Prosperidad
were able to give benefits but cities with larger budgets such as Bayugan and Dumaguete
were unable to do so.
9.10 Allocative Efficiency: Procurement. While supplies for maternal programs and
EPI are taken cared of by the Central Office, the extent of LGUs involvement in
Integrated Management of Childhood Illnesses is not very clear. These programs entail
having a well-stocked supply of medicines, particularly antibiotics, in each facility. In
the facility survey, commonly used drugs for common ailments such as amoxicillin,
cotrimoxazole, oral anti-malarial, zinc supplements and ORT, are normally available, but
respondents say that they are unable to give the full dose to each patient because they
need to maintain a buffer stock in case of emergencies. Procurement of drugs at the LGU
level also appears to be inefficient. None of the surveyed LGUs cooperate with their
ILHZ for bulk purchase of drugs. Most of them procure their drugs through medical
representative of pharmaceutical companies which are normally more expensive than if
they procure generic drugs.
A summary of these issues is provided in the figure below:

204
Figure 7.3 Summary of Maternal and Child Health Issues in the Study Areas
Allocative
Efficiency:
Inefficient
Procurement
Operational
Efficiency
-Lack of personnel
-magna carta
payments
-tenure of BHWs
Accountability:
lack of link between budget
and
accomplishments
Transparency: Barangay‘s role in
health financing
Participation: Role of TBAs
in BEMOnC/CEMOncC
Equity: -user fees
-PHIC indigent program
Sustainability:
-supply side issues on 4Ps
-LGUs and PHIC
Policy Finance
Institutions
205
CHAPTER 8
Sector Analysis: Potable Water Supply
1. Major Programs, Activities, and Projects
1.1 Major Programs, Activities, and Projects in Dumaguete City.
There are three types of potable water systems in the Philippines and all exist in
Dumaguete City. In Dumaguete City, the service delivery of Level I water is currently
provided by both the public and private sectors. Level II water is also supplied by the
public sector while Level III water is sourced from the water district.
1.1.1 Dumaguete City Water District (DCWD). The program of providing level III
water to Dumaguete City became reality in 1977 with the establishment of the DCWD.
This water district is a government-owned and controlled corporation (GOCC) with
jurisdiction over the entire city. Its corporate mission is the satisfaction of its
concessionaires through efficient and effective quality water supply and service; assured
reasonable water rates and enhanced financial viability; and adherence with technological
advances and innovations.
Currently, the DCWD already has distribution lines in the entire Dumaguete City area.
Furthermore, it supplies water to about 95 percent of the households with the rest getting
water from Level I and Level II water systems in the city. At present, the district has a
staff of 171 employees, with 93 permanent and 78 casual employees. Of the permanent
employees, 11 are in management, 40 are in operations, and 42 are in maintenance and
support. Of the total employees, 19 are women of which one is in management and 18 are
in operations.
For its source of water, the DCWD operates 15 pumping stations around the city which
produce about 25,000 cubic meters of groundwater per day. The DCWD argues that the
quality of the water from its pumping stations is already good and the water itself is safe
for drinking. However, to ensure quality, the district does water treatment chlorination. It
also periodically collects water sample for analysis at the Silliman University laboratory
the results of which are then submitted to the Department of Health (DOH). In general,
the results indicate that quality of the water is good. For instance, in 2006, only 7 out of
209 water samples failed the bacteriological tests.
In 2006, the DCWD had estimated annual operations and maintenance costs of P96.8
million, annual collections of P108.9 million, total capital expenditures in the last 5 years
of P42.6 million and average capital expenditure per connection per year of P438.35. Of
the annual operating and maintenance costs of DCWD, an estimated 60 percent went to
personnel, 22 percent was spent on power and 18 percent was used for repair and
maintenance.
206
The sources of investment funds of the DCWD were government loans and externally-
generated sources. The former comprised 60 percent of the loans while the later
contributed 40 percent. Among the funding generated by the water district over the years
were the loan assistance from the Local Water Utilities Administration (LWUA) for its
Interim Improvement Project (IIP) in 1983 and the loan assistance from the Asian
Development Bank (ADB) loan-assisted Comprehensive Improvement Project (CIP) in
1994. Currently, the water district has an outstanding loan from the LWUA for which it
pays P1.6 million in amortization payments monthly through the Development Bank of
the Philippines (DBP).
In 2006, the DCWD had 29,419 service connections including 17,591 households, 256
public taps, 1,571 commercial establishments and 1 consumer classified as others.
Households, therefore, formed 59.8 percent of the customers of the water district.
Together with those using public taps, these households in the city consumed
approximately 55 percent of the 9,098,084 cubic meters of chlorinated water produced by
DCWD in 2006. Five percent of the water produced was for commercial use while 39
percent was unaccounted for (UFW).
Effective September 2005 up to the present, the tariff structure for DCWD is as follows
(Table 8.1). A minimum charge for the first 10 cubic meters or less of water consumption
was set at P220.00 for residential/government users and ranged from P210.00 to P240.00
for various types of semi-commercial and commercial users. A commodity charge was
then set by the DCWD for higher levels of consumption. In particular, for
residential/government consumption of 11-20 cubic meters, a charge of P13.50 per cubic
meter was set. On the other hand, the charge for commercial consumption ranges from
P23.60 toP27.00 per cubic meter depending on the type of commercial establishment. As
the volume of consumption increases, the commodity charge imposed also rises. The
charges indicate that semi-commercial and commercial users pay more than residential
and government users at the same consumption levels. This, therefore, is a socialized
pricing scheme where large commercial users pay more to subsidize the small consuming
but numerous households. In addition to the minimum and commodity charges, a price
for new connections of P2,870.00 was set payable prior to connection although the urban
poor are allowed to pay in instalment.
In 2008, the DCWD had an estimated value of fixed assets of P120 million, annual gross
revenues of P98 million, annual total costs of P89 million and annual net profits of P9
million. It pays a franchise tax to the Bureau of Internal Revenue (BIR) of 2 percent of its
gross revenues. The water district, therefore, is a positively earning GOCC. Of the price
of water that the water district gets from its consumers, approximately 60 percent goes to
operating costs, 20 percent to maintenance costs, 10 percent to expansion costs and 10
percent to profits.
As of 2005, the planned activities and projects of the DCWD from that year until 2010
included the following: a) construction of a new administrative building, b) professional
advance and physical and spiritual development of its employees, c) replacement of old
and dilapidated equipment, d) acquisition of refilling equipment, e) bringing down of
non-revenue water by 30 percent, f) increase in connection by 4,000 g) optimization of
water production and minimization of downtime, h) increase in the number of four-
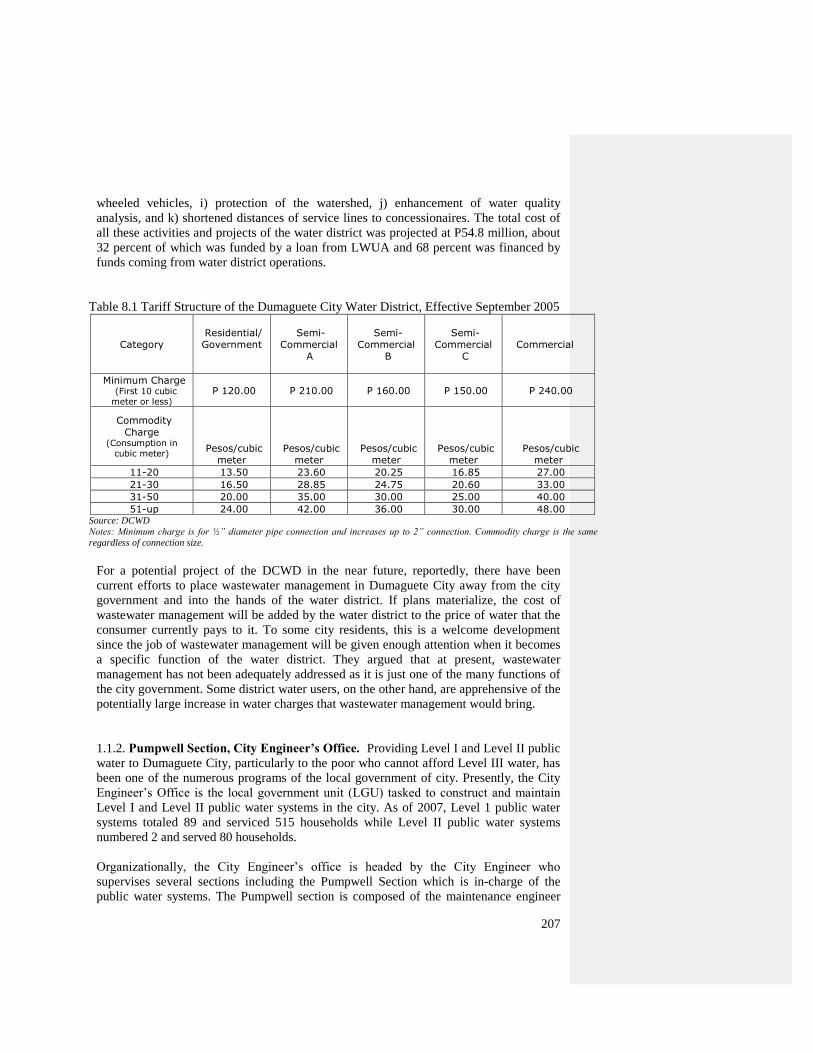
207
wheeled vehicles, i) protection of the watershed, j) enhancement of water quality
analysis, and k) shortened distances of service lines to concessionaires. The total cost of
all these activities and projects of the water district was projected at P54.8 million, about
32 percent of which was funded by a loan from LWUA and 68 percent was financed by
funds coming from water district operations.
Table 8.1 Tariff Structure of the Dumaguete City Water District, Effective September 2005
Category
Residential/ Government
Semi-Commercial
A
Semi-Commercial
B
Semi-Commercial
C
Commercial
Minimum Charge (First 10 cubic meter or less)
P 120.00 P 210.00 P 160.00 P 150.00 P 240.00
Commodity
Charge (Consumption in
cubic meter) Pesos/cubic
meter
Pesos/cubic
meter
Pesos/cubic
meter
Pesos/cubic
meter
Pesos/cubic
meter
11-20 13.50 23.60 20.25 16.85 27.00
21-30 16.50 28.85 24.75 20.60 33.00
31-50 20.00 35.00 30.00 25.00 40.00
51-up 24.00 42.00 36.00 30.00 48.00 Source: DCWD
Notes: Minimum charge is for ½” diameter pipe connection and increases up to 2” connection. Commodity charge is the same
regardless of connection size.
For a potential project of the DCWD in the near future, reportedly, there have been
current efforts to place wastewater management in Dumaguete City away from the city
government and into the hands of the water district. If plans materialize, the cost of
wastewater management will be added by the water district to the price of water that the
consumer currently pays to it. To some city residents, this is a welcome development
since the job of wastewater management will be given enough attention when it becomes
a specific function of the water district. They argued that at present, wastewater
management has not been adequately addressed as it is just one of the many functions of
the city government. Some district water users, on the other hand, are apprehensive of the
potentially large increase in water charges that wastewater management would bring.
1.1.2. Pumpwell Section, City Engineer’s Office. Providing Level I and Level II public
water to Dumaguete City, particularly to the poor who cannot afford Level III water, has
been one of the numerous programs of the local government of city. Presently, the City
Engineer‘s Office is the local government unit (LGU) tasked to construct and maintain
Level I and Level II public water systems in the city. As of 2007, Level 1 public water
systems totaled 89 and serviced 515 households while Level II public water systems
numbered 2 and served 80 households.
Organizationally, the City Engineer‘s office is headed by the City Engineer who
supervises several sections including the Pumpwell Section which is in-charge of the
public water systems. The Pumpwell section is composed of the maintenance engineer
208
and under him are 5 plumbers. All of these personnel are males. The jurisdiction of the
Pumpwell section is the entire Dumaguete City except the Poblacion which already has
100 percent water district connection. The section is specifically tasked to concentrate in
areas with no capability of getting water connection.
The budget that the Pumpwell Section uses for its operations is limited and comes from
different sources. For instance, in 2008, the Section got P11,000.00 quarterly or
P44,000.00 annually from the general funds of the city government for the repair and
maintenance of existing public water systems. Then, it also received P25,000.00 from the
City Planning and Development Office (CPDO) of Dumaguete City as counterpart
funding for the purchase of casings and other materials for the replacement of parts of
water pumps. Because the city is now generally covered by the water district, the
installation of public water systems is no longer afforded high priority by the city
government. Hence, the activities and projects of the Pumpwell Section usually deal only
on the repair and maintenance of existing public pumps.
1.1.3 Household Self-Providers. Aside from the local government of Dumaguete City,
some households self-provide Level I water. The actual establishment in the households
of these water systems are usually done by private business establishments and individual
contractors offering such services. As of 2007, there were 140 private Level I water
systems serving 148 self-providing households in the city.
1.1.4 Bottled Water and Refilled Water Producers. In addition to Levels I, II, and III
water, processed water in the forms of bottled water and refilled water are available in
Dumaguete City. There are an undetermined but gradually increasing number of bottled
water producers in the city. In 2007, there were also 20 water refilling stations. In some
cases, bottled water producers operate refilling stations and vice versa. In addition to
these processed water producers, businesses involved in this relatively new industry are
the numerous commercial, entertainment and similar establishments that sell in retail
bottled water.
One of the reasons why the sale of bottled water and refilled water in Dumaguete City is
relatively greater than in other areas in the province is its large tourist and educated
population. Both visitors and the large school population in the city would likely demand
bottled water and refilled water because of its health and safety features and because they
are unsure of other local potable water sources. Furthermore, the tourists in particular,
may also have a higher ability to pay for processed water compared to many other
population groups.
The programs, activities, and projects of bottled water and refilled water producers in
Dumaguete City vary. Because of increasing competition, some producers are active in
developing a distinctive brand name for their product in order to capture a niche of
customers. Others invest in business expansion to get a larger share of the market. Still
others develop tie-up with restaurants, hotels and similar large water consumers for the
exclusive delivery of processed water.
209
1.1.5 City Planning and Development Office (CPDO). The general function of the
CPDO is to plan the socioeconomic development of Dumaguete City. Aside from the
counterpart funds it gives to the Pumpwell Section, it plays a few functions related to
potable water management. Firstly, it monitors and regulates large-scale underground
water extraction. Specifically, for such type of extraction, one of the requirements that the
proponent has to comply is to get a permit from the city government through the CPDO.
Another function of the office is the maintenance of database on water extraction.
1.2 Major Programs, Activities, and Projects in Agusan del Sur.
As in Dumaguete City, Level I, Level II, and Level III water systems exist in Agusan del
Sur. The water service providers are also similar. The service delivery of Level I water is
done by both the public and private sectors. Level II water is provided by the public
sector while Level III water is delivered by the water districts and other similar public
water service providers.
1.2.1 Water and Sanitation (Watsan) Center. Presently, the task of providing Level I
and Level II public water systems in Agusan del Sur falls on the Watsan Center which is
an office under the provincial government. The Watsan Center was created in 1998 first
under the Provincial Planning and Development Office (PPDO) and later under the
Office of the Provincial Engineer. Its functions include the prioritization and
implementation of water and sanitation projects in the province, maintenance of a
databank on water and sanitation, identification of funding sources for water supply and
sanitation projects, setting up of the institutional development component of water supply
projects through trainings and seminars and sustained monitoring of the different
barangay water and sanitation associations (BWASAs).
The Watsan Center is headed by a chief who is an engineer. The center has 16 employees
including 6 regulars and 10 casuals. Of the staff, 1 is in management, 6 are in operations
and 9 are in maintenance and support. There are three women in the staff who works as
administrative support. The budget of the center was approximately 1.5 million in 2007
and P2 million in 2008.
The activities and projects of The Watsan Center in 2007 and 2008 included the
construction/installation/rehabilitation of water facilities in some municipalities (Table
8.2). Most of these facilities were shallow wells, of which 4 were constructed in 2007 and
22 were constructed in 2008.
At least one non-government organization (NGO) was involved in the provision of
potable water in Agusan del Sur. With funding from the Philippine-Canada Local
Government Program (LGSP), the Philippine Center for Water and Sanitation (PCWS)
helped the Watsan Center particularly in building its institutional capacity as well as
those of the other LGUs and the local communities involved in potable water
management and provision (ADB 2006). In one particular project, the PCWS assisted in
providing a potable water system to all households in the barangay of Dona Flavia in the
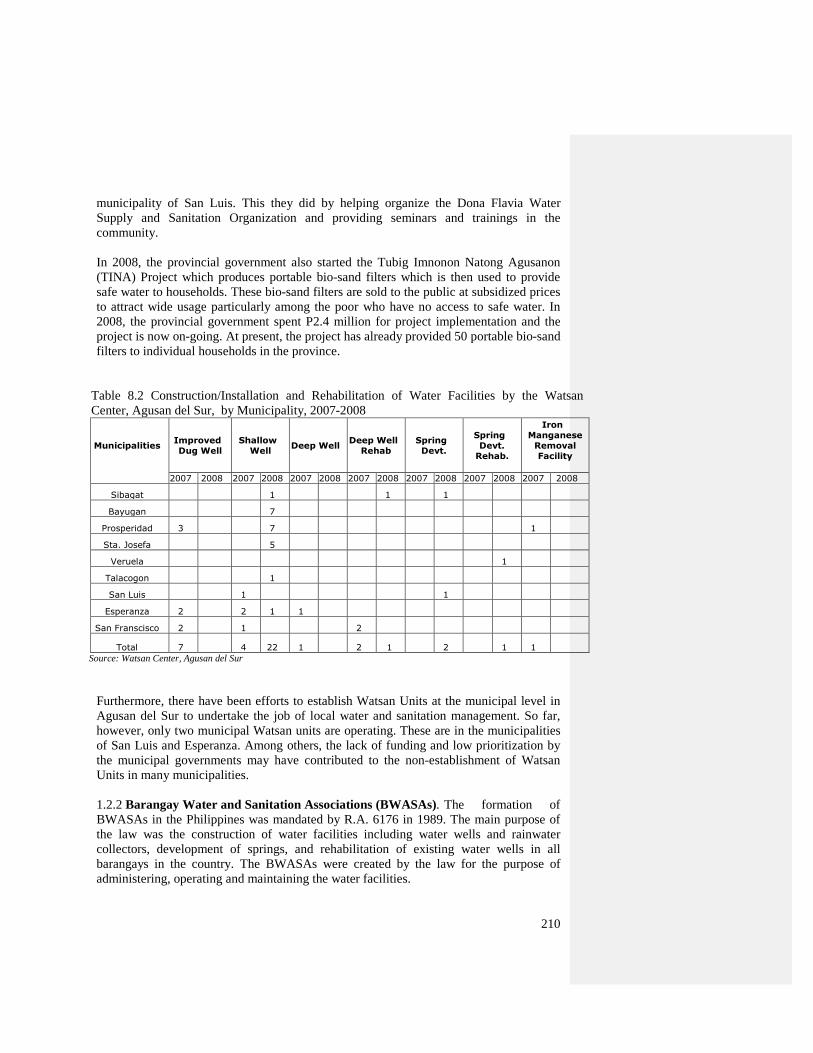
210
municipality of San Luis. This they did by helping organize the Dona Flavia Water
Supply and Sanitation Organization and providing seminars and trainings in the
community.
In 2008, the provincial government also started the Tubig Imnonon Natong Agusanon
(TINA) Project which produces portable bio-sand filters which is then used to provide
safe water to households. These bio-sand filters are sold to the public at subsidized prices
to attract wide usage particularly among the poor who have no access to safe water. In
2008, the provincial government spent P2.4 million for project implementation and the
project is now on-going. At present, the project has already provided 50 portable bio-sand
filters to individual households in the province.
Table 8.2 Construction/Installation and Rehabilitation of Water Facilities by the Watsan
Center, Agusan del Sur, by Municipality, 2007-2008
Municipalities Improved Dug Well
Shallow Well
Deep Well Deep Well
Rehab Spring Devt.
Spring Devt.
Rehab.
Iron Manganese
Removal Facility
2007 2008 2007 2008 2007 2008 2007 2008 2007 2008 2007 2008 2007 2008
Sibagat 1 1 1
Bayugan 7
Prosperidad 3 7 1
Sta. Josefa 5
Veruela 1
Talacogon 1
San Luis 1 1
Esperanza 2 2 1 1
San Franscisco 2 1 2
Total 7 4 22 1 2 1 2 1 1
Source: Watsan Center, Agusan del Sur
Furthermore, there have been efforts to establish Watsan Units at the municipal level in
Agusan del Sur to undertake the job of local water and sanitation management. So far,
however, only two municipal Watsan units are operating. These are in the municipalities
of San Luis and Esperanza. Among others, the lack of funding and low prioritization by
the municipal governments may have contributed to the non-establishment of Watsan
Units in many municipalities.
1.2.2 Barangay Water and Sanitation Associations (BWASAs). The formation of
BWASAs in the Philippines was mandated by R.A. 6176 in 1989. The main purpose of
the law was the construction of water facilities including water wells and rainwater
collectors, development of springs, and rehabilitation of existing water wells in all
barangays in the country. The BWASAs were created by the law for the purpose of
administering, operating and maintaining the water facilities.
211
The organizational structure of the officers of a typical BWASA in Agusan del Sur is
composed of a Board of Directors with a chairman, vice-chairman and about 6 members.
Under them are the secretary, treasurer and auditor. The BWASA usually also has a
support staff composed of a book keeper and caretaker. The primary financial sources of
funds of the BWASAs are the membership fee, cash contributions, penalties and water
user fees. The Secondary fund sources of the organization are the barangay, municipal
and provincial LGUs and NGOs.
The BWASAs in Agusan del Sur collect water user fees generally for system
construction, system operation, system maintenance and repair, and system improvement
and expansion. Generally, a single formula is followed in the computation of the monthly
water tariff of BWASAs. However, the final monthly water tariff arrived at is also
approved by the officers and membership of the BWASAs before it can be implemented.
The formula is as follows:
Average Water Tariff (AWT) = (Operation and Maintenance Cost (OMC) +
Annual Depreciation Cost (ADC) )/Number of Households Served
where ADC = Total Project Cost (TPC) / Design Life (Years).
The monthly water tariff for individual member households is then
computed as:
Monthly Water Tariff (MWT) = AWT + 35% (AWT)
where the 35 percent is the allotment for the improvement and expansion of facilities and
equipment.
Since 1999, 179 BWASAs have been organized by the Watsan Center in 14
municipalities in Agusan del Sur (Table 8.3). The most number of BWASAs were in
Prosperidad, Bayugan and San Francisco. The least number organized were in Esperanza
and Talacogon. At present, however, only a limited number of BWASAs are fully
functioning. There are several reasons why a BWASA does not fully operate or is not
operating. These include a) organizational conflicts among and between officers and
members, b) lack of repair and maintenance resulting to dilapidated facilities and
equipment, c) non-payment or low payment rates of dues and water charges by members,
and d) poor leadership and management skills of officers, among others.
Of the BWASAs fully functioning at present in Agusan del Sur, one is in Barangay Awa
in the municipality of Prosperidad. This BWASA has 14 officers and 106 members. More
than half of the members are women. Its coverage is Purok 1, 4, and 5 in the barangay
which have a total population of 120 households. Not all the households in the 3 puroks
were members of the BWASA because other households have other options for sourcing
potable water.
While some BWASAs are not functioning at present, key informants mentioned that
those that are functioning have contributed a lot in the provision of potable water in their
areas. They argued that the BWASAs should be strongly supported by the government
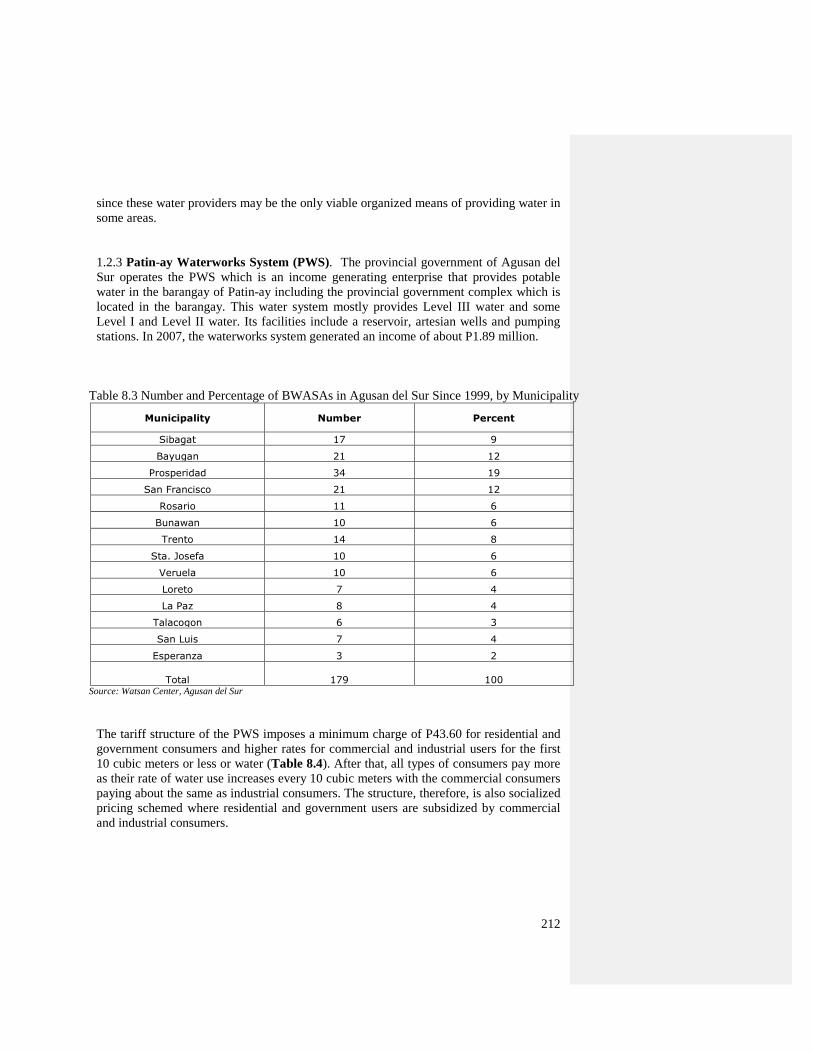
212
since these water providers may be the only viable organized means of providing water in
some areas.
1.2.3 Patin-ay Waterworks System (PWS). The provincial government of Agusan del
Sur operates the PWS which is an income generating enterprise that provides potable
water in the barangay of Patin-ay including the provincial government complex which is
located in the barangay. This water system mostly provides Level III water and some
Level I and Level II water. Its facilities include a reservoir, artesian wells and pumping
stations. In 2007, the waterworks system generated an income of about P1.89 million.
Table 8.3 Number and Percentage of BWASAs in Agusan del Sur Since 1999, by Municipality
Municipality Number Percent
Sibagat 17 9
Bayugan 21 12
Prosperidad 34 19
San Francisco 21 12
Rosario 11 6
Bunawan 10 6
Trento 14 8
Sta. Josefa 10 6
Veruela 10 6
Loreto 7 4
La Paz 8 4
Talacogon 6 3
San Luis 7 4
Esperanza 3 2
Total
179 100 Source: Watsan Center, Agusan del Sur
The tariff structure of the PWS imposes a minimum charge of P43.60 for residential and
government consumers and higher rates for commercial and industrial users for the first
10 cubic meters or less or water (Table 8.4). After that, all types of consumers pay more
as their rate of water use increases every 10 cubic meters with the commercial consumers
paying about the same as industrial consumers. The structure, therefore, is also socialized
pricing schemed where residential and government users are subsidized by commercial
and industrial consumers.
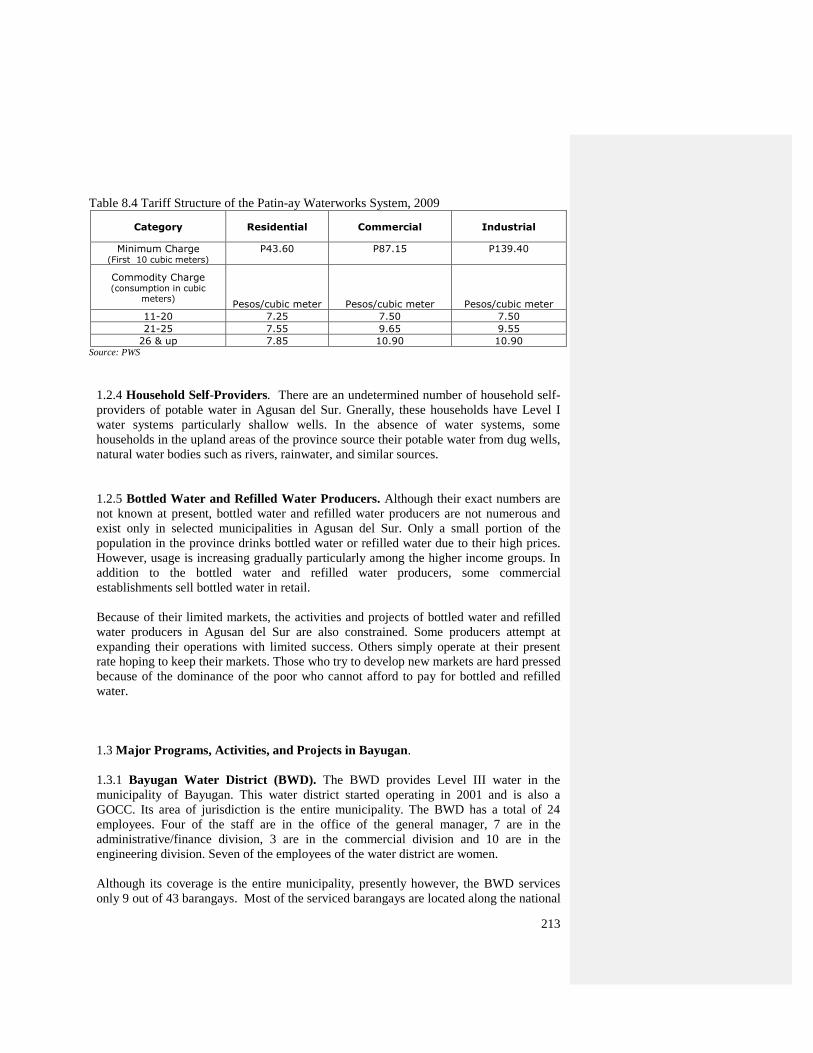
213
Table 8.4 Tariff Structure of the Patin-ay Waterworks System, 2009
Category Residential Commercial Industrial
Minimum Charge (First 10 cubic meters)
P43.60 P87.15 P139.40
Commodity Charge (consumption in cubic
meters) Pesos/cubic meter Pesos/cubic meter Pesos/cubic meter
11-20 7.25 7.50 7.50
21-25 7.55 9.65 9.55
26 & up 7.85 10.90 10.90 Source: PWS
1.2.4 Household Self-Providers. There are an undetermined number of household self-
providers of potable water in Agusan del Sur. Gnerally, these households have Level I
water systems particularly shallow wells. In the absence of water systems, some
households in the upland areas of the province source their potable water from dug wells,
natural water bodies such as rivers, rainwater, and similar sources.
1.2.5 Bottled Water and Refilled Water Producers. Although their exact numbers are
not known at present, bottled water and refilled water producers are not numerous and
exist only in selected municipalities in Agusan del Sur. Only a small portion of the
population in the province drinks bottled water or refilled water due to their high prices.
However, usage is increasing gradually particularly among the higher income groups. In
addition to the bottled water and refilled water producers, some commercial
establishments sell bottled water in retail.
Because of their limited markets, the activities and projects of bottled water and refilled
water producers in Agusan del Sur are also constrained. Some producers attempt at
expanding their operations with limited success. Others simply operate at their present
rate hoping to keep their markets. Those who try to develop new markets are hard pressed
because of the dominance of the poor who cannot afford to pay for bottled and refilled
water.
1.3 Major Programs, Activities, and Projects in Bayugan.
1.3.1 Bayugan Water District (BWD). The BWD provides Level III water in the
municipality of Bayugan. This water district started operating in 2001 and is also a
GOCC. Its area of jurisdiction is the entire municipality. The BWD has a total of 24
employees. Four of the staff are in the office of the general manager, 7 are in the
administrative/finance division, 3 are in the commercial division and 10 are in the
engineering division. Seven of the employees of the water district are women.
Although its coverage is the entire municipality, presently however, the BWD services
only 9 out of 43 barangays. Most of the serviced barangays are located along the national
214
highway. As of 2008, the water district provided water to 2,325 households which formed
13.6 percent of the total households in the municipality. In terms of financing, when it
started, the BWD received a loan from LWUA of P63 million for establishment and
operations. Currently, the water district has an estimated total fixed assets of P78 million.
In 2008, it had an estimated annual total revenues of P15 million, annual total costs of
P18 million and an annual net loss of P3 million. So far, therefore, the BWD is a losing
GOCC.
The sources of water of the BWD are the natural springs located in a 3,201 hectare
watershed in the barangay of Pinagalaan which is about 6 kilometers from the poblacion.
During the dry season when spring water is at a low level, the water district pumps water
through its pumping station in the barangay of Noli which is about the same distance
from the poblacion as Pinagalaan but in the opposite side of the municipality. For water
treatment, the water district applies chlorination. Furthermore, it undertakes on-field
testing twice a year for the quality of the spring water coming from the watershed.
Of the consumers of the BWD, an estimated 80 percent are households while the rest are
commercial establishments, commercial (industrial) establishments and municipal and
barangay LGUs. Each household is estimated to consume an average of 16 cubic meters
per month. A commercial establishment approximately uses from 20 to 45 cubic meters
of water per month. The municipal government consumes an average of 145 cubic meters
of water per month while each barangay government uses an average of 10 cubic meters
per month. An estimated 20 percent of the water produced by BWD is non-revenue
water.
The tariff structure of the BWD for 2009 show a minimum charge of P204.80 for
residential and government consumers and higher rates for different types of commercial
and commercial (industrial) consumers for the first 10 cubic meters or less or water
(Table 8.5). After that, all types of consumers pay more as their rate of water use
increases every 10 cubic meters with the commercial consumers paying less than twice
and the commercial (industrial) consumers about twice that paid by residential and
government consumers. The structure, therefore, is another socialized pricing schemed
like other sources of Level III water where residential and government users are
subsidized by commercial and commercial (industrial) users.
The process of the determination of the tariff structure of the BWD, however, is different
from that of other water districts in that the LWUA directly sets the tariff structure
without consultation with the consuming public. The LWUA sets the specific tariff
structure purposely for the water district to be able to pay its loan. In addition to the tariff
structure, consumers pay a one-time connection fee of P2,500.00. Furthermore,
consumers are also made to pay a penalty fee of 10 percent of the water bill in the event
of unreasonable delay in payment.
1.3.2 Municipal Mayor’s Office of Bayugan. The Municipal Mayor‘s Office of
Bayugan is the one undertaking the provision of Level I and Level II water systems to the
public at present. In this set-up, a sitio for instance may petition the barangay government
for a shallow well which in turn requests the Mayor‘s Office for the provision of one.
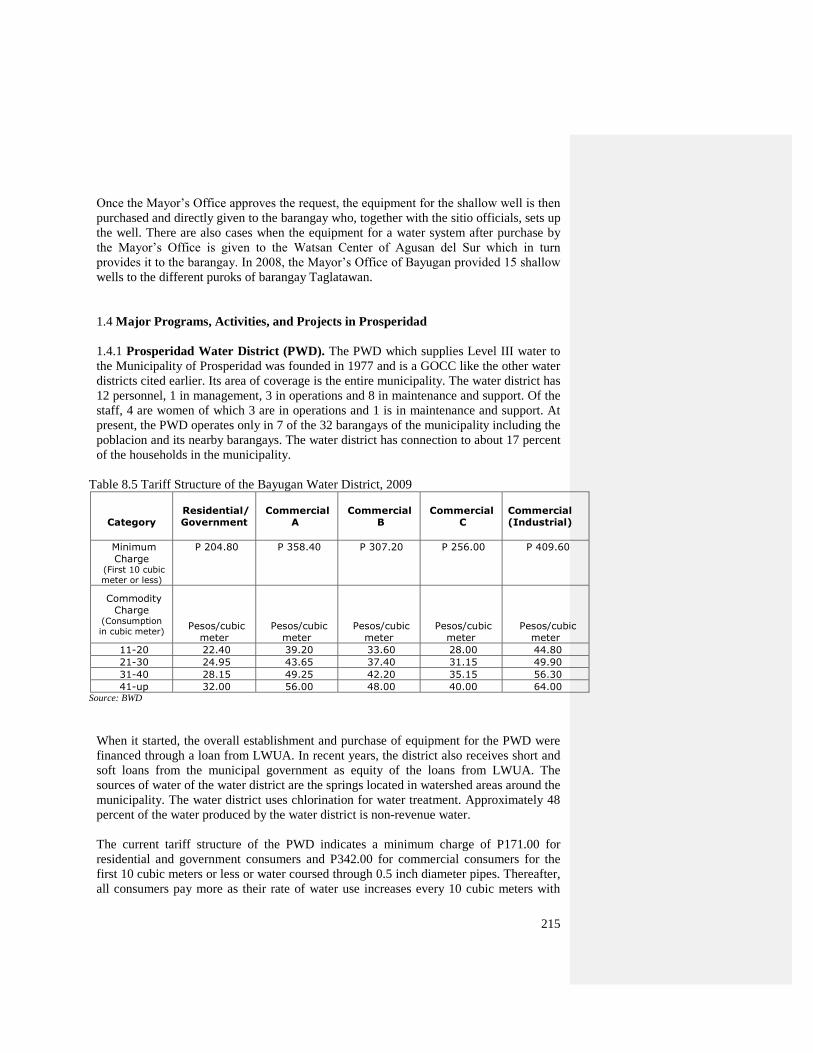
215
Once the Mayor‘s Office approves the request, the equipment for the shallow well is then
purchased and directly given to the barangay who, together with the sitio officials, sets up
the well. There are also cases when the equipment for a water system after purchase by
the Mayor‘s Office is given to the Watsan Center of Agusan del Sur which in turn
provides it to the barangay. In 2008, the Mayor‘s Office of Bayugan provided 15 shallow
wells to the different puroks of barangay Taglatawan.
1.4 Major Programs, Activities, and Projects in Prosperidad
1.4.1 Prosperidad Water District (PWD). The PWD which supplies Level III water to
the Municipality of Prosperidad was founded in 1977 and is a GOCC like the other water
districts cited earlier. Its area of coverage is the entire municipality. The water district has
12 personnel, 1 in management, 3 in operations and 8 in maintenance and support. Of the
staff, 4 are women of which 3 are in operations and 1 is in maintenance and support. At
present, the PWD operates only in 7 of the 32 barangays of the municipality including the
poblacion and its nearby barangays. The water district has connection to about 17 percent
of the households in the municipality.
Table 8.5 Tariff Structure of the Bayugan Water District, 2009
Category
Residential/
Government
Commercial
A
Commercial
B
Commercial
C
Commercial
(Industrial)
Minimum
Charge (First 10 cubic meter or less)
P 204.80 P 358.40 P 307.20 P 256.00 P 409.60
Commodity
Charge (Consumption in cubic meter)
Pesos/cubic
meter
Pesos/cubic
meter
Pesos/cubic
meter
Pesos/cubic
meter
Pesos/cubic
meter
11-20 22.40 39.20 33.60 28.00 44.80
21-30 24.95 43.65 37.40 31.15 49.90
31-40 28.15 49.25 42.20 35.15 56.30
41-up 32.00 56.00 48.00 40.00 64.00 Source: BWD
When it started, the overall establishment and purchase of equipment for the PWD were
financed through a loan from LWUA. In recent years, the district also receives short and
soft loans from the municipal government as equity of the loans from LWUA. The
sources of water of the water district are the springs located in watershed areas around the
municipality. The water district uses chlorination for water treatment. Approximately 48
percent of the water produced by the water district is non-revenue water.
The current tariff structure of the PWD indicates a minimum charge of P171.00 for
residential and government consumers and P342.00 for commercial consumers for the
first 10 cubic meters or less or water coursed through 0.5 inch diameter pipes. Thereafter,
all consumers pay more as their rate of water use increases every 10 cubic meters with
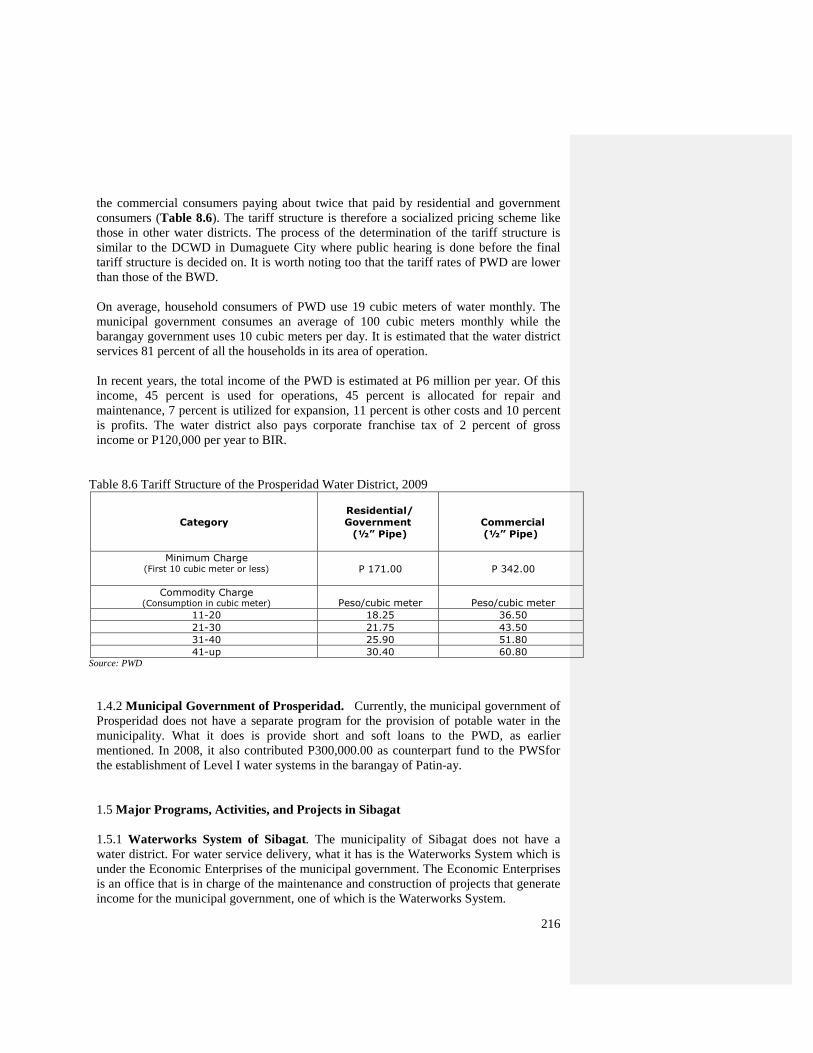
216
the commercial consumers paying about twice that paid by residential and government
consumers (Table 8.6). The tariff structure is therefore a socialized pricing scheme like
those in other water districts. The process of the determination of the tariff structure is
similar to the DCWD in Dumaguete City where public hearing is done before the final
tariff structure is decided on. It is worth noting too that the tariff rates of PWD are lower
than those of the BWD.
On average, household consumers of PWD use 19 cubic meters of water monthly. The
municipal government consumes an average of 100 cubic meters monthly while the
barangay government uses 10 cubic meters per day. It is estimated that the water district
services 81 percent of all the households in its area of operation.
In recent years, the total income of the PWD is estimated at P6 million per year. Of this
income, 45 percent is used for operations, 45 percent is allocated for repair and
maintenance, 7 percent is utilized for expansion, 11 percent is other costs and 10 percent
is profits. The water district also pays corporate franchise tax of 2 percent of gross
income or P120,000 per year to BIR.
Table 8.6 Tariff Structure of the Prosperidad Water District, 2009
Category
Residential/
Government
(½” Pipe)
Commercial
(½” Pipe)
Minimum Charge (First 10 cubic meter or less)
P 171.00 P 342.00
Commodity Charge (Consumption in cubic meter) Peso/cubic meter Peso/cubic meter
11-20 18.25 36.50
21-30 21.75 43.50
31-40 25.90 51.80
41-up 30.40 60.80 Source: PWD
1.4.2 Municipal Government of Prosperidad. Currently, the municipal government of
Prosperidad does not have a separate program for the provision of potable water in the
municipality. What it does is provide short and soft loans to the PWD, as earlier
mentioned. In 2008, it also contributed P300,000.00 as counterpart fund to the PWSfor
the establishment of Level I water systems in the barangay of Patin-ay.
1.5 Major Programs, Activities, and Projects in Sibagat
1.5.1 Waterworks System of Sibagat. The municipality of Sibagat does not have a
water district. For water service delivery, what it has is the Waterworks System which is
under the Economic Enterprises of the municipal government. The Economic Enterprises
is an office that is in charge of the maintenance and construction of projects that generate
income for the municipal government, one of which is the Waterworks System.
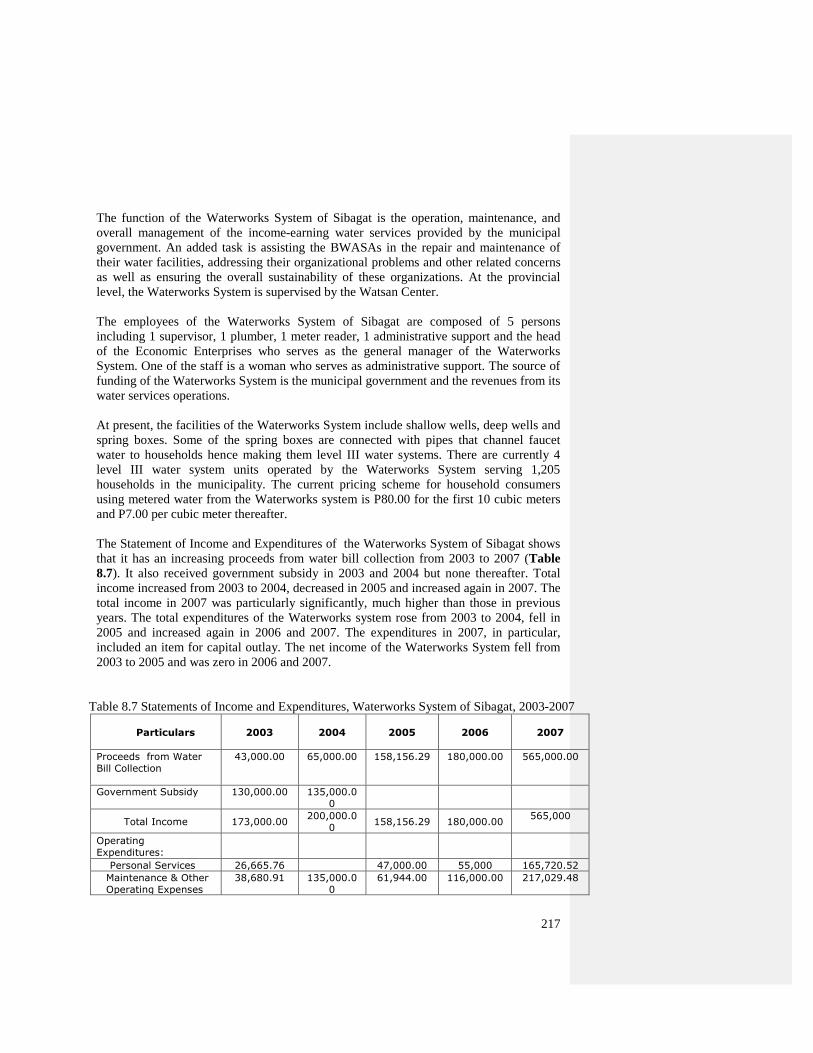
217
The function of the Waterworks System of Sibagat is the operation, maintenance, and
overall management of the income-earning water services provided by the municipal
government. An added task is assisting the BWASAs in the repair and maintenance of
their water facilities, addressing their organizational problems and other related concerns
as well as ensuring the overall sustainability of these organizations. At the provincial
level, the Waterworks System is supervised by the Watsan Center.
The employees of the Waterworks System of Sibagat are composed of 5 persons
including 1 supervisor, 1 plumber, 1 meter reader, 1 administrative support and the head
of the Economic Enterprises who serves as the general manager of the Waterworks
System. One of the staff is a woman who serves as administrative support. The source of
funding of the Waterworks System is the municipal government and the revenues from its
water services operations.
At present, the facilities of the Waterworks System include shallow wells, deep wells and
spring boxes. Some of the spring boxes are connected with pipes that channel faucet
water to households hence making them level III water systems. There are currently 4
level III water system units operated by the Waterworks System serving 1,205
households in the municipality. The current pricing scheme for household consumers
using metered water from the Waterworks system is P80.00 for the first 10 cubic meters
and P7.00 per cubic meter thereafter.
The Statement of Income and Expenditures of the Waterworks System of Sibagat shows
that it has an increasing proceeds from water bill collection from 2003 to 2007 (Table
8.7). It also received government subsidy in 2003 and 2004 but none thereafter. Total
income increased from 2003 to 2004, decreased in 2005 and increased again in 2007. The
total income in 2007 was particularly significantly, much higher than those in previous
years. The total expenditures of the Waterworks system rose from 2003 to 2004, fell in
2005 and increased again in 2006 and 2007. The expenditures in 2007, in particular,
included an item for capital outlay. The net income of the Waterworks System fell from
2003 to 2005 and was zero in 2006 and 2007.
Table 8.7 Statements of Income and Expenditures, Waterworks System of Sibagat, 2003-2007
Particulars
2003
2004
2005
2006
2007
Proceeds from Water
Bill Collection
43,000.00 65,000.00 158,156.29 180,000.00 565,000.00
Government Subsidy 130,000.00 135,000.0
0
Total Income 173,000.00 200,000.0
0 158,156.29 180,000.00
565,000
Operating Expenditures:
Personal Services 26,665.76 47,000.00 55,000 165,720.52
Maintenance & Other
Operating Expenses
38,680.91 135,000.0
0
61,944.00 116,000.00
217,029.48
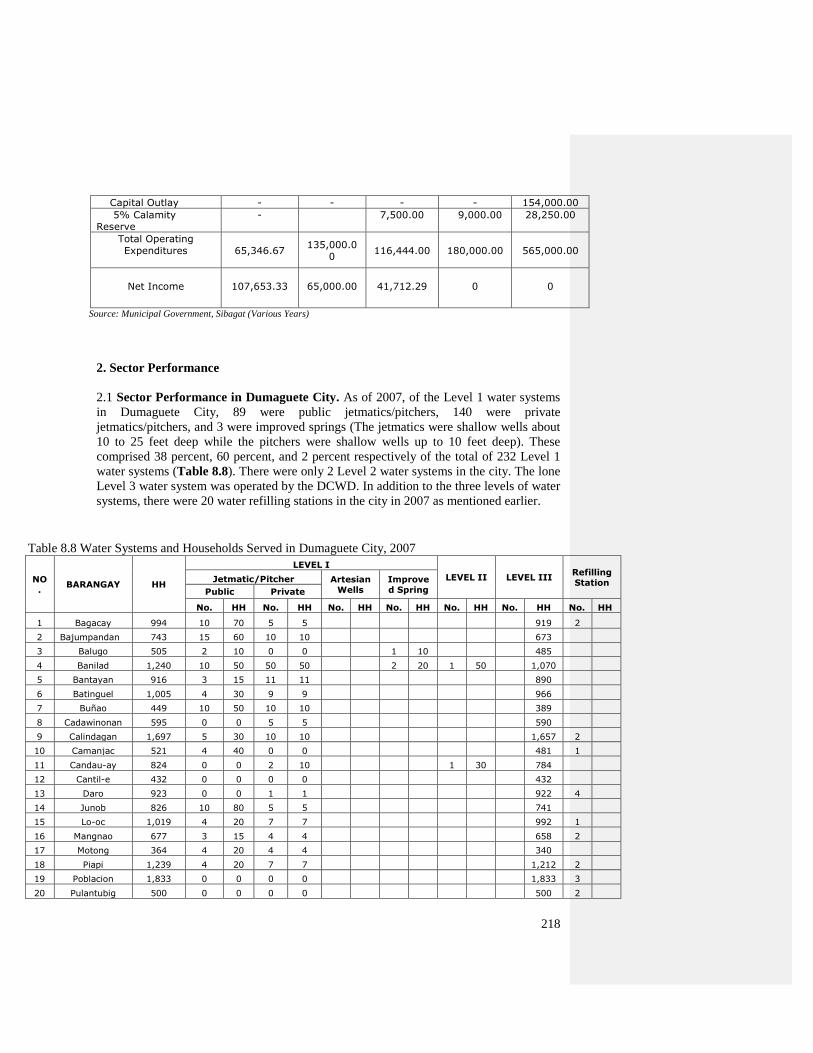
218
Capital Outlay - - - - 154,000.00
5% Calamity Reserve
- 7,500.00 9,000.00 28,250.00
Total Operating
Expenditures
65,346.67 135,000.0
0 116,444.00 180,000.00 565,000.00
Net Income
107,653.33
65,000.00
41,712.29
0
0
Source: Municipal Government, Sibagat (Various Years)
2. Sector Performance
2.1 Sector Performance in Dumaguete City. As of 2007, of the Level 1 water systems
in Dumaguete City, 89 were public jetmatics/pitchers, 140 were private
jetmatics/pitchers, and 3 were improved springs (The jetmatics were shallow wells about
10 to 25 feet deep while the pitchers were shallow wells up to 10 feet deep). These
comprised 38 percent, 60 percent, and 2 percent respectively of the total of 232 Level 1
water systems (Table 8.8). There were only 2 Level 2 water systems in the city. The lone
Level 3 water system was operated by the DCWD. In addition to the three levels of water
systems, there were 20 water refilling stations in the city in 2007 as mentioned earlier.
Table 8.8 Water Systems and Households Served in Dumaguete City, 2007
NO.
BARANGAY HH
LEVEL I
LEVEL II LEVEL III Refilling Station Jetmatic/Pitcher Artesian
Wells Improved Spring Public Private
No. HH No. HH No. HH No. HH No. HH No. HH No. HH
1 Bagacay 994 10 70 5 5 919 2
2 Bajumpandan 743 15 60 10 10 673
3 Balugo 505 2 10 0 0 1 10 485
4 Banilad 1,240 10 50 50 50 2 20 1 50 1,070
5 Bantayan 916 3 15 11 11 890
6 Batinguel 1,005 4 30 9 9 966
7 Buñao 449 10 50 10 10 389
8 Cadawinonan 595 0 0 5 5 590
9 Calindagan 1,697 5 30 10 10 1,657 2
10 Camanjac 521 4 40 0 0 481 1
11 Candau-ay 824 0 0 2 10 1 30 784
12 Cantil-e 432 0 0 0 0 432
13 Daro 923 0 0 1 1 922 4
14 Junob 826 10 80 5 5 741
15 Lo-oc 1,019 4 20 7 7 992 1
16 Mangnao 677 3 15 4 4 658 2
17 Motong 364 4 20 4 4 340
18 Piapi 1,239 4 20 7 7 1,212 2
19 Poblacion 1,833 0 0 0 0 1,833 3
20 Pulantubig 500 0 0 0 0 500 2
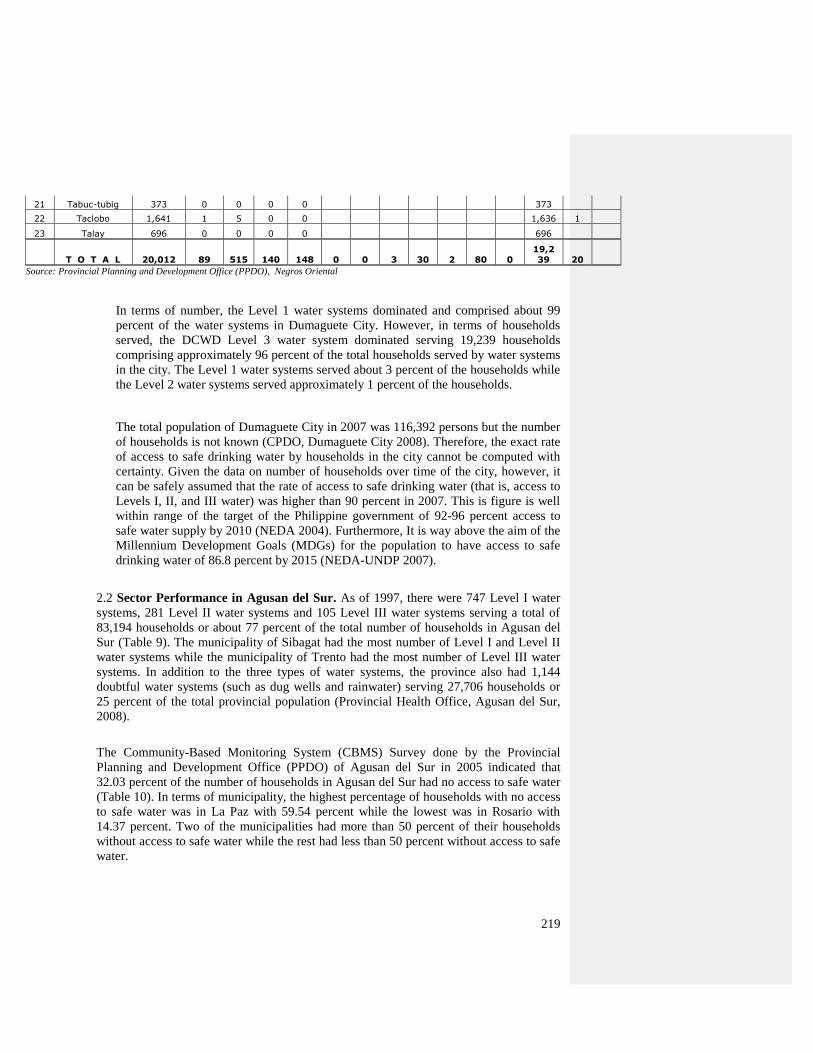
219
21 Tabuc-tubig 373 0 0 0 0 373
22 Taclobo 1,641 1 5 0 0 1,636 1
23 Talay 696 0 0 0 0 696
T O T A L 20,012 89 515 140 148 0 0 3 30 2 80 0 19,239 20
Source: Provincial Planning and Development Office (PPDO), Negros Oriental
In terms of number, the Level 1 water systems dominated and comprised about 99
percent of the water systems in Dumaguete City. However, in terms of households
served, the DCWD Level 3 water system dominated serving 19,239 households
comprising approximately 96 percent of the total households served by water systems
in the city. The Level 1 water systems served about 3 percent of the households while
the Level 2 water systems served approximately 1 percent of the households.
The total population of Dumaguete City in 2007 was 116,392 persons but the number
of households is not known (CPDO, Dumaguete City 2008). Therefore, the exact rate
of access to safe drinking water by households in the city cannot be computed with
certainty. Given the data on number of households over time of the city, however, it
can be safely assumed that the rate of access to safe drinking water (that is, access to
Levels I, II, and III water) was higher than 90 percent in 2007. This is figure is well
within range of the target of the Philippine government of 92-96 percent access to
safe water supply by 2010 (NEDA 2004). Furthermore, It is way above the aim of the
Millennium Development Goals (MDGs) for the population to have access to safe
drinking water of 86.8 percent by 2015 (NEDA-UNDP 2007).
2.2 Sector Performance in Agusan del Sur. As of 1997, there were 747 Level I water
systems, 281 Level II water systems and 105 Level III water systems serving a total of
83,194 households or about 77 percent of the total number of households in Agusan del
Sur (Table 9). The municipality of Sibagat had the most number of Level I and Level II
water systems while the municipality of Trento had the most number of Level III water
systems. In addition to the three types of water systems, the province also had 1,144
doubtful water systems (such as dug wells and rainwater) serving 27,706 households or
25 percent of the total provincial population (Provincial Health Office, Agusan del Sur,
2008).
The Community-Based Monitoring System (CBMS) Survey done by the Provincial
Planning and Development Office (PPDO) of Agusan del Sur in 2005 indicated that
32.03 percent of the number of households in Agusan del Sur had no access to safe water
(Table 10). In terms of municipality, the highest percentage of households with no access
to safe water was in La Paz with 59.54 percent while the lowest was in Rosario with
14.37 percent. Two of the municipalities had more than 50 percent of their households
without access to safe water while the rest had less than 50 percent without access to safe
water.
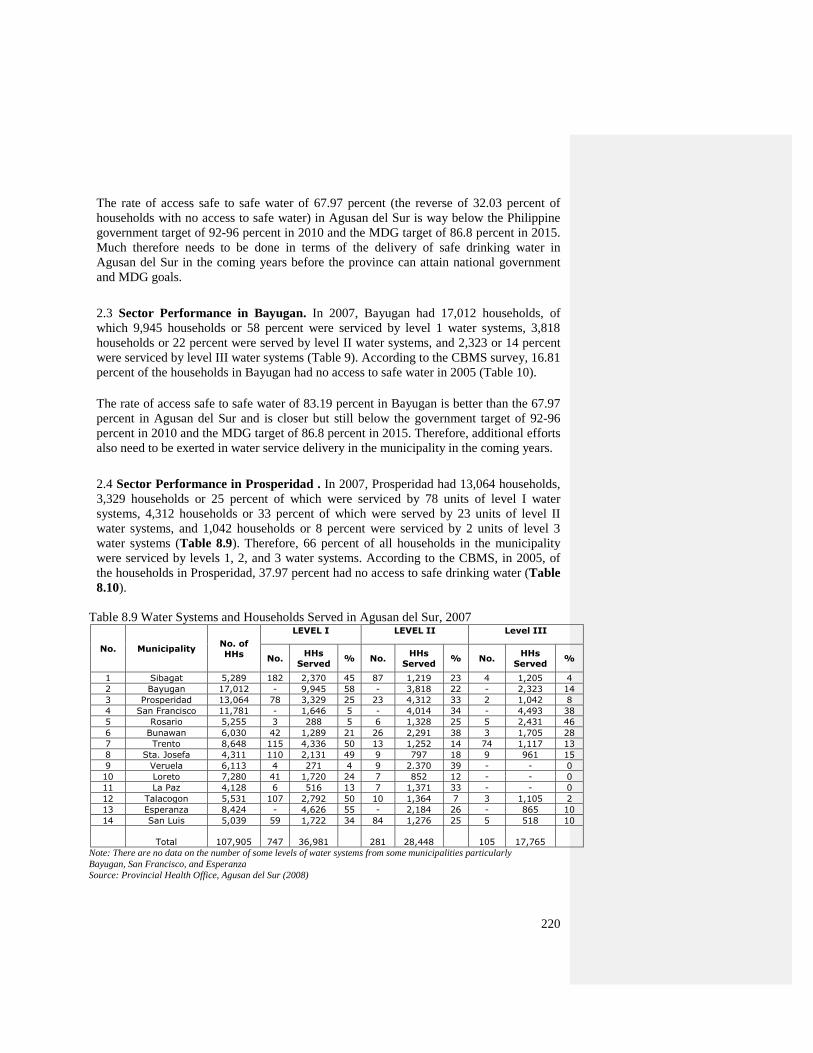
220
The rate of access safe to safe water of 67.97 percent (the reverse of 32.03 percent of
households with no access to safe water) in Agusan del Sur is way below the Philippine
government target of 92-96 percent in 2010 and the MDG target of 86.8 percent in 2015.
Much therefore needs to be done in terms of the delivery of safe drinking water in
Agusan del Sur in the coming years before the province can attain national government
and MDG goals.
2.3 Sector Performance in Bayugan. In 2007, Bayugan had 17,012 households, of
which 9,945 households or 58 percent were serviced by level 1 water systems, 3,818
households or 22 percent were served by level II water systems, and 2,323 or 14 percent
were serviced by level III water systems (Table 9). According to the CBMS survey, 16.81
percent of the households in Bayugan had no access to safe water in 2005 (Table 10).
The rate of access safe to safe water of 83.19 percent in Bayugan is better than the 67.97
percent in Agusan del Sur and is closer but still below the government target of 92-96
percent in 2010 and the MDG target of 86.8 percent in 2015. Therefore, additional efforts
also need to be exerted in water service delivery in the municipality in the coming years.
2.4 Sector Performance in Prosperidad . In 2007, Prosperidad had 13,064 households,
3,329 households or 25 percent of which were serviced by 78 units of level I water
systems, 4,312 households or 33 percent of which were served by 23 units of level II
water systems, and 1,042 households or 8 percent were serviced by 2 units of level 3
water systems (Table 8.9). Therefore, 66 percent of all households in the municipality
were serviced by levels 1, 2, and 3 water systems. According to the CBMS, in 2005, of
the households in Prosperidad, 37.97 percent had no access to safe drinking water (Table
8.10).
Table 8.9 Water Systems and Households Served in Agusan del Sur, 2007
No. Municipality No. of HHs
LEVEL I LEVEL II Level III
No. HHs
Served % No.
HHs Served
% No. HHs
Served %
1 Sibagat 5,289 182 2,370 45 87 1,219 23 4 1,205 4
2 Bayugan 17,012 - 9,945 58 - 3,818 22 - 2,323 14
3 Prosperidad 13,064 78 3,329 25 23 4,312 33 2 1,042 8
4 San Francisco 11,781 - 1,646 5 - 4,014 34 - 4,493 38
5 Rosario 5,255 3 288 5 6 1,328 25 5 2,431 46
6 Bunawan 6,030 42 1,289 21 26 2,291 38 3 1,705 28
7 Trento 8,648 115 4,336 50 13 1,252 14 74 1,117 13
8 Sta. Josefa 4,311 110 2,131 49 9 797 18 9 961 15
9 Veruela 6,113 4 271 4 9 2.370 39 - - 0
10 Loreto 7,280 41 1,720 24 7 852 12 - - 0
11 La Paz 4,128 6 516 13 7 1,371 33 - - 0
12 Talacogon 5,531 107 2,792 50 10 1,364 7 3 1,105 2
13 Esperanza 8,424 - 4,626 55 - 2,184 26 - 865 10
14 San Luis 5,039 59 1,722 34 84 1,276 25 5 518 10
Total
107,905
747
36,981
281
28,448
105
17,765
Note: There are no data on the number of some levels of water systems from some municipalities particularly
Bayugan, San Francisco, and Esperanza
Source: Provincial Health Office, Agusan del Sur (2008)
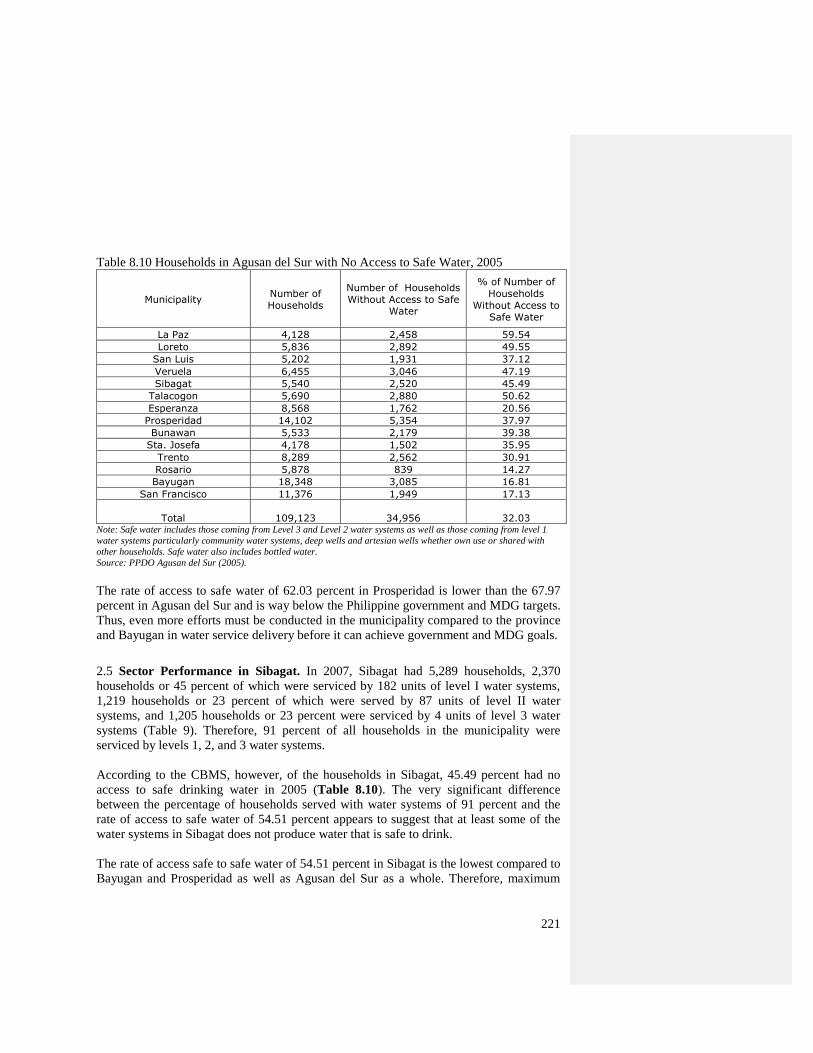
221
Table 8.10 Households in Agusan del Sur with No Access to Safe Water, 2005
Municipality Number of
Households
Number of Households
Without Access to Safe Water
% of Number of
Households
Without Access to
Safe Water
La Paz 4,128 2,458 59.54
Loreto 5,836 2,892 49.55
San Luis 5,202 1,931 37.12
Veruela 6,455 3,046 47.19
Sibagat 5,540 2,520 45.49
Talacogon 5,690 2,880 50.62
Esperanza 8,568 1,762 20.56
Prosperidad 14,102 5,354 37.97
Bunawan 5,533 2,179 39.38
Sta. Josefa 4,178 1,502 35.95
Trento 8,289 2,562 30.91
Rosario 5,878 839 14.27
Bayugan 18,348 3,085 16.81
San Francisco 11,376 1,949 17.13
Total
109,123
34,956
32.03 Note: Safe water includes those coming from Level 3 and Level 2 water systems as well as those coming from level 1
water systems particularly community water systems, deep wells and artesian wells whether own use or shared with
other households. Safe water also includes bottled water.
Source: PPDO Agusan del Sur (2005).
The rate of access to safe water of 62.03 percent in Prosperidad is lower than the 67.97
percent in Agusan del Sur and is way below the Philippine government and MDG targets.
Thus, even more efforts must be conducted in the municipality compared to the province
and Bayugan in water service delivery before it can achieve government and MDG goals.
2.5 Sector Performance in Sibagat. In 2007, Sibagat had 5,289 households, 2,370
households or 45 percent of which were serviced by 182 units of level I water systems,
1,219 households or 23 percent of which were served by 87 units of level II water
systems, and 1,205 households or 23 percent were serviced by 4 units of level 3 water
systems (Table 9). Therefore, 91 percent of all households in the municipality were
serviced by levels 1, 2, and 3 water systems.
According to the CBMS, however, of the households in Sibagat, 45.49 percent had no
access to safe drinking water in 2005 (Table 8.10). The very significant difference
between the percentage of households served with water systems of 91 percent and the
rate of access to safe water of 54.51 percent appears to suggest that at least some of the
water systems in Sibagat does not produce water that is safe to drink.
The rate of access safe to safe water of 54.51 percent in Sibagat is the lowest compared to
Bayugan and Prosperidad as well as Agusan del Sur as a whole. Therefore, maximum
222
effort must be exerted in the municipality in the future to improve its water service
delivery.
2.6 Other Indicators of Sectoral Performance. The survey of 158 households in
Dumaguete City and 183 households in Agusan del Sur in October 2008 generated
interesting findings about the sectoral performance of local water service delivery, some
of which are as follow:
i. A majority of the surveyed households had the primary source of drinking water
located within their neighborhood. Many also took no time in getting drinking water and
just walked to get it (Figure 1). Since most of the households get their drinking water
from Level I, Level II and Level III water systems, this result suggests that the local
water service delivery sector in Dumaguete City and Agusan have performed positively
in providing easy access to water by its users. The figure further indicates that the
performance in Dumaguete City is this aspect is better than in Agusan del Sur.
ii. Although adult males were mainly in-charge of getting drinking water from the
primary source, adult females were also involved as well as male ad female children to a
lesser degree (Figure 2). This explains that there are gender and age dimensions in local
water service delivery. It suggests a positive performance of the local water service
delivery sector in that it made physically possible for women and children to access
drinking water. The figure further shows that there are more women and children
involved in getting drinking water in Agusan del Sur than in Dumaguete.
iii. Only a minority of households treated their drinking water and of those who
did most used boiling as the form of treatment (Figure 3). This suggests that potable
water coming from local water service providers are considered drinkable and of good
quality by its users even without further treatment. The figure also indicates that there
are more households in Agusan del Sur who do not treat their drinking water than in
Dumaguete City.
iv. Some households were not willing to pay an additional amount for the
improvement of their drinking water but more households were (Figure 4). Of those who
were willing, most will pay an additional maximum amount of P1.00 or less per liter of
water. This means that households are willing to pay but only with little additional money
for the improvement of its drinking water. The figure also shows that there are more
households who are not willing to pay or willing to pay but only for less in Dumaguete
City than in Agusan del Sur.
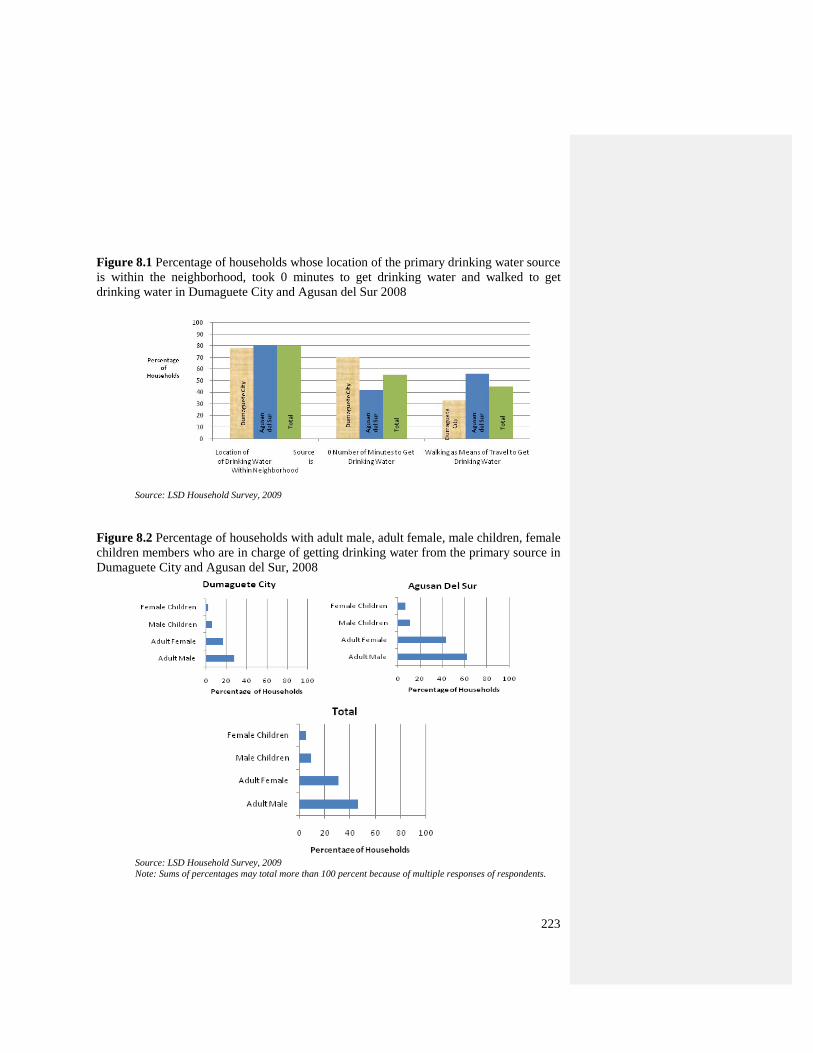
223
Figure 8.1 Percentage of households whose location of the primary drinking water source
is within the neighborhood, took 0 minutes to get drinking water and walked to get
drinking water in Dumaguete City and Agusan del Sur 2008
Source: LSD Household Survey, 2009
Figure 8.2 Percentage of households with adult male, adult female, male children, female
children members who are in charge of getting drinking water from the primary source in
Dumaguete City and Agusan del Sur, 2008
Source: LSD Household Survey, 2009
Note: Sums of percentages may total more than 100 percent because of multiple responses of respondents.
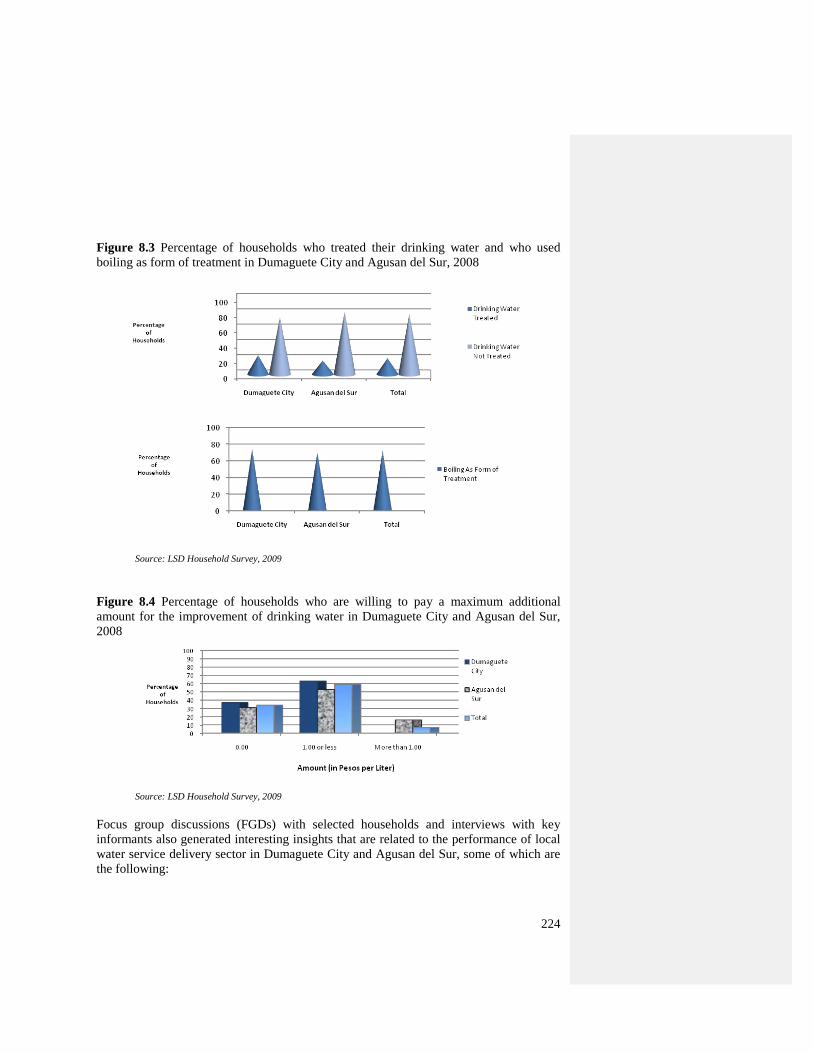
224
Figure 8.3 Percentage of households who treated their drinking water and who used
boiling as form of treatment in Dumaguete City and Agusan del Sur, 2008
Source: LSD Household Survey, 2009
Figure 8.4 Percentage of households who are willing to pay a maximum additional
amount for the improvement of drinking water in Dumaguete City and Agusan del Sur,
2008
Source: LSD Household Survey, 2009
Focus group discussions (FGDs) with selected households and interviews with key
informants also generated interesting insights that are related to the performance of local
water service delivery sector in Dumaguete City and Agusan del Sur, some of which are
the following:

225
i. The households who have a private connection to a water district 1) think that
the connection costs and tariff charges are affordable given their incomes, 2) believe that
water from the water district is of better quality compared to those from other sources,
and 3) think that water from the water district is more accessible compared to those from
other sources.
ii. The households who do not have a private connection to a water district even if
a water district operated in their community 1) cannot afford the cost of connection and
tariff rates, 2) have present sources of potable water that are free of charge or accessible
at low rates, and 3) think that the quality of water from their current sources are similar or
better compared to that from the water district.
iii. The households who do not use the water from the public wells even if it is
accessible to them 1) believe that water from public wells are of low quality, 2) think that
there are time and effort costs in accessing water from public wells compared to a private
connection and 3) want to avoid the competition for access to public wells during the
morning and other times of immediate need.
iv. The households who do not drink bottled water and refilled water even if these
are accessible do so because 1) the price of the water is high given their income and 2)
they can get potable water elsewhere for free or at low charge.
The abovementioned results show that the high price of water, comparable quality of
water and difficult access to water are the overriding factors why households do not
choose a specific type of potable water source. The local water providers should consider
these factors in improving their performance.
3. Key Issues and Challenges
The identified key issues facing the local water service delivery sector as a whole and for
water service providers based on the Dumaguete City and Agusan del Sur cases studies
are the following:
3.1 Key Issues facing the Sector
1. Denuded watersheds and water pollution that endanger both surface and
underground water sources;
2. Disparities in water service delivery between different municipalities and
barangays;
3. Existence of waterless rural barangays and areas that have no local water
service delivery;
4. Low levels of financial and related investments in local water service
delivery systems;
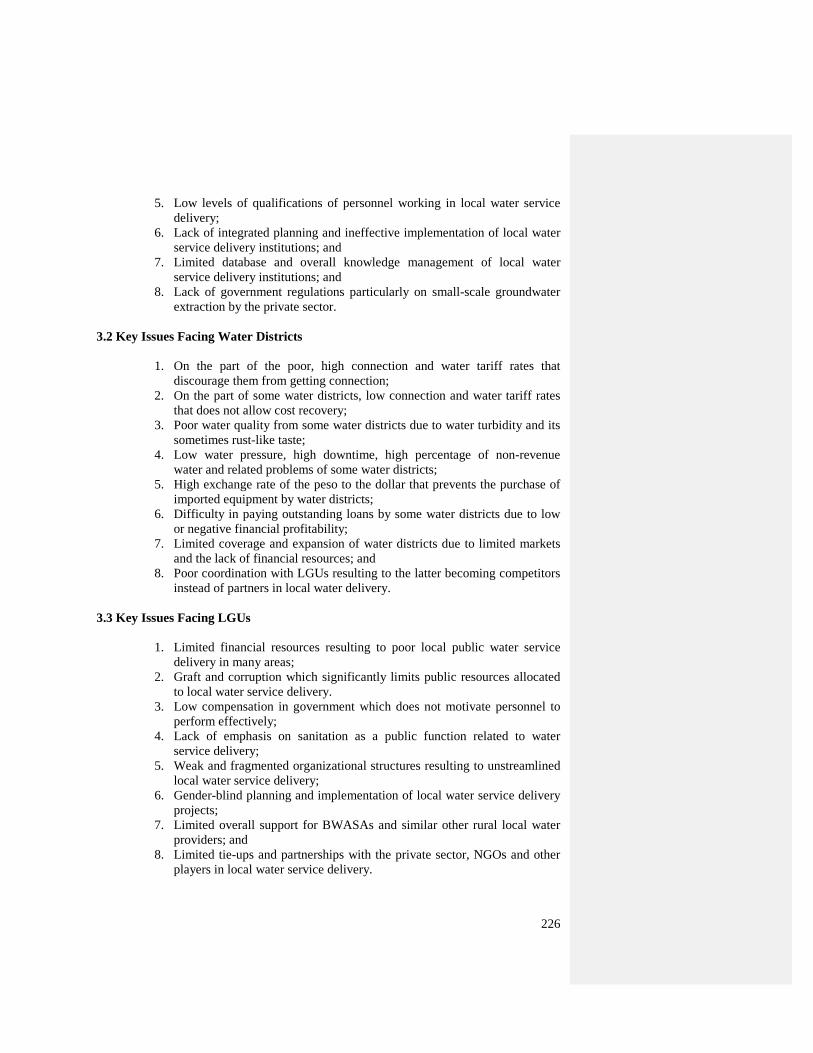
226
5. Low levels of qualifications of personnel working in local water service
delivery;
6. Lack of integrated planning and ineffective implementation of local water
service delivery institutions; and
7. Limited database and overall knowledge management of local water
service delivery institutions; and
8. Lack of government regulations particularly on small-scale groundwater
extraction by the private sector.
3.2 Key Issues Facing Water Districts
1. On the part of the poor, high connection and water tariff rates that
discourage them from getting connection;
2. On the part of some water districts, low connection and water tariff rates
that does not allow cost recovery;
3. Poor water quality from some water districts due to water turbidity and its
sometimes rust-like taste;
4. Low water pressure, high downtime, high percentage of non-revenue
water and related problems of some water districts;
5. High exchange rate of the peso to the dollar that prevents the purchase of
imported equipment by water districts;
6. Difficulty in paying outstanding loans by some water districts due to low
or negative financial profitability;
7. Limited coverage and expansion of water districts due to limited markets
and the lack of financial resources; and
8. Poor coordination with LGUs resulting to the latter becoming competitors
instead of partners in local water delivery.
3.3 Key Issues Facing LGUs
1. Limited financial resources resulting to poor local public water service
delivery in many areas;
2. Graft and corruption which significantly limits public resources allocated
to local water service delivery.
3. Low compensation in government which does not motivate personnel to
perform effectively;
4. Lack of emphasis on sanitation as a public function related to water
service delivery;
5. Weak and fragmented organizational structures resulting to unstreamlined
local water service delivery;
6. Gender-blind planning and implementation of local water service delivery
projects;
7. Limited overall support for BWASAs and similar other rural local water
providers; and
8. Limited tie-ups and partnerships with the private sector, NGOs and other
players in local water service delivery.
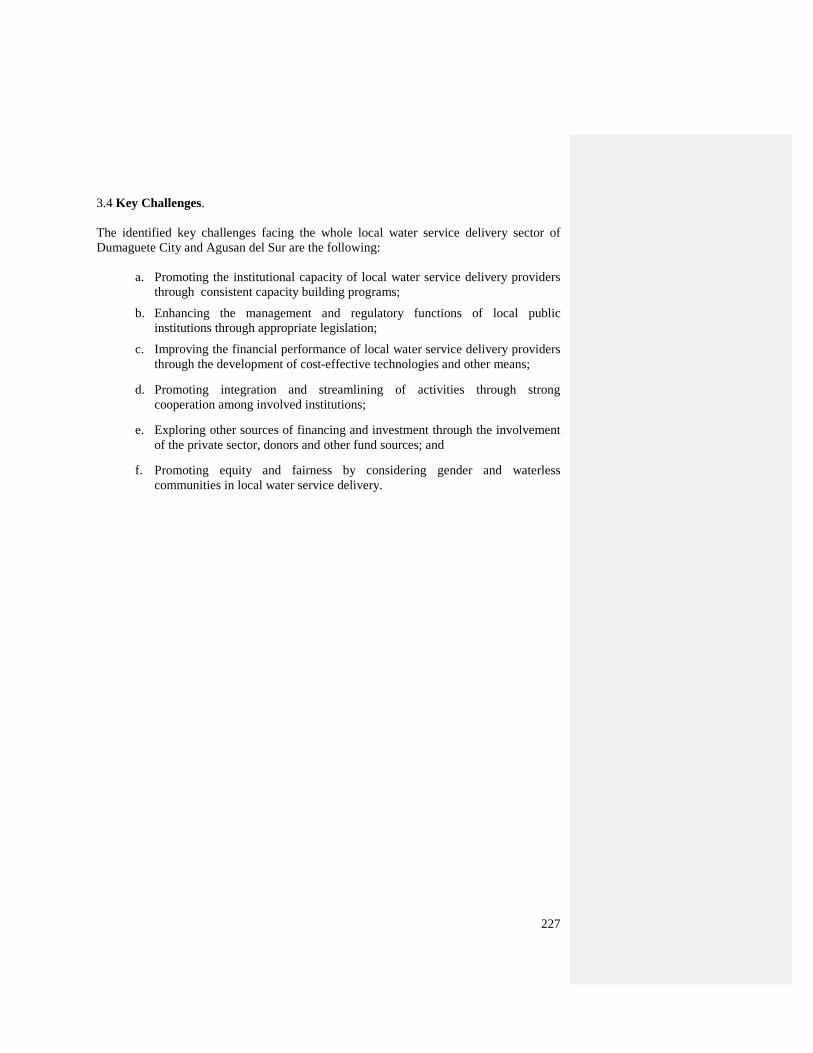
227
3.4 Key Challenges.
The identified key challenges facing the whole local water service delivery sector of
Dumaguete City and Agusan del Sur are the following:
a. Promoting the institutional capacity of local water service delivery providers
through consistent capacity building programs;
b. Enhancing the management and regulatory functions of local public
institutions through appropriate legislation;
c. Improving the financial performance of local water service delivery providers
through the development of cost-effective technologies and other means;
d. Promoting integration and streamlining of activities through strong
cooperation among involved institutions;
e. Exploring other sources of financing and investment through the involvement
of the private sector, donors and other fund sources; and
f. Promoting equity and fairness by considering gender and waterless
communities in local water service delivery.
228
CHAPTER 9
Comparative Assessment
This chapter makes a comparative assessment based on the sectoral analyses of the
previous three chapters. The assessment is based on policy-related concerns such as
accessibility, affordability, equity, quality, as well as financial (allocative efficiency and
sustainability) and institutional (governance deficits) aspects impacting on the local
service delivery of basic education, maternal and child health, and potable water supply.
1. Accessibility. The populations of the LSD areas – Dumaguete City and Agusan del Sur
– experience different problems of accessibility to health, education, and water services.
In health, the problem of accessibility is in terms of (i) utilization of service, and (ii)
quality of care. There is more bypassing of facilities such as BHSs and RHUs in
Dumaguete City than Agusan del Sur because of easy transport, more mobility and more
choices for urban residents, and availability of quality health facilities and services. In
Agusan del Sur, although there is high utilization for BHS and RHU for immunization
services, there is low usage for them for prenatal, delivery, postnatal care due to quality
of care and limited number of services such as obstetric care. There is bypassing of public
hospitals in Bayugan and Sibagat municipalities in favor of the bigger provincial hospital,
such as D.O. Plaza Provincial than Bayugan Community Hospital, due to availability of
more services as well as better quality of care. Moreover, private hospitals in Agusan del
Sur are by-passed for bigger private hospitals located in Butuan City, Agusan del Norte,
especially for Sibagat residents who live near Butuan City than the capitol towns of
Agusan del Sur.
In education, the problem of accessibility is in terms of (i) service coverage measured by
pupil/student-classroom ratio, pupil/student-seat ratio, pupil/student–ratio for elementary
and secondary education respectively, (ii) utilization of services measured in terms of net
enrollment rates for elementary and secondary education. With regard to service
coverage for elementary education in 2007, the Division of Dumaguete City has a better
pupil-classroom ratio (34.80:1) than Central Visayas (36.36:1) while the Division of
Agusan del Sur (35.99:1) has worse pupil-classroom ratio than much of the CARAGA
region (33.92:1). Dumaguate City‘s ratio is below the national average of 34.82:1 but not
Agusan del Sur‘s ratio is not. For secondary education, student-classroom ratios for
Dumaguete City (29:1) and Agusan del Sur (44:1) are better the national average (48:1)
in 2007. Pupil-seating ratios in elementaryfor Dumaguete City (0.87:1) and Agusan del
Sur (0.85:1) are better than the national average (1.02:1) in 2007. The same is true at the
secondary level with pupil-seating ratios for Dumaguete City and Agusan del Sur at
0.85:1 and 0.87:1 while the national average in 2007 was 1.12:1. Pupil-teacher ratios in
elementary for Dumaguete City (32.82:1) and Agusan del Sur (32.39:1) were slightly
better than the national average (33.18:1) in 2007. At the secondary level, the student-
teacher ratio for Agusan del Sur (32.59:1) was better than the national average (33.99:1)
229
in 2007, but that for Dumaguete City (34.16:1) but slightly worse. With regard to
utilization of services, both Dumaguete City and Agusan del Sur had lower net enrolment
rates (71.42% and 75.99%, respectively) than the national average of 83.22% in SY
2006-2007. Net enrolment for males is higher than for females in Agusan del Sur but
lower for Dumaguete City for the same period. At the secondary level, both Dumaguete
City and Agusan del Sur had lower net enrolment rates (54.14% and 48.86%,
respectively) than the national average of 58.59% in 2007. Net enrolment rates in both
areas are higher for females than for males in SY 2006-2007.
The problem of accessibility for water supply is measured in terms of (i) level of
coverage, and (ii) quality of water service. In Agusan del Sur, WDs are not able to serve
the whole municipalities. Bayugan Water District (BWD) is able to serve only 9 out of 43
barangays of the municipality of Bayugan. In the same way, Properidad Water District
(PWD) serves only 7 out 32 barangays in the municipality of Prosperidad. In terms of
household self-provision for those in the upland areas where water system is lacking,
potable water is sourced from dug wells, natural water bodies such as rivers, rainwater,
and similar sources. With regard to access to quality water service, this can be measured
in terms of how the LSD areas are faring well in meeting the MDG of increasing the
proportion of households with access to safe drinking water. Dumaguete City (90%) has
high probability of attaining the MDG target of 86.80%, while Agusan del Sur (67.97%),
as well as Prosperidad (62.03%) and Sibagat (54.51%) are below the target. Only
Bayugan (83.19%), though still below the target, may attain it by 2015.
2. Affordability. There is variance in terms of affordability of services for the three
sectors. In health, the residents utilizing services from public hospitals in Dumaguete City
view the cost of services, though lower than private hospitals, as expensive because it
constitutes a significant portion of their incomes. In Agusan del Sur, residents who by-
passed public hospitals do so because of lower costs and flexibility of payment schemes,
among others. In terms of cost of delivery services, cost of delivery by a doctor and
midwife is almost twice the price in Agusan del Sur compared with the price in
Dumaguete City. Likewise, delivery in a medical facility in Agusan del Sur costs twice
as much as in Dumaguete City. Moreover, BHSs and RHUs are the cheapest sources of
FP services.
In education, private education is more costly than public, albeit this is more evident for
pre-school and elementary education than for secondary education. In both LSD areas,
the average cost difference between private schools and public schools is about 4 to 9
times for pre-school education, 7 to 13 times higher for elementary education, and 2 to 6
times for secondary education.
In the water sector, not all residents in Agusan del Sur are capable of buying bottled
water because of high prices. As a result, this low market clientele makes bottled water
service providers unable to expand. This is in contrast to Dumaguete City where
residents –who are primarily educated and tourists – are able to buy bottled water. Also,
there is a big difference in affordability for those who have private water connection and
those who have none. In both LSD areas, the households who have a private connection
to a water district think that the connection costs and tariff charges are affordable given
230
their incomes, while those who have no connection cannot afford the cost of connection
and tariff rates and would rather access water at low rates, if not for free. Further, as
evidenced in the FGDs, residents of Dumaguete City more than that of Agusan del Sur,
are unwilling to pay for extra costs for better water services unless it is a small amount.
3. Equity. For the three sectors, equity can be gauged by (i) level of coverage of the
unreached, under-served or unserved areas, usually rural areas, and (ii) priority given to
poor beneficiaries of services. In health, the indicators are (a) IMR rate, (b) user fees
charged to poor pregnant women, and (c) PhilHealth membership. First, the decline in
IMR for Agusan del Sur in 2006 due to the difficulty of reaching remote barangays
evidences a problem of inequity. In Dumaguete City, the marked improvement of no
incidence of infant deaths in 2007 from an IMR of 11.7 attests to a serious concern for an
improved child health of the poorest sector of the city. Second, the attempt to augment
limited health funds in Dumaguete City and Sibagat Municipality through collection of
user fees for some services by the RHUs/CHOs affects the poorest sector. For although
charges are low and are meant to recoup laboratory re-agents, they are charged to all
patients, even to target clients such as pregnant women. This is different in the case of
Prosperidad that, though it also issued resolutions allowing health centers to collect user
fees, it exempts target clients from these. Third, in terms of Philhealth membership in
Agusan del Sur, the indigent population have a problem as to their (1) authentic
membership given that the 34% enrolment of indigent population to the sponsored
program of Philhealth in 2008 is doubtful considering the difficulty of ascertaining the
LGU‘s strategy of expanding coverage; (2) not being issued any cards even after paying
their counterpart fund of P300, (3) not being reimbursed by PHIC because their names
are not found in the membership roster; and (4) not enjoying any benefits as only RHUs
are given capitation fund per enrolled indigent, thus limiting health facilities that they can
access, as well as not being provided with free preventive care and laboratory services by
some RHUs as stipulated in the package. Identification of the true poor can be done by
validating the poor profile at the barangay level for authentic membership to Philhealth.
The passage of SP resolution stipulating the use of CBMS to correctly target Philhealth
members is a step in the right direction in Agusan del Sur.
In education, equity is measured in terms of disparities in education outcomes that can be
observed from a regional comparative assessment, viz.: (i) net enrolment ratio, (ii)
gender-parity index, and (iii) urban-rural ratio. For SY 2007-2008, primary net
enrolment rates in the 2 regions of the LSD areas are below the national average of
75.52%, with that of CARAGA at 74.80% and Central Visayas at 72.65%. Secondary
NER in SY 2007-2008 for CARAGA (40.66%) and Central Visayas (39.32%) are also
below the national average of 45.28%. In SY 2007-2008, participation rates are roughly
the same for males and females in CARAGA, but slightly higher for females in Central
Visayas (1% higher). At the secondary level for the same period, Central Visayas has one
of the highest gender disparities, with participation for female 27% higher than that for
males. This is different in the case of CARAGA where disparity has decreased from 25%
in 2005 to 22% in 2007. Both regions of the LSD areas have higher gender disparities
than the national average of 18%. The urban-rural ratio in elementary participation for
SY 2005-2006 in Central Visayas (13%) is above the national average of 10% but that for
CARAGA (3%) is lower. At the secondarylevel, the inequity between urban and rural
231
areas is lower in CARAGA (3%) and higher in Central Visayas (26%) than the national
average of 19%.
Further, equity in education can be observed in terms of (i) granting of MOOE, (ii) PTCA
resource mobilization, and (iii) SBM grant. First, granting of school MOOE in both LSD
areas should be based not merely on population (which gives schools equal per-student
budgets) but more importantly on school needs. Second, PTCAs in both LSD areas
enhances equity and sustainability as local stakeholders contribute for better education
services and outcomes. Third, SBM grants enhance equity by providing financial
assistance to low performing schools in both LSD areas. Based on SBM Framework and
Standards, low performing schools are given grants depending on their classification:
Level I for those complying with only minimum requirements, Level II for those
complying with minimum requirements, intensifying mobilization of resources, and
maximizing efforts to achieve learning-teaching outcomes, and Level III for those
schools and community stakeholders that further maximize their efforts to achieve
desired learning-teaching outcomes. In 2008 for example, the Division of Agusan del Sur
received SBM grants of P3.5 million, with 30% of low performing schools (based on low
promotion and high drop-out rates, participation and retention rates) receiving a portion
of it.
For the water supply sector, equity is measured in terms of (i) socialized pricing being
practiced by almost all WPSs in Dumaguete City and Agusan del Sur, (ii) LGU-managed
WSPs providing water to the poor, and (iii) LGU projects that cater to the needs of the
poor. First, Dumaguete City Water District (DCWD), Prosperidad Water District in
Prosperidad, Bayugan Water District in Bayugan, Agusan del Sur practice socialized
pricing where residential and government users are subsidized by large commercial users.
Second, Pumpwell Section, which is an office under the City Engineer‘s Office in
Dumaguete City, and Water and Sanitation (Watsan) Center, which is an office under the
provincial government of Agusan del Sur, provide Level I and Level II public water
systems for the poor. The Pumpwell Section, for example, is specifically tasked to
concentrate in areas with no capability of getting water connection. Third, there are also
projects by the LGUs that cater to water supply needs of the poor. In 2008, the provincial
government of Agusan del Sur, with the initiative of Governor Maria Valentina Plaza,
started the Tubig Imnonon Natong Agusanon (TINA Project). TINA Project is about
providing portable bio-sand filters that are used to provide safe water to poor households
at affordable and subsidized prices.
4. Quality. Depending on the service being provided, the quality of service rendered can
be measured in terms of (i) satisfaction with the quality of service, and (ii) achievement
vis-à-vis MDGs or national goals. In health, satisfaction of the quality of service can be
observed in the preferences for health facility and the reasons underlying them. First, in
both LSD areas, preference for one facility over the other depends on health and cultural
factors. BHS and RHU for example, get high satisfactory ratings in terms of the attitude
of medical personnel and their availability, but low ratings when it comes to medical
facilities, availability and adequacy of medical supplies, and quality of medicines and
supplies. Bypassing of one facility over the other, whether by a large public provincial
hospital over BHS, RHU/CHO, or by another private hospital over public hospitals and
232
poorly-kept private hospital – will greatly depend on the quality of health care service,
medical personnel, medicines and supplies, and cost of service. The latter criterion or
reason for preference may not be a determinant factor, especially in cases where urban
residents have the capacity to pay for better medical services such as in Dumaguete City,
and to some extent Agusan del Sur. Poor households have limited choices and thus avail
of health care services usually from public hospitals, if not from BHSs and RHUs only,
for financial consideration. Even when they avail of services from public hospitals with
lower fees compared to private hospitals, they still think that the fees are expensive given
their earnings.
Second, in terms of quality of service measured by achievement rates on certain services,
the performances of the two LSD areas vary. In terms of iron supplementation in Agusan
del Sur, 2007 MICS reports higher rates for Negros Oriental (80.3%) and Agusan del Sur
(83.8%) compared with the national average (76.7%), but LSD survey reports otherwise,
with LGUs not fully giving iron supplementation in three municipalities of Agusan del
Sur. With regard to Vitamin-A supplementation, almost all pregnant women in
Prosperidad and Sibagat receive supplements, unlike in Bayugan and Dumaguete City.
For skilled attendance at delivery, based on LSD survey, the percentage of pregnant
women attended by SBA during delivery is 59% for Bayugan, 50% for Prosperidad, 27%
for Sibagat. Dumaguete City registered a higher rate of between 89 to 91%. For
BEmONC and CEmONC services, Dumaguete City still rated higher at 90% in 2007
compared with Agusan del Sur where less than 20% of births delivered in a medical
facility did not have SBA supervision based on both 2007 FHSIS and 2007 MICS
surveys. Agusan del Sur, however, posted a high rate in terms of immunization at 93% if
data is to be based on 2007 FHSIS (70% only in 2007 MICS). Dumaguete City‘s FIC
declined to 77% in 2007 from as high as 96% in 2004. While lower than Prosperidad‘s
87%, Dumaguete City‘s rate was still higher compared with Bayugan‘s 61% and
Sibagat‘s 58%. With regard to supplementation and deworming services, although
almost all children in both LSD areas were able to receive Vitamin-A Supplementation,
only 25% to 50% were able to receive deworming tablets. For family planning services,
based on the LSD survey, only 9% (while 153% in FHSIS) of women of reproductive age
are FP users in Dumaguete City, while 10 % are FP users in Agusan Del Sur.
For education, the quality of service in both elementary and secondary education is
measured by at least (a) promotion and drop-out rates, (b) and achievement rates. First,
Dumaguete City‘s promotion rate for elementary education at 96% in 2007 (which
improved from 94% in 2003) is higher compared to Agusan del Sur (86%) and the
national average (91%). For secondary education, Dumaguate City‘s promotion rate is
higher at 90% compared with the national average (89%) and that of Agusan del Sur
(88%). For drop-out rates for elementary education, Dumaguete City has lower rate at
0.72% than Agusan del Sur (1.82 %) and the national average (1.26%). For drop-out
rates for secondary education, Agusan del Sur (88%) is below the national average of
89% and that of Dumaguete City (90%). For average achievement rate for grade 6, there
was a slight decline in the mean percentage score for Dumaguete City from 63% in 2004
to 62% in 2007, which is lower than the national average of 65%. Agusan del Sur posted
a higher rate of 71% percent in 2007 from 68% in 2004. For average achievement rate
for second year high school, though Agusan del Sur had a decline in the mean percentage

233
score from 63% in 2006 to 62% in 2007, its rate was still higher compared to that of
Dumaguete City (51%) and the national average (49%) in 2007.
For water supply sector, quality of service is measured by (a) the need for water
treatment, and (b) achievement rate in meeting the MDG of increasing the proportion of
households with access to safe drinking water. Quality of service in terms of (b) need not
be discussed as this section was already discussed under Accessibility. For (a), all the
WSPs in both LSD areas– water districts privately or LGU-managed –apply chlorination
as water treatment. For those with water sources from natural springs such as Bayugan
Water District in Agusan del Sur, on-field testing of the quality of spring water coming
from the watershed is done twice a year.
5. Allocative Efficiency and Sustainable Financing. Sustainable financing is measured
in terms of (i) the level of expenditure allocated per service, and (ii) how it is being spent.
For (i) in health, Negros Oriental exceeds the DOH benchmark of 20% share of
provincial expenditure for health, while Agusan del Sur‘s expenditure shares on health,
nutrition, and population have been declining from 18% in 2003 to 8% in 2005, though
with a slight increase in 2006 at 13% (SIE, DOF 2007). Bayugan Municipality (even
when it was still considered a city) has been allocating more than twice the national
average for city health expenditure share of 7 to 8 percent. Compared to Dumaguete City
which spent only 4.11%, Bayugan spent 20% of its total expenditure on healthcare in
2006. As discussed in chapter 7, health expenditure (in real prices) in most LGUs has
been declining from 2003 to 2006. And when viewed in terms of health expenditure per
capita, both per capita expenditures of Negros Oriental (P 156.00) and Agusan del Sur (P
105.00) are above national average for provinces (P 81.00). Per capita expenditures of
Dumaguete City (P 63.00), Bayugan (P 126.00), Sibagat (P 75.00), and Prosperidad (P
50.00) are below the national average for cities (P 132.00). For (ii), for sustainable
financing, there must be a link between budgets and accomplishments. In both LSD
areas, there appears to be no link between proposed targets detailed in the Local Budget
Preparation Form No. 154, and the achievements during the year. This implies non-
monitoring of achievements versus targets. Moreover, LGU‘s limited funds impact on the
availability of supplies, thus a negative effect on the delivery of health services.
In education, as discussed in chapter 6, the general trend in LGU funding has been quite
uniform (about 7%) since the enactment of 1991 LGC. The reasons for a decline in
education spending relative GDP from 0.3% in 1998 to 0.2% in 2005 have to do with (a)
decline of SEF income, (b) LGUs not supplementing their SEF with income from their
general fund, and (c) partial utilization of SEF. For the DepEd budget, the share of PS
has been decreasing from 2003 to 2007, while those of MOOE and CO have been
increasing. For the Regional Budget, the bulk of the share of the budget goes to PS. This
is true at the Division Level in Agusan del Sur and Dumaguete City. On a positive note,
the entire budget for PS for the LSD areas was fully spent; thus, signifying that the
budget utilization is high. For the School Budget, MOOE could be received in kind or in
cash depending on whether the secondary school has a financial staff. SBM grant, aimed
at assisting low performing schools in certain performance outcomes, is not clear on how
it is being used compared to MOOE, and how much it has influenced empowering
schools. With regard to SEF, the power of local officials and LCEs in approving or
234
disapproving the proposed allocations of SEF is viewed as a check on the discretion of
local education officials. For the LSD areas, the bulk of the SEF is mostly spent on
MOOE. Also, SEF has been funding the activities mandated by DepEd but for which no
funding is given; thus, shifting the burden from central office to the LGUs. As a result,
SEF has not been funding some items it was designed to finance such as construction of
school buildings, and repair of school facilities and equipment. General Fund (GF) is
used by LGUs to finance education. For example, Prosperidad allots about 3 % of its
current operating expenses to education, of which over 90% going to secondary
education, about 3% to elementary schools, and about 6% to technical/vocational
education. School Fees also finance education in Agusan del Sur and Dumaguete City.
The issue related to this is the collection of contributions by the school personnel
themselves, collection of unauthorized fees, and varying modalities of collection (e.g.
during enrolment and being used as a requirement). PTCA Fees contribute to financing
education, as well involving education stakeholders such as parents, teachers, students,
and local communities to participate in attaining desired education outcomes.
For water supply sector, sustainable financing is required for better management of
WSPs. The usual problem lies on the LGU-managed WSPs. This is the case in Agusan
del Sur more than in Dumaguete City. The zero income of Waterworks of Sibagat in
2006-2007 should be a cause of concern, considering that, being an economic enterprise,
it is one of the main sources of income for the LGU. Also, the many priorities of LGUs
make water supply just one, if not a secondary, concern. As to the WDs, not all are
losing GOCCs such as Bayugan Water District because of better sources of funding and
their efficient use. DCWD, for example, makes better use of its loans from LWUA,
ADB, and Dumaguete City government. As of 2005, DCWD has slated projects costing
P54.8 million, about 32 percent of which was funded by a loan from LWUA and 68%
from funds sourced through water district operations. Prosperidad Water District (PWD)
is another good case of an earning GOCC (a total of 6 million per year) that makes better
and efficient use of its financing mainly from LWUA and short and soft loans from LGU.
Further, socialized pricing is a good practice that caters to the needs of the poor
households, as well as enlarges the concept of corporate social responsibility of
commercial and industrial water users.
6. Institutional Governance Deficits. Institutional governance deficits result from, inter
alia, (i) unclear assignment of roles and functions, (ii) encroaching on other powers and
functions, (iii) incapacities and inefficiencies of institutional actors, and (iv) non-
participation of other stakeholders such as civil society groups and private sector, and (v)
lack of political will. The deficits manifest themselves in the delivery of health,
education, and water services. In health, in terms of (i), there is lack of clarity of the role
of barangay in financing for health care provision, the extent of LGUs involvement in
Integrated Management of Childhood Illnesses, the role of LCEs in health care provision,
and the NG‘s role in providing supplies (e.g. syringes) for key programs such as EPI that
LGUs are incapable of providing. In terms of (ii), new barangay officials in Agusan del
Sur, but not in Dumaguete City, change their BHWs once elected, thus creating a
problem of security of tenure for the BHWs. With regard to (iii), the role of PHO should
be strengthened in terms of monitoring the quality of services given by different service
providers and ensuring that private sector should comply with DOH protocols. For (iv),
235
the private sector can be tapped such as the OB Gyne Department of the Silliman
University in Dumaguete City in providing modern contraceptives as a FP service. In
terms of (v), there is a need for strong political will of LCEs to prioritize health,
specifically maternal and child health, and mandate linking of planning and budgeting or
aim for performance-based budgeting.
For education in terms of (i) LGUs may be assuming functions not mandated on them
such as the use of general fund. Although policy-making in education is not devolved,
production has increasingly been decentralized, with local government assuming a greater
role in financing local education. For (ii), local officials and LCEs seem to check on the
discretion of local education officials in appropriating for SEF by virtue of their power to
approve or disapprove the local education officials‘ SEF proposal. For (iii), there is a
burden-shift from NG to LGU in funding activities not through NG funds but through the
SEF; thus, making SEF fund activities it was not designed to finance.
For the water supply service, in terms of (ii) LWUA directly sets tariff structure in the
BWD in Bayugan without consultation with the consuming public. Also, (iii) is a
problem in that, owing to the many priorities of the Dumaguete City government, it
cannot do a better job in wastewater management. There has been a plan to transfer the
responsibility for wastewater management to DWCD. In Agusan del Sur, lack of funding
and low prioritization by the municipal governments have contributed to the non-
establishment of Watsan units in many municipalities. In terms of (iv) in both LSD areas,
private sector plays a bigger role in household self-provision and bottled water provision.
In Agusan del Sur, an NGO – Philippine Center for Water and Sanitation, played a major
role in (a) helping Watsan Center and other other WSPs build their institutional
development, (b) organizing Dona Flavia Water Supply and Sanitation, and (c) providing
potable water in province of Agusan del Sur. Such non-governmental organizations and
private sectors should be encouraged to help in improving local water service delivery. In
terms of (v), the TINA project of Governor Plaza is an evidence of strong political will
not only to improve local water service delivery, but also address the problem of access
to safe drinking water of poor households. This needs to be replicated in other LGUs.
236
CHAPTER 10
Key Findings, Conclusions, and Policy
Recommendations
This chapter provides for the key findings and conclusions based on the analyses and
assessments of the previous chapters, as well as data from focused group discussions, key
informants interviews, and facility mapping surveys. It also provides for the needed
policy reforms and recommendations – both sectoral and cross-cutting - as a way forward
in meeting the challenge of improving local service delivery.
1. Key Findings
1.1 People-centered Concept of Service Delivery. Though Agusan del Sur‘s Governor
Maria Valentina Plaza and Dumaguete City Mayor Agustin Perdices, as well as the
different barangay captains interviewed, may have different words of conceiving and
defining service delivery, they seem to have a common meaning beyond the words used –
people-centered service. Governor Plaza understands service delivery as a ―balancing
act‖ among competing needs of the people, especially their economic needs (e.g.
productive employment) and social needs (e.g. interests of the IPs), against the backdrop
of scarce resources and political, economic, social, cultural problems. Mayor Perdices
understands service delivery to be nothing but ―health, education, and livelihood for the
people,‖ the provision of which is within an empowerment framework that enjoins his
constituents to be self-reliant and not ask for dole-outs. Mr. Raul B. Aguilar, Barangay
Captain of Barangay Tinago in Dumaguete City, understands service delivery to be the
―delivery of basic needs such as health, education, water (e.g. drainage), among others.‖
For Mr. Nicolas T. Ramirez, Barangay Captain of Barangay Batinguel in Dumaguete
City, it is about ―project completion for the people‖. Mr. Lionel P. Banogon, Barangay
Captain of Barangay Bunao in Dumaguete City, associates it with the ―government
providing for the needs of the constituents.‖ For Barangay Captain Francisco Ebardo of
Barangay Bucac in Bayugan City, Agusan Del Sur, it is understood to be the ―delivery of
services to the people in conformance with the law and needs of the people.‖ Barangay
Captain Aurelio P. Dacera, Jr. of Barangay Afga in Sibagat thinks that ―Service delivery
entails utmost satisfaction of the public‘s needs without sacrificing governmental
integrity and honesty.‖ As to how this seemingly universal conception of local service
delivery translates into better services will have to be verified through the performance
outcome indicators of the LSD areas; hence, the value of sectoral analyses.
1.2 Critical Role of Local Chief Executives (LCEs). Local Chief Executives (LCEs)
play an important role in pursuing development agenda in both LSD areas. In Agusan del
237
Sur for example, Governor Plaza‘s Tubig Imnonon Natong Agusan (TINA) project -
aimed at addressing problems of access to safe water by the poor households - is a
testimony to her innovativeness in realizing a development agenda to her people. Her
effective leadership is evidenced by rallying around the municipal mayors of her province
in making sure that the benefits of her project are felt province-wide. In Dumaguete City
for instance, Mayor Perdices‘ pursuit of development agenda by empowering the people
through health, education, livelihood and other child-focused programs, than giving dole
outs makes a lot of sense from a development and governance perspective.
Further, in both LSD areas the professional background of the LCE creates a positive
impact on the development priorities of the LGU. For example, Governor Plaza admits
that her professional background as a businesswoman makes her employ business
principles and practices in getting things efficiently done in delivering services to her
constituents. Governor Emilio Macias II of Negros Oriental lists health as one of his top
priorities in his province, given his professional background as a medical doctor. Mayor
Thelma Lamanilao of Sibagat also prioritizes health, having been the municipal health
officer for quite some time before being elected as its mayor.
1.3 Scarcity of Resources. The usual problem attending local service delivery in both
LSD areas is the limited, if not lack of, resources –human, physical, financial, etc.
Limited or lack of ―soft infrastructure‖ such as qualified, skilled, trained human resources
in health (e.g. BHWs, SBAs, midwives, nurses, and doctors), education (e.g. teachers,
principals, school administrators or managers), and water (e.g. technical and operation
staff) cannot ensure better delivery of services. Limited or lack of hard infrastructure in
health (e.g. BHSs, RHUs/CHOs, BEmONC, CEmONC, public and private hospitals,
medicines and supplies), education (school buildings, day care centers, laboratories, and
equipment), water (e.g. water districts, water treatment sites, sanitation, and Level I, II,
and III public water systems) makes it impossible to address public needs for services.
Equally important, without sufficient funding to finance the production, distribution,
consumption or provision of public services, well-meaning public officials are not able to
deliver. These seemingly perennial constraints, limitations, scarcity of resources may
excuse or justify the inability of LGUs to provide public services or to improve on them.
But the demand for political will, innovativeness, and capabilities of local institutional
actors, primarily the LCEs, may not necessarily justify their incompetence, inefficiencies,
and ineptitude. Just like in Agusan del Sur and Dumaguete City, the challenge is to
make a big difference in delivering public services despite the constraints and delimiting
human, physical, and financial conditions.
1.4 Needs-based Prioritization. Given resource constraints, local officials practice
needs-based prioritization of service delivery. At the barangay level, barangay officials
have different priorities based on the needs of their constituents. For Barangay Bahbah in
the Municipality of Prosperidad in Agusan del Sur, these are: Infrastructure (e.g. school
buildings, day care center), water provision (e.g. Level I and II water systems). For
Barangay Afga in the Municipality of Sibagat, these include: education (ECCD, ALS,
Reading Center, Skills Development), infrastructure (e.g. drainage), water (e.g. Level I
and II water systems). For Barangay Bucac in the Municipality of Bayugan, the priorities
238
are: sports development, livelihood, and day care center. For Barangay Tinago in
Dumaguete City, these include health, education (e.g. materials, books), and water
drainage. For Barangay Batinguel, their priorities are creating livelihood, poverty-
reduction, and education of farmers. For Barangay Bunao, these are: drainage and youth
development and value formation. For Barangay Daro, their priorities include drainage,
lightning, and infrastructure.
1.5 Capacity Development. Like all LGUs, the local governments in Agusan del Sur
and Dumaguete City, need constant capacity development for their all-important function
as one of the frontline service providers. In Dumaguete City, there is a Barangay Affairs
Office which was established to provide technical assistance to barangay officials,
especially those comprising barangay finance committees, in preparing their development
plans, development priorities and projects, and budget proposals. The establishment of
such office for such purpose may be viewed as a best practice in governance, especially
when its positive benefits to both the barangays and the city government are considered.
In Agusan del Sur, as in other LGUs, such Barangay Affairs Office, needs to be
replicated. The rationale is based on the fact that most LGUs, not necessarily barangays,
have limited, if not lack of, capacities in satisfying the demands of an improved service
delivery, from financial management to infrastructure development, etc. More concretely,
most LGUs experience difficulties in following the New Government Accounting System
(NGAS)86
given their lack or limited capacity with the new system of accounting; to set
the linkage between planning and budgeting; and follow service standards that are
performance-based and results-oriented.
1.6 The Crucial Role of the National Government. The national government
department and agencies, DBM, DOF, COA, and DILG for example, have a bigger role
to play in providing or enhancing financial, technical, and institutional development
assistance to sub-national tiers of government. In terms of technical assistance in
complying with NGAS, COA, DBM, and BLGF should extend more assistance to make
LGUs – from provincial to barangay levels – become more adept at making use of the
system. The usual complaint of LGUs in the LSD areas is the difficulty of following the
policy guidelines despite the technical assistance being provided by the next higher tier of
LGUs and the national government agencies (NGAs). The other reason has to do with
the constant change in the memorandum circulars, standards, and guidelines by the
NGAs; thus, creating confusion among LGUs in the process. More often than not, they
are confused as to which of the ever-changing resolutions, standards, and policy
guidelines they are to supposed to follow and how best to follow them. Streamlining the
processes and procedures, setting clear policy guidelines and standards, and providing
86
Per COA Circular NO. 2001-2005 dated October 30, 2001, and effective January 1, 2002, all LGUs
except barangays have been prescribed to use the National Government Accounting System (NGAS) to
―ensure proper accounting of all financial transactions of the Local Governments.‖ Based on international
standard, NGAS was developed in line with one of COA‘s priority reform measures titled, ―Government
Accounting Simplification and Computerization.‖ It is a ―simplified set of accounting concepts, guidelines
and procedures designed to ensure correct, complete and timely recording of government financial
transactions, and production of accurate relevant financial reports.‖ Based on the interviews, though
barangays are exempted from NGAS, they are made to follow it as a guideline in doing financial reports.
239
effective training and technical assistance, among others, would ensure positive
development gains. This would also erase the wrong impression (based on one of the
interviews of the local financial committees) that NGAs do not have anything more to do
in a decentralized structural arrangement and are just justifying their positions in every
circular, standard, policy guideline that they set. In concrete terms, this would correct the
belief from below that: ―Those in the national government are armchair generals while
we in the LGUs are the marshals doing the dirty work.‖
1.7 Local autonomy by and for whom? There is a question on the local autonomy of
barangays vis-à-vis the 20% barangay development fund mandated to be allocated mostly
on infrastructure development. Most barangay officials who were interviewed in both
LSD areas think that such a mandate per DBM-DILG Joint Memorandum Circular No. 1,
s. 200587
violates their local autonomy, especially when they have development priorities
that place infrastructure development as secondary in importance. They believe that local
autonomy should be made to work for the development programs, activities, and projects
based on the local situations and needs of the people, and not from NGAs however good
the latter‘s intention may be for having a policy bias towards infrastructure development.
1.8 Service Standards. In terms of service standards (which can be measured in terms
of achieving MDG or national targets), there are good news and bad news. Based on the
comparative assessment made in the previous chapter, both Agusan del Sur and
Dumaguete City are doing well in attaining some targets but at the same time are
struggling in other targets in the three sectors. The main reason for this is the presence of
success and failure factors within the context of development constraints (e.g. lack of
funding) and opportunities (e.g. economic pay-offs) and the dynamics of social, political,
and economic environments. Unless institutional actors, primarily LCEs, cease being
complacent about the seemingly intractable constraints and seize the opportunity to
improve on local service delivery, failure factors would override success factors.
1.9 Success and Failure Factors. In Agusan del Sur and Dumaguete City, there are
success and failure factors (which may be taken to be best practices or bottlenecks) that
serve as determinants of the quality or ineffectiveness of local service delivery. Both
LSD areas appropriate, in one way or another, the established success and failure factors
in the literature. Success factors include, but are not limited to: (i) effective leadership,
political will, and enlarged concept of service delivery of LCEs, (ii) exercise of demand-
side of governance within the framework of empowerment and accountability, (iii) less
dependency on IRA and more reliance on own-source revenues and other sources for
sustainable financing of local service delivery, (iv) clear assignment of roles and
responsibilities of institutional actors, as well enhanced capacities for effective
functionality within the context of transparent, participatory, rules-based, and accountable
governance, (v) strengthening of strategic alliances and partnerships with civil society
87
DBM-DILG Joint Memorandum Circular No 1. s. 2005, September 20, 2005, ―Guidelines on the
Appropriation and Utilization of the 20% of the Annual Internal Revenue Allotment (IRA) for
Development Projects‖.
240
groups, private sector, and international donors, (vi) focusing on inclusive human
development priorities that target the real poor and making them both participants and
beneficiaries of development processes and outcomes. The failure factors include, among
others: (i) too much politicking at the expense of development gains, (ii) inept,
inefficient, corrupt local public officials and service providers, (iii) lack of political will
to turn constraints into opportunities, (iv) lack of implementation, monitoring, evaluation
frameworks for accountable performance, (v) lack of absorptive capacity for devolved
functions, (vi) over-dependency on IRA, PDAF and less inventiveness to make use of
own-source revenues, (vii) apathetic, if not illiterate, people who are incapable of
catalyzing the demand-side of governance.
1.10 Supply and Demand-side of Governance. The effectiveness of local service
delivery hinges on the nexus of supply-side and demand-side of governance. Both are
equally important and both should be taken into account. The supply-side refers to those
processes, services, and infrastructure (e.g. health facilities, schools, water districts
provided by service providers or public officials), while the demand-side has to do with
those rights-based demands of the people for quality services such as better educational
outcomes, quality healthcare, and safe drinking water. In Agusan del Sur as well as in
Dumaguete City, both are a big problem. Supply-side problem is having the hard
infrastructure such as health facilities, school buildings, and water districts, but without
having the well-trained medical staff, qualified teachers and supplies, and skilled
personnel to man them. Demand-side problem is present when local officials practice
nominal or token participation of local constituents in development processes such as in
barangay general assemblies where development priorities are supposed to be discussed,
debated, and agreed upon based on needs, availability of resources, and contributions –
material or otherwise. The key finding in most interviews, especially at the barangay
level, is that constituents are given venue - usually in general assemblies - to suggest
development priorities but the final decisions would still be local public officials‘. In
cases where most priorities emanate from the constituents, there are no mechanisms in
place for monitoring and evaluation; hence, not enough democratic space for
accountability for performance. Further, there is even a question on how capable are
local public officials in practicing democratic processes considering their limited, if not
lack of, training on the same. Moreover, the demand-side of governance becomes a
problem when most constituents are not educated and therefore are incapable of grasping
the complexities and intricacies of the dynamics and factors affecting local service
delivery, much less be empowered to take public officials to account for their policy
actions. This is more of a problem in Agusan del Sur than in Dumaguete City where local
people in the latter are mostly urban residents, well-informed, and educated. Needless to
say, urban-rural dichotomy impacts on people‘s empowerment and the demand for an
improved supply-side of governance.
1.11 The Politics of Service Delivery. Politics –both its positive sense of being a tool of
well-meaning politicians for improved service delivery, and its negative sense of being a
tool of self-serving politicians for political accommodation at the expense of service
delivery – plays an important role in the local service delivery in both LSD areas. In
Agusan del Sur, Governor Plaza acknowledges the possible difficulty of getting the
cooperation of Municipal Mayors to own up the provincial TINA project, but is
241
determined to make them believe in it by capitalizing on the prospective benefits of the
project to all constituents, particularly the poor households. Politics in its positive sense
would have to entail inter-LGU cooperation on such project for the poor. At the barangay
level, politics is used in its negative sense when BHWs, for example, are changed upon
the assumption to office of new barangay officials. Technology transfer and the rapport
established with clients, which both take a long time to imbibe and nurture, would go to
naught simply because of political accommodation for those in close connection with the
newly-elected officials. This case does not happen in Dumaguete City where there has
been no case of barangay captains changing their BHWS. Part of the reason is that it is
the city government that pays for the services of BHWs. Instead of being given honoraria,
they are issued job order, thus making them casual employees of the city government.
Also, the approval or disapproval of LCEs of the proposal for SEF allocation by the local
education officials in both LSD areas may have a political undertone to it - whether for
good or ill. Not to mention the mismatched of priorities by congresspersons, LCEs,
DepEd with regard allocation of classrooms and school buildings resulting to classroom
shortage, among things. Further, the good relationship that one has with the top echelons
of the political hierarchy (Governor and congressperson, for example) has a positive
effect of being granted funds needed for development PAPs. The flip side is that, another
barangay captain for example, would find it hard, if not impossible, to get funding from a
congressperson, if he/she does not gain his/her trust; thus, creating negative impact on the
much-needed development PAPs for the constituents.
1.12 Public-Private Partnerships. Public-private partnerships (PPPs) are important
component of an improved local service delivery. As evidenced in the sectoral
discussions and analysis, there are few instances where the private sector has been
involved in local service delivery. Some of these are: family planning services and
membership in LHBs for health; Adopt-a School program, GASPTE program, and
procurement process for education; and bottled water provision and household self-
provision for water. Though these are important programs, activities, and projects, they
have yet to be scaled up in order to maximize the full benefits of PPPs. One PPP that
could help LGUs further provide financing for local service delivery in Agusan del Sur
and Dumaguete City is easy access to loans through private depository banks. NG should
create an enabling environment for such arrangement instead of monopolizing all LGU
loans through government financial institutions (GFIs) such as Landbank and DBP. The
other important PPP is in fully maximizing the benefits of BOT law where LGUs can
enter into BOT contract for development programs. NGAs do have an important role to
play in helping LGUs in Agusan del Sur and Dumaguete City venture into such BOT
arrangements.
242
2. Five Conclusions
2.1 Complementarities of 3 sectors as human development priorities. In Agusan del
Sur and Dumaguete City, as well as elsewhere in the country, education, health, and
water are all complementarities. All three are: (i) about human concerns that need to be
prioritized for long-term positive impact on sustainable human development, and local
and national development; (ii) about rights, entitlements, and normatives that must be
valued, respected, and helped realized for development dividends and improved standard
of living, (iii) deeply inter-linked in that the effective, equitable, and quality delivery of
one bears impact on the other, (iv) about sharing the burden of responsibilities and
grappling with the dynamics of constraints and opportunities embedded in decentralized
context with political, economic, and social underpinnings; (v) demanding an improved
policy environment, sustainable financing, and institutional governance for their
improved delivery, and (vi) demanding sustainable provision and serious attention from
the government beyond the political winds of expediency.
2.2 Decentralization as an enabling environment for an improved local service
delivery. One promise of decentralization is better local service delivery for the local
people. However, as a key finding in Agusan del Sur and Dumaguete City, for
decentralization to create an enabling environment for better delivery of public goods and
services, its design must be one that takes into account proper phasing and rightsizing as
a way to capacitate both national and local authorities for their new devolved functions.
In health, for example, with almost two decades of devolving health to the different tiers
of local government, LGUs have yet to (i) assume unambiguous delineation of health
care-related responsibilities (e.g. personal and public health care services), (ii) capacitate
themselves to better perform at rendering public goods and services assigned to them by
the LGC, (iii) learn to work with DOH on shouldering functions (e.g. curative and
preventive health care provision) and cost-sharing (e.g. provision of iron supplements,
syringes for EPI use). In the education sector, for decentralization of basic education to
be fully practiced and be made to benefit the target beneficiaries, proper phasing and
rightsizing of yet-to-be devolved powers, functions, and responsibilities must be done.
The SBM approach, with its emphasis on principal empowerment and stakeholder‘s
involvement in education matters, is indeed a step in the right direction. However, clear
delineation of duties and responsibilities, institutional capacities, and sufficient funds,
among other prerequisites, is no less imperative between central and field offices.
Otherwise, decentralizing education, in its political aspect of devolution, may suffer the
same fate as in the health sector. The same is true with the water sector. For LGUs to
better perform at their own-managed water systems, for example, clear delineation of
powers, functions, and responsibilities; institutional development; and sustainable
financing or effective fiscal transfer must go hand in hand with high expectations to
deliver desirable results. The 3Fs –functions, functionaries, and funds – and the design
of decentralization – 3Ds (devolution, deconcentration, delegation) or its political,
243
administrative, financial, and market-based characteristics – must be carefully balanced
and calibrated as a work in progress for better local service delivery. Moreover, the
relationship between decentralization and effective service delivery becomes associative
than causative when the policy, institutional, and financial components are not valued as
interrelated or triangulated.
2.3 Interdependence of Policy, Institutional, and Financial Aspects. In Agusan del
Sur and Dumaguete City, improving local service delivery greatly hinges on its three
components, i.e. policy, institutions, and finance. But the effectiveness, sustainability,
equity, and quality of local service delivery deeply depend on the logic of
interdependence of the three components. Put differently, without good policy
environment as well as policy effectiveness, then institutional deficits and financial gaps
would persist to be perennial problems. The lack of coherent and robust policy and
regulatory framework for the water supply sector, for example, creates a certain
institutional limbo/fragmentation as to who is responsible for who and for what roles, as
well as where should funding go for effective project implementation. This goes to show
that local service delivery of education, health, or water must be triangulated by policy,
institutions, and finance, and more specifically, by good policy environment, efficient
intergovernmental financial system and management, and accountable institutional
actors. As evidenced in the findings in Agusan del Sur and Dumaguete City, local
service delivery is a complex interdependence of three components, each of which
contributes to the integrative approach of effective provision of public goods and
services. But an equally important idea, and as the value added of this study, the
institutional actors take a primordial role in filling in the policy and financial gaps as the
usual constraints for effectively delivering local services.
2.4 Accountability. Accountability is a key factor in effectively delivering services to
the public. But it is one that should be underpinned by at least four of its characteristics:
accountability for whom and to whom, as well as downward and upward accountability.
In Agusan del Sur and Dumaguete City, accountability for whom has to do with the
performance in local service delivery for the best interests of the people, especially the
poor, while accountability to whom refers to the political obligations of elected officials
to their constituents to deliver on their promises. Downward accountability is the
answerability and enforceability of rules-based PAPs by the local officials, while upward
accountability is the ability of the people to effectively take elected officials and service
providers to account for their policy actions. In both LSD areas, the usual justification
given for not delivering on PAPs promised to the people are resource constraints, lack of
coordination among LGUs, and apathy of the people themselves. These have become
common refrain, not only in the two CPC 6 areas, but also in any LGU nationwide.
Though these may be considered as valid justifications, the LGUs must find ways to
practice accountability in spite of them, and make people practice upward accountability
as a demand-side of governance. Effective leadership, political will, strategic alliances
and partnerships with like-minded people and organizations, and innovative ideas should
be aimed at by local leaders. For only when both service providers and beneficiaries
become accountable towards one another, can the justifications on resources constraints,
244
lack of coordination, and apathy cease to be just alibis for ineffective and corrupt
leadership, inefficient bureaucracy and public administration, and uninformed people.
2.5 Political, Economic, Social Dynamics. The political, economic, social dynamics, in
both the local and national levels, bear impact on the effective delivery of public goods
and services in particular and the attainment of the eight MDGs in general. Absence of
effective political leadership that practices good governance, efficient financial
administration, sustainable partnerships with civil society, private sector and international
donors; lack of economic growth with equity as well as macroeconomic stability; and,
lack of social infrastructure such as social capital, social safety nets, and empowered
people create bottlenecks for effective local service delivery. The interconnection of the
three cannot be over-emphasized. In analyzing and understanding the local service
delivery systems and practices in Agusan del Sur and Dumaguete City therefore, one
must factor in the political, economic, and societal dynamics for an informed perspective
on the success and failure factors with the view to crystallizing what works and what
cannot.
245
3. Recommendations
The following are the sector reforms and recommendations formulated based on sector
analyses of the three sectors on education, health, and water.
3.1 Sectoral Reforms and Recommendations
3.1.1 EDUCATION
3.1.1.1 Improving utilization of allocated MOOE. Several barriers towards full and
better utilization of allocated MOOE can be identified. The clear inadequacy of allocated
MOOE is one reason why schools continue to collect fees despite the prohibitions, often
directly or through the PTCA. Thus all avenues for improving the utilization of allocated
MOOE must be exhausted. Efforts towards the empowerment of schools towards self-
improvement have been accompanied by fiscal decentralization with the direct release of
funds to implementing units, particularly secondary schools with financial staff.
Elementary and secondary schools without financial staff, however, remain financially
dependent on the division offices. This dependence tends to hamper fund utilization and
reduce the influence of schools over the kind and quality of purchases. Among the easiest
change to implement is for division offices to increase the proportion of the MOOE
provided in cash to dependent schools. To lessen dependence the division office, the
department is currently implementing assigning a financial staff to a cluster of nearby
schools. The designation of teachers as financial staff in the interim creates a trade-off
between fiscal empowerment and learning outcomes, as teachers‘ financial
responsibilities interfere with their teaching functions. The creation of new items for
financial staff, on the other hand, would translate to an estimated additional personnel
cost of P3.7 billion88
for the department. Designating financial staff is then more feasible.
But to ease the burden on teacher-designates, the liquidation procedures should be
simplified and bonding requirements relaxed. The utilization of MOOE by dependent
schools is often slow owing to the requirement of monthly liquidation of cash advances.
A less frequent liquidation may ease this burden but this may require government-wide
change as this is a standard requirement for the whole bureaucracy.
3.1.1.2 Clarifying roles and accountabilities of institutions for greater coordination.
Institutions, processes and instruments introduced from different perspectives have
resulted in overlapping roles. The LGC created the Local School Boards (LSB) at the
province, city and municipal levels which are geographic-centric. The BESRA created
school-centric institutions such as the School Governing Council (SGC) and the School
Improvement Plans (SIP). Another school-centric institution is the PTCA. As a
consequence, the assignment of roles, accountabilities and expenditure items is not clear.
One vehicle for a coordinated assignment of expenditure items is to make the SIP the
framework for school-based expenditure needs. The SGCs can then bring the SIPs to the
88
Rough computation based on 37,000 positions at 100,000 per annum.
Formatted: Strikethrough
Comment [m14]: As we commented earlier, the SIP is more a tool for school-based planning and is not an entity.
246
corresponding LGUs and the LSBs which by law collect and manage the SEF,
respectively. The PCTA can also make the SIP the guide in their supplementary
voluntary collection efforts. One apparently overlooked item is that while the
city/municipality LSBs have clear jurisdictional coverage, the role of provincial LSBs is
not as clear. The DILG may need to specify an expenditure assignment rule for LSBs at
the different administrative levels. Expenditure externalities beyond municipal/city
boundaries can guide the spending assignment of provincial LSBs. Finally, enhancing
community support and participation in improving school outcomes would require a clear
definition of and explicit agreement on the roles of the different stakeholders – the PCTA,
the school officials, LGU officials and NGOs. The fact that this varies from school to
school and from one LGU to the next means that the existing definitions may not be clear
enough.
3.1.1.3 Improving compliance to compulsory basic education. The department has
gone to great lengths in implementing the constitutional guarantee of free basic
education. The compulsory feature of elementary education, however, has been given
practically no attention. It has been argued that schools focus on keeping enrolled
students in school while missing to bring all eligible students to school. In this regard,
schools must work together with the Barangay council and Sangguniang Kabataan to
enlist all school-age children. It would be helpful for Congress to pass a law on how local
governments, schools and other stakeholders should coordinate to promote enrolment and
on financing at the compulsory basic education level. Community pressure is effective in
effecting compulsory attendance. Meanwhile, although high school education is free, it is
not compulsory. Children / youth aged 12 to 15, whether having taken elementary
education or not, are not compelled to go to school and, especially the poor, are more
compelled to work, notwithstanding the prescribed working age. Thus, measures to curb
child labor are corollary to ensuring school participation as non-participation in school is
primarily attributed to poverty and hunger. School / community feeding programs also
present a promising solution to hunger and non-participation among school-age children.
School-based feeding programs are also potentially more sustainable than national
feeding programs as they rely on locally-available resources. It should, however,
complement rather than replace the national feeding program. Schools / communities can
supplement the rice provided under the national feeding program with locally grown
fruits, vegetables, etc.
3.1.1.4 Improve funding effectiveness to address equity. Policy prescribes budgeting
from the district level up to the regional level. The department‘s budget strategy advises
budgeting based on situational analysis and school improvement plans. However, there is
no evidence that varying school needs are considered in the department budgeting. For
one, school MOOE per capita is largely the same across schools. Secondly, district
offices rely practically entirely on the local government special education fund. Thus,
schools in poorer areas with lower real property taxes suffer from less district supervision
and assistance. Thirdly, voluntary collection by PTCAs is also dependent on the spending
capacity of households. The department should formulate a policy to guide budgeting
from the school-level up to the district, division and regional levels that would provide
for careful consideration of school and district needs particularly addressing equity
issues.
Comment [m15]: In terms of delineation of roles between the Prov’l LGU and the Municipal LGU , the following could be considered: the MLGU could focus their SEF on elementary schools while the PLGU can consider both levels and also serve as an ‘equalizer’ – that is, providing more resources to the less endowed municipalities.
Comment [m16]: This is exactly what we have been driving at – we don’t need more laws legislated , what is needed is enforcement of the existing Anti-Truancy Law . DepED, in partnership with the League of Provinces , Cities and Municipalities could develop guidelines and agree to push for passage of local ordinances for this purpose.
Comment [m17]: YES!!!
247
3.1.1.5 Clarifying accountabilities for education outcomes at different levels. The
2007 Budget Strategy provides a promising direction towards performance-based and
accountability-focused budgeting. However, although there are clear organizational
performance indicators, it is unclear whether there are guidelines on setting targets at the
regional, division, district and school levels. The Quality Assurance and Accountability
Framework needs to be operationalized further to identify accountabilities for certain
outcomes across the bureaucracy and provide a system of sanctions to reward good
performance and penalize poor performance. For instance, a lot of resources are under
the control of the Division Superintendent (an appointee of the President) who is
apparently not directly responsible for specific education outcomes. It is not even clear
how disciplinary actions for Division Superintendents are administered and for which
failures. Only the Secretary of DepEd is clearly accountable for all education outcomes.
Under RA 9155, the selection and promotion of division superintendents and assistant
superintendents are under the Secretary through a selection and promotions board.
However, it does not explicitly include disciplinary authority. Finally, with SBM
accountabilities and corresponding disciplinary actions for school principal should
likewise be clearly specified.
3.1.1.6 Promoting SBM. Improving empowerment at the school level has produced
significant desirable outcomes. There are, however, indications of side movements and
even reversals. One, the SBM Grant has significantly augmented the MOOE of schools,
particularly dependent schools which draw their MOOE from the divisions. However,
contrary to the intent, it was utilized simply as regular MOOE. For SBM grants to be
effective in influencing outcomes, the submission and assessment of proposals for SBM
grant should be based on clear links between the expenses, activities, outputs, objectives
and goals. Two, the hiring of school teachers has always been lodged with the division
office. Nevertheless, school heads were given influence in the evaluation of applicant-
teachers until recently when evaluation was assigned back to the division. This represents
a regression in school empowerment. Department policy should be modified to provide
school heads greater role in the selection of school teachers without compromising
objectivity and merit.
3.1.1.7 Greater coordination in school building program. The prioritization of school
buildings is too dependent on the division office and prone to the political interference of
congressmen, governors and mayors. Regional offices should endeavor to evaluate the
equity of the distribution of school buildings and report inequities to the Secretary in
view of disciplining division superintendents. The Department of Education has very
limited role in the bidding for the DPWH-led construction of classrooms, only as
observer. Moreover, there were failures in coordination between the DPWH and DepEd
personnel. These may be attributed to the nominal role of DepEd in the program. To
ensure its success, the School Building Program and the funds thereof should be jointly
administered and managed by the Department of Education and the DPWH. A special
Bids and Awards Committee should be constituted to include the Department of
Education division office, the district supervisor and the school principal. As to school
furniture, there are overlaps between the central, regional, and division offices in the
provision of school furniture.
248
3.1.1.8 Greater LGU spending per capita. Local governments have had an increasing
role in the provision of education, assuming a greater role in financing local education
needs primarily maintenance and operations but also personal services and capital outlay.
However, there are indications that spending per capita is declining (Manasan, 2009).
One tangible indication, given the huge and growing demand for teachers and the limited
resources of local governments, LGUs are increasingly unable to pay teachers‘ salaries as
much as those paid by the national government. So, instead of hiring teachers, local
governments are increasingly supporting Para-teachers / volunteers who are given lower
wages and no benefits. To address this, local governments should not only rely solely on
the SEF for the provision of education. The general fund of local governments should be
tapped to finance education, particularly the 20 percent development fund as some LGUs
are doing.
3.1.1.9 Improving fund management capability of PTCAs. PTCAs play a very
important role in mobilizing resources for school administration and improvement.
However, their capacity to manage their finances and administer their programs seems to
be largely overlooked. This is evident in the absence / poor quality of financial reports of
many PTCAs – a particularly critical function in a voluntary contribution scheme. Thus,
the capabilities of PTCAs in planning, budgeting, project implementation, monitoring and
evaluation, and financial management should also be strengthened.
3.1.2 HEALTH
3.1.2.1 Clear Understanding of LGU roles in health care provision. According to the
NOH 2005-2009, it appears that there is confusion among LGUs to what their role in
health services delivery is. Surveyed areas for this study shows that prioritization of
health programs is very much dependent on LCE preferences. The National Government
(NG) has not clearly defined what are the public health goods and programs that have to
have national funding so as to ensure universal coverage as well as promote public
welfare, reduce out of pocket expenses, and when LGUs are assigned to procure,
availability varies throughout that does not warrant timely availability and full coverage.
Thus, there is an urgent need for a dialogue between LGUs and DOH on the clear
delineation of responsibilities on vertical public health programs.
Table 10.1 below provides a summary of resource requirements, achievements, and
bottlenecks in selected maternal and child care programs. It can be observed that most
programs that are supported by the national government in terms of commodities have
high achievements (i.e., micronutrient supplementation) compared to those that are left
on LGUs (i.e., iron supplementation, family planning).
Comment [m18]: The PTCAs or the SGCs should play an active role not just in resource mobilization but also in formulating, implementing and monitoring the School improve Plan (SIPs). They can play a more proactive role in ensuring school resources actually reach the schools and in monitoring such pervasive leakages as teacher absenteeism or tardiness.
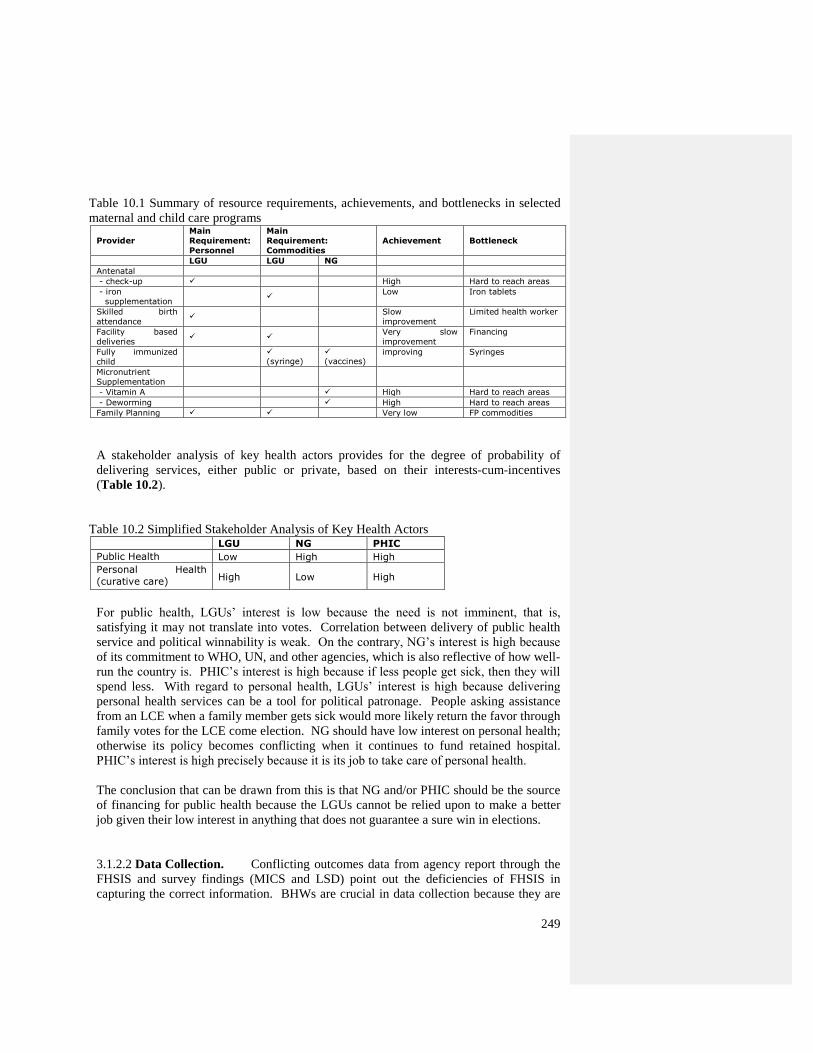
249
Table 10.1 Summary of resource requirements, achievements, and bottlenecks in selected
maternal and child care programs
Provider Main Requirement: Personnel
Main Requirement: Commodities
Achievement Bottleneck
LGU LGU NG
Antenatal
- check-up High Hard to reach areas
- iron supplementation
Low Iron tablets
Skilled birth attendance
Slow improvement
Limited health worker
Facility based deliveries
Very slow improvement
Financing
Fully immunized child
(syringe)
(vaccines)
improving Syringes
Micronutrient Supplementation
- Vitamin A High Hard to reach areas
- Deworming High Hard to reach areas
Family Planning Very low FP commodities
A stakeholder analysis of key health actors provides for the degree of probability of
delivering services, either public or private, based on their interests-cum-incentives
(Table 10.2).
Table 10.2 Simplified Stakeholder Analysis of Key Health Actors LGU NG PHIC
Public Health Low High High
Personal Health
(curative care) High Low High
For public health, LGUs‘ interest is low because the need is not imminent, that is,
satisfying it may not translate into votes. Correlation between delivery of public health
service and political winnability is weak. On the contrary, NG‘s interest is high because
of its commitment to WHO, UN, and other agencies, which is also reflective of how well-
run the country is. PHIC‘s interest is high because if less people get sick, then they will
spend less. With regard to personal health, LGUs‘ interest is high because delivering
personal health services can be a tool for political patronage. People asking assistance
from an LCE when a family member gets sick would more likely return the favor through
family votes for the LCE come election. NG should have low interest on personal health;
otherwise its policy becomes conflicting when it continues to fund retained hospital.
PHIC‘s interest is high precisely because it is its job to take care of personal health.
The conclusion that can be drawn from this is that NG and/or PHIC should be the source
of financing for public health because the LGUs cannot be relied upon to make a better
job given their low interest in anything that does not guarantee a sure win in elections.
3.1.2.2 Data Collection. Conflicting outcomes data from agency report through the
FHSIS and survey findings (MICS and LSD) point out the deficiencies of FHSIS in
capturing the correct information. BHWs are crucial in data collection because they are
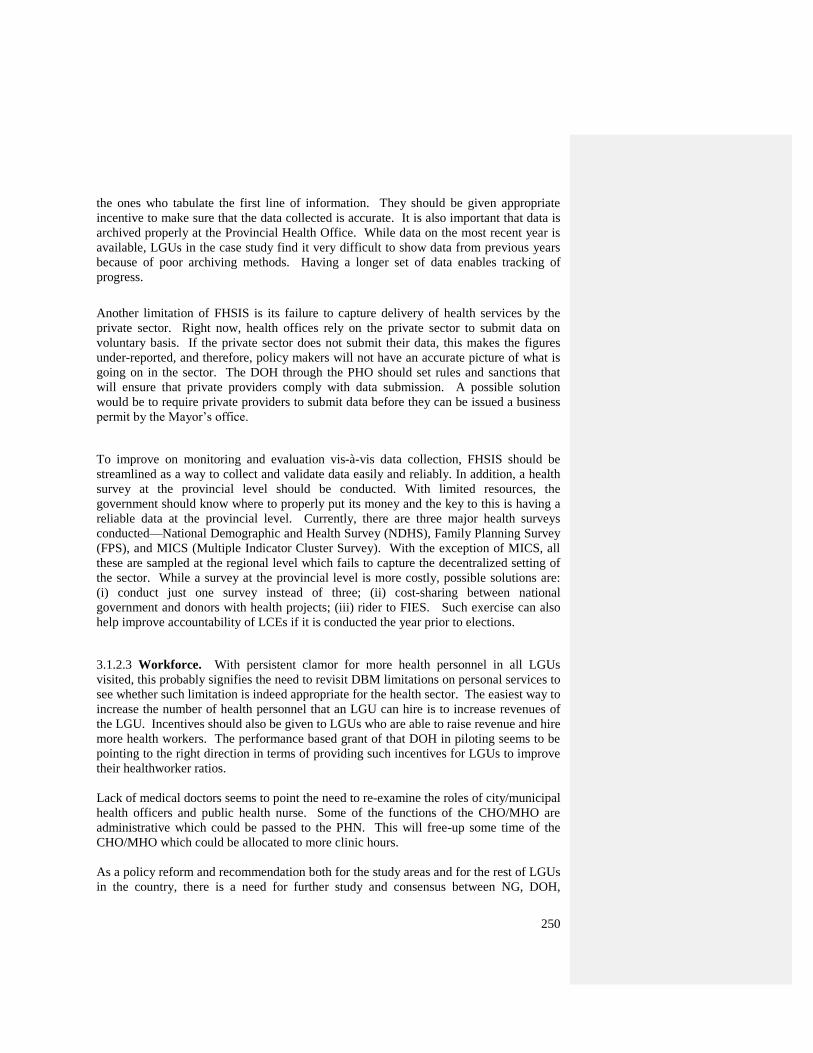
250
the ones who tabulate the first line of information. They should be given appropriate
incentive to make sure that the data collected is accurate. It is also important that data is
archived properly at the Provincial Health Office. While data on the most recent year is
available, LGUs in the case study find it very difficult to show data from previous years
because of poor archiving methods. Having a longer set of data enables tracking of
progress.
Another limitation of FHSIS is its failure to capture delivery of health services by the
private sector. Right now, health offices rely on the private sector to submit data on
voluntary basis. If the private sector does not submit their data, this makes the figures
under-reported, and therefore, policy makers will not have an accurate picture of what is
going on in the sector. The DOH through the PHO should set rules and sanctions that
will ensure that private providers comply with data submission. A possible solution
would be to require private providers to submit data before they can be issued a business
permit by the Mayor‘s office.
To improve on monitoring and evaluation vis-à-vis data collection, FHSIS should be
streamlined as a way to collect and validate data easily and reliably. In addition, a health
survey at the provincial level should be conducted. With limited resources, the
government should know where to properly put its money and the key to this is having a
reliable data at the provincial level. Currently, there are three major health surveys
conducted—National Demographic and Health Survey (NDHS), Family Planning Survey
(FPS), and MICS (Multiple Indicator Cluster Survey). With the exception of MICS, all
these are sampled at the regional level which fails to capture the decentralized setting of
the sector. While a survey at the provincial level is more costly, possible solutions are:
(i) conduct just one survey instead of three; (ii) cost-sharing between national
government and donors with health projects; (iii) rider to FIES. Such exercise can also
help improve accountability of LCEs if it is conducted the year prior to elections.
3.1.2.3 Workforce. With persistent clamor for more health personnel in all LGUs
visited, this probably signifies the need to revisit DBM limitations on personal services to
see whether such limitation is indeed appropriate for the health sector. The easiest way to
increase the number of health personnel that an LGU can hire is to increase revenues of
the LGU. Incentives should also be given to LGUs who are able to raise revenue and hire
more health workers. The performance based grant of that DOH in piloting seems to be
pointing to the right direction in terms of providing such incentives for LGUs to improve
their healthworker ratios.
Lack of medical doctors seems to point the need to re-examine the roles of city/municipal
health officers and public health nurse. Some of the functions of the CHO/MHO are
administrative which could be passed to the PHN. This will free-up some time of the
CHO/MHO which could be allocated to more clinic hours.
As a policy reform and recommendation both for the study areas and for the rest of LGUs
in the country, there is a need for further study and consensus between NG, DOH,
251
Congress, DoF, DBM, NEDA and LGU on HW issues (even for public health
commodities) as preparation for policy issuance. DOH would need to prepare a good
advocacy policy tool on this issue. DOH can also opt to deploy nationally funded
midwives in IRA-dependent LGUs, provide HW benchmarks to LGUs and cities in F1
grants as well as revive the Sentrong Sigla awarding to drive LGUs in meeting public
health worker standards for quality care.
3.1.2.4 Mobilizing Societies. In mobilizing societies to strive for better health,
strengthening the role of BHWs, the grassroots health worker, could not be over-
emphasized. They should be given appropriate incentives to ensure that they carry out
their tasks.
At present, most Filipinos still equate health care to drugs and curative care. Health
education is key in changing mindset. Media campaigns are needed to focus thinking on
the importance of preventive care.
Private sector can fill in areas that are not undertaken by the government. In the case of
Dumaguete where the local government has a staunch belief against modern
contraception, donors can tap the private sector such as the OB-Gyne department of
Silliman Medical Institute in providing modern contraceptives. The sisters of Holy Child
Hospital could also step-up in educating the public on preventive care.
3.1.2.5 Sustainable Financing. Performance needs to be linked to the budget. The
targets set at the budget preparation form should not be treated merely as compliance to
the rules set by the central government. When matched with actual accomplishments,
LCEs can use this tool to hold its departments accountable to budget that was given to
them.
3.1.2.6 Identification of the true poor. Agusan del Sur recently passed a SP resolution
which stipulates the use of CBMS to correctly target Philhealth members. To minimize
leakage, validation exercises at the level of the barangay needs to be performed.
3.1.2.7 User fees in RHUs should not be levied to all clients. Exemptions for those in
the target client list particularly for maternal and child health programs should be
instituted to ensure that targets in these programs are met. Each facility who are
receiving capitation funds from Philhealth should also honor their promise of giving the
outpatient benefit package to the indigents to make them feel the benefits of joining the
insurance program.
3.1.2.8 Investing in infrastructure, logistics, facilities and management capacity. For
key programs such as EPI, supplies should be provided by the national government at all
cost. The central office may need to re-visit its policy of letting the LGUs purchase their
own syringes for EPI use. Such practice adds impediment to the implementation of an
otherwise very important program.
The LGUs in the study areas lament as to how expensive it is to provide 180 iron tablets
per pregnant woman. Rather than the current practice of procuring from medical
representatives, LGUs can take advantage of bulk procurement from the National Drug
252
Program-Project Management Unit (NDP-PMU) of the DOH. CHDs through the PHTs
should orient LGUs on how they can use such facility of the central office.
3.1.2.9 Reaching the client. While policies such as facility- based delivery is the right
step, its implementation needs to be tailored to the realities in the provinces. While it
might work in urban areas like Dumaguete city, rural areas in Agusan del Sur needs a
breach plan to be able to implement this policy. A persistent problem in Agusan del Sur
is reaching the client—a good practice that was done by DOH before decentralization is
providing affordable motorcycle loans to its medical personnel. There is also a need for
proper incentives to persuade hilots to refer their clients to medical personnel.
3.1.2.10 Enhancing quality of maternal and child health. There is a need to strengthen
the role of PHO in monitoring the quality of services being given by all providers. The
PHO should also be given power to ensure that private sector providers comply with
DOH protocols.
3.1.2.11 Hybrid decentralization. Given the many issues and problems – policy,
institutions, and financial – besetting the LGUs in the study areas, the Philippines may
have to rethink its health decentralization-cum-devolution program. Perhaps, it should
adopt a hybrid decentralization and not total health devolution program. Although there
have been attempts at fiscal reforms in Congress, where the cost of health devolution has
been proposed to be deducted from IRA prior to distribution of IRA to LGUs to enable
the latter, especially the provinces, to finance and deliver health services, such attempts
maybe inadequate as the problems are not only financial but also institutional and policy-
related as proven in the foregoing. DOH, Congress, DoF, DBM, NEDA, DILG, and
LGUs must see the wisdom of hybrid decentralization – which could very well be
applicable to education sector as a candidate for devolution89
– and adopt such policy
change. The lessons learned in devolving health need to be accounted for in devolving
education and other sectors. These are, inter alia: (i) need for clearly-defined roles and
responsibilities for all institutional actors; (ii) need for institutional capacities and
financial sustainability for the devolved services; (iii) need for effective policy-making
and implementation; (iv) need for effective monitoring and evaluation and strategic
implementation and intervention in areas with high degree of development impact; (v)
need for participatory and accountable governance in all stages of program cycle, i.e.
planning, implementation, monitoring and evaluation, and impact assessment; and (vi)
need for effective leaders as catalysts or drivers of change and models of replicable good
practices.
89
For some of the lessons for education from health devolution, see Philippine Human Development
Report (2009: 98-9).
253
3.1.3 WATER
3.1.3.1 Reforms and Recommendations for the Sector
1. Monitoring and enforcement must be strengthened by local governments
in the areas of illegal logging, water pollution and other related
management concerns. Deputization of the local population may help.
2. Distribution of local resources for water services delivery must be based
on equity and fairness to reduce the disparity between areas. This principle
may be institutionalized through local legislation if necessary.
3. Workable approaches in providing water services delivery to waterless
barangays must be developed. The potential of small-scale independent
providers (SSIPs) and BWASAs must be further exploited.
4. The private sector as fund sources must be considered as financial sources
in partnership with local governments. Other financing must be explored
including development lending institutions, donor agencies and NGOs.
5. High standards must be established in the selection of personnel in water
service delivery. These standards must be based on merits and
qualifications and not on political connections to help improve
institutional capacity.
6. Local institutions involved in water service delivery should conduct
relevant trainings and seminars to improve the management, technical and
other areas of competence of their staff for purposes of planning and
implementation.
7. BWASAs and water providers in rural areas must be strongly supported.
LGUs with limited financial resources can help organizationally by
seriously settling disputes among BWASA members and even providing
moral support. The establishment of BWASAs in areas with no existing
ones at present should be seriously considered.
8. Local legislation is needed to regulate certain aspects in local water
service delivery, particularly the small-scale extraction of groundwater.
Strengthened monitoring and enforcement is also necessary.
3.1.3.2 Reforms and Recommendations for Water Districts
1. Since socialized pricing is already practiced by the LWUA and water
districts, they should consider lowering the tariff rates of low income
households vis a vis other users. An alternative is to set up more public
taps for the poor.
2. The LWUA and water districts should consider increasing the rates of
higher income households and the commercial and industrial users who
have higher abilities to pay. This will help improve cost recovery.
3. Proper management of water sources and regular repair and maintenance
of facilities will improve water quality. The water districts should invest
more in the repair and maintenance of distribution lines.
4. The management and technical aspects of operations of water districts
must be improved to increase water pressure, reduce downtime, lower
non-revenue water and solve related problems. More training will help.
254
5. The water districts should develop cost-effective and indigenous
technologies and innovations to reduce dependence on imported
technology and lower the negative impacts of a high and fluctuating
exchange rate.
6. The water districts which have difficulty in paying their loans may request
for loan restructuring from creditors or counterpart funding from LGUs. In
the future they should seek sources of financing outside of government.
7. The water districts can already increase coverage and expand by doing
some of the reforms and suggestions mentioned above and by improving
overall customer service. Expansion will help them benefit from
economies of scale.
8. The water district should improved coordination with LGUs in local water
service delivery. Regular consultations and meetings with relevant LGU
units and personnel will help reduce the incidence of redundant water
service.
3.1.3.3 Reforms and Recommendations for LGUs
1. LGUs should prioritize and provide more of its own funding to local
public water service delivery. Since water is a basic need like food, it
should be a public function to provide it particularly in areas where it is
lacking or absent.
2. LGUs must develop a local moral recovery program and an effective local
check and balance system that will penalize offending and corrupt public
officials and employees.
3. LGUs must develop forms of incentives so that its personnel will perform
effectively in their respective functions. A fair and merit-based promotion
system for instance can motivate low-paid employees to work better.
4. Since sanitation is directly related to water provision, it should be given
emphasis by LGUs. It should be an integral concern under the program of
local water services delivery.
5. The establishment and strengthening of provincial, municipal, and
barangay Watsan units to integrate the function of water and sanitation
under one roof will address the fragmentation in functions in local water
service delivery at all levels.
6. Gender issues must be considered in the planning and implementation of
local water service delivery projects. Local public water systems must be
user-friendly to both men and women.
7. BWASAs and water providers in rural areas must be strongly supported.
LGUs with limited financial resources can help organizationally by
seriously settling disputes among members and even providing moral
support.
8. Tie-ups and partnerships with other sectors must be established. Joint local
water service delivery projects should be explored where individual costs
to partners are lessened but overall benefits to users are increased.
255
3.2 Cross-cutting Reforms and Recommendations
3.2.1 Policy
3.2.1.1 Adaptive and Responsive Approach than Prescriptive Approach to Policy-
Making & Implementation. Rather than taking a prescriptive approach to policy-
making and implementation, NG should learn to adopt an adaptive and responsive
approach. Unlike the prescriptive approach that is viewed as totally contrary to the spirit
of local democratic governance for espousing a one-size-fits-all policy-making and
implementation, an adaptive and responsive approach is, res ipsa loquitur, adaptive to the
local situations and responsive to the needs of local leaders, communities, and people.
For example, the effectiveness of DOH‘s policy on skilled attendance at delivery would
rely not just in complying with the international standard and practice on obstetric care,
but also in taking into account and being responsive to the local needs and situations of
poor pregnant mothers in rural areas, especially in Agusan Del Sur than Dumaguete City,
who are still incapable of giving birth at medical facilities and would rather choose home-
based delivery with TBAs. Proper phasing of adoption and selective implementation of
policy until such time that local communities and facilities can effectively implement
them may be a good policy action.
3.2.1.2 Inclusive Human Development Approach (Targeting the Real Poor). A good
policy is one that entails prioritizing human development concerns and services such as
primary and secondary education, maternal and child health, and potable water supply.
But a policy is more effective if its inclusive, equitable, and responsive to the needs of the
poorest sector of society or the chronically poor. The government – both local and
national – as well as its strategic alliances and partners in civil society and private sector,
should adopt an inclusive human development approach in policy-making and
implementation. Such approach would be able to target the real beneficiaries of
improved local service delivery and human development – the poor. Geographic and
household targeting would therefore be effectively enforced and implemented to create an
impact on poverty-reduction (Llanto 2008: 4-5). Using CBMS in correctly targeting
Philhealth members is a step in the right direction. The SBM grant, albeit needing
improvement in effective implementation and clear connection to school empowerment,
is a way to enhance equity by catering to the needs of the poorest schools (at least in
terms of performance or outcome indicators). This can be done also in the water supply
sector where poor households should be targeted as real beneficiaries and given priorities
to access and avail water supply services. The poor households in the upland areas
without connection to public water system should benefit from effective targeting and
prioritization. Since the government has already embarked on targeting system, being
applied to 4Ps for example, what it can do now is to develop an effective targeting and
monitoring system and apply it to be able improve local service delivery based on an
inclusive human development approach.
3.2.1.3 Performance-based, Results-Oriented Incentivism. A policy on incentivism
for best practices on local service delivery must be formulated and effectively
implemented, monitored, and evaluated. But such incentive system must be
256
performance-based and results-oriented. The logic is premised on the idea that ―Good
Performance Pays Off!‖ For example, LWUA may provide loan with low interest rates
for those WDs and WSPs that earn a certain minimum of profit annually. Also, DepEd
may grant incentives to schools, especially in localities with special needs such as in
conflict-prone areas in performing well in certain education outcomes despite constraints
and contingencies. This may complement the SBM grant. Further, DOH may grant
incentives to BHSs, RHUs/CHOs, hospitals that enable hilots to refer pregnant women to
BEmONC and CEmONC facilities, as well as LGUs that register high rates of enrolment
of Philhealth members with transparency. Moreover, DBM and DOF, through BLGF,
may grant incentives to those LGUs who are able to do well in resource generation, either
from external sources or their own-source-revenues. These may be in the form of less
taxes. With regard to matching grants, these could be about providing for low LGU
counterparting of funds.
3.2.1.4 Linking Local, Regional, and National Development Plans. For local service
delivery to create an impact on poverty reduction and national development, it must be
effectively formulated and implemented in a local development plan that is in line with
the regional and national development plans of the country. The effectiveness of a local
development plan would hinge on its complementarities with the regional and national
developments in terms of goals, targets, strategies, and PAPs. The provinces and
municipalities and city of the LSD areas have municipal, city, and provincial plans (e.g.
Annual Investment Plan or AIP). For an effective implementation of such development
and investment plans, important inputs from regional and national plans must be
embedded into them, especially those that have human development priorities and
challenges. Absent such linkage, local development plan would not be informed by the
micro and macroeconomic factors that create opportunities and constraints for the
country, as well as not strategically and deliberately attain goals beyond the locality.
3.2.2 Institutions
3.2.2.1 Creating Champions and Ensuring Local Leadership and Ownership of LSD
agenda. The argument of this study is that local leaders are key to an improved local
service delivery. Hence, the need for an effective local leadership that owns up local
service delivery agenda cannot be over-emphasized. Effective local leadership, primarily
by the LCEs, would be about (i) institutionalizing reform culture and effective change
management; (ii) prioritizing human development concerns and MDGs; (iii) having an
enlarged conception of public service delivery with a view to incessant improvement of
local service delivery systems, policies, and practices; (iv) practicing democratic
governance to create enlarged spaces for grassroots community participation by NGOs
and local communities themselves as both empowered beneficiaries and participants of
the development process; (v) practicing efficient financial administration for improved
MDG-related services by rationalizing the use of IRA and own-source revenues, as well
as tapping other sources and harmonizing their effective use such as grants, loans, and
donations, and (vi) practicing good governance. Given these institutional prerequisites
for effective leadership and ownership of LSD agenda, further training, education and
257
leadership enhancement of local leaders by the NG agencies, especially DILG, should be
done with a view to creating champions of LSD.
3.2.2.2 Enhancing Strategic Alliances and Partnerships (Civil Society & Private
Sector). The resources, ideas, and idealism of civil society groups and private sector
should be tapped in helping to improve local service delivery. They can be involved in
planning, financing, implementing, monitoring, and evaluating of PAPs related to basic
education, maternal and child health, and potable water supply. Enhancing strategic
alliances and partnerships with non-government organizations, people‘s organizations,
and local communities is a way to empower them to demand better services and
accountable governance (WB 2002, 2005). In Agusan del Sur, an NGO – Philippine
Center for Water and Sanitation, played a major role in (i) helping Watsan Center and
other other WSPs build and improve on their institutional development, (ii) organizing
Dona Flavia Water Supply and Sanitation, and (iii) providing potable water in the
province of Agusan del Sur. These are important achievements for the people and the
local government. They must be replicated in other localities. There is a need therefore
to further create an enabling environment for civil society partnerships and the spreading
of best practices in involving them in local service delivery system improvement.
Likewise, enhancing strategic alliances and partnerships with the private sector through
public-private partnerships (PPPs), would create a dent in enlarging the stakeholders of
development, improve local service delivery system and practices using the market
principles that work best in the private sector, and enlarging the concept of corporate
social responsibility (CSR) of private sectors in partnering for human development
concerns. Partnerships with the businesses in providing bottled water services or
contracting with MWSI and MWCI for water sector, with private schools for GASPTE
and Adopt-A-School programs for education, and private hospitals and institutes for
modern contraceptives for health are/could be instances of effective partnerships. The
need is to further create enabling environment for PPPs, and the spreading of best
practices in involving them in improving local service delivery and creating economic
opportunities for local development.
3.2.2.3 Strengthening of LGU capacities. As frontline service providers, LGUs must
have the needed capacities for effective local service delivery. These may include (i)
better performing the functions assigned to them per 1991 LGC, (ii) strengthening local
special bodies such as LDCs, LHBs, and LSBs as a way of empowering communities to
participate in decision-making in development plans, health budgeting, use of SEF, etc;
(iii) practicing efficient resource management and sound fiscal policy and discipline; (iv)
tapping civil society and private sector involvement in local service delivery and
development agendas; (v) better coordination among local governments and interfacing
with the national government, (v) harmonizing investments on the MDG-related sectors
(vi) practice good governance, that is, being transparent, accountable, responsive,
equitable, just, participatory, and rules-based in doing PAPs. As evidenced in the LSD
areas, most of these capacities-cum-functions have yet to be fully developed for making
local governments in Agusan del Sur and Dumaguete City perform well in attaining
MDG-critical services on education, health, and water. Enhancing LGUs‘ absorptive
258
capacity for decentralized powers, functions, and responsibilities would make a big dent
in improving local service delivery, local empowerment, and local development. But the
role of NG in such institutional capacity-building should be emphasized. For example,
based on the interviews of local finance officials –from barangay to the provincial level–
in the LSD areas, it was found out that they find it hard to make financial statements
following the New Government Accounting System (NGAS) that the Commission on
Audit (COA) implements for better auditing of LGUs. More enhancement training and
technical assistance in this regard should be extended from the NG.
3.2.3 Finance
3.2.3.1 Human Development Priority Concerns. NG and LGUs need to spend more on
human development priority concerns such as education, health and water. In the period
between 1996-2007, NG allocates close to 91% of its total spending on basic social
services to education, only 3% on health, and 1% on water. Moreover, between 1997-
2005, the cut in real per capita NG spending was deepest in basic water and sanitation
(29% annually on the average) and by basic health and nutrition (11%). With regard to
LGU expenditure, low priority was given to social services sectors in favor of public
administration in 2000-2007. Given the high return on investment on human priority
concerns, NG must prioritize increasing spending on them despite economic woes, fiscal
deficits, and financial crisis. Since most LGUs, the LSD areas included, are dependent on
IRA, financial sustainability should be guaranteed so as not to make vulnerable to
unpredictable IRA release and volatile macroeconomic factors, thus avoiding delay in
implementing PAPs that improve on local service delivery.
3.2.3.2 Allocative and Operational Efficiency. LGUs must practice allocative
efficiency and operational efficiency in order to rationalize the use of scarce resources or
limited funds. The mandated 20% allocation on development from IRA or the Local
Development Fund of every LGU must be optimized. This could be made possible by
allocating most of it on education, health, and water that yield high human development
dividends. Allocating on these human priority concerns also guarantees sustainability
since every centavo spent on them creates long-term positive development impact.
Practicing operational efficiency by rationally utilizing funds on PAPs related to MDG-
critical services would also ensure sustainability as scarce resources are maximized for
greater gain mostly by the poor beneficiaries. The practice of both allocative and
operational efficiency also would ensure better use of the taxes of the people and
maximal benefit of investment from non-government and external sources.
3.2.3.3 Enhancing Resource Management and Fiscal Capacity. The lifeblood of
financing local service delivery must be LGUs‘ own-source-revenues than IRA. Since
the enactment of 1991 LGC, IRA transfers have created disincentives for mobilizing local
sources of incomes. This has weakened the fiscal capacity of LGUs and has disinclined
to fully make use of their revenue-raising powers because: (i) most LGUs would rather be
highly dependent on IRA than raise own-source-revenues, (ii) there is continuing control
259
of NG on the productive tax base, (iii) the 1991 LGC imposes various limitations in
establishing local tax rates, and (iv) weak local administration (Llanto 2007: 333-4). On a
positive note, although all the LSD study areas are more dependent on the IRA than the
average LGUs, they have performed better than average in terms of own-source revenue
generation in 2003-2007. In 2006, both Sibagat and Agusan del Sur did well in their total
income per capita, unlike Negros Oriental, Dumaguete City, and Bayugan and
Prosperidad. The needed policy and financial reforms are: (i) improvement in local
revenue administration and financial management, (ii) aggressive and inclusive local
economic development, (iii) efficient bureaucracy and public administration, (iv)
lessening, if not eradicating corruption and wastage, and being transparent and
accountable in financing and implementing PAPs, (v) institutionalizing Multi-Year
Expenditure Framework, Organizational Performance Indicator Framework, and Cost
Reduction Measures; and (v) enhancing LGUs absorptive fiscal capacity.
Institutionalizing these reform measures would create positive effects. For as Brillantes
(2005:38) opines, ―The effectiveness of good fiscal transfers could be measured by their
‗effects on such policy outcomes as allocative efficiency, distributional equity, and
macroeconomic stability.‖ He further argues that ―Fiscal autonomy should be seen not
only as the transfers of authority to disburse fiscal resources at the local government level
but also the greater responsibility to carry out policies that would increase local revenue
earning capacity from local sources (Brillantes 2005: 40).‖
260
CHAPTER 11
Areas for Further Research
This chapter provides for some areas for further research for each sector on education,
health, and water.
1. EDUCATION
To the extent possible, this study has analyzed the various types of decentralization, or,
perhaps more aptly, the various components of local service delivery in education.
However, as may be expected in a study with such breadth, it is impossible to cover all
issues in depth. There remains, therefore, much scope for further study.
1.1 Private participation in education provision. The extent of private participation in
education provision is itself a rich study area.90
It would be worthwhile to assess the
differences in education outcomes between public and private schools. In light of the
foregoing analyses, the following areas of research can be pursued further.
1.2 Differential effects of multiple dimensions of poverty on education outcomes. It is
generally acknowledged that non-participation in school among eligible children is
mainly due to poverty. However, given the multiple dimensions of poverty, it would be
useful to determine the differential effects of various aspects of poverty on school
participation, in various areas or in each locality. In that way, the most appropriate local
solutions can be instituted. For instance, it may not be parents‘ unemployment or lack of
wherewithal that constrains them from sending their children to school but the general
inaccessibility of the school from their residence. The issue of child labor should also be
analyzed. It would be important to determine how much of those who do not attend
school actually work and what can be done to get them away from work and into schools.
Beyond the usual suspects, it would also be helpful to understand the role of community
pressure on effecting school attendance.
1.3 Impact of the use of local language as medium of instruction. In light of the recent
support given by the education department on the use of local language as medium of
instruction, it would be useful to study or clarify its impact on learning and assess the
support system necessary.
1.4 Impact of national and local spending on education outcomes. It would also be
useful to study the relative impacts of national spending and local spending on education
outcomes. Does local government spending make a difference? Which expenditures
should be assigned to which level of government?
90
This is called market decentralization in the study protocol.
Comment [m19]: There is sufficient evidence on this already, both from int’l and local studies/projects. What is lacking is a solid communication and advocacy program to disseminate such findings to critical stakeholders – legislators, parents, communities, LGUs. The DepED and the Summer Insitute of Linguistics has a rich body of knowledge and research evidence on this.
261
1.5 Analysis of the effect of fiscal decentralization and impact assessment of SBM. A
more rigorous analysis of the effect of fiscal decentralization on school management and
education outcomes is necessary. Similarly, an impact assessment of the school-based
management (SBM) grant will be useful.
1.6 In-depth assessments of the institutional arrangements and the allocation of
education inputs. More in-depth assessments of the institutional arrangements and the
allocation of education inputs are necessary. A separate assessment can be conducted for
each input including classrooms, seating, and textbooks. For instance, it would be
informative to conduct a thorough comparative assessment of the DPWH-led school
building projects and the DepEd-administered school building projects.
2. HEALTH
In light of the recommendations presented in the previous chapter, the following areas for
further research would be necessary to improve policies or programs and projects to
improve the local delivery of maternal and child care services:
2.1 LGU Philhealth counterpart funding. LGUs have been providing their counterpart
to help achieve universal PHIC coverage. It has been quite some time now since the
Sponsored Program has been implemented. Problems with the implementation are non-
enrollment of LGUs of their indigents, and inclusion of ―political‖ indigents in the
enrollment. A study on how the current system of LGU counterparting has contributed to
achieving universal PHIC coverage will be helpful, in order to help decide whether the
government shall continue with the current system, or if the national government shall
take full charge in achieving universal coverage.
2.2 Learning from well-managed delineation of responsibilities from other countries.
Delineation of public health responsibilities has not been settled, in terms of how
preventive and curative measures are defined. Once properly delineated, the assigning of
responsibilities to either NG or LGU can be managed. Studies on well-managed
delineation of responsibilities from other countries with a similar decentralized setup
would be helpful in studying our own system.
2.3 Performance-Based Grants. One of DOH‘s steps in order to support LGUs is
through Performance-Based Grants. To be able to implement this program well, DOH
needs a reliable baseline on the health needs of each province. A study on the existing
surveys of the NSO can be tailored to come up with comprehensive health survey
sampled provincial level is needed. Also, a study on how FHSIS reports can be
streamlined to make it easier for BHWs to collect. A study on how the central office to
validate the FHSIS is also needed. Finally, a study on finding the appropriate
combination of how grants to LGUs are to be made--a mix that caters to the minimum
health needs of the LGUs and at the same time, rewards well performers, should be
carefully studied.
262
3. WATER
The following are suggested areas for further research on local water service delivery in
Dumaguete City and Agusan del Sur and similarly situated provinces, cities and
municipalities in the country:
3.1 Analysis of the total demand and supply for potable water services. Analysis of
the total demand and supply for potable water services in local communities which can be
undertaken by PIDS or a similar national economic and policy research agency together
with PPDOs, CPDOs and MPDOs;
3.2 Evaluation of the economic and social impact of water districts and other water
service providers. Evaluation of the economic and social impact of water districts and
other water service providers in local communities which can be conducted by PIDS with
the water districts, PPDOs, CPDOs, MPDOs and LWUA;
3.3 Analysis of the environmental impacts of water districts and other water service
providers. Analysis of the environmental impacts of water districts and other water
service providers in local communities which can be done by PIDS or another economic
and policy research agency together with DENR, PENROs, CENROs and ENROs;
3.4 Evaluation of the impacts of global warming and climate change on water
services. Evaluation of the impacts of global warming and climate change on water
services in local communities which can be conducted by PIDS together with DENR and
the PENROs, CENROs and ENROs;
3.5 Analysis of the relationships between water and sanitation services. Analysis of
the relationships between water and sanitation services in local communities which can
be undertaken by PIDS with DOH, DECS and the local health, education and economic
planning agencies;
3.6 Evaluation of the impacts of waste disposal and drainage systems on the
provision of water services. Evaluation of the impacts of waste disposal and drainage
systems on the provision of water services in local communities which can be initiated by
PIDS with DPWH, DOH and the local public works, health and economic planning
agencies;
3.7 Analysis of market-based mechanisms to enhance water services. Analysis of
market-based mechanisms to enhance water services in local communities which can be
done by PIDS with DOF and the local finance and economic planning agencies; and
3.8 Evaluation of sustainable financing mechanisms to enhance water services.
Evaluation of sustainable financing mechanisms to enhance water services in local
communities which can be initiated by PIDS with DOF with the local finance and
economic planning agencies.

263
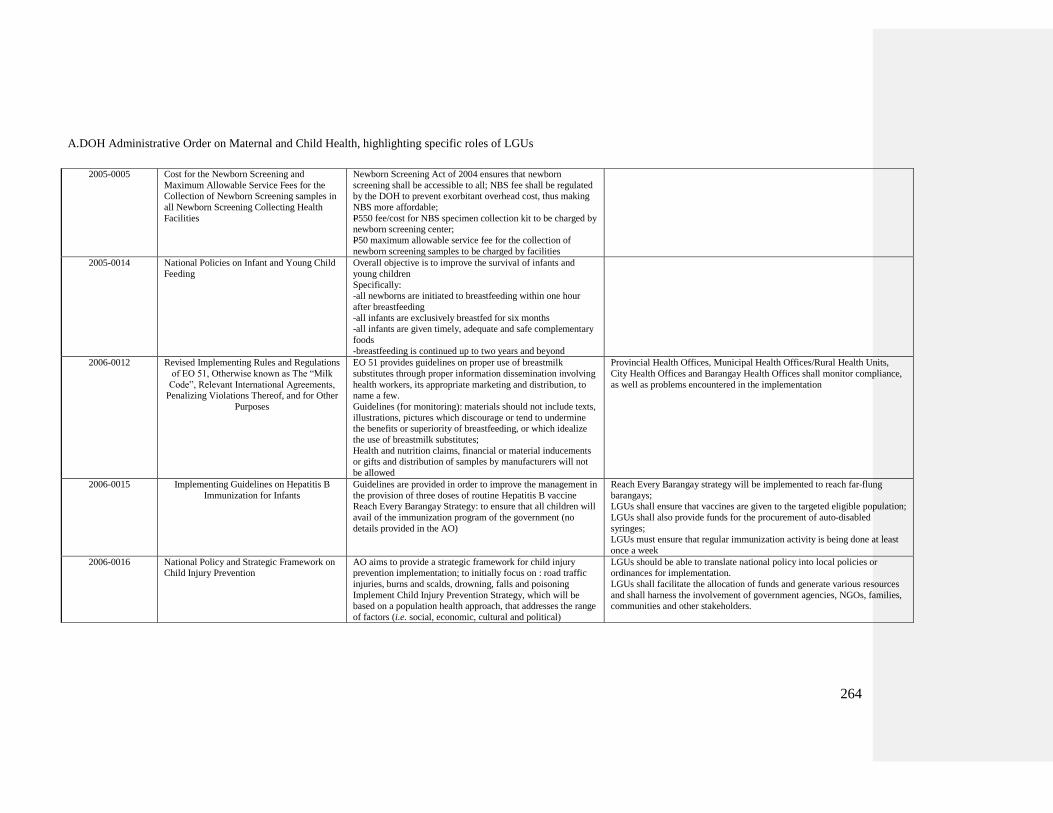
264
A.DOH Administrative Order on Maternal and Child Health, highlighting specific roles of LGUs
2005-0005 Cost for the Newborn Screening and
Maximum Allowable Service Fees for the Collection of Newborn Screening samples in
all Newborn Screening Collecting Health
Facilities
Newborn Screening Act of 2004 ensures that newborn
screening shall be accessible to all; NBS fee shall be regulated by the DOH to prevent exorbitant overhead cost, thus making
NBS more affordable;
P550 fee/cost for NBS specimen collection kit to be charged by newborn screening center;
P50 maximum allowable service fee for the collection of
newborn screening samples to be charged by facilities
2005-0014 National Policies on Infant and Young Child
Feeding
Overall objective is to improve the survival of infants and
young children
Specifically: -all newborns are initiated to breastfeeding within one hour
after breastfeeding
-all infants are exclusively breastfed for six months -all infants are given timely, adequate and safe complementary
foods
-breastfeeding is continued up to two years and beyond
2006-0012 Revised Implementing Rules and Regulations
of EO 51, Otherwise known as The ―Milk
Code‖, Relevant International Agreements, Penalizing Violations Thereof, and for Other
Purposes
EO 51 provides guidelines on proper use of breastmilk
substitutes through proper information dissemination involving
health workers, its appropriate marketing and distribution, to name a few.
Guidelines (for monitoring): materials should not include texts,
illustrations, pictures which discourage or tend to undermine the benefits or superiority of breastfeeding, or which idealize
the use of breastmilk substitutes;
Health and nutrition claims, financial or material inducements or gifts and distribution of samples by manufacturers will not
be allowed
Provincial Health Offices, Municipal Health Offices/Rural Health Units,
City Health Offices and Barangay Health Offices shall monitor compliance,
as well as problems encountered in the implementation
2006-0015 Implementing Guidelines on Hepatitis B
Immunization for Infants
Guidelines are provided in order to improve the management in
the provision of three doses of routine Hepatitis B vaccine Reach Every Barangay Strategy: to ensure that all children will
avail of the immunization program of the government (no
details provided in the AO)
Reach Every Barangay strategy will be implemented to reach far-flung
barangays; LGUs shall ensure that vaccines are given to the targeted eligible population;
LGUs shall also provide funds for the procurement of auto-disabled
syringes; LGUs must ensure that regular immunization activity is being done at least
once a week
2006-0016 National Policy and Strategic Framework on Child Injury Prevention
AO aims to provide a strategic framework for child injury prevention implementation; to initially focus on : road traffic
injuries, burns and scalds, drowning, falls and poisoning
Implement Child Injury Prevention Strategy, which will be based on a population health approach, that addresses the range
of factors (i.e. social, economic, cultural and political)
LGUs should be able to translate national policy into local policies or ordinances for implementation.
LGUs shall facilitate the allocation of funds and generate various resources
and shall harness the involvement of government agencies, NGOs, families, communities and other stakeholders.
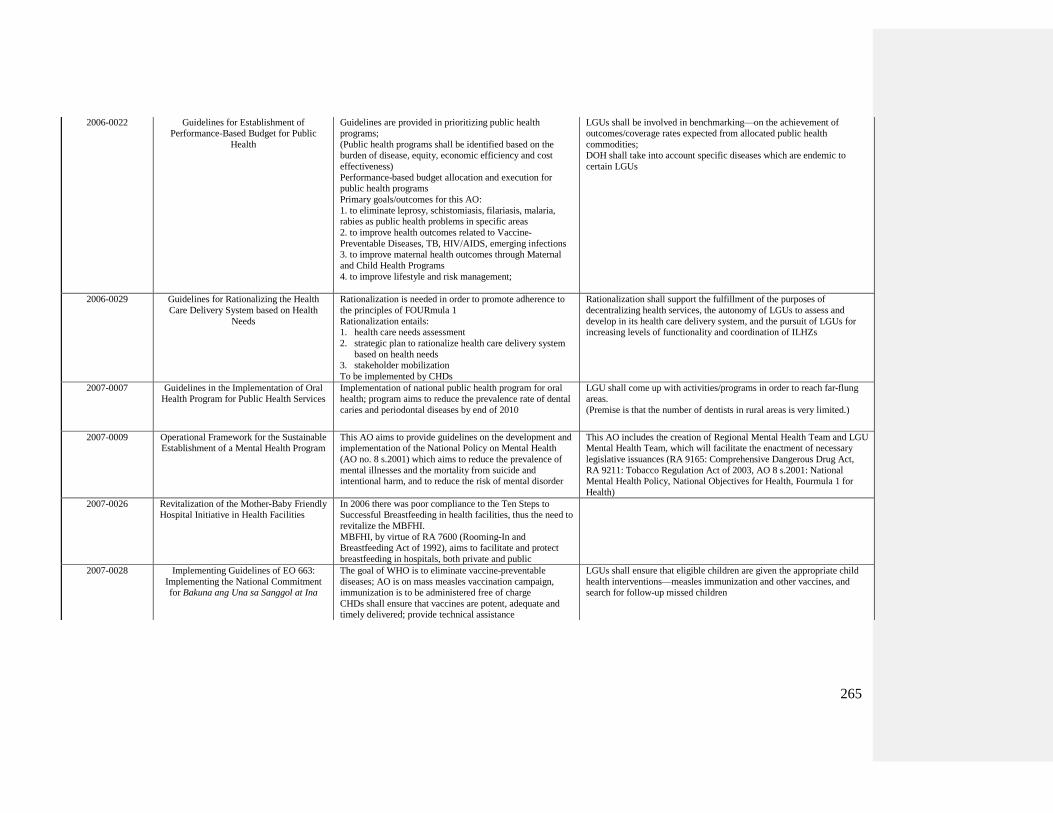
265
2006-0022 Guidelines for Establishment of Performance-Based Budget for Public
Health
Guidelines are provided in prioritizing public health programs;
(Public health programs shall be identified based on the burden of disease, equity, economic efficiency and cost
effectiveness)
Performance-based budget allocation and execution for public health programs
Primary goals/outcomes for this AO:
1. to eliminate leprosy, schistomiasis, filariasis, malaria, rabies as public health problems in specific areas
2. to improve health outcomes related to Vaccine-
Preventable Diseases, TB, HIV/AIDS, emerging infections 3. to improve maternal health outcomes through Maternal
and Child Health Programs
4. to improve lifestyle and risk management;
LGUs shall be involved in benchmarking—on the achievement of outcomes/coverage rates expected from allocated public health
commodities; DOH shall take into account specific diseases which are endemic to
certain LGUs
2006-0029
Guidelines for Rationalizing the Health
Care Delivery System based on Health
Needs
Rationalization is needed in order to promote adherence to
the principles of FOURmula 1
Rationalization entails: 1. health care needs assessment
2. strategic plan to rationalize health care delivery system
based on health needs 3. stakeholder mobilization
To be implemented by CHDs
Rationalization shall support the fulfillment of the purposes of
decentralizing health services, the autonomy of LGUs to assess and
develop in its health care delivery system, and the pursuit of LGUs for increasing levels of functionality and coordination of ILHZs
2007-0007 Guidelines in the Implementation of Oral Health Program for Public Health Services
Implementation of national public health program for oral health; program aims to reduce the prevalence rate of dental
caries and periodontal diseases by end of 2010
LGU shall come up with activities/programs in order to reach far-flung areas.
(Premise is that the number of dentists in rural areas is very limited.)
2007-0009 Operational Framework for the Sustainable Establishment of a Mental Health Program
This AO aims to provide guidelines on the development and implementation of the National Policy on Mental Health
(AO no. 8 s.2001) which aims to reduce the prevalence of
mental illnesses and the mortality from suicide and intentional harm, and to reduce the risk of mental disorder
This AO includes the creation of Regional Mental Health Team and LGU Mental Health Team, which will facilitate the enactment of necessary
legislative issuances (RA 9165: Comprehensive Dangerous Drug Act,
RA 9211: Tobacco Regulation Act of 2003, AO 8 s.2001: National Mental Health Policy, National Objectives for Health, Fourmula 1 for
Health)
2007-0026 Revitalization of the Mother-Baby Friendly Hospital Initiative in Health Facilities
In 2006 there was poor compliance to the Ten Steps to Successful Breastfeeding in health facilities, thus the need to
revitalize the MBFHI.
MBFHI, by virtue of RA 7600 (Rooming-In and Breastfeeding Act of 1992), aims to facilitate and protect
breastfeeding in hospitals, both private and public
2007-0028 Implementing Guidelines of EO 663:
Implementing the National Commitment for Bakuna ang Una sa Sanggol at Ina
The goal of WHO is to eliminate vaccine-preventable
diseases; AO is on mass measles vaccination campaign, immunization is to be administered free of charge
CHDs shall ensure that vaccines are potent, adequate and timely delivered; provide technical assistance
LGUs shall ensure that eligible children are given the appropriate child
health interventions—measles immunization and other vaccines, and search for follow-up missed children
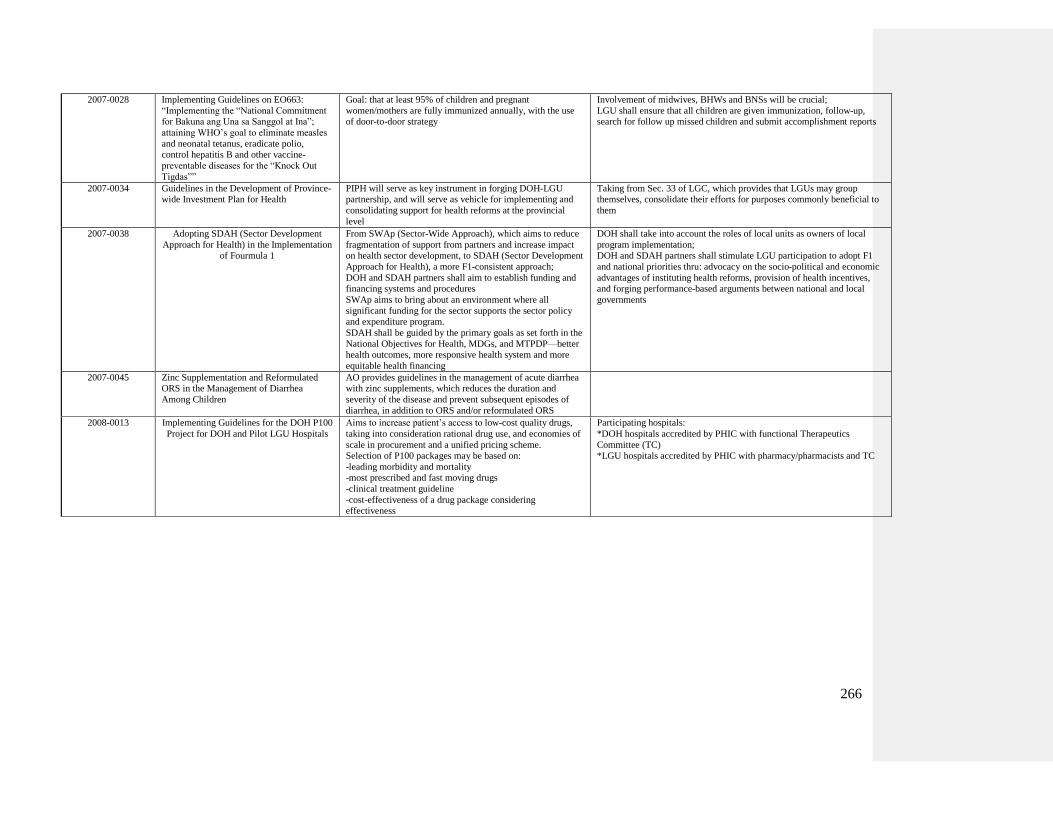
266
2007-0028 Implementing Guidelines on EO663:
―Implementing the ―National Commitment for Bakuna ang Una sa Sanggol at Ina‖;
attaining WHO‘s goal to eliminate measles
and neonatal tetanus, eradicate polio, control hepatitis B and other vaccine-
preventable diseases for the ―Knock Out
Tigdas‖‖
Goal: that at least 95% of children and pregnant
women/mothers are fully immunized annually, with the use of door-to-door strategy
Involvement of midwives, BHWs and BNSs will be crucial;
LGU shall ensure that all children are given immunization, follow-up, search for follow up missed children and submit accomplishment reports
2007-0034 Guidelines in the Development of Province-wide Investment Plan for Health
PIPH will serve as key instrument in forging DOH-LGU partnership, and will serve as vehicle for implementing and
consolidating support for health reforms at the provincial
level
Taking from Sec. 33 of LGC, which provides that LGUs may group themselves, consolidate their efforts for purposes commonly beneficial to
them
2007-0038 Adopting SDAH (Sector Development
Approach for Health) in the Implementation of Fourmula 1
From SWAp (Sector-Wide Approach), which aims to reduce
fragmentation of support from partners and increase impact on health sector development, to SDAH (Sector Development
Approach for Health), a more F1-consistent approach;
DOH and SDAH partners shall aim to establish funding and financing systems and procedures
SWAp aims to bring about an environment where all
significant funding for the sector supports the sector policy and expenditure program.
SDAH shall be guided by the primary goals as set forth in the
National Objectives for Health, MDGs, and MTPDP—better health outcomes, more responsive health system and more
equitable health financing
DOH shall take into account the roles of local units as owners of local
program implementation; DOH and SDAH partners shall stimulate LGU participation to adopt F1
and national priorities thru: advocacy on the socio-political and economic
advantages of instituting health reforms, provision of health incentives, and forging performance-based arguments between national and local
governments
2007-0045 Zinc Supplementation and Reformulated ORS in the Management of Diarrhea
Among Children
AO provides guidelines in the management of acute diarrhea with zinc supplements, which reduces the duration and
severity of the disease and prevent subsequent episodes of
diarrhea, in addition to ORS and/or reformulated ORS
2008-0013 Implementing Guidelines for the DOH P100
Project for DOH and Pilot LGU Hospitals
Aims to increase patient‘s access to low-cost quality drugs,
taking into consideration rational drug use, and economies of
scale in procurement and a unified pricing scheme. Selection of P100 packages may be based on:
-leading morbidity and mortality -most prescribed and fast moving drugs
-clinical treatment guideline
-cost-effectiveness of a drug package considering effectiveness
Participating hospitals:
*DOH hospitals accredited by PHIC with functional Therapeutics
Committee (TC) *LGU hospitals accredited by PHIC with pharmacy/pharmacists and TC
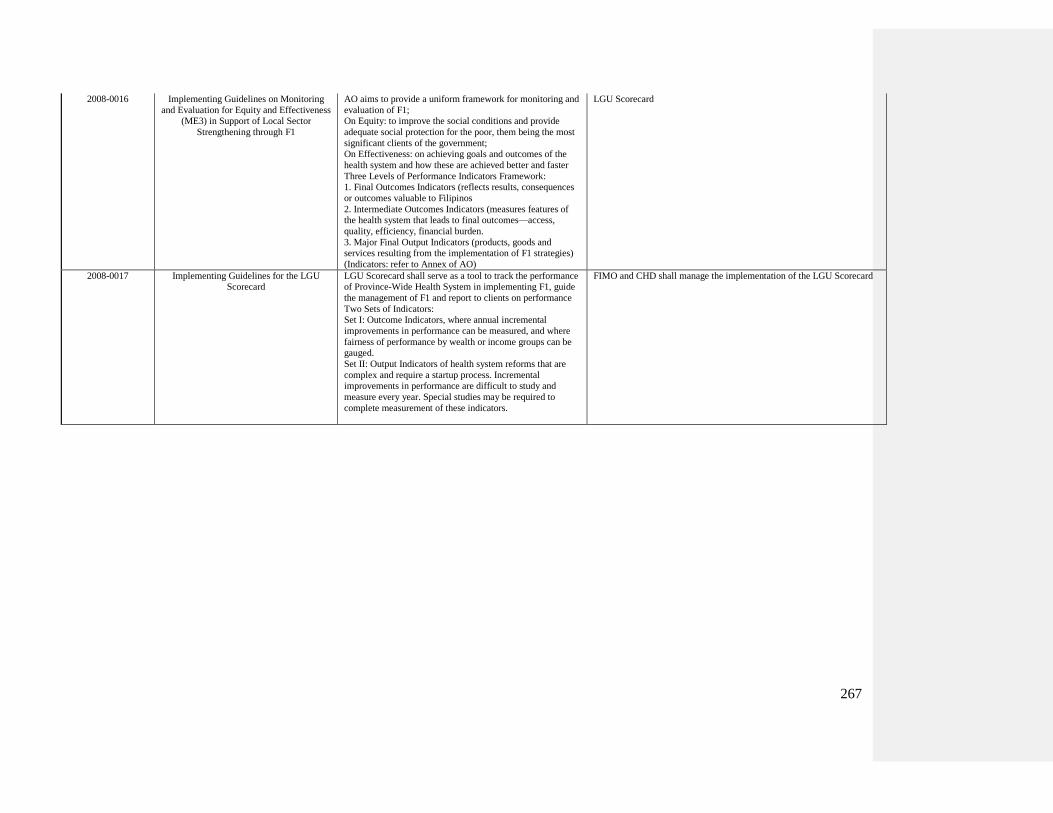
267
2008-0016 Implementing Guidelines on Monitoring
and Evaluation for Equity and Effectiveness (ME3) in Support of Local Sector
Strengthening through F1
AO aims to provide a uniform framework for monitoring and
evaluation of F1; On Equity: to improve the social conditions and provide
adequate social protection for the poor, them being the most
significant clients of the government; On Effectiveness: on achieving goals and outcomes of the
health system and how these are achieved better and faster
Three Levels of Performance Indicators Framework: 1. Final Outcomes Indicators (reflects results, consequences
or outcomes valuable to Filipinos
2. Intermediate Outcomes Indicators (measures features of the health system that leads to final outcomes—access,
quality, efficiency, financial burden.
3. Major Final Output Indicators (products, goods and services resulting from the implementation of F1 strategies)
(Indicators: refer to Annex of AO)
LGU Scorecard
2008-0017 Implementing Guidelines for the LGU Scorecard
LGU Scorecard shall serve as a tool to track the performance of Province-Wide Health System in implementing F1, guide
the management of F1 and report to clients on performance
Two Sets of Indicators: Set I: Outcome Indicators, where annual incremental
improvements in performance can be measured, and where
fairness of performance by wealth or income groups can be gauged.
Set II: Output Indicators of health system reforms that are
complex and require a startup process. Incremental improvements in performance are difficult to study and
measure every year. Special studies may be required to
complete measurement of these indicators.
FIMO and CHD shall manage the implementation of the LGU Scorecard
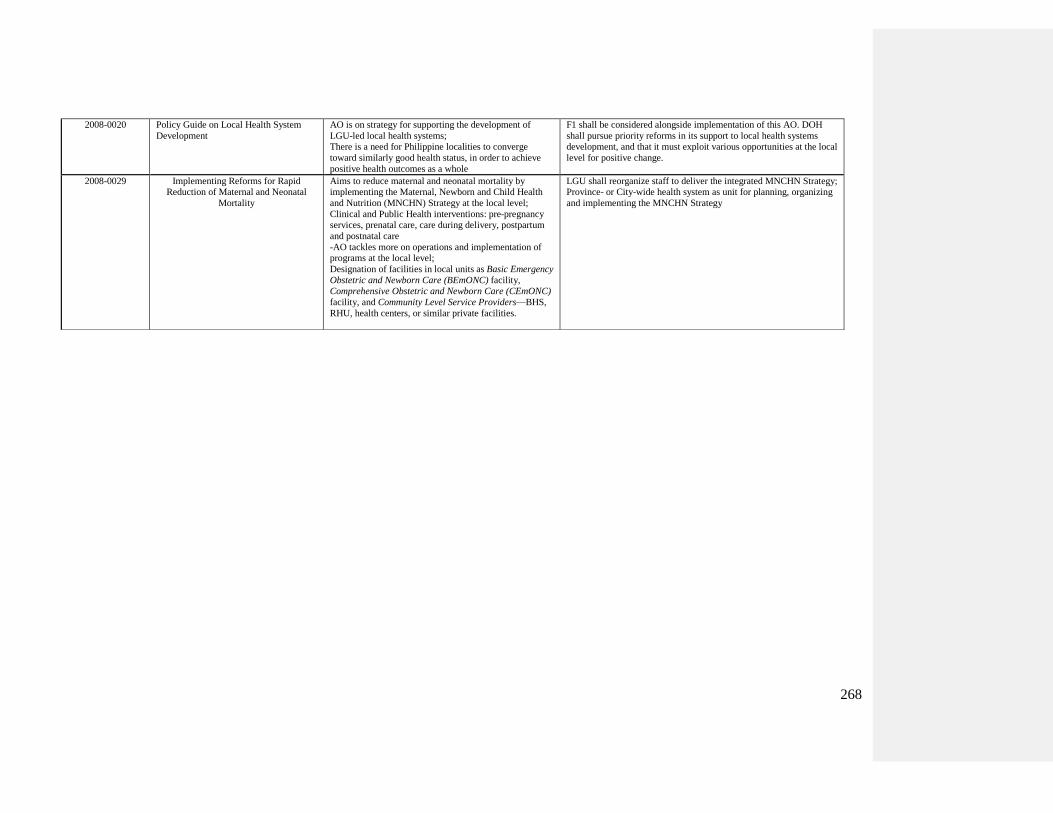
268
2008-0020 Policy Guide on Local Health System
Development
AO is on strategy for supporting the development of
LGU-led local health systems; There is a need for Philippine localities to converge
toward similarly good health status, in order to achieve
positive health outcomes as a whole
F1 shall be considered alongside implementation of this AO. DOH
shall pursue priority reforms in its support to local health systems development, and that it must exploit various opportunities at the local
level for positive change.
2008-0029 Implementing Reforms for Rapid Reduction of Maternal and Neonatal
Mortality
Aims to reduce maternal and neonatal mortality by implementing the Maternal, Newborn and Child Health
and Nutrition (MNCHN) Strategy at the local level;
Clinical and Public Health interventions: pre-pregnancy services, prenatal care, care during delivery, postpartum
and postnatal care
-AO tackles more on operations and implementation of programs at the local level;
Designation of facilities in local units as Basic Emergency
Obstetric and Newborn Care (BEmONC) facility,
Comprehensive Obstetric and Newborn Care (CEmONC)
facility, and Community Level Service Providers—BHS,
RHU, health centers, or similar private facilities.
LGU shall reorganize staff to deliver the integrated MNCHN Strategy; Province- or City-wide health system as unit for planning, organizing
and implementing the MNCHN Strategy
269
REFERENCES
Abueva, J.V. (2003), ‗Towards a Federal Republic of the Philippines with a
Parliamentary Government by 2010‘, in A. Brillantes, et al (eds), Decentralization
and Power Shift, Federalism: The Future of Decentralizing States?, University of
the Philippines National College of Public Administration and Governance.
Acosta, R., et al. (1991), Local Government Capability-Building Handbook, Local
Government Development Foundation and the Bureau of Local Government
Supervision, Inc., Manila.
Alfiler, M.C. (1995), ‗The Political Administrative Accountability Continuum in
Philippine Public Service‘, pp. 308-409 in Cariño, L. (ed.) Conquering Politico-
Administrative Frontiers: Essays in Honor of Raul P. De Guzman, UP National
College of Public Administration and Governance and University of the
Philippines Press, Quezon City.
Ambat, G.H. (2007), ‗Textbook Count Project: Improving Service Delivery and Curbing
Corruption in the Education Sector Through Civil Society and Public Sector
Involvement‘, in Making Services Work for the People: Leading Practices in
Improving Service Delivery at the National Government Level, University of the
Philippines and European Commission.
Anderson, B. (1988), ‗Cacique Democracy in the Philippines‘, New Left Review, May-
June, 3-31.
Ang, A. (2007), ‗Management of Devolved Services‘, pp. 105-113 in Preschle, K. and G.
Sosmeňa, Jr. (eds) Center and Localities Dynamics of Intergovernmental
Relations, Local Government Development Foundation and Konrad Adenauer
Stiftung, Manila.
Angeles, J.C., ‗The Role of the Naga City Urban Poor Federation un the Passage of Pro-
Poor Ordinances and Policies‘, in M.A. Wui and M.S. Lopez (eds) 1997, State-
Civil Society, Relations in Policy Making, Third World Studies Center.
Armecin, G., et al (2006), ‗Early Childhood Development through an Integrated Program:
Evidence from the Philippines‘, World Bank Policy Research Working Paper
3922.
Ashford, L., D. Gwatkin and A. Yazbeck (2006), ‗Designing Health & Population
Programs to Reach the Poor‘, Population Reference Bureau, Washington DC.
Asian Development Bank (2003), Asian Development Bank Key Indicators, Manila.
Asian Development Bank (2004), ‗Country Water Action: Philippines Rural Water
Supply and Sanitation Sector Project‘, July.
Asian Development Bank (2004), ‗First Regional Meeting of National Water Sector
Apex Bodies, Leadership in Water Governance‘, May 18-21, Hanoi, Vietnam.
Asian Development Bank (2005), ‗Governance, Sound Development Management‘.
Asian Development Bank (2005a), ‗Good Governance Defined‘, available at
<http://www.adb.org/Documents/Policies/Governance>, accessed 25 June 2005.
Asian Development Bank (2005b), Private Sector Assessment, Manila, May.
Asian Development Bank (2006), ‗Country Water Action Philippines: Institutionalized
Community-Managed Approach for Water Supply and Sanitation in Agusan del
Sur‘. <http://www.adb.org/water/Actions/PHI/Water-Supply-Agusan.asp>.
Retrieved on 2009-06-01.
270
Asian Development Bank (2007), ‗Country Paper Philippines‘, Asia-Pacific Water
Forum.
Asian Development Bank (2007), ‗Water, Doubling Financing to Get Double the
Results‘.
Asian Development Bank (2007), ‗What is the Asian Water Development Outlook
2007?‘, Asia-Pacific Water Forum.
Asian Development Bank (2007), ‗Philippines: Women‘s Health and Safe Motherhood
Project‘, Project No. PPE: PHI 27010, July.
Asian Development Bank (2007), ‗Philippines: Critical Development Constraints‘,
Country Diagnostics Studies, ADB, Manila.
Asian Development Bank and UNCDF (2004), ‗Executive Summaries and Abstracts of
Case Studies‘, prepared for the Regional Seminar & Learning Event on Local
Governance and Pro-Poor Service Delivery, Manila, 10-12 February.
Asian Development Bank, ‗Country Governance Assessment: Philippines‘.
Ateneo Center for Social Policy and Public Affairs, ‗Decentralization and Peace and
Development: The Eastern Samar Experience‘, in A. Brillantes, et al (eds) 2003,
Decentralization and Power Shift, Federalism: The Future of Decentralizing
States?, University of the Philippines National College of Public Administration
and Governance.
Atienza, M., ‗Local Governments and Devolution in the Philippines‘, in N. Morada and
T. Encarnacion (eds) 2006, Philippine Politics and Governance: An Introduction,
UP: Department of Political Science.
Auclair, C., ‗Federalism: Its Principles, Flexibility and Limitations‘, in A. Brillantes, et al
(eds) 2003, Federalism: The Future of Decentralizing States?, University of the
Philippines National College of Public Administration and Governance.
Auxilian, E.T. and W. Cabo (1998), ‗Government Policies on and Institutions for
Economic Promotion, pp. 285 – 316 in Tapales, P. (ed.) Local Government in the
Philippines: A Book of Readings, Volume I, Center for Local and Regional
Governance, National College of Public Administration and Governance,
University of the Philippines.
Bahl, R. and B.D. Miller (eds) (1983), Local Government Finance in the Third World: A
Case Study of the Philippines, Praeger, New York.
Balilihan Rural Health Unit, ‗Primary Health Care through the Balilihan Rural Purok
Initiative‘, LGU Performance Program, Compendium of Best Practices Region 7.
Balisacan, A.M. and H. Hill (eds) (2003), The Philippine Economy: Development,
Policies and Challenges, Oxford University Press, New York NY, and Ateneo de
Manila University Press, Quezon City.
Barba, P.F., ‗The Challenges in Water Resources Management in the Philippines‘,
National Water Resources Management in the Philippines, Quezon City,
Philippines.
Barnett, C., H. Minis and J. VanSant (1997), ‗Democratic Decentralization‘, United
States Agency for International Development, December.
Bautista, V.A., M.T. Joaquin and E. Santiago, ‗Philippine Experience in Health Service
Decentralization‘, in P.D. Tapales and A.B. Brillantes, Jr. (eds) 2002, Local
Government in the Philippines: A Book of Readings, Vol. 3, UP: Center for Local
and Regional Governance, and National College of Public Administration and
Governance.
271
Bautista, V. (1995), ‗Alternative Systems for Health Service Delivery in the Philippines‘.
Bautista, V., E., Joaquin, and E. Santiago (2002), ‗Philippine Experience in Health
Service Decentralization‘, pp.73-99 in Tapales, P. and A. Brillantes (eds.) Local
Government in the Philippines: A Book of Readings, Volume III, Center for Local
and Regional Governance, National College of Public Administration and
Governance, University of the Philippines.
Bautista, V., et al. (2003), Introduction to Public Administration in the Philippines: A
Reader, 2nd
Edition, National College of Public Administration and Governance,
University of the Philippines.
Bautista, V.A. (2003), ‗Towards a Framework for Participatory Governance‘, pp. 794-
802 in in Bautista, V., et al. (eds) Introduction to Public Administration in the
Philippines: A Reader, 2nd
Edition, National College of Public Administration and
Governance, University of the Philippines.
Behrman, J.R., A. Deolalikar and L. Soon (2002), ‗Promoting Effective Schooling
through Education Decentralization in Bangladesh, Indonesia, and Philippines‘,
Economics and Research Department Working Paper Series No. 23, Asian
Development Bank.
Belmonte, Jr., F., ‗Pursuing the Vision of Effective Governance for Quezon City‘, in P.D.
Tapales and A.B. Brillantes, Jr. (eds) 2002, Local Government in the Philippines:
A Book of Readings, Vol. 3, UP: Center for Local and Regional Governance, and
National College of Public Administration and Governance.
Blunt, P. and M. Turner (2007), ‗Decentralization, De concentration & Poverty
Reduction in the Asia Pacific‘, pp. 115-130 in Cheema, G.S. and D. Rondinelli
(eds) (2007), Decentralizing Governance: Emerging Concepts and Practices,
ASH Institute for Democratic Governance & Innovation, Harvard University.
Bird, R. and M. Smart (2002), ‗Intergovernmental Fiscal Transfers: International Lessons
for Developing Countries.‘ World Development 30, page 899-912
Bird, R., J. Litvack, and M. G. Rao (1995). ‗Intergovernmental Transfers and Poverty
Alleviation in Vietnam.‘ Policy Research Working Paper 1430. Washington D.C.:
World Bank.
Boadway, R. and D. Wildasin (1984), Public Sector Economics, Little Brown Co.,
Boston.
Boncodin, E.T. (2001), ‗Governance & Institutional Reforms in Public Sector‘, pp. 7-14
in Philippine Development Economics, 38(1) June, University of the Philippines
School of Economics and Philippine Economic Society, Quezon City.
Bray, M. and M.V. Mukundan (2003), ‗Management and Governance for EFA: Is
Decentralisation Really the Answer?‘, Comparative Education Research Centre,
June.
Brillantes, A. (1994), ‗Decentralization: Governance from Below‘, pp. 41-42 in Magno,
A. (ed.), KASARINLAN: Rethinking the State & the Economy, Vol. 10 No.1, Third
World Studies Center, University of the Philippines, Quezon City.
Brillantes, Jr., A.B. (2001), ‗Developing Indicators of Local Governance in the
Philippines: Towards an ‗ISO‘ for LGUs‘, Philippine Journal of Public
Administration, 45(1&2): 18-34.
Brillantes, Jr., A.B., ‗Global Forces and Local Government in the Philippines: Challenges
and Responses‘, in P.D. Tapales and A.B. Brillantes, Jr. (eds) 2002, Local
272
Government in the Philippines: A Book of Readings, Vol. 3, UP: Center for Local
and Regional Governance, and National College of Public Administration and
Governance.
Brillantes, Jr., A.B., ‗Philippines, Sustaining the Gains of Decentralization‘, in A.
Brillantes and N. Cuachon (eds) 2002, Decentralization and Power Shift.
Brillantes, Jr., A. and N. Cuachon (eds) (2002), Decentralization and Power Shift,
University of the Philippines National College of Public Administration and
Governance.
Brillantes, Jr., A. (2003), ‗Decentralized Democratic Governance Under the Local
Government Code: A Governmental Perspective‘, pp. 325-343 in Bautista, V., et
al. (eds) Introduction to Public Administration in the Philippines: A Reader, 2nd
Edition, National College of Public Administration and Governance, University of
the Philippines.
Brillantes, Jr., A.B. (2003), Innovations and Excellence: Understanding Local
Governments in the Philippines, National College of Public Administration and
Governance, University of the Philippines, Diliman, Quezon City.
Brillantes, A. (2007), ‗Interlocal Cooperation as a Service Delivery Mechanism: Some
Policy Options‘, pp. 25-37 in Preschle, K. and G. Sosmeňa, Jr. (eds) Center and
Localities Dynamics of Intergovernmental Relations, Local Government
Development Foundation and Konrad Adenauer Stiftung, Manila.
Briones, L.M. (1994), ‗Fiscal & Monetary Policies as Constraints to Development‘, pp.
7-24 in Kasarinlan, 4th
Quarter, Third World Studies Center, University of the
Philippines, Quezon City.
Cabalfin, M. and J. Yap (2007), ‗A Framework for Regional and Local development‘,
Development Research News, Vol. XXV No. 5, Philippine Institute for
Development Studies.
Cabalfin, M. and J. Yap (2008), ‗Sustainable Governance Framework for Local
Governance‘, Dicussion Paper Series No-2008-03, Philippine Institute for
Development Studies.
Calderon, M.L. (2008), ‗Drinking Water From Faucet Still Possible in RP‘, Business
World, July 1.
Campos, J.E. And J.S. Hellman (2005), ‗Governance Gone Local: Does Decentralization
Improve Accountability?‘, pp.237-52 in R. White and P. Smoke (eds), East Asia
Decentralizes: Making Local Government Work, World Bank, Washington DC.
Canlas, Corrine (2008), ‗Draft Evaluative Study: Presidential Priority Program on Water‘,
A GTZ-Commissioned Study for the National Anti-Poverty Commission.
Caoli-Rodriguez, R. (2007), ‗Country Profile commissioned for the EFA Global
Monitoring Report 2008, Education for All by 2015: will we make it?‘.
Capuno, J., ‗The Quality of Local Governance and Development under Decentralization‘.
Capuno, J. (2008), ‗The spread of local government innovations under decentralization:
A Case study of four Philippine provinces‘, prepared for the 11th
International
Convention of the East Asian Economic Association, Manila, 15-16 November.
Cariňo, L.V. (1998), ‗Governance in Local Communities: Towards Development and
Democracy‘, pp. 67-84 in Tapales, P. (ed.) Local Government in the Philippines:
A Book of Readings, Volume I, Center for Local and Regional Governance,
National College of Public Administration and Governance, University of the
Philippines.
273
Cariňo, L.V., ‗Devolution for Democracy and Development‘, in P.D. Tapales and A.B.
Brillantes, Jr. (eds) 2002, Local Government in the Philippines: A Book of
Readings, Vol. 3, UP: Center for Local and Regional Governance, and National
College of Public Administration and Governance.
Cariño, L.V. (2003), ‗The Concept of Governance‘, pp. 66-76 in Bautista, V., et al. (eds)
Introduction to Public Administration in the Philippines: A Reader, 2nd
Edition,
National College of Public Administration and Governance, University of the
Philippines.
Cariño, L. (2003), ‗Increasing Social Access to Basic Services: An Examination of
Relevant Concepts & Practices‘, pp. 745-771 in Bautista, V., et al. (eds)
Introduction to Public Administration in the Philippines: A Reader, 2nd
Edition,
National College of Public Administration and Governance, University of the
Philippines.
Cariño, L. (2003), ‗Administrative Accountability: A Review of the Evolution, Meaning
& Operationalization of a Key Concept in Public Administration‘, pp. 805-838 in
in Bautista, V., et al. (eds) Introduction to Public Administration in the
Philippines: A Reader, 2nd
Edition, National College of Public Administration and
Governance, University of the Philippines.
Cariño, L. (2007), ‗Devolution Toward Democracy: Lessons for Theory & Practice from
the Philippines‘, pp. 92-114 in Cheema, G.S. and D. Rondinelli (eds) (2007),
Decentralizing Governance: Emerging Concepts and Practices, ASH Institute for
Democratic Governance & Innovation, Harvard University.
Carlos, C. (2006), ‗Towards a New Model of Bureaucracy in the Philippines, pp. 12 – 20
in Preschle, K. and G. Sosmena, Jr. (eds) The Local Government Bureaucracy
and Local Fiscal Administration, Local Government Development Foundation
and Konrad Adenauer Stiftung, Metro Manila.
Celestino, A. and S. Ilago, ‗The Primary Health Care Program in Surigao City‘, pp. 485-
519 in Decentralization and People Empowerment.
Celestino, A., N. Malvar and R. Zipagan, Sr. (1998), Handbook of Local Fiscal
Administration in the Philippines, UP Center for Local Governance and German
Foundation for International Development.
Cheema, G.S. and D. Rondinelli (eds) (2007), Decentralizing Governance: Emerging
Concepts and Practices, ASH Institute for Democratic Governance & Innovation,
Harvard University.
Cheema, G.S and D. Rondinelli (2007), ‗From Government Decentralization to
decentralized Governance‘, pp. 1-20 in Cheema, G.S. and D. Rondinelli (eds)
Decentralizing Governance: Emerging Concepts and Practices, ASH Institute for
Democratic Governance & Innovation, Harvard University.
Cheema, G.S. (2007), ‗Devolution with Accountability: Learning from Good Practices‘,
pp. 170-188 in Cheema, G.S. and D. Rondinelli (eds) (2007), Decentralizing
Governance: Emerging Concepts and Practices, ASH Institute for Democratic
Governance & Innovation, Harvard University.
Chesterman, S., M. Ignatieff and R. Thakur (eds.) (2005), Making states work: State
Failure and the crisis of governance, United Nations University Press.
Chiplunkar, A., M. Duenas and M. Flor, ‗Rebidding Process Infuses New Life to a
Struggling Concessionaire‘, Asian Development Bank
274
City Planning and Development Office, Dumaguete City (2008), ‗City of Dumaguete
Socio-economic and Business Profile‘. Dumaguete City, Negros Oriental. 97 p.
Commission on Audit (2007), ‗2007 Annual Audit Reports – NGAs‘. Retrieved
February 21, 2009, from The Official Website of the Commission on Audit:
http://www.coa.gov.ph/Audit/AAR.htm
Commission on Human Rights, et al., ‗The Philippine National Report on Follow-up to
the World Summit for Children‘.
Committee Affairs Department (2006), ‗Committee tackles proposed amendments to
Basic Education Act‘.
Coronel, S., Y. Chua, L. Rimban and B. Cruz (2004), The Rulemakers: How the Wealthy
and the Well-born Dominate Congress, Philippine Center for Investigative
Journalism, Quezon City.
Council for the Welfare of Children, ‗Child 21: A Legacy to the Filipino Children of the
21st Century‘, Philippine National Strategic Framework for Plan Development for
Children 2000-2025.
Cristobal, Jr. A., ‗How the Local Government in Valencia, Negros Oriental Views
Democracy and Citizenship‘, in M. Diokno (ed) 1997, Democracy and
Citizenship in Filipino Political Culture, Third World Studies Center.
Cruz, P.C. (2004), ‗The Colonial Origins of Philippine Institutions‘, MA thesis,
University of the Philippines School of Economics, Diliman, Quezon City.
Dacanay, J. and M.C. Rodolfo (2005), ‗Challenged in Health Services Trade: Philippine
Case‘, PIDS Discussion Paper Series No. 2005-30, Makati City, December.
Dagnalan, F.L., ‗Enhancing Local Development Planning as Instrument of Sustainable
Development and Good Urban Governance: the Philippine Experience‘, in A.
Brillantes, et al (eds) 2004, Decentralization and Good Urban Governance,
University of the Philippines National College of Public Administration and
Governance.
David, C. and A. Innocencio (2001), ‗Public-Private-Community Partnerships in
Management and Delivery of Water to Urban Poor: The Case of Metro Manila‘,
Philippine Institute for Development Studies Discussion Paper Series 2001-18,
Makati City.
De Dios, E. and P. Hutchcroft (2003), ‗Political Economy‘, in A.M. Balisacan and H. Hill
(eds), The Philippine Economy: Development, Policies, and Challenges, Oxford
University Press, New York NY, and Ateneo de Manila University Press, Quezon
City.
De Dios, E. et al. (2004), ‗The Deepening Crisis: The Real Score on Deficits and the
Public Debt‘, UPSE Discussion Paper No. 2004-09, University of the Philippines
School of Economics, Quezon City, August.
De Guzman, R. and M. Reforma (1991), ‗Toward Alternative Delivery Systems‘, paper
presented in an ADIPA Seminar held in the University of the Philippines Diliman,
Quezon City, 4-5 December.
De Guzman, R., M. Reforma and E. Panganiban (1998), ‗The Evolution of Local
Government in the Philippines, pp. 103-120 in Tapales, P. (ed.) Local
Government in the Philippines: A Book of Readings, Volume I, Center for Local
and Regional Governance, National College of Public Administration and
Governance, University of the Philippines.
Formatted: French (France)
275
De Guzman, A., ‗School-Based Management in Philippine Basic and Higher Education
Sectors: Rational, Practices and Policy Directions‘.
De Guzman, A. (2003), ‗The Dynamics of Educational Reforms in the Philippine Basic
and Higher Education Sectors‘, Asia Pacific Education Review, 4(1): 39-50.
Dela Cruz, P. Macasaet, J. A. (2002), ‗Governance in Health‘, pp. 79-129 in Philippine
Governance Forum, Philippine Governance Report: Studies on the Management
of Power, Ateneo School of Government, Manila.
De Leon, H. (2005), Textbook on the Philippine Constitution, Rex Bookstore Company
Inc., Quezon City.
De Mello, L. (2000), ‗Can Fiscal Decentralization Strengthen Social Capital?‘, IMF
Working Paper, WP/00/129, International Monetary Fund, Washington DC.
Department of Education - Department of Budget and Management (2004). ‗Guidelines
on the Direct Release of Funds to DepEd Regional Offices and Implementing
Units‘. Joint Circular 2004-1.
Department of Education (2004), ‗2004 Desks/Armchair Procurement Program‘. DepEd
Order No. 59, s. 2004 . Pasig City: Department of Education.
Department of Education (2008), ‗Addendum to DepEd Order No. 36, s. 2006‘. DepEd
Order No. 60, s. 2008 . Pasig City: Department of Education.
Department of Education and Department of Budget and Management (2004, January 1),
‗Guidelines on the Direct Release of Fund to the DepEd Regional Offices and
Implementing Units‘ . Joint Circular No. 1, s. 2004.
Department of Education (2001), ‗Collection of School Publication Fees‘. Department
Order No. 51, series 2001 .
Department of Education (2001), ‗Collection of Fees by Parent Teacher Community
Associations‘. Department Order No. 26, series 2001.
Department of Education (2003, May 19), ‗Regulating the Collection of Voluntary
Contributions from Students‘. Department Order No. 38, series 2003.
Department of Education (2002, August 28), ‗Collection of School Publication Fees‘.
Department Order No. 41, series 2002.
Department of Education (2002, August 28), ‗Schedule of Collection of Authorized
Voluntary Contributions‘. Department Order No. 42, series 2002.
Department of Education (2008), ‗Student Uniforms not Required in Public Elementary
And Secondary Schools‘. Department Order No. 45, series of 2008. Pasig City.
Department of Education (2009, January 28), ‗Policies and Guidelines on Planning and
Administration / Management of the Human Resource Training and Development
Program‘. Department Order No.11, series 2009.Pasig City.
Department of Education (2004, June 9), ‗Implementation of the Direct Release of
Funds to DepEd - Regional Offices and Implementing Units‘. DepEd Order No.
37, s. 2004. Pasig City, Philippines: Department of Education.
Department of Education (2004, August 9), ‗Qualification Standards for the Positions of
Head Teachers and Principals‘. DepEd Order No. 48, s. 2004. Pasig City,
Philippines: Department of Education.
Department of Education (2003, Novemeber 27), ‗Guidelines on the Selection,
Promotion and Designation of School Heads‘. DepEd Order No. 85, s. 2003.Pasig
City, Philippines: Department of Education.
Department of Education (2008), ‗Guidelines for School-Based Management (SBM)
Grants‘. DepEd Order No. 55, s. 20008.
276
Department of Education (2003), ‗Guidelines for the Coordination and Monitoring of
DPWH-constructed School Buildings‘. DepEd Order No. 77, s. 2003 . Pasig City:
Department of Education.
Department of Education (2006), ‗Guidelines on the Voluntary Collection of Fees from
Students of Public Elementary and Secondary Schools‘. DepEd Order No. 20, s.
2006 . Pasig City: Department of Education.
Department of Education (2008), ‗Implementation of No Collection Policy in All Public
Elementary and Secondary Schools‘. Department Order No. 19, series of 2008.
Pasig City.
Department of Education (2006), ‗Implementing Rules and Regulations on Executive
Order No. 210 (Establishing the Policy to Strengthen the Use of the English
Language as a Medium of Instruction in the Educational System)‘. DepEd Order
No. 36, s. 2006 . Pasig City: Department of Education.
Department of Education (2008), ‗Institutionalization of the Brigada Eskweal Program
or the National Schools Maintenance Week (NSMW)‘. DepEd Order No. 24, s.
2008 . Pasig City: Department of Education.
Department of Education (2008), ‗Moving Forward BESRA's Collaborative Action‘.
Pasig City: Department of Education.
Department of Education (2009), ‗Policies and Guidelines on Planning and
Administration / Management of the Human Resource Training and Development
Program‘. Department Order No. 11, series 2009.
Department of Education (2003), ‗Revised Guidelines Governing PTAs/PTCAs at the
School Level‘. DepEd Order No. 23, s. 2003. Pasig city: Department of
Educaiton.
Department of Education (2003), ‗Revised Guidelines Governing PTAs/PTCAs at the
School Level‘. Department Order No. 23, series 2003 .
Department of Education (2004), ‗Revised Guidelines on Recruitment and Appointment
or Assignment of Public School Teachers Including the Establishment of a
Pooling Scheme‘. DepEd Order No. 1, s. 2004 . Pasig City, Philippines:
Department of Education.
Department of Education (2003), ‗Revised Implementing Guidelines of the 2002
Secondary Education Curriculum Effective School Year 2003-2004‘. DepEd
Order No. 37, s. 2003 . Pasig City: Department of Education.
Department of Education (2002), ‗Rules and Regulations of RA 9155 (Governance of
Basic Education Act)‘. Pasig City.
Department of Education (2001), ‗Schedule of Collection of Authorized Voluntary
Contributions‘. DECS Order No. 31, s. 2001 . Pasig City: Department of
Education.
Department of Education (2004), ‗Standard Curriculum for Elementary Public Schools
and Private Madaris‘. DepEd Order No. 51, s. 2004 . Pasig City: Department of
Education.
Department of Education (2003), ‗Strengthening the Student Technologists and
Entrepreneurs of the Philippines (STEP) to Enhance the Technology and
Livelihood Education (TLE) of the Basic Education Curriculum (BEC)‘. DepEd
Order No. 73, s. 2003 . Pasig City: Department of Education.
Department of Education (2005), ‗Submission of List of Recipient Schools to be funded
under the CY 2005 School Building Program for Areas Experiencing Acute
277
Classroom Shortage‘. DepEd Order No. 19. s. 2005 . Pasig City: Department of
Education.
Department of Education (2003), ‗Submission of the Priority List of School Buildings to
be Funded Under the CY 2003 DepEd Schoolbuilding Program‘. DepEd Order
29, s. 2003 . Department of Education.
Department of Education (2004), ‗Textbook Policy‘. DepEd Memorandum No. 289, s.
2004 . Pasig City: Department of Education.
Department of Education (2002), ‗The 2002 Basic Education Curriculum‘. DepEd Order
No. 43, s. 2002 . Pasig City: Department of Education.
Department of Education (2003), ‗The Textbook Exchange Program‘. DepEd Order No.
88, s. 2003 . Pasig City: Department of Education.
Department of Education, Culture and Sports (2000), ‗Amendments to DECS
Memorandums No. 59, s. 2000 and 509, s. 1999 (Re Implementation of SEMP
Textbook Component)‘. DECS Memorandum No. 255, s. 2000 . Pasig City:
DECS.
Department of Education (2006), ‗Basic Education Sector Reform Agenda (2006-2010)‘.
Department of Education (2007), ‗State of Basic Education Report‘.
Department of Education (2008), ‗2007 Annual Report‘.
Department of Education (2008), ‗Department of Education Comparative Performance
Report July 1998 to Present‘.
Department of Education (2008), ‗SONA Commitments Performance Report 2004-2008‘.
Department of Education (2008), ‗Fact Sheet‘. September.
Department of Education (2008). ‗Basic Education Information System‘, available at <
http://www.deped.gov.ph/quicklinks/quicklinks2.asp?id=12>.
Department of Health (1995), ‗Implementing Rules and Regulations of Chapter II Water
Supply of the Code on Sanitation of the Philippines (P.D. 856)‘, Manila,
Philippines.
Department of Health (2000), ‗Philippine Health Statistics‘, National Epidemiology
Center, Manila, Philippines.
Department of Health (2005), ‗National Objectives for Health Philippines 2005-2010‘.
Department of Health (2007), ‗Amendment to Section VIII. 3 of Administrative Order
No. 18-A s. 1993 dated January 23, 1993 entitled ‗Standards of Quality
Requirements for the Processing, Packaging, and Labeling of Bottled Drinking
Water‘‘, Administrative Order No. 2007-0044, Dec 28.
Department of Health (2007), ‗Philippine National Standards for Drinking Water 2007‘,
Administrative Order No. 2007-0012, March 9.
Department of Health (2007), ‗Standard Requirements and Procedures of Treatment of
Drinking Water at Household Level Using 1.25% Sodium Hypochlorite,
‗, Administrative Order No. 2007-0005, Jan 15.
Department of Health (2007), ‗Annual Report 2007‘.
Department of Health (2007), ‗Field Health Service Information System‘, National
Epidemiology Center, Manila.
Department of Health (2008), ‗Accelerate a unified strategy to save mothers, newborns,
and children‘, Health Policy Notes, Volume 1: Issue 1, April.
Department of Health (2008), ‗Accelerate the reduction of malnutrition among pregnant
and lactating women and children 0-2 years old‘, Health Policy Notes, Volume 1:
Issue 2, April.
278
Department of Health (2008), ‗Multi-sectoral action: Key to Improving access to water
and sanitation services‘, Health Policy Notes, Volume 1: Issue 5, April.
Department of Health (n.d), ‗Second Women‘s Health & Safe Motherhood Project:
Health Sector Reform Project‘, Environmental Assessment Report.
Department of Interior and Local Government (2006), Local Governance Performance
Management System: Simple Measures, Great Results, User’s Guide. Bureau of
Local Government Supervision, Manila, Philippines.
Department of Interior and Local Government and Department of Budget and
Management (2005), Joint Memorandum Circular No 1., s. 2005, ―Guidelines on
the Appropriation and Utilization of the 20% of the Annual Internal Revenue
Allotment (IRA) for Development Projects‖ (September 20). Manila, Philippines.
Diamond, L. (1999), Developing Democracy: Toward Consolidation, The Johns Hopkins
University Press, Baltimore and London.
Diokno, B.E. (2003), ‗Decentralization in the Philippines after Ten Years: What Have
We Learned? What Have I Learned?‘, paper presented to a conference on
Development and Decentralization in Asia, Kitakyushu, November.
Doronilla, A. (1994), ‗Reflections in a Weak State & the Dilemma of Decentralization‘,
pp. 48-54 in Magno, A. (eds), KASARINLAN: Rethinking the State & the
Economy, Vol. 10 No.1, Third World Studies Center, University of the
Philippines, Quezon City.
Drage, J., ‗Women in Local Government in Asia and the Pacific: A Comparative
Analysis of Thirteen Countries‘, in A. Brillantes, et al (eds) 2003,
Decentralization and Power Shift, Federalism: The Future of Decentralizing
States?, University of the Philippines National College of Public Administration
and Governance.
Duenas, M. (2004), ‗Water Champion: Rebecca Ravalo on Rural Water Supply Bringing
Water to the Rural Poor‘, Asian Development Bank
Eaton, K. (2001), ‗Political Obstacles to Decentralization: Evidence from Argentina and
the Philippines‘, Development and Change, Institute of Social Studies, The
Hague, January.
‗Economic Results of CDD Programs: Evidence from Burkina Faso, Indonesia and the
Philippines‘, Social Development Notes, Community Driven Development, No.
109, June 2007.
Edillon, Rosemarie (2006), ‗Meeting Goal 1 Are We on the Right Track?‘ Analysis of the
Millennium Development Goals Progress and Project Methodology
Improvements Background, Report submitted to UNDP-NEDA, 18 November.
Education Quality and Relevance (EQR) Updates. Vol.1. October 2007
Einsiedel, N., ‗Overcoming the Obstacles to Decentralization in Asia‘, in A. Brillantes, et
al (eds) 2003, Decentralization and Power Shift, Federalism: The Future of
Decentralizing States?, University of the Philippines National College of Public
Administration and Governance.
Esguerra, J. (2006), ‗Rural Growth and Development Revisited: Governance Issues and
reform Imperatives for Rural Growth‘.
Executive Order No. 279, ‗Instituting Reforms in the Financing Policies for the Water
Supply and Sewerage Sector and Water Service Providers and Providing for the
Rationalization of LWUA‘s Organizational Structure and Operations in Support
Thereof‘.
279
Executive Order No. 421, ‗Implementing the refocusing of functions and organizational
structure of the local water utilities administration under EO 279 and providing
options and benefits for employees who may affected thereon‘.
Federal Ministry for Economic Cooperation and Development (2006), ‗Revisiting
Decentralization in the Philippines‘, International Conference, September.
Fernandez, L. (2005), ‗Race for Survival: Hurdles in the Road to Meeting the MDGs in
2015‘, Social Watch Philippines 2005 Report, People and Advocacy and Social
Watch Philippines.
Ferrer, C.S., ‗Alternative Approaches to Water Service Delivery in Hard-to-reach Areas:
two cases from the Philippines‘, Institute for Popular Democracy.
Flavier, J. (2003), ‗Technical Report on Improving Access and Affordability of Family
Planning Services; To Reduce Unmet Need for FP Information and Services‘,
October 31.
Fritzen, S. and P. Lim (2006), ‗Problems and Prospects of Decentralization in Developing
Countries‘, first draft submitted for consideration by the Encyclopedia of Public
Administration and Public Policy, May.
Frankenhorst, R. (2007), ‗GTZ Approach – Good Financial Governance‘, pp. 19-120 in
Ilago, S., B. Lopos and E. Cureg (eds) Local Government Financing: iTAX – A
Milestone for Local Government Finance, German Technical Cooperation,
Makati City.
Gako, N. (2007), ‗Fifteen Years of Decentralization in Health‘, pp.53-64 in Ilago, S. and
M. Tumanut (eds), Fifteen Years of Decentralization in the Philippines: Lessons
Learned and the Way Forward, UP Center for Local and Regional Governance
and United Nations Development Programme.
Galing Pook Foundation (2002), A Tribute to Innovation and Excellence in Local
Governance, Pasig City.
Galing Pook Foundation (2006), Kaban Galing: A Case Bank of Innovative & Exemplary
Practices in Local Governance, Government of the Philippines, United Nations
Development Programme, UP National College of Public Administration and
Governance.
Garcia, M. and E.C. Cabegin (2008), ‗An Assessment of the Implementation and
Budgetary Requirements of the Magna carta for Public Workers: Final Report‘,
April.
Global Water Partnership, ‗Towards Water Security: A Framework for Action: Executive
Summary‘.
Gonzalez, E. (1996), ‗Intergovernmental Fiscal Relations: An Institutional Analysis‘, pp.
234-79 in R.P. Alonzo et al. (eds), Developing an Action Plan for Financing of
Local Government Projects with Social and Environmental Objectives, University
of the Philippines School of Economics Foundation, Quezon City.
Grindle, M. (2007), ‗Local Governments that Perform Well: Four Explanations‘, pp. 56-
74 in Cheema, G.S. and D. Rondinelli (eds) (2007), Decentralizing Governance:
Emerging Concepts and Practices, ASH Institute for Democratic Governance &
Innovation, Harvard University.
Guanzon-Lapena, M. and R. Javier, Jr., ‗The Influence of an NGO on the Political
Culture of a Community, An Initial Analysis of the Experience of the Education
280
for Life Foundation‘, in M. Diokno (ed) 1997, Democracy and Citizenship in
Filipino Political Culture, Third World Studies Center.
Guevara, M. (2006), ‗Fiscal Decentralization in the Philippines: First Steps, Next Steps‘,
pp. 73 – 87 in Preschle, K. and G. Sosmena, Jr. (eds) The Local Government
Bureaucracy and Local Fiscal Administration, Local Government Development
Foundation and Konrad Adenauer Stiftung, Metro Manila.
Guevara, M. (2007), ‗Learning from the IRA experience: Some Perspectives on
Intergovernmental Fiscal Relations‘, pp. 13-24 in Preschle, K. and G. Sosmeňa,
Jr. (eds) Center and Localities Dynamics of Intergovernmental Relations, Local
Government Development Foundation and Konrad Adenauer Stiftung, Manila.
Gutierrez, E. (1994), The Ties that Bind: A Guide to Family, Business and Other Interests
in the Ninth House of Representatives, Philippine Center for Investigative
Journalism, Pasig City.
Habulan, H. and N. Malvar (2006), ‗Revisiting the Policy on Local Credit Financing in
the Philippines‘, pp. 103-118 in Preschle, K. and G. Sosmena, Jr. (eds) The Local
Government Bureaucracy and Local Fiscal Administration, Local Government
Development Foundation and Konrad Adenauer Stiftung, Metro Manila.
Herrera, C.F., ‗ADB policy deprives the poor of water – NGO Forum‘, available at
<http://www.manilastandardtoday.com/?page=politics05_nov14_2005>.
House Committee on Oversight (2008), ‗The Chair‘s Assessment of Government
Performance in the Fourth Year of the Arroyo Presidency‘.
Human Development Network (2005), Philippine Human Development Report: Peace,
Human Security and Human Development in the Philippines, Human
Development Network and United Nations Development Program, Manila.
Human Development Network (2007), ‗Guiding Principle for Implementing School-
based Management Programs‘, available at
http://www.worldbank.org/education/economicsed.
Human Development Network (various years), Philippine Human Development Report,
Human Development Network and United Nations Development Program,
Manila.
Hutchcroft, P. (1995), Booty Capitalism, Ateneo de Manila University Press, Quezon
City.
Hutchcroft, P. and J. Rocamora (2003), ‗Strong Demands and Weak Institutions: The
Origins and Evolution of the Democratic Deficit in the Philippines‘, Journal of
East Asian Studies, 3(2): 259-92.
Hyden, G. (2007), ‗Challenges to Decentralized Governance in Weak States‘, pp. 212-
228 in Cheema, G.S. and D. Rondinelli (eds) (2007), Decentralizing Governance:
Emerging Concepts and Practices, ASH Institute for Democratic Governance &
Innovation, Harvard University.
IBON (2003), ‗The Health Sector Reform Agenda: Privatizing Philippine Health‘, IBON
Facts and Figures, Volume 26, No.16, IBON Foundation Inc., August 31.
IBON (2003), ‗Maynilad and MWSS Basic Contradictions Behind a Failed Union‘, IBON
Facts and Figures, Volume 26, No. 7, IBON Foundation Inc., April 15.
IBON (2005), ‗Continuing Threat to People‘s Control over Water Services‘, IBON Facts
and Figures, Volume 28, No. 5, IBON Foundation Inc., March 15.
281
Ilago, S., B. Lopos and E. Cureg (2007), Local Government Financing: iTAX – A
Milestone for Local Government Finance, German Technical Cooperation,
Makati City.
Ilago, S.(2007), ‗Improving Loacal Government Capacity for Resource Generation:
Synthesis of the Proceedings‘, pp. 3-19 in Ilago, S., B. Lopos and E. Cureg (eds)
Local Government Financing: iTAX – A Milestone for Local Government
Finance, German Technical Cooperation, Makati City.
Ilago, S. and M. Tumanut (2007), Fifteen Years of Decentralization in the Philippines:
Lessons Learned and the Way Forward, UP Center for Local and Regional
Governance and United Nations Development Programme.
Insular Southeast Asia Sub-Regional Synthesis Report ( 2008), Asia and the Pacific
Education for All (EFA) Mid-Decade Assessment. Draft for Circulation,
Validation, Comments and Recommendation (June 15).
International Labour Organization, ‗Philippines: Extension of Social Health Insurance
Coverage to Workers in the Informal Economy Through Organized Groups‘,
Social Security Extension Initiatives in South East Asia Series.
International Institute of Rural Reconstruction (2001), Enhancing Participation in Local
Governance: Experiences from the Philippines, Local Government Support
Program and SANREM CRSP Southeast Asia.
Inman, Robert P and Daniel L. Rubinfeld (1997), ‗Rethinking Federalism’, Journal of
Economic Perspectives, Vol. 11, No. 4, pp. 43-64.
Financing for Development Initiative (2005), ‗Development-Driven Public-Private
Partnerships in Basic Education‘, World Economic Forum.
Jimenez, P.R. And E. Javier (1988), ‗The Philippine Health Institutions; Some Problems,
Approaches and Policy Issues‘, in the Journal of Philippine Development,
Volume XV, No.2, Philippine Institute of Development Studies.
Jucaban, A.(2006), ‗Local Public Enterprises‘, pp. 137-147 in Preschle, K. and G.
Sosmena, Jr. (eds) The Local Government Bureaucracy and Local Fiscal
Administration, Local Government Development Foundation and Konrad
Adenauer Stiftung, Metro Manila.
Jutting, Johannes, (2003), ‗Institutions and Development: A Critical Review‖ Technical
Papers No. 210, pp. 11-14, available at: www.oecd.org/dev/Technics (July).
Kho, J. and E. Agsaoay-Sano, ‗Country Study on Customary Water Laws and Practices,
Philippines‘.
King, E.M. and S. Guerra, ‗Education Reforms in East Asia: Policy, Process, and
Impact.‘
King, E. (1999), ‗Education Decentralization‘, in 1998 Philippines Education Sector
Study. Asian Development Bank.
Krugman, P. (1998b), ‗The Role of Geography in Development‘, paper presented to the
Annual World Bank Conference on Development Economics, Washington DC,
April.
Lakshminarayanan, R. (2003), ‗Decentralisation and Its Implications for Reproductive
Health: The Philippines Experience‘, Reproductive Health Matters.
Lande‘, C. (1965), Leaders, Factions, and Parties: The Structure of Philippine Politics,
Yale University Southeast Asian Studies, New Haven CO.
282
League, J.A. (2006), ‗ Local Development Bank: An Option for Local Governments‘, pp.
119-136 in Preschle, K. and G. Sosmena, Jr. (eds) The Local Government
Bureaucracy and Local Fiscal Administration, Local Government Development
Foundation and Konrad Adenauer Stiftung, Metro Manila.
Leedam, E. (1985), ‗Traditional Birth Attendants‘, International Journal of Gynaecology
and Obstetrics, 23: 249-74
Leftwich, D. (1993), ‗Governance, Democracy and Development in the Third World‘,
Third World Quarterly, 14(3): 605-24.
Legaspi, P. (2001), ‗The Enabling Role of Local Governments‘, Chapter 1 in The
Changing Role of the Local Governments Under a Decentralized State: Some
Cases in Philippine Local Governance, National College of Public Administration
and Governance, University of the Philippines, Quezon City.
Lieberman, S.S, J.J. Capuno and H.V. Minh (2005), ‗Decentralizing Health: Lessons
from Indonesia, The Philippines and Vietnam‘, pp. 155-78 in R. White and P.
Smoke (eds), East Asia Decentralizes: Making Local Government Work, World
Bank, Washington DC.
Lim, J., J. Dongail and R. Oliveros (2000), ‗Documentation and Analysis of Experiences
of NGOs, Social Development Agencies and People‘s Organizations with Local
Governments‘, Philippine Center for Policy Studies, Quezon City.
Lina, Jr. J., ‗Decentralization and Federalism in the Philippines: Issues and Concerns‘, in
A. Brillantes, et al (eds) 2003, Decentralization and Power Shift, Federalism: The
Future of Decentralizing States?, University of the Philippines National College
of Public Administration and Governance.
Llanto, G.M. (2004a), ‗Infrastructure Development: Experience and Policy Options for
the Future‘, Philippine Institute for Development Studies Perspective Series No.
7, Makati City.
Llanto, G.M., M.B. Lamberte, R.G. Manasan and J.C. Laya (1998), Local Government
Units’ Access to the Private Capital Markets, Philippine Institute of Development
Studies, Makati City.
Llanto, G. (2008), ‗Make ‗deliberate‘ haste in rolling out the 4Ps‘, Policy Notes No.
2008-09, Philippine Institute for Development Studies, December.
Local Governance Performance Management System (2006), State of Cities of the
Philippines: Administrative Operatives, Productivity & Development Condition,
United Nations Development Programme, Quezon City.
Local Water Utilities Administration (2005), Manual on Water Rates & Related
Practices, Quezon City, Philippines.
Local Water Utilities Administration (2007), ‗Annual Report 2007‘.
Macasaet, J. A. (2002), ‗Governance of the education sector‘, pp. 285-313 in Philippine
Governance Forum, Philippine Governance Report: Studies on the Management
of Power, Ateneo School of Government, Manila.
Maligalig, D and JR Albert, (2008), ‗Ensuring a more evidence based policy for basic
education‘ No. 2008-03, Policy Notes, Philippine Institute for Development
Studies (April).
Magno, A. (1994), ‗Rethinking the State & the Economy‘, KASARINLAN Vol. 10 No.1,
Third World Studies Center, University of the Philippines, Quezon City.
283
Magtolis, C., M.C. Genove and F. Aurelia, ‗Inter-LGU-NGO Partnership in Health Care
Delivery: The Sta. Bayabas Inter-Local Health Zone Experience‘, Province of
Oriental Negros.
Magtolis, C., M.C Genove and F. Amelia, ‗Kaban Galing: Mainstreaming Replication of
Exemplary Local Governance Practices‘, Gawad Galing Pook.
Malvar, N. (2007), ‗Status of Local Government Finance‘, pp. 17-28 in Ilago, S. and M.
Tumanut (eds), Fifteen Years of Decentralization in the Philippines: Lessons
Learned and the Way Forward, UP Center for Local and Regional Governance
and United Nations Development Programme.
Management Sciences for Health (2002), ‗In-Patient Capitation for Indigent Members of
the national Health Insurance Program: A Concept Paper‘, United States Agency
for International Development, March.
Manalo, P. (2007), ‗Reform Directions on the IRA‘, Policy Advisory, No. 2007-01,
Congressional Planning and Budget Department House of Representatives .
Manasan, R.G. (1992a), ‗Fiscal Implications of the Local Government Code of 1991‘,
Journal of Philippine Development, 19(1): 1-58.
Manasan, R.G. (1992b), ‗Intergovernmental Fiscal Relations, Fiscal Federalism, and
Economic Development in the Philippines‘, Philippine Institute for Development
Studies Working Paper Series No. 92-04, Makati City.
Manasan, R.G. (1992), ‗Fiscal Decentralization and the Local Government Code of
1991‘, Development Research News, Vol. X No.5, Philippine Institute for
Development Studies.
Manasan, R.G. (1995a), ‗Fiscal Decentralization: The Early Years of Code
Implementation‘, Development Research News, 13(4), Philippine Institute of
Development Studies, Makati City.
Manasan, R.G. (1995b), ‗Revenue Mobilization in Local Government Units: The Early
Years of Local Government Code Implementation‘, Philippine Institute for
Development Studies Discussion Paper No. 95-02, Makati City.
Manasan, R.G. (1995), ‗The Early Years of Code Implementation‘, Development
Research News, Vol. XIII No.4, Philippine Institute for Development Studies.
Manasan, R.G. (1997), ‗Local Government Financing of Social Service Sectors in a
Decentralized Regime: Special Focus on Provincial Governments in 1993 and
1994‘, PIDS Discussion Paper Series No. 97-04, P Philippine Institute for
Development Studies, Makati City.
Manasan, R.G. (2000), ‗Basic Education: Improving Quality and Quantity‘, Policy Notes
No. 2000-20, Philippine Institute for Development Studies, December.
Manasan, R.G. (2003), ‗Tax Administration Reform: (Semi) Autonomous Revenue
Authority Anyone?‘, Philippine Institute for Development Studies Discussion
Paper No. 2003-05, Makati City.
Manasan, R.G. (2004), ‗Fiscal Reform Agenda: Getting Ready for the Bumpy Ride
Ahead‘, Philippine Institute for Development Studies Discussion Paper No. 2004-
26, Makati City.
Manasan, R.G. (2004), ‗Local Public Finance in the Philippines: In Search of Autonomy
with Accountability‘, PIDS Discussion Paper Series No. 2004-42, Philippine
Institute for Development Studies, Makati City.
284
Manasan, R.G. (2007), ‗IRA design issues and challenges‘, Policy Notes No. 2007-09,
Philippine Institute for Development Studies, December.
Manasan, R.G. And S. Chatterjee (2003), ‗Regional Development‘, pp. 342-80 in A.M.
Balisacan and H. Hill (eds), The Philippine Economy: Development, Policies, and
Challenges, Oxford University Press, New York NY, and Ateneo de Manila
University Press, Quezon City.
Manasan, R. and E. Villanueva (2005), ‗Looking closely on who benefits from public
subsidies in health care: a gender perspective‘, Policy Notes No. 2005-07,
Philippine Institute for Development Studies, December.
Manasan, R. and E. Villanueva (2006), ‗Gems in LGU Fiscal Management: a
Compilation of Good Practices‘, PIDS Discussion Paper Series No. 2006-16,
Philippine Institute for Development Studies, Makati City.
Manasan, R. and J. Cuenca (2007), ‗Pitfalls in targeting‘, Policy Notes No. 2007-07,
Philippine Institute for Development Studies, December.
Manasan R., J. Cuenca and E. Villanueva-Ruiz (2008), ‗Benefit Incidence of Public
Spending on Education in the Philippines‘, Philippine Institute for Development
Studies Discussion Paper Series No. 2008-08.
Manasan, R.G., E.T. Gonzalez and R.B. Gaffud (1999), Towards Better Government:
Developing Indicators of Good Governance for Local Development, National
Economic and Development Authority, Pasig City.
Manila Waters Incorporated. ‗Manila Water to build P105-M sewage treatment plant in
Taguig‘, July 15, 2008, available at http://www.manilawater.com/news/manila-
water-to-build-p105-m-sewage-treatment-plant-in-taguig
Manila Waters Incorporated, Corporate Website. < http://www.manilawater.com/>
Metro Manila Water Works System, Corporate Website. <http://www.mwss.gov.ph>
Manzano, J.C., ‗The Local Governance Self-Assessment Tool: Its Niche in Governance
Assessment‘, in A. Brillantes, et al (eds) 2004, Decentralization and Good Urban
Governance, University of the Philippines National College of Public
Administration and Governance.
Mayer, H. (2007), ‗Strengthening Decentralization‘, pp. 31-36 in Ilago, S., B. Lopos and
E. Cureg (eds) Local Government Financing: iTAX – A Milestone for Local
Government Finance, German Technical Cooperation, Makati City.
McCoy, A. (ed.) (1994), An Anarchy of Families: State and Family in the Philippines,
Ateneo de Manila University Press, Quezon City.
McIntosh, A. (2003), ‗Asian Water Suppliers: Reaching the Urban Poor‘, Asian
Development
Bank, Manila.
McLure, C.E. And J. Martinez-Vazquez (2002), The Assignment of Revenues and
Expenditures in Intergovernmental Fiscal Relations, World Bank Institute,
Washington DC.
Mercado, R. (1995), ‗Philippine Health Care Delivery: Attempts at System
Improvement‘.
Miranda, F.B., ‗Political Economy in a Democratizing Philippines: A People‘s
Perspective‘, in F.B. Miranda (ed) 1997, Democratization: Philippine
Perspectives, UP: University of the Philippines Press.
285
Mukherjee, A. (2004), ‗Taking Decentralization Forward in the Philippines‘, World
Bank, Manila.
Municipal Government, Sibagat. (Various Years), ‗Annual Budget on General Fund and
Economic Enterprise‘. Municipality of Sibagat, Agusan del Sur.
National Anti-Poverty Commission. www.napc.gov.ph
National Education for All Committee (2006), ‗Basic Education Sector Reform Agenda
(2005-2010)‘.
National Education For All Committee (2006), ‗Functionally Literature Filipinos : and
Educated Nation‘.
National Statistics Office (2003), ‗Literacy Status of Filipinos‘, NSO Special Release No.
193.
National Statistics Office (2003), ‗National Demographic and Health Survey‘, Manila,
Philippines.
National Economic and Development Authority (2004), ‗Medium-Term Philippine
Development Plan 2004-2010‘.
National Economic and Development Authority (2005), Second Philippines paper Report
in the Millennium Development Goals.
National Economic and Development Authority (2007), Philippines Midterm Progress
Report on the Millennium Development Goals.
National Economic and Development Authority (2008), ‗Nutrition in the Philippines: A
Continuing Challenge‘, DevPulse, Vol. XII, No. 16, August 31, 2008.
National Statistical Coordination Board (2004), ‗Philippine Statistical Yearbook‘, Makati
City.
Nolledo, J.N. (1992), The Local Government Code of 1991: Annotated 1992 First
Edition, National Book Store, Inc., Manila.
North, D. (1981), Structure and Change in Economic History, W.W. Norton, New York
and London.
North, D. (1990), Institutions, Economic Change, and Economic Performance,
Cambridge University Press, New York NY.
North, D. (2005), Understanding the Process of Economic Change, Princeton University
Press, Princeton NJ.
National Statistical Coordination Board (various years), Philippine Statistical Yearbook,
Makati City.
Oates, W. (1972), Fiscal Federalism, Harcourt Brace Jovanovich, New York NY.
OECD and Federal Ministry of Food, Agriculture and Consumer Protection, ‗Innovative
Service Delivery: Meeting the Challenges of Rural Regions‘, OECD Rural Policy
Conferences, Germany, 3-4 April.
Ocampo, R. and E. Panganiban (1985), The Philippine Local Government System:
History, Politics, and Finance, Local Government Center, Manila.
Ocampo, R. (1998), ‗Decentralization and Local Autonomy: A Framework for Assessing
Progress‘, pp. 85 -100 in Tapales, P. (ed.) Local Government in the Philippines: A
Book of Readings, Volume I, Center for Local and Regional Governance,
National College of Public Administration and Governance, University of the
Philippines.
286
Ocampo, R. and E. Panganiban (1998), ‗The Philippine Local Government System:
History, Politics and Finance‘, pp. 137 – 144 in Tapales, P. (ed.) Local
Government in the Philippines: A Book of Readings, Volume I, Center for Local
and Regional Governance, National College of Public Administration and
Governance, University of the Philippines.
Odugbemi, S. and T. Jacobson (eds) (2008), Governance Reform: Under Real-World
Conditions, World Bank, Washington DC.
Office of the President of the Philippines (2005), ‗Implementing Guidelines of the
President‘s Priority Program on Water (P3W)‘, National Anti-Poverty
Commission, Water and Sanitation Coordinating Office (WASCO), July 4.
Office of the Presidential Assistant for Education (2007), ‗President Gloria Macapagal
Arroyo, Champion for Education, creates the Presidential Task Force on
Education‘, Education Quality & Relevance, Volume 1, October.
Office of the Presidential Assistant for Education (2008), ‗President Gloria Macapagal
Arroyo keynotes First Biennial National Congress on Education, 31 Jan 2008‘,
Education Quality & Relevance, Volume 1, January
Orbeta, A., et al. (2003), ‗Family Planning and Maternal and Child Health Outcomes,
Utilization and Access to Services by Asset Quintile‘, PIDS Discussion Paper
Series No. 2003-14, Philippine Institute for Development Studies, Makati City,
September.
Osteria, T. and R. Buendia, ‗Social Assessment of the Women‘s Health and Safe
Motherhood Programme Package: Final Report‘.
Padilla, P.L., ‗Decentralization Towards Democratization and Development: The
Philippine Experience‘, in R. de Guzman and M. Reforma (eds) 1993,
Decentralization Towards Democratization and Development, Philippine Eastern
Regional Organization for Public Administration.
Palma, A. (2001), ‗Absorptive Capacity for Government and Donor Funding: Assessing
the DOH Case‘, Policy Notes No. 2001-14, Philippine Institute for Development
Studies, 2001.
Panadero, A.A., ‗Local Capacity Building and Local Development in the Philippines:
Appreciating Capacity Building for Decentralization‘, in A. Brillantes, et al (eds)
2003, Decentralization and Power Shift, Federalism: The Future of
Decentralizing States?, University of the Philippines National College of Public
Administration and Governance.
Pangabean, A. (2006), ‗Expanding Access to Basic Services in Asia and the pacific
Region: Public-Private Partnerships for Poverty Reduction‘, ERD Working Paper
Series No. 87, Asian Development Bank, Manila.
Panganiban, E. (1998), ‗Local Governance and the New Community: Economic
Development as a Function, pp. 247 – 284 in Tapales, P. (ed.) Local Government
in the Philippines: A Book of Readings, Volume I, Center for Local and Regional
Governance, National College of Public Administration and Governance,
University of the Philippines.
Pardo, E. (2006), ‗Issues on the effective Exercise of LGU Taxing Powers‘, pp. 88-102 in
Preschle, K. and G. Sosmena, Jr. (eds) The Local Government Bureaucracy and
Local Fiscal Administration, Local Government Development Foundation and
Konrad Adenauer Stiftung, Metro Manila.
287
Parker, David and Eva Jespersen (1994), 20/20: Mobilizing Resources for Children.
UNICEF Staff Working Paper Number 12, New York: UNICEF, 1994.
Philippine Center for Policy Studies (2004), ‗Governance Project‘, available at
<http://www.e-works.com.ph/pcps/gofordev.asp>, accessed 20 December 2004.
Philippine Environmental Laws, ‗Water Code of the Philippines, Implementing Rules and
Regulations‘.
Philippine Institute for Development Studies (1998), ‗Health Care Financing Reform:
Issues and Updates‘, Policy Notes No. 98-06, October.
Philippine Institute for Development Studies (1999), ‗Inter-LGU Cooperation: The Key
to the Issues of a Devolved Health Care System‘, Policy Notes No. 99-01,
Philippine Institute for Development Studies.
Philippines Development Forum (2007), ‗Promoting Decentralization and Local
Governance for Enhanced Growth and Competitiveness: Progress and
Challenges‘, prepared for the 2007 Philippine Development Forum held on March
8-9, 2007, Cebu City.
Pineda, V.S. (1998), ‗Health Management: Strategies from Selected Cities‘, PIDS
Discussion Paper No. 98-36, Philippine Institute for Development Studies, Makati
City.
Pimentel, Jr. A., ‗Federalization: An Idea Whose Time Has Come‘, in A. Brillantes, et al
(eds) 2003, Decentralization and Power Shift, Federalism: The Future of
Decentralizing States?, University of the Philippines National College of Public
Administration and Governance.
Pimentel, Jr., A. (2007), The Local Government Code Revisited, Philippine Normal
University, Manila.
Preschle, K. and G. Sosmena, Jr. (2006), The Local Government Bureaucracy and Local
Fiscal Administration, Local Government Development Foundation and Konrad
Adenauer Stiftung, Metro Manila.
Preschle, K. and G. Sosmeňa, Jr. (2007), Center and Localities Dynamics of
Intergovernmental Relations, Local Government Development Foundation and
Konrad Adenauer Stiftung, Manila.
Presidential Decree No. 198, ‗Declaring a national policy favoring local operation and
control of water systems; authorizing the formation of local water and providing
for the government and administration to facilitate improvement of local water
utilities; granting said administration such powers as are necessary to optimize
public service from water utility operations, and for other purposes‘.
Presidential Decree No. 1067, ‗The Water Code of the Philippines: A Decree instituting a
water code, thereby revising and consolidation the laws governing the ownership,
appropriation, utilization, exploitation, development, conservation and protection
of water resources‘.
President Gloria Macapagal-Arroyo and her Administration (2004), ‗Alternative Views &
Assessments of the Macapagal-Arroyo Presidency & Administration: Record &
Legacy 2001-2004‘, Third UP Public Lectures on the Philippine Presidency &
Administration, Volume II, University of the Philippines Press, Quezon City.
Provincial Health Office, Agusan del Sur (2008), ‗Annual Report 2007‘. Government
Center, Patin-ay, Prosperidad, Agusan del Sur.
288
Provincial Planning and Development Office, Agusan del Sur (2005), ‗Community-
Based Monitoring System Agusan del Sur (Core and non-Core Indicators 2005)‘.
Government Center, Patin-ay, Prosperidad, Agusan del Sur.
Prud‘homme, R. (1995), ‗The Dangers of Decentralization‘, World Bank Research
Observer, 10(August): 210-26.
Quimpo, B. (1996), ‗Devolution Matters: A Documentation of Post-Devolution
Experiences in the Delivery of Health Services‘, Local Government Assistance
and Monitoring Service, Department of Health.
Ramiro, Jr., F. (2002), ‗Governance and Development in Mindanao‘, pp. 315-70 in J.I.
Angeles (ed.), Philippine Governance Report: Studies on the Management of
Power, Ateneo School of Government, Ateneo de Manila University, Makati
City.
Ramiro, L. et al. (2001), ‗Community participation in local health boards in a
decentralized setting: cases from the Philippines‘, Health Policy and Planning;
16(Suppl 2): 61-69, Oxford University Press.
Ramos, C. (2007), ‗Decentralization & Democratic Deepening in the Philippines‘,
Decentralization Interrupted, Part IV Studies from Cambodia, Indonesia,
Philippines & Thailand, Institute for Popular Democracy, Philippines.
Rao, Govinda (1995), ‗Poverty Alleviation under Fiscal Decentralization‘
http://www.worldbank.org/wbi/publicfinance/documents/module%2012/Poverty.p
df
Raya, R. (2008), ‗Perspective: Filipino Families and Government Spending Less on
Education‘, Focus on the Philippines, Business World.
Reclaiming Public Water Network (2007), ‗Water Democracy: Reclaiming Public Water
in Asia‘, November.
Reforma, M. (1998), ‗Reforming Government: New Concepts & Practices in Local
Public Administration in the Philippines‘, pp. 83-94 in Nakamura, A. (ed.)
Reforming Government: New Concepts & Practices in Local Public
Administration, Comparative Studies of Public Administration, EROPA Local
Government Center, Tokyo.
Republic Act No. 4670, ‗Magna Carta for Public School Teachers‘.
Republic Act No. 6716, ‗An Act providing for the construction of water wells, rainwater
collectors, development of springs and rehabilitation of existing water wells in all
barangays in the Philippines‘.
Republic Act No. 7305, ‗Magna Carta of Public Health Workers: Revised Implementing
Rules and Regulations‘.
Republic Act No. 7875, ‗An Act instituting a National Health Insurance Program for all
Filipinos and establishing the Philippine Health Insurance Corporation for the
purpose‘.
Republic Act 7880, ‗Fair and Equitable Access to Education Act‘.
Republic Act No. 7883, ‗Barangay Health Workers‘ Benefits and Incentives Act of 1995:
An Act granting benefits and incentives to accredit barangay health workers and
for other purposes.
Republic Act No. 8423, ‗Traditional & Alternative Medicine Act of 1997: An Act
creating the Philippine Institute of Traditional and Alternative Health Care
(PITACH) to accelerate the development of traditional and alternative health care
in the Philippines, providing for a Traditional and Alternative Health care
Development Fund and for other purposes‘.
289
Republic Act No. 8976, ‗Philippine Food Fortification Act of 2000: An Act establishing
the Philippine Food Fortification Program and for other purposes‘.
Republic Act No. 8980, ‗An Act promulgating a comprehensive policy and a national
system for early childhood care and development (ECCD)‘, providing funds
therefor and for other purposes‘.
Republic Act No. 9155, ‗An Act instituting a framework of governance for basic
education, establishing authority and accountability, renaming the Department of
Education, Culture and Sports as the Department of Education, and for other
purposes‘.
Republic Act No. 9275, ‗An Act providing for a comprehensive water quality
management and for other purposes‘.
Roberto, N. (2002), How to Make Local Governance Work: Listening to the Citizen’s
Voice and Taking Action: The Final Scorecard, Asian Institute of Management,
Manila.
Robredo, J., ‗Reinventing Local School Boards in the Philippines‘.
Rocamora, J. (1995), ‗Classes, Bosses, Goons, and Clans: Re-imagining Philippine
Political Culture‘, pp. vii-xxxi in Philippine Center for Investigative Journalism
and Institute for Popular Democracy (ed.), Boss: Five case Studies of Local
Politics in the Philippines, Quezon City.
Rola, A.C., H.A. Francisco and J. Liguton (eds) 2004, Winning the Water War, Philippine
Institute for Development Studies, Makati City, Philippines.
Romero, S. (2006), ‗Local Bureaucratic Performance: What is to be done?‘, pp. 48 – 72
in Preschle, K. and G. Sosmena, Jr. (eds) The Local Government Bureaucracy
and Local Fiscal Administration, Local Government Development Foundation
and Konrad Adenauer Stiftung, Metro Manila.
Romero, S. (2006), ‗Challenges and Lessons in Organizing Local Service Delivery
Associations: The Case of Water‘. German Technical Cooperation, Philipines.
Rondinelli, D. (2007), ‗Parallel & Partnership Approaches to Decentralized Governance:
Experience in Weak States‘, pp. 21-42 in Cheema, G.S. and D. Rondinelli (eds)
(2007), Decentralizing Governance: Emerging Concepts and Practices, ASH
Institute for Democratic Governance & Innovation, Harvard University.
Rood, S. (1998), ‗Decentralization, Democracy and Development‘, in Timberman, G.
(ed.) The Philippines, New Directions in Domestic Policy and Foreign Relations,
Asia Society.
‗ Rules and Regulations of Republic Act No. 9155 (Governance of Basic Education Act
of 2001)‘.
Sachs, J. (2003), ‗Institutions Don‘t Rule: Direct Effects of Geography on Per Capita
Income‘, NBER Working Paper 9499, National Bureau of Economic Research,
Cambridge MA.
Sachs, J. (2005), The End of Poverty: How We Can Make It Happen in Our Lifetime,
Penguin Books, London.
San Luis, S. (2008), ‗A Look Into The Reproductive Health Bill‘, UP University Council,
p.3, November.
Save the Children Fund (2008), ‗The Child Development Index: Holding governments to
account for children‘s wellbeing‘, Save the Children, London UK.
290
Sen, A. (2001), ‗What is Development About?‘, pp. 506-13 in G.M. Meier and J.E.
Stiglitz (eds), Frontiers of Development Economics: The Future in Perspective,
Oxford University Press, New York NY.
Senate Economic Planning Office (2007), ‗Sustaining the Momentum, Making Growth
Work for the Poor: A Proposed Legislative Agenda for the 14th
Congress‘, Senate
of the Philippines, December 2007.
Sia, C. (n.d.) ‗Decentralizing the Philippine Health System: An Overview‘, Unpublished
Report. Quoted in V. Bautista, E. Joaquin, and E. Santiago (2002), ‗Philippine
Experience in Health Service Decentralization‘, pp.73-99 in Tapales, P. and A.
Brillantes (eds.) Local Government in the Philippines: A Book of Readings,
Volume III, Center for Local and Regional Governance, National College of
Public Administration and Governance, University of the Philippines.
Sicat, G. and R. Abdula (2003), ‗Fiscal Policy‘, pp. 106-35 in A.M. Balicasan and H. Hill
(eds), The Philippine Economy: Development, Policies and Challenges, Oxford
University Press, New York NY, and Ateneo de Manila University Press, Quezon
City.
Sidel, J. (1999), Capital, Coercion, and Crime: Bossism in the Philippines, Stanford
University Press, Palo Alto CA.
Singh, Satyajit (2006), ‗Paradigms of Decentralization, Institutional Design and Poverty:
Drinking Water in the Philippines‘, Discussion Paper Series No. 2006-19,
Philippine Institute for Development Studies, October.
Singh, Satyajit, ‗Reforming the Centralized State: Accessing Decentralisation Paradigms
in the Drinking Water Sector in the Philippines‘.
Smoke, P. (2007), ‗Fiscal Decentralization & Intergovernmental Fiscal Relations:
Navigating a Viable Path to Reform‘, pp. 131-154 in Cheema, G.S. and D.
Rondinelli (eds) (2007), Decentralizing Governance: Emerging Concepts and
Practices, ASH Institute for Democratic Governance & Innovation, Harvard
University.
Smoke, P., E. Gomez and G. Peterson, Decentralization in Asia and Latin America:
Towards a Comparative Interdisciplinary Perspective.
Soliven, P.S. and M. Reyes (2008), National Report of the Republic of the Philippines.
Solon, O., R. Fabella and J. Capuno (2001), ‗Is Local Development Good Politics? Local
Development Expenditures and the Re-election of Governors in the Philippines
for 1992, 1995 and 1998‘, UPSE Discussion Paper No. 2001-04, University of the
Philippines School of Economics, Quezon City, February.
Solon, O., C. Panelo and E. Gumafelix (2003), ‗A Review of the Health Sector Reform
Agenda (HSRA) Implementation Progress‘, U.S Agency for International
Development, January.
Soriano, M. C., Steffensen, J., Makayan, E., Nisperos, J. (2005, October), ‗Assessment of
Non-IRA Transfers and Other Funds for Devolved Services in the Philippines‘,
available at
<http://www.pdf.ph/downloads/decentralization/Assessment%20of%20Non-
IRA%20Transfers.pdf>
Sosmeña, Jr., G. (1991), Decentralization & Empowerment, Local Government
Development Foundation Inc., Manila.
Sosmena, Jr. G.C., M.J. Guillermo and S.E. Sapuay (eds) 2004, Measuring Local
Government Performance, Local Government Development Foundation, Pasay
City, Philippines.
291
Sosmena, Jr., G. (2007), ‗Center and Localities: Dynamics of Intergovernmental
Relations‘, pp.1-12 in Preschle, K. and G. Sosmeňa, Jr. (eds) Center and
Localities Dynamics of Intergovernmental Relations, Local Government
Development Foundation and Konrad Adenauer Stiftung, Manila.
Sosmena, Jr., G. (2007), ‗Intergovernmental Relations: Achieving Financial and Political
Autonomy‘, pp.73-82 in Preschle, K. and G. Sosmeňa, Jr. (eds) Center and
Localities Dynamics of Intergovernmental Relations, Local Government
Development Foundation and Konrad Adenauer Stiftung, Manila.
Sproats, K., ‗Local Government in Asia and the Pacific: A Comparative Analysis of
Fifteen Countries‘, in A. Brillantes, et al (eds) 2003, Decentralization and Power
Shift, Federalism: The Future of Decentralizing States?, University of the
Philippines National College of Public Administration and Governance.
Tapales, P., J. Cuaresma and W. Cabo (1998), Local Government in the Philippines: A
Book of Readings, Volume I, Center for Local and Regional Governance and
National College of Public Administration and Governance, University of the
Philippines.
Tapales, P. (1998), ‗Participatory Governance: The Philippine Experience‘, pp. 113-123
in Nakamura, A. (ed.) Local Governance & National Development Comparative
Studies of Public Administration IV, EROPA Local Government Center, Tokyo.
Tapales, P.D. and A. Brillantes (eds) (2002), Local Government in the Philippines: A
Book of Readings, Volume III, Center for Local and Regional Governance and
National College Of Public Administration and Governance, University of the
Philippines.
Tapales, P. (2003), ‗The Nature & State of Local Government‘, pp. 309-323 in Bautista,
V., et al. (eds) Introduction to Public Administration in the Philippines: A
Reader, 2nd
Edition, National College of Public Administration and Governance,
University of the Philippines.
Teehankee, J. (2002), ‗Electoral Politics in the Philippines‘, pp. 149-203 in A. Croissant,
B. Bruns and M. John (eds), Electoral Politics in Southeast and East Asia,
Friedrich Ebert Stiftung, Singapore.
Ter-Minassian, T. (1997), Fiscal Federalism in Theory and Practice, International
Monetary Fund, Washington DC.
Teves, R., ‗Federalism: An Idea Whose Time Has Come!‘, in A. Brillantes, et al (eds)
2003, Decentralization and Power Shift, Federalism: The Future of
Decentralizing States?, University of the Philippines National College of Public
Administration and Governance.
Teves, M. (2007), ‗Importance of Revenue for Good Governance‘, pp. 37-41 in Ilago, S.,
B. Lopos and E. Cureg (eds) Local Government Financing: iTAX – A Milestone
for Local Government Finance, German Technical Cooperation, Makati City.
Tigno, J.V., ‗Decentralization and Fiscal Sustainability: Problems and Prospects for the
Philippine Experience in Good Urban Governance‘, in A. Brillantes, et al (eds)
2004, Decentralization and Good Urban Governance, University of the
Philippines National College of Public Administration and Governance.
Tigno, J.V., ‗Overview of Government Policy and Strategy Toward Water Services and
Water Resource Management‘.
292
Torres, C and F.M. Lorenzo (n.d.), ‗Policy Briefing Paper on Health and Devolution in
the Philippines: An Overview‘. Quoted in V. Bautista, E., Joaquin, and E.
Santiago (2002), ‗Philippine Experience in Health Service Decentralization‘,
pp.73-99 in Tapales, P. and A. Brillantes (eds.) Local Government in the
Philippines: A Book of Readings, Volume III, Center for Local and Regional
Governance, National College of Public Administration and Governance,
University of the Philippines.
Triche, T., S. Requena and M. Kariuki (2006), ‗Engaging Local Private Operators in
Water Supply and Sanitation Services‘, Water Supply & Sanitation Working
Notes, Note No. 12, December
Tsalik, S. (1999), ‗Size and Democracy: The Case for Decentralization‘, pp. 117-160 in
Diamond, L. (ed.) Developing Democracy: Toward Consolidation, The Johns
Hopkins University Press, Baltimore and London.
United Nations Children‘s Fund-World Health Organization (2004), ‗Joint Monitoring
Program for Water Supply and Sanitation‘.
United Nations Development Programme (1994), Human Development Report 1994.
New York: Oxford University Press.
United Nations Development Program (1996), ‗Implementing the 20/20 Initiative: Issues
Regarding Definitions, Modalities and Monitoring,‘ Paper prepared for the
international meeting on the 20/20 initiative, Oslo, 23-25 April.
United Nations Development Programme (2005), Investing in Development: A Practical
Plan to Achieve the Millennium Development Goals, New York.
United Nations Development Programme (2008), Portfolio on Enabling Environment:
Poverty Reduction Through Good Governance 2002-2004, Government of the
Philippines and UNDP.
United Nations Educational, Scientific and Cultural Organization (2008), ‗Conventions
and Laws Guaranteeing All Children the Equal Right to a Quality Education in an
Inclusive Setting Philippine Version‘.
United Nations Population Fund (2000), ‗UNFPA and Government Decentralization: A
Study of Country Experiences‘, March.
United Nations Population Fund (1997), ‗Support to Traditional Birth Attendants‘,
Evaluation Report, New York.
Ursal, S. (2006), ‗Local Finance Management and Performance‘, pp. 148-159 in Preschle,
K. and G. Sosmena, Jr. (eds) The Local Government Bureaucracy and Local
Fiscal Administration, Local Government Development Foundation and Konrad
Adenauer Stiftung, Metro Manila.
Ursal, S. (2007), ‗The New Government Accounting System: Issues in Public Audit‘, pp.
84-90 Sosmena, Jr., G. (2007), ‗Center and Localities: Dynamics of
Intergovernmental Relations‘, pp.1-12 in Preschle, K. and G. Sosmeňa, Jr. (eds)
Center and Localities Dynamics of Intergovernmental Relations, Local
Government Development Foundation and Konrad Adenauer Stiftung, Manila.
Water and Sanitation Program (2004), ‗Identifying Elements of Sustainability‘, January.
Water and Sanitation Program (2004), ‗The Experience of Small-Scale Water Providers
in Serving the Poor in Metro Manila, Increasing Access‘.
293
Water and Sanitation Program (2008), ‗Economic Impacts of Sanitation in the
Philippines, Summary‘, World Bank.
Water Sanitation and Solid Waste Management Program in the Philippines (2006),
Towards an Integrated Water Resources Management, available at
http://www.watsansolid.org.ph.
Wekwete, K. (2007), ‗Decentralization to Promote Effective & Efficient Pro-poor
Infrastructure & Service Delivery in the Less-Developed Countries‘, pp. 242-265
in Cheema, G.S. and D. Rondinelli (eds) (2007), Decentralizing Governance:
Emerging Concepts and Practices, ASH Institute for Democratic Governance &
Innovation, Harvard University.
White, R. and P. Smoke (eds) (2005), East Asia Decentralizes: Making Local
Government Work, World Bank, Washington DC.
Work, R., ‗Overview of Decentralization Worldwide: A Stepping Stone to Improved
Governance and Human Development‘, in A. Brillantes, et al. (eds) 2003,
Decentralization and Power Shift, Federalism: The Future of Decentralizing
States?, University of the Philippines National College of Public Administration
and Governance.
World Bank (1990), World Development Report 1990: Poverty. New York: Oxford
University Press.
World Bank (1993), The East Asian Miracle, Oxford University Press, Oxford.
World Bank (2001), ‗Decentralization and governance: does decentralization improve
public service delivery?‘, Prem Notes No. 55, June.
World Bank (2001), ‗Project Appraisal Document on a Proposed Loan in the Amount of
JPY3,717,900,000 (US$30 million equivalent) to the Development Bank of the
Philippines (DBP) for a LGU Urban Water and Sanitation Project APL2‘, Report
No: 21431-PH, September 14.
World Bank (2000), ‗Filipino Report Card on Pro-Poor Services‘, Report No. 22181-PH,
May 30.
World Bank (2002), ‗On Making PhilHealth Policies More Pro-poor‘, Philippines Health
Policy Note, June 28.
World Bank (2003), ‗Out-of-School Children and Youth in the Philippines: Issues and
Opportunities‘.
World Bank (2003), ‗Philippines, Country Water Resources Assistance Strategy‘.
World Bank (2003), Philippines Environment Monitor.
World Bank (2003), ‗Decentralizing Indonesia: A Regional Public Expenditure Reviw‘,
Report No. 26191-IND, Poverty Reduction and Economic Management Unit, East
Asia and Pacific Region, Washington DC.
World Bank (2003), ‗Urban Sanitation and Seawage‘, Philippines Environment Monitor,
World Bank, Washington DC.
World Bank (2004), ‗Education Policy Reforms in Action: A Review of Progress Since
PESS and PCER‘.
World Bank (2004), ‗Implementation Completion Report (TF-25191 SCL-44220) on a
Loan in the Amount of US$23.2 Million to the Development Bank of the
Philippines for an LGU Urban Water and Sanitation Project‘, Report No. 25718-
PH, July 28.
World Bank (2004b), ‗Local Development Discussion Paper‘, paper prepared for the
International Conference on Local Development, Washington DC, 16-18 June.
294
World Bank (2005a), East Asia Decentralizes: Making Local Government Work,
Washington DC.
World Bank (2005b), World Development Report 2005: A Better Investment Climate for
Everyone, Washington DC.
World Bank (2005c), ‗Philippines: Meeting Infrastructure Challenges‘, draft report,
Washington DC.
World Bank (2005), ‗A Project appraisal document on a proposed loan in the amount of
US$16.0 Million to the Republic of the Philippines for a Second Women‘s
Health and Safe Motherhood Project‘, Report No. 31456-PH, March 23.
World Bank (2005), Local Governance & Institution Report, Volume 5 Joint Needs
Assessment for Reconstruction & Development of Conflict-Affected Areas in
Mindanao, Government of the Philippines, International Funding agencies and
Mindanao Stakeholder, Pasig City.
World Bank (2005), Finance & Private Sector Development Report, Volume 4 Joint
Needs Assessment for Reconstruction & Development of Conflict-Affected Areas
in Mindanao, Government of the Philippines, International Funding agencies and
Mindanao Stakeholder, Pasig City.
World Bank (2005), ‗Philippines: Meeting Infrastructure Challenges‘.
World Bank (2006), World Development Report 2006: Equity and Development, World
Bank and Oxford University Press, New York.
World Bank (2006), ‗National Program Support for Basic Education Project‘, Report No.
35445-PH, May 22.
World Bank (2007), ‗Implementation Completion & Results Report on a Loan in the
Amount of US$ 113.4 Million to the Republic of the Philippines for a 3rd
Elementary Education Project‘, Report No. ICR0000204, January 31.
World Bank and Independent Evaluation Group (2008), Decentralization in Client
Countries: An Evaluation of World Bank Support 1990-2007, World Bank,
Washington DC.
World Bank (n.d), ‗A Project Proposal for Women‘s Health and Safe Motherhood‘,
Women‘s Health and Safe Motherhood Project 2 , Volume 1.
World Bank, ‗Social Accountability in the Education Sector‘, Social Accountability
Sourcebook.
World Bank and Asian Development Bank (2005), Decentralization in the Philippines:
Strengthening Local Government Financing and Resource Management in the
Short Term, Washington DC and Manila.
World Bank Water and Sanitation Program (2003), ‗Management Models for Small
Towns Water Supply‘, June.
World Health Organization, United Nations Children‘s Fund (2006), ‗Improved
Sanitation‘, June.
World Health Organization (2008), ‗WHO Statistical Information System‘, available at <
http://apps.who.int/whosis/data/Search.jsp>
World Health Organization, United Nations Children‘s Fund (2004), ‗Meeting the MDG
Drinking Water and Sanitation Target: A Mid-Term Assessment of Progress‘.
Yap, J. and J. Balboa (2008), ‗Why has the Philippines Lagged?‘, East Asian Bureau
Economic Research Newsletter, October.
Yap, J. (2009), ‗The Philippine Economy in 2008 and Prospects for 2009‘, Development
Research News, Vol. XXVII No.1, Philippine Institute for Development Studies.
295
Zipagan, R. (2007), ‗Consolidating Local Governments: Reducing Local Financial
Disabilities‘, pp. 136-155 in Preschle, K. and G. Sosmeňa, Jr. (eds) Center and
Localities Dynamics of Intergovernmental Relations, Local Government
Development Foundation and Konrad Adenauer Stiftung, Manila.