Embed Size (px)
Citation preview
N A S A T E C H N I C A L M E M O R A N D U M
70 2 8 0 2 8
NASA T M X- 52790
A N APPROACH TO RELIABILITY DETERMINATION OF A ROTATING
COMPONENT SUBJECTED TO COMPLEX FATIGUE
by Vincent R. Lalli and Dr . Dimitri B. Kececioglu
Lewis Research Center Cleveland, Ohio
TECHNICAL PAPER proposed fo r presentation at Ninth Reliability and Maintainability Conference cosponsored by the American Institute of Aeronautics and Astronautics , the Society of
Automotive Engineers, and the American Society of Mechanical Engineers Detroit, Michigan, July 20-23, 1970
https://ntrs.nasa.gov/search.jsp?R=19700018718 2018-08-28T03:56:40+00:00Z

AN APPROACH TO RELIABILITY DETERMINATION O F A ROTATING
COMPONENT SUBJECTED TO COMPLEX FATIGUE
by Vincent R. Lalli and Dr , Dimitri B. Kececioglu
Lewis Research Center Cleveland, Ohio
TECHNICAL PAPER proposed fo r presentation a t
Ninth Reliability and Maintainability Conference cosponsored by the American Institute of Aeronautics and Astronautics,the Society of Automotive
Engineers, and the American Society of Mechanical Engineers Detroit, Michigan, July 20-2 3, 1970
NATIONAL AERONAUTICS AND SPACE ADMINISTRATION

AN APPROACH TO RELIABILITY DETERMINATION OF A ROTATING
COMPONENT SUBJECTED TO COMPLEX FATIGUE
Vincent R. Lalli Dr. Dimitri B. Kececioglu Lewis Research Center and University of Arizona
Cleveland, Ohio Tucson, Arizona
A methodology lor clctc~~-iiiii~in: thc reliabilitv of ' mcehanical coinponcnts is given. 'l'hc necessary design data arc> pointcd out. Con~plex fatigue re- search inachincs are dcscl-ihcd, which a r e gen- csatiting the uocluircd fn t i~uc strcngth data in t e rms :if cgclcs to Sailurc and endurance strength. The tcst loading i s that of alternating bending combined \vith stcady torquc. The design data obtained a r e 1)~-cscntcd. The design by reliability methodology ;and data a r e applied to the design of an actual al- ternator rotor inner shaft, and the results a r e compared with those obtained by conventional design procedure.
SYMBOLS
- A b C
c1 D d e I 3
f , kw, s, t
average area, in. 2 * positive integer specimen radius, in. power of ten exponent specimen major diameter, in. specimen groove diameter, in. natural log base, 2.718 -r- moment of inertia, in. polar moment of inertia, in.4 s t ress concentration factor: b,
bending; f , fatigue reduction; kw , keyway; s, torsional shear; t , par t geometry
coefficient of kurtosis
life cycles factor
MSIC coefficient of skewness
K~ coefficient of variation
ka,b, c ,d ,e , f modifying factors
Lb, ut, Y tensile load (see S), klb
M bending moment on specimen, in. -1b
f cycles to failure n R r r
s
Sa, m
Sb, ut, Y
Se s;
Sa, m
T T r
WP z A e C1 t- o-
o-x
o - ~
number of specimens reliability specimen groove radius, in. coefficient of correlation s t ress ratio, sa/sm
graphical value material strength (see s) , psi
tensile strength, psi: b, breaking; ut, ultimate; y, yield
corrected endurance limit, psi estimated endurance limit of the
rotating beam specimen, psi material s t ress , kpsi: a, alterna-
nating; m, mean torque on specimen, lb-in. test results: s, success; f , failure pan weight, lb
standardized normal variable tolerance, in. angle, deg normal mean estimate difference statistic, psi normal standard deviation component of bending s t ress , psi:
C, compresion; t , tension; a , alternating; m , mean
component of radial s t r ess , psi
component of shear s t ress , psi: m, mean; a, alternating
infinity
01s a r e also used to represent statistically distributed variables

PRi'St.INT MECHANICAL DESIGN techniques depend - heavily oil "modifying factorsn to compensate for Ilns;ltsci Imoavledge of materials and loads. Some of thesc "modifying factorsH compensate for imperfect i\rioa%~lcdge concerning such things a s surface condi- tion, size, temperature, s t ress concentration and miscellaneous effects. In the best cases they a r e based on empirical data obtained over a long period of time, but in many other cases there is little real data and the selection i s based on the designer's feel a t the time, A final factor is often applied which generally reflects all the uncertainties involved and is probably inf1uenced.a~ much by the seriousness of the consequences if the part should fail as by anything else. The resulting design is probably considerably heavier than necessary.
Light designs a r e important in aerospace tech- nology. Lighter designs might be possible if the designs could be based on the statistical matching of the available strength to the imposed stress. The NASA- Lewis Research Center in conjunction with The University of Arizona has undertaken the task of developing a mechanical design methodology of this type. The design methodology being devel- oped under this research is trying to reduce the number of these modifying factors by improved lab- oratory testing methods. It is dealing with im- portant design variables a s statistical distributions rather than single valued estimates. It also makes provisions for designing a n a priori reliability into a mechanical component.
In order to work out this methodology the fol- lowing information is required:
(1) Statistical strength distributions for a selected material.
(2) Statistical s t r ess variations in a loading configuration.
(3) Statistical methods for relating s t ress to strength. This paper discusses the analytical, experimental and application status accomplished during the first pliase of this research.
A typical rotating part design problem is given in this paper to illustrate the conventional design technique. The same problem is reworked using the reliability design methodology developed th~ring Phase I of this research to see if weight savings can be accomplished.
ANALYSIS
- DETFR3IINE TIIE FAILURE GOVERKING
STRENGTH - In the engineering application of the design-by-reliability inethodology, one of the most difficult tasks i s to determine the actual strength and s t ress distributions involved for a specific material in a specific application. Two methods for determining distribution parameters for material strengths have been developed thus far: (1) Random variable functions; and (2) Di- rect experimentation. Much work remains to be done in this area.
Random Variable Functions - The method of random variable functions a s applied to material strengths i s concerned with finding a statistical function which accurately represents the materi- al 's strength. Considerable research effort has been expended by Kececioglu (I)* and others to determine which distribution defines experimen- tal fatigue data best. Distributions which have been studied a re the normal, lognormal and Weibull.
A procedure to convert readily available ten- sile strength data, such as that given in Table A-3 of Ref. (14, p. 600), to statistical functions which accurately represent the material 's endurance strength would be very useful. This tahlc gives yield strength, Sy, and ultimate tensile strength, S u t In many cases where endurance strength distribution data for AISI steels a r e not available, use can be made of the common practice, based on the work of Lipson and Juvinall (2, p. 162) , to obtain the mean estimate for endurance limit for steels as:
".s; = 0.50 SUt; when Sut 2 200 kpsi
pSk= 100 kpsi; when Sut 2 200 kpsi
The standard deviation lor the nornlal distril,utio~i can he obtained 11y maliing use of a concl~~sion based on Kececiogluf s n r j l ' o thersf w01~1i ( 3 , .4). These investigators hn1.e found that a st:inclul.cl deviation of 7 percent of thc unluotlifictl cnclui-- ance limit can I,e uec,, ' ' " " lttlc o r 11o tc.st t1:tt:i i s
cnccs a t cnrl o f 1 ) : 1 1 ) f ' ,

available. The final expression for Se becomes @sf , 0.07 Si). - " ~ a r i n ' s work (5, p. 127) can be extended to obtain a machined part 's distributional endurance limit Se by considering each parameter in Eq. (1) below a s a random variable.
Products of random variables can be calculated by various methods (6,7). A later section gives , ari example calculation of this type for the case I
of Q, kb and k, unit normal modifiers, kc i s included by a different method and SA is based '
P on experimental data rather than obtained from tables a s explained previously.
A second procedure for determining the dis- tribution of the fatigue strength of materials has been worked out using Monte Carlo Techniques. This procedure also requires knowledge of the constants lia through Irf with an estimate of 53; from existing data. Digital computing tech- niques have been developed to calculate the f irst four moments of a statistic formed by the product of 1000 draws from the normal distribution of the known variables (8, 9, 10 and 11). Results ob- tained from the Monte Carlo computer calcula- tions compare within 5 percent of those obtained by the Algebra of Normal Functions Method when the coefficients of variation a r e small. There- fore, this lat ter method provides a simple ac- ceptable method for estimating strength distri- butions under these conditions.
Direct Experimentation - In some cases it may not be possible to estimate the distribution parameters for the fatigue strength of a material. This almost always is due to a lack of statisti- cally meaningful test data and/or engineering ex- perience with a particular material. A laboratory test procedure b~ which fatigue strength for dif- ferent lnaterials could be obtained is desired.
The first requireinent of the test procedure would be to design suitable tcst specimens. Each test specimen must be carefully prepared and inspected to assure that it reproduces a s many of the essential features U L t l~c part application a s possible. nTany timcs it i s necessary to scale various test specimen paraineL~1; mnl\-ing an effort to retain the same stresses, stress con-
, centration factors, s t r ess rat ios and material - conditions. A statistically meaningful number of - these test specimens is also required.
A machine to test these specimens under conditions similar to the part application i s also needed. The fatigue testing machines used in
' this research effort a r e explained later . Groups of specimens a r e tested to failure a t fixed alter- nating s t ress levels and s t ress ratios. Fig. 1 shows the distributional S-N diagrams obtained from this testing. Five alternating s t ress levels
, and an endurance strength s t ress level a r e de- termined. The specimens a re subjected to fixed magnitudes of reversed bending and steady torque
I to keep the s t ress ratio (alternating/mean), rs, a t I fixed values. Fig. l ( a ) is for Fs = "O and Fig. l(b)
is for % = 0.825 for the cycles-to-failure and - for rs = 1 . 0 3 for endurance.
The cycles-to -failure distributions for a par- , titular s t ress ratio can be converted to the ma- terial 's strength distribution a t any desired cy- c les of life. The cumulative histogram is formed
' to show the percentage of specimens failing in each s t ress cell for a fixed cycle-life value.
' ' From this cumulative histogram, the material strength distribution can be found by using sta- tistical methods. The resulting statistical dis- tribution is the material 's strength for a fixed number of cycles of life and s t ress ratio. A num- ber of strength distributions may then be trans- lated onto the Goodman diagram, such a s shown in Fig. 2, and the experimental failure governing strength distribution surface may thus be ob- tained. Fig. 2 shows a theoretical Goodman complex-fatigue strength surface. It seems that to establish an acceptable Goodman fatigue strength surface, a t least four distributions ( r s = "0, 3.0, 0.70 and 0.30, a t a specified life cycle, KL = 10" cycles) would be required. This coupled with the static ultimate tensile strength distribution, o r a t rs = 0, gives five sections on the contour to define the strength surface. The contours shown in Figs. 1 and 2 a r e for the two parameter normal distribution. A detailed task is being considered to determine i f other clistri- bustions woultl f i t this data better.
DETERNIINE THE FAILURE GOVERNPJG STRESS - TFr j~1-0111eni of deterinini~ig the failure governing s t ress i s concerned with determining

w h i ~ h f a ~ l u r c governing theory applies best for elzc: anateu~al, loads, dimensions, stres,s concen-
" tr=lcions and the like for thc part in service. Ro- tating shafts can be analyzed using the von Mises I-Xencky failure criterion (8, 12). This criterion is applicable b ductile steels (8, pp. 152-1541, m d is theoretically valid for the elastic region only. It i s recognized that the steel used in this research fits the ductile requirement in the un- notched form. The elastic region coistrain is not met either, a s the specimens a r e tested to fracture. The justifications for i t s use a r e that (1) correlation does exist between the results predicted by it and the experimental results (13, pp. 38-41} and; (2) it i s the only theoretically Sorlr~ulated criterion which explicitly incorporates a l l s t ress conlponents involved.
Fig. 3 shows the rotating shaft surface s t ress element for the two-dimensional case. The equa- tions for components of bending, radial and shear s t resses a r e also given in th is figure. Using the s t r e s s components as defined in the s t ress dia- gram, and. according to the von Mises-Hencly criterion (14, p. 154), the failure governing al- ternating s t ress , sa, is given by
and the failure governing s t ress Fm by
I
A detailed example of the use of similar equa- tions for a specific case i s given later .
The magnitudes of the corresponding failure governing strength (stress-to-failure) components
I ' can be obtained from the three-dimensional Goodman diagram by using graphical construction techniques, shown in Fig. 10. Fig. 10 shows a probabilistic, three-dimensional Goodman dia- gram. The top portion of the Goodman strength surface is obtained by drawing three straight lines to represent a distributional (normal) sur- face. The mean estimate loci a r e drawn a s solid lines and the plus o r minus three t imes the stand- ard deviation loci a r e drawn a s dashed lines. These lines extend through experimental data
. points o r from an ordinate of (pSe, use) to the junction of (psy, 'T and w t , a h t ) . A second s t ress plane i s nee 3) ed to define Sa and Sm. This surface is defined by the probability density axis and the line passing through the origin sub- tending an angle of 82 with the abcissa. The angle 62 i s given by the application s t ress ratio:
- - 1 /2 +iF + 3 i 2 ) 'rn = ( ~ 2 ~ - 'Txmgym ym xym 1 =-=- sa ' ~ a
S s n ~ 'sm
The test specimens studied in this research a r e explained later . For this specimen config- uration, the following collditiolls apply: O2 = tan- 1 - ''a
P 'rn
M - (PM, sa = uxa = --- - (2) 1 (0.098 ?, 0.000244 2) The intersection of this line with the mean C Goodman line defines Sa and
BRIDGE THE GAP BY RELIABILITY THE- ORY - The reliability of a component can be de- termined from the basic concept that a no-failure probability exists when a given strength, S, value is not exceeded by s t ress , s . The probability that a s t ress of value s exists in the interval s1 - ds/2 to sl + ds/2 i s equal to the area of
. the element ds, o r to A1 in Fig. 4, o r

l"he probability of strength exceeding sl i s egutl thc shaded area A2, o r
Reliability i s given by all probabilities that strength i s in excess of s t r e ss 01- that S - s > 0 . Using the designation < = S - s , reliability is
The probability of no failure, that i s , the reli- given by all of the probabilities that 5 > 0 . Let
ability, at sl is the product of these two prob- abilities, o r
h( t ) be defined a s the difference distribution of f(S) and f(s), and a s f(S) and f(s) a r e normally distributed, then h(C) i s norn~ally distributed also (16, pp. 215-216) and is expressed by
dR = f(sl)ds x
1 The component reliability would then be all prob- h ( t ) = - e
abilities of strength being greater than all pos- ucdz;T
sible values of s t r e ss (13,15) o r where F = S - 5
2 2 and u C = ( a S + u s )
Reliability would then be given by all prob- abilities of t being a positive value, hence
The reliability can also be written a s
Eqs. (4) and (5) can now be used to calculate the reliability of any component whose f(s) and f(S) a r e known. These equations ca r ry limits of integration applicable to distributions defined over the interval from -m to +m. For functions defined in different intervals these limits should be replaced by the lowest and highest values that can be used. Convolution integral techniques, transform methods, o r a computer program uti- l i ~ i i ~ g Simpson's Rule (13, pp. 177 -197) may be employed to evaluate these equations and thereby determine reliability.
If the density functions f(s) and f(S), rep- resenting the s t r e ss and strength distributions, respectively, a r e Gaussian o r normal, a s shown in Fig. 5, then they may be expressed a s
The relationship between h(b) and the stand- ardized normal distribution can be utilized to evaluate the above integral. The transformation relating t and the standardized variable z may be used which i s
The new limits of the integrand a r e

- 4-00 - and b r 5 = +co, z = 3 =+a,
@c also d t = a g d z
If these conditions a r e substituted into the reliability equation, the following result is ob- tained:
Consequently, the reliability of a component is given by the area under the standardized normal
' density function from the value of I
I
I I
The value of this area may be obtained from the 1
tables of a reas under the standardized normal 1 density function, available in many references. I
' AP TUS AND PROCEDURE I I
1 The combined bending-torsion fatigue- I I
reliability research machines a r e designed to 1 simulate a shaft in service. The objective of thel immediate research program is to examine the I htigue life of specimens made of SAE 4340 steel under combined loadings. The machine is de-
I 1 signed to subject the specimens to a predeter- I mined range of combined reverse bending and / I steady icsrque. A number of specimens a r e tested under this range of conditions to obtain the sta- tistical didribution of the material 's strength. ;
Each fatigue machine consists of a two- I
I section, rotating shaft with a test specimen I
I Locked in the center, a s shown in Fig. 6. The horizontal shall. i b coupled at each end to allow for relatively free deflection when the specimen
1 I is loaded. A 7zhorsepower, 1800 rpm motor powers the shaft. The bending load is applied to
- - - -- - - I
I
the specimen h\r mc-11.: of two \ o , , L ~ , olie each on 1 two hearings located sgmmet r ica l l~~ al>out the , specinl~, i ,,;i f ~ v o C O I ~ I I ~ C I Y i a l tool Ilolde1'~ Pn1r\u7
the shaft, the yol;es a re conncctctl I)y a horizontal link, ;; hich conccntrates the load at a single ver- tical link in the center. Thc vertical linlr i s then connectccl to either a long o r a short loading lever arm. These loading a rms malre possible the ap-
/ plication of a great range of bending s t resses in 1 the specimen groove, by means of pan weights
applied at the end of the loading arm. One lb of pan weight i s equal lo approximately 2000 psi bending s t ress in the groove. The torque is applied by means of a commercial Infinit-Indexer which is located on the back shaft of the machine. Table 1 summarizes the operational specifica- tions for the complex fatigue research machines. The machine i s capable of producing, holding and transmitting to the rotating speciillen steady torques of up to 5400 lb-in, and reversed bending moments of up to 3450 in. -1b. Specimens of diameters up to 1 in. can be tested in this ma- chine by changing the collets in the specimen holder.
The SNAP-8 turbine shaft design specifica- tions were used a s a guide to make the research data directly applicable to Aerospace problems. The American Society of Testing Materials Stand- ards were used a s a guide for testing (17). Fig. 7 shows the notched test specimen details. Bar stock pieces 6 in. long where carefully machined to the dimensions and finish specified in Fig. 7(a). Each specimen has a ground-in circumferential groove and keyway. The reverse bending moment M, torque T, bending s t ress cxa, and shear s t ress T ~ ~ , a r e also defined in Fig. 7(a).
Each specimen is installed in the test ma- chine and the instrumentation i s checked for zero adjustment and calibration. Appropriate bending moment is applied to the specimen by putting weights on the load pan. Torque is applied to the specimen through the Infinit-Indexer with a suit- able wrench. The timing clock is set to zero and the machine i s started. When the specimen frac- tures a microswitch stops the cloclc and the ma- chine; See Fig. 7 (b) for the actual specimen be- fore and after fracture.

EXPERDAENTAL RESULTS
P- -- A wtal of 396 specimens have been tested. Only L38 ol. these specimens yielded useful re- sults: 150 specimens yielded cycles-to-failure data, 68 specimens yielded endurance strength data, and 20 specinlens yielded static strength data, The remaining 158 specimens were not included in the reported test data because the machine test conditions varied over too wide a range during the test , o r the specimen broke a t 1 the keyway rather than in the groove.
Tables 1 to 5 present the data obtained from the laboratory testing machines. Table 2 shows ' the cycles-to-failure data for s t ress rat ios of w and 0.825. Tables 3 and 5 show the notched and unnotched tensile strength data for a s t ress ratio of zero. Table 5 shows the endurance strength data for s t ress ratios of CQ and 1.03. Table 6 shows a summary of the best fit equa- Lions for the cycles-to-failure data a s given in I
Tables 2 and 4.
DESIGN EXAMPLES
A typical rotating par t design problem is I
explained below. The inner shaft for an alter- nator rotor (see Fig. 8) is designed using mod- ifying factors to reduce the material 's endurance limit. The shaft diameter folbwing this design procedure came out to be 5/8 in.
The inner shaft for an alternator rotor i s redesigned using the probabilistic design method - ology. The shaft diameter following the distri- butional design procedure came out to be 1/2 in. This decrease in shaft diameter over the original requirement results in about a 38bercent de- crease in weight of material required to fabricate this part. None of the original design require- ments were reduced. These requirements were met by .matching material to an application through the use of statistical methods.
CONVENTIONAL SHAFT DESIGN - The inner shaft shown in Fig. 8 is being desigmed to support an alternator rotor. The shaft is made of AISI 4340 steel, heat treated to 340/380 Brinell hard- ness with a n~ach in~r l finish. The rotor sul~jccts the shaft to a radial bending load of 136.8 lb and a torque of 1000 111-in. when delivering full load electrical power. The spline drive can exert a
maximum inisalignlllent radial force of 3 111. The hot gas turbine drive will r a i s e the shaft temper- ature to 500' F. The shaft rotates at 12,000 rpnl
8 and i s to have a life oi greater than 10 cycles corresponding to a 0.999 component reliability. What slmuld the shaft diameter be?
There a re various methods that can be used for machine design problenls in which the shaft diameter i s unlmown. For aerospace applications life and reliability a r e very important consider- ations. Shigley (14, p. 482) has shown that under these conditions it is wise to use the von Mises- Hencky-Goodman method. This method requires knowledge of material strengths and application s t resses .
The example design problem specifies that this shaft i s to be made of AISI 4340 steel, heat treated to 340/380 Brinell hardness. Table A-3 (14, p. 600) gives the tensile properties for 1 in. round, drawn 1 0 0 0 ~ F condition, 377 Brine11 hardness material a s Sy = 160 lcpsi and SUt = 187 kpsi.
Following Joseph Marin's suggestion (5, p. 127) the endurance limit will be reduced by modifying factors. These modifying factors attempt to account for the differences between the machined part 's application environment and the endurance limit defined by laboratory testing. A machined part 's endurance limit can be calculated by using Eq. (7) below:
The modifying factors will be explained later . In many cases, when endurance strength data for AISI steels a r e not readily available, use can be made of the common practice, based on the work of Lipson and Juvinall (2), to estimate endurance limits for steels as :
S; = 0.50 Sut; when Sut 5 200 kpsi
For AISI 4340 steel
S: = 0 . 5 0 ~ 1 . 8 7 ~ 1 0 ~ psi = 93.5 kpsi
The fatigue strength modifying factors for this problem can bc "i~Lailled Erom existing literature. The surface finish factor, lea, (14, Fig. 5-2G, 1). 167)
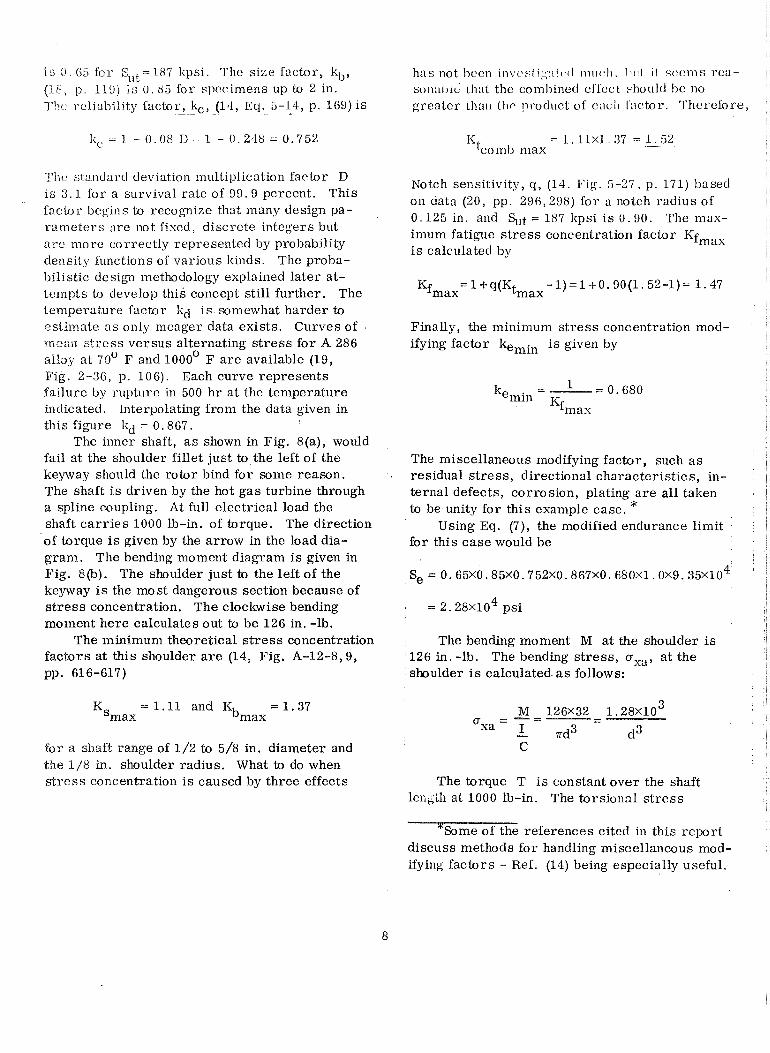
1s ( I . GS for S,lt = 187 !,psi. The size factor, kb,
(18, p 1.19) is U . b5 for specimens up to 2 in. Thc rttliability factor, - - b, (14, Eq. 5-14, p. 1tiS)ls
'I'ilc standard deviation multiplication factor D i s 3 . 1 for a survival rate of 99. 9 percent. This factor begins to recognize that many design pa- rameters :Ire not fiscd, discrete integers but a r e more correctly represented by probability density functions of various kinds. The proba- bilistic design methodology explained later at- tempts to develop this concept still further. The temperature factor kd is somewhat harder to estiinate a s only nlcager data exists. Curves of metirr s t ress versus alternating s t r e s s for A 286 alloy a t 70' F and 1 0 0 0 ~ F a r e available (19, Fig. 2-36, p. 106). Each curve represents failure by rupture in 500 h r at the temperature indicated. Interpolating from the data given in this figure kd = 0.8G7.
The inner shaft, a s shown in Fig. $(a), would fail at the shoulder fillet just to the left of the keyway should the rotor bind for some reason. The shaft i s driven by the hot gas turbine through a spline coupling. At full electrical load the shaft ca r r i e s 1000 Ib-in. of torque. The direction of torque is given by the arrow in the load dia- gram. The bending moment diagram is given in Fig. 8@). The shoulder just to the left of the keyway is the most dangerous section because of s t r e s s concentration. The clockwise bending moment here calculates out to be 126 in. -1b.
The minimum theoretical s t r e s s concentration factors at this shoulder a r e (14, Fig. A-12-8,9, pp. 616-617)
K -1.11 and Kb =1 .37 Smax max
for a shaft range of 1/2 to 5/8 in. diameter and the 1/8 in. shoulder radius. What to do when s t r ess concentration i s caused by three effects
has not Iwcn invcstigll;:~l~~tl r n l ~ c > l i . I ~ I I I i l sc:cms rea- sonaI,lc 11i:lt the conlbined cffcct ~hould he no greater than Ihrl ~>roduct of cacir l':lctor. Thcreiore,
Notch sensitivity, q , (14. Fig. 5-27, p. 171) based on data (20, pp. 296,298) for a notch radius of 0.125 in. and %t = 187 kpsi i s 0.90. The max- imum fatigue s t r e ss concentration factor Kfmax i s calculated by
Finally, the minimum s t ress concentration mod- ifying factor kemin is given by
The miscellaneous modifying factor, such a s . residual s t r e s s , directional characteristics, in-
ternal defects, corrosion, plating a r e all taken to be unity for this example case. *
Using Eq. (7), the modified endurance limit for this case would be
4 = 2 . 2 8 ~ 1 0 psi
The bending moment M a t the shoulder is 126 in. -1b. The bending s t ress , a,,, at the
' shoulder is calculated a s follows:
The torque T is constant over the shaft 1el;gi;ih at 1000 lb-in. The torsional s t r e s s
references cited in this 'cport discuss methods for handling miscellaneous mod- ifying factors - Ref. (14) being especially useful.

1. x3 m in t-hc ~~i.I.mon~n diameter section of the shaft is :
neglecting the contribution of the alternating shear s t ress due to the vertical shear a t the critical section.
Analysis has been made of the various fail- ure theories suitable for defining s t ress compo- nents under these conditions (8, p. 37, 12, p. 479). The von Mises-Hencky failure theory has gained recognition a s it seems to explain laboratory ob- servations well. The von Mises-Hencky s t ress components sa and sm a r e given by
ordinate (S, = 0 , 2 . 2 8 ~ 1 0 ~ ) and abscissa (Sut =
1 . $7x10⁵, 0). The right boundary i s defined by a point (Sy = 1 . 60x105, 0) and nn angle (tan-' G - 80.5O) a s the abscissa scale was choosen to Ise six times the ordinate scale to inlprove accuracy. A third straight line is constructed to define Sa and Sm for this case. This line i s defined by a point and an angle - (0,O) and (tan-l 0.865 = 40.8O) The intersection of Line 1 and Line 3 define the
3 point Sa = 1 2 . 3 ~ 1 0 ~ psi and % = 8 5 . 0 ~ 1 0 psi. Conventional design practice presently i s
using a margin of safety of at least 100 percent to insure a safe design. This requires that uxa meet the following constraint:
Substituting values gives 2
'rn = (O:m - uxmoym + uym +
3 1'28x10 5 6 . 1 5 ~ 1 0 3
I
2 2 d3 'a = (Oxa - uxauya + Oya +
3 3 1.28XlO = 0.209 d -Z For this problem, a reasonable model se ts i 6.15X10 3
om, gym, uya and Txya all equal to zero. Therefore,
, : o r
d 2 0.590 in.
A conventional. Goodman diagram can be pre- pared from this data. Alternating and mean s t ress are plotted a s ordinate and abscissa, respectively, in Fig. 9. Defining stress-to-failure as material strength makes i t possible to use the Goodman boundary to represent the strength of this mate- r ial a s modified by environmental factors. The top portion of the Goodman boundary is obtained hv drawing a straight line between two points -
Based on this results use a shaft diameter of - - -
i 19/32 in. The results for the conventional design- method a re tabulated in Table 7 for purposes of comparison with the probabilistic design method.
PROBABILISTIC SHAFT DESIGN - The al-
, ternator shaft designea in the previous section ! shall be redesigned using the probabilistic meth-
odology. The probabilistic design methodology being developed under Grant NGR 03-002-044 i s based on Marints technique using a modified form of the von Mises-Hencky-Goodman diagram. The primary change i s to consider the necessary design parameters a s probability density functions and the Goodman diagram a s surfaces. Consid- erable laboratory testing is also being done to define material strength surfaces in tliis form.

7'he cxa~nple design problem specified that the :lltcu~~ator shaft i s to be made of AISI 4340 steel, heat-treated to 340/380 Brine11 hardness. The laboratory test program explained in the main texl of this report gives test data for SAE 4340 steel which is similar to AISI 4340, condition C4, per MIL-S-5000B, heat treated to Rockwell C 35/40 per MIL-H-6875, with minimum tempering temperature of 1 0 0 0 ~ F, inspected according to MIL,-1-6868. These tests showed that Ct = ( 2 . 5 6 ~ 1 0 ~ ; 2 . 5 ~ 1 0 ~ ) for notched specimens and %t = ( 1 . 7 8 ~ 1 0 ~ ; 2 . 5 ~ 1 0 ~ ) for unnotched specimens (see Tables 3 and 4). This mean estimate is 0.96 times that given in able A-3 of (14, p. 600). The unnotched yield strength given in Table 5 is Sy = ( 1 . 7 1 ~ 1 0 ~ ; 3 x 1 0 ~ ) which agrees with the value given in Table A-3 of (14) fairly well (10.7 percent) and serves a s a check on the test program validity.
Since the laboratory test program is gen- erating data for endurance limits under combined conditions of reverse bending and steady torque for various s t ress ratios, not a s many modifying factors a r e required to determine the par ts ap- plication endurance limit. The test specimens were carefully machined to control surface finish so ka has been included in the test program. These tests were run on round specimens with D = 0 . 7 3 5 i n . , d = 0 . 4 9 7 5 in. and r = 0 . 1 5 0 in. ; therefore, lcb is already included. The relia- bility factor k, is introduced differently based on the overlap range of s t ress into strength a s explained in the body of this report. All of the test specimens run on this project so fa r have been in a laboratory ambient temperature of 75O
F; therefore, an estimate of the modifying factor for temperature kd is required. One value for kd = 0.867 qan be obtained from (19), Fig. 2-36, p. 106 for unnotched A 286 alloy steel. A second value for kd = 0.921 can be obtained from (81, Fig. 1.20, p. 46 based on (20) for un- notched, 1 . 8 percent nickel, 0 .8 percent chrom-
1 ium alloy steel. To obtain a normal probability iunction, define the range of kd a s 0.867 to 0.921. The mean estimate of 0.894 with a standard devia- tion of 0.009 for this range. The difference in ke for this shaft and the test specimens i s negligible. All other modifying factors a r e assumed to be unity.
Table 5 shows that S; = ( 5 . 6 5 ~ 1 0 ~ ; 3 . 2 ~ 1 0 ~ psi) for this material for rs = 1 .03 and that there is littlc change for rs - m.
Using the algebra of normal functions and Fq. (7), the modified endurallce limit for this case can be calculated a s follows:
3 S = ( 5 . 0 8 ~ 1 0 ~ ; 2.75X10 ) psi e
The bending moment, M, at the shoulder was estimated to be (126; 11.4) in. -1b. The bending s t ress , a,,, at the shoulder is calculated a s fo llow s
Thz distance to the outer fibers C is given by (0.5 a; 0.0025 3). Standard deviation for this estimate i s based on a manufacturer's guaranteed tolerance, Ad, of 0.015 3. The moment of in- ert ia, I, is given by (0.049 s4 ; 000295 34) for
ithis configuration. The ratio I/C is given by (0098 a3; 0.000735 a3). Substituting these val- ues yields the solution for bending s t ress given in Eq. (8).
The shearing moment, T , transmitted by this shaft is given to be (1000; 80) lb-in. The torsional s t ress rxym at the shoulder is calculated a s follows:
The von Mises-Hencky s t ress components a r e given a s
" ~ o r m a l distribution notation (mean, stand- ard deviation).

. -
S = a
using Eqs. (2) and ( 8 ) , and N -
usf
sm = 8.83X10 709
using Eqs. (3) and (9).
- sa - 0.144 rs=-- Sm
The above two s t ress distributions should be synthesized into the failure governing s t ress dis- tribution f(sf), along Ts in Fig. 10. Along ?Fs
hence using the partial derivatives method (22, pp. 228-235), and the parameters for f(sa) and f(sm) given above, we get
L
and
'where
- - asf sa -=- asf sm
- and -=-. - ass . Sf asm sf
Consequently,
Thus f(sf) should be coupled with f(sf) to deter- mine the shaft diameter with the specified re - liability. Consequently f(sf) should be determined next. A probabilistic Goodman diagram can be prepared from the research data. Fig. 10 is the resultant diagram for this case. The top portion of the Goodman surface is obtained by drawing three straight lines to represent a normal sur- face. The mean estimate loci i s drawn a s a solid line - ordinate ( 5 . 0 8 ~ 1 0 ~ ; 0) and is = 1 . 0 3 a t
( 5 . 0 8 ~ 1 0 ~ ; 5 . 4 ~ 1 0 ~ ) . * From here on data from , the combined s t ress fatigue reliability research machines has not been reduced a s yet. The mid-
idle portion of the Goodman surface connects the unnotched*" ultimate strength (1.78~10'; 2 . 5 ~ 1 0 ~ ) to the F;, = 1.03 points. The right hand boundary
' i s defined by the surface boundary ( 1 . 7 1 ~ 1 0 ~ ; 3 x 1 0 ~ ) and the angle (tan-' 2 = 63.5') a s the ab-
8 scissa scale was chosen to be two t imes the o r - dinate scale to improve accuracy. A second sur- face is constructed to define Sa and Sm for this case. This surface is defined by a point (0; 0) and three lines passing through the origin subtending an angle of (1 6. 1+1°) with the abscissa.
his point is based on the experimental data iven in Table 5. f* This is the currently accepted practice. I t 's validity shall be established a t the conclusion
of the present phase of this research. '

I
- I
Neglecting the effect of the very small variability , CONCLUDING REMAnKS in Fs, the intersection of the strength surface
- with the 7 line defines Sa to be approximately - 1 The Lewis Rcscarch Ccntcr in conjunction 3 (1.91 xlO{ 1.10X10 ) and , S, to be approxi- 1 with The University of Arizona has undertaken
mately ( 1 . 3 1 ~ 1 0 ~ ; 1 . 2 1 ~ 1 0 ~ ) . Combining these , the task of developing a n~cclianical design me- two distributions gives a failure gpverning strength ' thodology to stnti q{ ; c n l l j ~ match the available distribution along Fs defined a s ( 1 . 3 3 ~ 1 0 ~ ; I strength to the inipo sed s t ress . Analytical and 1. 23x10~) . ' esperimcntal methods have been dcvcloyed to
The mean and standard deviation of f(sf) and reduce the number of modifying factors necessary f(Sf) have thus been determined. If it is assumed to determine a material 's endurance limit. Im- that these distributions a re normal, then the pa- portant design variables a re handled a s statistical rameters of these distributions a re known and distributions. Provisions for designing an a a r e those determined. previously. The amount by priori reliability into a mechanical component which these two normal distributions overlap has a r e explained. In order to work this methodology been specified by a part reliability requirement out completely for one case, methods for deter- of 0.999. Eq. (6) may be used to approximate mining (1) statistical strength distributions for the reliability of this complex case. Then for SAE 4340 steel; (2) statistical s t r ess variations R = 0.999, -S /uc should be 3.09 (21, Table 3, for a rotating shaft subject to reverse bending p. 351) o r since and torque; and (3) statistical methods for relating
I strength to s t ress a r e given in this paper. 1 - c Psf - .Usf
The sample mechanical design problems - -= - (10) given in this paper show that weight savings a r e
( .&+u"~'2 '
I possible when the new design methodology i s I compared with the existing von Mises-Hencky- , Goodman design procedure.
substituting previously obtained values into Eq. (10) There a r e some serious problems in trying and solving for d yields 1 to put the probabilistic design methodology into
I
i broad usage. The most serious of these problems , @ - 0.134284 2 + 0.00412 = 0 1 is the gross lack of distributional data for ma- : / terial strengths. A second problem i s the lack !
Solving for 3 gives a 3 of 0.438 in. Use a i of loading distributions and combinations of s t ress 1
shaft diameter of 15/32 in. ~t must be pointed out distributions. Experimental test programs a r e that the portion of the Goodman diagram in I currently under way to obtain more data. These
Fig. 10 used to determine f(sf) is conservative I I efforts a r e directed toward alloy and carbon steels 1 hence this shaft's weight may be reduced further. , suitable for use in the design of machined parts
The results for the probabilistic design subjected to fatigue.
method a r e tabulated .in Table 7 . Three modifying A third problem is working with the tai ls of factors a re not required a s the experimental data statistical functions. For valid work to be ac- I
includes these factors. An a priori reliabililty is complished in this region, the statistical functions 1
designed into this part by making use of difference must be based on an unbiased sample of the pop-
statistics. The probabilistic design methodology ulation. One of the important tasks defined in results in better than a 38 percent savings in ma- Phase I1 of this research is to determine the
terials for this case. Furthermore the design effect of sample size on the discrimination ability
integrity is known to have a reliability of 0.999, , of selecting the best distribution from among such that on the average no more than one in a various distributions that fit the experimental 1000 such shafts will fail while functioning during data. their designed for mission.
I 1 . D. Kececioglu and H. Broome, ~ r o b a b i l i s t i c l ' Graphical and Phenomenological Analysis of I / Combined Bending Torsion Fatigue Relia- I bility Data, I t University of Arizona, 1969. 2 . C. Lipson and R . C. Juvinall, eds. , "Appli-
cation of S t r e s s Analysis to Design and 1 &/leti?llurgy, 'Jniver sity of Michigan Summer Conference, Ann Arbor, Mich. , 1961.
3. Kececioglu, e t a l . , "Design and Development of and Results f rom Combined ending Torsion Fatigue fteliability Research Ma- chinges, l l University of Arizona, 1969.
1 4. F. B. Stulen, H. N. Cummings, and W. C. Schulte, "Preventing Fatigue Fai lures . - - -. P a r t 5 - Calculating Fatigue Strength, " Machine Design, vol. 33, no. 13 , June 22, 1961, pp. 159-165.
5. J . Marin, "Design for Fatigue Loading. P a r t 3 , " Machine Design, vol. 29, no. 4, Feb. 21, 1957, pp. 124-133.
I
6. M. D . Springer and W. E . Thompson, "The Distribution of Products of Independent Random Variables, ' I General Motors Defense Research Laboratories Report TR 64-46, AD-447393, Aug. 1964.
I
7. J . D. Donahue, l r Products and Quotients of Random Variables and Their Applications, "
I Martin Company, Report ARL-64-115, AD- 603667, July 1964.
I 8. D. Kececioglu, "Probabilistic Method of
Designing Specified Reliabilities into 1 4
I Mechanical Components with Time De- pendent S t r e s s and Strength Distributions, 1'
I University of Arizona, 1967. I
9. Yu. A . Shreider, ed. , "The Monte Carlo I i Method, New York, N. Y. : Pergamon, , 1 1966. . l o . J. H. Cur t i ss , lfMonte Carlo Methods for t h i I Wesation of Linear Operators , " National 1 I I bureau of Standards Report 2365, 1953. / X I . H. A . Meyer, e d . , ftSymposium on Monte I I
Carlo Methods, 1-1 New York, N. Y. : I 1956.
Wfiey, I / 12. S. Timo shenko , "Strength of Materials.
I P a r t II, " New York, N. Y. : Van Nostrand! 3rd ed. , 1956, pp. 438-558. I
I
13. R . W. J a i l e r , G. Frei l ich, and A. W. I i
Castellon, "Flight Vehicle Power Systems; Reliability Cr i te r ia , American Power J e t Company Report APJ-268-1, ASD-TR-61- I 736, Mar. 1962. I
I 14. J. E. Shigley, "Mechanical Engineering
Design, " New York, N. Y. : McGraw-Hill, 1963.
15. D. Kececioglu and D. Corrnier, "Designing a Specified Reliability Directly into a Com- ponent, Proceedings of the Thi rd Annual Aerospace Reliability and Maintainability Conference, New York, N. Y. : SAE, 1964, pp. 546-565.
16. A. Hald, Itstatistical Theory with Engineering Applications, New York, N. Y. : Wiley, 1952.
17. Anon., "A Guide for Fatigue Testing and the Statistical Analysis of Fatigue Data, " Special Technical Publication No. 91 -A, Philadelphia, Pa . : ASTM, 2nd ed. , 1963,
18. H. J. Grover, S. A. Gordon and L. R. Jackson, "Fatigue of Metals and Structures, Washington, D. C . : Government Printing Office, 1954.
19. D. Kececioglu and E . B. Haugen, "Interac - tion Among the Various Phenomena Involved in Design of Dynamic and Rotary Machinery and Their Effects on Reliability, " Univer- sity of Arizona, AD-671780, Apr. 1968.
20. G. Sines and J. L. Waisman, eds . , !!Metal Fatigue, " New York, N. Y. : McGraw-Hill, 1959.
21. S. R. Calabro, "Reliability Principles and Pract ives, " New York, N. Y. : McGraw- Hill, 1962.
' 22. Gerald J. Hahn and Samuel S. Shapiro, "Statistical Models in Engineering, John Wiley & Sons, 1967, New York, pp. 355.

Table 1 - Operational Specifications for the Strength Distribution Research Machines
1 . 0 in. diameter maximum; simple design employing "off-the- shelf" components.
Steady Torque: torque of 5400 lb-in. to test specimen.
Reversed Bending: Test Specimen:
chemical and physical properties; uniform quality, same heat and processing, heat treat to lZockwell "C" 35/40 a s per MIL- H-6875 with minimum tempering temperature of 1 0 0 0 ~ F; in- spection a s per MIL-1-6868; D = 0 . 7 3 5 in. , d = 0.500 in. , r = 0.150 in.; ICb = 1.45; Ks= 1.22, with 1 in. X 1/8 in. x1 /8 in.
Instrumentation:
To handle a t least 6 se ts of strain gage outputs simultaneously. To transfer strain gage data to amplifier while specimen i s rotating. To amplify static and dynamic output from strain gages.
Recorder To produce a permanent record of amplified strain gage outputs. I aThree such machines have been built to date and a r e being used to obtain distributional
complex fatigue data for the steel specimens specified above.

Tabie 2 - Cycies-To-Failure Fatigue Data Material: SAE 4340 Steel, Roclwell 35/40
MIL-S-5000B, Condition C 4
a~dd i t iona l s t r e s s rat ios of 3.0 and 0 . 3 a r e being investigated. b ~ e a n s t resses rounded to the nearest 500 psi . 'variability asa is the standard deviation of the distribution about the mean. d~oeff ic ient of variation KV i s the ratio of the variability to the mean expressed a s
a percentage e~ycles-to-fai lure rounded to the nearest 50 cycles.

Table 3 - Tensile Strength
Data for Notched specimensa
a ~ l ~ e c i m e n diameter a t the base of the notched was controlled to 0.4975 zt0.0025 in. which gives an area of 0.1944
2 h0.0019 in. . h ~ t r e n g t h has been rounded to
nearest 500 psi. ' ~ a t a reduction to normal pa-
rameter s.
Ultimate Breaking p 255.5 304.0 kpsi a 2 .5 3 .0 kpsi
Table 4 - Tensile Strength Data for Unnotched Specimens
rs = 0
aSpecimen diameter was controlled to d k0.0025 in. which 2 gives an a reaof xk0.0019 in. .
b~t reng ths rounded to the nearest 500 psi. CData reduction to normal parameters:
Yield Ultimate Breaking p 171.0 178.0 255.0kpsi a 3.0 2 . 5 4 .5 kpsi

, I
Table 5 - Endurance Strength Data
, Material: SAE 4340 Steel, Rockwell 35/40 MIL-S-5000B, Condition C4
aTest results: S - success, if specimen survived bxloC' cycles
I F - failure, if specimen broke before bxloC cycles b ~ a t a reduction to normal parameters:
r 13.01 1.0310.31 0 I (1 56.0 56.5 1 Tensile lipsi
u 3 .5 3.2 Test kpsi

, Table 6 - Strength Distribution Best Fit Summary
Material: SAE 4340 Steel, Rockwell 35/40 MIL-S-5000B, Condition C4
as t ress rounded to nearest 500 psi. b~qua t ion of a straight line on special graph paper with ordinate (Y),
abscissa (X), slope (m) and intercept (b) such that Y=mX+b. CThe coefficient of correlation between two perfectly correlated linear
variables should be 1.0000. Deviation from this value is a measure of goodness of f i t .

I
I
I
I I
---- -- - - -- - i
Table 7 - Alternator Inner Rotor , _- , r . ,- ,. I I
--,. Shaft Design Summary , I h
ke
Sl
Se T M
a ~ o r m a l distribution notation (mean, standard /deviation).
b~egend: 'N. R. - not required a s experimental data include's / I I this factor. I
D . M. - a different method is used to include this 1 factor . I I I ,
CThe reliability obtained by the approach of Shigley / ' j(14, p. 169) is not theoretically applicable to this; I
lcomplex case, hence the reliability is really not 1 1 I 'known.
i i / I i 1 8 '
'm i
sa
I S,
0.680 min
9 . 3 5 ~ 1 0 ~ psi 4
2.28~10 psi
1000 lb-in. 126 in. -1b
N.R. 3 ( 5 . 6 5 ~ 1 0 ~ ; 3.2x10 ) psi
4 3 (5.08x10 ; 2.75X10 ) psi
( 1 x 1 0 ~ 80) lb-in. (1.26~10'; 11.4) in. -lb
8. 83x10~
a3 12 .3~10 psi
85. 0xlo3 psi
8.83x10³ *--.-- 709 psi
33 :3 ~3 ( 1 . 9 1 ~ 1 0 ~ ; 1.10~10~) psi
( 1 . 3 1 ~ 1 0 ~ ; 1 . 2 1 ~ 1 0 ~ ) psi
I
I
x i
i . j /

MATERIAL: SAE 4340 STEEL MIL SPECS: S-50008, H-6875, 1-6868
CONDlTlON C4, ROCKWELL C 35/40
180 160 140 120 ENDURANCE 100
z 80 a Y
,% 60
v; ln z 40 c (A) STRESS RATIO: = m. V) ln
180 I ' 160 t; 4 140 = 120 ln
2 100 w ENDURANCE
80
60
40 I$ 104 105 106 107
CYCLES TO FAILURE, Nf
(B) STRESS RATIO: 6 = 0.825 FOR CYCLES-TO- FAILURE AND 7, - 1.03 FOR ENDURANCE.
Figure 1. - Distributional S-N diagrams.
r ALTERNATING BENDING STRENGTH DISTRIBUTION I
I I
CONSTANTS: - I r = W I Kt = 1.45 , ,' ,COMBINED STRENGTH KI = 10n CYCLES
Figure 2. -Three-dimensional Goodman fatigue diagram.

EQUATIONS
O X = ox", ' uxa 0 = u Y ym * O Y ~
Tm = Txym * 'lxya
Figure 3. - Rotating shaft surface element stresses.
LEFT TAIL OF STRENGTH z DISTRIBUTION 7, W I \
ds STRESS OR STRENGTH, kpsi
Figure 4. - Probability areas of stress and strength.

f(s) f (S)
NORMAL DISTRIBUTION
ORDINATE
0 - S S
STRESS OR STRENGTH, kpsi
Figure 5. - Stress and strength distributions.
Figure 6. - A close-up view of t h e complex-fatigue research machines.

(A) DIMENSIONS, FINISH, FORCES AND STRESSES.
(B) CONFIGURATION BEFORE AND AFTER FATIGUE TESTING.
Figure 7. -Test specimen details.
(B) BENDING MOMENT DIAGRAM.
Figure 8. -A l te rna to r i n n e r rotor shaft.

ALTE
RNAT
ING
STRE
SS O
R ST
RENG
TH,
kpsi
AL
TERN
ATIN
G ST
RESS
OR
STRE
NGTH
, kp
si


![patriotic hygiene 2013 Cosponsored by UNC's - [email protected]](https://img.pdfslide.net/doc/110x75/620495b54b1be21e4726f6d2/patriotic-hygiene-2013-cosponsored-by-uncs-emailprotected.jpg)


![Reliability Maintainability and Risk[Cyberdownlinx]](https://img.pdfslide.net/doc/110x75/54610995af79593f708b576a/reliability-maintainability-and-riskcyberdownlinx.jpg)