Embed Size (px)
Citation preview

DOCUMENT RESUME
ED 048 650 EA 003 370
TITLE Technical Papers of the Association of PhysicalPlant Administrators of Universities and Colleges.
INSTITUTION Association of Physical Plant Administrators,Corvallis, Oreg.
PUB DATE 70NOTE 150p.
EDRS PRICEDESCRIPTORS
ABSTRACT
EDRS Price MF-40.65 HC-$6.58*Heating, Organizations (Groups) , *ParkingFacilities, Physical Facilities, *SchoolMaintenance, *Technical Reports, *Utilities
These technical papers by Association members covera few of the many work functions of physical plants. The authors andtheir topics are: Thomas E. Shepard, "Opportunities for Controllingthe Cost of Electric Power"; Walter W. Wade, "A Different Approach toParking Structure Construction"; Ronald T. Flinn and Jesse M.Campbell, "Walk -- Through Steam Tunnels at Michigan StateUniversity"; Donald Whiston, "Searching for Answers to RefuseHandling"; Raymond Halbert, "Elevator Maintenance Cost Analysis"; R.S. Hollar, "Electrical Demand Study of Campus Buildings at ColoradoState University"; Harry F. Ebert, "Physical Plant Organizations inUniversities and '2olleges"; and Guy Valade and G. M. Gauthier,"Survey of Building Management Centers of North AmericanUniversities." (Charts on p. 87, 150-153, and figure on p. 42 mayreproduce poorly.) (Author)

C:D
Lf1
TECHNICAL PAPERSca OF
THE 4SSOCIATION OF
PHYSICAL PLANT ADMINISTRATORS
OF UNIVERSITIES AND COLLEGES
APPAU.S. DEPARTMENT OF HEALTH, EDUCATION & WELFARE
OFFICE OF EDUCATION
THIS DOCUMENT HAS BEEN REPRODUCED EXACTLY AS RECEIVED FROM THE
PERSON OR ORGANIZATION ORIGINATING IT. POINTS OF VIEW OR OPINIONS
STATED DO NOT NECESSARILY REPRESENT OFFICIAL OFFICE OF EDUCATION
POSITION OR POLICY.
Published byC'D
Association of Physical Plant AdministratorsC'D Oregon State University
Corvallis, OregonPERMISSION TO REPRODUCE THIS COPY
RIGHTED MATERIAL HAS BEEN GRANTED
Ete,ka'ofCopyright © on by APPA Oda we 5
TO ERIC AND ORGANIZATIONS OPERATINGUNDER AGREEMENTS WITH THE U.S. OFFICEOF EDUCATION. FURTHER REPRODUCTIONOUTSIDE THE ERIC SYSTEM REQUIRES PER-
I.MISSION OF THE COPYRIGHT OWNER

TABLE OF CONTENTS
Foreword
Opportunities for Controlling the Costof Electric PowerThomas E. Shepard
A Different Approach to ParkingStructure Construction
Walter W. Wade
WalkThrough Steam TunnelsAt Michigan State University
Ronald T. Flinn and Jesse M. Campbell
Searching for Answers to Refuse HandlingDonald Whiston
Elevator Maintenance Cost AnalysisRaymond Halbert
Electrical Demand Stud'; of Campus BuildingsAt Colorado State University
R.S. Hollar
Physical Plant Organizationsin Universities and Colleges
Harry F. Ebert
Survey of Building Management Centersof North American Universities
Guy Valade and G.M. Gauthier
1
27
37
53
71
89
101
143
ti

FOREWORD
The Association of Physical Plant Administrators of Universities andColleges was founded in 1914 for the purpose of aiding its membersthrough the sharing of information and dissemination of mutually usefulknowledge. The first papers ever published by APPA were sent out to themembership in 1966. In 1968, another issue followed and in 1969, thevery well received "Campus Disorders" was published. This issue marks thefirst publication of type set pages for said papers. This issue of technicalpapers was authorized by the Board of Directors of APPA. Publication hasproceeded under the stewardship of George 0. Weber, President, APPAand Sam F. Brewster, Vice President for Professional Standards, APPA.
Physical plant activities represent a broad spectrum of work functionsbut only a few are represented herein. The future should hold manyinteresting topics for the perusal of the APPA membership. Membersshould be encouraged to prepare and submit papers to their regions andtheir regional representatives.
Authors and sponsors of articles used in this issue have beenextremely helpful in the submission of articles and assisting in the finalpreparation of the documents. In addition, we wish to acknowledge theassistance of Dennis W. Nelson, who aided greatly in adapting the writtenand graphic material to the format herewith presented. To each and everyone of these persons the editor publicly acknowledges his thanks.
Richard A. AdamsEditor Newsletter
August, 1970

OPPORTUNITIES FOR CONTROLLINGTHE COST OF ELECTRIC POWER
THOMAS E. SHEPHERD, JR., P.E.
Thomas E. Shepherd, Jr., is now Superintendent of Electrical Servicesat M.I.T. He joined the Physical Plant Staff of M.I.T. in 1967, working asStaff Engineer on utility problems and in the electrical operation ofdistribution systems and new construction programs. Prior to 1967, hespent 17 years with Jackson and Moreland, Division of H.E. & C., asProject Manager in the Utility Services Department, specializing inutility-industry economics.
He received the B.S. degree from M.I.T. (1950) in Economics andEngineering and subsequently attended Harvard Graduate School ofEngineering.
He is a registered professional engineer in Massachusetts and amember of I.E.E.E.
In this technological age vr4 amounts of time and moneyare invested in controlling the use of electric energy at all levelsof sophistication. I'm sure that you can point to significantcontributions on your own campus. Of course, the results ofthis effort are awesome. It is frequently claimed that theavailability of instant energy at reasonable cost is thecornerstone of our present civilization.
On our campus, and probably on yours, electric powercosts represent between 15 and 20 percent of our total plantoperating budget. With this level of use, it is not surprising thatrelatively small investments of time and money on the part of
1

plant administrators directed to controlling the cost of thissilent but expensive servant can yield high returns measured inreduced power cost.
When I was considering a title for this paper my immediatethought was "Opportunities for Reducing the Cost of ElectricPower." I changed from reducing to controlling becausereducing the cost has a connotation of achieving a lowei totalelectric power cost next month or next year than you spent thisyear. In this day of rapidly growing campuses and increasingelectric use it is probably not possible to actually lower thetotal cost of power.
Therefore, reduce cost? Probably not. But increaseefficiency, lower the unit cost, get more service for each twodollars you spend for power. Definitely yes! This is possible,and this is what I refer to as controlling the cost of power.
The reference I made to two dollars spent for power is aleading thought to impress you with the fact that electric costs,like good fighters and boy friends, are ambidextrous. That is,you always have two arms to contend with when you aremaking an electric power decision. Don't spend too much timewatching the left hand, say, investment, or you may getclobbered by the right hand, the electric bill or electricalmaintenance costs. What you should be looking for areopportunities to control your total campus electric cost; andyou should keep in your thinking a balance between fixed costsand operating costs.
The major portion of my talk today will deal with thequestion of power factor, a very specific electric power costproblem. Power factor improvement is one of the mostdramatic opportunities to control the cost of power and itapproaches the problem in a free swinging, two fisted manner.But before I get into power factor I would like to give you thegeneral broad check list which we use at the Institute to try tocontrol our cost of power.
First, I might ask, "How often do you talk with yourutility representative?" Keep in mind that your utility is yourbest source of advice and counsel on electric problems. At
2

M.I.T. we have set up a regular monthly luncheon with ourutility company where two or three representatives from eachorganization sit down for lunch and talk. Occasionally we havean agenda of questions or problems but usually we meetwithout any pressing needs: invariably we get into a stimulatingdiscussion of mutual problems.
There is a tendency, I think, to avoid discussions with theutility except when it is absolutely necessary, for a new serviceor for adding load on your present service. This sort of armslength attitude shuts you off from innovative thought andsuggestions by a widely experienced consultant.
As a second question I would ask, "How long has it beensince you made a serious and fairly comprehensive electricservice review?" By review I mean a justification, perhaps betterconsidered an audit, of your electric power cost. If it has beenlonger than five years our electric use characteristics and ourpurchased electric costs can change enough so that accumulateddeficiencies are costing us money. Enough money annually sothat such an audit can be self supporting out of first year'ssavings. I feel confident that you are in the same situation.
What steps are involved in an electric service review? Sucha review falls naturally into two parts: first, getting togetheryour facts and data, and, second, questioning the facts.
The data gathering should include information in thefollowing three items:
Item 1. A list showing in tabular form a factinventory for every separate serviceloci tion with as much pertinent statisticalinformation as is available. The list shouldinclude the following as a minimum foreach location.
a. Rate schedule in use,b. Maximum demand and time of
occurrence,c. Power factor,d. Annual KWH energy
consumption,
3

e. Average cost-per KWH,f. Service voltage level and
secondary use level.g. Adjacent services,h. Transformer and equipment
ownership.
Item 2. An up-to-date copy of the published ratesof your utility supplier together withcopies of his general service agreements andservice requirements.
Item 3. A talk with as many other electriccustomers as possible to determine theirrate schedule and their use characteristicstogether with their average cost.
When you have collected your factual data. the secondpart of the electric service review involves a critical questioningof as much of your factual data as your resources will permityou to pursue. As a first step, which requires no effort on yourpart, you should ask your utility to review each service todetermine that you are on the proper and most advantageousrate schedule. The utility should be willing to make this analysisand report to you on a semi-formal basis for each separatelocation. Keep in mind that the utility is also best qualified toadvise you as to how you can qualify for a better rate and alsomake suggestions as to how you can optimize costs on yourpresent rate.
On your part, you should make a critical review of at leastone current bill for each of your major services. Ask yourselfsuch obvious questions as:
a. Am I getting my discounts?b. Is the bill computed properly?c. Why am I on this rate?d. Why don't I qualify for a better rate?
Make sure you get a satisfactory answer to each question.Often this routine investigation will turn up obvious errors oroversights on the part of the utility. Don't make the mistake ofequating utility bills to bank statements on an accuracy basis.
74

This investigation is also going to turn up obvious errorsand oversights that you have made over the past five years.Correcting your own errors is just as rewarding financially if notegotistically as correcting the utilities errors.
In an electric review conducted this past year, after a fiveyear interval, we discovered that three out of 17 of our separateservices which were analyzed in detail were not being billedproperly or on the most advantageous rate. The review alsodisclosed that our major campus totalized service was not beingproperly billed because of a metering deficiency. The immediatebilling corrections for these items more than paid for the entirecost of our formal studies which also included manynon-associated electrical analyses.
At this point in the review after you have done someserious questioning undoubtedly you will have raisedunanswered questions which require a special study of sometypeperhaps technicalperhaps economic or perhaps a fullengineering/economic comparison is indicated. Do you hire anengineer? Can the potential benefits justify this expense? Canyou handle the study internally and satisfy your administrativeofficers? I'm sure that you've faced these questions many times.I just add the reminder to exhaust the resources of your utilitybefore you pay for consulting help.
What sort of special studies might be indicated? You willcertainly see possibilities for basic changes in your type ofservice: possibly extension of your own distribution system, achange in voltage level or a change in the ownership of servicefacilities. You will also find a variety of ideas aimed atimproving your load and cost characteristics within theframework of your present rate schedule and physical plant. Idon't mean shutting off lights, the idea widely attrhuted toPresident Johnson, but by some kidicious planning you canfrequently add economical off-peak load or move on-peak loadto your long-hours use energy block. Or conversely, you canlook critically at proposals to add loads which will increase yourdemand unnecessarily.
5

Power Factor Improvement
You may find that an awareness of power factor and itseffect on your power costs can be very helpful in setting upspecial studies. Large electric power users frequently have anexpensive power factor problem. Most college and universityfacilities fall into this category. Many college administrators towhom power factor was only an academic problem (pardon thepun) a few years ago are finding it a serious, practical andeconomic problem today. Growing non-lighting loads, morestringent ventilation requirements, more critical voltageregulation requirements for building equipment and scientificuse and even for the more sophisticated devices coming downthe line for boiler supervision and control, and of course therapid growth of air conditioning, all contribute to a powerfactor problem.
The low, lagging power factor which is characteristic of theconnected load of larger commercial, semi-industrial andacademic buildings results in hidden or disguised costs which hitthe power user twice. First, in his construction cost when he isbuilding, and second, in his operating expenses on each monthlypower bill. Low power factor makes it necessary to scale theentire electric system of a building perhaps 20% larger thannecessary initially, and, as if that is not enough penalty, thesame power factor problem may add a three percent mark-up tothe cost of each KWH purchased over the entire life of thebuildingit has on our campus.
Low power factor can be corrected to eliminate most ofthese capital and operating cost elements and as a consequencea power factor improvement program will invariably yielddramatic cost reductions. An initial investment is required but,happily, this investment is self amortizing from savings, usuallywithin two years, and the annual savings generated by theequipment then continue. actually increasing in value, each yearfor the full life of the equipmentestimated at 20 to 30 years.
Who Should Consider Power Factor Improvement?
A power factor improvement program or at least a reviewof power factor economics is indicated for any institution that
6

purchases at primary level, on a large commercial or industrialpower rate or maintains one or more of his own electricsubstations. More specifically, some power factor improvementwill prove to be worthwhile if your electric use meets one ormore of the following conditions:
1. If your electric power demand is measured andrecorded on your power bill in KVA or if yourelectric rate has a KVAR or power factor penaltyclause,
2. If you have problems anywhere on your distributionsystem with voltage regulation or chronic low voltage,
or 3. If load growth is eating into the spare capacity of oneof your substations or distribution lines and you arefaced in the near future with adding additionaltransformer or feeder capacity.
Power factor improvement will save you money in each ofthese cases: it will reduce your purchased power cost if you buyon a KVA demand rate; it will improve your voltage regulationand ease any low voltage problems; and it will increase thepower carrying capability of your transformers and feedersthereby delaying the need for capital expenditures. These arethe areas where power factor is significant because power factorimprovement releases locked-up capacity and increases theefficiency with which you use the copper and aluminum both inyour electric system aid in the utilities' system.
Where do the savings and cost reductions of power factorimprovement come from? It is easy to appreciate the actualsaving you incur if you increase the efficiency or power carryingcapability of your distribution system. Your investment indistribution equipment is smaller for a given power requirementand you can see the saving associated with the avoidance ordelay of a major investment in a larger substation.
Similarly, many electric utilities will pay you in reducedpower bills for any power factor improvement you make. Theutility is willing to pay you because of power factorimprovement at the extremities of his entire power supply
7
10

system, distribution, transmission and generating. He sees thesesavings as an extension of the saving you see in reduced voltagedrop and released capacity.
As you might expect, while power factor improvement is afairly simple concept in economic terms it becomes fairlycomplex in engineering and application techniques. There are awide variety of ways to improve power factor when you get tothe detail engineering level. Fortunately, the layman can getgood advice in many areas at no cost from the local utility andfrom the manufacturers who supply the equipment. All that isneeded is an appreciation of the problem and, if you feel thatyou qualify for savings, a call to your utility as a starter.
At M.I.T. we are correcting power factor in a number ofways for each of the reasons noted above, and power factorcorrection is paying off handsomely on some fairly sizeableinvestments. For example, within the past year we have investedabout $60,000 in equipment for power factor improvement. Weare recovering this investment at the rate of $3,000 per monththrough reduced electric power billing. Our pay-off period forpower factor correction is roughly 22 months.
What is Power Factor?
Let me start off by stating that power factor isfundamentally and simply an efficiency ration. Please keep thisin mind while I pursue briefly the other things that it is. Youprobably recall the common formula definition for powerconsumed in an electric circuit:
P(kw) = E I Cos e See Figure 1]
That is, power equals volts times amps (current) times cosine 0The L.osine 0 factor in the equation represents the power factorof the load.
The power factor of a circuit is usually expressed as apercentage which represents the cosine of an angle, usuallyidentified as e, which exists between the vector current flowingin a circuit and the vector voltage applied to the circuit. Thesame angle 0 is the angle which exists between the real power
8

POWER :Pd KW) E x Ix Cosine e
Real Power = Volts x Amps x Power Factor
REAL POWERKW
REACTIVEOR
IMAGINARYPOWER
K VAR
FIGURE 1
vector, the kilowatts (KW) measuring the actual work output ofthe electric circuit, and the apparent power vector, thekilovolt-amperes, (KVA) measuring the actual voltage andcurrent applied to the circuit. Therefore power factor is theratio of the KW used to the KVA delivered.
As you note from the geometry of the right triangle on thevector diagram (in Figure 1) the apparent power, KVAdelivered, is always larger than the real or useful power KWconsumed. For common electric systems the real power willaverage between 80 and 90 percent of the apparent power.Because apparent power is always somewhat larger than realpower and therefore sizes, the electric system, most electricaldevices are rated in KVA rather than in KW.
9
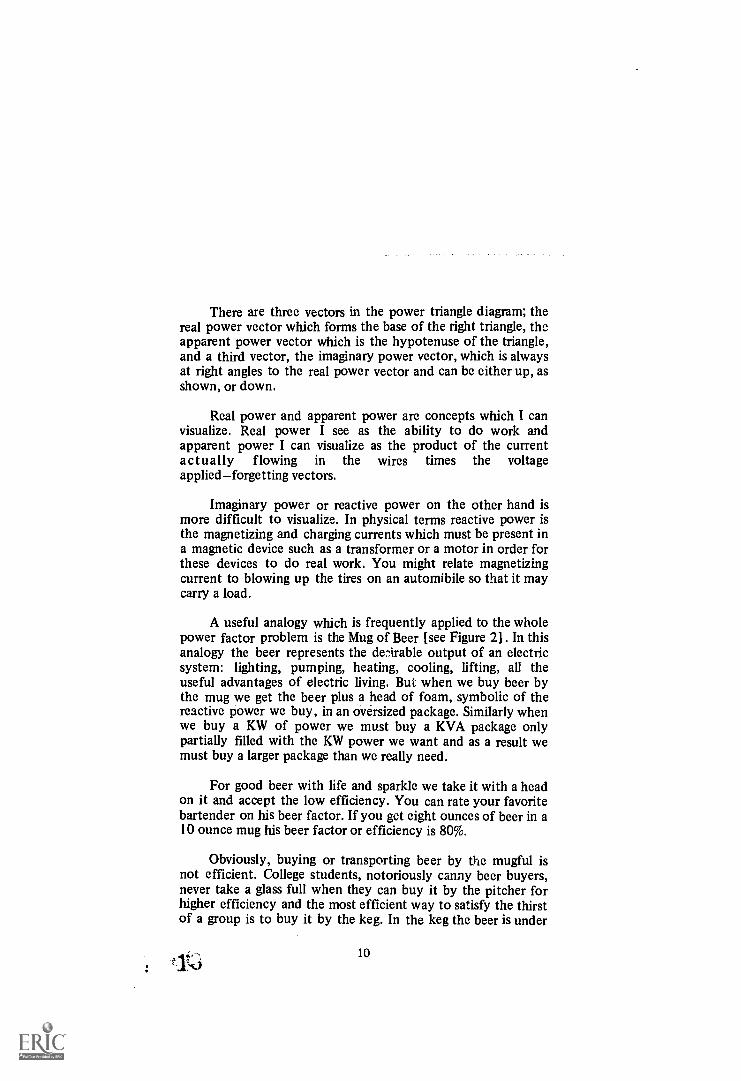
There are three vectors in the power triangle diagram; thereal power vector which forms the base of the right triangle, theapparent power vector which is the hypotenuse of the triangle,and a third vector, the imaginary power vector, which is alwaysat right angles to the real power vector and can be either up, asshown, or down.
Real power and apparent power are concepts which I canvisualize. Real power I see as the ability to do work andapparent power I can visualize as the product of the currentactually flowing in the wires times the voltageapplied forgetting vectors.
Imaginary power or reactive power on the other hand ismore difficult to visualize. In physical terms reactive power isthe magnetizing and charging currents which must be present ina magnetic device such as a transformer or a motor in order forthese devices to do real work. You might relate magnetizingcurrent to blowing up the tires on an automibile so that it maycarry a load.
A useful analogy which is frequently applied to the wholepower factor problem is the Mug of Beer [see Figure 2] . In thisanalogy the beer represents the desirable output of an electricsystem: lighting, pumping, heating, cooling, lifting, all theuseful advantages of electric living. But when we buy beer bythe mug we get the beer plus a head of foam, symbolic of thereactive power we buy, in an oversized package. Similarly whenwe buy a KW of power we must buy a KVA package onlypartially filled with the KW power we want and as a result wemust buy a larger package than we really need.
For good beer with life and sparkle we take it with a headon it and accept the low efficiency. You can rate your favoritebartender on his beer factor. If you get eight ounces of beer in a10 ounce mug his beer factor or efficiency is 80%.
Obviously, buying or transporting beer by the mugful isnot efficient. College students, notoriously canny beer buyers,never take a glass full when they can buy it by the pitcher forhigher efficiency and the most efficient way to satisfy the thirstof a group is to buy it by the keg. In the keg the beer is under
10

11.
FIGURE 2
1!;. ,
Ly

pressure with the bubbles dissolved and no foam present and noloss of volume or efficiency is incurred.
This is the secret of power factor improvement, buy yourpower by the keg, so to speak, without any reactive elementand add the reactive power yourself each time you tap the keg.
I should re-emphasize here the fact that we can't dowithout reactive power. Every magnetic device requires it andthe electric system to each device must be sized large enough toKVA to deliver both the KW and KVAR.
The Cause of Low Power Factor
Power factor is low and electric transmission efficiency iscorrespondingly low when there is a relatively high ratio ofmagnetizing (imaginary) power to real power. How does thiscome about?
The equipment which uses imaginary power and whichcontributes to low power factor are the devices which dependupon magnetic fields for their operation. Transformers,induction motors, welders, induction furnaces and uncorrectedfluorescent lamp ballasts all contribute to poor power factor. Ifyou have a relatively high proportion of your total powerrequirement made up of these devices you will have a lowoverall power factor. But this problem can be furtherexaggerated. The magnetizing current for any magnetic device isnearly independent of real power output from no-load to fullload. Therefore, the relative imaginary power requirement of amotor, that is its power factor contribution, depends upon theamount of load carried. Lightly loaded motors have a lowpower factor and the power factor improves as the load on themotor increases. A typical induction motor running at 1/8 offull load will have a 40 percent power factor and will bedrawing more than twice as much imaginary current as realcurrent. At 7/8 of full load the power factor will have increasedto its peak, say 87 percent. To reach this power factorimprovement the real current has increased roughlyproportional to load, say seven times, while the imaginarycurrent has less than doubled. This situation is repeated for allthe magnetic devices on a system. Therefore, one method of
12

avoiding a poor power factor is to buy and operate yourequipment as close as possible to its design level. Do not have anunnecessarily oversized system.
The Effects of Poor Power Factor
A low or badly lagging power factor has some verynoticeable ill effects on system operation in addition to theeconomic losses which are incurred in high power bills andexcessive capital costs. The most serious effect is low voltage.Low voltage is reflected in reduced light output and reducedheat from resistance devices. Electric induction motors runhotter because of higher current requirements and motor torqueis reduced.
Power Factor Improvement
How can you improve an existing power factor problem?
Power factor improvement comes about by reducing oreliminating the flow of imaginary power through theconductors and transformers of your system. The capacity todeliver power KW's to the loads is limited in conductors andtransformers by the total amperes or KVA required. If weeliminate the imaginary power flow and improve the powerfactor by 20 points say from 80 to 100 percent we increase thepower delivering capability and the system efficiency by 25percent.
This is possible only if we are not required to buy theimaginary power from the utility and deliver it through thedistribution system to each magnetic device.
Consequently, if we can inject the imaginary powerrequirements of the magnetic devices into the system at thepoint where they are required we relieve the rest of the systemof the need to deliver them. This would be comparable toinstalling a small generating unit adjacent to each load andthereby relieving the circuit conductors of the need to deliverthe necessary current.
Local generators would, in fact, be an entirely satisfactorymethod of improving system power factor. Generators produce
13
.16

the imaginary poWer required by magnetic devices as well as thereal power.
The ability to generate imaginary power is a characteristicof two other electrical devices; the synchronous motor and thestatic capacitor. These devices produce leading reactive powernaturally and when a device of this type is placed electricallyadjacent to a magnetic device which requires lagging reactivepower there is an interchange of reactive power between them.If the devices are properly sized, the electric circuit looking atthem sees no net reactive power requirement. On the vectorpower triangle we looked at earlier, this is equivalent to addinganother imaginary power vector equal in length and in theopposite direction downward to cancel out the original reactivepower vector. Then as you see, the KVA will fall down uponthe KW vector and their ratio will be 100%.
Large sized synchronous motors can provide dual service,meeting a power requirement and in addition generating extrareactive power to improve the power factor of the circuitserving other inductive loads. The ability to use synchronousmotors in this way is limited by economics. In general,synchronous motors in small sizes are substantially moreexpensive than a comparable induction motor plus a capacitorbank to provide the equivalent high power factor. When motorsizes reach 300 HP the synchronous motor should never beoverlooked in preliminary planning.
The other natural generator of reactive power, thecapacitor, is the most widely used method of improving powerfactor. Simple, reliable and relatively inexpensive, with nomoving parts and using no real power, the capacitor is an idealcircuit element.
Description of Capacitors
The power factor correcting capacitor is a large scale, highpower model of the capacitors we are used to seeing in radioapplications. A capacitor consists df two parallel metal plates oflarge area separated by insulation and sealed within a tank-likecontainer. In manufacturing you would find two long strips ofconducting foil separated by a plastic sheet and rolled intocylinder form.
rt 14

Most of you are probably familiar with capacitors and I'msure all of you have seen power factor capacitors perhapswithout noticing them, mounted in clusters on utility poles insuburban and rural areas. Commonly the individual capacitorunit is a tank about the size and shape of a brief case standingon end with two insulating posts projecting for connections onthe top. These units are normally seen in clusters of three to 15cans in a rack mounted configuration.
For indoor installations the same tank units are built into astandard switchgear enclosure or rack mounted with a sheetmetal box enclosing the terminal bushings.
Capacitors for power factor improvement may be thoughtof as normal electric devices and connected to the electricsystem in almost exactly the manner that any electric load suchas a motor or lighting fixture is connected. As an example, ifyou wished to correct the power factor of a portable electricmotor which was plugged into one side of a duplex receptacle itwould be entirely reasonable and good location practice toprovide a capacitor unit with a plug and cord and plug it intothe other side of the receptacle.
In practice of course, the capacitor installation ispermanently mounted like a piece of switchgear and connectedto the electric system at a substation bus by a breaker orcon tactor.
Capacitor Ratings
Thinking of the capacitor basically as a load device issupported by the fact that capacitors are normally rated inKVA reactive or simply KVAX to differentiate leading powerfrom KVAR which is used to identify lagging power.
Capacitors are technically rated in microfarads but in themanufacturers specifications for engineering use, the units arerated in the more realistic terms of system voltage and KVAC.
15
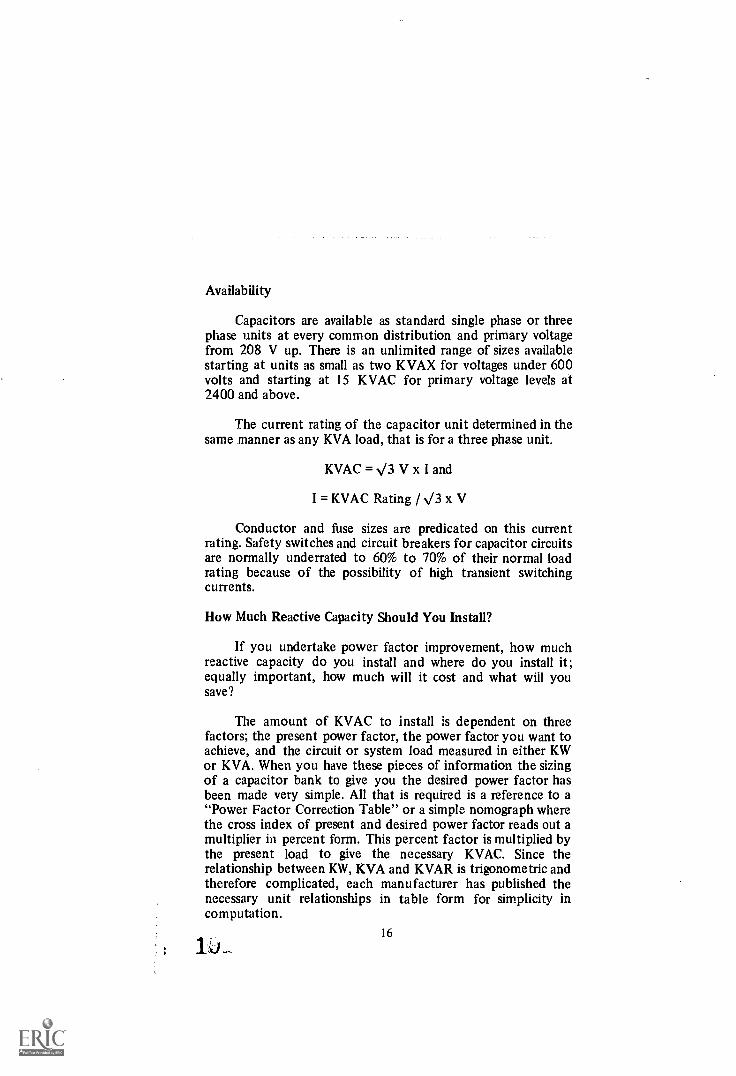
Availability
Capacitors are available as standard single phase or threephase units at every common distribution and primary voltagefrom 208 V up. There is an unlimited range of sizes availablestarting at units as small as two KVAX for voltages under 600volts and starting at 15 KVAC for primary voltage levels at2400 and above.
The current rating of the capacitor unit determined in thesame manner as any KVA load, that is for a three phase unit.
KVAC = N/3 V x I and
I = KVAC Rating / N/3 x V
Conductor and fuse sizes are predicated on this currentrating. Safety switches and circuit breakers for capacitor circuitsare normally underrated to 60% to 70% of their normal loadrating because of the possibility of high transient switchingcurrents.
How Much Reactive Capacity Should You Install?
If you undertake power factor improvement, how muchreactive capacity do you install and where do you install it;equally important, how much will it cost and what will yousave?
The amount of KVAC to install is dependent on threefactors; the present power factor, the power factor you want toachieve, and the circuit or system load measured in either KWor KVA. When you have these pieces of information the sizingof a capacitor bank to give you the desired power factor hasbeen made very simple. All that is required is a reference to a"Power Factor Correction Table" or a simple nomograph wherethe cross index of present and desired power factor reads out amultiplier in percent form. This percent factor is multiplied bythe present load to give the necessary KVAC. Since therelationship between KW, KVA and KVAR is trigonometric andtherefore complicated, each manufacturer has published thenecessary unit relationships in table form for simplicity incomputation.
16
Of the three input factors need- Al for this decision,twothe present power factor and the present load are knownor can be determined easily by metering. The third item, desiredpower factor, is somewhat deceptive. What level of final powerfactor do you want: 85%, 95%, unity (100%)?
If for billing purposes your electric rate gives you a powerfactor target of say 85% or 95%, this is what you want as aminimum. It is usually desirable when you are correcting powerfactor to go to a higher power factor than your minimum level.This is suggested for two reasons;
First, the incremental cost of capacitors is very low. Theunit cost to add one more KVAC to an existing bank ofcapacitors is usually less than half of the average cost installed.This is true because the fixed costs of switching and mountingstructures in a capacitor bank are major cost items.
Second, normal load growth results in a falling powerfactor. If you correct power factor to the minimum this year,next year, with normal load growth, your power factor willhave declined and you will again be deficient and faced with thesame correction problem at higher cost.
This philosophy says reach out for a good improvementwith some cushion above the minimum. How high should yougo? You are limited on the upper end of correction by theeffectiveness of added KVAC. As shown in Figure [3), thecorrective ability of a KVAC decreases rapidly as you approachunity power factor. Thus, you are faced with the law ofdiminishing returns on your investment if you try to correct tomuch over 95% to 97%.
For a rule-of-thumb, which is supported by many studies,plan to correct to 97% or more, regardless of your purpose.
And Where Should You Install It?
After you have estimated the total amount of reactivecapacity in KVAC, which can be utilized on your system, youcan consider the problem of where io locate this amount ofKVAC. Will you install it in ona large block or in several small
17
2Q

blocks? At what voltage should the installations be made if youhave a choice?
by
z 10042o.4 90
ow 800cn 70
ct< 60
x 50
0 40-J-J
coP- 30z0
20
.0I-- 1 0z0W 0
If your major incentive is to reduce your power bill, eithermeeting a utility standard or by reducing your billing
2.A
70 75 80 85 90 95PERCENT POWER FACTOR
FIGURE 3
18
100

demand, you should be looking at large blocks of capacitors, atthe highest voltage you own and as close to the utilities meterpoint as you can get. If on the other hand your major concern isdistribution efficiency, delay of new investment in transformersor feeders or improved voltage regulation, you should belooking at smaller units at lower voltages located at theextremities of your system.
To illustrate these extremes, consider the simplifiedone-line diagram in Figure [4,] which looks something like atree. For purchase power economies add large capacitors at theroots or on the trunk of the tree, points 1, 2, or possibly 3: fordistribution economies add several smaller capacitors at thebranches or at the leaves, points 3, 4, or 5.
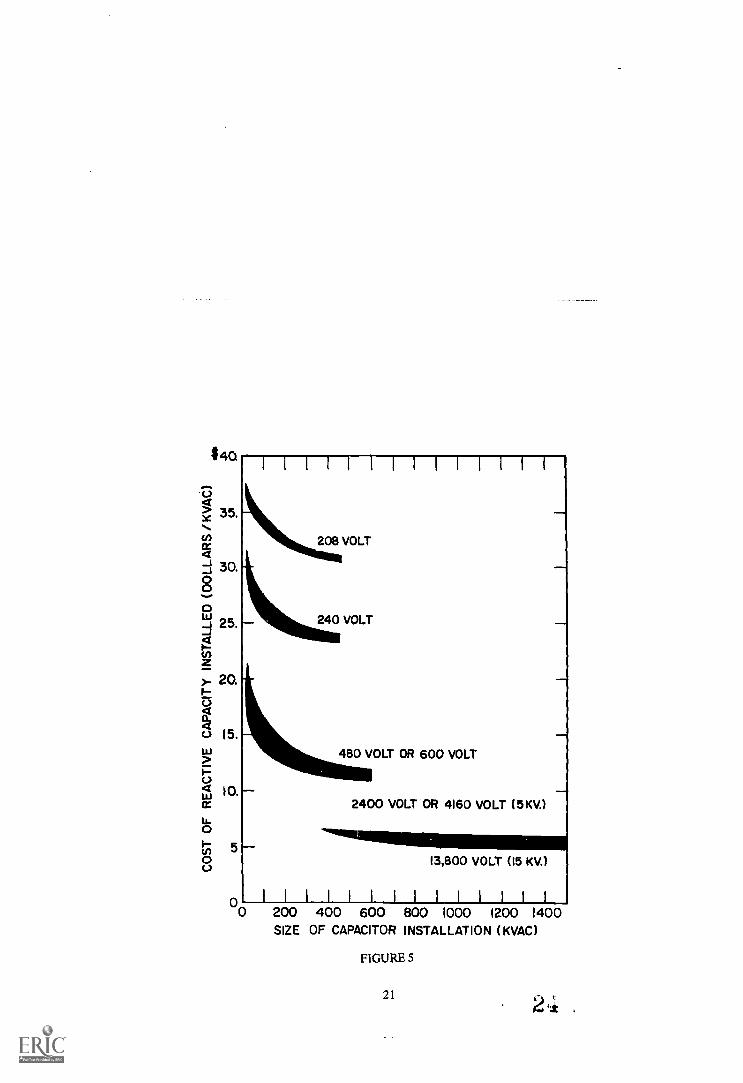
We can simplify the question of unit size and location inthis manner because the cost of capacitor units follows a verypredictable pattern. Large blocks of capacity operating, at highvoltages are cheap and small blocks of capacity operating at lowvoltages are expensive. Figure [5] demonstrates theseconditions graphically. Large blocks are cheap because of thelow incremental cost of the actual capacitor units. High voltagesare cheap because capacitor efficiency increases as the square ofthe voltage.
Since your potential savings are usually fixed once youdecided on the total amount of KVAC you plan to add, yourover-all economic incentive depends on how cheaply you canadd the KVAC. To maximize benefits, climb down the tree asfar as you can.
Power Factor Improvement at MIT.
To illustrate some of these principles in practice, let meuse some examples of power factor correction at M.I.T. To putour personal problems in context I will briefly outline theM.I.T. power supply and distribution system as it stands today.
19

5MOTORBRANCHCIRCUIT
1
PR I MARYSERVICE
BUS
T
MOTORCONTROLCENTER
BUS
PRIMARYSECTIONALIZING
BUS
e.2
POWER COMPANY
FIGURE 4
20
li3
SECONDARYSUBSTATION
BUS
$40
c)
1>i 35.
cr
30.000Lj 25.
}20o-r)tit
15.
rizi 10.a
0I-- 50
00
1 1 1 1 1 1 1 1 1 1 1 1 1
208 VOLT
240 VOLT
480 VOLT OR 600 VOLT
2400 VOLT OR 4160 VOLT (5KV.)
13,800 VOLT (15 KV.)
200 400 600 800 1000 1200 1400SIZE OF CAPACITOR INSTALLATION (KVAC)
FIGURE 5
21

We have a central urban campus in the shape of a broadtriangle which comprises most of our teaching, research anddorm facilities. All the buildings on the main campus areinterconnected by a 13.8 KV selective primary loopunderground distribution system anchored at three servicepoints within the campus. Figure [6] One station is located atthe middle apex and two other stations at points close to theother ends of the triangle. The original portions of the campus,now a small fraction of our load, are interconnected at 2,300volts. The balance, the major portion, is operating at 13,800volts. We have connected on the 13,800 volt system 55individual substations serving buildings on the campus atsecondary voltage. All of our power is purchased and we takedelivery at the three bulk delivery service substations. Theutility feeds each of these substations with two 13,800 voltfeeders. Our maximum demand for our main campus load istotalized for three separate services. The maximum load in 1968was 16,000 KVA and our annual use was 85,000,000 kwh. Ournormal uncorrected power factor is 86%.
Al I. T. SUBSTATION NQ 2
EE Ea 11:12
MAT. SUBSTATION Na MIT. SUBSTATION NO3
ESR1i1O o-7 7
M
W452300 VOLT
SYSTEM
000Q 42B
CD
MASS. INSTITUTE OF TECHNOLOGY
I3B KV PRIMARY DISTRIBUTION SYSTEM
0
FIGURE 6
22
In addition to the central contiguous campus system, weare responsible for electric service to some 30 additionalbuildings close to the central campus which are notinterconnected and are separately served by our utility. Theseloads, range up to 1,000 KVA in individual size and account foranother 7,000 KVA of demand and 30,000,000 kwh in annualuse. Many of these loads, former industrial properties, haveuncorrected power factors between 80 and 90 percent. Theseseparate locations are normally served at primary voltage if theyare large enough to qualify; otherwise at the available secondarylevel.
In our "Large General" and "Primary Light and Power"rates from the utility we have a well defined economic incentivefor power factor improvement. We pay for power on a two-partdemand and energy rate with a long-hour use provision. Ourbilling demand is computed on a KVA basis. As a consequence,it is fairly easy for us to estimate the savings in the monthlypower bill which will result from any power factor correction.On the main campus rate for example, for each KVA we reduceour demand, our demand charge pays us $1.22 per month or$14.65 per year. On the smaller, individual services off-campus,our savings run as high as from $1.56 per KVA per month forsome services to $2.10 per KVA per month or $25.20 per yearfor smaller loads with service at secondary voltage. When wecompare these potential savings with the per unit cost ofcapacitors, roughly $10 to $20 per KVAC, it is fairly easy tojustify even a substantial capital outlay with a short pay-offperiod. Referring back to Figure [3] which showed the KVAreduction per KVAC added, we note that the "effectiveness"drops off rapidly as the initial power factor increases over 90%.This "effectiveness ratio" multiplier must be used to discountthe savings for comparison with the cost of capacitors.
Examples of Capacitor Installations
To give some practical examples of the form that powerfactor correction can take, I have prepared capsule descriptionsof four of our installations. The first three installations are atlow voltage, at 480 volts or 550 volts. The final example is ourmost recent and ambitious installations at 13,800 volts.
23

While our incentive for power factor improvement isgenerally for lower billing, we have recently installed a capacitorbank at a separately served buildinga converted industrialproperty off-campus, which is a classic example of releasedcapacity. It happened this way. When we took over thisproperty it had a 1,000 KVA transformer substation and an 800KVA load. Over a three year period we progressively occupiedand upgraded the building substantially. The maximum demandon the substation gradually grew in this three year period to a1,245 KVA summer peak and showed signs of increasing stillfurther beyond safe limits. This condition was coupled with alow power factor averaging 80 percent. We were faced with anexpensive step-up in transformer capacity.
We found that by adding enough capacitors on thetransformer secondary side to raise the power factor to aneconomic level, purchase power wise, that the KVA peak loaddropped from the excessive levels of 1,245 KVA in 1967 to asafe level of 960 KVA with added capacity for growth in 1968.To reach this condition we added a 450 KVAC bank at 550volts.
By extending the substation pad slightly and utilizing aspare breaker position to tie the bank to the secondary bus, weadded this equipment at a cost of $4,600. This unit has reducedour power bill by $3,025 in the first 9 months of its operationand we see a payoff period on our investment of 14 monthsfrom billing alone. Of course we also have avoided a newtransformer and substation installation which saved us over$10,000 immediately. This savings alone exceeded the cost ofthe units twice over.
Low voltage capacitor units are very compact and easy tofit into existing electrical equipment space. This isdemonstrated by the next two examples.
Another low voltage capacitor bank, a minimum typeinstallation also in an off-campus building was installed in 1961.In this installation, a 80 KVAC unit corrected an 80% powerfactor condition to 97% on a 200 KVA load. This unit at anoriginal cost of $1,200 in 1961 has been saving us billing of$960 per year for seven years.

As a third example of power factor correction added atsecondary voltage, we have made a similar installation this yearin a converted semi-industrial building. This compact unit of150 KVAC at 550 volts is installed to improve power factor ona load of 400 KVA at a saving of $1,120 per year. Total cost ofthe installation was about $1,700.
Note that the capacitor is not as large as breaker panel.These units have illustrated the technique of correcting powerfactor at the secondary voltage level. This type of power factorimprovement is very beneficial for the entire electric systemsince it covers all of the desirable features of power factorimprovement. It frees capacity, improves voltage, and results inpurchase power saving. It doesn't, however, maximize savings.These units we have seen cost an average of $12 to $20 perKVAC, depending on voltage and size, and yet they each reducebilling at the rate of roughly $10 per KVAC per year. Byinspection of the unit cost chart we see that we can buy thisequivalent reactive capacity for less than $10 per KVAC andachieve the same savings if we install the units at primaryvoltage, 2,300 or 13,800 volts.
This conclusion led us to the consideration of large bulkcapacitor installations. In past years we tended to look at thepower factor problem on an individual building or substationbasis. If we planned to upgrade the power supply to a buildingor add a substation we would check the local power factor and,if indicated, we would add a power factor correcting bank withthe installation.
This past year we faced the power factor problem on asystem wide basis. Our studies of loads, locations and savingsrelationships convinced us that in our position we wouldmaximize our benefits on our campus system by installing oursystem power factor improvement in large blocks, at primaryvoltage, the cheapest possible installation. As a result we haveinstalled two large indoor metal enclosed capacitor banks onour side of the metering equipment at two of our substation tiesto the utility. We have under construction a unit for the thirdstation and it will be in service within two months.
2523.

With our primary sectionalizing equipment we provide adual feed to each of our 55 individual substations. We can selectthe active feeder to each substation from any one of the threebulk substations by use of the eight primary loop feeders. Thisconfiguration made it desirable for us to go to capacitorlocations close to the delivery points because we cannotguarantee that any one location we might choose out on thesystem will always be at the end of a feeder.
Since our load is fairly well balanced between our threedelivery points under normal conditions, we have settled on atypical capacitor bank design for each of the three bulk units.We have installed a specially designed package unit of 2,250KVAC initial capacity with an add-on feature to an ultimatecapacity of 3,600 KVAR per unit. We intend to increase thecapacity of each unit in increments of 450 KVAC as our loadincreases and on this basis to keep our power factor close tounity. The incremental cost of capacitors at the 13,800 voltlevel is less than $2.00 per KVAC and even at 99% power factoreach KVAC we add will save us $1.50 per year.
Each of the three bulk capacitor banks has a designpayback period of 22 months. They will do somewhat betterthan this in practice because our system load continues to growat a 10 percent annual rate and this growth amplifies oursavings.
We e.xpect that these banks will carry our power factorimprovement needs on the main campus for at least six yearsbased on our current growth projections. Before these units areused to capacity, load growth and feeder capacities may forceus to turn to the dispersal method of adding our additionalcapacitor needs. Also, we intend to look more carefully atsynchronous motors for large power needs and capacitorsdirectly Et the motor for our intermediate size motor needs.
26
A DIFFERENT APPROACH TOPARKING STRUCTURE CONSTRUCTION
WALTER W. WADE
Walter W. Wade is a 1941 engineering graduate of Purdue University. Afterfour and one-half years service in the Navy as an engineering officer, and abrief period of employment with Commonwealth Edison Company, hejoined the staff of the Construction Division of the Physical PlantDepartment of Purdue University in 1946. His current title is Director ofPhysical Plant. During his period of service at Purdue, over $200,000,000of new construction contracts have been completed at Purdue's fivecampuses.
Through a combination of circumstances, a parkingstructure construction procedure evolved at Purdue whichmight be of use to other universities as well as others in need ofparking structures. The major advantage of the procedure is thatthe buyer is able to select the design he prefers at a knownprice. In Purdue's case we were able to select an economical,low maintenance structure designed to our programrequirements by a specialist in parking structure design.
The procedure is quite simple, yet there are certain pitfallsto be avoided.
The procedure is as follows:
1. Performance specifications are prepared.2. The project is advertised for bids.
2?

3. Bids are received from designer-builder teams.4. The Owner selects the most advantageous design at a
known bid price and awards the contract.5. The designer submits working drawings as shop
drawings for the Owner's approval.6. Construction proceeds with inspection of the work a
joint responsibility of the Owner and designer.7. Final acceptance procedures are those of normal
construction practices.
Having outlined the total procedure, I will go into moredetail as to how each item has been handled at Purdue andpitfalls that may be encountered.
The preparation of performance specifications must bedone in detail by qualified personnel, in that, having describedwhat is acceptable to you, the designers will provide a designjust meeting your minimum requirements. For the designer toprovide more than the minimum requirements will insure thathis team is not the low bidder for the particular materialcombination used in his design.
Fortunately, our personnel in our Planning andEngineering Section have the necessary qualifications.Undoubtedly many other universities have such qualifiedpersonnel also.
Our specifications were quite detailed and contained thenormal "front end" as well as the design requirements. Theindex was as follows:
Advertisement for BidsWage RatesInstructions to BiddersCombination Bid Bond and Bond for ConstructionPrincipal Subcontractor QuestionnaireSubcontractor and Material QuestionnaireProposed Design and Construction Progress ScheduleSupplemental Bid FormAlternate Proposals
General Conditions
28

Special ConditionsScope of ProjectThe SiteDesign RequirementsField Log for Soil Boring
Each university undoubtedly has a "front end" to itsspecifications that is designed to meet its own particular needs.Therefore, I will not dwell in any detail on that part of ourspecifications.
We included a section on alternate proposals to permit thedesigner to propose alternative solutions of accomplishing anyphase of the work which he felt might be to the Owner'sadvantage. Examples of the kind of items a designer-builderteam might submit alternate proposals on are:
(1) Cor-Ten steel structure in place of painted steelstructure.
(2) An alternate facade treatment in place of theproposed with the base bid.
(3) An alternate safety barrier assembly.(4) An alternate drainage or water proofing method.(5) An alternate stair style or construction.
Our general conditions were the same general conditions asused on all Purdue work. Our section headings are:
(1) Definitions(2) Intent of the Contract Documents(3) The Architect and the Superintendent(4) Construction Progress Schedule(5) Materials, Workmanship and Equipment(6) Specifications and Drawings(7) Changes in the Work(8) Access to Work and Correction of Work(9) Correction of Work
(10) Payments to Contractor(11) Insurance(12) Owner's Right to Let Other Contracts(13) Contractor's Superintendent and Supervision(14) Subcontractors and Manufacturers
29
3 2,

(15) Protection of Work and Property(16) Contractor's Guarantees(17) The Owner's Right to do Work(18) Owner's Right to Terminate Contract(19) Assignment(20) Waiver(21) Cash Allowances(22) Permits and Regulations(23) Codes and Ordinances(24) Royalties and Patents(25) Use of Premises(26) Cleaning Up(27) Cutting, Patching and Digging(28) Gross Income TaxNon-Resident Contractors(29) Nondiscrimination Provisions(30) Open Competition
Special general conditions are needed to fit therequirements of a particular site and project. The headings usedin our special general conditions were:
Additional DefinitionsTests and Inspection of MaterialsDelivery and Storage of MaterialsManufacturer's Instructions or SpecificationsGeneral Conditions of the Contract (Revisions)Indiana Sales and Use TaxTime of CompletionLiquidated DamagesOwner's Use or OccupancyCooperation of ContractorsParking RegulationsMaintaining TrafficTemporary OfficesSanitary ConveniencesLocations and GradesProtecting Public
In the Scope of the Project we covered the preliminarydesign submittal; the working drawings and specifications to besubmitted if awarded a contract; demolition; State and Owner'sapprovals required; permits; quality of construction; shop
30
33

drawing approval; field inspection; progress zhedule; "As-BuiltDrawings"; quality standards; and Owner's evaluation of allbids.
To permit the Owner to select the solution best meetinghis requirements, he must not be forced to 'accept the low dollarbid. In this portion of the specifications we informed thedesign-builder team that we would evaluate all bids on the basisof (1) economy, (2) traffic flow, (3) structure, (4) aesthetics,both exterior and interior, (5) and maintenance. We did notindicate what weight we would assign to each item.
This award evaluation section is one which reaps thegreatest benefits to the Owner but also creates some of hispost-award headaches. Each designer and material supplier ofcourse considers his design and material the best. Once youselect a design and its associated materials, you are open tocriticism for having chosen what you selected.
To adequately explain to your governing board why yourecommend a particular design, it is necessary to make adetailed comparison of all bids submitted. When this is done,some bids are eliminated because of poor traffic patterns; othersbecause of first cost; others because of high maintenance cost.This same detailed comparison will be of value in explaining tobidders why their bid was not selected. To a limited extent, itwill also be of use in placating unsuccessful material suppliers.
A site plan and description needs to be supplied to thebidding team for their use in preparing a design and bid. Ourscovered the following items concerning the site: size, grades,adjacent streets and alleys, points of ingress and egress to theparking structure, existing utilities, sidewalks, curbs and gutters,protection of adjacent property, storage area, set-backs,demolitiln and soil boring, plot plan and log.
Finally, we get to the Design Requirements of the parkingstructure. Our paragraph headings (capitalized) and subheadingswere:
General DescriptionBuilding Code
31

Usage, primary, secondaryCapacityTraffic Flow: entrance, exit one way traffic, pedestriantraffic, parking spaces, vertical clearance, slant parking,module width, ramp slopes, buried spaces, ramp widths,turning radii, curbs and dividers and crossover lanes.Type of Structure: footings, framework, structural steel,reinforced concrete, concrete decks, safety barriers, liveloads, finishes, codes and concrete requirements.Drainage and WaterproofingStairways: treads and risers, non-slip nosing, handrails,enclosure and fire extinguishers.Striping and Marking: parking spaces and warning signsExterior TreatmentExcavation, Back fill and GradingConcrete PavingSidewalks, Curbs and GuttersStandpipesElectrical System: lighting fixtures and light levels,convenience outlets, distribution system, exit light systemand fire alarm system.
Although the above list is long, subheadings were omittedin some instances where none are listed.
The advertisement for bids is the normal one we use withthe exception that sufficient time must be allowed for thedesigners, builders, and material suppliers to form "teams" tobid upon the work. In my opinion a minimum of two monthsshould be allowed from the time of advertising and the r-zceiptof bids.
Bids should be received at least two weeks beforepresenting your recommendation to your governing board toallow sufficient time for analysis and comparison of the designsand bids.
Following the above procedures, we received eight bidswhich are summarized below:
32

Bid Infonation Features of Design
Rid No. 1Base Bid: $580,000 Short span steel framework(390 car garage complete) with reinforced concrete$1488/space; $5 .09/sq.ft. decks. Interlocking helix
w/900 parking, 9' stalls,one-way traffic, 60' modulewidth, 4 stories high, 4%crown ramp (w/2.5% slope inparking spaces).
Bid No. 2Base Bid: $622,000 Long span steel framework(391 car garage complete) with reinforced concrete$1592/space; $5. l 0/sq.ft. decks. Interlocking helix
w/700 slant parking, 9' stalls,one-way traffic, 55' modulewidth, 4 stories high, 4%crowned ramp (w/2.5% slopein parking spaces).
Bid No. 3Base Bid: $640,000 Long span post-tensioned(391 car garage complete) concrete w/ post-tensioned$1638/space; $5.29/sq.ft. concrete decks. Interlocking
helix w/700 slant parking, 9'stalls, one-way traffic 55'module width, 4 stories high,4% crowned ramp (w/2.5%slope in parking spaces).
Bid No. 4Base Bid: $660,000 Long span precast (double tee)(391 car garage complete) concrete w/3" reinforced$1690/space; $5.45/sq.ft. topping deck. Interlocking
helix w/700 slant parking, 9'stalls, one-way traffic, 55'module width, 4 stories high,4% crowned ramp (w/2.5%slope in parking spaces).
Bid No. 5Base Bid: $680,000 Long span precast (single tee)(391 car gargage complete) concrete w/3" reinforced$1740/space; $5.61 /sq.ft. topping deck. Interlocking
33

helix w/700 slant parking, 9'stalls, one-way traffic, 55'module width, 4 stories high,4% crowned ramp (w/2.5%slope in parking spaces).
Bid No. 6Base Bid: $772,730 Long span precast concrete(424 car garage complete) w/3" post-tensioned deck over$1824/space; $5.68/sq.ft. 9' tees at 9' o.c. Ramped
floors (full length) w/900parking, 9' stalls, two-waytraffic 62' module width, 4stories high, 2.5% ramp slopethroughout.
Bid No. 7Base Bid: $914,576 Long span precast concrete(422 car garage complete) framework w/post-tensioned$2170/space; $6.50/sq.ft. concrete decks. Interlocking
helix w/900 parking, 9' stalls,one-way traffic, 60' modulewidth, 4 stories high, 3.73%crowned ramp (w/2.5% slopein parking spaces) and a 8.3%slope crossover ramps at ends.
Bid No. 8Base Bid: $997,457 Long span steel framework(417 car garage complete) w/reinforced concrete decks.$2390/space; $6.50/sq.ft. Interlocking helix w/600 slant
parking, 9' stalls, one-waytraffic, 55' module width, 5stories, 4% crowned ramp(w/2.5% slope in parkingspaces).
We selected Bid No. 3 on the basis of good traffic flow,low maintenance cost and reasonably low first cost. Havingmade the selection of poured in place post-tensioned concrete, Iam no longer as well thought of by structural steel and precastconcrete suppliers as I once was.
34

Once the award is made, another delay period occursduring which the working drawings are prepared by the designerand submitted as shop drawings to the Owner for approval. Aspart of our requirements, we require the designer to obtain thenecessary approvals from the various State agencies.
Once the working drawings are approved, constructionproceeds with the designer now a member of a second team. Henow joins forces with the Owner to inspect to see that hisdesign is carried out. At Purdue we provide the day to dayinspection with the designer visiting the job on a weekly basisfor progress review and necessary interpretation of his plans andspecifications.
I have gone into some detail in listing the points covered inour performance specifications in that the design will beresponsive first to what you require, and secondly to thedesigner's thoughts. To permit the designer as much freedom asis possible to utilize his own talents, the performancespecifications should concentrate on results desired and not onhow these results are to be achieved.
Having gone through this procedure on one parkingstructure, I feel we have discovered a procedure that will bringus the latest thinking in design concepts and material utilizationas future parking structures are built. As evidence of this, I wasvisited by representatives of one of the major steelmanufacturers subsequent to our awarding our contract. Theirpurpose in visiting us was to have their design criticized so thatflaws in it could be eliminated in future work.
With designers, builders and material suppliers workingtogether to achieve the most economical, functional,maintenance-free design, I feel certain that lower cost per spacestructures will be available to Owners who follov, this suggestedprocedure.
35

WALK-THROUGH STEAM TUNNELSAT
MICHIGAN STATE UNIVERSITY
RONALD T. FLINNand
JESSE M. CAMPBELL
Jesse M. Campbell is now employed as a Consultant to the Utility ServicesDepartment at the Physical Plant DivisionMichigan State University. Hewas formerly Supe.intendent of Power Plants, preceded by a full timeteaching assignment as Professor of Mechanical Engineering. He has a B.S.degree in Mechanical Engineering from Mississippi State University and anM.S. degree from the University of Minnesota. He is a member of theAmerican Society of Mechanical Engineers (A.S.M.E.) and the AmericanSociety of Electrical Engineers (A.S.E.E.), and has been active in otherorganizations.
Ronald T. Flinn is currently Associate Director of Physical Plant Divisionat Michigan State University, and has charge of engineering planning,construction and all technical services related to Physical Plant activities.He is a Registered Professional Engineer, has a B.S. degree in CivilEngineering from Michigan State University, and an A.A.S. (Associates ofApplied Science) degree from Erie County Technical Institute in Buffalo,New York. Mr. Flinn is active in professional organizations and numerouscommunity activities.
37 3J

Introduction
Michigan State University has 34.4 miles of steam andcondensate return pipes and this system includes 5.0 miles ofwalk-through steam tunnels. Prior to 1939, steam tunnels wereconstructed; from that time until 1960, all construction ofsteam distribution was of the direct burial type. Since 1960, 3.3miles of steam tunnels have been built.
The older section of steam tunnels carries 90 psi and 5 psisteam mains and vacuum condensate return mains, while thenew section carries 90 psi steam mains and 25 psi condensatereturn mains.
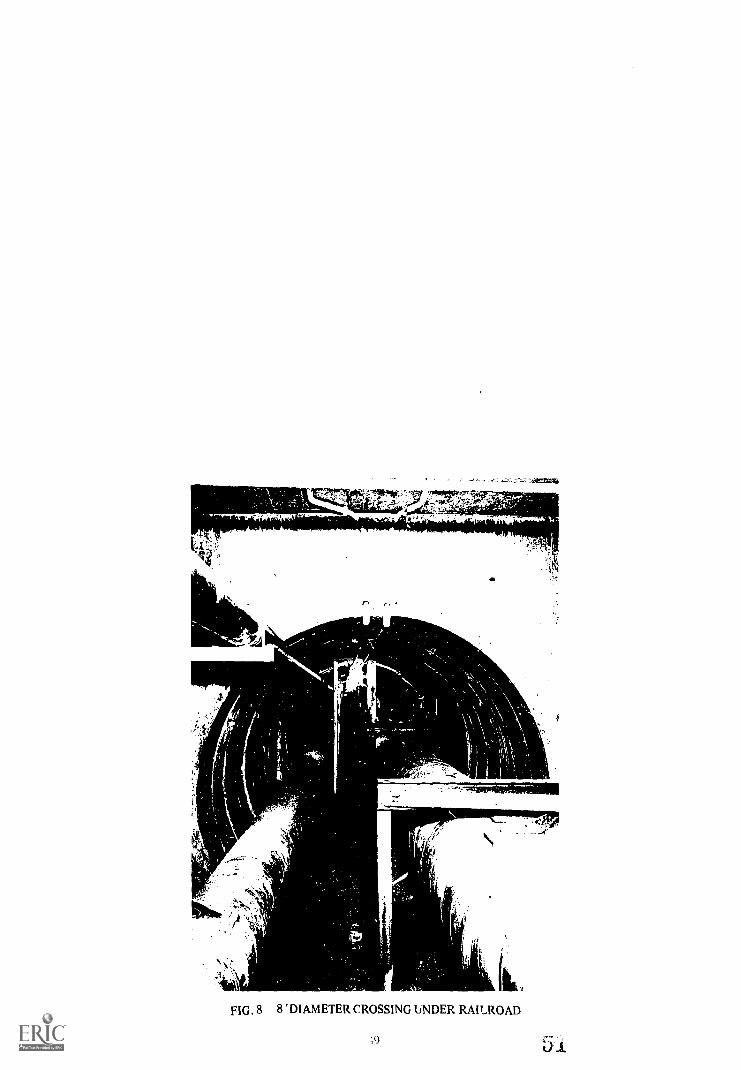
The tunnels carry steam pipes varying from 2-1/2" to 30"diameter and accompanying condensate return lines vary in sizefrom 1" to 18" diameter. The steam tunnels have reserve spacefor future pipes and in certain areas, parallel steam mains havebeen installed to provide additional capacity for reliability.Chilled water pipes have been installed to air condition onebuilding from machinery installed in another. Figure [ 1
displays the campus steam distribution system.
Construction
The steam tunnels have been constructed with variouswidths and heights, but the most common have insidedimensions of 6'9" width and 6'2" height. The tunnel structureis constructed in three steps: 1. floor slab; 2. wall erection; 3.roof slab. The pipe is normally placed in the tunnel betweenstep 2 and 3. Inserts and anchors are placed in the form work,before the concrete placement. The steam tunnels are built insections with lengths no longer than 40 feet; thus, the tunnel isessentially a group of concrete boxes, 40 feet long. Theplacement of a vinyl water stop between each section of tunnelallows for slight linear expansion and contraction. Steam vaultsare placed at interconnection points in the piping, andespecially at expansion joint locations. Each steam vault has aminimum of two access and ventilation manholes. The concretetunnel and vaults receive a two-ply felt and pitch waterproofingcoat.
40 38

The lowest pipes in the tunnels are supported with pipesaddles and rollers placed on concrete pads. The spacing ofthese supports is dictated by pipe size, but it is normally 15 to20 feet. Good results have been obtained by using galvanizedmetal strut inserts in the walls and the support pads. Thesupport rollers are bolted to the strut cast in the support padand the wall strut, which extends from floor to ceiling, is usedto support future pipe. The wall strut is also employed toreceive rollers at guide locations. Anchors in the tunnel sectionusually consist of three structural steel channels cast in theconcrete tunnel wall. Anchors within steam vaults employ avertical structural steel column or columns. Pipe guides have astructural steel column next to the walkway to provideresistance to pipe movement in that direction. The anchors andguides are, therefore, capable of receiving future pipe locatedabove the first pipe installed. All steel, in contact with the floor,is encased in concrete for corrosion protection.
The packed slip sleeve type of expansion joint has been themost widely used. Maintenance on these joints require ease ofaccessibility and occasionally require additional manholes orladders to allow the men to get to the side of the expansionjoint opposite the walkway. See Figures [2 and 3] for typicaldetails of tunnels and piping arrangements.
The steam tunnels have 100 watt electric light bulbs placed25' apart. Main tunnel runs are switched from a master panel inone of the power plants. Branch tunnels have two-way switchesto control lights.
Operation
Steam tunnels provide an unexpected problem of security,especially with an inquisitive university community. Sincesafety of maintenance personnel is a foremost thought, it wasnecessary to develop a system of control which would allow therapid exit of maintenance personnel in case of emergency, butwould also prevent entry by unauthorized personnel. Thesolution was to chain down each manhole cover with a quickrelease load binding device and to have doors at buildingsunlocked on the tunnel side. This requires very close securitycontrol, whenever construction requires an opening into the
39
4

existing tunnel system. A steel bulkhead, with a locked doorerected in the tunnel, has been the best solution. During thesummer, the temperature in the steam vaults can become quitehigh and a cooling fan greatly aids the maintenance men inperforming their work. A gasoline driven mobile fan isillustrated in Figure [4] and has been very successful. In steamtunnels, the men usually drape tarpaulins over the tunnelopening to force the cool air down through the manholeopposite the manhole on which the fan is setting. The fan hasbeen extremely beneficial, when a steam leak has developed.The fan is capable of exhausting enough air to clear a vault ofsteam when a 3/4" nipple on a 90 psi steam line has broken,and allow maintenance men to enter safely.
Steam tunnels are susceptible to flood therefore adequatefloor drainage is essential; occasionally, this requires theinstallation of sump pumps.
Economics
From the historical sketch presented in the Introduction,it can be seen that there was a period of time when steamtunnels were considered too expensive at Michigan StateUniversity. When the large expansion began, during the earlysixties, it was necessary to construct steam lines in the 20"diameter class. Estimates of the various types of steam lineconstruction indicated that steam tunnels could beeconomically feasible. At the time, the possibility of extendinga parallel steam main for future capacity could not be ruled out.This eventually would require the installation of a second largediameter steam pipe, initially or in the future, in any buriedtype installation.
The history of direct burial distribution systems revealsfairly frequent failures of condensate return pipes installed ingranular fill insulating materials and failures of asphalt coatedsteel conduits, especially if buried in corrosive soils. The mostrecent direct burial systems used have a steel conduit which iscoated with epoxy resin and fiberglas cloth. Installation ofuninsulated direct burial ductile iron pipe with mechanicaljoints for condensate return lines has been used in recent years.
40
42

The mechanical joints, by not butting the pipe sections tightlytogether, eliminates the need for expansion joints, since themechanical joints will absorb the expansion and contraction. Afailure by corrosion has not been experienced on the ductileiron; however, a time elapse of 10 years is too short to provide adecisive conclusion. Figure [5] displays a graph which comparessteam tunnel cost versus a direct burial system usingepoxy-coated conduits on the steam line, and epoxy-coatedconduit or ductile iron pipe for the return line.
Steam tunnels will allow delaying the installation of thefuture pipes, when needed; whereas, a buried system willrequire their installation during the initial construction, ifeconomy is to be gained for the excavating and backfillingoperation.
Conclusion
Walk-through tunnels are the most maintenance freesystem for steam transmission mains. When long life and lowmaintenance costs are important factors in selecting the type ofpipe encasement, tunnel costs should be closely analyzedagainst costs of alternate systems. The larger the pipe diameter,the more competitive tunnel costs will be as compared toalternate °,-stems.
41 43

Neso...71,,A
TIA
JAI V
TI
PO
WE
RP
LAN
T
Fl G. I
ST
EA
M H
EA
TIN
G D
IST
RIB
UT
ION
SY
ST
EM
41
ob. ND
ST
EA
M T
UN
NE
LS K
IVU
140A
TA
NN
I MA
N T
UN
NE
LS S
INC
E N
INO
- -eIN
AC
ET
SU
MO
ST
EA
M M
AIN
S

TYPICAL VAULTANCHOR CONSTRUCTION
TYPICAL TYPEVAULT ANCHOR
TYPICAL TYPE IVAULT ANCHOR
FIG. 2STEAM TUNNEL
DETAILS
TYPICAL VAULT PLAN
43
SECTION A- A
4

FIG. 3STEAM TUNNEL DETAILS
TYPICAL CROSS SECTIONSAT PIPE SUPPORTS
TYPICAL CROSS SECTIONAT PIPE GUIDES
44
TYPICAL TUNNELANCHOR

FIG. 4 MOBILE TUNNEL EXHAUST FAN
45

a.
30-1
6
24 1
2
20-1
0
16-8
12-6
10-5
8-4
6-3
4-2
FIG
.5
CO
ST
CO
MP
AR
ISO
N O
F E
NC
AS
EM
EN
T S
YS
TE
MS
,//,
; ,..r
,/ , ,,,
,__
-TU
6IN
EL
EP
DX
YF
OR
CO
AT
ED
CO
ND
UIT
ST
EA
M 8
RE
TU
RN
CO
AT
ED
CO
ND
UIT
ST
EA
M 8
DU
CT
ILE
RE
TU
RN
/ /E
PC
AY
FO
RIR
ON
5010
015
020
0C
OS
T P
ER
FO
OT
250
300
350

se.
fr
J.
FIG. 6 9 'TUNNEL WITH fWO 30 STEAM LINES, 18 "RETURNLINE AND 6 ''DEMINERALIZED WATER LINE
47
4

a-
FIG. 7 7 X 7 TUNNEL READY FOR 2ND 24 -STEAM LINE
48
r , -
-.11111111111111...A
4
rY,
3.
N
FIG. 8 8 'DIAMETER CROSSING UNDER RAILROAD
49

-4--,-et_
FIG. 9 ROLLER SUPPORT FOR UPPER PIPE
50

FIG. 10 PIPE GUIDE ASSEMBLY-HORIZONTAL STRUT WILL BEREPLACED BY STRUCTURAL STEEL FOR COMPLETION
515 3

SEARCHING FOR ANSWERS TOREFUSE HANDLING
DONALD WHISTON, P.E.
Donald Whiston graduated from M.I.T. in 1932 with S.B. degree inBuilding Engineering and Construction. He taught for two years at theCentral China College; designed and supervised construction of several
buildings, including Radiation Laboratory facilities at M.I.T. while
employed in private industry. He shifted into maintenance withassignment as Plant Engineer for the Radar School and in 1946 toBuildings and Power Department, M.I.T., as Assistant Superintendent.
He was Construction Manager of the Raw Materials Division ofA.E.C. for two years, and then for 1 1/2 years with Amerimn CyanimideCompany, as General Superintendent of the Chemical ConstructionCorporation's Construction Division,
He returned to M.I.T. in 1954, in the Physical Plant Department assuccessively Executive Officer, General Superintendent and presently
Associate Director.
The rug wore out and exposed the sweepings. So now withdirt in the sky, everyone is suddenly aware of air pollution andthe problem of solid waste disposal. Legislators are busy makinglaws controlling the output of incinerators and the watereffluent of industrial complexes. Citizens are protesting againstdumps and landfills. Still there is no final answer as to the formrefuse should take, whether in its original form scattered into aconvenient hole in the ground, whether compacted to eliminatethe voids which breed flies and rodents, whether shredded tofeed an incinerator, pulverized for mixing with dirt as landfill,or as a gas devoid of solid particles and odours, whether encased
53'±

and sunk in the ocean depths, or kicked off the earth's surfaceto burn off in an orbit about the sun.
Physical Plant administrators are, however, faced with aninterim decision closer to home, how to handle the proliferationof trash in the building space provided and what to do if theregular refuse outflow ceases because of strikes of sanitationworkers or by other uncontrollable events. This, then, is theproblem--what system, which machine, how much storage?
Late in 1965, the problem of refuse collection particularlyat the central rubbish room of the main M.I.T. campus becameso troublesome, action had to be taken. To this rubbish roomevery night some 120 cleaners brought their refuse pickup fromthe offices, classrooms, and laboratories in the 1,615,000 grosssquare feet they serviced. The collection was made into 42gallon fibre barrels which were trundled by means of four wheeldollies to this room and the contents dumped loose on thefloor. Often the quantity was such that more than one trip wasnecessary, the distance traveled varying from a few hundredyards to one-quarter mile. Imagine the time spent in thistraveling, let alone the stopping to chat with dear friends!
By morning, this rubbish filled the floor of the room to adepth of three to four feet. Sometimes it overflowed into thecorridor, since the last comers were not about to tramp throughthe waste to dump near the exterior door. Open doors allowedthe wind to scatter pieces of paper down the corridor inside andup and down the alley outside.
Quoting from the brochure of an incinerator manufacturer"And this brings up a blind spot toward waste disposal costswhich afflicts many an organization highly knowledgeable inproduction costs and business accounting. All they see is thecontract hauler's fee to remove waste from the premises. Few, ifany, recognize that, for every $1 spent to haul away trash, theyspend some $3 collecting, transporting and storing it right ontheir own property. As trash generation proliferates, its disposaldemands a rethinking on a systems basis." [1]
Around eight in the morning the rubbish contractorbrought in two open trucks which were loaded by means of apayloader or by hand. During this operation still more papers
5 54

were wafted up and down the alley and on to adjt.cent roofs.Professors teaching in nearby classrooms comply ined not aloneon the appearance of the grounds but on the noise of theoperation.
The answers come, not from refuse managementconsultants, but from a careful step by step examination of theprocedure by the physical plant supervisors.
The first answerContain the waste. Paper or plastic bagswere bought to insert in the rubbish collection barrels. Also, tieswere furnished to secure the top of the filled bag. Result: noscattered rubbish, bags could be piled two or three high ifneeded. Odours and rodents went to near zero, and the roomwas no longer a haven for rubbish pickers.
The second answer: Contain the noise. The rubbishcontractor parked a packer-truck at the door of the rubbishroom each evening with a man to operate. Bags were depositedin the truck tail-piece as they came to the room, werecompacted, and by 7:00 A.M. at the end of the shift the truckwas full and ready to drive to the dump as the first load of theday. Results: no noise to disturb the day classes, and therubbish room clear, clean, and ready to receive the minoramount of refuse brought over during the day.
The overall result: Cleaner's time for rubbish room tripscontrolled, and complaints down to a minimum. (Theblue-green color of the plastic bag clashed with the decor of atraveling art exhibit, so a change was made on the next purchaseto a cream colored bag).
Although in M.I.T.'s case the plastic bag (of 0.0135"thickness) seemed most desirable by reason of lower costs andease of use, paper bags may be the container of the future.Plastic does smoke during incineration, has an unpleasant odourwhen burnt, will tear with punctures, and may not pass thrucertain pulverizers. Its stretching qualities, which permitsretention of irregular shaped objects, is a fault when disposed ofin small single bag compactors. Plastic does have somecompaction effect due to its elasticity. The use of bags,however, with their neater and cleanlier appearance, has
55

brought out a change of attitude toward refuse, for what is notseen fails to offend. Presently at M.I.T. some 160,000 bags areused per year as against 50,000 the first year.
The cost proved worth it, but its excessiveness warrantedcontinued efforts. The budget for rubbish hauling for this areaof the campus has tripled in the last five years. Part of thisincrease is the cost of bags, from $3600 in 1965-66 to $8600during 1968-69. Other factors are: A. The difference in costbetween the previous open air disposal method and the presentrent on the packer-truck and operator for 12 hours a night, fivenights a week. B. Inflationary costs effecting the contractor'srates, about three to four percent per year, and C. Costs ofspecial handling of demolition and construction wastes causedby extensive space alterations to existing buildings.
Space Planning
During this same period (1965 to 1969) M.I.T. was addingto its building facilities. With each building came the questionfrom the space planners on the amount of space to allow forbuilding service functions, including that of rubbish storage.Early space forecasts were based on the assignment of 12,000 to15.000 gross square feet to each clea 'er- custodian, and thateach such cleaner would produce 1 1/2 to 1 42-gallon rubbishbarrels per night. With the gross square feet of the buildingknown as well as the nature of the occupancy the area of arubbish room could be determined, using rented two yardcontainers to contain at least three day's waste.
Waste Per Capita
In reviewing the literature on solid waste disposal, it wasfound that the figure for the amount of waste generated perperson varied with the author. European consultants, analyzingthe United States waste problems, came up with a figure of 0.66tons of waste per person per year or 3.62 pounds per day perperson. [2] Other authors n the Proceedings of the 1968National Incinerator Conference give values ranging from fourto five pounds per day per person. From the M.I.T. report of1968 comes a figure of 1000 lbs./year/person or 2.7lbs./daylperson.
565.-

A more useful table for physical plant use is that shown inTable I compiled by the Incinerator Institute of America. [4]However, personal observation showed that even these figureswere out of line with actual values. Some of the differenceprobably comes from the use of net square feet figures in theTable I values, but in keeping with the standards of APPA(Association of ?hysical Plant Administrators of Universitiesand Colleges) [5] gross square feet of a building is used in thedata to follow.
Table 1. Data for Estimating Incinerator Capacity
Building Types Quantities of Waste Produced Per Day
IndustrialFactoriesWarehouses
Survey required2 113. per 100 sq. ft.
CommercialOffice buildings 1 lb. per 100 sq. ft.Department stores 4 lb . per 100 sq. ft.Shopping centers Study of plans or survey requiredSupermarkets 9 lb. per 100 sq. ft.Restaurants 2 lb. per mealDrug stores 5 lb. per 100 sq. ft.Banks Study of plans or survey required
ResidentialPrivateApartment
5 lb. basic plus 1 lb. per bedroom4 lb. per sleeping rcom
SchoolsElementary 10 lb. per room plus 1/4 lb. per pupilHigh schools 8 lb. per room plus 1/4 lb. per pupilUniversities Survey required
InstitutionsHospitals 8 lb . per bedNurses or interns homes 3 lb. per personHomes for the aged 3 lb . per personRest homes 3 lb. per person
57

Building Types Quantities of Waste Produced Per Day
HotelsFirst class 3 lb. per room plus 2 lb . per mealMedium class 1 1/2 lb . per room plus 1 ib . per mealMotels 2 lb. per roomTrailer camps 6-10 lb. per trailer
In one set of observations covering the rubbish roomservicing two buildings some six cubic yards of partially pressedrubbish in bags were deposited on the average each day.Invoices of the rubbish contractor confirmed this. These twobuildings, occupied by the Biology, Bio-chemistry and EarthScience Departments, aggregated 269,000 gross square feet,(231,000 net), and 848 spaces. With each bag weighing between25 and 30 pounds and a volume of 5 to 5 1/2 cubic feet, theuensity is then about five pounds per cubic foot, and fcr thisoccupancy waste will be generated at 0.30 pounds per day per100 gross square feet or one pound per space per day.
At another location, where refuse from four buildings isgathered, the unit is higher-0.40 pounds per day per 100 grosssquare feet or 1 1/2 pounds per space per day. In this case thefour buildings totaled 297,000 gross square feet, (247,000 net),with 746 spaces, and serviced space for aeronautical,servomechanism, space study and computer work.
At the present time studies are being made on rubbishgeneration in dormitories, but to check Table I valuesobservations were made at several New York City apartments.These were middle-class income apartments with an average offour persons per apartment. The figure was 1 1/4 to 1 1/2lbs./day/person, varying evidently with the relative income.
A calculation of the waste generation at the M.I.T. StudentCenter Building, using 4 lbs./day/100 gross sq. ft. for the storearea one pound per meal for the dining service, and 1/2lb./day/100 gross sq. ft. for the student organization's officesand the general area, gave a value for waste volume of 20 cubic
58
59
yards per day. This agreed with personal observation as well asinvoice figures of 20.3 cubic yards per day over a three monthperiod.
Rubbish Room Requirements
Allowances must be made in any waste analyses for v..devariations in waste input. Such material as computer punchdcards at 48 lbs. per cubic foot or telephone books at 36 lbs. percubic foot can change materially density figures for averagewastes at five pounds per cubic foot. Charges at dumps andlandfills are sometimes based on weight and sometimes onvolume. With increased use of compactors the trend will be tocharges based on weight.
In setting aside rubbish room area, include allowances forvariations in waste input during the year. Stores at the start ofthe school season, the Christmas per period throughout officeareas, new furniture, all these and more effect the normal wastegeneration. Any such room should also include area formaneuvering containers as well as room for future compactors.
Other room requirements include water connection forcleaning, floors sloped to floor drains, power, ventilation toexhaust odours and smoke, and sprinklers. With a need for anoccasional wash-down; concrete floors should be sealed andwalls and ceilings should be covered with a hard gloss paint.
Stationary Compactor Study
It was obvious early in the study of M.I.T. waste problemsthat regardless of the ultimate resting place of the wastes, thelogistics of picking up, transporting within our buildings, andassembling for pickup were the items for study. By the use ofpaper or plastic bag barrel liners the pickup became orderlywith custodians placing filled bags at convenient points in theirarea for later transport at the end of the shift. However, thedeposit of these bags in open containers and the later handlingby the rubbish hauler seemed inefficient as well as unsightly.
In certain buildings with incinerators a review of the timetaken to fire up, the feeding of waste through a hot open door,
59
D

and the later removal of ash and unburnables all seemedinefficient, costly and an excessive use of manpower. Where theuse of the incinerator was a necessity because of laboratoryanimal wastes, it was best to assign the incinerator to alaboratory technician or animal caretaker designated by theacademic department. The sole function of physical plantmaintenance was the removal of the ash daily and theoccasional check of gas controls.
With the advent of more rigid air pollution regulations, theobvious difficulties attending labor disputes in the rubbish field,and the closing of dumps by citizen demand, it was evident thatsteps must be taken to put the waste in a more condensed andcontained form. [9] This led to a detailed study of the varioustypes of compactors during the spring and summer of 1969.
Stationary Compactor Requirements
The compactor for use inside a building rubbish roombasement corridor, or previous incinerator space must be smallin physical dimension. The hopper size must receive one ormore bags of waste at a time and take an average sizedcardboard carton. Its container should handle wastes collectedby cleaner-custodians during the evening and night shifts. Yetthe container must be small enough to pass through doors,down corridors, and into elevators for transit to shipping rooms.The degree of compaction must be sufficient to warrant theexpenditure. Compactor and/or containers must not only lookneat but be designed to withstand the pressures and abuse towhich they are subjected.
Compactor Types
It was found on examination of the trade literature thatmost emphasis was given to the larger compactors. These areeminently suitable at an industrial site where interior routes ofwaste pickup can terminate at a suitable loading platform, orfor transfer sites as an end terminus before trucking to a distantlandfill. The application of compactors as a substitute for smallbuilding in nerators is a recent development, pushedparticularly by the air pollution regulations enacted by NewYork City early in 1968. [6] The industry is in the throes of
60
6i
having a demand market without a true and tried product todeliver. Many times during survey inspection trips to see theoperation of seemingly suitable compactors it was found thatthey had been withdrawn, were in the process of modification,or were the figment of a salesman's hopeful prediction of a saleand/or delivery promise. The practice of manufacturers inbringing out newly designed compactors for trial at thecustomer's location is a nuisance that should be discouraged.
Nevertheless there is progress, many models are now in useand satisfactory to the building owner. Others are installed anduseable, but not in use by reason other than machine fault.
To list all compactors available is not the task of thisreport. Those listed are typical of the type and are the productof manufacturers known in the trade. They may or may not bepresently available for purchase. Only one model of any onetype of any one manufacturer is listed. The data given is thatprovided or calculated from values furnished in brochuresfurnished by the maker or his agent. See compactors listed inthe Sanitation Industry Yearbook [8] .
Medium Size Stationary Compactors Table II
Medium size compactors are those up to 1 1 /4 cubic yardsnominal size for use with six cubic yard containers or larger andare usually a smaller version of larger industrial-typecompactors. These require the use of a platform for deposit ofthe wastes into the hopper and trucking area for handling thecontainer. There are some arrangements putting the compactorand hopper inside the building with the container outside. Theplanner must, in this case, think of how to conceal thecontainer in some fashion and provide for truck loading of thecontainer. There should be sufficient waste N flume to warrant apickup at least twice a week. Longer storage of compactedmaterial could cause odours and health hazards.
Small Stationary Compactors Table III
Small compactors are mini-versions (less than one cubicyard nomina! size) for use with one to five cubic yardcontainers. These containers are small enough to permit moving
61

from an interior location to a suitable shipping location.Although the compactor units are relatively trouble free, thecontainers are subject to considerable abuse during unloadinginfo the packer-truckers. Loose, unfastened lids, bulging sidesand cracked welds of the containers destroy the ability of thecompactor to concentrate the refuse. The degree of compactionis thus reduced to possibly three to one or less as against itsrating of five to one. Casters on these containers are sometimesundersized for the weight to be handled. The contractor'spersonnel frequently have difficulty in hooking up thecontainer to the packer-truck for unloading. Buildingmanagement, renting such equipment, should put the burden ofcontainer repair on the contractor. Management should watchthe entire sanitation operation that untrained, unsupervised,lackadasical sanitation workers do not effect the prices quotedby the contractor.
Small Special Compactors Table IV
The small special compactors, intended to replaceapartment building incinerators, are fairly new in concept.These have been brought out by the industry by reason ofcertain New York City requirements [7] , as well as a need forsmall containers of the ash can type and no more than 80pounds in weight when filled. Some of these units fill one paperbag container at a time, and require an up-righting of the bagafter filling, tying and replacement with a new bag. Buildingmanagement having captive help, or a janitor with spare time atthe right time of day can consider this type machine, but it iscertainly not automatic in operation
Other compactors in this table, having compaction fromtwo directions, produce a denser material, and use a carousel toautomatically place an empty ash can or bag in position whenthe previous receptacle is full. This type, with several patentedvariations, may prove outstanding once the bugs have beenlicked. The practice of the manufacturers in bringing out newlydesigned compactors for trial at the customer's expense should,however, be discouraged. Compactors of this type are not nowlisted in the Sanitation Industry 1970 Yearbook. [8]
62

Compactor Data
The data listed in Tables II, III and IV are fairly selfexplanatory, but there are some precautions in comparing thevalues given.
The value for the ram force is usually the maximumavailable, and puts the hydraulic system at its top-limitingpressure. The machines are customarily run at lower pressuresdependent on the safety factor desired, the type of refuse andthe desired degree of compaction. It is unfortunate but mostcompactors are not furnished with pressure gauges, a featurethat would be most desirable for the operator.
Some values do not reflect the entirety, as for instance theweight given is usually that of the compactor and would notinclude the weight of the hydraulic system or control panel.
The design for the cylinder of the hydraulic system is animportant feature, and the cylinder used should be of reputablemanufacture. The diameter and stroke should not be soexcessive as to cause distortion of the tube or rod. One problemof maintenance is the replacement of the seals and gaskets ofthe cylinder and for this reason the cylinder should beprotected with covers from dirt and grit as far as possible.
Attention is called to the Force Factor, [Table III Item19] (the ram force divided by the charging box volume) whichis more pertinent than the ram face area stress. Oftenmanufacturers increase the dimensions cf the charging boxwithout increasing the available force. Research is needed todetermine the best value for this factor for various types ofrefuse.
Like the auto industry, compactor models sometimes aredelivered with certain controls or with controls as an extra tothe price. These can vary from a lever or push button to anelectric eye or sonic sensor in the hopper. Many compactorshave a forward and back stroke limit switches as well as apressure limit switch. Others are evidently hopeful that no onewill drop in any refuse (such as a bolt) that the machine cannot
63

shear off. The building management must make a judgement onthe joining of a particular compactor to the particular trashexpected from the building. In no case should physical plantmanagement make a choice of compactor from an evaluation ofthese tables. Rather they should examine the reputation of themanufacturer, the simplicity of the machine, the built-in safety,the availability of reliable repair service, and the relation of costto weight. Here is a machine where the cost/weight ratio can bean important factor.
6364

TA
BL
E I
I
DA
TA
ON
ME
DIU
M S
IZE
ST
AT
ION
AR
Y C
OM
PAC
TO
RS
FOR
6 C
U. Y
D. O
R L
AR
GE
R C
ON
TA
INE
RS
ITE
MN
O.
DA
TA
IT
EM
UN
IT
1.N
omin
al S
ize
CY
3/4
3/4
11
1/4
2.R
am F
orce
lbs.
70,0
0020
,000
39,0
0042
,405
3.R
am F
ace
Are
ain
.64
81,
220
1,00
81,
490
4.R
am F
ace
Are
a St
ress
psi
108
1638
285.
Wei
ght
lbs.
1,73
03,
000
6.Po
wer
HP
33
35
7.C
ylin
der
Dia
.in
.2
1/4"
sc2-
5"6
8.C
ylin
der
Stro
kein
.48
30as ch
9. 10.
Hyd
raul
ic P
ress
ure
Pum
p C
apac
ityps
iG
PMN
on3
1/2
2,00
012
1,50
07
1/2
11.
Oil
Cap
acity
Gal
.10
2212
.C
ompa
ctor
Wid
thin
.57
4648
1/2
97 1
/213
.C
ompa
ctor
Len
gth
in.
108
7575
51 1
/414
.C
ompa
ctor
Hei
ght
in.
5644
5215
.C
harg
ing
Box
-Wid
thin
.36
3642
16.
Cha
rgin
g B
ox-L
engt
hin
.40
3134
17.
Cha
rgin
g B
ox-D
epth
in.
2334
3039
18.
Dis
plac
emen
t/Cyc
leC
.F.
19.2
22.0
24.8
32.8
19.
Forc
e Fa
ctor
lbs/
CF
3,45
092
51,
450
1,31
020
.T
ime
of C
ycle
sec.
3050
2645
21.
Con
trol
sN
on-H
ydB
utto
nB
utto
nS@
onic
But
ton
22.
Man
ufac
ture
rM
cMea
rty
Perf
ectio
nA
uto-
Pak
Dem
pste
rE
quip
. Co.
Cob
y C
o.C
ompa
nyB
ros.
23.
Mod
el N
ame
Pac-
Kin
gSt
atio
n-Pa
cD
ual-
Pak
Pow
er-M
ite24
.M
odel
No.
150
SP8
DP1
0SP
1042

05)
TA
BL
E I
ll
DA
TA
ON
SM
AL
L S
TA
TIO
NA
RY
CO
MPA
CT
OR
SFO
R 1
-5 C
UB
IC Y
AR
D C
ON
TA
INE
RS
ITE
MN
O.
DA
TA
IT
EM
UN
IT
I.N
omin
al S
ize
CY
1/4
1/4
1/3
1/3
3/4
2.R
am F
orce
lbs.
10,0
0040
,000
10,0
0025
,000
7,35
03.
Ram
Fac
e A
rea
in.
207
480
467
540
345
4.R
am F
ace
Are
aSt
ress
psi
4983
2146
215.
Wei
ght
lbs.
2,10
01,
500
1,80
01,
600
6.Po
wer
HP
12
32
1
7.C
ylin
der
Dia
.in
.1
1/2"
sc2
3/4
42
1/2
8.C
ylin
der
Stro
kein
.31
3931
1/2
a.9.
Hyd
raul
ic P
ress
ure
psi
Non
1,65
02,
000
1,50
010
.Pu
mp
Cap
acity
GPM
2 1/
27
1 1/
211
.O
il C
apac
ityG
al.
53
1
12.
Com
pact
or-W
idth
in.
2828
43 1
/242
1/2
3213
.C
ompa
ctor
-Len
gth
in.
7161
8773
6914
.C
ompa
ctor
-Hei
ght
in.
4231
72 1
/466
5715
.C
harg
ing
Box
-Wid
thin
.23
1/2
2430
2616
.C
harg
ing
Box
-Len
gth
in.
2720
2826
17.
Cha
rgin
g B
ox-D
epth
in.
1520
2148
18.
Dis
plac
emen
t/Cyc
leC
.F.
5.0
5.5
9.3
10.2
18.8
19.
Forc
e Fa
ctor
lbs/
CF
1,85
07,
250
1,05
02,
500
390
20.
Tim
e of
Cyc
lese
c.30
2630
2620
21.
Con
trol
sN
on-H
ydB
utto
nSo
nic
But
ton
Soni
cE
ye22
.M
anuf
actu
rer
McM
eart
yN
at'l
Com
pact
orH
eil
Aut
o-Pa
kE
-Z P
ack
Equ
ip. C
o.&
Tec
h Sy
st's
Co.
Co.
Co.
23.
Mod
el N
ame
Pac-
Kin
gK
eil-
Pac
Pitc
h'N
'Pak
AO
Pac
ker
24.
Mod
el N
o.10
020
24

TA
BL
E W
DA
TA
ON
SM
AL
L C
OM
PAC
TO
RS
FOR
CA
N A
ND
/OR
BA
G C
ON
TA
INE
RS
ITE
MN
OD
AT
A I
TE
MU
NIT
1.N
omin
alC
Y1/
41/
41/
411
42.
Ram
For
ceM
ax.lb
s.37
,600
42,0
0039
,300
y ;;0
003.
Ram
Fac
e A
rea
in.2
200
177
176
4.R
am F
ace
Are
a St
ress
Max
.psi
187
238
223
5.W
eigh
tlb
s.60
01,
500
2,30
02,
200
6.Po
wer
HP
7 1/
23
7 1/
22
7.C
ylin
der
Dia
.in
.4"
H,4
"V2-
3 1/
2"8.
Cyl
inde
r St
roke
in.
24"1
-_,3
0"V
9.H
ydra
ulic
Pre
ssur
eM
ax.p
si3,
000
2,50
02,
000
3,00
0aN --
4
10.
11.
Pum
p C
apac
ityO
il C
apac
ityG
PMG
al.
5.6
257. 20
6.
12.
Com
pact
or-W
idth
in.
2426
4237
13.
Com
pact
or-L
engt
hin
.74
9495
3/4
111
14.
Com
pact
,r-
Hei
ght
in.
9126
83 1
/269
15.
Cha
rgin
g B
ox-W
idth
in.
2424
2416
.C
harg
ing
Box
-Len
gth
in.
2424
3817
.C
harg
ing
Box
-Dep
thin
.18
19 1
/215
18.
Dis
plac
emen
t/Cyc
leC
F6.
06.
56.
719
.Fo
rce
Fact
orM
ax.
lbs/
CF
6,30
06,
460
6,10
07,
680
20.
Tim
e of
Cyc
lese
c.35
21.
Con
trol
sH
ydr.
But
ton
But
ton
or E
yeE
ye
22.
Man
ufac
ture
rC
ombu
stio
nC
ompa
ctor
Res
earc
h-A
uto-
Pak
Equ
ip.A
ssoc
.C
orp.
Cot
trel
l,Inc
.C
o.0-
.)23
.M
odel
Nam
eH
ydra
-Pak
Was
te-P
acto
rPa
k-T
rell
Gob
bier
0.)
24.
Mod
el N
o.M
ark
I15
716

INCINERATOR VS. PULVERIZER VS. COMPACTOR
All three of these machines serve to concentrate solidwaste, with the incinerator properly controlled giving thesmallest end result. The incinerator must have the proper hightemperature, even to using additional fuel in a secondaryburner, which makes its use costly and calls for control equal toa chemical plant. When one examines the variation in refusecomposition and moisture contents of typical home andindustrial wastes, [10] the instances of smoke and vapor cloudscan be appreciated. It is thus obvious that an incinerator mustbe large enough in capacity to warrant the excessive cost oferection and that a volume of waste be available equal to thatfrom one to one and one half million people. [2]
Pulverizers are beginning to gain attention as a mt.ans offeeding incinerators, to permit a greater degree of compaction;or to mix with dirt for compositing or controlled landfill.Further development of these machines are needed to provetheir advantages as against their higher costs in comparison withcompactors "In Great Britain as a whc!-- 80 per cent of refuseis disposed of by "controlled" tipping, (landfill) 16 per cent byincineration and four per cent by composting andpulverization." [1]
Compactors have met the challenge of present day needs,in furnishing types to meet the demands of any waste, be itautos, tin cans, or confetti. Waste in the compacted form duespresent difficulty to the incinerator operator, for its lowburning rate. Waste, when compacted properly, can be hauledto landfill sites at cost comparable to the removal ofnon-combustibles and by-products of incineration. On coststhere is no question that compactors have large advantages overincinerators. [9]
And here finally is the point of departure, what is thenecessary ultimate form of our solid wastes? To meet thisproblem an extensive federal research prow am [12] has beenstarted. Hopefully, some answers will be forthcoming before itbecomes an unsolved problem for physical plant administrators.
63 68

REFERENCES
[11 From Trash to AshBrochure from R. P. C. DivisionMidland-Ross CoiporationRoxboro, North Carolina
[2] W. Fichtner and F. MartinService Requirements of a Modem LargeRefuse Incinerator PlantProceedings of 1968 National Incinerators ConferenceA.S.M.E. pages 117-122
[3] D. G. Wilson (ed)Summer Study of the Management of Solid WastesSloan Basic-Research Fund, MIX., September 1968
[4] F.W. RohrPlanning for IncineratorsBuilding Systems Design (formerly ACHY)Industrial Press, Inc. N.Y.C.
pages 44-46 July 1969
[5] The Newsletter, The Association of Physical PlantAdministrators of Universities and Colleges
Richard A. Adams, EditorOregon State University, P. 0. Box 173Corvallis, Oregon
[6] Various data and bulletinsDepartment of Air Pollution ControlThe City of New York
[7] Rules and RegulationsVarious-Housing and Development AdministrationDepartment of Buildings, City of New York-Environmental Protection AdministrationDepartment of Sanitation, City of New York
69
0

[8] Stationary PackersSanitation Industry Handbook-1970Solid Wastes Management Refuse Removal Journal
pages 117.129RRJ Publishin , Corp., 150 E. 52nd Street, N.Y.C.
[9] W. E. BelangerCompactorsAn Alternative to IncinerationPublic Health Dept.City of PhiladelphiaBulletin N. MH-68122
[10] E. R. Kaiser, C. D. Zeit, J. B. McCaffetyMunicipal Incinerator Refuse and ResidueProceedings of 1968 National Incinerator ConferenceA.S.M.E. pages 142-153
[11] D. TattersallPlanning and Disposal of Waste MaterialPublic Cleansing(Vol. LIX, No. 7 , July 1969, pg. 335)The Institute of Public Cleansing28 Portland Place, London, England
[12] R. D. Vaughan, R. J. BlackThe Federal Solid Wastes ProgramProceedings of 1968 National Incinerator ConferenceA.S.M.E. pages 318-321
7170

ELEVATOR MAINTENANCE COST ANALYSIS
BY
RAYMOND HALBERT
Raymond Haibert attended the University of Missouri. He has servedas Director of Physical Plant, University-Wide, University of Missouri, for23 years. He is a member of the Board oi Directors of APPA and hasserved on numerous APPA committees. Ea is a past-president of theCentral States Regional Association of /WM. He has published severalother articles relating to physical plant work.
In looking through the minutes of previous NationalAssociation of Physical Plant Administrators' Meetings andCentral States Regional Association Meetings, I do not find anypapers pertaining to elevator maintenance or history ofelevators.
Before going into the matter of maintenance of elevators, Ithought perhaps it might be well to consider a brief history ofelevators. The history of vertical transportztion parellels thenew development of civilization. As nations grew economically,materially, and intellectually, there is a closely allied growth inthe field of vertical transportation and the designs andconstruction of monumental types of structures.
We read that Louis XIV and Napoleon I were familiar withan elevator composed of a chair that employed the use of acounterweight.
71/iw

The first commercial power elevators for verticaltransportation were powered by steam. It was applied in a crudeway and was used almost exclusively for freight elevators asthese elevators were not considered safe for passenger service.
In 1853, G. E. Otis, the inventor, reportedly brought aplatform equipped with a safety device to a safe stop after a"free-fall" demonstration. This eventful date begins the era ofmodern elevator industry. There have been many majorimprovements and refinements made in elevators in ensuingyears. Development of a practical wire rope had a stronginfluence on the progress of elevator design and operation.
In its beginning, the elevator industry was one in which afew individuals set up workshops to fabricate elevatorspiecemeal. Today, there are hundreds of highly organizedelevator companies in all parts of the world. At present, elevatorengineering is a highly specialized industry combiningapplication of the newest developments in the electrical,chemical, and mechanical fields. A look at the skyline of anylarge city will easily show the absolute dependency placed bythe public on vertical transportation. If vertical transportationhi,d not been made available, building structures would haveremained at their 1850 height.
The year 1861 saw an improvement in roped elevatorsconsisting of the use of multi-ropes rather than only one or two.Each rope was capable of sustaining the full weight of the car.The use of multi-ropes was satisfactory and is still commonpractice.
The hydraulic elevator was first developed and installed in1867. Hydraulic elevators can operate at 600 and 700 feet perminute, but are very expensive. Elaborate pumping equipmentis required with this type since a pressure of 1000 pounds persquare inch or higher is necessary. With the use of hydraulicelevators, the hole must be drilled below the pit floor as deep asthe rise is high. Think of the cost of sinking a 300 feet deep by12 inch diameter hole in New York City where bedrock startson the surface. Aside from the high initial cost and extensivemaintenance expense, there are two other objectionablefeatures of hydraulic elevators which arise from the passenger
72

viewpoint. First, there is a considerable difference in up anddown speed, especially under extreme load conditions. Second,such cars often give unpleasant bouncing sensations on startingand stopping if air pockets exist in the cylinders.
One of the most important developments of the 187C'swas the introduction of the overspeed safety and governor. Thissafety device was designed to automatically cause the car safetyto pip the guide rails if the elevator attained a predeterminedspeed, thereby stopping and holding the car in case of overspeeddue to any cause. Present day safeties fall broadly into threegeneral classifications. They are the broken rope safety, the rollsafe and the gradual safe. The first two are instantaneous typesbut differ in concept, depending on rope breakage andoverspeed respectively to operate the safety devices.
In America, the commercial use of the electric elevatorbegan in 1899 with the installation of two electric elevators byOtis Brothers and Company in New York. These elevators weredirect current shunt motor driven. Several years elapsed beforealternating current motors were developed to the extent wherethey could be applied to elevator machines.
The traction elevator, or gearless traction, was developedin 1903. Today, most cable elevators around the world aretraction driven. The advantage of the traction machine can belisted as, A. a given machine can be used for almost any rise ascompared with drums which must have capacity for enoughrope to accommodate. the rise, and B. when either the car orcounter-weight ceases to move because of some obstruction inthe shaft, the ropes lose their traction allowing the drum to spinwithout moving the car. The last mentioned item constitutes animportant safety feature. With the advance of the tractionmachine, the days of the hydraulic car appeared to benumbered.
In the past few years, however, the plunger electricelevators have again become quite popular in certainapplications. Most plunger electric units today are "closedcircuit" installations where the fluid passes from a storage tankto a piston or pistons and returns. On the up direction, a pumpforces the fluid from the tank to the cylinder lifting the car. To
73 1,

descend, a valve is electrically opened and the fluid is forcedback to the storage tank by the weight of the elevator and load.Most units today use oil rather than water as actuating fluid.Probably the greatest number of plunger electric elevatorsinstalled today are of limited rise type.
The manner of elevator controls is quite important. Theearly elevators were hand rope controlled which involved a roperunning over shafts in the overhead structure and fit into ashipper w!xel on the controller. This wheel revolves in thedirection the hand rope is moving, turning the shaft whichopens and closes the directional switches by means of a cam.
Later, car switch controls were developed. This systeminvolves a switch which energizes electric magnetic switches onthe controller which supplies power to the motor in the chosendirection. These two types of controls are becoming obsoletethroughout the world.
An improved signal control system was developed in theearly 20's whereby an individual would signal the need for anelevator at a given floor and the elevator operator would takethe elevator to the floor that had signaled. The individual wouldthen be taken to his desired floor. This control was very popularfor approximately 25 years. This type control required anelevator attendant. Many of these elevators are still inoperation; however, most of the elevators have been convertedto automatic operation.
A single automatic push-button control has beendeveloped and by means of a push button at any landing thepassenger calls a car to him. Having entered the car, he indicatesthe level desired by pressing a marked car button. This typecontrol is unsatisfactory in that someone may take the car awayfrom the original rider and he may be delayed in getting to hisdesired floor.
About 15 years ago, the selective collective automaticpush-button control system was developed. This type ofoperation permits any number of landing buttons to registercalls concurrently. This has a great advantage over singleautomatic push-button controls where only one passenger or
74

group of passengers can be served at a time. A passengerentering a collective control elevator at the first landing mightregister his stop as point six. Other passengers might send or callthe car by pushing their landing buttons in the car or in thehalls. The elevator will automatically stop at these indicatedintermediate stations answering in sequence all calls in onedirection irrespective of the sequence in which the buttons arepressed. It will after its last call in one direction, reverse itselfand answer all calls in the opposite direction in the samemanner.
Refinement of signal control systems as used by a numberof companies, has been one of the several reasons for thedevelopment of the so-called "operatorless elevators." Thesecontrols have been developed to a point where they are quit:.reliable and permit elevators to run up to speeds of 1600 feetper minute with safety in heavily populated high rise buildings.
While the elevator manufacturers were developing newertypes of drives and control mechanisms, they were alsoconscious of the need for greater safety imposed by the higherspeed and by the operation of the elevators by passengers. SomeEuropean countries regard safety of elevators in a different lightthan do the Western Hemisphere countries. For example, selfservice passenger elevators in Europe are permitted to operatewithout car gates. At the other extreme, until recently,Australia insisted on drop safety tests without hoist rope on allcompleted elevators. They still require double sets of contactson all hoistway doors so the elevator will not run with the dooropen. The elevator code authorities in all areas try to the best oftheir ability to insure safe conditions for passengers.
As a result of engineering advances, appreciation ofresponsibility on the part of labor and management, as well ascooperation between codes and other governing authorities andindustries, today's elevator is the safest form of publictransportation. The elevator carries more passengers per daythan any other individual system in most of the world's majorcities.
With the many advances in automation and controls, it canreadily be seen that special skills are required in the
75

maintenance of elevators throughout our many buildings. Nosingle mechanical trade is involved in elevator maintenance. Itinvolves mechanical trades as well as electrical trades. The dayof the maintenance man with the screwdriver and pliers is past.Electronic equipment as well as a thorough understanding ofthe electronic equipment is necessary today for the modernelevator maintenance man.
The public has accepted "operatorless elevators" and theyexpect them to operate flawlessly. and only through propermaintenance will this occur.
For the elevator maintenance man to do his job properlyand the owner to have a safe and satisfactory elevator, someitems mu3t be "built in" when the elevator is ordered. Some ofthe paragraphs under each of the following major items whichshould be included in your specifications are:
1. Codes: All work in connection with the installationof the elevator shall be done in accordance withNational Electric Code and American Standard SafetyCode for Elevators, Dumbwaiters, and Escalators.
2. Power Supply: Elevator motor and controls will bedesigned to operate at minimum speed specifiedunder full load conditions in up direction with a 10%reduction in the specified voltage.
3. Multi-Speed Leveling: Car will approach landing atreduced speed from either direction of travel.
4. Car Position and Direction Indicator: As a paragraphunder this heading you should state, "If "Nixie"tubes are used for elevator position indicators at hallpush buttons, the tube shall be 15,000 hour lifetubes. These tubes shall be B-50313 as manufacturedby Burroughs Corporation or approved equal."
5. Main Line Strainer: On hydraulic elevators, a mainline strainer and shut-off cock assembly of theself-cleaning type, equipped with a 100 mesh elementand a magnetic drain plug, shall be furnished and
I. 76'I

installed in the oil line. The unit shall be designed for300 p.s.i. working pressure, compact in design andwith easy access for cleaning.
6. Instruction Manuals: Prior to the acceptance of theelevator covered under this contract, the contractor isto furnish owner with three complete boundinstruction manuals for operation and maintenance ofthe elevator equi-_,ment. These manuals are to includecomplete description of systems, complete parts listshowing all parts by name, identifying number,function and source of supply if such is other thanthe manufacturer of the elevator installed, detailedmaintenance in ,tructions with copy of completeelectrical dircuit diagram as installed, completelubrication schedule and lubrication instructions.
This is by no means a complete list of all of the paragraphsyou will have in your specifications, others would be: ShopDrawings, Travel, Capacity, Car Platform and Sling, Car Guidesand Shoes, Car Enclosure, Car Doors, Hoistway Doors, DoorOperation, Signal Type (Selective Collective Automatic PushButton), Alarm Bell, Automatic Control of Standing Time,Directional Arrows, Jackunit if Hydraulic, Jackhole ifHydraulic, Power Unit, Buffers, Wiring and Piping, Painting,Maintenance, Special Conditions and Guarantee.
I will list some of the types of elevator service agreementsavailable:
1. Oil and Grease Examination Service: This serviceagreement provides cleaning and oiling of machine,lubrication of bearings, and minor adjustments attime of examination. This agreement does not givethe owner much in the way of preventivemaintenance. You pay for all parts and call -backservice. This would be the least expensive form ofelevator maintenance if you can tolerate frequentperiods of service interruptions. This maintenanceprogram should not be used unless you have light useof the elevators.
77

2. Parts, Oil and Grease Examination Service: Thisservice agreement provides for cleaning and oiling ofmachines, lubrication of bearings, minor adjustmentsat time of examination and only minor parts such asmotor brushes, contact springs, cotton wastes, etcetera are furnished. This, like the one above, doesnot give the owner much in the way of preventivemaintenance. You pay for all but minor parts and allcosts in connection with call-back service. This is nextto the least expensive form of elevator maintenance.You can expect frequent periods of serviceinterruptions. This maintenance program should notbe used unless you have light use of the elevator.
3. Full Maintenance Service: This type service covers allitems connected with elevator service except abuseand misuse. Good preventive maintenance isperformed and excellent service and long life shouldbe expected from equipment covered by this typemaintenance agreement.
4. Full Maintenance Service Plus a Charge for MeteredElevator Mileage: The same maintenance service isreceived as under item three above, but the cost isadjusted in accordance with the number of times theelevator is used. Elevators with light use will cost less,but the elevator having heavy use will cost more. Thisis a fair arrangement since you should expect to payfor the service received. The Full Maintenance S.rvicePlus a Charge for Elevator Car Mileage is a relativelynew type agreement and will probably become morepopular in the future.
By using either agreement, number three or four, the costwill be much more thin number one or two, but you shouldhave a minimum of service interruptions. Either number threeor four should be used if you have a heavy use of the elevatorsand depend on the elevator for emergency use unless you do themaintenance work on the elevators with your own personnel.
You can accept a standard form of maintenance serviceagreement which any reliable elevator company will furnish you
78

or you can write your own specifications, depending on yourneeds.
In 1956, we started a 440 bed Teaching Hospital andMedical School on our campus at Columbia. No elevator firmhad a serviceman in Columbia, and we were 125 miles fromKansas City or St. Louis. We did not have men in ouremployment with experience in elevator maintenance service,and we elected to have an outside elevator contractor performour elevator maintenance service. We wrote our ownspecifications due to our location end special conditions we hadto meet. We set forth our needs and requirements and inaddition specified that the successful bidder for our work wouldestablish a service office in Columbia and have stationed inColumbia at least one serviceman with five or more yearsexperience in the servicing of elevators of the selective collectivecontrol system.
Due to the critical need for elevators in hospital serviceand the Regional Handicapped Program, we specified the firmhad to have a serviceman at our elevators that needed servicewithin thirty minutes after we phoned his office in Columbia.We secured Naughton Elevator Company, Inc. as our originalsuccessful bidder. We have bid this service contract twice sincethen, and our same requirements still apply except the firm wasrequired to have three men available in Columbia to be anacceptable bidder. The firm is permitted to do work for otherfirms in Central Missouri if they have as many as fourservicemen stationed in Columbia. As buildings are completedon our campus which have elevators in them, these elevators areadded to the contract by Change Order. The elevatormaintenance company doing our elevator maintenance workcan cancel if they are not satisfied and we can do the same. Thecompany has asked that the agreement be cancelled once, andthe University cancelled once due to technicalities. The pricecan only be changed when our elevator maintenance work isrebid as we have no provision for price change in the contract.
At the Rolla campus, they do not have a need for thirtyminute service. We have a twenty-four hour reporting time afterwe call the elevator maintenance company for the serviceman toreport. We modified our specifications for Columbia elevator
79 80

maintenance work and bid the elevator maintenance service atRolla. It has proven acceptable at Rolla. The one form at eachcampus is required to perform full maintenance service on allmakes of elevators at Columbia and Rolla campuses. I believewe have all makes of elevators at our campuses. The firms are touse genuine replacement parts manufactured by themanufacturer of the elevator they are repairing. A $50.00penalty for each twenty-four hours an elevator is out of serviceis to be charged if any elevator is not placed back in servicewithin forty-eight hours after the trouble is reported. TheUniversity is not liable for premium time which the contractormay incur to meet this deadline. A ling delay in placing anelevator back in service should only be exprienced when amotor burns out or some other major item fails. To date, wehave had only short periods of elevator service outage.
In Kansas City and St. Louis, where each elevatormanufacturer has a serviceman available, we have issued a FullService Maintenance Agreement with each company to maintainthe elevators of their company on each campus. We have usedtheir standard form of maintenance agreement. Their cost perelevator opening is higher than ours at Columbia.
We have not made an effort to employ our own elevatormaintenance men as this is specialized work. We would havesickness, vacation and other scheduling problems. Everyone ishappy with the results of our present system, and no one hastime to take on the added responsibility of elevatormaintenance.
We all realize that companies are in business to makemoney. if you want to save the 10-15% the company hopes tomake and you want to compete with them for the qualifiedman to do competent elevator maintenance work, you may beable to save some money.
You should realize you are assuming responsibility for safeoperation of frequently used equipment. You will be relying onsomeone or several men to do proper and competent work. Themen must be reliable as trouble will not show up for many yearsin a little used elevator. You may have difficulty placingresponsibility for failure of parts due to lack of maintenance, as
8180
more than one employee will be doing this work because ofvacations, sickness, change of personnel, et cetera. Your schoolshould have liability insurance which will protect it and youfrom damage suits which may result from an accident inconnection with elevator use.
Each Director or Superintendent should consider his needfor availability of elevator service on his campus and choose todo the elevator maintenance service with his own personnel orwith his own personnel and services of a reliable elevator firmfor special maintenance service, or use a service agreement asdiscussed previously in this paper.
I had a good response to my questionnaire regardingelevator maintenance throughout the colleges of Central StatesRegional Association of Physical Plant Administrators. I amincluding a summary of the returns for your information andguidance. Each of you can compare your own operation withthe data given in this summary. If you are in doubt as to yourschool, I will give you the number used to identify each school.
I tried in several ways to compare these figures and finallydecided to use the comparison of costs based on "cost permonth for each opening served."
1. Maintenance by Own Personnel and ContractForOil, Grease and Examination Service: Seven schoolsreported that they did the minor work on elevators,but oil, grease and inspection work was contracted.These schools also contracted on a per item basis formajor items of repair. These schools reported costsranging from $2.59 to $18.01 per month per openingserved. The average cost for 208 elevators on thistype maintenance at seven different schools was$6.81 per month per opening served for hydraulicelevators and $5.34 for electric cable elevators. Onthis basis, cost for hydraulic elevators over electriccable elevator maintenance was $1.47 per mor.th peropening served. It might also be noted that there were67 hydraulic elevators with 222 openings and 141electric cable elevators with 1,070 openings. Costsmight be grouped under this heading, combining
81
82

hydraulic and electric cable elevators, as follows:
12 elevators over $2 but under $3 per month peropening34 elevators over $3 but under $4 per month per
opening10 elevators over $4 but under $5 per month per
opening32 elevators over $5 but under $6 per month per
opening102 elevators over $6 but under $7 per month peropening
18 elevators over $7 per month per opening.
This would indicate substantial savings can be made ifyou have the proper manpower to do this type ofmaintenance. Three of the seven schools with thistype maintenance listed one or more of theirelevators as critical.
2. Maintenance by Own Personnel and Contract forParts, Oil, Grease and Examination Service: Therewere four schools reporting on this basis. Two schoolsstated some of their elevators were critical. Costs onthis basis averaged $2.24 for hydraulic and $2.46 forelectric cable per month for each opening served. Thisgroup covered a total of 45 elevators. This is too fewa number to establish a fair cost. Forty-five elevatorswith 178 openings were involved at schools reportingon this basis.
3. Maintenance by ContractFull Maintenance Service:On this basis, there were 15 schools reporting anaverage cost of $12.54 per month per opening servedwith 102 hydraulic elevators involved. Also on thisbasis, there were 18 schools reporting an average costof $12.21 per month per opening served with 228electrical cable elevators involved. It should be notedthat it costs $.33 less per opening served by the use ofelectric cable elevators over electric hydraulic. Costsmight be grouped under this heading, combininghydraulic and electric cable elevators, as follows:
82

9 elevators under $5 per month per opening119 elevators over $5 but under $10 per month peropening70 elevators over $10 but under $15 per month per
opening101 elevators over $15 but under $20 per month peropening
29 elevators over $20 but under $25 per month peropening
There were 328 elevators covered by this typemaintenance in the report received. Seven of theschools, where elevators were located, listed one ormore of their elevators as critical. If you pay more,you should expect and can insist on fewer and shorteroutage of elevator service.
4. Maintenance by ContractFull Maintenance ServiceIncluding Monthly Mileage Charge: Two schoolsreported that they had this type maintenance. One ata cost of $8.62 per month per opening served forhydraulic elevators with eight elevators involved andthe other at a cost of $7.80 per month per openingserved for hydraulic elevators with five elevatorsinvolved. One school with electric cable elevatorsreported this type of maintenance service. Their costwas $9.84 with five elevators involved. Each of theseschools are located in large cities. Two schoolsreported that their elevators were critical. Themileage charge feature of this type agreement mustresult in a lesser charge than the average for the fullmaintenance agreement type service.
5. Maintenance by Own Personnel: One school reportedthey did all of their elevator maintenance work. Theyuse two men, part time, at an annual cost for laborand parts of $2,486. They have four hydraulic and sixelectric cable elevators. None of the elevators is listedas critical. Average cost per opening served at thisschool is $4.41.
83
84

The survey also indicated that,at 35 colleges we have 216 elevators less than fiveyears old;at 25 colleges we have 162 elevators over five yearsold, but
under 10 years old;at 27 colleges we have 114 elevators over 10 yearsold, but under 15 years old;at 19 colleges we have 106 elevators over 15 yearsold, but under 25 years old;at 17 colleges we have 73 elevators over 25 years old.
Twenty-five schools indicated a total of 219 elevatorscovered by this survey were listed as critical. A total of 143 ofthe 219 elevators were located at three colleges. They havecontract elevator maintenance service at two of these schoolsand one school does have maintenance by oil, grease, andexamination service with four men spending 75% of their timeon elevator mainteance service.
I have not covered all of the factors involved inestablishing a comparison of maintenance costs. Others whichyou should consider are: (1) Location of the elevator, big cityor urban area; (2) Speed of the elevator-100' per minute wouldnot require a motor generator setat 300' per minute, youshould have a M-G set; (3) Capacitylarge units require largercables, a larger motor and all items would be more expensive toreplace; (4) Controlsa selective collective system is, by itsnature, more expensive than a push-button type control; and ifyou use group supervision, this will be more expensive to installand maintain than the selective collective system.
I have only scratched the surface on this subject. I doubt ifwe have a proper number of various types of elevators with themany variations in size, speed, control, et cetera to arrive at adefinite cost for elevator maintenance.
Considering the various types of elevators, the location ofthe installation, the speed at which elevators travel, our manyand various types of controls, the capacity of our elevators, andthe service we expect them to perform, our prime considerationin connection with elevator maintenance should be, "How can I
SJ84

get the elevator maintenance work performed with the greatesteconomy and in a quality manner without injury to workmenor passengers?" Safety should be your foremost considerationin elevator maintenance service. If you cannot do your elevatormaintenance safely and economically, you must have acompetent elevator firm do it for you.
From the questionnaires I received, it would appear thatthe most economical way to have maintenance work performedor elevators is to do the routine inspection and maintenanceincluding oiling and greasing and replacement of minor partswith your own personnel, if you have qualified maintenancemen, who understand electronics and the operation andmaintenance of elevators. You should have such work as cablereplacement and safety checks done by an outside reliableelevator firm.
85 3

5: 41 6
1la
23
45
Ho" in
Maintenance
Per formed
6
If By Outside
Contract-Basis
Of Proposal
78
910
Total Annual Cost of Hydraulic
Elevator Maintenance Agreements
Based On:
5a
56
6a
6b
6c
6d
10a
1011
100
10d
tt. t 2 82.
= z
1 rr
?
m
., I; . i =
P22...
......
.S
'
gg 0
2, . 2 '...
°'''
s.
11
4 s"c2
"24'
s
ii t.i .3I
34 2i .5
...:.-
43 4
... gC
O 4
1
M.! '''' '5 2.1g
r.ii
say
43 0
3 . 404
IS &" I.43 no I:
,S'
'' I
e .4 L.', g ...I
FAd
I ..i 2
. as rJ g 22.. s 2,...
211.
1
1ye
s44
120
26
42
5X
72
87
265
27
$21,876
2 3yes
14
116
21
2x
39
43
120
7537,450
4ye
s12
410
18
5x
all
32
107
15
$33,588
5yea
37
3X
315
6yes
834
12
22
x14
41
69
I5,892
7yes17
16
B19
4X
3142
109
17
$4.344
8ye
s5
17
Mme b
Xog
l r13
5lbnd
600
9yea
38
100
12
34
5X
X14
236
132
17
$1,119
10ye
49
73
14
51
5X
56
31
350
14
$6,700
11no
12
yes
528
23
XX
17
72
13
yes
826
45
5X
XX
13
24
16
14
yes
45
9x
934
$1,308
15
yes
319
11
1X
11
34
2$
168
16
yes
1040
46
x15
32
17
yes
921
45
X9
1119
01,583
18
yee
48
2x
X.
19
yes
I20
1X
12
20
yee
215
2X
x10
$1,032
21
yes
X
22
yes
7m'
715
XX x
3
byd
cbl
12
14
100 45
2$
80
23
yes
12
25
24
yea
20
14
421
1X
X11
789
4
25
yea
314
12
xX
$360
26
yes
41
27
XX
448
27
yes
95
44
pal't.
palT
215
19
13
28
yes
12
311
6X
17
66
43
52,160
29
yea
2r
72
Xx
4
30
yes
612
54
XX
x14
38
$387

3yes[14
116
21
2X
39
143
12G
7$37,450
4yes
12
4IF10
18
5X
I
al
32
107J15
$33,588
5yes
37
3X
315
6yes
834
12
22
X14
41
69
5 5,892
7yes 17
16
819
4X
31
42
109
17
4,34
8yes
51
13
7,,,,,,mh
lo:ar
13
5lhnd
2$
600
9yes 38
100
12
34
5X
X14
236
132
17 $ 1,119
10
yes 49
73
14
51
5X
56
31
350
14 $ 6,700
11
no
12ye
a5
28
2X
X1
77
2
yes
826
45
5X
XX
13
24
16
14
yes
45
9X
934
1,308
yes
319
11
1X
11
34
2$
168
16
yee
10
40
46
1
Xt
15
1
32
17
7es
921
45
X9
11
19
$ 1,583
18
yea
48
2X
X
19
yes
120
1X
12
20
yes
215
2X
X6
10
$ 1,032
21
yes
X
22
yes
720
Val.
10
15
1X
X
3
hyd
9
cbl
12
14
100
45
280
23
yes
12
25
7
24
yes
20
14
421
1X
X11
789
4
25
yes
314
12
XX
,.$
360
26
yes
41
27
._:
XX
448
27
yes
95
44
part
part
215
19
13
28
yes 12
311
6X
17
66
43
; 2,160
29
yes
27
2X
X4
30
yes
612
54
XX
X14
28
$ 387
31
yes
416
32
minor
calls
10
20
32
yes
422
24
2X
X8
10
4$
33
yen 23
23
437
2x
142
10
180
9
yed
127
1x
12
35 yes
412
41
4x
x8
412
5,700
36
,..
yes 37
32
211
45
20
X61
521
65
$ 1,500
37
yee
720
25
1elec.
hydr.
27
15
2$2,326
38
yes
314
12
yes
26
Ova
Crew
39
yes IR
14
527
3X
X11 163
11
$16,279
+ elect.
40
ye
231
21
22
29
6$1,872
41
yes
210
11
prey.
4 ..in,
major
X3
313
$50
42
ye
79
X9
8$6,300
43
ye,
42
25
X1
21
65
.0
$80
Mont0h
12
Aldg
44
ps
221
12
X3
316
$540

.
.!.
11
Total Annual Coat or All ElectricCable Elevator Maintenance Agree-manes:
12 13 14 15 16 16a lbb 17 18 19
Average Age ofElevators
20
Ila lib 11c lid 19a 19b 19c 19d 19e
c.::
i:0
or"
i-
V
3
ti
V.
1
:i
6'
i:
2
1 t:i,'A'i:
it.,:4 .
c
i.., 2
,t; i 3
2,44
i ic. ).
! .3
I I..., 5°BS--.:It
.i 'g
T5
.5 !
ri45,ti`ir2... t:
m.
'.. 1 i
!i.9
2::
,.i
I4
82;
, It
,
com20,,,g'!.,7.2-...,,
t'..2!P.:,."'4 t.
P2pow
0
..fl i
"-I L°
S ci
mu'2,m r-
2.,..,
t.cA-
7g,
:...
tl:
5.
>:,
g
g
5.
-
2,
v
2
5.
v.0i
g
50
m.,4
:'
.81
2I1 $43,649 None 45
min.IS
min.16 20 3 5 68
2h2ra. 23ht°'54. 35 1 2 wks. 2 ohs 3 1 1 1
3min , minS ,
3 wks 21 7 6 5
4 None3.11month
30min.
10 11 12 11
5 $ 4,698°°°°
5hrs.
4hrs.
3
6 $ 4,238 h?... id141,1 8 4 1 1 8
7 510,008.00 hr3 s. hr1 .
8 10 5 8 1
8 $21,605 4
hrs.30
min.1 5 8 5
9 $ 5,005 $ 2,271.00 $ 6,000 30min. 10 $5.52-sa.73 2 75% y
Elec.2 2 wks. 2 wks 12 6 9 12 12 3
10 $28,3002
hrs,30
min.20 24 7 8 12 20
11
12Nor
Available2
hrs. $3.00 2 .3% .uctg- 2 wks. 2 abs 1 1 1
13 $ 285 $ 1,200 hrs12 . ha6 s.$1.00
54rEicianlect 12 hrs. 1/2 day 5 2 2
14 $ 746 hrs.1
hr. 7 2 1
515 $ 62Unknown
wry little24
hr.. 1 1 1
16hr1. .°r
+-53.05 lir
time25%
MCenech.
2 vka 1 2 1 4 2
17 $ 2,242 $ 1,35030
min.10-20min. 3 0 3 1 2
18 $ 9,000 $ 200 mg. etg. 6 2 3
19 $ 64.57 24hrs.
1 1
20 3-4hrs.
2-3hrs. X
21
22 $ 1,164 4 2
hz. $2.72 .1 of1%
lect.jiefri.
2
monthsZ
month '3 1
23 5
$ 600
3,000 6 12 4 4
24 $ 7502 30
$2.20 3 54Elec-tric days
7 5 7 5 2
25 2
hrs. 2 1
26 $ 793 $ 1,000 h1rm. am 55.75 2
---.
2
27 5 1,424 1
dayhy
Elect.4 1 1 3 3
28 $ 1,080 $200 /yearder elev. 10
min,15
min. '30 2 None
Elec-trlc
3
days4 7 3 2 1 all
29 $ 100 1hr. hrs. 1 1
30 $ 456 2
days2
53.00 2 None,en.E1Ire mt days
5 4
31 $100 /yeardays hle. 1 2 1 1 1
32 5 5,460 None
$ 2,319
30min.40
30min.
20
min.
4
8
3
7
2
21
1
33 $ 481 $18,308
34 $ 50 $ 50.005 years hrs.
35 $ 4,0001
hr.122hr. 3 3 2 1 1
36 $12,000 $ 50030
min.20
min. $3.50 '-'4
Gen.Ml1nt,
3
weeks3
weeks 21 16 18 20 11 55
37 249 $ 94 J21, eashr .$4.25 1 None2
days2
days 3 2 2
38 3-5hrs.
1-2hra. Month-°°'"
1'
ShortTime
1-3days 1
2
39 2hra.
30min. 6 4 3 7 12
40 12. day
41 $ 10 MinimalMinima,./
i hr.2-4hr.. 54.25 1 None
Elect 1 day.
steel2
42 2
hrs. 5 4 3
43 $1.25 hr8s.
1hr. 3 1
44 POU 20HA.
15min. 3
88
0000

ELECTRICAL DEMAND STUDYOF
CAMPUS BUILDINGS ATCOLORADO STATE UNIVERSITY
R. S. HOLLAR, P.E.
R. S. Hollar graduated in 1951 from Colorado State University with aB.S. degree in electrical engineering. After graduating he joined GeneralElectric developmental division in Fort Wayne, Indiana.
He joined the staff of the Colorado State University Physical PlantDepartment in 1953, as Assistant University Engineer. His present title isManager of Utilities. In addition to his operational and maintenance dutieshe is responsible for the design and development of the primary electricaldistribution systems of the campus.
He has been a registered professional engineer in the state ofColorado for over ten years.
Colorado State University Physical Plant Department, FortCollins, has completed the first phase of a study aimed atcorrelating building types and connected load characteristicswith maximum electrical demands.
We have found (and not too surprisingly) that in sizing atransformer it is not sufficient to know the demand of a"similar" building without first establishing the degree ofsimilarity between the two buildings.
The data are presented to provide a base of facts and apoint of departure for design engineers. The information is
89
sufficiently complete to allow the interested user to formulatehis own use and method of application.
Many Colleges and Universities receive electrical powerfrom the supplier at primary distribution voltage and therebyassume the role of electrical distributor. The distribution linesand transformers are thus the property of the institution and asa general rule the new building transformers are sized by aconsulting electrical engineer. We have reason to pity the typicalconsultant at this point: he may use a formula of his ownmaking, data from the last similar building (doubtful), theNational Electric Code, his intuition, or a combination of anynumber of these methods to arrive at the "proper" transformersize. He must consider not only the probable maximum demandfor today but he feels he must also provide some capacity forthe future. If the transformer is large and hard to remove fromthe building or is a part of a load center, the consultant willwant to oversize the unit to provide for unforseen changes inbuilding use and not burden the owner with unnecessarytransformer changes. Thus the consultant might rigorouslyapply his knowledge and come up with a "properly" sizedtransformer. Furthermore, the conscientious consultant willreadily offer "proof" of the validity of his calculated maximumdemand. So be it. The consultant's task of sizing thetransformer is more nearly a job for a magician.
Simple economics does not demand that the transformerbe sized "exactly" even if it were possible, so long as sufficientcapacity is made available and so long as the sizing was based onavailable facts properly applied.
The campus buildings selected for study are broadlycategorized in the table according to use: academic, residence,research, and service. Seventy-five percent of the buildings listedhave permanently installed watthour meters with fifteen minutedemand registers. Recording ammeters were used where nowatthour meters existed and a power factor of 90% wasassumed. These buildings may be easily identified in the table,as no kilowatt hour consumption figures appear. We feel there isno significant loss in accuracy in cases where measurementswere taken via recording ammeters.
90
90

Both physical and electrical building characteristics mostlikely to affect the electrical load are listed for each building.These include the gross square feet, building use, date ofconstruction, lighting loads and types, mechanical loads, andheating and cooling system characteristics.
Connected load calculations, however arrived at, arealways based on numerous assumptions. Most variable amongthe assumptions is the watts or current assigned to convenienceoutlets and outlets for special equipment. The most oftenassigned load value and the one used in this study for a commonconvenience outlet is 1.5 amps or 180 watts at 120 voltsassuming unity power factor.
"Special" outlets with unknown loads were assigned a 400watt load. Where outlets were designed for a known piece ofequipment, the full value of that load was used in arriving at theconnected load.
Admittedly, most assigned loads to outlets of any sort areintelligent guesses and are fair subjects for discussion,particularly in commercial or industrial buildings not governedby home building codes. The judgment of the designingengineer is recognized, but values other than those used in thistext must be adjusted to correlate with the data presented ifcomparisons are to be valid.
Residence halls listed are complete living units with centrallounge areas and kitchen and dining facilities. Kitchenequipment energy may be steam, from a central station, gas, orelectric, with a fair degree of each in a typical unit listed.
Most central air conditioning is accomplished via steamabsorption units receiving steam from a central station;however, some of the research facilities as noted have totalelectric air conditioning equipment.
It should be noted that one horse power is equated to onekilowatt in arriving at the connected load. It is felt that such a"rounding off" does nut compromise the accuracy of the studyso long as the fact is known and the reader adjusts his thinkingaccordingly.
91 91

:
To use the data to aid in the design of a new structure, theengineer will first categorize the proposed building according touse and size and select a building from the data which has arecent date of construction. If the buildings are similar in sizeand use (refer to "percent of gross square feet" column),multiply the "gross square feet" by the "watts per gross squarefeet" for a ball park figure on what the demand might be. Atthis point the engineer must review carefully the elements of hisconnected load figure to be certain of the correlation betweenthe proposed building load and the load shown in the table. Toestablish a correlation other than unity, the engineer must lookat the lighting loads, method of arriving at convenience outletload, total motor load, special outlet loads, etc. In other words,he must carefully analyze the example offered and in a similarfashion and with the same end in mind carefully compare theproposed building characteristics and adjust the "watts per grosssquare feet" figure up or down according to the degree ofsimilarity.
Buildings dating back to early 1900 are included in thestudy for their interest and for use by Colorado State Universityengineers in their overall planning of distribution.
Many buildings used for study are typical or represent anaverage found throughout the area, while others may not betypical. A careful study of the building characteristics isnecessary if the reader hopes to successfully use the datapresented.
If the data presented fails to support the reader's previousinformation or reassumed methods we can but sympathize. Thispresentation does not presume to draw conclusions, but only torecord the facts as they appear.
92

BLDG
NO.
BUILDING
NA ME
YEARCON
STRUC-5OUARETED
CROSSARXA
FEET
CONNECTED LOADS
LIGHTING MOTORS CO.
180W
KWLOAD
OTHERGRANDTOTALKW LOAD
KW LOAD " 3LOAD
KW LOAD
4 rFLOR INCAN HG
MAX HP DESCRIP.
ACADEMIC1 1
93 221 Agriculture 1939 46,55( 82% 1 18% J .- -- 66 c.o.@ 100 181
30 52 Ammons Hall 1921 23, 704 13% 1 87% 1 5 9 -- 44
116 141 763 Animal Science 1940 38 600 70% 1 30% 1 -- 10 70 Lab EIOD 403
539 478 --
4
1966 60,332 28% 1 48% I 24 30 174 -- 1 191ill'grIgical 168 104 20
5 Science 1948 72,600 70% 1 30% 1 -- 10 164 Spec.c.o. 456127 -- 19
6 Chemistry 1922 54.002 13% 1 87% I -- -- 108 Spec o 254Engineering 211 1C2 32
7 Center 1957 120004 67% J 33% J -- 25 138 Spec.c.o. 483Engineering 84 132 69
8 Center (Math) 1966 3lO76 71% I1 -- 25 65 Computer 35028 -- 4
9 Geology 1905 14.084 18% 1 19% 1 -- -- 19 Spec.c.o. 51(Home Ec) 33 4 152
10 Guggenheim 1910 15,767 39% 1 61% 1 -- 3 29 Ranges 21838 -- 11
11 Home Ec A:meg 1919 18.519 79% 1 21% 1 -- -- 27 Spec.c.o. 76
82 112 --12 Humanities 19 40,670 78% 1 22% 1 -- 15 49 -- 243
Industrial 47 145 75
13 Arts Shops l92 1974O 11% 1 89% 1 -- 75 9 1,&s pwr 276152 33_ 54
utLlgj,ra Arts 19b., IALLI'lliELL17 10 106 CD.LI ecEmiip 395335 342 41
15 Morgan Library 1964 140.356 70% -I 30%1 -- 90 85 Heaters/c.o 80370 13 --
16 Music Bldg 1927 31.150 302 1 70% 1 -- 10 20 -- 103165 284 89
17 Physiology 1966 61,122 88% 1 12% 1 -- 100 70 C.o.& heaters 608205 85 10
18 Plant Science 1960 78,768 73% I 27/. 1 -- 20 200 SpeclabEguip 500Social Science
19 Unit A 1968 102.10k 1 rSocial Science 429 KVA 449 KVA 435 --
20 Units B & C 1967 151,859 92: 1 8: 1 -- 40 KVA -- l313 KVAUniversity . 50 46 160
21 HeadhseiGnihse 1959 28,450 10: 1 90% 1 -- 2.5 31 Gtth (limbrs ,_ 287Veterinary 43 9 25
22 Science 1920 70% 1 3021 -- 1.5 31 C.(16 EbcHarck 108
1 1
LL I
93/94

MAXIMUMMO.
15 MIN.KW
DEMAND
AVERAGEMO.
KWHCONS.
LOADFACTOR
(MONTHLY15 MIN)
CAL.UNIT
DEMApWM'GS.
PERCENT OF GROSS SQUARE. FEET
y5
z
U
dV.t
'64.,'"iq:15V56i4.
tv,
>.0
f°E
i..
g1..1:5
2
'''.
i';=.
ik.
°217iii
St,..1.v,
z06,
ti
'4
°E
p
1:ig-tt.i
IL,
8..":-.'g g
'8
ACADEMIC
115 2.46
0.93
10
2
20
6
4
3
11 17
29
10
29
28
22 15 15
125 3.24 2 15 2 7 8 3 22 17 24
630 248,000 .55 2.42 1 2 1 33 12 30 19
211 2.91 2 10 1 2 7 11 18 26 2
180 45,500 .35 3.34 16 10 9 22 6 17 17 2
216 1.80 15 15 1 9 24 2 8 27
200 77,000 .53 6.45 24 23 3 3 30 17
29 2.07 18 18 3 5 18 16 20 3
38 2.43 16 4 2 50 6 19 4
32 1.73 20 14 1 9 14 8 3 28 2
112 36,000 .45 2.76 3 13 6 1 25 7 13 29 1
54 2.74 1 81 16 2
156 2.36 24 26 5 4 37 3
600 340,057 .79 4.27 1 15 2 19 62
60 15,800 .37 1.93 9 2 6 49 9 26 1
230 104,000 .63 3.77 6 6 20 11 18 34
187 2.36 8 14 2 20 13 12 29 1
120 50,500 .58 1.18 24 3 2 5 5 46 15
270 96,600 .89 1.78 17 27 4 4 5 3 2 38
150 50,000 4.64 5.30 2 3 3 11 15 68
77 25,000 .45 5.35 8 2 8 35 36 9 3
9495
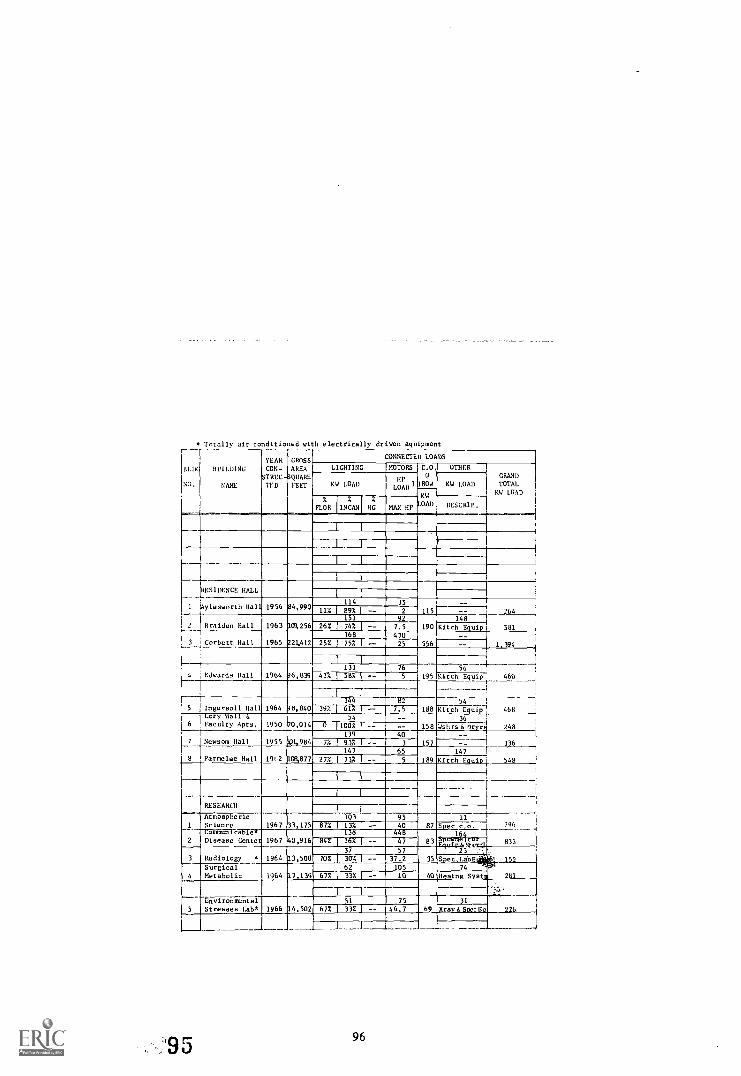
BLDC
NO.
Totally air conditioned with electrically driven equipment
YEAR GROSS
BUILDING CON- AREASTREC-iQUARE
NAME TED FEET
RESIDENCE HALL
1 Piylesworth Hall. 1956 84,990
2 Braiden Hall
,3 Corbett Hall
4 Edwards Ball
1963 109,256
1965 221.412
1964 96,839
5 Ingersoll Hall 1964 98,840Lory Hall
6 I Faculty Apts. 1950 70,0141
7 Newsom Hall 1955 101,984
8 Parmelee Hall 1962_109,877
RESEARCH
2
AtmosphericScienceCommOircablesDisease Center
1967 33,175
1967 40,916
3
4
Radiology *
Surgical .
Metabolic
1964 13,500
1964 17,139
5
EnvironmentalStresses Lab*
LIGHTING
CONNECTED LOADS
MOTORS C.O. OTHER
KW LOAD LOAD
%
FLOR% 4
INCAN HG MAX HPm1 71 1
1 1
1 1
114 35
11% I 859%1 I -- 2
9226% 1 74% I -- 7.5
368 47025% j 75% I -- 25
I I
133 76
42% 1 58%1 -- 5
I -T144 112
3911-(; 7.5
54 --
0 1100% 1 --139 40
7% 1 937. 1 -- 3
147 65
27% 1 73% I -- 5
I 1
I 1
I 1
103 9587% 1 13% 1 -- 40
138 44884% I 16% I -- 47
37 57
70% 1 30% 1 -- 37.262 105
67% ,-°-- 10
-1751 75
67% 1- 33% 1 -- 46.7
80
KWOAD
KW LOAD
DESCRIP.
GRANDTOTAL.
KW LOAD
115
190
148
Kitch Equip
264
581
556
56
1 394
195 Kitch Equip 460
54
188 Mitch Equip' 468
36 1
158 Wshrs A Dryrq 248
157 336
147
189 Mitch Equip 548
11
87 Spec c.o. 296
snnainglru r--83 833'11-q3Ster.d1,.
35 Spec-LabliaNC 15274 "1-'1
40 Heatng Svetli 281
31
1966 14,502 69 Xray&Specla 226
r- 96

MAXIMLNMO.
15 MIN.KW
DEMAND
AVERAGEMO.KWH
CONS.
LOADFACTOR
(MONTHLY15 MIN)
CAL.
UNITDEMAND
2W/FyTGSF
PERCENT OF GROSS SQUARE FEET
2
'''
.622,,tggg
re r.
2
6`'28
i''2.g,hEi
z2
,e
2"
.64
5:,.
E21d
F;.95 w
RESIDENCE HALLS
125 39,718 .44 1.475
264 72,000 .38 2.42 10 66 23
420 175,000 .58 1.90 8 61 30
152 65,000 .59 1.78 9 59 32
148 66,000 .62 1.50 9 60 30
62 20,500 .46 0.87 66 12 23
125 42,417 .47 1.23
208 70,000 .47 1.92 10 66 23
RESEARCH
115 40,000 .48 3.48 19 10 14 26 30
196 85,000 .60 4.80 9 5 19 27 41
67 15,666 .32 4.96
le
7 4 23 40 26
105 45,000 .59 6.15 6 3 30 43 18
118 25,000 .29 8.14 8 2 33 30 27
97

COLORADO STATE UNIVERSITY
YEAR GROS
LUG BUILDING CON- AREASTRUC. SQUA
NO. NAME TED FEET
SERVICEBUILDINGS
1 Heating Plant 1915 13,73
(Without Add.)2 Student Center 1962 124,92
(With AdarEion)3 Student Center 1962 253,731
4 Student Health 1964 38,45
LIGHTING
CONNECTED LOADS
MOTORS
KW LOAD LOPAD3
% 2
FLOR INCAN NGMAX HP
I
I
19 553
82 I 761 16% 250294 480
40% i 604 I -- 100687 772
54% I 46% I -- 10086 66
41% I 592 1 -- 10
I
I
F
I
1
I
I I
I
I I
I
I
I
I I
C 0 urata
180W
KW
LOAD
214
9 7;98
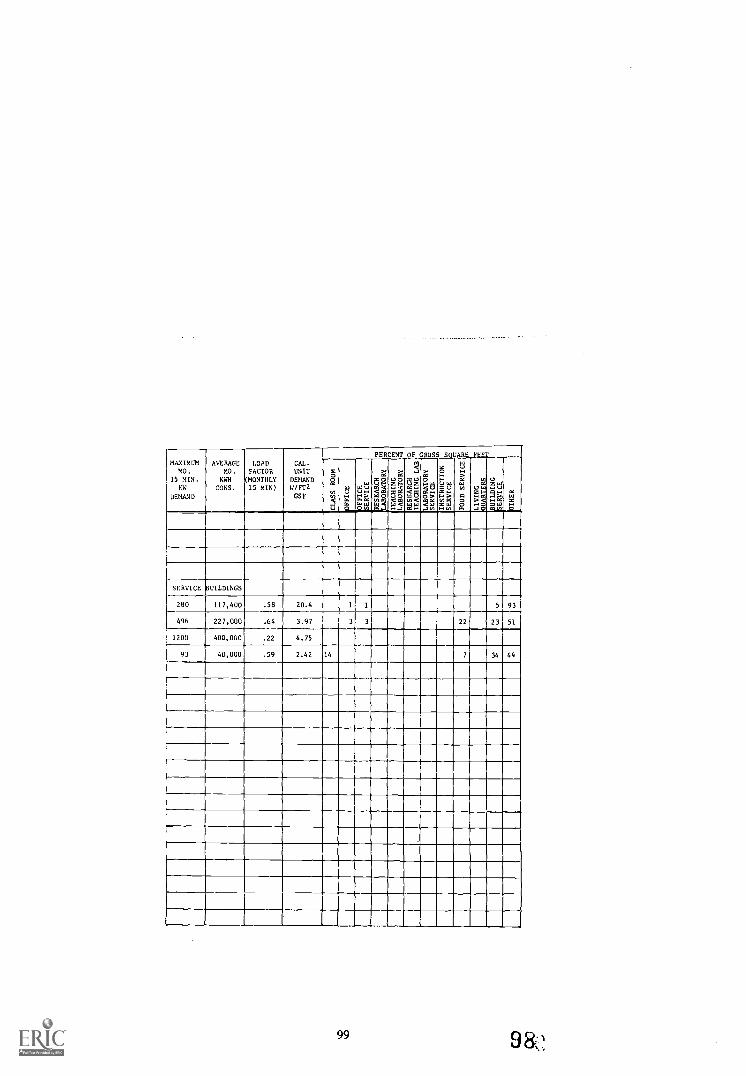
MAXIMUMMO.
15 MIN.KW
DEMAND
AVERAGEMO.
KWH
CONS.
LOADFACTOR
(MONTHLY
15 MIN)
CAL.
UNIT
DEMAND
WIFT2GSF
PERCENT OF
'6 2
v, .cW
GROSS
tc.
,.9 wv-
e,e
SQUARE
z
dim.
P42t., ,>.
''
5El
wgR
FEE:
hi
2,25 .4
;", a
5 ,`,-..'
g te,
=
8
z
E
,.,
i3
17:
8
...'6'2
8 ','
ra
3?'4g
W
5
rc.
2E.°RA..
tti .,
SERVICE BUILDINGS
280 117,400 .58 20.4 1 1 5 93
496 227,000 .64 3.97 3 3 22 23 51
1200 400,000 .22 4.75
93 40,000 .59 2.42 14 7 34 44
99

PHYSICAL PLANT ORGANIZATIONS INUNIVERSITIES AND COLLEGES
By
Harry F. Ebert
Harry F. Ebert has been a member of APPA since 1961. He is amember of the Central States Regional Association. He is editor of theCentral States Regional Association Newsletter.
He holds membership in the American Association MechanicalEngineers, American Association Refrigeration and Air ConditioningEngineers, Texas Association of Professional Engineers, NationalAssociation of Professional Engineers and the Honorary: Pi Tau Sign:a.
Since 1961 he has presented 17 papers to various organizationsconcerning Physical Plant Organization, Plant Maintenance, PlantOperation and Budget Preparation. In addition to these accomplishmentshe has also served with distinction on several APPA committees.
Management of physical plant organizations is a frequentlyand rather thoroughly discussed subject. It is necessary toresearch only briefly in the literature to find this is a verygeneral subject and that a great store of information has beenpublished even in the specific field of university and collegephysical plant management. It is necessary to do only equallybrief research in the same literature to realize that there exists avariety of definitions, principles, terms and graph symbols forwhich there is no universal agreement. However, these variationsappear to reflect only different points of view or differentbackground and experiences rather than conflicting conclusions.
3 /01 99

In order to establish a premise for the following, it shouldbe stated for purposes of this discussion that the art ofadministration is the direction, coordination, and control ofmany persons to achieve some purpose or objective. That is, anadministrator is one who directs, coordinates and controls theactivities of others. These definitions may seem too elementaryfor this occasion, but it is felt they bear repetition to emphasizethe goals and objectives of college and university physical plantadministrators.
An administrative system deals with organization, certainaspects of management in action, fiscal management, personnelmanagement, forms of action by which some persons in otherjurisdictions are regulated and with the responsibility to whichthe system is subject. The term " organization" may be used topoint out an existing arrangement of the parts of a whole. Theterm may also be used to point out the process of establishingor rearranging relationships among parts. Since every college oruniversity physical plant department in existence has anarrangement, however good or bad, it then is preferable here forpurposes of clarity to refer to "organization" as an arrangementof the parts of a whole and to "reorganization" as the processof establishing a different relationship.
It is one of the most important tasks of an administratorto apply skill and good judgment in an organization to secure anarrangement of parts that will attain maximum achievementwith available resources. A good organization and smoothoperation are inseparably connected with the effectiveness withwhich personry:1 can work. A poor organization is one in whichthe parts are not properly laid out, where there may beduplication of effort, misunderstanding of responsibility, poorcoordination and supervision, ineffective delegation, imbalance,confused purpose and responsibility and restricted achievement.Even though competent personnel may make any organizationwork, there is no sense in requiring them to work with a poorone. The point has bee!: admirably made by Prof. John M.Gaus:
"Organization is the arrangement of personnel for facilitatingthe accomplishment of some agreed purpose through theallocation of functions and responsibilities. It is the relating
1'0O':102

of efforts and capacities of individuals and groups engagedupon a common task in such a way as to secure the desiredobjective with the least friction and the most satisfaction tothose for whom the task is done and those engaged in theenterprise.
"The vital point is that structure (organization) is anarrangement of the working relationships of individuals, notmerely an impersonal process of putting blocks together tomake a building."9
This, the continuing need and desire for better physicalplant organization seems soundly justified. This continuing needand desire for better organization presents a very complexsituation. The complexity would appear to be somewhatintensified in view of a changing situation. It is in order for agood physical plant administrator to examine perpetually thequestions in his own situation:
(1) What is the mission of the physical plant department?(2) Which changes are occurring?(3) How are they occurring?(4) What is their magnitude and direction?(5) Should an attempt be made to influence these changes;
and if so, why?
The overall problem of every administrator may be simplyvisualized if he can imagine himself a marksman. When themarksman is to fire one shot from a stationary platform to afixed target through a clear range, he has a relatively simplesituation. On the other hand, it is not so simple if he is on aroughly moving platform firing continuously at an erraticallymoving target that is changing range rapidly. It isn't likely in thelatter case that all the shots will be on target, but goodmarksmen do make high scores if they don't run out of bulletsbefore the end of the contest.
It is not within the scope of any single presentation toexamine in detail all of the static and dynamic factors thataffect organization. At least one reason for not attempting suchan investigation is that all of the factors are not yet known eventhough studies in administration and organization are recorded
103

in history to have begun prior to the days of the Roman Empirewith continuing progress in the meantime. A scholarlystatement was made in 1885 by one of the first Americanwriters in the field of management that bears repeating here:
"If there be a science correlative to the art of administration,it must, like every other physical science, be founded on thecomparison of accumulated observations. Since the accuracyof the knowledge sought can be no greater than the exactnessof the data from which it is derived, in order to make aproper comparison it is important that the observations be asfree from error as possible, and that they be measured by acommon standard. Whatever be the standard ofmeasurement, it suffices for comparison if it be generallyaccepted, if it be impartially applied and if the results befairly recorded."7
While this occasion is more oratory than scientific, somecomparison of accumulated observations having a common,generally accepted base are useful even if applied to only alimited number of factors.
To limit the scope of this paper, it was somewhatarbitrarily determined that the size of institution would be usedas a common base of comparison. Previous investigations havevariously used building square feet, building cubage, studentenrollment and other measurables as a base. More recently theterm F.T.E. Enrollment has Lome to common usage. Full TimeEquivalent Enrollment is generally agreed to be determined bydividing total undergraduate semester hours by 15 and graduatesemester hours by nine. F.T.E. was selected as a base herebecause it is believed to be the most readily available at thistime.
A superficial review of the overwhelming volume of datacurrently available to determine indices of change shows themost radical measurable changes are occurring in enrollmentand capital investment in physical plant. A correlation betweenthese factors and changes in organization would be extremelyuseful in organizational planning and administration if suchcorrelation exists and can be identified. To provide current datafor study, inquiries were sent to eighty-five universities andcolleges. An attempt was made to get approximately equal
102 104

geographical distribution and a spread in sizes of schoolsoffering a general curriculum. Usable data was received fromforty of those contacted. Since specific authority forrepublication was not requested from the respondents, the datais represented here symbolically. A period of only the last 10years was used. It is felt that changes more than 10 years oldwould be of little immediate significance. It was presupposedthat the sponsorship of the school and the ultimate authority towhom the physical plant administrator reports would have asignificant affect on the organization. Therefore, inquiries weremade regarding these. The effort involved here makes onefurther assumption. That is, there is a common mission of alluniversity and college physical plant organizations. A definitionof this common mission was well stated in a recent publicationby Mr. M. F. Fifield, Director, Physical Plant Department,University of New Mexico:
"The mission of a physical plant organization is to providethe best possible facilities and climate to support theinstruction and learning program for the entire university."6
It is worth restating that the mission of a physical plantorganization is solely one of support, one that is to serve theteaching and learning 'unction,
Many of the studies made in the field of management andorganization present data in statistical and numerical forms.One of the most extensive of such studies was made by Mr. SamBrewster, Director Physical Plant Department, Brigham YoungUniversity, Provo, Utah. A complete and detailed report of thisgigantic effort is recorded in Minutes Of The Forty-SixthAnnual Meeting, The National Association of Physical PlantAdministrators Of Universities And Colleges, May 11, 1959.Another extensive study was reported by L. L. Browne in apaper recorded in Minutes Of The Fortieth Annual Meeting,The National Association Of Physical Plant Administrators OfUniversities And Colleges, May, 1953.4 Anyone interested inthe intimate details of plant operation would be well advised toinclude these reports in his bibliography. Since organizationalchanges and functional arrangements do not lend themselvesreadily to numerical expression, a graphic and pictorial schemewas selected here.
105 104

The graphic information given in Figure [ I ] illustrates, ingeneral terms, the F.T.E. growth rates in different sizeinstitutions. While it is con, nonly accepted that almost everyschool is experiencing an increase in enrollment, there is onefactor shown here that may not be common knowledge. That is,in general, the larger schools are growing at a greater rate,percentage-wise, than are the small schools. If this is aself-regenerative process, then our growth patterns are unstableand will bear watching in relation to long-terin plans. Thesignificance of this criteria is not yet clear, but it seemsworthwhile to know that the larger an institution becomes, themore rapidly it is likely to grow.
Figure [2] is a reflection of expenditures for newconstruction in two consecutive five year periods. In general,and as one might suspect, the expenditures were greater morerecently by some 25%. The causes for this increase are many.The most common of these are the escalation of unitconstruction costs, increased complexity of facilities, andincreased sophistication. Probably the most significantconclusion one might draw firm ,Figure [2] is that theinvestment in schools of 8,000 or less is quite radical whereasabove this size it is reasonably stable at a current level ofapproximately $2,000 per F.T.E. for a five year period. Whileno information is given here in support of such a conclusion,there are other data available to indicate that the extensivefederally-controlled participation in new construction financingwill establish a fairly uniform per capita investment during thelife of the federal program.
If an administrator is to attempt control and direction ofthe efforts of others, it would be useful if he could anticipatehow many others there will be. Figure [3] is an illustration ofaverage data regarding the number of physical plant employeesversus F.T.E. for a span of I0 years. The single significant factorshown in the figure is that the F.T.E. enrollment per physicalplant employee has remained nearly constant for 10 years in allsizes of schools at approximately 48.
Of all the organization charts that became available duringthis study, no two were identical nor even close thereto. Eachhas certain common elements and some had predominating
104 106

24
en z 20
0 t-16
z W 212
0 cc W as;
8 4 0
FIG
UR
EI.
AVERAGE F.T.E. ENROLLMENT vs CALENDAR YEARS
FO
R F
IVE
SIZ
E G
RO
UP
S O
F V
AR
IOU
SU
NIV
ER
SIT
IES
8 C
OLL
EG
ES
1956
1961
CA
LEN
DA
R Y
EA
RS
1S66
1966
SIZ
E G
RO
UP
,FT
E.
I-1
,462
4,98
3II
5,00
06,
369
III7,
500
9,92
0T
V11
,000
13,0
40
V15
,640
27,7
93

106
FIGURE 2.
NEW CONSTRUCTION EXPENDITURE PER F.T.E.VS
1966 F.T.E. ENROLLMENT
24
LL
ce 20.a.
rc
.J6 .
0
z01- 12 .
rco-wz0
6LLO
ce 4
S
A - AVERAGE EXP. PER STUDENT 1956-61 / 1961 F.T.E.
Et- AVERAGE EXP. PER STUDENT 1961- 66/1966 F.T.E.
I a DI rz
0 4 8 12 16 20 24
1966 F.T.E. ENROLLMENT IN THOUSANDS(AVERAGE FOR EACH GROUP SIZE
108

700
600
500
400
300
200
100
0
4
)- 75
a. 5025
755025
755025
FIGURE 3.
PHYSICAL PLANT EMPLOYEES
VS
F.T.E. ENROLLMENT
......
" . ............... . ........................ .....
A
19661961 ---1956 -
0 I2 16 20 24
F.T.E. ENROLLMENT IN THOUSANOS
109

portions similar to some others, but no two could be consideredthe same. In order to keep the scope of this collection withinpractical limits, only illustrative examples are included. A studyof all the charts available will support the general statement thatall physical plant departments, irrespective of size, haveapproximately the same fundamental responsibilities and varyonly in the degree of detail. Further support for this statementcan be found in the several C.S.R.A. and N.A.P.P.A. StandardsCommittee reports and in the survey conducted relative to thereport on Organizations and Functions of Physical PlantDepartments by Sam Brewster and in other publications. Duringa question and answer period following a paper presented at the1949 N.A.P.P.A. Meeting by Mr. Henry Pearson onOrganization of the Buildings and Grounds Department atIndiana University, the following question and answer wererecorded:
"Ries-Oberlin-1 think that in order to understand theproblem better we should have some measure of the size ofyour plant, something that would give us some notion as tothe magnitude, such as floor area.'
"Pearson-Indiana University'It makes very little differencehow big the organization is. It would make a difference ofcourse in the number of personnel, but the system wouldwork the same for a large or small organization'."
In this particular regard little, if anything, has changed inthe last 16 years.
If it can be accepted that all physical plant departments dohave essentially the same fundamental responsibilities, then whyis every organization different? The organization must beinfluenced by other than plant needs. The influence is primarilyone of people. This influence is of two kinds: one external tothe organization and another within the organization. Theseinfluences, regardless of the direction, cause distortions awayfrom the ideals. Some of the more readily apparent influencesare:
10.8 110

A. External To The Department
1. Institutional attitude and policytoward the department.
2. Personalities and background of otherdepartmental or administrative officers.
3. Role and scope of the institution.4. Local labor markets and organizations.5. Available community services and facilities.6. Source of funds.7. Competition for funds.8. Miscellaneous other.
B. Internal To The Department
1. The inherited organization.2. Tenure3. Personalities4. Availability of talents.5. Attitudes6. Competence and intellect.7. Complexity of facilities.8. Communication and transportation.9. Miscellaneous
Anticipation of some distortions in any ideal organizationchart is set forth in a statement by M. F. Fifield. He says, "Nomatter how intelligently and carefully you plan yourorganization it's not going to work quite that way because ofthe people in it."6 In summary of this point it can be said thateach situation presents a different set of circumstances and anorganization must be specially designed within the localguidelines to fit as nearly as possible the particular situation.
An examination of existing organization charts is notlikely to produce one acceptable for copy and application to asecond situation. Neither does it disclose anything approachinga standard. However, such an examination will provide anopportunity to share experiences of others and can provide abasis for better understanding fundamentals necessary for theplanning and developing the desired organization structure. The
111 109
charts shown on pages 19 to 42 are typical of some currently inuse. Those presented are only typical and not proposed as goodnor bad. It may be useful to point out some features of each.
1/2 Director assumes direct line contact with three functionaland one staff unit, and has delegated all relatedmaintenance functions to a single authority.
1/3 Similar to 1/2 except a "methods engineer" is retained attop .taff level.
1/4 A somewhat unusual combination of staff positions isretained.
1/6 Three managerial levels superimposed on .a generalline organization with staff support at lowest managerlevel only.
1/7 A conventional organization but contains the uniquestaff position "space planning analyst".
1/8 Organization chart does not indicate a responsibilityfor utilities and is strongly oriented to design andconstruction. The campus is less than five years old.
1/9 Contains a line function for property development.
11/10 Does not provide for any building maintenance byphysical plant staff.
II/11 Mechanical trades are under separate jurisdictionfrom building trades below second level ofresponsibility.
11/12 Top level administrator serves dual function andperforms in line function.
11/13 Each third level supervisor has three parallel lines ofresponsibility to top level.
11/14 Physical Plant in operational line of student housing.
110 112

11/16 Staff positions also perform line functions.
111/17 Top level supervision serves dual position andperforms as staff to non-physical plant department.
III/18 All building trades and mechanical trades under samesuperintendent with custodial also in samejurisdiction as a shop.
111/19 Exceptionally clear separation of line and stafffunctions. However, Director is in directcommunication with nine subordinate positions.
III/20 An arrangement for operating two campuses underone superintendent of buildings and grounds.
IV/23A Remodeling carried as a major function. CampusArchitect responsible for coordinating federal fundproject.
IV /24 Physical Training facilities under joint responsibilitywith physical plant.
V/26 Director of Physical Plant, through an assistant is indirect line with 13 supervisors.
V/27 Safety Engineer functions as a line officer.
V/28 Plant Planning is function of an engineering serviceinstead of architect as in usual case.
V/30 All of plant operation and maintenance line functionsare separated into architectural and engineering, eachunder an assistant director.
113
1 1 1

.P
RE
S.
I
---T
TT
T-2
-F
.T. E
.1,
462
DIR
EC
TO
RP
HY
S P
L. E
MP
LOY
EE
S60
PH
YS
. PLA
NT
NE
WC
ON
ST
RU
CT
ION
SE
CR
ET
AR
YB
OO
K-K
EE
PIN
GR
EC
OR
DS
IA
SST
.D
IR.
1Il
PH
YS
. PLA
N"!
GR
OU
ND
S a
LAN
DS
CA
PIN
G
I
UT
ILIT
IES
H.P
.IC
E R
INK
LCA
RP
EN
TR
YL
PLU
MB
ING
LP
AIN
TL
PR
EV
EN
TIV
EL
CU
SIJ
DIA
LS
EC
UR
ITY
LTR
AN
SP
MA
INT
. AN
DR
EP
AIR

IME
TH
OD
S E
NG
R .
IB
US
.M
GR
.I
L-__
T -
--J
I
SU
PE
RIN
TE
ND
EN
T
.O
F B
LDG
. a G
RN
DS
.
3F
. T. E
.2,
700
PH
YS
PL.
EM
PLO
YE
ES
108
GR
OU
ND
S
SU
PE
RV
ISO
R O
FM
AIN
T. a
OP
ER
.
CU
ST
OD
IAL
SE
RV
ICE
SG
EN
ER
AL
FO
RE
MA
NG
EN
ER
AL
SE
RV
ICE
SM
EC
HA
NIC
AL
SE
RV
ICE
SG
UA
RD
ING
FIR
E P
RO
TE
CT
ION
- JA
NIT
OR
IAL
- C
AR
PE
NT
RY
- C
LER
ICA
L-
PO
WE
R P
LAN
T-
GU
AR
DS
- M
INO
R M
AIN
T.
- :A
l NT
ING
- P
AY
RO
LLS
- E
LEC
TR
ICA
L-
FIR
E IN
SP
.
- S
PL.
AC
TIV
ITIE
S-
MA
SO
NR
Y-
ST
OR
ES
- P
LUM
BIN
G-
WA
TC
HM
EN
ME
TA
L W
OR
K-
DR
AF
TIN
G-
RE
FR
IGE
RA
TIO
N-
SA
FE
TY
INS
P.
- S
WIT
CH
BO
AR
D

CH
IEF
EN
GIN
EE
R
reT
S. w
iGR
J...
rD
IRE
CT
OR
OF
PH
YS
. PLA
NT
SE
CU
RIT
Y
E
----
I SU
PT
. OF
BLD
G E
t GR
ND
S
PLA
NT
EN
GIN
EE
R
(AS
ST
. DIR
EC
TO
R &
IC
AM
PU
S E
NG
R.
CIV
IL D
EF
EN
SE
SE
RV
ICE
S S
UP
ER
VIS
OR
- C
ON
TR
OLS
_GR
OU
ND
S M
AIN
T
- U
TIL
ITIE
S-
CU
ST
OD
IAL
-RE
FR
. a A
/C-
LAB
OR
:
-PO
WE
R P
LAN
TH
AU
LIN
G
-ST
EA
M F
ITT
ER
ST
RA
SH
CO
LL.
- M
EC
HA
NIC
SP
L. E
VE
NT
S
44,
232
MA
INT
SU
PE
RV
ISO
R
_ B
LDG
TR
AD
ES
-SP
L. T
RA
DE
S

ES
TIM
AT
OR
EX
PE
OIT
ER
GR
OU
ND
,
SU
PT
.
ICU
ST
OD
IAL
FO
RE
MA
N
r--
IB
US
. MG
R.
I
'MA
NA
GE
R O
F I
BLD
G .
aGR
ND
S.
IAS
ST
.MGR.
AS
ST
. TO
MG
R.
6
F.T
.E.
4,49
3P
HY
S. P
L E
MP
LOY
EE
S16
0
.---
-IO
FF
ICE
SU
PV
.
IGE
NE
RA
LF
OR
EM
AN
PO
LIC
E 1
SU
PP
LYO
FF
CA
MP
US
RE
C. a
INS
T.
CA
PT
.F
OR
EM
AN
PR
OP
TY
. SU
PE
RV
.S
TO
RE
S S
UP
ER
V.
- E
LEC
. FM
N.
ME
CH
.F
MN
PA
INT
FM
N.
- C
AR
P. F
MN
.
- H
TG
- A
/C F
MN
-PO
WE
R P
LAN
T

..
DO
I
SP
AC
E P
LAN
NIN
GA
NA
LYS
T
DIR
EC
TO
R1
DIR
EC
TO
R O
FI
FIN
AN
CE
II
...!
7
IF
T. E
4,57
7a
PH
YS
PL.
EM
PLO
YE
ES
81
DIR
EC
TO
R O
FP
HY
SIC
AL
PL
AN
T
OF
FIC
E
MA
INT
EN
AN
CE
EN
GIN
EE
R
IPA
INT
ING
8
IG
LAZ
ING
FD
ING
SH
EE
T M
ET
AL
AC
AR
PE
NT
RY
SU
RV
EY
ING
8D
RA
FT
ING
GE
NE
RA
LS
ER
VIC
E
TR
UC
KIN
GM
AIL
DE
LI V
ER
Y
(CU
ST
OD
IAL
SE
RV
ICE
WIN
DO
W S
HA
.K
EY
8 L
OC
KS
TR
7fE
X--
1T
.E
QU
IPT
.
GR
OU
ND
SS
UP
ER
INT
EN
DE
NT
GR
OU
ND
S8
RO
AD
S
TR
AS
HD
ISP
OS
AL
CA
MP
US
PO
L C
E
WA
TC
HM
AN
SE
RV
ICE
ME
CH
AN
ICA
LE
NG
INE
ER
PLU
MB
ING
8H
EA
TIN
G
ELE
CT
RIC
AL
PO
WE
RP
LAN
T
AIR
CO
ND
. 8C
ON
TR
OLS

I BU
S. M
GR
.
DIR
EC
TO
R O
FP
HY
S.P
LAN
Ta
CA
MP
US
AR
CH
.
IAS
ST
. DIR
EC
TO
R P
HY
9. P
L.I
L O
FF
ICE
MA
NA
GE
R
SE
C.1
F. T
. E.
B
4,95
7
LAS
ST
. CA
MP
US
AR
CH
.I
CH
. EN
GR
.-
AC
CO
UN
TS
CO
NS
T.
SU
PE
RV
.
CU
ST
OD
IAL
SU
PE
RV
.-
CLE
RIC
AL
- S
R. A
RC
H.
GR
OU
ND
S S
UP
ER
V.
-- S
EC
RE
TA
RIA
L-
FU
RN
ITU
RE
AN
ALY
ST
PO
LIC
Y O
NLY
OF
F C
AM
PU
S B
LDG
. SU
PE
RV
.-
LAN
DS
CA
PE
AR
CH
.
BLO
G. M
AIN
T. S
UP
ER
V.

BU
S.
; BU
S. M
GR
. ,JS
UP
T.
OF
BLD
GS
GR
ND
S
1 9
F. T
. E .
4 , 9
83P
HY
S. P
L . E
MP
LOY
EE
S11
5
ST
EN
OG
RA
PH
ER
AS
ST
.T
O S
UP
T.
MA
INT
.a
RE
MO
DE
L
- A
DM
AS
ST
S.
- C
LER
ICA
L
[GE
NE
RA
L F
OR
EM
AN
- B
LDG
. TR
AD
ES
- M
EC
H. T
RA
DE
S
- G
RO
UN
DS
- T
RA
NS
PO
RT
AT
ION
AS
ST
. TO
SU
PT
.A
SS
T. T
O S
UP
T.
PP
TY
.D
EV
ELO
PM
EN
TS
AN
ITA
TIO
N ,
SE
CU
RIT
Y
- A
DM
. AS
ST
.-
CU
ST
OD
IAL
- D
RA
FT
SM
EN
- W
AT
CH
ME
N
- V
EH
ICLE
S
I
AS
ST
. TO
SU
PT
.P
OW
ER
PLA
NT
OP
R.
AS
ST
. CH
.E
NG
R.
ri LPLA
NT
OP
ER
AT
OR
S

ST
EN
OG
RA
PH
ER
DE
AN
OF
AD
MIN
IST
RA
TIO
NI
-T -
IDIR
EC
TO
R P
HY
SIC
AL
PLA
NT
I
I
10F
. T. E
.5,
000
PH
YS
. PL.
EM
PLO
YE
ES
56
CA
MP
US
SE
CU
RIT
Y
PO
LIC
EM
EN
WA
TC
HM
EN
SU
PE
RV
ISO
RC
US
TO
DIA
L
LEA
DM
AN
CU
ST
OD
IAN
S
.aU
PE
RV
ISO
RE
NG
INE
ER
EN
GIN
EE
RS
SU
PE
RV
ISO
RU
T1L
I T
YG
RN
I,..?
UT
I LIT
YG
RO
UN
DS
ME
N
PA
RK
ING
ME
TE
RS
ER
VIC
E
PA
RK
ING
'VT
R.
RE
PA
IRM
AN
MA
INT
EN
AN
CE
SU
PP
LIE
S
ST
OR
ER
OO
MA
TT
EN
DA
NT

IB
US
.M
GR
.1-
.
SU
PT
.O
F B
LDG
S.a
GR
ND
S.
HE
AD
CU
ST
OD
IAN
'AS
ST
. CU
ST
N.
1
JAN
ITO
RS
-- M
AID
S
OF
F. M
GR
.
EC
LER
ICA
L
PE
RS
ON
NE
LR
EC
OR
DS
ME
CH
AN
ICA
LS
UP
T.
AS
ST
. SU
PT
. OF
BLD
GS
. a G
RN
DS
.G
RO
UN
DS
SU
PT
.
EM
EC
H. T
RA
DE
S
PO
WE
R P
LAN
T
i
II
F. T
. E .
5,15
9
LAB
OR
FO
RE
MA
N
GR
OU
ND
SLA
BO
R P
OO
L
_ C
AR
ET
AK
ER
TR
AN
SP
OR
TA
TIO
N
CO
NS
TR
UC
TIO
NS
UP
T.
BLD
G. T
RA
DE
S

PR
ES
IDE
NT
I
T T IS
UP
ER
INT
EN
DE
NT
OF
BLD
G. 8
GR
ND
S.
AN
DC
HIE
F E
NG
INE
ER
IB
OA
SS
T.
SU
PT
.G
Sa
GR
ND
S.
I 1 12F
. T. E
5,57
1P
HY
S.P
L. E
MP
LOY
EE
S47
ISE
CR
ET
AR
Y
MA
INT
EN
AN
CE
FO
RE
MA
N
CO
NS
TR
UC
TIO
NF
OR
EM
AN
- B
LDG
. TR
AD
ES
ME
CH
. TR
AD
ES
- G
RO
UN
DS
- T
RA
NS
PO
RT
AT
ION
CU
ST
OD
IAL
FO
RE
MA
N
- C
US
TO
DIA
NS
SE
CU
RIT
Y
EP
AT
RO
LME
N
WA
TC
HM
EN
PO
WE
R P
LAN
TE
NG
INE
ER
LCE
NT
RA
L S
TA
.O
PE
RA
TO
RS

MU
G. M
GR
. e
CIV
IL D
EF
EN
SE
CO
OR
DIN
AT
OR
]
SU
PE
RV
ISIN
G E
NG
R.
DIR
EC
TO
R
II
13F
. T. E
.6,
203
CO
ST
AC
CO
UN
TA
NT
UN
IVE
RS
ITY
AR
CH
ITE
CT
SU
PV
R. U
T IL
IT E
S
SU
PE
RV
ISO
RO
FG
RO
UN
DS
SU
PE
RV
ISO
RM
A IN
T. /
3CONSTRUC.
SU
PE
RV
ISO
RE
LEC
T/3
ME
CH
AN
ICA
L
SU
PE
RV
ISO
RO
FP
OW
ER
PLA
NT
SU
PE
RV
ISO
RO
F J
AN
TO
RIA
LS
ER
VIC
ES
SU
PE
RV
ISO
RA
UX
ILIA
RY
SE
RV
ICE
S
FO
RE
MA
NG
EN
ER
AL
FO
RE
MA
N-
LAB
OR
-C
AR
PE
NT
RY
_ F
OR
EM
AN
ELE
C.
_ P
OW
ER
PLA
NT
_ F
OR
EM
EN
OF
_ A
IRP
OR
TF
OR
EM
AN
FO
RE
MA
NJA
NIT
OR
SS
AN
ITA
TIO
NP
AIN
TF
OR
EM
AN
RE
F.
SE
WA
GE
PLA
NT
HO
US
EK
EE
PE
RR
EN
TA
L P
RO
PF
OR
EM
AN
-_L
AB
OR
ER
S-
FU
RN
ITU
RE
_ F
OR
EM
AN
PLU
MB
._.
FIR
E D
EP
T.
JAN
ITO
RS
_SE
RV
S. S
TA
.
A...
BLD
G .
8 G
RN
DS
.S
TO
RE
S

AS
ST
. TO
PR
ES
.
SU
PT
. OF
PH
YS
. PLA
NT
II
15F
. T. E
.6,
800
PH
YS
. PL.
EM
PLO
YE
ES
88
PO
WE
R P
LAN
T8
AIR
CO
ND
.LG
RO
UN
DS
LAN
DS
CA
PE
8S
EC
UR
ITY
PA
TR
OL
GE
NL.
OF
FIC
E
- C
ON
ST
RU
CT
ION
- P
AIN
TIN
G
-CA
RP
EN
TR
Y
-ELE
CT
RIC
AL
-PLU
MB
ING
RE
FR
IGE
RA
TIO
N
ID
OR
MS
MA
RR
. ST
UD
EN
TH
OU
SIN
GS
AF
ET
YC
US
TO
DIA
L
INV
EN
TO
RY

LSE
CR
ET
AR
Y1
IP
RE
SID
EN
TI
L--
- , -
-J
IDI R
EC
TO
R O
FP
HY
S. P
LAN
T
PE
RS
ON
NE
L R
EC
OR
DS
RE
PO
RT
S
CA
MP
US
MA
IL
!ST
OR
EK
EE
PE
R
SU
PP
LIE
S
TR
AU
SP
OR
TA
TIO
N
II
16
F. T
. E .
6,96
9
CU
ST
OD
IAL
SE
RV
ICE
CU
ST
OD
IAN
S
MA
IDS
E
BU
ILD
ING
MA
INT
EV
AN
CE
TR
AD
ES
LAB
OR
ER
S
UT
ILIT
Y M
EN
SE
CU
RIT
Y a
PA
RK
ING
GR
OU
ND
S
MA
INT
EN
AN
CE
PA
TR
OL
8 W
AT
CH
ME
NG
RO
UN
DS
ME
N
PA
RK
ING
FA
CIL
ITIE
ST
RA
SH
DIS
P.

RE
AL
ES
TA
TE
CLA
SS
IFIE
DC
ON
TR
AC
TS
RA
DIO
AC
TIV
EM
AT
ER
IALS
-
rP
RE
SID
EN
TI
II
I
LJ
F. T
. E
. 7,5
00P
HY
S. P
L. E
MP
LOY
EE
SI9
0
DIR
EC
TO
RP
HY
S. P
LAN
T
CH
IEF
TE
LEP
HO
NE
IS
UP
T.
OP
ER
AT
OR
BLO
GS
.aT
RA
DE
SD
IRE
CT
OR
EN
GR
. SE
RV
SL
GS
UP
T.
RN
DS
.B S
ER
VS
.
TE
LE. C
OM
MU
NIC
AT
ION
ST
RA
DE
SH
OP
SS
EC
UR
ITY
CO
NS
TR
. MA
NA
GE
MT
.B
LDG
. MA
INT
.C
US
TO
DIA
LE
NG
INE
ER
ING
UT
ILIT
IES
PLA
NS
&R
EC
OR
DS
GR
OU
ND
S M
AIN
T.
PLA
NN
ING
aD
EV
ELO
PM
EN
TF
UR
NIT
UR
ED
ES
IGN
Be
SP
EC
IFIC
AT
ION
SD
EC
OR
AT
IVE
SE
RV
S.
TR
AN
SP
OR
TA
TIO
N
ST
EA
M E
NG
INE
ER
HE
AT
ING
&V
EN
TIL
AT
ING
ST
EA
M P
LAN
'
ST
EA
M F
ITT
ER
SS
HO
PS
TE
AM
DIS
T

CO
MP
TR
OLL
ER
1
DIRECTOR
OF
PH
YS
. PLA
NT
II
I
18F
. T.E
.7,
540
PH
YS
.PL.
EM
PLO
YE
ES
256
OF
FIC
EM
AN
AG
ER
SU
PE
RIN
TE
ND
EN
TS
UP
ER
INT
EN
DE
NT
PLA
NT
SU
PE
RIN
TE
ND
EN
TO
F G
RO
UN
DS
OF
BU
ILD
ING
SE
NG
INE
ER
OF
PLA
N .
8 E
NG
R.
- G
RO
UN
DS
CA
RE
- P
AIN
T S
HO
PS
TE
AM
PLA
NT
- E
NG
INE
ER
ING
- LA
BO
R P
OO
L-
CU
ST
OD
IAL
SE
RV
S.
- F
ILT
ER
PLA
NT
- P
LAN
FIL
ES
- M
OT
OR
PO
OL
- LO
CK
SM
ITH
-WA
ST
E T
RE
AT
ME
NT
- W
OR
K O
RD
ER
PLA
NN
ING
- C
AR
PE
NT
EN
SH
OP
-A/C
8 R
EF
R. S
HO
PS
- S
HE
ET
ME
TA
L S
HO
P-E
LEC
TR
ICA
LS
TE
AM
- P
ES
T C
ON
TR
OL
WA
TE
RD
IST
. SY
ST
EM
S-
ELE
CT
RIC
AL
8 M
ET
ER
ING
PLU
MB
ING
ST
EA
M F
ITT
ING
8 W
ELD
ING
SH
OP
S
LC
HIE
FO
F S
EC
UR
ITY
- P
OLI
CE
- N
ICH
T W
AT
CH
MA
N
- F
IRE
DE
PT
.
- S
AF
ET
Y 8
SE
CU
RIT
YS
YS
TE
MS

EN
G' N
EE
RIN
G
CO
MF
(R
OLL
ER
I
DIR
EC
TO
R O
FP
HY
S. P
LAN
T
III 19F
T. E
9,85
0P
HY
S. P
LEM
PLO
YE
E S
220
SU
RP
LUS
PR
OP
.
OF
FIC
E O
FSECT.
SA
FE
TY
CO
MM
.
EX
TE
NS
ION
PR
OP
ER
TIE
S
CO
MM
UN
ICA
TIO
NS
CO
OR
D
CO
NS
TR
UC
TIO
N 0
LU
TIL
ITIE
SM
AIN
TE
NA
NC
E
CA
RP
EN
TR
Y
1- P
LUM
BIN
G
PA
INT
ING
,MA
SO
NR
Y
- E
LEC
.a
RE
F.
ME
CH
. MA
INT
.
- F
IELD
CO
NS
T.
- G
RO
UN
DS
MA
INT
.
- C
EN
TR
AL
ST
A.
- W
AT
ER
PR
OD
.
- C
EN
TR
AL
UT
IL.
CO
NT
RO
L
CA
MP
US
SE
RV
ICE
S
[MO
TO
R P
OO
L
CU
ST
OD
IAL
CKEYS
sLO
CK
S
LS
PE
C. E
VE
NT
S

1\r
V. P
RE
s.III
00F
. T
. E .
9, 9
20P
HY
S. P
L. E
MP
LOY
EE
S25
0S
UP
T. O
FB
LDG
S.a
GR
ND
S.
SA
FE
TY
SU
PV
.
'SE
CR
ET
AR
Y
[AS
ST
. SU
PT
. OF
BLD
GS
.a
GR
ND
S
HC
EN
TR
AL
H T
G
Ia
A-C
PLA
NT
CO
NS
T. S
UP
VR
.
INS
PE
CT
OR
S-
INS
PE
CT
OR
S
PH
YS
. PL.
SU
PV
RC
AM
PU
S A
MA
INT
. DIV
.
BLD
G. T
RA
DE
S
ME
CH
. TR
AD
ES
TR
AN
SP
OR
TA
TIO
N
LAB
OP
PO
OL
PH
YS
. PL.
SU
PV
R.
CA
MP
US
A
SE
RV
ICE
S
[CU
ST
OD
IAL
SE
CU
RIT
Y
LS
PL.
EV
EN
TS
IP
HY
S. P
L. S
UP
V.
CA
MP
US
BM
AIN
T.
aS
ER
V.
GR
OU
ND
S M
AIN
T.
CA
MP
US
A
- M
A IN
T. T
RA
DE
S-
GR
OU
ND
SM
EN
SE
RV
ICE
S
- G
RO
UN
DS

r---
--D
EA
N O
FA
DM
INIS
TR
AT
ION
L ...
..T
OIR
EC
TO
R
SE
CR
ET
AR
Y I
I v 22
F T
E12
,500
MA
INT
. 8 O1-
PE
RS
.'
'PH
YS
. PLA
NT
SU
PT
. III
PH
YS
. PLA
NT
SU
PT
. II
SE
CR
ET
AR
Y
... WI
EN
GIN
EE
RIN
G__
Ir
HE
AT
IN3
II
1 C
AM
PU
SB
GR
OU
ND
S.1
I
BU
ILD
ING
RE
PA
IRS
a1
CO
NS
TR
UC
TIO
N
1
'ELE
CT
RIC
AL
RE
PA
IRS
&1
CO
NS
TR
UC
TIO
N
IM
EC
HA
NIC
AL
RE
PA
IRS
a C
ON
S T
P.U
CT
ION
II
IP
AIN
TIN
GI
1
(MA
INT
EN
AN
CE
RE
PA
IRS
B L
AB
OR
CR
EW
1
IS
HO
PS
I
1
PLA
NN
ING
a C
ON
ST
R.
SE
RV
ICE
SI
I SU
PT
. OF
SE
RV
ICE
S--
11
OF
FIC
Err
tiGIN
EE
RA
RC
HIT
EC
TI
ID
ELI
VE
RY
SE
RV
ICE
1
Ir
,
LD
EP
T. O
FA
RC
H.
IS
TO
RE
SI
SE
CR
ET
AR
Y
IC
ON
ST
R .I
NS
PE
CT
.1
l TE
AC
HIN
G /
, t____
___1
TE
LEP
HO
NE
CO
NS
TR
. CLE
RK
_JI
SU
PE
RIN
TE
ND
EN
T o
rP
LAN
NIN
G 8
CO
NS
TR
.
LAN
DS
CA
PE
PLA
NN
ING
i LA
ND
SC
AP
E A
RC
H.)
DR
AF
TIN
G
IALT
ER
AT
ION
S T
OE
XIS
TIN
G S
TR
UC
TU
RE
S
CA
MP
US
PLA
NN
ING
PR
OG
RA
M
IJA
NIT
OR
IAL
IP
LAN
T S
EC
UR
ITY

PR
V P
RE
SLa
TR
EA
S.
-J_
DIR
. OF
IP
HY
S P
LAN
T
IV 23A
FT
E1
2,62
0P
HY
S P
L E
MP
LOY
EE
S 2
72
C
AS
ST
. DIR
. 1
EM
I
IBLD
G. M
AIN
T.
SU
PV
.'S
UP
VR
EM
OD
EL
IIE
bin
:oP
ER
. I[C
RSU
PV
.D
S.M
AIN
T.
-1 S
EC
. IS
EC
CU
ST
SE
RV
.
BLD
G. O
PE
R.
BLO
G.T
RD
S-B
LDG
.TR
DS
.P
ES
T C
ON
TR
L.M
EC
H. T
RD
S-
ME
CH
. TR
D S
.
LAB
.PC
OL
SP
L.C
ON
TR
.
SP
L E
VE
NT
SR
EP
RS
. a
SE
T U
PR
EM
OD
EL,
LOC
KS
MIT
H
-AU
TO
MA
INT
.
- R
DS
PR
KG
.W
LK.M
AIN
T.
- T
RA
SH
DIS
P-I
MP
L. M
AIN
T.
TR
EE
MA
INT
GR
DS
FO
RE
. I
-GR
EE
NH
sE.a
NU
RS
.OP
R.
GR
DN
S. L
AW
N,
BP
L A
NT
MA
INT
.
-,R
EC
OR
DS
8R
EP
OR
TS
-CE
NT
. ST
A.O
P-P
UR
CH
.U
TIL
. DIS
T. a
CO
NT
RO
LR
AT
E S
TU
DY
5 C
ON
TR
OL
'CA
MP
US
AR
CH
BU
S.O
PE
RS
UP
V[C
ON
TR
.I
CO
NS
TR
.
-RE
CO
RD
S 8
RE
PO
RT
S-
MT
LS. P
RO
C.
- P
HY
S. P
L.S
TO
RE
S-P
AY
RO
LLS
- B
UD
GE
TC
ON
TR
OLS
- P
HY
S. P
L.E
OP
T IN
V.
- M
OT
OR
PO
OL
CA
MP
US
PLA
NN
ING
-CO
NT
R.A
8ES
ER
VIC
ES
-FE
D F
OLD
C 0
Hu
(-IN
SP
EC
TIO
N
AR
CH
.
EN
GR
CIV
IL
AR
CH
.
[SM
ALL
NE
WC
ON
S T
.
AR
CH
EN
GR
.D
RA
FT
. SE
RV
.R
EC
. MA
P P
L A
NF
ILE
SE
C.]
SE
CU
RIT
YS
UP
V.
HS
EC
. IT
RA
FF
ICS
PA
RK
CO
NT
PO
LIC
E 8
WA
TC
HM
EN
CO
NT
R. R
EP
RS
. FIR
E P
RE
V8
RE
MO
DE
L S
AF
ET
Y
1LA
ND
SC
. AR
CH
I
DE
SIG
N
PLA
N
CO
NT
RA
CT

V P
RE
S a
I BU
S. M
GR
.
- _-
r. _
_J
DIV
. OF
PH
YS
. ED
. aA
TH
LET
ICS
SU
PT
. OF
PH
YS
. PLA
NT
PH
YS
. ED
. aP
HY
S. P
LAN
TB
LDG
. a G
RN
DS
. MIN
T.
INT
ER
CO
LLE
GIA
TE
[G
EN
L. O
FF
.A
SS
T. S
UP
T.
CO
OR
DIN
AT
OR
AS
ST
. SU
PT
.
GR
ND
S. M
AIN
T.
SH
OP
S
PH
YS
. ED
. FA
CIL
.-
CO
MM
UN
ICA
T O
NS
MA
INT
.
- IN
T. C
OLL
AT
HL.
FA
CIL
.-
PA
YR
OLL
SG
RN
DS
ME
NT
RA
DE
S
-I N
TR
AM
UR
ALS
FA
CIL
.-
PE
RS
. RE
CO
RD
S
- R
EC
. FA
CIL
.-
RE
CO
RD
S a
RE
PT
S.
- P
HY
S. P
L S
TO
RE
S CO
NS
T. P
LAN
NIN
GA
SS
T. S
UP
T.
PH
YS
. PL.
PLA
N.
INS
PE
CT
ION
CO
NT
RA
CT
CO
NS
T. I
F. T
E
BLD
G.
MA
INT
.
CU
ST
OD
IAL
IV 24 12,8
00
UT
I LI T
IES
AS
ST
. SU
PT
.
_IC
EN
TR
AL
ST
A .
IST
RI B
UT
ION
1

I SE
C. B
ST
EN
O
V P
RE
S
IDIR
EC
TO
RO
FP
HY
S P
LAN
T
AS
ST
. DIR
C E
F7C
Z1
V 26F
T E
15,6
40P
HY
S P
L E
MP
LOY
EE
S 4
63
ii
FIR
E C
H
ISU
PV
.PO
WE
R
PL
IS lu
iPi
SU
PV
II N
NT
TIo
Nv
-IC
AP
T.
II C
H. E
NG
RI
IF
OR
E.
-I C
AP
T.
I-I
HE
AT
ING
PL
I-
{AS
ST
. FO
RE
. I
-I IN
SP
EC
TO
RS
-IC
HIL
L. P
L.I
[PA
INT
ER
S
,L[
AS
ST
. FO
RE
. I-I
CN
.ST
A.M
AIN
T.1
PA
INT
ER
S
LAB
OR
ER
S
AC
CO
UN
TA
NT
CLE
RIC
AL
II
EN
GR
AS
ST
SU
PV
PLU
MB
HE
AT
ING
- D
ES
IGN
B IN
SP
-I P
LUM
B.
I
- D
RA
FT
ING
-CLE
RIC
AL
SU
PV
. BLD
GC
ON
ST
BM
AIN
TS
UP
V E
LEC
DIS
TR
.
Min
FO
RE
.
CA
RP
BLA
B.
- M
AS
ON
AS
ST
.
CLE
RIC
AL
FO
RE
(3)
I
-LIN
EM
EN
-ELE
CT
RIC
IAN
SI
CUSTODIANS
- LO
CK
SM
ITH
GA
RD
EN
ER
S-E
LEV
.MA
INT
.E
LEC
T.
LA B
OR
ER
S
EO
UIP
OP
.
HA
ULI
NG
AU
TO
SE
RV
.
FO
RE
L C
US
TO
DIA
L
SU
PV
RO
AD
SR
OO
FIN
G
FORE.
I
-IA
-C O
PE
R. J
I AS
ST
.FO
RE
.I
[-I
RE
' 1. M
AIN
T. I
AU
TO
MA
INT
.
CE
ME
NT
FIN
.
ME
TA
LSM
IT H
[RO
OF
ER
S
PA
RK
ING
MT
R
HE
AV
Y E
0 O
PI
PO
LIC
EC
HIE
F
CLE
RK
SE
iDE
SK
SG
T
SP
L O
FF
ICE
R
CA
PT
.I
LLT
S(4
)L
PO
LIC
E

PR
ES
IDE
NT
IDI R
EC
TO
R
L1
OF
PH
YS
. PL
AS
ST
CH
RE
CT
OR
V 27F
.T.E
.18
718
PH
YS
.PLE
MP
LOY
EE
S36
2
SA
FE
TY
EN
GR
SE
CU
RIT
YS
UP
ER
(..,c
F IC
ES
UP
ER
CO
ST
AC
CT
.S
UP
VO
PR
SU
TIL
EN
GR
.P
LAN
NIN
GC
HIE
F
SA
FE
TY
(.11
TR
AIN
ING
SU
PE
R.
OE
MO
LIT
ION
LLA
NO
AC
O.
TE
LE.S
ER
V.
CA
RP
.F
OR
E.
ELE
CF
OR
EP
LUM
B.
FO
RE
.
SH
OP
- P
OLI
CE
- S
EC
- F
IRE
PR
EV
. - S
TE
NO
- P
AR
KIN
G-
PA
YR
OLL
S(
GA
RA
GE
MG
R.
PA
INT
FO
RE
LAB
OR
FO
RE
.E
N R
EP
R.
FO
RE
.
CU
ST
SU
PR
PO
WE
R P
L.!
+T
L.D
IST
. 1
GR
ND
S.
SU
PR
.
JAN
ITO
RS
-TR
AS
H H
AU
L
-SP
L.C
RE
WS
-M
AIL
OE
L
-FR
EIG
HT
-LA
ND
SC
AP
E M
AIN
T.
AR
CH
BLD
G IN
SP
DR
AF
TIN
G
- E
NG
R.
LSU
RV
.

AD
MIN
IST
RA
TIV
EA
SS
IST
AN
T
BU
S. M
GR ..J
Di R
EC
TO
RP
HY
SIC
AL
PLA
NT
FE
?7,!0
0
PH
YS
PL
EM
PLO
YE
ES
667
PL
SE
CU
RIT
Ya
CA
RE
TA
KIN
GO
FF
ICE
R
1
IC 0
MM
T U
RN
A IN
CsA
pT I
ON
S
OF
FIC
ER
PLA
NT
EN
GIN
EE
RIN
GO
FF
ICE
R
PLA
NT
MA
INT
EN
AN
CE
OF
FIC
ER
MG
R. O
FM
GR
. OF
MG
RO
FM
GR
OF
MG
R O
FM
GR
OF
PA
RK
ING
SE
CU
RIT
YF
AC
ILS
EN
GIN
EE
RIN
GM
AIN
TE
NA
NC
EM
AIN
TE
NA
NC
ED
ES
IGN
PLA
N.
RE
CO
RD
SH
EA
LTH
SC
S.
GE
N C
AM
PU
S
MG
R. O
FC
US
TO
D.
MG
R. O
FM
GR
OF
CA
RE
UT
ILIT
IES
GN
OS
. CA
RE
MA
NA
GE
R O
FM
GR
. OF
MG
R. O
FM
GR
. OF
CO
MM
UN
ICA
TIO
NS
OF
F C
ES
ER
V C
ES
TR
AN
SP
OR
.S
ER
VIC
ES
CE
N.S
HO
PS
El T
RA
DE
S

V. P
RE
S.
- -
-1T
---
ID
IRE
CT
OR
IP
HY
S P
LAN
T
V30
-F
E 2
7,79
3P
HY
S P
l. E
MP
LOY
EE
S 7
01
AS
ST
. DIR
EC
TO
R
[SA
FE
TY
BS
EC
IS
UP
T.
BLD
G.S
ER
V.
SU
PT
- P
RO
TE
CT
ION
- T
RA
DE
S S
HO
PS
- IN
S.I3
SA
FE
Tr-
ELE
CT
RO
NIS
HO
PCS
- P
OLI
CE
-SP
L P
RO
J.
- F
IRE
CH
.-P
ES
T C
ON
T.
- T
RA
FF
IC-
PA
RK
ING
Ci3
C.1
1
-CU
ST
OD
IAL
-SP
L. S
ER
V.
-TR
AS
H R
EM
.
-RE
LAM
PIN
G
-SP
L.C
LNG
.P
RO
JEC
TS
[G
RO
UN
DS
SU
PT
-LA
ND
SC
AP
E D
ES
IGN
- LA
ND
SC
AP
ING
-HA
RD
SU
RF
MA
INT
.
-LA
ND
SC
AP
E M
AIN
T
AS
ST
. DIR
EC
TO
R
I_C
ON
ST
RS
UP
TU
TIL
ITIE
SS
UP
T
-CO
NT
RO
NS
PR
AIN
sPO
F S
TE
AM
CO
NT
R R
EP
RE
LEC
.a
RE
HA
B iN
SP
WA
TE
Ra
SU
PV
CO
NT
RO
L A
IR
PI-
IY.P
L O
FF
ICE
MG
R.I
PA
BX
1ELE
.SY
ST
EM
- A
CC
OU
NT
ING
- P
AY
RO
LL
- B
UD
GE
T C
ON
TR
OL
- U
TIL
ITY
BIL
LIN
G
- C
LER
ICA
L
HE
AT
ING
, AC
SU
PT
!PLA
NN
ING
SU
PT
.
-HE
AT
ING
SH
OP
-A
RC
H
-RE
FR
IG S
HO
P -
CIV
IL E
NG
R-O
P. &
MA
INT
-ES
TIM
AT
ING
A-C
B R
EF
RS
YS
TE
MS
- M
EC
H E
NG
R

Individual reactions to information given here are almostcertain to vary widely. These variations are almost with equalcertainty to be a ref:ection of different circumstances orindividuals rather than fundamental disagreements. In anyevent, the information is presented for individual study with theintention that it may contain some helpful and thoughtprovoking suggestions.
1:36
I. Because of the demand for growth in everyinstitution, there is a recent increase in campusplanning effort but fewer than haif of the physicalplant departments participate in design and planningof facilities.
Even though many contract maintenance services arecurrently available, there is still no extensive use ofthem in universities and colleges.
3. There are some physical plant departments nowproviding highly technical services such as electronicand instrument repairs, elevator maintenance,business machine repairs, research and prototypeshops where these were almost non-existent 10 yearsago.
4. Approximately half of the institutions separatemaintenance forces into two general categories ofbuilding trades and mechanical trades, each underseparate supervision. The other half combines themunder single line supervision. This appears to he anarea of management that has not been sufficientlymastered as to produce a singularly preferredarrangement.
5. There appears to be a trend toward removal ofcampus security from physical plant jurisdiction.
138

Some of the conclusions that may be drawn from this surveyare:
1. There is no apparent relationship between theorganizational charts and school sponsorship (i.e.state, church, private, other).
2. A large majority of the physical plant administratorsreport to a university official whose primary concernis finance. Only a small per cent report to the senioruniversity administrator.
3. There are some rea 'ily available and measurablechange indices in university growth patterns, but theones used here do not correlate with any specificpatterns of organizational structure.
4. t s long as organizational structure continues to befr.imed around people, and more specifically aroundindividuals, it is not likely that a generally applicableor standard organization chart will be possible.
As a general summary and conclusion, it is indicated thatthe demand for technical and professional competence inphysical plant administration is greater than ever before. Thesedemands are accentuating the managerial and administrativephases. If present trends continue, the physical plantadministrators of the future will be more oriented to themanagement of people and money, and will supplement hisneeds for technical competence by employment of specialists.In any event, the future in this field is certain to be dynamic,interesting and a tremendous challenge.
139 137

BIBLIOGRAPHY
I. American Council on Education, College and UniversityBusiness Administration, Volume II, Washington, D. C.,i 955.
2. Association of Consulting Management Engineers, Inc.,Common Body of Knowledge Required By ProfessionalManagement Consultants, Association of ConsultingManagement Engineers, Inc., 347 Madison Avenue, NewYork 17, New York, 1957.
3. Brewster, Sam F., Organizations and Functions of PhysicalPlant Departments of Universities and Colleges, Minutes ofthe Forty-Sixty Annual Meeting, The National Associationof Physical Plant Administrators of Universities andColleges, Kansas State University, Manhattan, Kansas,May, 1959.
4. Browne, L. L., Organization Chu ic of Physical PlantDepartments, Minutes of the Fortieth Annual Meeting,The National Association of Physical Plant Administratorsof Universities and Colleges, Alabama PolytechnicInstitute, Auburn, Alabama, May, 1953.
5. Dale, Ernest, Planning and Developing The CompanyOrganization Structure, American ManagementAssociation, 1515 Broadway, New York 36, New York.
6. Fifield, M. F., A Good University Physical Plant and WhatMakes It Click, Third Printing, Physical Plant Supervisor'sWorkshop, North Carolina State University, August, 1966.
7. Merrill, Harwood F., Classics In Management, (The Scienceof Administration by Captain Henry Metcalf 1847-1917),American Management Association, 1515 Broadway, NewYork 36, New York.
8. Pearson, H. E., Organization of the Buildings and GroundsDepartment at Indiana Uniersity, Minutes of theThirty-Sixth Annual Meeting, Association of Physical Plant
140
138

Administrators of Universities and Colleges, University ofArkansas, Fayetteville, Arkansas, May, 1949.
9. White, Leonard D., Introduction To The Study Of PublicAdministration, The Ma;millan Company, New York,1950.
141.139

SURVEY OFBUILDING MANAGEMENT CENTERS
OFNORTH AMERICAN UNIVERSITIES
GUY VALADEAND
G. M. GAUTHIER
G. Valade, Engineer, is in charge of the operation and maintenanceof all mechanical and electrical services at the University of Montreal,including all utilities and mechanical and electrical trades. Mr. Valade is agraduate engineer, receiving his B.A. Sc. in 1956 from Ecole Polytechniquein Montreal, the engineering school affiliated with the University ofMontreal. He joined the University of Montreal's Physical PlantDepartment in 1967 as an engineer and was put in charge, in 1968, of allmechanical and electrical services. He is a member of ASHRAE and ofother engineering societies.
G. M. Gauthier, Engineer, is chief automation engineer withSurveyer, Nenniger, Chenevert Inc., a major international engineeringconsultant with its head 'Ace in Montreal. Mr. Gauthier received hisBachelor of Arts degree from University of Montreal in 1951, andgraduated from McGill University in 1956 with a B.A. Sc. degree, majoringin communications. Subsequently, Mr. Gauthier held many responsiblepositions allied to the field of automation. In 1966 he joined theconsulting firm of Surveyer, Nenniger, Chenevert, Inc. to set up anautomation group. He is a member of numerous engineering societies.
NV 143: 1
Editor's Note: This paper was obtained for publication through thecourtesy and thoughtfulness of 0. Jean Gratton, Directeur, ServiceTechnique des hnmedubles, Universite de Montreal, C.P. 6128. Montreal3, Quebec, Canada. We believe that Mr. Gratton was responsible for havingthe compilation made and for forwarding the initial documents to theeditor. We are grateful for the opportunity to publish this survey.
INTRODUCTION
The growing complexity of mechanical, electrical andauxiliary services of buildings, as a consequence of therequirements of usage, comfort and safety of the premises, hascreated a great number of specialized tasks to insure the bestpossible use and control of the required equipment. The properorganization and performance of these various tasks may beimprovised manually until such time when the magnitude andcomplexity of the installations make this operationuneconomical and inefficient. It 's then that the application ofthe principles of automation beer me essential in order to insurethe optimum operation of the sy,tems.
Nowadays, automation is in general use in the greatmajority of commercial and industrial complexes where themost efficient and economical operations are the basic criteriafor a successful venture.
Automation has also found favor in the public sector, suchas governmental and institutional complexes. However, theimportance of this trend is not too well known.
University of Montreal authorities are deeply interested inthe subject of automating its campus and it was thought thatsome knowledge o.1 this subject would be helpful in arriving at adecision. To this end, they decided to make a survey amongNorth American universities, members of APPA. Aquestionnaire was sent to more than 600 members, requestinginformation on the size of physical plant, number of buildingsinvolved, the type of services and controls, the number ofmonitor and control points, economical results, etc.
.141 144
RESULTS OF SURVEY
Response from APPA membership was very encouragingand we take this opportunity to convey our gratitude.
A tota: of 223 answers were received. Their compilationand analysis gave the following results:
52 (23%) institutions are equipped with a centralizedcontrol system.
11 (5 %) institutions are presently installing acentralized system.
74 (33%) institutions have undertaken a feasibility studyon the subject and are planning in view of itsimplementation.
18 (8 %) institutions indicated a genuine interest andpropose to undertake a study.
68 (31%) institutions have answered negatively. Thisgroup however, comprises the smallerinstitutions and generally do not havecentralized services.
As a complement to this survey, we have compiledseparate lists of 13 Canadian and 75 American universitiespresently enjoying the benefits of a centralized control system.Among this group are many members of AFPA, from whom noanswer was received.
Thus, from a total of 311 universities, 140 possess a"building management center", 11 have reached the installationstage, 92 have definite plans or are genuinely interested; only68, for the specific reasons mentioned above, are not interestedat this time.
A further regrouping of the answers, on the basis of sizeand equipment, has been made, in an attempt to show moreclearly the actual trend to automation in university complexes.
145 142
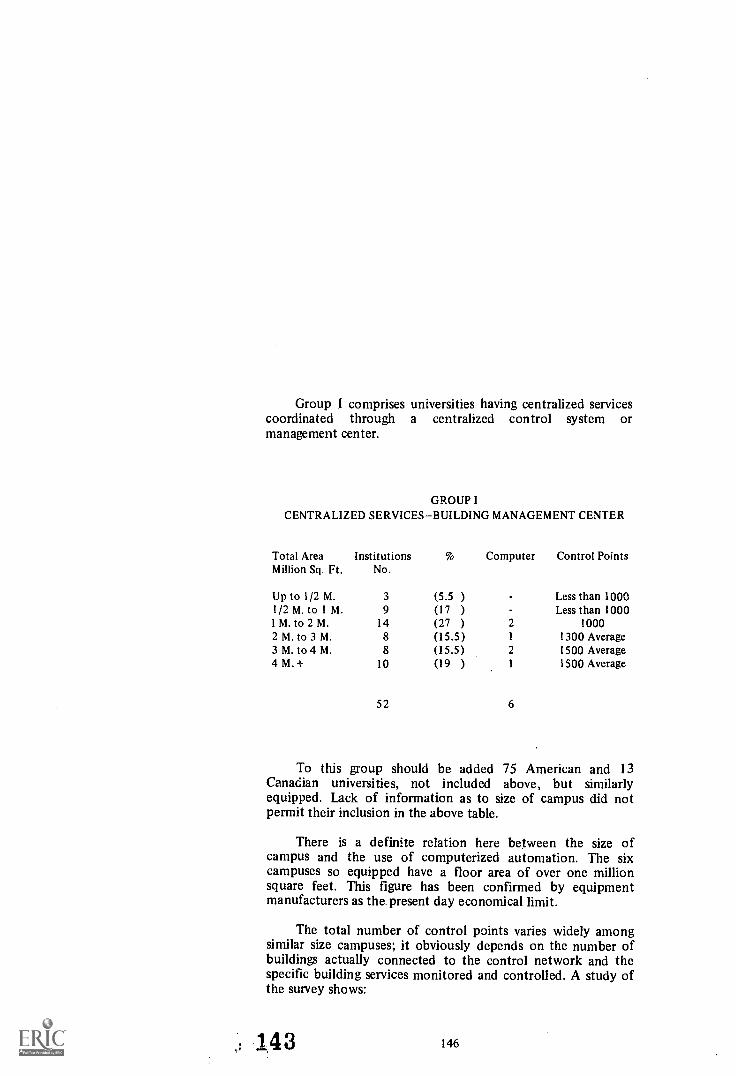
Group I comprises universities having centralized servicescoordinated through a centralized control system ormanagement center.
GROUP ICENTRALIZED SERVICESBUILDING MANAGEMENT CENTER
Total AreaMillion Sq. Ft.
InstitutionsNo.
Computer Control Points
1Jp to 1/2 M. 3 (5.5 ) Less than 10001/2 M. to 1 M. 9 (17 ) Less than 10001 M. to 2 M. 14 (27 ) 2 10002 M. to 3 M. 8 (15.5) 1 1300 Average3 M. to 4 M. 8 (15.5) 2 1500 Average4 M. + 10 (19 ) 1 1500 Average
52 6
To this group should be added 75 American and 13Canadian universities, not included above, but similarlyequipped. Lack of information as to size of campus did notpermit their inclusion in the above table.
There is a definite relation here between the size ofcampus and the use of computerized automation. The sixcampuses so equipped have a floor area of over one millionsquare feet. This figure has been confirmed by equipmentmanufacturers as the present day economical limit.
The total number of control points varies widely amongsimilar size campuses; it obviously depends on the number ofbuildings actually connected to the control network and thespecific building services monitored and controlled. A study ofthe survey shows:
143 146

Control Point InstitutionsRange
Up to 1000 25 48%1000-2000 18 3A%2000-4000 4 8%
4000-10000 2 4%10000 + 3 6%
The survey indicated an average of 30 buildings oncampus, one third of which are controlled from a buildingmanagement center, the remainder being gradually integrated tothe control system as soon as yearly budgets will permit.
With regard to benefits resulting from automation, 80% ofthose who answered to this question report savings of 10% to30% in such areas as operation and maintenance personnel, fueland electrical bills and an average reduction of 15% inemergency calls. One particularly enthusiastic report indicatedthat the investment was paid in three years and expects totalsavings to reach $ 1 million in 10 years.
Group II includes university complexes equipped withcentralized services but without management center.
GROUP II
CENTRALIZED SERVICES WITHOUT MANAGEMENT CENTER
Proposed Installation Degree ofTotal Area Institutions of Management Center Interest
Million No. % UnderSq. Ft. Construction Planned Interested No. %
Up to 1/2 M. 4 ( 4) 1 1 1 2 501/2 M. to 1 M. 22 (22) 2 9 1 10 551 M. to 2 M. 29 (29) - 12 5 12 592 M. to 3 M. 14 (14) 2 6 3 3 793 M. to 4 M. 9 ( 9) .. 6 3 1004 M. + 22 (22) 3 13 6 73
100 a 47 12 33 67
147 144

Comments
It is obvious from this tabulation that the degree ofinterest grows with the size of the physical installations. Notethat of 33 negative answers, 24 are from small campuses of lessthan one and a half million sq. ft.
Group III includes 70 institutions equipped with localbuilding services, and no management center.
GROUP III
NON CENTRALIZED BUILDING SERVICESNO MANAGEMENT CENTER
Proposes Installation Degree ofTotal Arey Institutions of Management Center Interest
Million Sq. Ft. No. % UnderConstruction Planned Interested No. %
Up to 1/2 M. 12 (17) 2 3 7 411/2 M. to 1 M. 21 (30) I 7 1 12 43I M. to 2 M. 19 (27) 9 1 9 532 M. to 3 M. 9 (13) 1 4 4 553 M. to 4 M. 3 (4 ) 3 .. 1004 M. + 6 (9) I 2 1 2 67
70 3 27 6 34 51
It is understandable that the existence of localizedmechanical and electrical services is not conducive toautomation because of its more expensive installation costs,which in turn inhibits possible savings, specially for the smallerinstallations. It is remarkable that in spite of these objections,more than 50% are either thinking about it or have taken initialsteps towards its implementation.
145 148

CONCLUSIONS
From an analysis of the answers to the present survey, thefollowing conclusions can be drawn:
a) Existence of a definite trend to automation of buildingservices of University Campuses.
b) Trend is obviously stronger on larger campuses i.e. overone million sq. ft., as expressed by the so-called degree ofinterest, tabulated in Groups II and III.
c) For economical reasons, computer application is restrictedto the larger installations, upwards of 2 million sq. ft.,where the number of monitoring and control points justifyits use.
d) In the majority of cases reported, rate of return oninvestment was favorable; answers indicate savings of 10%to 30% in such areas as operation and maintenancepersonnel, fuel and electrical billing. In addition, there is amarked decrease (15%) in the number of emergency calls.
May we say, in conclusion that the survey has been veryhelpful in determining the primary aims for which it waslaunched, namely;: a) determine the trend to automation onuniversity campuses, and b) locate installations alreadyautomated among APPA membership comparable to theUniversity of Montreal Campus as to size, operationalconditions and equipped with centralized services.
Its present floor area of 3.5 million sq. ft., to be expandedto 6.5 million in 1977, places the University of MontrealCampus among the larger institutions in North America.
The successful experience gained by others, together withthe resulting tangible and intangible benefits, should be a strongincentive to undertake the necessary steps for a more efficientand economical building management.
149 146
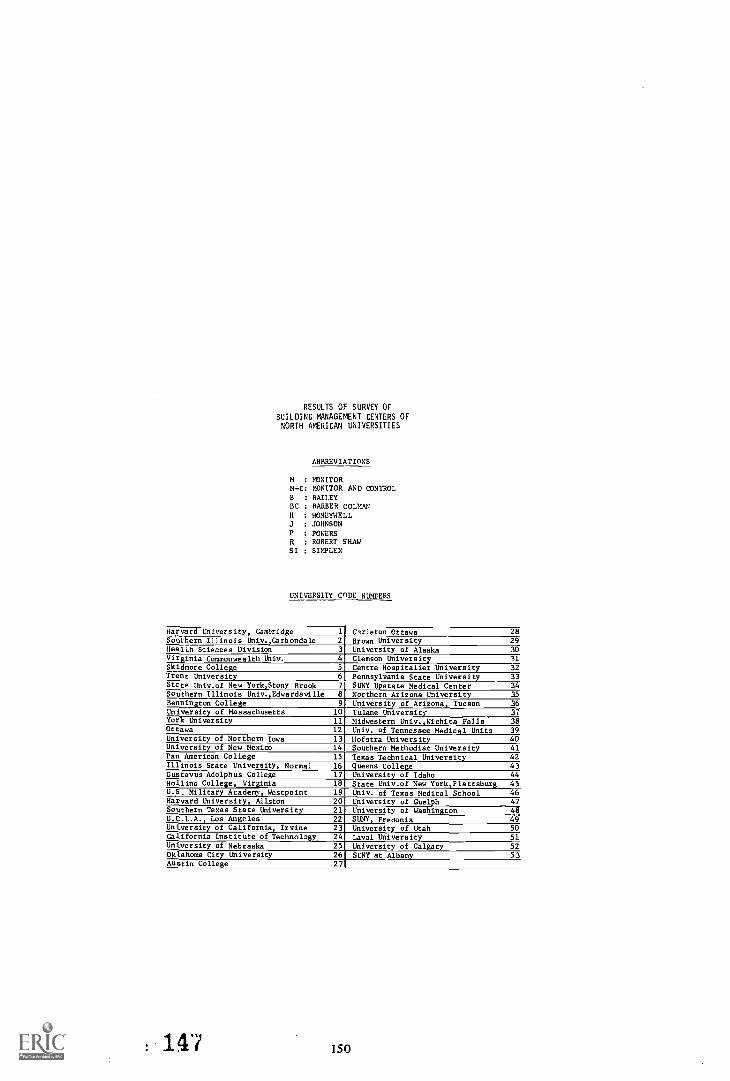
RESULTS OF SURVEY OFBUILDING MANAGEMENT CENTERS OFNORTH AMERICAN UNIVERSITIES
ABBREVIATIONS
M : MONITORM-C: MONITOR AND CONTROLB : BAILEYBC : BARBER COLMANH : HONEYWELLJ : JOHNSONP : POWERSR : ROBERT SHAWSI : SIMPLEX
UNIVERSITY CODE NUMPERS
Harvard University, Cambridge 1 Carleton Ottawa 28Southern Illinois Univ.,Carbondale 2 Brown University 29Health Sciences Division 3 University of Alaska 30
Virginia Commonwealth Univ. 4 Clemson University 31
Skidmore College 5 Centre Hospitalier University 32Trent University 6 Pennsylvania State University 33State Univ.of New York,Stony Brook 7 SUNY Upstate Medical Center 34Southern Illinois Univ.,Edwardsville 8 Northern Arizona University 35Bennington College 9 University of Arizona, Tucson 36University of Massachusetts 10 Tulane University 37York University 11 Midwestern Univ.,Wichita Falls 38Ottawa 12 Univ. of Tennessee Medical Units 39University of Northern Iowa 13 Hofstra University 40University of New Mexico 14 Southern Methodist University 41Pan American College 15 Texas Technical University 42Illinois State University, Normal 16 Queens College 43Gustavus Adolphus College 17 University of Idaho 44Hollins College, Virginia 18 State Univ.of New York,Plattsburg 45U.S. Military Academy, Westpoint 19 Univ. of Texas Medical School 46Harvard University, Allston 20 University of Guelph 47Southern Texas State University 21 University of Washington 48U.C.L.A., Los Angeles 22 SUNY, Fredonia 49University of California, Irvine 23 University of Utah 50California Institute of Technology 24 Laval University 51University of Nebraska 25 University of Calgary 52Oklahoma City University 26 SUNY at Albany 53Austin College 27
147 150

UNIVERSITIES UITH CENTRALIZEC CONTROL SYSTEM (BUILDING MANAGE4ENT
o ..I
5 nrA i ''''CL , 4
1
IPA 8
TOTAL
AREA
CA 0-. 1:,,..-
CI < '. ,..E.1 c 0w 61n
I,:.: ::t
AGE OFBUILDINGS
NO, OF BUILDINGS WIT SERVIC gCENTRALIZED
,ETTH -.
ts.1e1
W
PROP-
.-1
d
LOCAL
oM
F
W V'.
.-' 8
ar>.
I
c.
4
,4: 0, -..
..I0
, ,.,
,.2%,..
tiI'
1010
10
L
%
6I-..J
,A 40
.40
4.490..0E14103 000 000-4 000,000110-20
20
-10
5-10
I-
'5-10B-105-10
+-
10
10 10 10 102 -
-
10
-
10
10
10
103 40 2,000 000-3 000 0004
5 10-20 500,000-1,000,000 5-10 10 - 10 10 10 10 - 5-6 500,000-1,000,000 5- 5-10 - - - - .5-10 5-10 5- 5-7 3006,000-4,000,000 10-20
5-1010 1 -
5-10 -
-
-
10
5-10 5-10'"5-108 5-10 1,000,000-2,000,000 5-10 5-10 5-109 40 500,000-1 000 0004_5-
4,000,000 20
20
10-20,10
5-10 - . -
10 .101105- . - 1775- :5-10.1.0
10 - , - 5- , -10 160 10
1010
- -
10 10
_5-5- ,10
10 ;10
10
10
5-
11 10-20 2,000 000-3,000,00012 10-20 I 0,..3000-2 000 0001.10-20
1,000,000-2,000,00013 20-40 15- - i10 - 10 5- 10 1014 40 2,000,000 - 3000-3 000 , 000 10-20 10 '10 10 10
Z.10 - _ -
15 20-40 500,00- '5- 10 '10 10 -3,000,000-4,000,000 10-20 10 ;10 T10 10
10
- -
- -
10
10- 416 40
17 20-40 1,000,000 - 2,000,000 5-
5-
5- .10
5-1 0 1 1 0
5- 10
5- 10 5- - 10 5-.1
5-18 40 500,000-19 40 -...---.-----4 J 000 / 000
120
4,000,000 120 +5- :5-10
10 -11010
10
1010
-
10
10
5-10
10
10
10
10
10
ID20 40
21 40 2,000,000 -3 000 000 -
.20
.10 --f--.10
10 10110
X10-
10
10
10
10
1010
-
5-
10
1010
-
-
10
10-
1010'
5-10
105-
10
10
5-10
1010
0
10
5-10
)05-10
22 40 4,000,00023 10-20 500,000-1, 000,0001V-71
1.000,000- 2.000,000'10 -20
10
10 410.
10
- 1
I5- :5-10
24 40
25 40 4,000,000 2026 20-46 500,00T,000,000 5-10
.111015-105- 10 5-10 - 10 5-10 5-10
27 20-40 500 000-1,000,000,5-1'000,000 - 2,000,000[10 -20
2,000,000-3,000,0010-20
5- 010 ,10
10 i -5-10 5-10 - 10 5- 10
28 10-20 r. - 10
29 40 5-10'5-10.10 10 - - 10 10 5-e30 40 1,000,000 - 2,000,000110 -20
--
10 ,10
, -
'5- 10 5-10 10 10
10 '10 10 10 10 - L- -, _ _ 5_
31 20-40 2.000.000-3.000.000110-20,1032 5- 1,000,000-2,000,000133 40 4,000,000 120 10 ;10 10 10 - 10 10 - -
34 5-10 1,000,000-2,000,000 5- 5- - ;5- - - - - - -35 40 500,000-1,000,000110-20 10
10
10 .5-10 10 - 10 5 - 5-10 110 10 10 10 10 10 10
10 10 IMEEMIrrn1010 .5-1011:1111,1111 - - -
10 '10 - - - 10 10 10
36 40 4,2001000 '20
IN511 40 __zoo 000-3 000 000 10-20 5-103' 20-407-500,000-1 000,000'5-10
5-105-105-10ERR 0-40 500,000-1,000,000
II
1 000 000-2 000 001 20 5-10 10 5- 5-10 5-10 - 5-10 5-10 5 -10Kill o 2 000.000-3.000.000 10-24Mille
10
5-1010
10.
10
10
5 -10_10
10 I
4 0 UWE. -- - -gEgg40 3 000 000-4 000 000 20
5-1010 -
43 EIMEI 1 000,J002 000
44 40
.000
3.000 000-4,000,0001.00000072 U00 000
10-20 10 10 _ - 5- 10 5-10
45 20-40 10-20 10 10 10 10
46 5- 500,600-47 , 3000,0004750 1 0
40 4 000 000-. I
20I
1010 10 10 5-10_1 5 5-10 10 10 10 10 10 10 10
40
10 -20
10-20
1 0002000- 4000,0004000 000
10-2020
5-10 5-10 5- 10 - 10 5- 10 5-101111120..:40
III
lalltall
10 10 10 10 - - 10 10 10
.460..,00074,000,600
I 0002_000- 2,000,000
000 000-4,000 000
10-20I6-20
10-20
10
.i.0
4g
105'--
10
-
10 __15:10It-
48
101-
10 5- 5- 5-- 10 io 10
- - -
151 148

UNIVERSITIES WITH CENTRALIZED CONTROL SYSTEM (BUILDING MANAGEMENT)
g8
F.
r-41
>F.
NO, OF BUILDINGS WITH CONTROL SYSTEM f
TOTAL
NO,
OF
POINTS
Low.CONTROL
CENTRALIZED CONTROL
F-:2 7 ..-72. Ji.. .;..a.
x>( 7i
a,':',
utit.
;g ..----,--
HEATING VENTILATIONAIR
CONDITION
..,
riz
i!..!.T.
M M-C M
1 10 H 10 10 10 10 10 10 10 10
10
11000 -2.000
1,000-2,0002 10 - P 10 10 10 10 10 10 10
3 10 10 V 5- - - - 1,000-2,0004
5 - H 10 10 10 - 1 000-6 - 5-10 H
H
-
5-105-105-10
-
5-10:-10 - 5- - 5-10 1,000-
7 - 10 5-10 5-10 - 5- 5-10 10,0008 5-10 5-10 J - 5-Y0 - 5-10 - 5-10 - - 10,000
9 - P 5- 5- - - - - 1,00010 10 5- H - 5- - 1,000II 10 10 H 10 - 10 - 10 - 10 10 80012 5-
10 5-10J
R5-
-
5-5-10
5--
5-5-10
5--
5-5-10
5--
5--
1.0004 000-10,002,000-4,000
1.000-
13
14 - J - 10 - 10 - 10 - -
15 105- 5-
B
P
-
5- 5--
-
-
5-10
5-10
5--
5--
5-16 1,000-17 - H - 10 - 10 - - 1,000-18 5- 5- X11 5- 5- 5- 5- 5- 5- - 5- 1 00°-19 10 10 J 5- 5- 5- 5- 5- 5- - 5- ?,000-20 10 10 H 10 10 10 10 10 10 10 10 1,000-2,00021 10 10 SI 10 - 10 - - - - - 1.000-22 10 10 17 5- - - 1,000-23 5- 5- H 5- 10 5- 10 5- 10 5-
-
5-105-10
5-
10
1,000 -
1,000-1.000-2.000
10 10 if 10 10
5-1019
5-1010
5-1010
5-105-10
10
5-10
__2y
25 10 10 J 5-1026 5-10 510 H 5-10 5-10 5-'.0 5-10 -3=ib - 10 1,000-2
27 10 5-10 J 5-
-
5-
10
5-
-
5-
10
5- S-
10
-
-
-
-
1.000-2,000-4,00028 10 10 H
29 5- 5- H - 10 - 10 10 - - 900
30 10 10 H - 10 - 10 - 10
31 - - H - 10 - 10 - 10 - - 1,000-2,00032 5- - H - - - - - - ---
33 5- - S ---------34 5- 5-10 H 5- 5- 5- 5- 5- 5- - 5-10 1.000-35 5-
-105- J 5-10 5-10 - - - - 1,000-
36 10 H 10 10 10 10 10 10 - 10 1,000-37 10 - H 10 10 10 - 10 10 - - 1 000-2,000
38 - - B.C. - 10 - 10 - 10 - - 1,000 -2 000
39 10 10 H 10 10 10 10 10 10 10 10 1.000-2.00040 5-10 5-10 II - ...10 - 5-10 - 5-10 - - 1.000-41 - - P,P.D 10 10 10 10 - 10 _ - --
42 - - J 10 10 10 10 10 10 - 10 10,000-43 5- 10 - - - - -
5--
5--
5-0----1,000-44 5-10 10 H 5- 5- 5- 5-
45 10:
4J
10_ - - - _ 5- - 10 11000-1,000-
4,pn0 _1n Q1 000-
46 5- - 5- - -
47 10
5-1010
10
J
H
-
5-1010
5-10-
5-10105-10
-
-
Iq- -
-1048
49 10 10 SI 10 - 10 - 5-5-
5-10
10
-r
5
-
.5 -10
-
- 10 1,000-
50 10 10 11_ 10 105-10-
5-10 5-105-10,45=1010 -
-
5-105-1010
10
10
1.000-2.000-4 000
1.000-
51 5- - 8_ 5-101052 10 10 B
53 - J 48 48 48 48 13 13 - 48 1,000-2,000
149 152

UNIVERSITIES WITH CENTRALIZED CONTROL SYSTEM (BUILDING MANAGEMENT)
o
'iw
COMPUTER
ECONOM %PROPOSED
INSTALLATION OFCENTRALIZED
CONTROL SYSTEMPERSONNEL OPER T ON
7,.
..: mw.",4
4,A '179'
..1 C.) 0 S --.6=FU', l" 850,, 0...,.. ....
7.:0
ti-'
O.0
ti,4..4
13
1:.,
.
4.
6wt
3YES NO 9 ';..'
w,E88 !,7;
t.,E2
NO YES
1 X X
2
3 X 30 30 20-30 X4
5 X X6 X7 X &8 S9 X X
10 X X
11 1 X
12 X11 X x14 X
X
X
15
16 X X
17 X 10- 10-20 20-30 10-20 10-
18 X
19 X
20 X
21 X 10- 10- 10-
22 j X
23 X
24 X
25 X
26 X
27 X
26 X
29 X
30 X X
31 X
32 30 30 10-20 10-20 X
33
34
35 X 10-20 20-30 30- 10 10 X
36 X 10- 30 10 10-20 10
37 X
36 X
39 x 20 -30
30
20-2030
20-3030
10- 10-X40 X
41 X 10
42 X
434445 X
46 X 70 -30 10-:"' 30 10-20 10-47 X
48 X49 X
50 X51 X
52
XX'',,1 10-20 10- 10- 10 - X
153150