Embed Size (px)
Citation preview
7/30/2019 70031 Skill Up Lesson What s the Conclusion Student Sheets
http://slidepdf.com/reader/full/70031-skill-up-lesson-what-s-the-conclusion-student-sheets 1/15
7/30/2019 70031 Skill Up Lesson What s the Conclusion Student Sheets
http://slidepdf.com/reader/full/70031-skill-up-lesson-what-s-the-conclusion-student-sheets 2/15
What’s the
conclusion?
Student SheetsA skills development activity for GCSE

7/30/2019 70031 Skill Up Lesson What s the Conclusion Student Sheets
http://slidepdf.com/reader/full/70031-skill-up-lesson-what-s-the-conclusion-student-sheets 3/15
SS1 Test results (reusable) b is a version for higher ability students.
SS2 Program outline(consumable)
SS3 Hazard perception (reusable) b is a version for higher ability students
SS4 Flow chart (reusable)
SS5 Flow chart (teacher guide)
SS6 Report from the Daily Post(reusable)
SS7 Marking guide (reusable) For teacher use but can be used by students forself/peer assessment
SS8 Flow chart (reusable) Optional extra for the explain task
SS9 Flow chart (teachers guide)
Sheet number Title Notes
Contents
7/30/2019 70031 Skill Up Lesson What s the Conclusion Student Sheets
http://slidepdf.com/reader/full/70031-skill-up-lesson-what-s-the-conclusion-student-sheets 4/15
050
100
150
200
250
300
350
400450
500
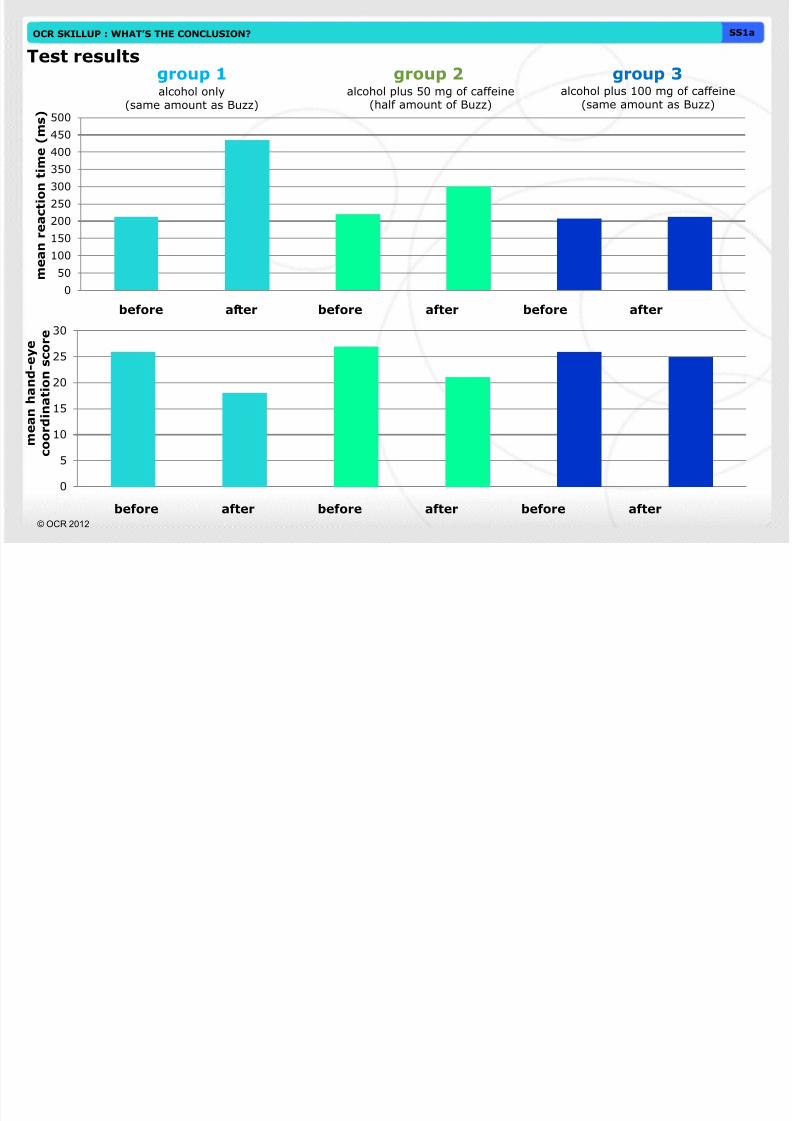
alcohol only(same amount as Buzz)
alcohol plus 50 mg of caffeine(half amount of Buzz)
m
e a n r e a c t i o n t i m e ( m s )
OCR SKILLUP : WHAT’S THE CONCLUSION? SS1a
Test resultsgroup 1 group 2 group 3
alcohol plus 100 mg of caffeine(same amount as Buzz)
before after before after before after
© OCR 2012
before after before after before after
m e a n
h a n d - e y e
c o o r d i n a t i o n s c o r e
0
5
10
15
20
25
30

7/30/2019 70031 Skill Up Lesson What s the Conclusion Student Sheets
http://slidepdf.com/reader/full/70031-skill-up-lesson-what-s-the-conclusion-student-sheets 5/15
0
1
23
4
5
6
7
8
0 25 50 75 100 125 150
0
50
100
150
200
250
0 25 50 75 100 125 150
i n c r e a s e i n r e a c t i o n
t i m e ( m s )
amount of caffeine (mg)
Test results
Buzz (100 mg)
OCR SKILLUP : WHAT’S THE CONCLUSION? SS1b
© OCR 2012
d e c r e a s e
i n h a n d - e y e
c o o r d i n a t i o n t e s t s c o r e
amount of caffeine (mg)Buzz (100 mg)

7/30/2019 70031 Skill Up Lesson What s the Conclusion Student Sheets
http://slidepdf.com/reader/full/70031-skill-up-lesson-what-s-the-conclusion-student-sheets 6/15
Program outline
Intro: Abigail, our presenter,
introduces Buzz and discusses thehypothesis we are testing.
The tests: Reaction times and hand-eye coordination: Abigail explains the tests and discusses theresults. Write conclusions to describe what the evidence shows.
Do both pieces of evidence match our prediction? If so, describe our conclusion and the evidence thatwe collected which supports it.
OCR SKILLUP : WHAT’S THE CONCLUSION? SS2
Our prediction is that drinking both caffeine and
alcohol together will result in their effects beingcancelled out.
Wrapping up: Abigail gives our final thoughts. How could we make our conclusionmore secure?
The controversy: Abigail explains that it seems that the makers are claiming that you can drink Buzz and drive.We discuss the hazard perception results. Explain how confident we are in the hypothesis that the effects of alcoholare cancelled out by caffeine. Do we think you can drink Buzz and drive?
© OCR 2012

7/30/2019 70031 Skill Up Lesson What s the Conclusion Student Sheets
http://slidepdf.com/reader/full/70031-skill-up-lesson-what-s-the-conclusion-student-sheets 7/15
Hazard perception
The test
You take a driving
hazard perception test.
The higher your scoreout of 50, the more
aware you are of
hazards when driving.
OCR SKILLUP : WHAT’S THE CONCLUSION? SS3a
Method
120 people were split into 3 groups
and each person did the test.
The people in each group drank a
different drink.
They waited 20 minutes and did
the test again.
alcohol only(same amount as Buzz)
alcohol plus 50 mg of caffeine(half amount of Buzz)
group 1 group 2 group 3alcohol plus 100 mg of caffeine
(same amount as Buzz)
before after before after before after0
5
1015
20
25
30
35
40
45
50
m e a n s c o r e
© OCR 2012

7/30/2019 70031 Skill Up Lesson What s the Conclusion Student Sheets
http://slidepdf.com/reader/full/70031-skill-up-lesson-what-s-the-conclusion-student-sheets 8/15
0
5
10
15
20
0 25 50 75 100 125 150
The test
You take a driving hazard perception
test. The higher your score out of 50,the more aware you are of hazards
when driving.
Hazard perception
OCR SKILLUP : WHAT’S THE CONCLUSION? SS3b
d e c r e a s e i n s c o r e
amount of caffeine taken (mg)Buzz (100 mg)
Method
120 people were split into 7 groups.
Each person did the test and then was
given a drink that contained:●A fixed amount of alcohol
(same as Buzz)
●A different amount of caffeine
(between 0-150mg)
The people were not told what was in
their drink.
They waited 20 minutes and did thetest again.
© OCR 2012

7/30/2019 70031 Skill Up Lesson What s the Conclusion Student Sheets
http://slidepdf.com/reader/full/70031-skill-up-lesson-what-s-the-conclusion-student-sheets 9/15
Yes
Yes
The hypothesis could bewrong.
No
Yes
Look at all the evidence.
You can have a HIGH level of confidence in the hypothesis.
Your cannot draw a clear conclusion aboutwhether the hypothesis is correct.
Look at the method used to collect each piece of evidence.
?Does it all match your
predictions?
Describe theevidence thatsupports it.
?Does most of the
evidence match yourpredictions?
You can have a LOW level of confidence in the hypothesis.
Describe the evidencethat supports and
opposes it.
No
Describe theevidence thatopposes it.
?Are there errors
that could lead to
inconsistent results?
Describe how to improve themethod, to see if thehypothesis is really correct.
No
Suggest other hypothesesthat would explain the results
you got.
OCR SKILLUP : WHAT’S THE CONCLUSION? SS4
START HERE
© OCR 2012

7/30/2019 70031 Skill Up Lesson What s the Conclusion Student Sheets
http://slidepdf.com/reader/full/70031-skill-up-lesson-what-s-the-conclusion-student-sheets 10/15
Yes
Discussion about the results from the tests.
Yes
The hypothesis could bewrong.
No
Yes
Look at all the evidence.
You can have a HIGH level of confidence in the hypothesis.
Your cannot draw a clear conclusion aboutwhether the hypothesis is correct.
Look at the method used to collect each piece of evidence.
?Does it all match your
predictions?
Describe this andthe evidence that
supports it.
?Does most of the
evidence match yourpredictions?
You can have a LOW level of confidence in the hypothesis.
Describe the evidencethat supports and
opposes it.
No
Describe theevidence thatopposes it.
?Are there any mistakes
that could lead to
inconsistent results?
Describe how to improve themethod, to see if thehypothesis is really correct.
No
Suggest other hypothesesthat would explain the results
you got.
OCR SKILLUP : WHAT’S THE CONCLUSION? SS5
START HERE
The reaction times tests and hand-eye coordination do but not thehazard perception test.
Students could take both routes here to a certainextent.
Good area for debate – the students may spot someparts of the test that they feel were mistakes e.g.not waiting long enough after drinking and beforetaking the test.
The effects of alcohol are notcancelled out bythe affects of caffeine (or it doesbut atconcentrations nottested)
Teacher notes
© OCR 2012

7/30/2019 70031 Skill Up Lesson What s the Conclusion Student Sheets
http://slidepdf.com/reader/full/70031-skill-up-lesson-what-s-the-conclusion-student-sheets 11/15
Our conclusion from
this study is that
eating broccoli can prevent
the growth
of cancer.
Report from The Daily Post
Scientists grew cancer cells and normal healthy cells outside of the body. Theythen added different concentrations of the chemical to each (higher than amounts
naturally found in broccoli) and measured the growth of the cells. These graphs
show the results:
concentration of chemical added g r o w t h o f c a n
c e r c e l l s
1 Use the results on graph A to explain how The Daily Post came up with their conclusion.2 Study graph B.
a Comment on how confident you are with their conclusion and explain why.
b What further data would help you to be more confident in the conclusion?
Research published last week found that a chemical found in broccoli
slows down the growth of cancer cells.
0
0.2
0.4
0.6
0.8
1
zero low high
0
0.2
0.4
0.6
0.8
1
zero low high
concentration of chemical added
g r o w t h o f n o r m a l c e l l sgraph A graph B
OCR SKILLUP : WHAT’S THE CONCLUSION? SS6
© OCR 2012
7/30/2019 70031 Skill Up Lesson What s the Conclusion Student Sheets
http://slidepdf.com/reader/full/70031-skill-up-lesson-what-s-the-conclusion-student-sheets 12/15
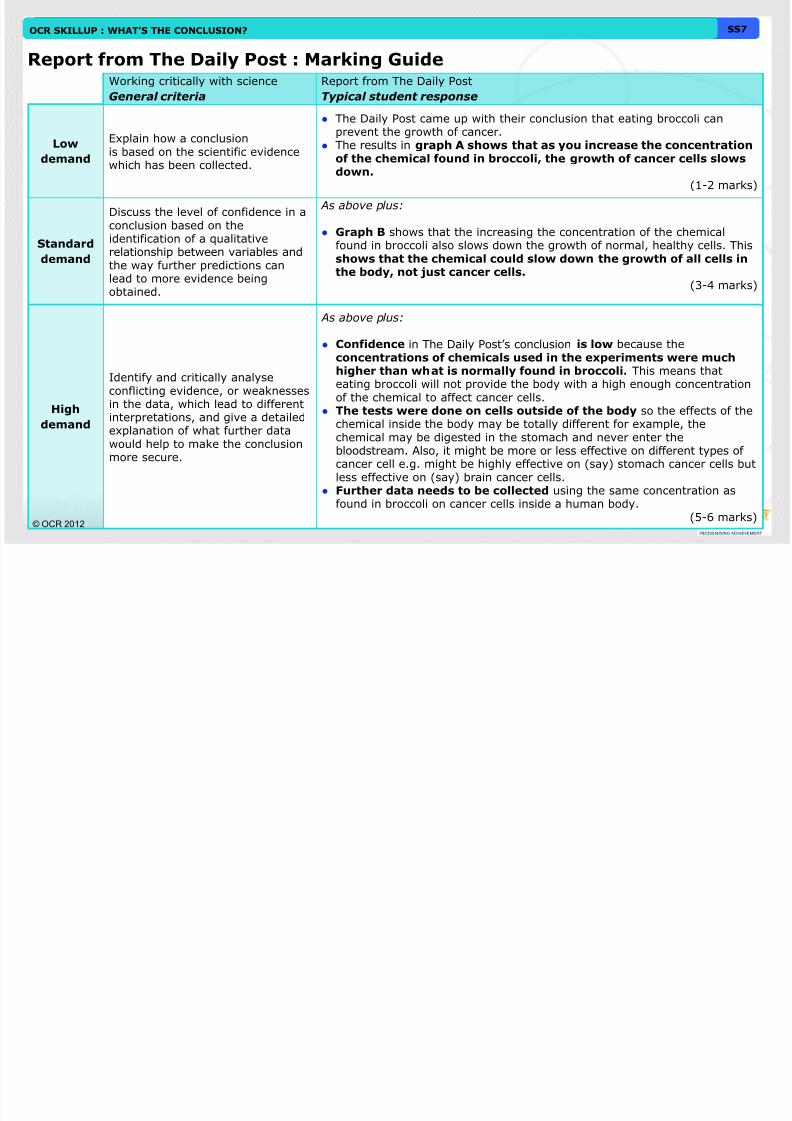
Report from The Daily Post : Marking GuideWorking critically with science
General criteria
Report from The Daily Post
Typical student response
Lowdemand
Explain how a conclusionis based on the scientific evidencewhich has been collected.
● The Daily Post came up with their conclusion that eating broccoli canprevent the growth of cancer.
● The results in graph A shows that as you increase the concentrationof the chemical found in broccoli, the growth of cancer cells slowsdown.
(1-2 marks)
Standard
demand
Discuss the level of confidence in aconclusion based on theidentification of a qualitativerelationship between variables andthe way further predictions can
lead to more evidence beingobtained.
As above plus:
● Graph B shows that the increasing the concentration of the chemicalfound in broccoli also slows down the growth of normal, healthy cells. Thisshows that the chemical could slow down the growth of all cells inthe body, not just cancer cells.
(3-4 marks)
High
demand
Identify and critically analyseconflicting evidence, or weaknessesin the data, which lead to different
interpretations, and give a detailedexplanation of what further datawould help to make the conclusionmore secure.
As above plus:
● Confidence in The Daily Post’s conclusion is low because theconcentrations of chemicals used in the experiments were muchhigher than what is normally found in broccoli. This means thateating broccoli will not provide the body with a high enough concentrationof the chemical to affect cancer cells.
● The tests were done on cells outside of the body so the effects of thechemical inside the body may be totally different for example, thechemical may be digested in the stomach and never enter thebloodstream. Also, it might be more or less effective on different types of cancer cell e.g. might be highly effective on (say) stomach cancer cells butless effective on (say) brain cancer cells.
● Further data needs to be collected using the same concentration asfound in broccoli on cancer cells inside a human body.
(5-6 marks)
OCR SKILLUP : WHAT’S THE CONCLUSION? SS9
© OCR 2012
OCR SKILLUP : WHAT’S THE CONCLUSION? SS7

7/30/2019 70031 Skill Up Lesson What s the Conclusion Student Sheets
http://slidepdf.com/reader/full/70031-skill-up-lesson-what-s-the-conclusion-student-sheets 13/15
NoYour cannot draw aclear conclusion, asthe results areinconsistent.
Look at the methodused to collect eachpiece of evidence.
Describe what it shows.
Look at the 2nd piece of evidence (graph/chart/table)
Yes
?Do both pieces of evidence match your
prediction?
?
Describe how youthink the problemled to inconsistentresults.
Yes
OCR SKILLUP : WHAT’S THE CONCLUSION? SS8
You can draw a clear conclusion toanswer the original question.
STARTHERE
Look at the 1st piece of evidence (graph/chart/table)
?
Can you find anyproblems?
Describe theevidence whichsupports andopposes thehypothesis.
© OCR 2012
Describe what it shows.
Write the conclusion and
describe the evidence that
supports it.
7/30/2019 70031 Skill Up Lesson What s the Conclusion Student Sheets
http://slidepdf.com/reader/full/70031-skill-up-lesson-what-s-the-conclusion-student-sheets 14/15
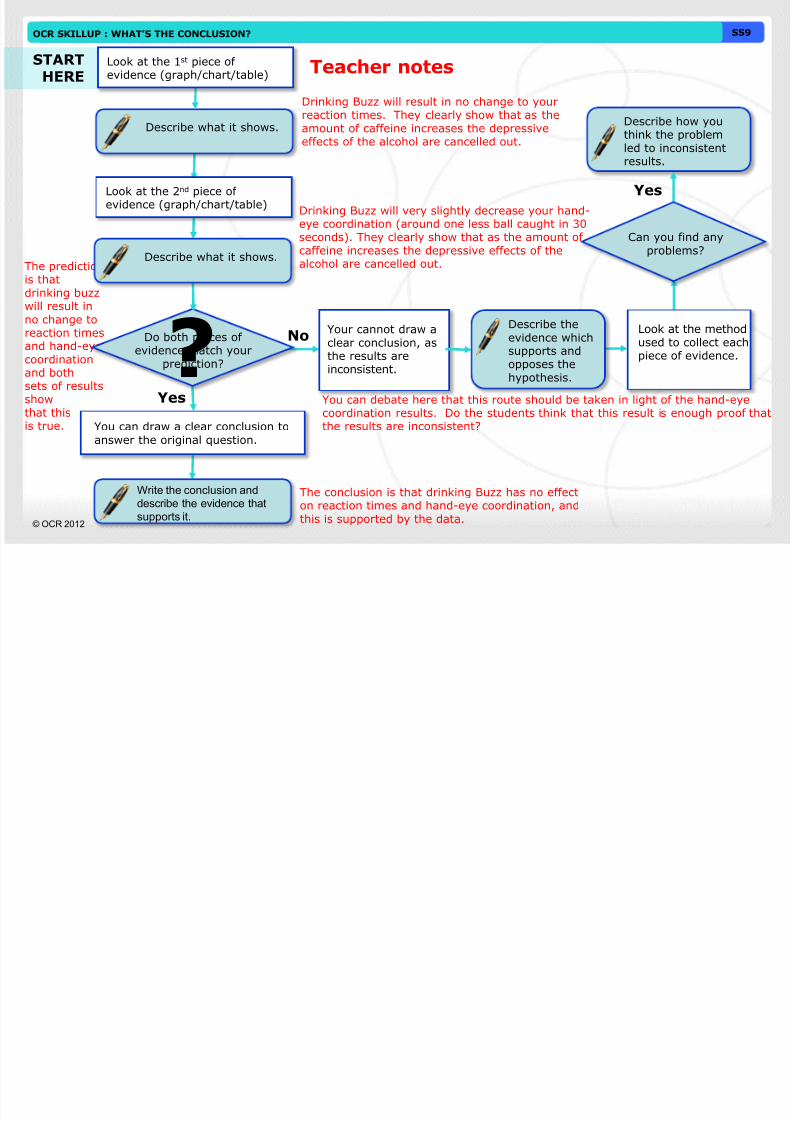
NoYour cannot draw aclear conclusion, asthe results areinconsistent.
OCR SKILLUP : WHAT’S THE CONCLUSION? SS9
© OCR 2012
Drinking Buzz will result in no change to yourreaction times. They clearly show that as theamount of caffeine increases the depressive
effects of the alcohol are cancelled out.
The prediction
is thatdrinking buzzwill result inno change toreaction timesand hand-eyecoordinationand bothsets of resultsshow
that thisis true.
Drinking Buzz will very slightly decrease your hand-eye coordination (around one less ball caught in 30seconds). They clearly show that as the amount of caffeine increases the depressive effects of thealcohol are cancelled out.
The conclusion is that drinking Buzz has no effecton reaction times and hand-eye coordination, andthis is supported by the data.
You can debate here that this route should be taken in light of the hand-eye
coordination results. Do the students think that this result is enough proof thatthe results are inconsistent?
Teacher notes
Look at the methodused to collect eachpiece of evidence.
Describe what it shows.
Look at the 2nd piece of evidence (graph/chart/table)
Yes
?Do both pieces of evidence match your
prediction?
?
Describe how youthink the problemled to inconsistentresults.
Yes
You can draw a clear conclusion toanswer the original question.
STARTHERE
Look at the 1st piece of evidence (graph/chart/table)
?
Can you find anyproblems?
Describe theevidence whichsupports andopposes thehypothesis.
Describe what it shows.
Write the conclusion and
describe the evidence that
supports it.
7/30/2019 70031 Skill Up Lesson What s the Conclusion Student Sheets
http://slidepdf.com/reader/full/70031-skill-up-lesson-what-s-the-conclusion-student-sheets 15/15
© OCR 2012 3072589305
1/12