Embed Size (px)
Citation preview

INDOT Market Research Project 2.0 General Survey
Cambridge Systematics, Inc. 2-1
2.0 General Survey
A central component of the market research study was a general survey of the Indiana population aimed at validating INDOT’s Policy Plan and identifying emerging areas on which INDOT should focus. The survey also provided an opportunity to identify what transportation issues are important to Indiana residents, and how well INDOT performs in these areas. Ultimately, many of the survey questions may become the basis for customer-based performance measures that INDOT could monitor periodically.
The survey was prepared and carried out in these steps:
1. Cambridge Systematics developed a draft survey instrument aimed at probing INDOT’s nine policy areas, and addressing potential customer-based performance measures.
2. Cambridge Systematics worked with The Blackstone Group to carry out two focus groups in Indianapolis in March 2003. The primary purpose of the focus groups was to test the approach to the survey and wording of questions. The secondary purpose was to gain a sense of attitudes. One of the focus groups was oriented towards Indianapolis residents, while the other was oriented to suburban Indianapolis resi-dents. The focus group findings are not statistically significant, but do provide some interesting anecdotal insights. The focus group report is provided in Appendix A.
3. Cambridge Systematics developed a phone survey instrument in consultation with INDOT staff and Indiana University Public Opinion Laboratory. The survey was car-ried out in May 2003. A copy of the survey instrument is included in Appendix B.
The methods and results of the survey are explained in presentation format in the remaining pages of this section. Appendix C has a summary of the responses to the sur-vey, and Appendix D has the transcripts of the open-ended responses.

summaryresearch
2-2
2-3
Research Summary
Analysis Objectives
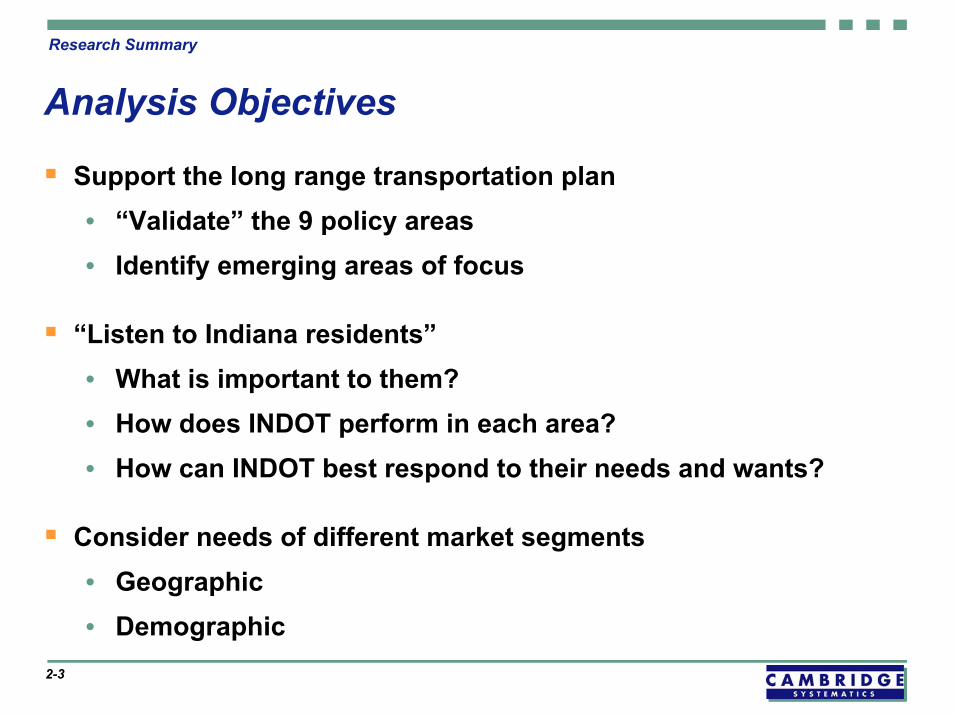
Support the long range transportation plan• “Validate” the 9 policy areas• Identify emerging areas of focus
“Listen to Indiana residents”• What is important to them?• How does INDOT perform in each area?• How can INDOT best respond to their needs and wants?
Consider needs of different market segments• Geographic• Demographic

2-4
Research Summary
Relationship to Other INDOT Activities
Environmental Justice (EJ). How does INDOT respond to EJ populations?1 EJ populations are defined as• Being of race/ethnicity other than white• Being of more than one race• A single person earning less than $15,000 per year• Belonging to a household of two or more people that earns
less than $25,000 per year• Belonging to a household of three or more people that earns
less than $35,000
Performance measures. Market research findings can be used as the basis for customer-oriented performance measures.
• Can monitor Hoosiers’ “pulse” over time
1 More detail on this topic is provided in a separate memorandum

2-5
Research Summary
Survey Research Design
Telephone survey• 10-15 minutes long• Random digit dialing (RDD) covering all of Indiana
A random individual in the household was selected
Survey design• Probed policy areas in long range plan• Explored emerging policy areas
INDOT staff and focus group findings influenced design
Survey pre-test influenced final refinements

2-6
Research Summary
Sample Design
Counties were grouped into 6 homogeneous strata
• Marion County• Lake County• 12 counties in northern Indiana
with cities of 20,000+• 9 counties in southern Indiana
with cities of 50,000+• 29 other counties in northern
Indiana• 40 other counties in southern
Indiana
Stratified sample used for efficiencyRepresentative sample expanded to the entire state

2-7
Research Summary
Survey Weighting
We over sampled households in Lake and Marion counties• They had a higher incidence of EJ population• By collecting a random sample of households in these
counties, we achieved a higher EJ sample
Census 2000 was the basis for weighting (see table on next page)• Survey weighting factors were determined by
Strata’s share of census populationStrata’s share of survey sample

2-8
Research Summary
Survey Weighting
1.3414.6%19.4%Other Southern Indiana Counties
0.9514.6%13.9%Other Northern Indiana Counties
0.9914.6%14.4%South Indiana with Large Cities
2.0114.6%29.4%Northern Indiana with Large Cities
0.3720.8%7.8%Lake
0.7320.8%15.1%Marion
WeightSurvey
IncidenceCensusSurvey Strata

2-9
Research Summary
Categories of Questionnaire Topics
Importance of different policy areas
Ratings of priorities for transportation policy initiatives
Satisfaction with specific INDOT services
Awareness and image of INDOT
Overall satisfaction with INDOT and recent performance
Recent experiences with INDOT highway facilities
Travel behavior and socioeconomic characteristics

2-10
Research Summary
Analysis Framework
Described travel behavior and socio-economic characteristics
Identified differences in answers by market segment• Used analysis of variance, chi-square, and t-tests
Identified significant differences according to• Geography by the 6 strata• Socioeconomics
- EJ household- Income, gender, age,- Auto ownership, household size
• Travel behavior – Miles driven per year

findingssignificant
2-11

2-12
Significant Findings
Key Take-Aways
Indiana residents mostly agree with INDOT’s priorities
Funding allocation appears to be “about right”
If a reallocation were to be made, funding should shift to• Transit and intercity air• New road construction instead of maintenance
People are generally aware of INDOT but its exposure could be increased
High and uniform “overall satisfaction” with INDOT
Customers’ view of INDOT has remained the same or has slightly improved over the past 12 months
continued on next page…..

2-13
Significant Findings
Key Take-Aways (continued)
INDOT has a positive image in• Trustworthiness• Keeping drivers safe• Helping Indiana’s economy
Areas of concern include• Completing construction/maintenance projects on time• Treating all parts of the state fairly

2-14
Significant Findings
Implications for Long-Range Planning
Nine policy areas are still relevant
People think that INDOT should focus on• Congestion management• Improved highway maintenance• Scheduling of construction and maintenance projects
Land resources and homeland security are key emerging issues
INDOT’s role in bus and passenger rail service is polarized
Safety and signage are big positives for INDOT
usage of INDOT facilitiestravel behavior and
2-15

2-16
Travel Behavior and Usage of INDOT Facilities
Customer Travel CharacteristicsSummary (details on following pages)
High auto ownership ─ only 3 percent without an auto
Automobile travel• 22 percent of individuals drove more than 15,000 miles/year• 42 percent of households drove more than 20,000 miles/year
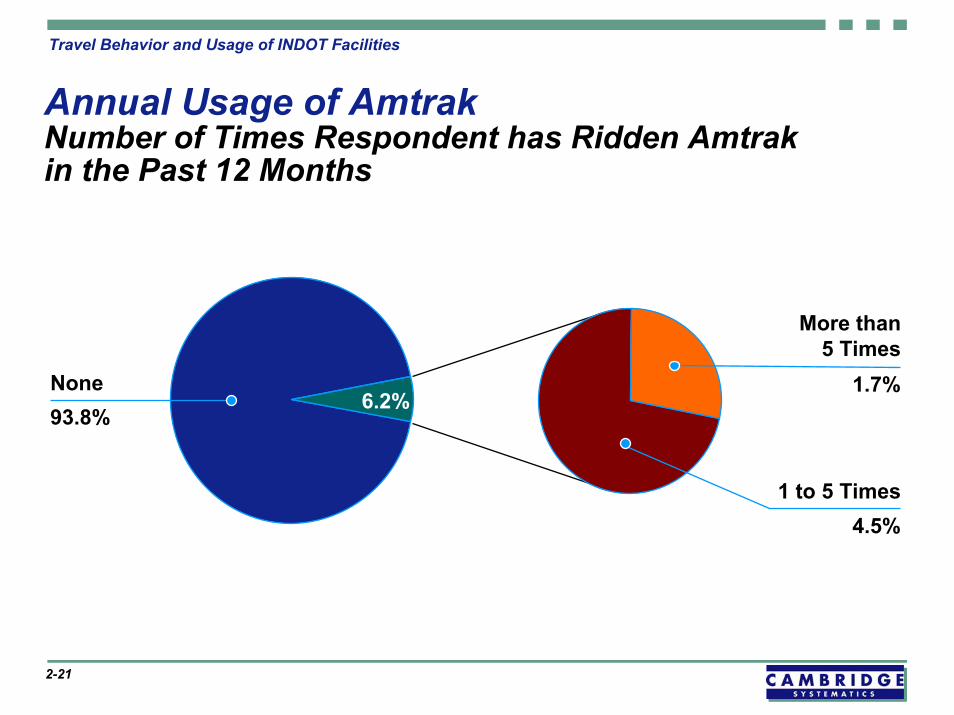
Travel by other modes• 43 percent traveled by air in last 12 months; 6.2 percent used
Amtrak• Fairly low transit use in last month
- 4.9 percent used transit at least once- Higher in urban areas – 9 percent in Lake County, 7 percent in
Marion County, 6 percent in Northern Indiana• Only 1.3 percent used transit 10 or more times each month

2-17
Travel Behavior and Usage of INDOT Facilities
Vehicle Availability in Household
No Vehicles3%
1 Vehicle23%
3 or More Vehicles
35%
2 Vehicles39%
• Only 3% have no vehicles
• Only 3% have no vehicles
• 74% of households have 2 or more vehicles
• 74% of households have 2 or more vehicles
• Lowest auto ownership was in Marion County• Highest was in southern Indiana• Highly correlated with household size and Income
• Lowest auto ownership was in Marion County• Highest was in southern Indiana• Highly correlated with household size and Income

2-18
Travel Behavior and Usage of INDOT Facilities
Miles Traveled by Person in Past 12 Months
• The amount of driving varies by geography
• People that drive 20,000 or more miles are twice as likely to be in rural counties
• The amount of driving varies by geography
• People that drive 20,000 or more miles are twice as likely to be in rural counties
Less than 5K31.25%
5 to 10 K23.38%
10 to 15K19.65%
15 to 20K9.52%
More than 20K12.57%
Don’t Know3.63%
2-19
Travel Behavior and Usage of INDOT Facilities
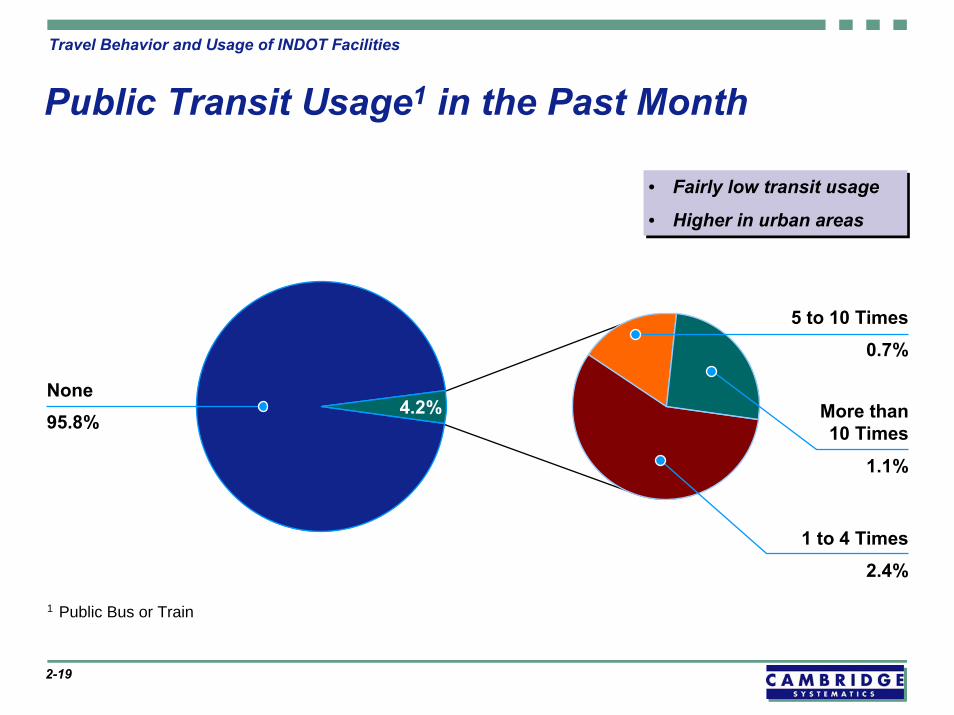
Public Transit Usage1 in the Past Month
• Fairly low transit usage
• Higher in urban areas
• Fairly low transit usage
• Higher in urban areas
4.2%
1.1%
0.7%
2.4%
95.8%None
1 to 4 Times
5 to 10 Times
More than10 Times
1 Public Bus or Train

2-20
Travel Behavior and Usage of INDOT Facilities
Annual Long-Distance TripsNumber of Times Respondent has made a Trip of 75 Miles or More in Past 12 Months
• Overall, a mix of long distance travel by Hoosiers
• Overall, a mix of long distance travel by Hoosiers
None 1 to 5Times
6 to 10Times
11 to 20Times
21 to 50Times
More Than50 Times
0
5
10
15
20
25
30
35
40
45Percent of Respondents
2-21
Travel Behavior and Usage of INDOT Facilities
Annual Usage of AmtrakNumber of Times Respondent has Ridden Amtrak in the Past 12 Months
4.5%
1.7%6.2%
1 to 5 Times
More than5 Times
93.8%None

2-22
Travel Behavior and Usage of INDOT Facilities
Annual Usage of Indiana AirportsNumber of Times Respondent has Traveled Through an Indiana Airport in the Past 12 Months
56%
36%
5%
3%
43%None
1 to 5 Times
6 to 10 Times
More than10 Times
• 36% of Hoosiers have been through an airport at least once in the past year
• 36% of Hoosiers have been through an airport at least once in the past year

2-23
Travel Behavior and Usage of INDOT Facilities
Usual Commuting ModeUsual Mode of Travel to Work in Past Week (of Those Working Outside Their Home)
• 97% of commute trips are by car• 97% of commute trips are by car
71.0%
2.5%25.7%
3.3%
0.8%
Drive Alone
Auto-Shared Ride
Bus/Commuter Rail
Walk/Bicycle
2-24
transportation agency’s role to you?
how important are various aspects of a state
2-24
2-25
Policies ─ How Important?
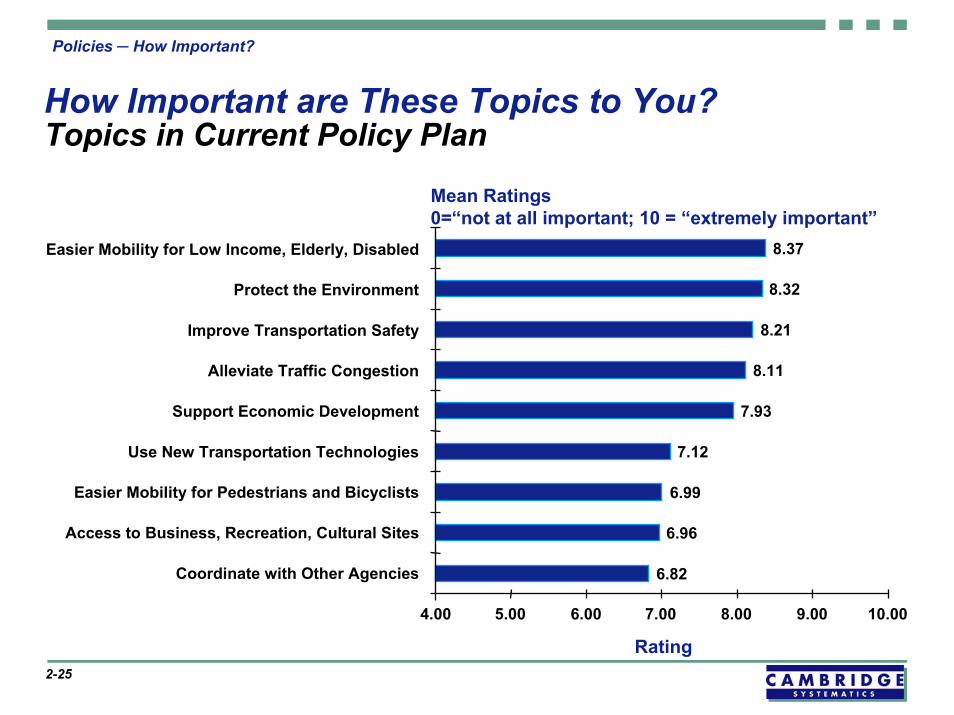
How Important are These Topics to You?Topics in Current Policy Plan
Mean Ratings 0=“not at all important; 10 = “extremely important”
6.82
6.96
6.99
7.12
7.93
8.11
8.21
8.32
8.37
4.00 5.00 6.00 7.00 8.00 9.00 10.00
Coordinate with Other Agencies
Access to Business, Recreation, Cultural Sites
Easier Mobility for Pedestrians and Bicyclists
Use New Transportation Technologies
Support Economic Development
Alleviate Traffic Congestion
Improve Transportation Safety
Protect the Environment
Easier Mobility for Low Income, Elderly, Disabled
Rating

2-26
Policies ─ How Important?
Extremities of OpinionsTopics in Current Policy Plan
Percent Rating Not Important (0-2)
0 10 20 30 40 50 60 70 80 90 100
Reduce Traffic Congestion
Improve Transportation Safety
Improve Access to Sites
Low Income, Elderly, Disabled
Coordinate with Agencies
Support Economic Development
Protect the Environment
Pedestrians and Bicyclists
Use New Technologies
Percent Rating Very Important (8-10)
Percent rating “very important” or “not important”
INDOT’s nine policy areas continue to be relevantINDOT’s nine policy areas continue to be relevant
2-27
Policies ─ How Important?
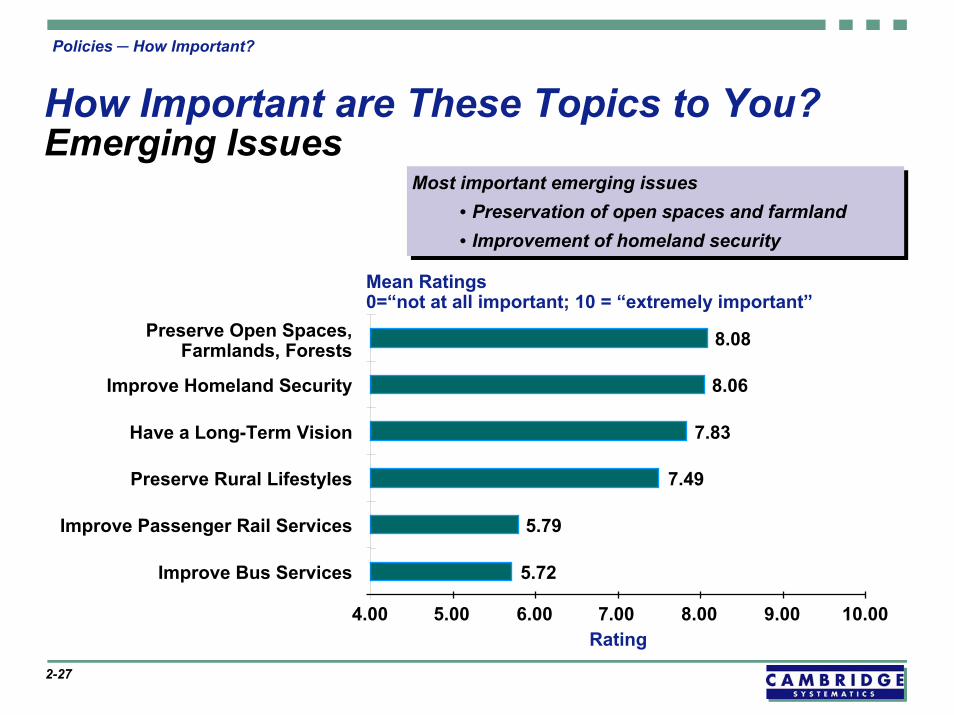
How Important are These Topics to You?Emerging Issues
Most important emerging issues• Preservation of open spaces and farmland• Improvement of homeland security
Most important emerging issues• Preservation of open spaces and farmland• Improvement of homeland security
Mean Ratings 0=“not at all important; 10 = “extremely important”
5.72
5.79
7.49
7.83
8.06
8.08
4.00 5.00 6.00 7.00 8.00 9.00 10.00
Improve Bus Services
Improve Passenger Rail Services
Preserve Rural Lifestyles
Have a Long-Term Vision
Improve Homeland Security
Preserve Open Spaces,Farmlands, Forests
Rating
2-28
Policies ─ How Important?
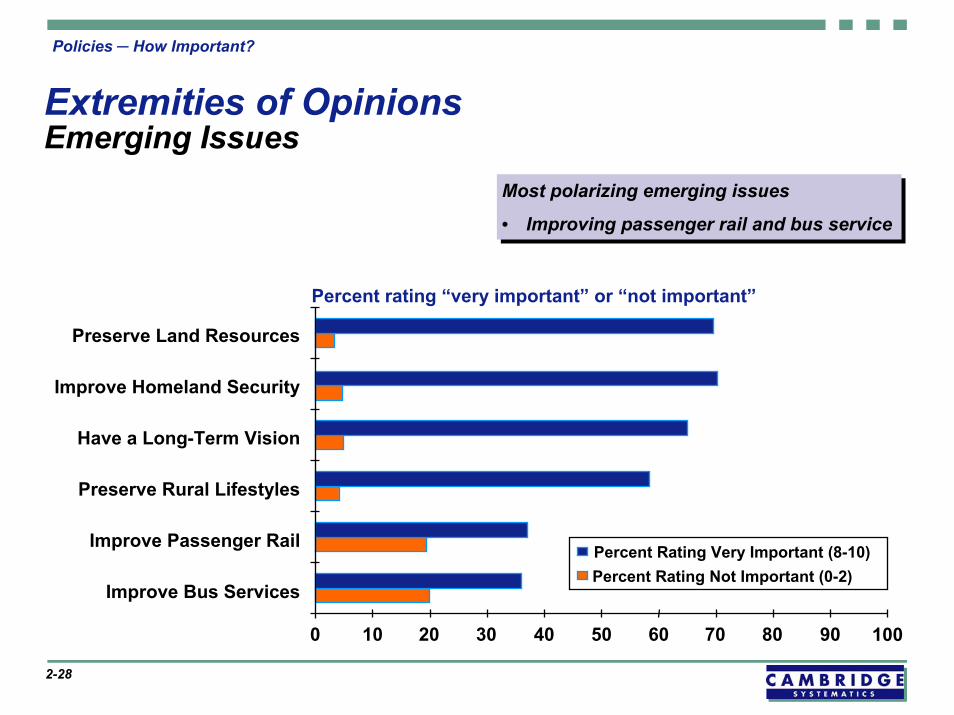
Extremities of OpinionsEmerging Issues
Most polarizing emerging issues
• Improving passenger rail and bus service
Most polarizing emerging issues
• Improving passenger rail and bus service
0 10 20 30 40 50 60 70 80 90 100
Have a Long-Term Vision
Improve Bus Services
Improve Passenger Rail
Preserve Land Resources
Preserve Rural Lifestyles
Improve Homeland Security
Percent rating “very important” or “not important”
Percent Rating Not Important (0-2)Percent Rating Very Important (8-10)

2-29
Policies ─ How Important?
Differences by Market Segment
By gender• Women placed higher importance on all topics
By geography• Congestion most important in Northwest Indiana• Transit very important in Northwest Indiana and
Marion County
EJ groups, as distinct from the general public• EJ population places greater importance on roughly half of
the statements• Greatest difference on bus and rail service improvements

2-30
Policies ─ How Important?
Women’s Point of View
Place higher importance on everything than men
Differences most pronounced when evaluating• Improvements in transportation safety• Enhanced mobility for low income, disabled, and elderly• Easier mobility for pedestrian and bicyclists• Improvements in homeland security• Preservation of open space, farmlands, and forests
Women appear to be a more receptive audience for improvements of a more qualitative nature

2-31
Policies ─ How Important?
Differences by Geography
“Alleviating traffic congestion” most important innorthwest Indiana
Transit very important in northwest Indiana and Marion County. More importance placed on• “Improving bus services”• “Improving passenger rail services”

2-32
Policies ─ How Important?
How EJ Populations Differ from General Population1
Non-EJ EJ Population
0
2.0
4.0
6.0
8.0
10.0
TransportationSafety Access to
Sites
EnhancedMobility Agency
Coordination
EnvironmentalProtection Pedestrian/
BikeMobility
NewTechnologies Bus
Services
RailServices
Rating
EJ population places greater importance on most statementsGreatest difference in importance is placed on
• Improvements in bus and passenger rail service• Enhanced mobility for low income, disabled, and elderly• Improved access to business, recreation, and cultural sites
EJ population places greater importance on most statementsGreatest difference in importance is placed on
• Improvements in bus and passenger rail service• Enhanced mobility for low income, disabled, and elderly• Improved access to business, recreation, and cultural sites
1 More detail on this topic is provided in a separate memorandum

of INDOT prioritiescustomers’ view
2-33

2-34
Customers’ View of Priorities
Do INDOT’s Customers Think it Has the Right Priorities?
We asked these questions• Overall, is INDOT on the right track?• Unaided, what do the customers say?• Does INDOT devote too much or too little attention to certain
policy areas?• Are INDOT’s spending priorities in the right place?• How did these answers vary by market segment?
2-35
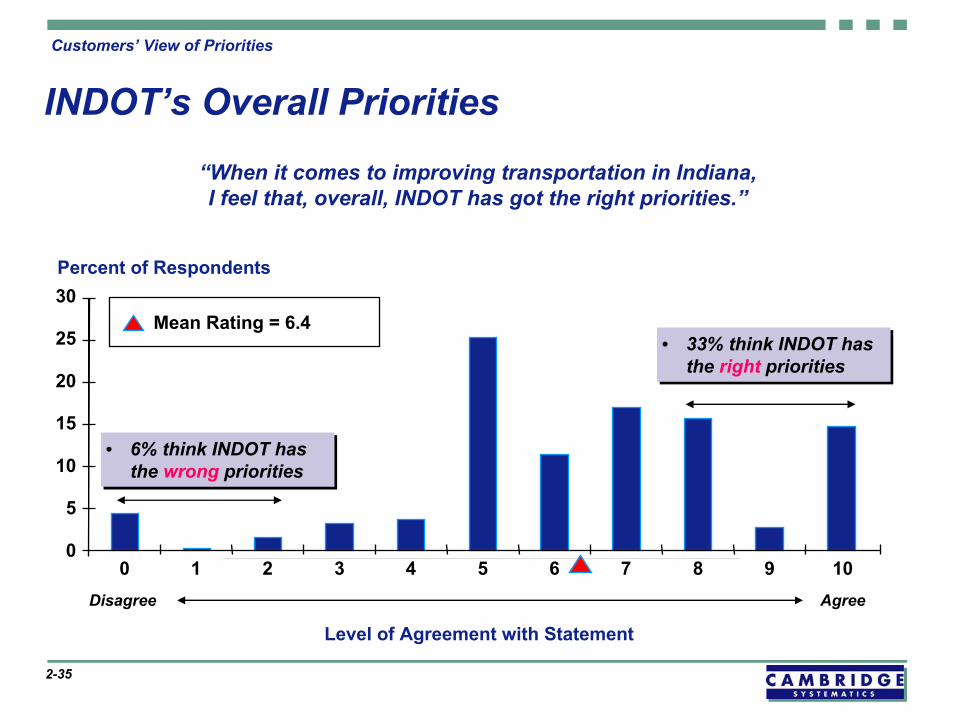
Customers’ View of Priorities
INDOT’s Overall Priorities“When it comes to improving transportation in Indiana,I feel that, overall, INDOT has got the right priorities.”
• 33% think INDOT has the right priorities
• 33% think INDOT has the right priorities
0
5
10
15
20
25
30Percent of Respondents
0 1 2 3 4 5 6 7 8 9 10
Mean Rating = 6.4
• 6% think INDOT has the wrong priorities
• 6% think INDOT has the wrong priorities
Disagree Agree
Level of Agreement with Statement

2-36
Customers’ View of Priorities
What Should INDOT’s Top Priorities Be?
“In your opinion, what should be INDOT’s top priorities in the future?”
Number of Respondents0 25 50 75 100 125 150 175 200 225 250
Keeping Roads Safe and Secure
Maintain Existing Roads(Repair Potholes, Etc.)
Increase Public/MassTransportation Availability
Reduce Traffic Congestion
Build New/Better Roads
Protecting the Environment/Wildlife/Reducing Pollution
Make It Easier for Disabled/LowIncome/Elderly to get Around
Open ended question, with up to three responses allowedOpen ended question, with up to three responses allowed
Most frequent responses were
•Safety•Maintenance
Most frequent responses were
•Safety•Maintenance
8%
9%
9%
11%
13%
24%
26%

2-37
Customers’ View of Priorities
“Does INDOT Give too Little, About the Right Amount, or too Much Attention to these Policy Areas?”Nine Policy Areas from Policy Plan
0 10 20 30 40 50 60
Reduce Traffic Congestion too Little Attention to Policy Areas
Improve Transportation Safety
Improving Access to Business
Make it Easier for Low Income, Elderly, and Disabled Persons to get Around
Actively Coordinate with and Assist Other Agencies
Support Economic Development in the State
Protect the Environment
Make It Easier for Pedestrians and Bicyclists to get Around
Use New Transportation Technologies
Create a Long Term Vision
Percent indicating “too little”
2-38
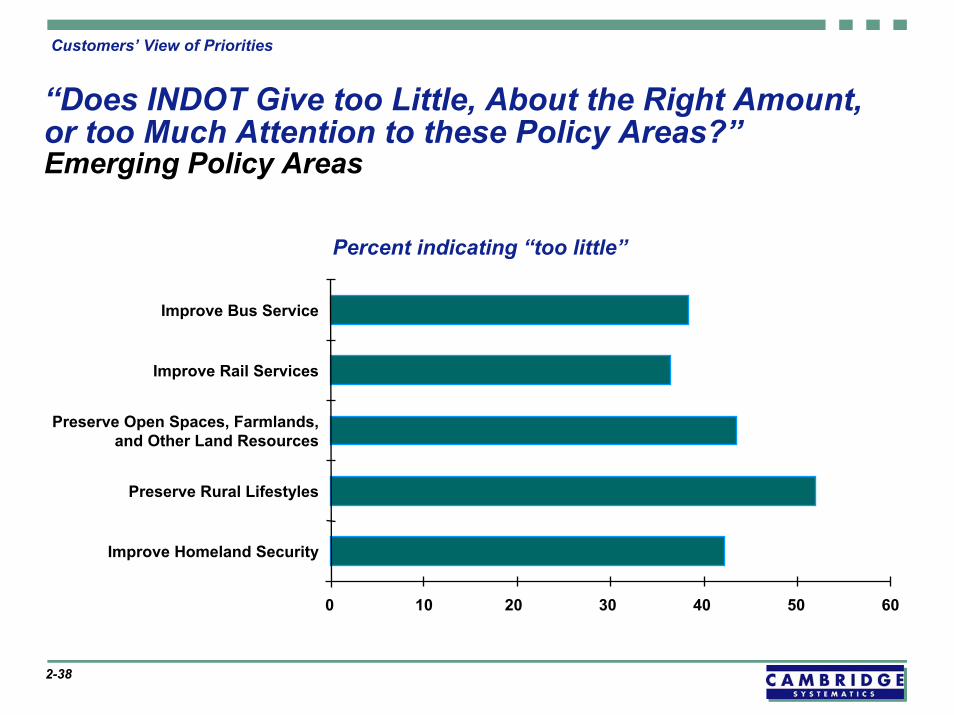
Customers’ View of Priorities
“Does INDOT Give too Little, About the Right Amount, or too Much Attention to these Policy Areas?”Emerging Policy Areas
Percent indicating “too little”
Improve Bus Service
Improve Rail Services
Preserve Open Spaces, Farmlands, and Other Land Resources
Preserve Rural Lifestyles
Improve Homeland Security
0 10 20 30 40 50 60

2-39
Customers’ View of Priorities
Change the Current Funding Allocation?
No80%
Yes20%
Last year, INDOT spent about
• 70 percent of its available construction funds on paving and maintaining highways and repairing bridges
• 20 percent on new roadway projects, and
• 10 percent on non-highway programs, like public transit and airports
If it were up to you, would you use the same allocation?

2-40
Customers’ View of Priorities
Should INDOT Adjust its Funding Allocation?
Respondents Who Want to See a Reallocation of Funding by INDOT(refer to question on previous page)
11.3
7.05.5
8.2
12.814.8
0
10
20
70% Allocation to Repair and Maintenance
for Highways
20% Allocation to New Roadways
10% Allocation to Public Transit/Airports
Percent of Respondents
Dec
reas
e
Incr
ease

2-41
Customers’ View of Priorities
How Did Answers Vary by Market Segment?
Members of the EJ population believe that INDOT pays too little attention to• Improving access to business, recreation, and cultural sites• Making it easier for low income, elderly, and disabled to
move around• Coordinating with other agencies• Improving bus services
Lake County and rural southern Indiana residents believe INDOT pays too little attention to reducing traffic congestion
Lake and Marion County residents believe INDOT pays too little attention to improving bus services
importance and satisfaction
INDOT services ─
2-42

2-43
Services ─ How Important?
INDOT Services
Questions focused on eight specific services provided by INDOT• Probed two dimensions of respondents’ perceptions
- Importance of each INDOT service- Satisfaction with each aspect of service
The results tell us• What do customers think is important? • Where does INDOT service lag?• How can INDOT focus on service weaknesses that are
important to its customers?

2-44
Services ─ How Important?
How Important are These INDOT Services to You?• High stated importance across the board• Most important services include safety, good repair of
bridges, and keeping highways smooth.• Least important is “building and expanding highways”
• High stated importance across the board• Most important services include safety, good repair of
bridges, and keeping highways smooth.• Least important is “building and expanding highways”Percent Rating Not Important (0-2)
Percent Rating Very Important (8-10)
0 10 20 30 40 50 60 70 80 90 100
Build and Expand Highways
Keep Highways Smooth
Maintain Bridges in Good Repair
Keep Highways Clean
Keep Highways Safe
Provide Clear Highway Signs
Keep Roads Clear of Congestion
Truck Traffic Flowing SmoothlyPercent rating “very important” or “not important”

2-45
Services ─ How Important?
How Satisfied are You With the Services that INDOT Provides?
• Greater variation than the importance ratings• Highest level of satisfaction with safety,
signage, and bridge repair• Lowest level of satisfaction with keeping
highways smooth and keeping roadways free of congestion
• Greater variation than the importance ratings• Highest level of satisfaction with safety,
signage, and bridge repair• Lowest level of satisfaction with keeping
highways smooth and keeping roadways free of congestion
Build and Expand Highways
Keep Highways Smooth
Maintain Bridges in Good Repair
Keep Highways Clean
Keep Highways Safe
Provide Clear Highway Signs
Keep Roads Clear of Congestion
Truck Traffic Flowing Smoothly
Percent Rating Not Satisfied (0-2)Percent Rating Very Satisfied (8-10)
0 10 20 30 40 50 60 70 80 90 100

2-46
Services ─ How Important?
Satisfaction Versus ImportanceAnalysis Framework
Priorities for Improvements
ImportanceLow
High
Satisfaction
Low
High
Communicationof successes
Low Priority
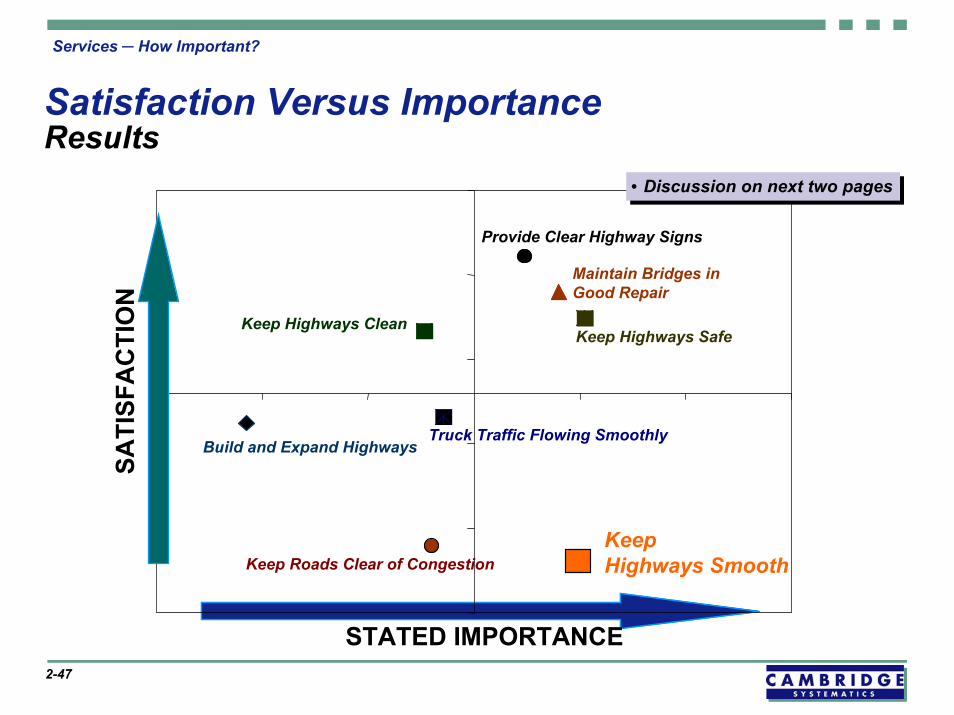
Comparing the importance customers place on certain services to their satisfaction with those services gives INDOT some clues as to where to focus their attention.
Areas which are importantto customers are on the right side. Areas with low satisfaction are at the bottom. So, areas that show up towards the bottom right hand corner of the chart on the next page are those where INDOT should focus its attention
2-47
Services ─ How Important?
Satisfaction Versus ImportanceResults
Build and Expand Highways
Maintain Bridges in Good Repair
Keep Highways CleanKeep Highways Safe
Provide Clear Highway Signs
Keep Roads Clear of Congestion
Truck Traffic Flowing Smoothly
STATED IMPORTANCE
SATI
SFA
CTI
ON
• Discussion on next two pages• Discussion on next two pages
Keep Highways Smooth

2-48
Services ─ How Important?
Satisfaction Versus ImportanceStrengths
Clear success stories• Safety – “keep highways safe”• Signage – “provide clear highway signs”• Level of bridge repair – “maintain bridges in good repair”
What should INDOT do about these?• Communicate success to the public• Monitor service offered to ensure continuity
2-49
Services ─ How Important?
Satisfaction Versus ImportanceWeaknesses
Important areas that need to receive attention by INDOT• Pavement maintenance – “keeping highways smooth”• Congestion management – “keep roads free of congestion”• Truck traffic management – “truck traffic flowing smoothly”
INDOT should develop performance measures to• Verify perceptions• Locate problem spots• Determine and implement changes
INDOT should monitor service and communicate improvements to the public
2-50
Services ─ How Important?
How Did Satisfaction Vary by Market Segments?
“Keeps truck traffic flowing smoothly”• Lake County residents were significantly less satisfied• Northern Indiana rural county residents were the
most satisfied
“Keeps roads clear of congestion”• Lake and Marion County residents were less satisfied• Northern Indiana rural county residents were most satisfied

2-51
Services ─ How Important?
How Did Importance Vary by Market Segments?
“Keeping highways free of congestion”• Most important to Lake County residents and EJ
respondents• Much less important to residents of rural counties• Very important to women respondents
“Build and expand highways to keep pace with land development”• Most important to Lake County residents• Least important to rural county residents
Women placed greater importance on safety, signage, and a smooth flow of truck traffic

towards INDOT –awareness and image
attitudes
2-52
2-53
Attitudes Toward INDOT
Attitudes toward INDOT – Awareness and ImageSummary (details follow)
Customers indicate a reasonable level of INDOT awareness during last 12 months• 14 percent very aware of INDOT “in the news”• 46 percent had heard something about INDOT
Customers image of INDOT generally neutral
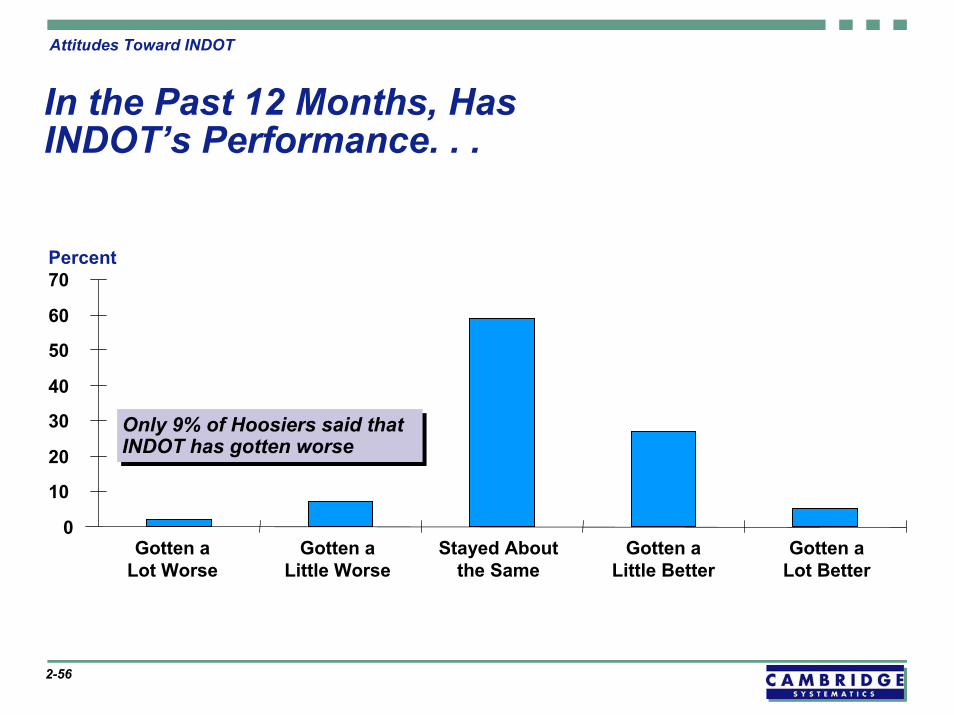
Customers view of INDOT over the past 12 months is generally steady or improving• Has deteriorated (9 percent)• Has stayed the same (59 percent)• Has improved at least somewhat (32 percent)

2-54
Attitudes Toward INDOT
How Much Have You Heard About INDOT Lately?
Nothing40%
Something46%
A Lot14%
2-55
Attitudes Toward INDOT
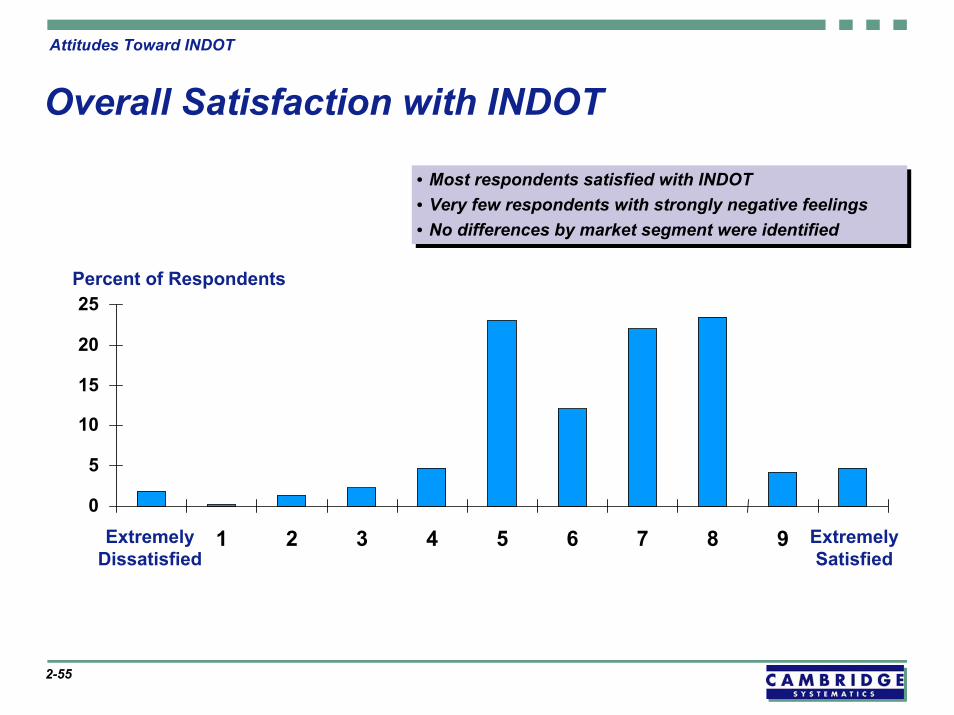
Overall Satisfaction with INDOT
• Most respondents satisfied with INDOT• Very few respondents with strongly negative feelings• No differences by market segment were identified
• Most respondents satisfied with INDOT• Very few respondents with strongly negative feelings• No differences by market segment were identified
Percent of Respondents
0
5
10
15
20
25
Extremely Dissatisfied
1 2 3 4 5 6 7 8 9 Extremely Satisfied
2-56
Attitudes Toward INDOT
In the Past 12 Months, Has INDOT’s Performance. . .
Only 9% of Hoosiers said that INDOT has gotten worseOnly 9% of Hoosiers said that INDOT has gotten worse
0
10
20
30
40
50
60
70
Gotten a Lot Worse
Gotten a Little Worse
Stayed About the Same
Gotten a Little Better
Gotten a Lot Better
Percent

2-57
Attitudes Toward INDOT
Image Ratings
“How well does this phrase describe INDOT (0-10 scale)?”
0 10 20 30 40 50 60 70 80 90 100
See next page for interpretationSee next page for interpretation
Does not Describe INDOT (0-2)Describes INDOT Well (8-10)
Protects INDOT Natural Environment
Provides Leadership to Move INDOT Forward
Helps INDOT Economy
Is Good at Managing Growth
Completes Construction and Maintenance On Time
Keeps Drivers Safe
Puts Funds to Good Use
Is Trustworthy
Treats all Parts of the State and all Groups Fairly

2-58
Attitudes Toward INDOT
Image RatingsInterpretation
The majority of respondents have a “neutral” view of INDOT image
A third or more believe that INDOT performs well in ─• Trustworthiness• Keeping drivers safe• Helping Indiana’s economy
There was greater dissatisfaction with INDOT in these categories ─• Completing construction/maintenance projects on time• Treating all parts of the state fairly

INDOT highway facilities
recent experiences with
2-59

2-60
Recent Experiences
Recent Experiences with INDOT Highways
“In the past 30 days, how often have you encountered….?”
Respondents Responding “Frequently”and “Almost Every Day” (in Percent)
0 10 20 30 40 50
Unacceptable Traffic Congestion
Unacceptable Pavement Quality
Unsafe Road Conditions
Missing or Confusing SignsCustomers show more concern with pavement quality and traffic congestion than with signing or safety
Customers show more concern with pavement quality and traffic congestion than with signing or safety
survey participantsdemographics of
2-61

2-62
Demographics of Survey Participants
Demographics of Survey ParticipantsSummary (details follow)
Generally consistent with year 2000 Census data
Representative of different areas in the state
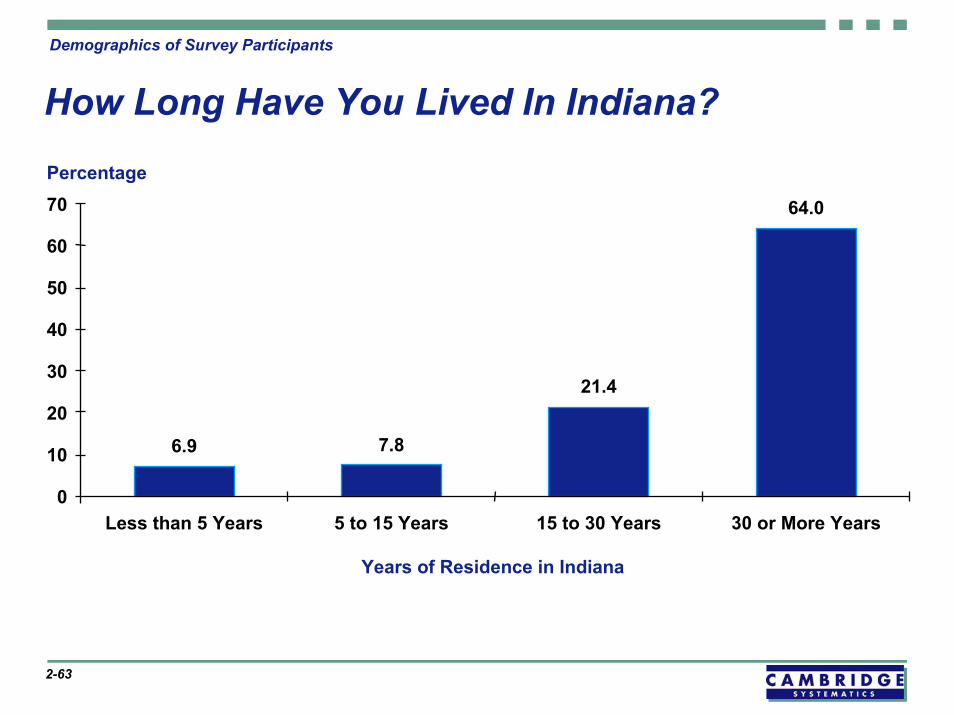
Majority of respondents are long-time residents of the state
2-63
Demographics of Survey Participants
How Long Have You Lived In Indiana?
6.9 7.8
21.4
64.0
0
10
20
30
40
50
60
70
Less than 5 Years 5 to 15 Years 15 to 30 Years 30 or More Years
Years of Residence in Indiana
Percentage

2-64
Demographics of Survey Participants
Household Size
16.9
35.3
20.7
15.2
7.94.0
0
5
10
15
20
25
30
35
40
1 2 3 4 5 6 or MorePeople in theHousehold
Household Size
Percentage

2-65
Demographics of Survey Participants
Household Workers
Workers in Household
19.3
30.736.4
13.5
05
10152025303540
No Workers One Worker Two Workers Three Or MoreWorkers
Percentage
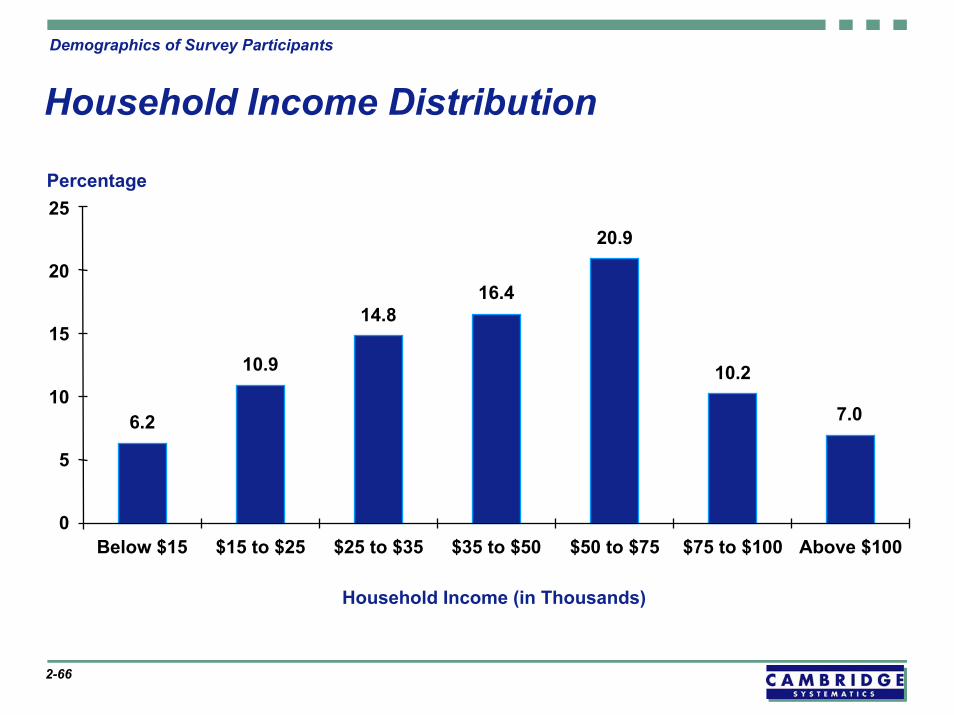
2-66
Demographics of Survey Participants
Household Income Distribution
Household Income (in Thousands)
6.2
10.9
14.816.4
20.9
10.2
7.0
0
5
10
15
20
25
Below $15 $15 to $25 $25 to $35 $35 to $50 $50 to $75 $75 to $100 Above $100
Percentage

2-67
Demographics of Survey Participants
Respondent Employment Status
49.2
9.6
8.1
19.2
2.6
3.5
4.9
0.7
0.9
1.3
0.1
0.1
0 5 10 15 20 25 30 35 40 45 50
Employed Part-Time
A Full-Time Homemaker
Employed Full-Time
Percentage
Self-Employed
Retired
A Full-Time Student
Not Presently Employed
DK/Refused
Permanently Disabled/On Disability
Employed and a College Student
Maternity Leave
Seasonal Employment

2-68
Demographics of Survey Participants
Respondent Age Distribution
1.8
9.0
15.4
29.2
26.3
18.4
0 5 10 15 20 25 30 35
Under 18
18-25
25-35
35-50
50-65
Over 65
Distribution (in Years)
Percentage
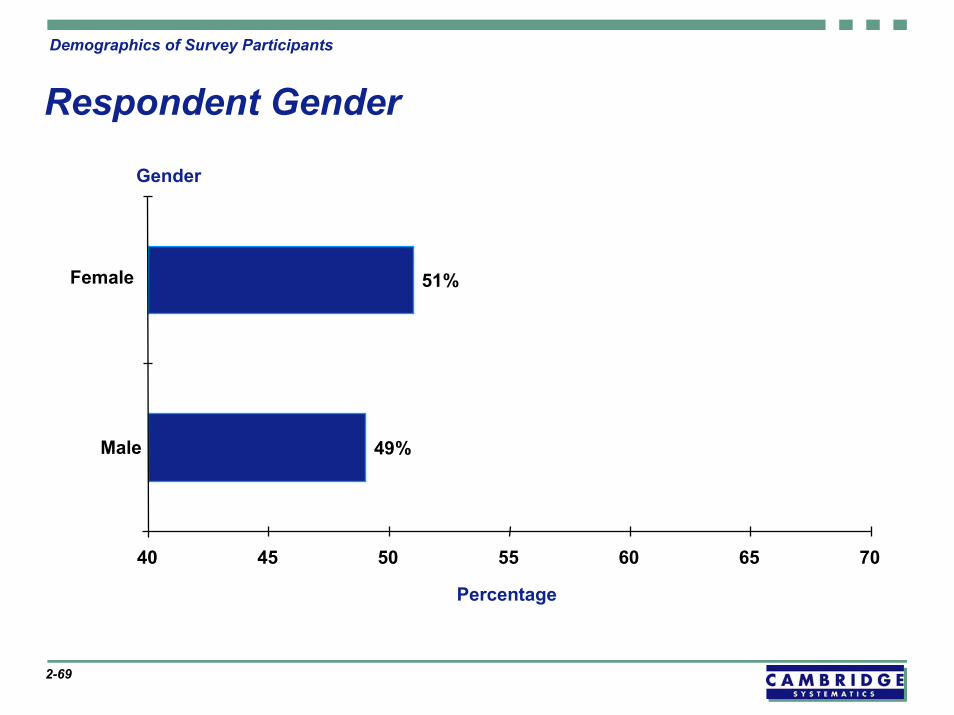
2-69
Demographics of Survey Participants
Respondent Gender
49%
51%
40 45 50 55 60 65 70
Male
Female
Gender
Percentage
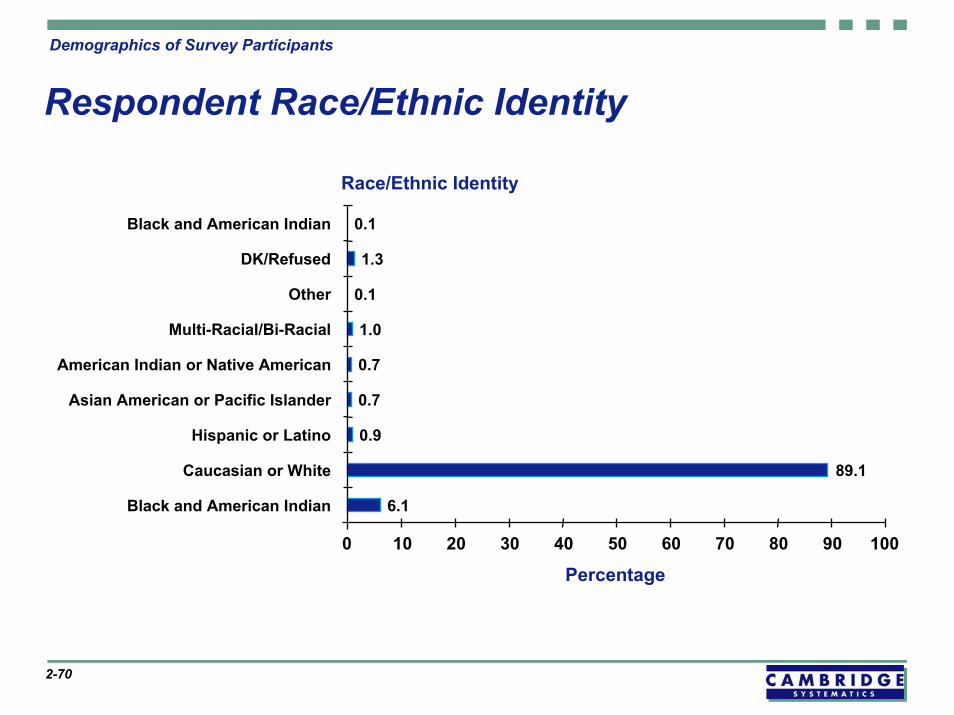
2-70
Demographics of Survey Participants
Respondent Race/Ethnic Identity
6.1
89.1
0.9
0.7
0.7
1.0
0.1
1.3
0.1
0 10 20 30 40 50 60 70 80 90 100
Black and American Indian
Caucasian or White
Hispanic or Latino
Asian American or Pacific Islander
American Indian or Native American
Multi-Racial/Bi-Racial
Other
DK/Refused
Black and American Indian
Percentage
Race/Ethnic Identity