Embed Size (px)
DESCRIPTION
7.4 Use Normal Distributions. 7.3-7.4 HW Quiz: August 18 7.3-7.4 Quiz: August 20. Vocabulary. Normal Distribution Is modeled by a bell-shaped curve called a normal curve that is symmetric about the mean. The total area under the related curve is 1. - PowerPoint PPT Presentation
Citation preview
7.4Use Normal Distributions
7.3-7.4 HW Quiz: August 18
7.3-7.4 Quiz: August 20
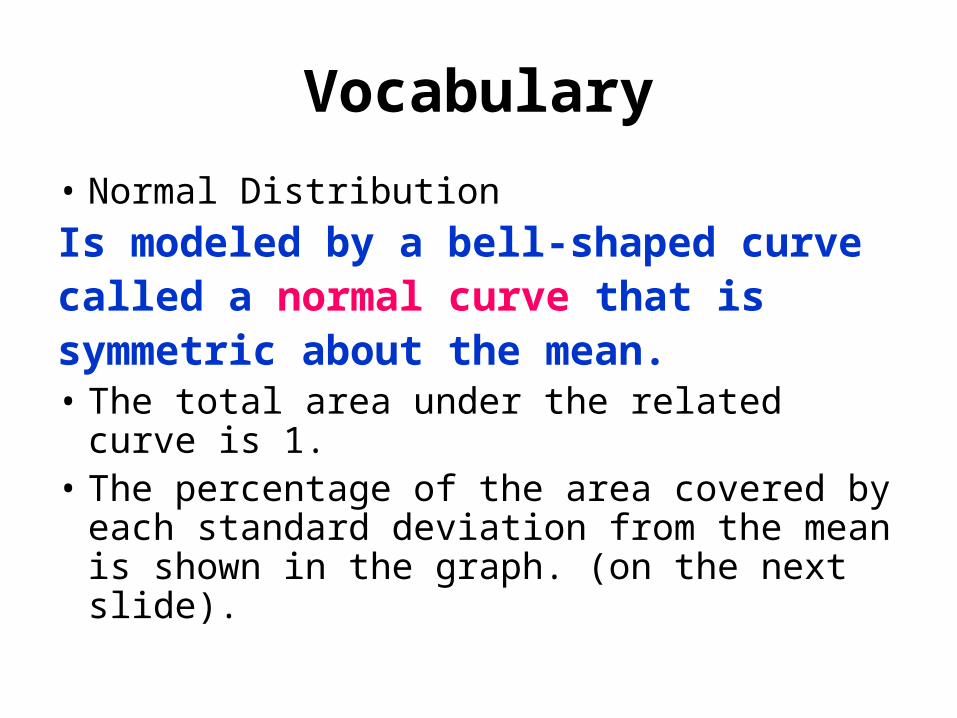
Vocabulary
• Normal Distribution
Is modeled by a bell-shaped curvecalled a normal curve that issymmetric about the mean.• The total area under the related curve is 1.• The percentage of the area covered by
each standard deviation from the mean is shown in the graph. (on the next slide).
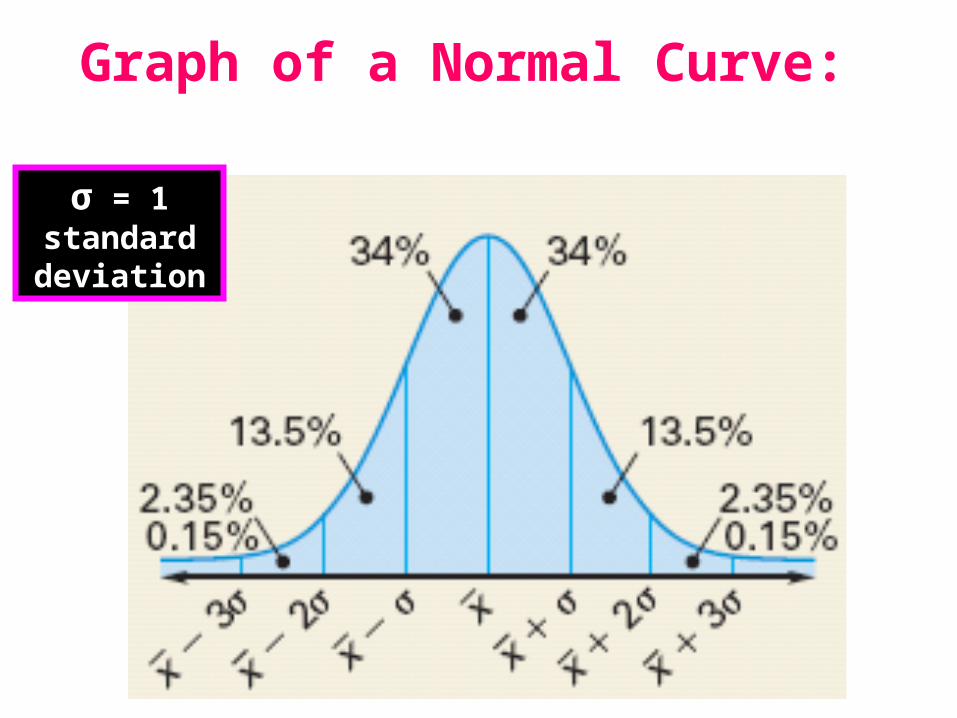
Graph of a Normal Curve:
σ = 1 standard deviation
Vocabulary
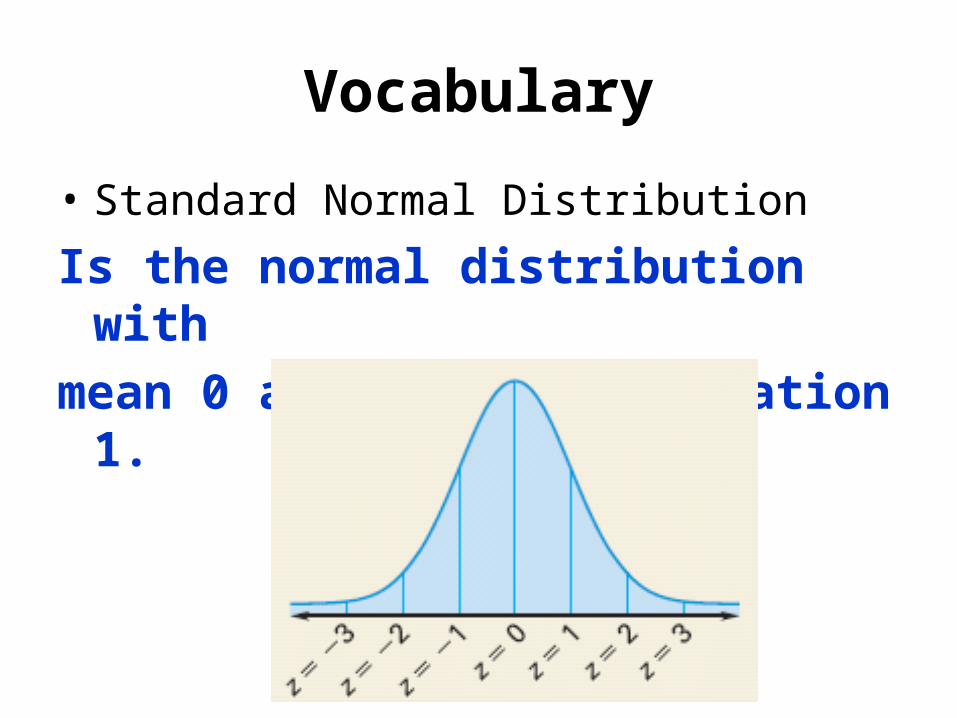
• Standard Normal Distribution
Is the normal distribution with
mean 0 and standard deviation 1.
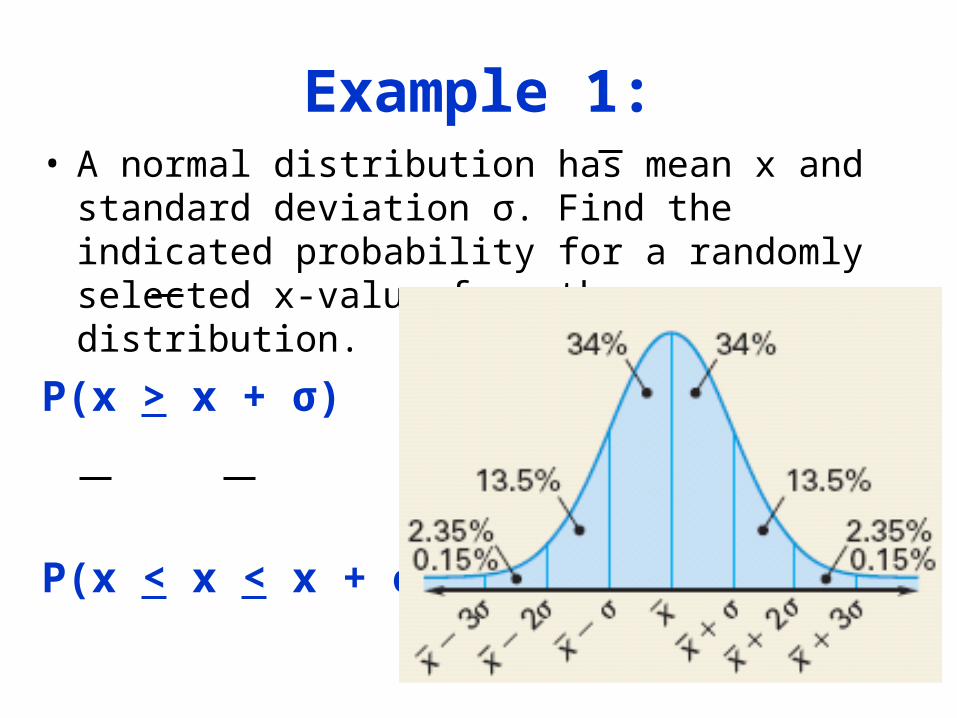
Example 1:• A normal distribution has mean x and standard
deviation σ. Find the indicated probability for a randomly selected x-value from the distribution.
P(x > x + σ)
P(x < x < x + σ)
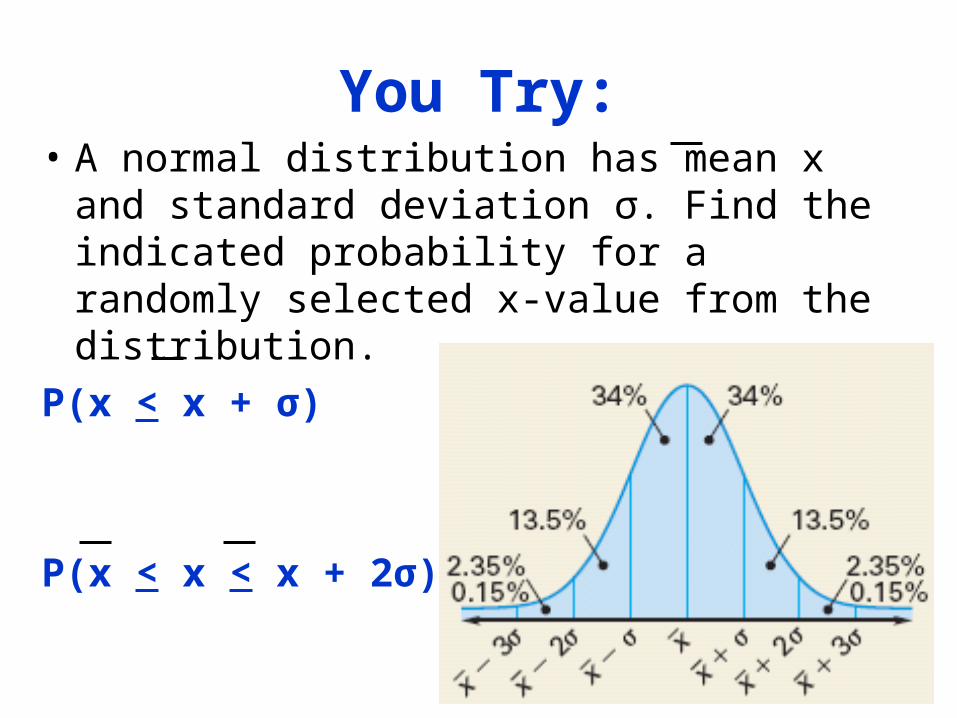
You Try:• A normal distribution has mean x and
standard deviation σ. Find the indicated probability for a randomly selected x-value from the distribution.
P(x < x + σ)
P(x < x < x + 2σ)
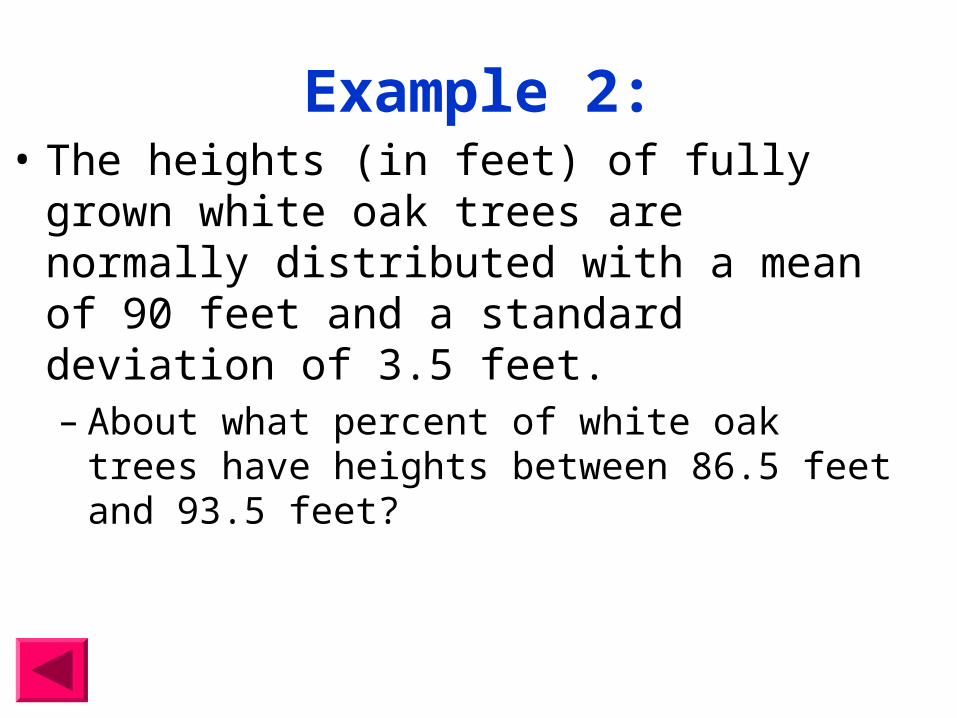
Example 2:• The heights (in feet) of fully grown white oak
trees are normally distributed with a mean of 90 feet and a standard deviation of 3.5 feet.– About what percent of white oak trees have
heights between 86.5 feet and 93.5 feet?
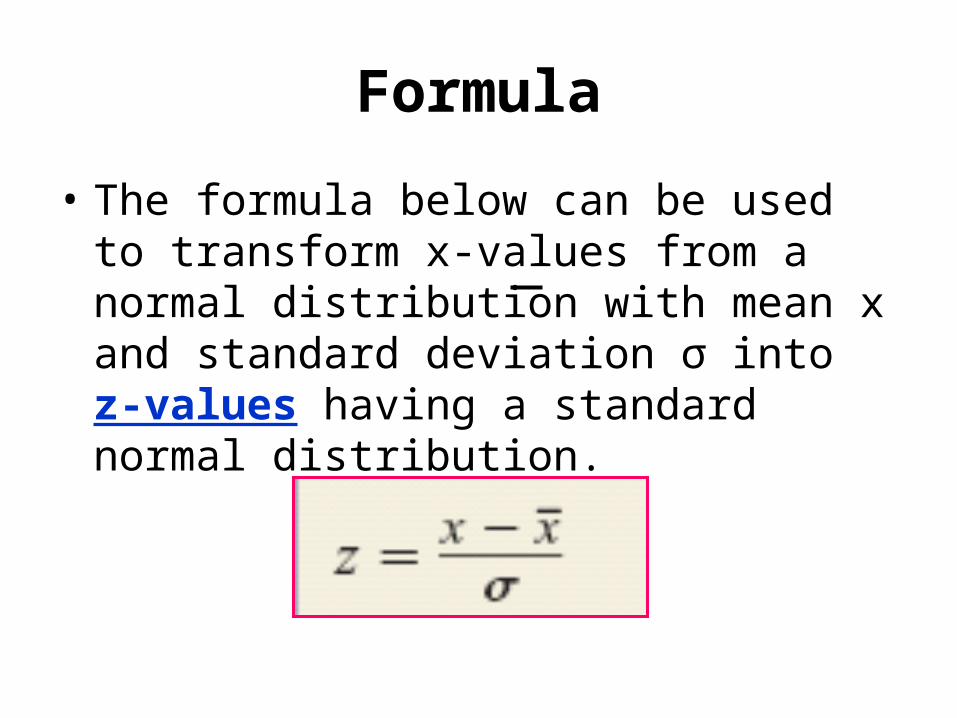
Formula
• The formula below can be used to transform x-values from a normal distribution with mean x and standard deviation σ into z-values having a standard normal distribution.
Z-Value
• The z-value for a particular x-value is called the z-score for the x-value and is the number of standard deviation the x-value lies above or below the mean x.
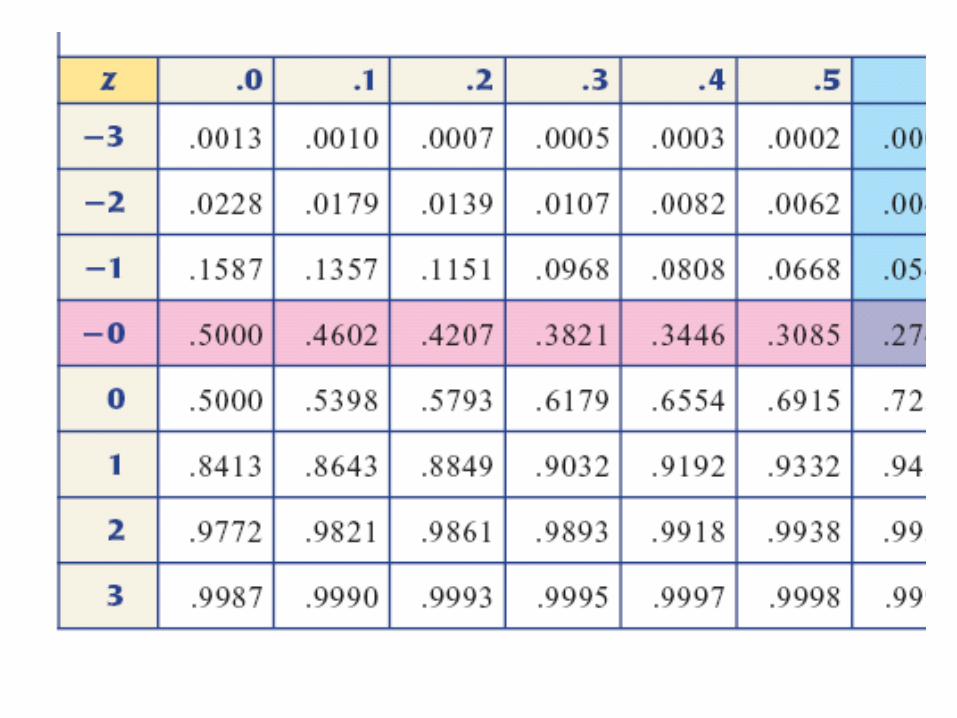
***To use the z-score you will need to look at the table that is on p. 296 in your textbook***
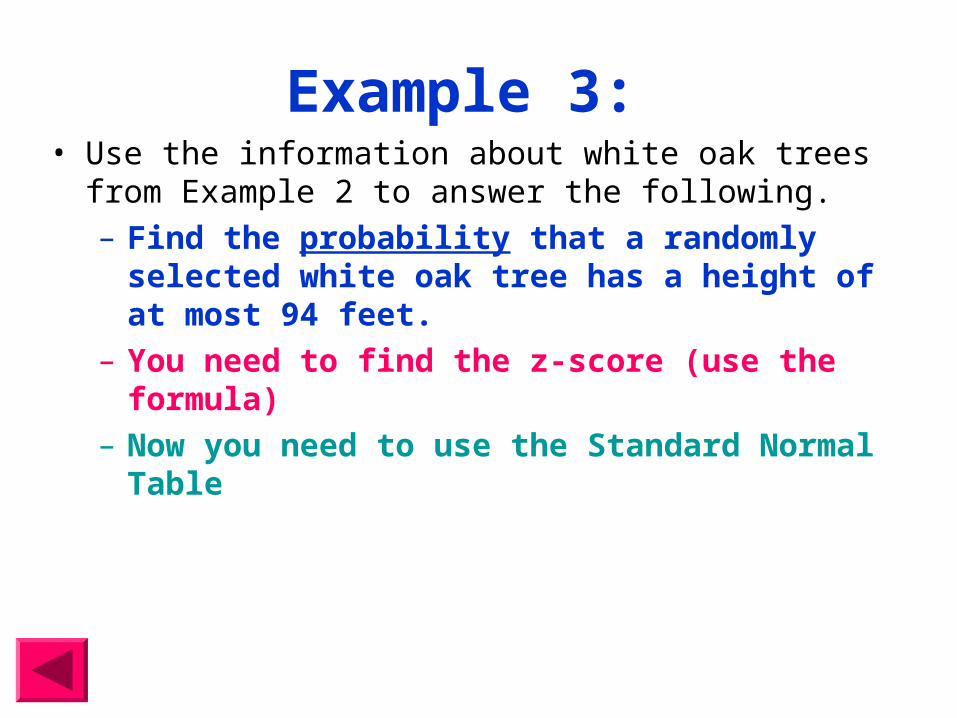
Example 3: • Use the information about white oak trees from Example
2 to answer the following. – Find the probability that a randomly selected
white oak tree has a height of at most 94 feet. – You need to find the z-score (use the formula)– Now you need to use the Standard Normal Table
You Try:
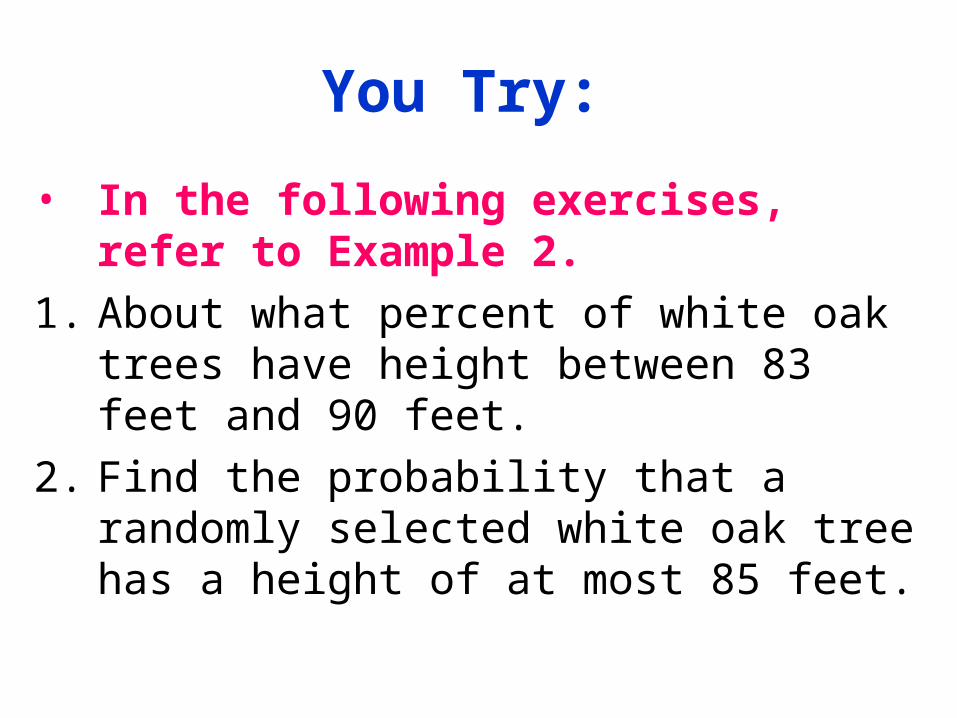
• In the following exercises, refer to Example 2.
1. About what percent of white oak trees have height between 83 feet and 90 feet.
2. Find the probability that a randomly selected white oak tree has a height of at most 85 feet.
Homework
P. 266
#1-19odd