Embed Size (px)
Citation preview

www.moodys.com
Corporate FinanceMoody’s Global
Special Comment
Table of Contents: Summary 1
I. Data and Methodology 3 II. Metrics by Rating Category Aggregated Across All Industries 3 III. Industry Study 4
EBITA / Average Assets 5 EBITA / Interest Expense 6 EBITA Margin 7 Operating Margin 7 (FFO + Interest Expense) / Interest Expense 8 FFO / Debt 9 Retained Cash Flow / Net Debt 9 Debt / EBITDA 10 Debt / Book Capitalization 11 CAPEX / Depreciation 12 Revenue Volatility 13
IV. Discussion 13 Appendix A: Detailed Distributions by Credit Metric 16 Appendix B: Definition of Credit Ratios 28 Appendix C: Definition of Industry Aggregates 29 Moody’s Related Research 30
Analyst Contacts:
New York 1.212.553.1653
Qidong (Tony) Zhang Associate Analyst
Jennifer Tennant Assistant Vice President – Analyst
Albert Metz Senior Vice President
December 2009
Moody's Financial Metrics™ Key Ratios by Rating and Industry for Global Non-Financial Corporations: December 2009 Summary
This paper outlines key financial ratios across industries for each broad rating category for global non-financial non-utility corporations. The global category includes EMEA, Asia and the Americas and the ratios are based on the most recent fiscal year-end data. In addition to presenting these ratios by each rating and industry combination, we also focus on the Baa-rated issuers to deepen our analysis.
The underlying data are taken from Moody’s Financial Metrics™, a data and analytics platform that provides as-reported and adjusted financial data, ratios, models and interactive rating methodologies. The adjustments are described in detail in Moody’s Approach to Global Standard Adjustments in the Analysis of Financial Statements for Non-Financial Corporations - Parts I, II and III.
For more information, see Moody’s Financial Metrics homepage, www.MoodysFM.com.
The metrics presented are:
EBITA / Average Assets
EBITA / Interest Expense
EBITA Margin
(FFO + Interest Expense) / Interest Expense
FFO / Debt
RCF / Net Debt
Debt / EBITDA
Debt / Book Capitalization
Operating Margin
CAPEX / Depreciation Expense
Revenue Volatility

2 December 2009 Special Comment Moody’s Global Corporate Finance - Moody's Financial Metrics™ Key Ratios by Rating and Industry for Global Non-Financial Corporations: December 2009
Special Comment Moody’s Global Corporate Finance
Moody's Financial Metrics™ Key Ratios by Rating and Industry for Global Non-Financial Corporations: December 2009
These eleven ratios provide a useful and foundational set of metrics for comparative analysis, with broad applications both across regions and, pertinent to this study, across industries. Combinations of these ratios, sometimes further modified by non-public data, are used in our rating methodologies in conjunction with industry-specific measures and subjective judgments. The definitions of the ratios are presented in Appendix B.
A companion spreadsheet containing the data presented in this report is available on the Moody’s Financial Metrics homepage, www.MoodysFM.com. (Click here to view file).
We stress however that this report is not intended to describe Moody’s rating process. Ratio analysis is but one part of Moody’s analytical process. Qualitative and forward-looking considerations are also important. Interested readers are referred to Moody’s rating methodologies for detailed discussions of our analytical approach and core ratios for each industry. When Moody’s does analyze financial ratios, it uses a multivariate approach. As a result, a simple monotonic relationship between ratings and any single ratio should not generally be expected at the industry level.
Section I of the report describes details of the data and methodology. Section II presents a brief review of the distribution of these metrics in the aggregate by rating category – that is, without regard to industry classification. Results for all Baa rated issuers by industry are presented in Section III, with subsections devoted to each of the eleven metrics. Section IV contains some brief discussion and analysis.
Each exhibit in Appendix A focuses on a single financial metric and shows how its median values vary across industries and across rating categories. Definitions of the ratios are provided in Appendix B, while descriptions of the industry aggregates are presented in Appendix C.
Our analysis shows the following:
In the aggregate, there exists a strong monotonic relationship between these metrics and ratings.
(FFO + Interest Expense) / Interest Expense monotonically increases with ratings, as expected. Debt / Book Capitalization monotonically decreases.
The median FFO / Debt, EBITA / Average Assets, EBITA / Interest Expense, EBITA Margin, Operating Margin and RCF / Net Debt are somewhat lower for Aa than A issuers; this may again be an artifact of the small Aa sample.
Industries with consistently better-than-average metrics for Baa rated issuers include:
Metals & Mining,
Energy & Environment, and
Healthcare
Industries with consistently weaker-than-average metrics for Baa issuers include:
Transportation,
Automotive, and
Retail & Distribution
The evidence suggests that more intrinsically risky industries are required to achieve better credit ratios to obtain a given rating. Put simply, those industries with more volatile revenues tend to be the same as
those with otherwise better credit metrics. This result is consistent with prior research.1
Table A.12 in Appendix A shows changes between the 2008 medians and latest available medians for Baa-rated issuers by industry. We plan to publish a new Special Comment that studies the percentage change in credit metrics at the end of first quarter in 2010.
1 See, for example, “The Distribution of Common Financial Ratios by Rating and Industry for North American Non-Financial Corporations,” Moody’s Special
Comment, July 2006.

3 December 2009 Special Comment Moody’s Global Corporate Finance - Moody's Financial Metrics™ Key Ratios by Rating and Industry for Global Non-Financial Corporations: December 2009
Special Comment Moody’s Global Corporate Finance
Moody's Financial Metrics™ Key Ratios by Rating and Industry for Global Non-Financial Corporations: December 2009
d .
I. Data and Methodology
Financial data for this study are taken from the most recently available fiscal year-end filings in Moody’s Financial Metrics™. The metrics that we study include measures of coverage, leverage, cash flow-to-debt, profitability and revenue stability. Please consult Appendix B and the references for a detailed discussion and definitions.
All the issuers in the sample are rated by Moody’s. The reported ratings refer specifically to the issuer’s senior unsecured rating or, in the absence of such a rating, its estimated senior unsecured rating as of reporting
date.2 Government-Related Issuers (GRIs) are excluded from the sample.
Moody's Financial Metrics™ has expanded greatly recently. Therefore, our comparison of medians in Table A.12 is compared with the 2008 numbers from the current FM, not simply a comparison with the formerly published numbers. This paper, and its companion pieces, describes the latest available numbers for FM Issuers as of December 2009. So, December 2008 might be the most recent fiscal year end for some issuers.3 Please note that this is the change of median numbers of financial metrics for each industry. It is also desirable to see the changes for a matched sample of Baa issuers. For this purpose, we are planning a new study on the more extensive change in credit metrics for each industry, which is expected to be publisheat the end of first quarter in 2010
Industry classifications are based on proprietary Moody’s sector assignments. For descriptions, please see Appendix C.
II. Metrics by Rating Category Aggregated Across All Industries
In this section we examine some of the properties of these metrics in the aggregate, that is, without regard to industrial classification. In all cases, the statistics we report are medians. We consider the distribution of these metrics by broad rating category.
Exhibit 1 summarizes our findings. We make the following observations:
Two metrics are strictly monotonic with ratings:
(FFO + Interest Expense) / Interest Expense monotonically increases with ratings, as expected. Debt / Book Capitalization monotonically decreases.
Most metrics are very nearly monotonic with ratings:
Median FFO / Debt, EBITA / Interest Expense, and RCF / Debt are each less for Aa than A issuers, though this may be an artifact of the small Aa sample. EBITA / Average Assets, EBITA Margin and Operating Margin have Aa and Baa lower than Ba. Otherwise, these metrics behave as expected.
Only two metrics have weak relationships to ratings:
Revenue Volatility is higher for Aaa issuers than Aa issuers, which of course is a small sample, and is not strictly increasing across speculative-grade ratings. CAPEX / DepExp is not strictly monotonic either.
2 Please see “Moody’s Senior Ratings Algorithm & Estimated Senior Ratings,” Feb 2009 for a discussion of estimated senior unsecured ratings. 3 Limiting the sample to 2009 numbers, rather than the latest available, would cut down the sample too much.

4 December 2009 Special Comment Moody’s Global Corporate Finance - Moody's Financial Metrics™ Key Ratios by Rating and Industry for Global Non-Financial Corporations: December 2009
Special Comment Moody’s Global Corporate Finance
Moody's Financial Metrics™ Key Ratios by Rating and Industry for Global Non-Financial Corporations: December 2009
Exhibit 1
Aggregate Metrics by Rating Category
EBITA / Average
Assets Operating
Margin EBITA
Margin EBITA / Interest
Expense (FFO + IntExp) /
IntExp
Aaa 22.0% 18.6% 21.9% 18.6 17.8
Aa 7.4% 9.7% 11.2% 5.5 10.1
A 11.3% 13.4% 14.0% 6.6 8.9
Baa 9.5% 11.0% 12.2% 4.4 5.8
Ba 9.6% 11.3% 12.9% 3.2 4.6
B 6.9% 7.8% 9.1% 1.4 2.4
C 2.3% 1.7% 2.5% 0.3 1.2
Debt / EBITDA Debt / Book
Capitalization FFO / Debt
Retained Cash Flow / Net Debt
CAPEX / Depreciation
Revenue Volatility
Aaa 0.9 30.2% 87.5% 164.0% 1.3 13.0
Aa 2.1 43.4% 35.5% 23.1% 1.1 11.5
A 2.0 44.7% 37.6% 26.7% 1.3 15.0
Baa 2.8 50.6% 25.4% 22.9% 1.3 16.0
Ba 3.2 54.3% 22.3% 21.1% 1.2 22.0
B 5.3 74.9% 10.9% 10.5% 1.0 17.0
C 7.7 103.9% 2.3% 2.3% 0.8 15.0
Source: Moody’s Financial Metrics™
III. Industry Study
In this section, we study these financial metrics by industry. We compare ratios for Baa-rated issuers only. We do this not only to make the presentation tractable, but also because not all industries are represented in all rating categories. For instance, only five industries are represented in the Aaa category, and only nine in the Aa. The Baa category is the best represented investment-grade rating category.
Exhibit 2 lists the industries covered in this report and the number of Baa rated issuers in each. For descriptions of these industry classifications, please see Appendix C.

5 December 2009 Special Comment Moody’s Global Corporate Finance - Moody's Financial Metrics™ Key Ratios by Rating and Industry for Global Non-Financial Corporations: December 2009
Special Comment Moody’s Global Corporate Finance
Moody's Financial Metrics™ Key Ratios by Rating and Industry for Global Non-Financial Corporations: December 2009
Exhibit 2
Industry Coverage Industry Count of Baa issuers
Aerospace & Defense 10
Automotive 15
Chemicals 32
Consumer Products 68
Energy & Environment 76
Healthcare 11
Manufacturing 60
Media 25
Metals & Mining 23
Retail & Distribution 34
Services 7
Telecommunications 58
Transportation 23
Source: Moody’s Financial Metrics™
EBITA / Average Assets
Exhibit 3 sorts the industries by their median Baa EBITA / Average Assets ratio. The complete distribution is presented in Appendix A. The median aggregate ratios at different rating categories are highlighted for comparison.
Exhibit 3
0% 5% 10% 15% 20% 25%
Aggregate AaaEnergy & Environment
Metals & MiningAggregate A
Aerospace & DefenseServices
TelecommunicationsConsumer Products
HealthcareAggregate Ba Aggregate Baa
MediaManufacturing
Retail & DistributionChemicals
Aggregate Aa Aggregate B
TransportationAutomotive
Aggregate Caa-C
Source: Moody’s Financial Metrics™
Median Baa EBITA / Average Assets

6 December 2009 Special Comment Moody’s Global Corporate Finance - Moody's Financial Metrics™ Key Ratios by Rating and Industry for Global Non-Financial Corporations: December 2009
Special Comment Moody’s Global Corporate Finance
Moody's Financial Metrics™ Key Ratios by Rating and Industry for Global Non-Financial Corporations: December 2009
From Exhibit 3 we see that for Baa rated issuers, median EBITA / Average Assets is highest for the Energy & Environment and Metals & Mining industries, exceeding that of the aggregate A rated issuer set. At the other extreme, the median Baa ratio is lowest for the Automotive industry, ranking just above the aggregate Caa-C rated issuer set.
While this ratio is nearly increasing across ratings in the aggregate up to A, this ratio is fully monotonic for only one industry.
EBITA / Interest Expense
Exhibit 4 presents median Baa EBITA / Interest Expense ratios by industry. Again, detailed distributions are reported in the Appendix. Aggregate ratios are monotonic except Aa, and that holds true for four industries.
Exhibit 4
0 2 4 6 8 10 12 14 16 18 2
Aggregate AaaMetals & Mining
HealthcareAggregate A
Aggregate Aa Services
Energy & EnvironmentManufacturing
Aerospace & DefenseAggregate Baa
MediaConsumer ProductsTelecommunicationsRetail & Distribution
ChemicalsAggregate Ba Transportation
AutomotiveAggregate B
Aggregate Caa-C
0
Source: Moody’s Financial Metrics™
Median Baa EBITA / Interest Expense
Metals & Mining and Healthcare have the largest metrics, exceeding that of the aggregate Aa cohort. Automotive and Transportation have the lowest median EBITA / Interest Expense Ratio, falling slightly above the aggregate B issuer pool.

7 December 2009 Special Comment Moody’s Global Corporate Finance - Moody's Financial Metrics™ Key Ratios by Rating and Industry for Global Non-Financial Corporations: December 2009
Special Comment Moody’s Global Corporate Finance
Moody's Financial Metrics™ Key Ratios by Rating and Industry for Global Non-Financial Corporations: December 2009
EBITA Margin
Median Baa EBITA Margins are presented in Exhibit 5. This metric is strictly monotonic only in one industry.
This metric is highest for the Energy & Environment, Media and Telecommunications industries and lowest for the Automotive and Retail & Distribution.
Exhibit 5
0% 5% 10% 15% 20% 25%
Aggregate AaaEnergy & Environment
Media
TelecommunicationsHealthcare
Aggregate A
Metals & MiningAggregate Ba Aggregate Baa
Aerospace & DefenseConsumer Products
Aggregate Aa Manufacturing
Aggregate B
ChemicalsTransportation
Services
Retail & DistributionAutomotive
Aggregate Caa-C
Source: Moody’s Financial Metrics™
Median Baa EBITA Margin
Operating Margin
Median Baa Operating Margins are presented in Exhibit 6. This metric is strictly monotonic for only one industry.
Just as was the case with median EBITA Margin, the Energy & Environment, Telecommunications and Media industries have the greatest median Baa Operating Margins. Automotive and Retail & Distribution are on the lower end.

8 December 2009 Special Comment Moody’s Global Corporate Finance - Moody's Financial Metrics™ Key Ratios by Rating and Industry for Global Non-Financial Corporations: December 2009
Special Comment Moody’s Global Corporate Finance
Moody's Financial Metrics™ Key Ratios by Rating and Industry for Global Non-Financial Corporations: December 2009
Exhibit 6
0% 2% 4% 6% 8% 10% 12% 14% 16% 18% 20%
Aggregate AaaEnergy & Environment
TelecommunicationsMedia
Aggregate AMetals & Mining
HealthcareConsumer Products
Aggregate Ba Aggregate Baa
Aerospace & DefenseAggregate Aa Manufacturing
ChemicalsServices
Aggregate BTransportation
Retail & DistributionAutomotive
Aggregate Caa-C
Source: Moody’s Financial Metrics™
Median Baa Operating Margin
(FFO + Interest Expense) / Interest Expense
Exhibit 7 presents the median Baa (FFO + Interest Expense) / Interest Expense ratios by industry. In the aggregate, this metric strictly increases monotonically. That holds true for six industries as well.
The Healthcare industry has median ratios that exceed the Aa aggregate. On the other hand, the Aerospace & Defense industry has median metrics just above that of the aggregate Ba cohort.
Exhibit 7
0 2 4 6 8 10 12 14 16
Aggregate AaaHealthcare
Aggregate Aa Aggregate A
Metals & MiningServices
TelecommunicationsEnergy & Environment
Aggregate BaaMedia
Retail & DistributionChemicals
TransportationAutomotive
ManufacturingConsumer Products
Aerospace & DefenseAggregate Ba
Aggregate BAggregate Caa-C
18
Source: Moody’s Financial Metrics™
Median Baa (FFO + Interest Expense) / Interest Expense

9 December 2009 Special Comment Moody’s Global Corporate Finance - Moody's Financial Metrics™ Key Ratios by Rating and Industry for Global Non-Financial Corporations: December 2009
Special Comment Moody’s Global Corporate Finance
Moody's Financial Metrics™ Key Ratios by Rating and Industry for Global Non-Financial Corporations: December 2009
FFO / Debt
Median Baa FFO / Debt ratios are presented in Exhibit 8. In the aggregate, this metric increases monotonically with ratings except for Aa. That continues to hold true for five industries.
The Metals & Mining industry has median ratios exceeding that of the aggregate Aa cohort. The Transportation sector has the lowest median FFO / Debt ratio, slightly above that of the aggregate B issuer pool.
Exhibit 8
0% 10% 20% 30% 40% 50% 60% 70% 80% 90%
Aggregate AaaMetals & Mining
Aggregate AAggregate Aa
HealthcareTelecommunications
Energy & EnvironmentServices
Aerospace & DefenseMedia
Aggregate BaaChemicals
Retail & DistributionAggregate Ba Manufacturing
Consumer ProductsAutomotive
TransportationAggregate B
Aggregate Caa-C
Source: Moody’s Financial Metrics™
Median Baa FFO / Debt
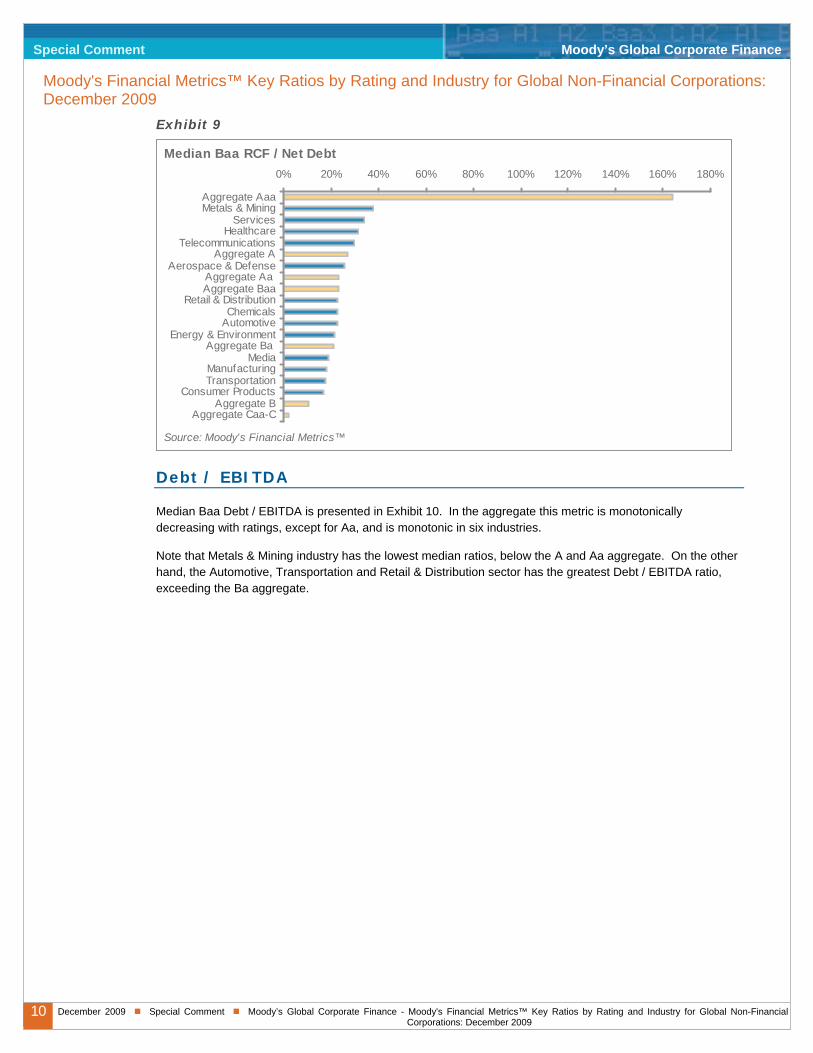
Retained Cash Flow / Net Debt
Median Baa RCF / Net Debt ratios are presented in Exhibit 9. This metric monotonically increase with ratings in the aggregate except for Aa and is monotonic in two industry sectors.
Metals & Mining and Services have median ratios in excess of the aggregate Aa pool. The Consumer Products, Transportation, Manufacturing and Media industries have RCF / Net Debt ratios below the aggregate Ba set.
10 December 2009 Special Comment Moody’s Global Corporate Finance - Moody's Financial Metrics™ Key Ratios by Rating and Industry for Global Non-Financial Corporations: December 2009
Special Comment Moody’s Global Corporate Finance
Moody's Financial Metrics™ Key Ratios by Rating and Industry for Global Non-Financial Corporations: December 2009
Exhibit 9
0% 20% 40% 60% 80% 100% 120% 140% 160% 180%
Aggregate AaaMetals & Mining
ServicesHealthcare
TelecommunicationsAggregate A
Aerospace & DefenseAggregate Aa Aggregate Baa
Retail & DistributionChemicals
AutomotiveEnergy & Environment
Aggregate Ba Media
ManufacturingTransportation
Consumer ProductsAggregate B
Aggregate Caa-C
Source: Moody’s Financial Metrics™
Median Baa RCF / Net Debt
Debt / EBITDA
Median Baa Debt / EBITDA is presented in Exhibit 10. In the aggregate this metric is monotonically decreasing with ratings, except for Aa, and is monotonic in six industries.
Note that Metals & Mining industry has the lowest median ratios, below the A and Aa aggregate. On the other hand, the Automotive, Transportation and Retail & Distribution sector has the greatest Debt / EBITDA ratio, exceeding the Ba aggregate.

11 December 2009 Special Comment Moody’s Global Corporate Finance - Moody's Financial Metrics™ Key Ratios by Rating and Industry for Global Non-Financial Corporations: December 2009
Special Comment Moody’s Global Corporate Finance
Moody's Financial Metrics™ Key Ratios by Rating and Industry for Global Non-Financial Corporations: December 2009
Exhibit 10
0 1 2 3 4 5 6 7
Aggregate AaaMetals & Mining
Aggregate AAggregate Aa
Energy & Environment
HealthcareTelecommunications
ServicesChemicals
Aerospace & Defense
Aggregate BaaManufacturing
MediaConsumer Products
Aggregate Ba
Retail & DistributionTransportation
AutomotiveAggregate B
Aggregate Caa-C
8
Source: Moody’s Financial Metrics™
Median Baa Debt / EBITDA
Debt / Book Capitalization
Median Baa Debt / Book Capitalization is presented in Exhibit 11. This decreases with ratings in the aggregate, and seven industry groups are completely monotonic.
The ordering of industries resembles that given by Debt / EBITDA ratios. The sectors with the least Debt / Book Cap metrics are Healthcare and Metals & Mining. The Transportation, Media, Retail & Distribution and services industries have the greatest Debt / Book Cap ratio, exceeding the Ba aggregate.

12 December 2009 Special Comment Moody’s Global Corporate Finance - Moody's Financial Metrics™ Key Ratios by Rating and Industry for Global Non-Financial Corporations: December 2009
Special Comment Moody’s Global Corporate Finance
Moody's Financial Metrics™ Key Ratios by Rating and Industry for Global Non-Financial Corporations: December 2009
Exhibit 11
0% 20% 40% 60% 80% 100% 120%
Aggregate AaaHealthcare
Metals & MiningAggregate Aa
Energy & EnvironmentAggregate A
ManufacturingChemicals
Aerospace & DefenseAggregate Baa
TelecommunicationsConsumer Products
AutomotiveAggregate Ba
ServicesRetail & Distribution
MediaTransportation
Aggregate BAggregate Caa-C
Source: Moody’s Financial Metrics™
Median Baa Debt / Book Capitalization
CAPEX / Depreciation
Exhibit 12 presents median CAPEX / Depreciation ratios for Baa rated issuers. This metric does not strictly increase across ratings in the aggregate, but does so for three industries.
Energy & Environment and Metals & Mining are among the strongest industry sectors, while Services is the weakest.
Exhibit 12
0.0 0.5 1.0 1.5 2.0 2.5
Energy & EnvironmentMetals & Mining
Retail & DistributionHealthcare
TransportationAerospace &Aggregate A
Aggregate AaaAggregate BaaManufacturing
Consumer ProductsAutomotiveChemicals
Aggregate Ba Telecommunications
MediaAggregate Aa
ServicesAggregate B
Aggregate Caa-C
Source: Moody’s Financial Metrics™
Median Baa CAPEX / Depreciation

13 December 2009 Special Comment Moody’s Global Corporate Finance - Moody's Financial Metrics™ Key Ratios by Rating and Industry for Global Non-Financial Corporations: December 2009
Special Comment Moody’s Global Corporate Finance
Moody's Financial Metrics™ Key Ratios by Rating and Industry for Global Non-Financial Corporations: December 2009
Revenue Volatility
Exhibit 13 presents median revenue volatility metrics for Baa rated issuers by industry. As discussed, this metric does not correlate well with ratings in the aggregate. And no industry exhibits the expected monotonic relationship.
The Automotive industry has the least volatile revenues among Baa rated issuers. Other leading sectors include Consumer Products, Retail & Distribution and Chemicals, all with revenues less volatile than the Aaa-rated aggregate. On the other hand, revenue volatility for two industries exceed that of the Ba-rated aggregate. These include Metals & Mining and Energy & Environment.
Exhibit 13
0 5 10 15 20 25 30
AutomotiveAggregate Aa
Consumer ProductsRetail & Distribution
ChemicalsMedia
TransportationAggregate Aaa
ServicesTelecommunications
Aggregate AAggregate Caa-C
HealthcareAggregate Baa
Aggregate BManufacturing
Aerospace & DefenseAggregate Ba
Metals & MiningEnergy & Environment
Source: Moody’s Financial Metrics™
Median Baa Revenue Volatility
IV. Discussion
Exhibit 14 summarizes the results presented above. For each metric, we report its standardized (mean 100,
standard deviation 1) value and sort the industries by their average score.4 The Metals & Mining, Healthcare
and Energy & Environment industries have the highest average score, while the Automotive, Transportation and Retail & Distribution sectors have the lowest.
What are we to make of these results? Recall that these results are conditioned on ratings: Baa-rated issuers in the Metals & Mining industry generally have stronger (sometimes substantially stronger) metrics than do Baa rated issuers in the Retail & Distribution industry.
One interpretation is that observing different values is evidence of different methods or standards in assigning ratings: we observe better metrics in Metals & Mining than Retail & Distribution because we hold the former to a higher standard than we do the latter, perhaps because one industry is intrinsically riskier than the other. Consistent with previous research, we find evidence to suggest that this is true.
Using “revenue volatility” as a proxy for intrinsic risk, the hypothesis is that we should observe better credit ratios associated with greater volatility within a rating category. In other words, we should observe a negative correlation between the standardized credit ratios and standardized revenue volatility.
4 The average is taken with respect to all metrics except revenue volatility. Adjustments are made for those metrics (e.g. Debt / EBITDA) for which greater
values are less desirable.

14 December 2009 Special Comment Moody’s Global Corporate Finance - Moody's Financial Metrics™ Key Ratios by Rating and Industry for Global Non-Financial Corporations: December 2009
Special Comment Moody’s Global Corporate Finance
Moody's Financial Metrics™ Key Ratios by Rating and Industry for Global Non-Financial Corporations: December 2009
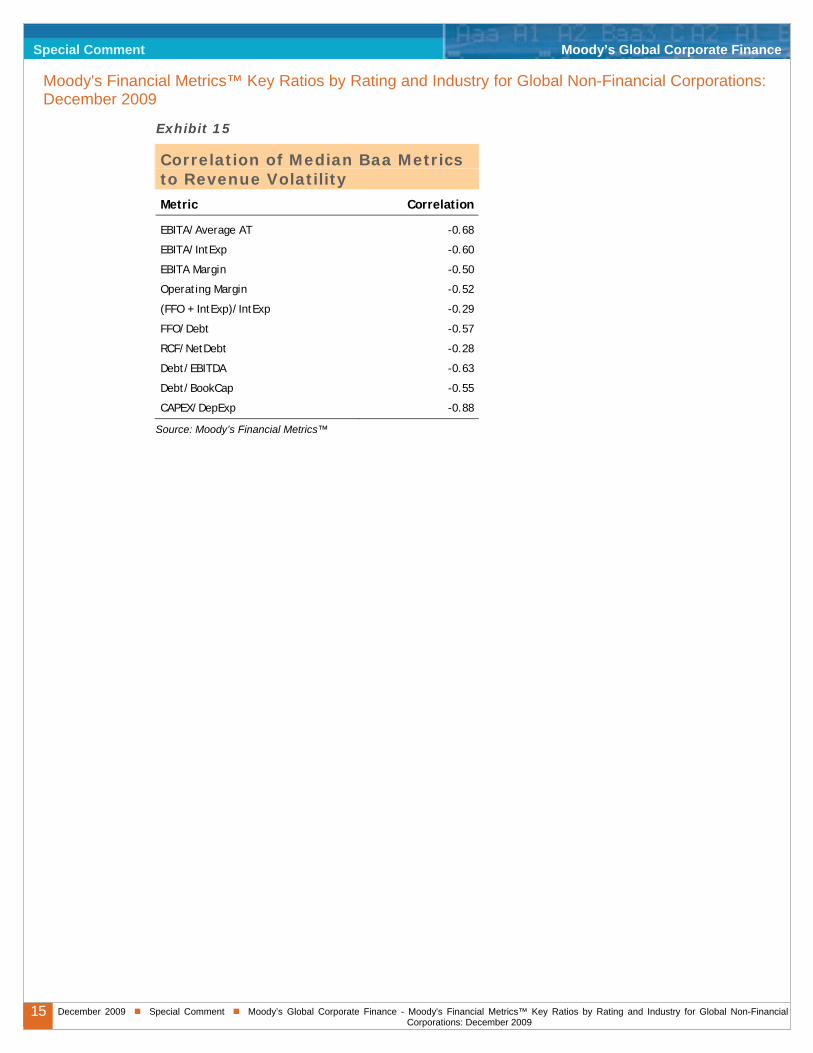
Exhibit 15 reports the correlation of the standardized values of each metric to revenue volatility. As expected, we obtain negative correlations for all metrics. The most significant correlations are with CAPEX / DepExp (-0.88), EBITA / Average AT (-0.68) and Debt / EBITDA (-0.63).
While purely suggestive, the results indicate that industries with more volatile revenues are required to achieve stronger credit metrics in order to obtain the Baa rating.
Exhibit A-12 shows the percentage change in medians of Baa-rated issuers from 2008 to 2009. Many industries exhibit big decline in these key metrics, whereas last year there was only modest change, if any. For example, Automotive industry has significant decline in most of the metrics, underscoring its turmoil in the current environment. Aggregated Aaa issuers also show big metrics change.
Exhibit 14
Summary of Standardized Baa Metrics
Average
score EBITA / Average
Assets EBITA / IntExp
EBITA Margin
Operating Margin
(FFO + IntExp) / IntExp
Metals & Mining 101.2 101.1 102.2 100.3 100.5 101.4
Healthcare 100.9 100.2 101.4 100.9 100.3 102.6
Energy & Environment 100.6 101.3 100.5 101.5 101.5 100.2
Telecommunications 100.4 100.5 99.7 101.1 101.4 100.2
Services 100.1 100.7 100.5 99.0 99.3 100.5
Media 100.0 99.8 99.8 101.4 101.3 99.6
Aerospace & Defense 99.9 100.9 99.9 100.0 100.0 99.1
Chemicals 99.7 99.5 99.6 99.4 99.5 99.6
Consumer Products 99.7 100.2 99.7 100.0 100.1 99.2
Manufacturing 99.6 99.8 99.9 99.8 99.7 99.3
Retail & Distribution 99.5 99.7 99.6 98.7 98.7 99.6
Transportation 99.1 98.4 98.7 99.2 99.2 99.5
Automotive 99.1 97.9 98.4 98.5 98.4 99.3
Average
score FFO / Debt RCF /
NetDebt Debt /
EBITDA Debt /
BookCap CAPEX / DepExp
Rev Vol
Metals & Mining 101.2 102.5 102.0 101.6 101.5 101.7 98.5
Healthcare 100.9 100.9 101.0 100.9 102.1 100.0 100.0
Energy & Environment 100.6 100.4 99.5 101.0 100.6 102.6 97.6
Telecommunications 100.4 100.8 100.8 100.8 99.9 99.3 100.4
Services 100.1 100.4 101.4 100.5 99.6 99.1 100.4
Media 100.0 99.8 99.2 99.8 99.1 99.2 100.6
Aerospace & Defense 99.9 99.8 100.1 100.1 100.0 99.8 99.3
Chemicals 99.7 99.7 99.7 100.2 100.0 99.5 100.6
Consumer Products 99.7 99.2 98.8 99.6 99.9 99.6 100.8
Manufacturing 99.6 99.3 99.1 99.8 100.1 99.6 99.7
Retail & Distribution 99.5 99.3 99.7 99.4 99.2 100.1 100.8
Transportation 99.1 98.7 99.0 98.3 98.3 100.0 100.6
Automotive 99.1 99.2 99.7 98.1 99.6 99.6 100.8
Source: Moody’s Financial Metrics™
15 December 2009 Special Comment Moody’s Global Corporate Finance - Moody's Financial Metrics™ Key Ratios by Rating and Industry for Global Non-Financial Corporations: December 2009
Special Comment Moody’s Global Corporate Finance
Moody's Financial Metrics™ Key Ratios by Rating and Industry for Global Non-Financial Corporations: December 2009
Exhibit 15
Correlation of Median Baa Metrics to Revenue Volatility Metric Correlation
EBITA/Average AT -0.68
EBITA/IntExp -0.60
EBITA Margin -0.50
Operating Margin -0.52
(FFO + IntExp)/IntExp -0.29
FFO/Debt -0.57
RCF/NetDebt -0.28
Debt/EBITDA -0.63
Debt/BookCap -0.55
CAPEX/DepExp -0.88
Source: Moody’s Financial Metrics™

16 December 2009 Special Comment Moody’s Global Corporate Finance - Moody's Financial Metrics™ Key Ratios by Rating and Industry for Global Non-Financial Corporations: December 2009
Special Comment Moody’s Global Corporate Finance
Moody's Financial Metrics™ Key Ratios by Rating and Industry for Global Non-Financial Corporations: December 2009
Appendix A: Detailed Distributions by Credit Metric
Source: Moody’s Financial Metrics™
Exhibit A-1
Median EBITA / Average Assets Aaa Aa A Baa Ba B C
Aggregate 0.2198 0.0736 0.11325 0.0946 0.0959 0.0687 0.0233
n= 6 49 222 442 546 601 159
Aerospace & Defense 0.1242 0.11295 0.1094 0.087 0.0541
6 10 17 9 1
Automotive -0.01385 0.0253 0.0502 0.05595 0.05235 0.009
2 9 15 12 30 9
Chemicals 0.13675 0.0924 0.08315 0.1098 0.06265 -0.17445
2 21 32 26 28 2
Consumer Products 0.1309 0.146 0.09865 0.08225 0.0627 0.03585
9 27 68 98 137 42
Energy & Environment 0.2686 0.02795 0.1479 0.1213 0.10355 0.0906 0.0148
1 14 21 76 80 54 13
Healthcare 0.2218 0.1768 0.184 0.0986 0.1013 0.07405 0.0318
1 5 24 11 33 32 4
Manufacturing 0.1048 0.0345 0.1021 0.08895 0.089 0.0727 -0.0196
1 5 41 60 63 65 15
Media 0.1245 0.0897 0.09625 0.0748 -0.002
4 25 42 44 16
Metals & Mining 0.1804 0.1177 0.1271 0.0464 0.00225
5 23 22 13 10
Retail & Distribution 0.0704 0.09385 0.0882 0.0951 0.068 0.02555
3 16 34 36 49 10
Services 0.0865 0.1082 0.11875 0.0804 0.042
4 7 28 34 4
Telecommunications 0.2437 0.1102 0.1346 0.10365 0.09765 0.0594 0.0224
2 4 35 58 74 84 22
Transportation 0.119 0.0674 0.0637 0.0617 0.0974 0.0458 0.0133
1 5 9 23 15 22 11

17 December 2009 Special Comment Moody’s Global Corporate Finance - Moody's Financial Metrics™ Key Ratios by Rating and Industry for Global Non-Financial Corporations: December 2009
Special Comment Moody’s Global Corporate Finance
Moody's Financial Metrics™ Key Ratios by Rating and Industry for Global Non-Financial Corporations: December 2009
Exhibit A-2
Median EBITA / Interest Expense Aaa Aa A Baa Ba B C
Aggregate 18.59 5.52 6.64 4.37 3.215 1.37 0.31
n= 6 49 221 442 546 599 159
Aerospace & Defense 6.875 4.375 4.4 1.98 0.79
6 10 17 9 1
Automotive -3.29 2.95 2.28 1.785 1.295 0.14
2 8 15 12 30 9
Chemicals 50.555 5.76 4.035 4.06 1.21 -1.615
2 21 32 26 27 2
Consumer Products 13.74 5.81 4.18 2.34 1.16 0.505
9 27 68 98 137 42
Energy & Environment 26.54 2.21 6.4 5.28 3.515 2.475 0.45
1 14 21 76 80 54 13
Healthcare 21.15 24.34 16.505 6.64 3.67 1.71 0.39
1 5 24 11 33 32 4
Manufacturing 6.22 10.28 7.29 4.425 3.12 1.35 -0.56
1 5 41 60 63 64 15
Media 8.1 4.36 2.21 1.31 0.11
4 25 42 44 16
Metals & Mining 21.05 7.76 5.465 1.37 0.16
5 23 22 13 10
Retail & Distribution 3.93 4.65 4.07 3.035 1.54 0.53
3 16 34 36 49 10
Services 5.135 5.34 3.815 1.485 0.505
4 7 28 34 4
Telecommunications 74.015 18.43 6.64 4.14 3.595 1.2 0.325
2 4 35 58 74 84 22
Transportation 3.49 2.68 6.01 2.72 2.68 0.935 0.19
1 5 9 23 15 22 11

18 December 2009 Special Comment Moody’s Global Corporate Finance - Moody's Financial Metrics™ Key Ratios by Rating and Industry for Global Non-Financial Corporations: December 2009
Special Comment Moody’s Global Corporate Finance
Moody's Financial Metrics™ Key Ratios by Rating and Industry for Global Non-Financial Corporations: December 2009
Exhibit A-3
Median EBITA Margin Aaa Aa A Baa Ba B C
Aggregate 0.21905 0.1124 0.14025 0.1216 0.1292 0.0913 0.0249
n= 6 49 222 441 546 599 157
Aerospace & Defense 0.12285 0.12135 0.1068 0.109 0.0591
6 10 17 9 1
Automotive -0.01345 0.0376 0.0452 0.05565 0.0407 0.0064
2 9 15 12 30 9
Chemicals 0.15715 0.1004 0.09095 0.09775 0.0815 -0.11675
2 21 32 26 27 2
Consumer Products 0.1882 0.1473 0.1209 0.1104 0.07545 0.0346
9 27 68 98 136 41
Energy & Environment 0.193 0.07205 0.1972 0.1933 0.1975 0.1875 0.117
1 14 21 75 80 54 13
Healthcare 0.2818 0.3269 0.27935 0.166 0.1402 0.112 0.05095
1 5 24 11 33 32 4
Manufacturing 0.1449 0.0429 0.0935 0.10695 0.0932 0.0918 -0.03285
1 5 41 60 63 65 14
Media 0.16535 0.1891 0.20195 0.1978 -0.0103
4 25 42 44 16
Metals & Mining 0.1846 0.1342 0.1818 0.0583 0.002
5 23 22 13 10
Retail & Distribution 0.0583 0.0631 0.056 0.0548 0.0643 0.0157
3 16 34 36 49 10
Services 0.15175 0.0711 0.17515 0.1129 0.02935
4 7 28 34 4
Telecommunications 0.3014 0.17265 0.2092 0.17475 0.2136 0.09315 0.03875
2 4 35 58 74 84 22
Transportation 0.1606 0.1907 0.1159 0.0795 0.1515 0.0543 0.0211
1 5 9 23 15 22 11

19 December 2009 Special Comment Moody’s Global Corporate Finance - Moody's Financial Metrics™ Key Ratios by Rating and Industry for Global Non-Financial Corporations: December 2009
Special Comment Moody’s Global Corporate Finance
Moody's Financial Metrics™ Key Ratios by Rating and Industry for Global Non-Financial Corporations: December 2009
Exhibit A-4
Median Operating Margin Aaa Aa A Baa Ba B C
Aggregate 0.1855 0.0972 0.13365 0.11 0.1126 0.078 0.0173
n= 6 49 222 441 546 599 157
Aerospace & Defense 0.1149 0.10645 0.0997 0.1086 0.0395
6 10 17 9 1
Automotive -0.01465 0.0323 0.0386 0.0529 0.0358 -0.0027
2 9 15 12 30 9
Chemicals 0.14225 0.0864 0.08585 0.0911 0.0685 -0.1246
2 21 32 26 27 2
Consumer Products 0.1772 0.1428 0.11285 0.09435 0.0685 0.0353
9 27 68 98 136 41
Energy & Environment 0.155 0.0614 0.2091 0.1743 0.1963 0.1686 0.0027
1 14 21 75 80 54 13
Healthcare 0.2538 0.2609 0.2176 0.1216 0.1273 0.1029 0.02695
1 5 24 11 33 32 4
Manufacturing 0.1386 0.0364 0.0946 0.09695 0.084 0.0734 -0.0357
1 5 41 60 63 65 14
Media 0.1637 0.1674 0.1617 0.1613 0.08895
4 25 42 44 16
Metals & Mining 0.1724 0.1319 0.14885 0.0497 -0.0021
5 23 22 13 10
Retail & Distribution 0.0576 0.05835 0.05135 0.0484 0.0614 0.01045
3 16 34 36 49 10
Services 0.1297 0.079 0.16025 0.0995 0.0238
4 7 28 34 4
Telecommunications 0.2864 0.15675 0.1756 0.1711 0.14055 0.0647 0.027
2 4 35 58 74 84 22
Transportation 0.1185 0.1844 0.1131 0.075 0.1465 0.0409 0.0063
1 5 9 23 15 22 11
20 December 2009 Special Comment Moody’s Global Corporate Finance - Moody's Financial Metrics™ Key Ratios by Rating and Industry for Global Non-Financial Corporations: December 2009
Special Comment Moody’s Global Corporate Finance
Moody's Financial Metrics™ Key Ratios by Rating and Industry for Global Non-Financial Corporations: December 2009
Exhibit A-5
Median (FFO + Interest Expense) / Interest Expense Aaa Aa A Baa Ba B C
Aggregate 17.8 10.1 8.89 5.76 4.575 2.42 1.23
n= 6 49 221 442 546 599 159
Aerospace & Defense 8.22 4.7 5.4 2.81 1.2
6 10 17 9 1
Automotive 18.885 5.665 5.01 3.38 2.045 1.2
2 8 15 12 30 9
Chemicals 59.245 7.62 5.445 4.645 2.27 1.065
2 21 32 26 27 2
Consumer Products 11.86 6.79 4.825 3.75 2.12 1.005
9 27 68 98 137 42
Energy & Environment 21.62 7.67 12.67 6.465 5.23 4.205 2.87
1 14 21 76 80 54 13
Healthcare 19.97 25.14 15.665 10.58 5.6 3.07 1.455
1 5 24 11 33 32 4
Manufacturing 6.66 10.61 8.91 4.955 4.98 2.3 0.9
1 5 41 60 63 64 15
Media 8.725 5.55 3.215 2.02 1.005
4 25 42 44 16
Metals & Mining 18.71 8.53 7.275 3.74 1.17
5 23 22 13 10
Retail & Distribution 5.89 6.54 5.545 4.95 2.66 1.99
3 16 34 36 49 10
Services 6.67 7.11 4.205 2.405 1.32
4 7 28 34 4
Telecommunications 69.995 27.835 10.03 6.58 5.315 2.865 1.61
2 4 35 58 74 84 22
Transportation 6.19 4.96 6.38 5.4 4.24 2.465 1.18
1 5 9 23 15 22 11
21 December 2009 Special Comment Moody’s Global Corporate Finance - Moody's Financial Metrics™ Key Ratios by Rating and Industry for Global Non-Financial Corporations: December 2009
Special Comment Moody’s Global Corporate Finance
Moody's Financial Metrics™ Key Ratios by Rating and Industry for Global Non-Financial Corporations: December 2009
Exhibit A-6
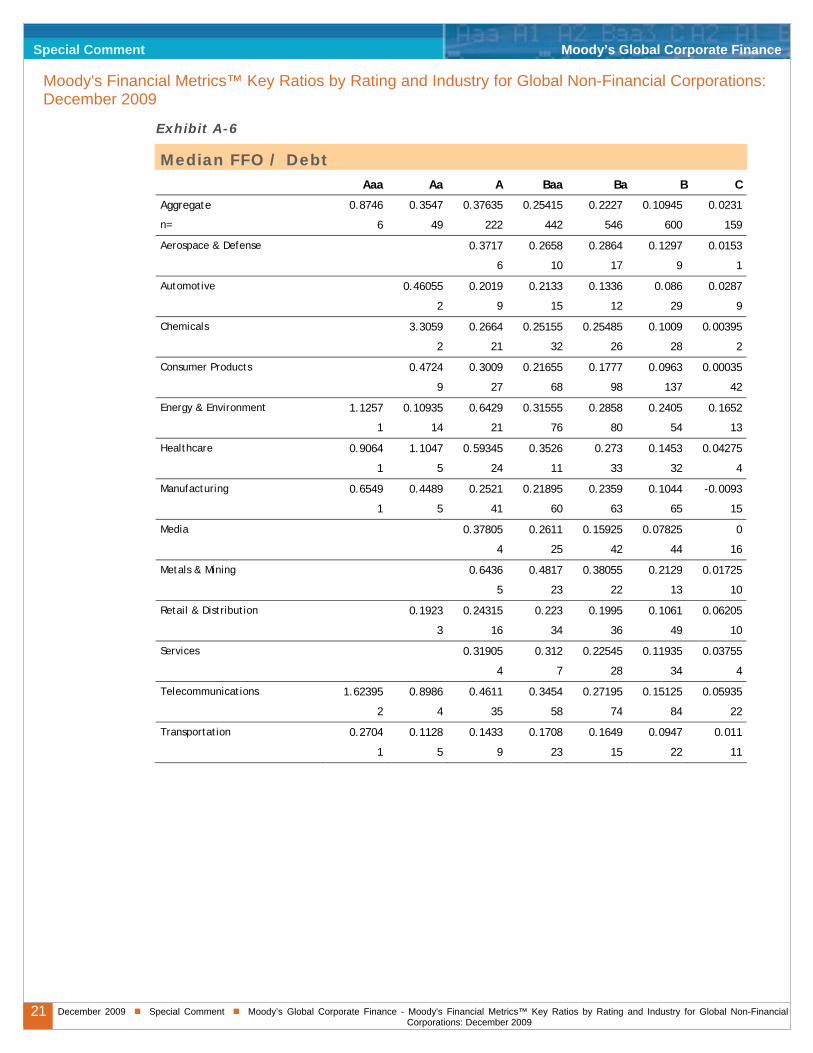
Median FFO / Debt Aaa Aa A Baa Ba B C
Aggregate 0.8746 0.3547 0.37635 0.25415 0.2227 0.10945 0.0231
n= 6 49 222 442 546 600 159
Aerospace & Defense 0.3717 0.2658 0.2864 0.1297 0.0153
6 10 17 9 1
Automotive 0.46055 0.2019 0.2133 0.1336 0.086 0.0287
2 9 15 12 29 9
Chemicals 3.3059 0.2664 0.25155 0.25485 0.1009 0.00395
2 21 32 26 28 2
Consumer Products 0.4724 0.3009 0.21655 0.1777 0.0963 0.00035
9 27 68 98 137 42
Energy & Environment 1.1257 0.10935 0.6429 0.31555 0.2858 0.2405 0.1652
1 14 21 76 80 54 13
Healthcare 0.9064 1.1047 0.59345 0.3526 0.273 0.1453 0.04275
1 5 24 11 33 32 4
Manufacturing 0.6549 0.4489 0.2521 0.21895 0.2359 0.1044 -0.0093
1 5 41 60 63 65 15
Media 0.37805 0.2611 0.15925 0.07825 0
4 25 42 44 16
Metals & Mining 0.6436 0.4817 0.38055 0.2129 0.01725
5 23 22 13 10
Retail & Distribution 0.1923 0.24315 0.223 0.1995 0.1061 0.06205
3 16 34 36 49 10
Services 0.31905 0.312 0.22545 0.11935 0.03755
4 7 28 34 4
Telecommunications 1.62395 0.8986 0.4611 0.3454 0.27195 0.15125 0.05935
2 4 35 58 74 84 22
Transportation 0.2704 0.1128 0.1433 0.1708 0.1649 0.0947 0.011
1 5 9 23 15 22 11

22 December 2009 Special Comment Moody’s Global Corporate Finance - Moody's Financial Metrics™ Key Ratios by Rating and Industry for Global Non-Financial Corporations: December 2009
Special Comment Moody’s Global Corporate Finance
Moody's Financial Metrics™ Key Ratios by Rating and Industry for Global Non-Financial Corporations: December 2009
Exhibit A-7
Median Retained Cash Flow / Net Debt Aaa Aa A Baa Ba B C
Aggregate 1.64005 0.2313 0.26715 0.22925 0.21065 0.1053 0.0226
n= 6 49 222 442 546 601 159
Aerospace & Defense 0.31005 0.25615 0.3012 0.1395 0.0157
6 10 17 9 1
Automotive -2.4264 0.2143 0.2256 0.1522 0.08655 0.0415
2 9 15 12 30 9
Chemicals -0.5958 0.2288 0.2275 0.17565 0.0967 0.0128
2 21 32 26 28 2
Consumer Products 0.3971 0.2395 0.1681 0.1712 0.0947 -0.0001
9 27 68 98 137 42
Energy & Environment 2.1972 0.1061 0.5775 0.21475 0.26525 0.226 0.1712
1 14 21 76 80 54 13
Healthcare 1.0829 0.3593 0.4384 0.314 0.2506 0.13425 0.04385
1 5 24 11 33 32 4
Manufacturing 0.2405 0.3964 0.2505 0.1828 0.2113 0.1039 -0.01
1 5 41 60 63 65 15
Media 0.36895 0.1898 0.14845 0.0729 0.0013
4 25 42 44 16
Metals & Mining 0.9088 0.3794 0.3529 0.0343 0.01945
5 23 22 13 10
Retail & Distribution 0.2313 0.23615 0.229 0.18985 0.1052 0.06475
3 16 34 36 49 10
Services 0.253 0.3422 0.24655 0.09825 0.0287
4 7 28 34 4
Telecommunications 11.3673 0.43465 0.3471 0.2969 0.3149 0.15355 0.06745
2 4 35 58 74 84 22
Transportation 0.3108 0.1093 0.1088 0.177 0.1512 0.08415 0.0123
1 5 9 23 15 22 11

23 December 2009 Special Comment Moody’s Global Corporate Finance - Moody's Financial Metrics™ Key Ratios by Rating and Industry for Global Non-Financial Corporations: December 2009
Special Comment Moody’s Global Corporate Finance
Moody's Financial Metrics™ Key Ratios by Rating and Industry for Global Non-Financial Corporations: December 2009
Exhibit A-8
Median Debt / EBITDA Aaa Aa A Baa Ba B C
Aggregate 0.905 2.05 2.015 2.825 3.23 5.26 7.7
n= 6 49 222 442 546 600 159
Aerospace & Defense 2.22 2.81 2.89 4.23 10.79
6 10 17 9 1
Automotive 2.09 3.14 4.2 5.415 5.615 7.24
2 9 15 12 30 9
Chemicals 1.005 2.86 2.775 2.61 5.59 3.215
2 21 32 26 27 2
Consumer Products 1.57 2.47 3.195 3.83 5.87 9.09
9 27 68 98 137 42
Energy & Environment 0.57 8.31 1.17 2.215 2.685 2.72 3.5
1 14 21 76 80 54 13
Healthcare 0.88 0.84 1.14 2.29 3.29 5.055 7.745
1 5 24 11 33 32 4
Manufacturing 1.26 1.61 2.36 3.03 2.73 4.47 5.04
1 5 41 60 63 65 15
Media 1.84 3.04 4.53 6.46 9.12
4 25 42 44 16
Metals & Mining 1.2 1.79 1.995 3.42 6.67
5 23 22 13 10
Retail & Distribution 3.55 3.04 3.335 3.745 5.99 10.34
3 16 34 36 49 10
Services 2.895 2.55 2.885 5.395 7.025
4 7 28 34 4
Telecommunications 0.64 1.13 1.74 2.295 2.93 4.685 6.595
2 4 35 58 74 84 22
Transportation 3.26 5.82 4.46 4.08 4.48 6.715 10.54
1 5 9 23 15 22 11

24 December 2009 Special Comment Moody’s Global Corporate Finance - Moody's Financial Metrics™ Key Ratios by Rating and Industry for Global Non-Financial Corporations: December 2009
Special Comment Moody’s Global Corporate Finance
Moody's Financial Metrics™ Key Ratios by Rating and Industry for Global Non-Financial Corporations: December 2009
Exhibit A-9
Median Debt / Book Capitalization Aaa Aa A Baa Ba B C
Aggregate 0.30165 0.4335 0.4472 0.50635 0.54265 0.7494 1.0386
n= 6 49 222 442 546 601 159
Aerospace & Defense 0.5092 0.50435 0.4955 0.549 1.1191
6 10 17 9 1
Automotive 0.1999 0.4633 0.5426 0.6986 0.8216 0.8705
2 9 15 12 30 9
Chemicals 0.2496 0.4575 0.5031 0.60155 0.8016 1.3829
2 21 32 26 28 2
Consumer Products 0.3733 0.6181 0.5165 0.59765 0.7629 1.21855
9 27 68 98 137 42
Energy & Environment 0.2471 0.72925 0.3354 0.4466 0.47995 0.537 0.7319
1 14 21 76 80 54 13
Healthcare 0.308 0.1592 0.27945 0.3063 0.4928 0.6591 1.62895
1 5 24 11 33 32 4
Manufacturing 0.2953 0.3043 0.4258 0.4919 0.4715 0.6414 0.8347
1 5 41 60 63 65 15
Media 0.35685 0.5836 0.75775 0.891 1.436
4 25 42 44 16
Metals & Mining 0.3002 0.3609 0.4845 0.5949 0.86185
5 23 22 13 10
Retail & Distribution 0.4971 0.55335 0.57905 0.65105 0.7829 1.01345
3 16 34 36 49 10
Services 0.40625 0.5434 0.55915 0.73965 1.14455
4 7 28 34 4
Telecommunications 0.24195 0.26385 0.4384 0.51475 0.56075 0.7467 1.32725
2 4 35 58 74 84 22
Transportation 1.0486 0.7744 0.5698 0.6641 0.694 0.86715 1.0171
1 5 9 23 15 22 11

25 December 2009 Special Comment Moody’s Global Corporate Finance - Moody's Financial Metrics™ Key Ratios by Rating and Industry for Global Non-Financial Corporations: December 2009
Special Comment Moody’s Global Corporate Finance
Moody's Financial Metrics™ Key Ratios by Rating and Industry for Global Non-Financial Corporations: December 2009
Exhibit A-10
Median CAPEX / Depreciation Aaa Aa A Baa Ba B C
Aggregate 1.3332 1.1236 1.3497 1.32985 1.2377 1.01955 0.8041
n= 6 49 222 440 543 598 156
Aerospace & Defense 1.3712 1.35915 1.2662 1.0392 0.946
6 10 17 9 1
Automotive 1.0323 1.408 1.2709 1.19835 0.94395 0.8018
2 9 15 12 30 9
Chemicals 1.30485 1.327 1.26055 1.12805 0.9336 0.44305
2 21 32 26 26 2
Consumer Products 1.299 1.2013 1.278 1.20345 0.9765 0.7583
9 27 68 98 137 41
Energy & Environment 1.2342 1.20235 1.8928 2.32245 2.0834 1.6752 1.6602
1 14 21 74 80 53 13
Healthcare 1.3889 0.8822 1.18415 1.4166 1.2797 1.1449 0.83365
1 5 24 11 33 32 4
Manufacturing 2.1923 0.9722 1.3532 1.2989 1.16585 0.8977 0.70355
1 5 41 60 62 65 14
Media 0.9857 1.1347 1.0485 0.9329 0.74955
4 25 41 44 16
Metals & Mining 2.1043 2.008 1.7032 1.6638 0.9397
5 23 22 13 9
Retail & Distribution 1.1236 1.4738 1.45715 1.143 1.0174 0.8902
3 16 34 36 49 10
Services 1.22015 1.1188 1.1429 1.07185 0.9442
4 7 28 34 4
Telecommunications 1.38965 1.2274 1.2162 1.1627 1.105 0.9704 0.67475
2 4 35 58 73 84 22
Transportation 0.9614 1.069 2.2467 1.4072 1.3336 1.20155 1.2341
1 5 9 23 15 22 11

26 December 2009 Special Comment Moody’s Global Corporate Finance - Moody's Financial Metrics™ Key Ratios by Rating and Industry for Global Non-Financial Corporations: December 2009
Special Comment Moody’s Global Corporate Finance
Moody's Financial Metrics™ Key Ratios by Rating and Industry for Global Non-Financial Corporations: December 2009
Exhibit A-11
Median Revenue Volatility Aaa Aa A Baa Ba B C
Aggregate 13.0 11.5 15.0 16.0 22.0 17.0 15.0
n= 5 46 205 399 455 471 127
Aerospace & Defense 17.5 20.0 26.5 16.5 40.0
6 9 12 6 1
Automotive 11.5 13.5 11.5 10.0 13.0 8.0
2 8 14 9 25 7
Chemicals 19.5 15.0 13.0 22.0 20.0 8.0
2 19 31 25 20 1
Consumer Products 15.0 12.0 12.0 17.0 13.5 12.0
8 26 60 85 110 31
Energy & Environment 17.0 10.5 23.5 30.0 37.5 38.5 22.5
1 14 20 70 66 46 10
Healthcare 13.0 14.0 16.5 16.0 19.0 27.0 14.0
1 5 20 9 23 27 4
Manufacturing 12.0 10.0 15.0 18.0 28.0 21.0 17.0
1 5 39 56 57 53 12
Media 9.0 13.0 20.5 14.0 11.0
3 21 34 35 15
Metals & Mining 24.0 25.0 42.0 26.5 24.0
5 17 17 10 6
Retail & Distribution 18.0 14.5 12.0 18.5 13.0 6.0
2 16 30 30 35 9
Services 16.0 14.0 28.0 17.0 10.5
4 5 23 29 4
Telecommunications 13.5 4.0 12.5 14.0 19.0 16.0 16.5
2 3 32 56 61 59 18
Transportation 9.0 17.0 13.0 21.0 19.0 20.0
5 7 21 13 16 9
27 December 2009 Special Comment Moody’s Global Corporate Finance - Moody's Financial Metrics™ Key Ratios by Rating and Industry for Global Non-Financial Corporations: December 2009
Special Comment Moody’s Global Corporate Finance
Moody's Financial Metrics™ Key Ratios by Rating and Industry for Global Non-Financial Corporations: December 2009
Exhibit A-12
Percentage change in medians of Baa-rated issuers, 2008-2009
EBITA / Average
Assets
EBITA / Interest Expense
EBITA Margin
Operating Margin
(FFO + Interest
Expense) / Interest Expense
FFO / Debt
Retained Cash Flow
/ Net Debt
Debt / EBITDA
DEBT / Book
Capital-ization
CAPEX / Deprec-
iation Revenue Volatility
Aerospace & Defense -1.3% -29.1% -6.7% -6.1% -33.5% -34.5% -51.8% 40.1% 30.8% 10.0% -9.1%
Automotive -35.6% -49.8% -31.2% -38.1% -36.4% -31.4% -22.4% 66.0% 16.2% 3.4% -25.8%
Chemicals -9.6% -38.3% -11.7% -7.4% -28.4% -5.4% -6.6% 10.1% 20.7% 9.1% 0.0%
Consumer Products 0.5% -7.7% -3.4% 7.7% -11.1% -10.0% -4.1% 7.2% 8.7% 5.6% 9.1%
Energy & Environment -0.1% -15.2% -22.0% -21.1% -20.4% -7.7% 11.9% 9.1% 13.3% 10.7% -9.1%
Healthcare -21.8% 28.2% -5.3% -10.1% 40.1% 16.5% 14.2% -7.3% -31.8% 2.2% 6.7%
Manufacturing -15.4% -22.6% -12.6% -10.3% -21.0% -21.0% -24.1% 20.2% 8.7% -2.7% 0.0%
Media 7.7% 10.5% -3.8% 5.1% 12.3% 4.9% 0.2% -0.8% 6.5% -2.6% -16.1%
Metals & Mining -13.9% -29.0% -24.9% -8.2% -11.7% -16.5% -37.8% 67.3% 37.4% 8.9% -19.4%
Retail & Distribution -3.0% -6.2% 0.7% -0.9% 0.5% 4.3% 1.1% 5.9% 3.8% 4.8% -7.7%
Services 8.4% -3.9% 17.2% 45.1% 5.9% -3.5% -1.0% 7.1% 5.6% 1.7% -26.3%
Telecommunications -6.0% -16.8% -17.3% -5.8% -10.2% -15.7% -18.8% 26.8% 8.3% 12.1% 7.7%
Transportation -25.8% -24.4% -41.2% -40.3% -6.1% -24.7% -19.0% 9.4% 7.8% -8.4% -16.1%
Aggregate Aaa 88.5% -24.1% 15.7% 21.6% -22.9% -33.0% -41.8% 61.6% 46.5% -5.6% -7.1%
Aggregate Aa -22.5% -38.0% -19.9% -23.7% -3.1% -22.0% 50.0% 25.4% 15.3% -11.1% 43.8%
Aggregate A -4.4% -20.7% -5.1% -2.9% -7.4% -6.4% -20.8% 8.3% 11.7% 0.4% -6.3%
Aggregate Baa -3.6% -12.4% -9.7% -9.9% -10.6% -10.1% -7.2% 8.9% 11.1% 0.8% -5.9%
Aggregate Ba 1.3% 0.3% -2.9% -2.8% -1.0% -0.7% -2.1% 3.7% 4.1% 0.1% 0.0%
Aggregate B -2.7% -2.8% -8.5% -7.6% 0.8% 2.1% 2.8% -1.3% 3.3% -0.5% -5.6%
Aggregate C -19.7% -24.4% -7.4% -4.4% -2.4% -10.3% -4.0% 2.0% 2.2% 4.9% -3.2%

28 December 2009 Special Comment Moody’s Global Corporate Finance - Moody's Financial Metrics™ Key Ratios by Rating and Industry for Global Non-Financial Corporations: December 2009
Special Comment Moody’s Global Corporate Finance
Moody's Financial Metrics™ Key Ratios by Rating and Industry for Global Non-Financial Corporations: December 2009
(FFO – Preferred Dividends – Common Dividends – Minority Dividends) / (Short-Term Debt + Long-Term
(Short-Term Debt + Long-Term Debt) / EBITDA
zation
erm Debt + Long-Term Debt + Deferred Taxes + Minority
Revenue
railing Five Years of Net Revenue Growth
Appendix B: Definition of Credit Ratios
Below we define the ratios presented in this study. Please note that these definitions are applied to adjusted financial numbers. For a detailed discussion of Moody’s global adjustments, please consult the references.
EBITA / Average Assets
EBITA / Average of Current and Previous Year Assets
EBITA / Interest Expense
EBITA / Interest Expense
EBITA Margin
EBITA / Net Revenue
(FFO + Interest Expense) / Interest Expense
(Funds From Operations + Interest Expense) / Interest Expense
FFO / Debt
Funds From Operations / (Short-Term Debt + Long-Term Debt)
RCF / Debt
Debt)
Debt / EBITDA
Debt / Book Capitali
(Short-Term Debt + Long-Term Debt) / (Short-TInterest + Book Equity)
Operating Margin
Operating Profit / Net
CAPEX / Depreciation Expense
CAPEX / Depreciation Expense
Revenue Volatility
Standard Deviation of T

29 December 2009 Special Comment Moody’s Global Corporate Finance - Moody's Financial Metrics™ Key Ratios by Rating and Industry for Global Non-Financial Corporations: December 2009
Special Comment Moody’s Global Corporate Finance
Moody's Financial Metrics™ Key Ratios by Rating and Industry for Global Non-Financial Corporations: December 2009
, building materials, (low technology) component equipment, (non-consumer) finished
Media
d newspaper publishing, broadcast and subscription radio and television, and diversified media.
ng, aluminum and steel production and recycling.
s, department stores, general and specialty merchandise retailers, and various
services, consumer services, technology services, and defense services.
are, component equipment, consumer electronics, semiconductor and contract
Appendix C: Definition of Industry Aggregates
In this report we study the distribution of financial ratios across 13 industry aggregates. These aggregates are based on proprietary Moody’s coding of broad and specific industry categories. They may generally be described as follows:
Aerospace & Defense
Aircraft, aerospace and defense equipment and parts manufacturers.
Automotive
Commercial and passenger automotive and parts manufacturers.
Chemicals
Agricultural, commodity and specialty chemicals producers.
Consumer Products
Packaged food and beverage, household and personal care products, apparel and shoes, textiles and durable consumer products. Casinos, lodging, restaurants and general amusements. Pulp and (non-packaging) paper, wood products, agriculture, protein and tobacco processors. Paper, glass, metal and plastic packaging.
Energy & Environment
Oil & gas exploration and production, refining and marketing, and integrated oil companies. (Non-utility) electricity production, merchant energy, oil service and pipeline operators, environmental services and waste management.
Healthcare
Hospitals, long-term care facilities, outpatient facilities, medical device manufacturers and medical service providers. General and specialty pharmaceuticals.
Manufacturing
Heavy machinery
products, and transportation equipment manufacturers. Commercial and residential construction, homebuilding.
Book an
Metals & Mining
Coal and metal mini
Retail & Distribution
Grocery stores, drug storewholesale distributors.
Services
Business
Telecommunications Computer hardware, softw
manufacturers. Wireless, wireline, towers, satellite equipment and services, equipment manufacturers and integrated telecommunications companies.

30 December 2009 Special Comment Moody’s Global Corporate Finance - Moody's Financial Metrics™ Key Ratios by Rating and Industry for Global Non-Financial Corporations: December 2009
Special Comment Moody’s Global Corporate Finance
Moody's Financial Metrics™ Key Ratios by Rating and Industry for Global Non-Financial Corporations: December 2009
Transportation
Equipment leasing, airlines, air freight, railroad and maritime shipping, commuter transportation.
Moody’s Related Research
Special Comment:
Moody's Financial Metrics™ Key Ratios By Rating and Industry For Global Non-Financial Corporations: 2008, January 2009 (113940)
Moody's Financial MetricsTM Key Ratios By Rating And Industry For European, Middle Eastern And African Non-Financial Corporations: 2008, January 2009 (113942)
Moody’s Financial MetricsTM Key Ratios by Rating and Industry for North American Non-Financial Corporations: 2008, January 2009 (113941)
The Distribution of Common Financial Ratios by Rating and Industry for North American Non-Financial Corporations: 2008, July 2006 (98551)
Moody’s Senior Ratings Algorithm & Estimated Senior Ratings, February 2009 (114614)
Rating Methodology:
Moody's Approach to Global Standard Adjustments in the Analysis of Financial Statements for Non-Financial Corporations - Part I, February 2006 (96760)
Moody’s Approach to Global Standard Adjustments in the Analysis of Financial Statements for Non-Financial Corporations - Part II, February 2006 (96729)
Moody’s Approach to Global Standard Adjustments in the Analysis of Financial Statements for Non-Financial Corporations - Part III , September 2006 (98842)
Special Report:
Moody’s Basic Definitions for Credit Statistics, June 2007 (78480)
To access any of these reports, click on the entry above. Note that these references are current as of the date of publication of this report and that more recent reports may be available. All research may not be available to all clients.

31 December 2009 Special Comment Moody’s Global Corporate Finance - Moody's Financial Metrics™ Key Ratios by Rating and Industry for Global Non-Financial Corporations: December 2009
Special Comment Moody’s Global Corporate Finance
Moody's Financial Metrics™ Key Ratios by Rating and Industry for Global Non-Financial Corporations: December 2009
CREDIT RATINGS ARE MOODY'S INVESTORS SERVICE, INC.'S (MIS) CURRENT OPINIONS OF THE RELATIVE FUTURE CREDIT RISK OF ENTITIES, CREDIT COMMITMENTS, OR DEBT OR DEBT-LIKE SECURITIES. MIS DEFINES CREDIT RISK AS THE RISK THAT AN ENTITY MAY NOT MEET ITS CONTRACTUAL, FINANCIAL OBLIGATIONS AS THEY COME DUE AND ANY ESTIMATED FINANCIAL LOSS IN THE EVENT OF DEFAULT. CREDIT RATINGS DO NOT ADDRESS ANY OTHER RISK, INCLUDING BUT NOT LIMITED TO: LIQUIDITY RISK, MARKET VALUE RISK, OR PRICE VOLATILITY. CREDIT RATINGS ARE NOT STATEMENTS OF CURRENT OR HISTORICAL FACT. CREDIT RATINGS DO NOT CONSTITUTE INVESTMENT OR FINANCIAL ADVICE, AND CREDIT RATINGS ARE NOT RECOMMENDATIONS TO PURCHASE, SELL, OR HOLD PARTICULAR SECURITIES. CREDIT RATINGS DO NOT COMMENT ON THE SUITABILITY OF AN INVESTMENT FOR ANY PARTICULAR INVESTOR. MIS ISSUES ITS CREDIT RATINGS WITH THE EXPECTATION AND UNDERSTANDING THAT EACH INVESTOR WILL MAKE ITS OWN STUDY AND EVALUATION OF EACH SECURITY THAT IS UNDER CONSIDERATION FOR PURCHASE, HOLDING, OR SALE. © Copyright 2009, Moody’s Investors Service, Inc., and/or its licensors and affiliates (together, "MOODY'S”). All rights reserved. ALL INFORMATION CONTAINED HEREIN IS PROTECTED BY COPYRIGHT LAW AND NONE OF SUCH INFORMATION MAY BE COPIED OR OTHERWISE REPRODUCED, REPACKAGED, FURTHER TRANSMITTED, TRANSFERRED, DISSEMINATED, REDISTRIBUTED OR RESOLD, OR STORED FOR SUBSEQUENT USE FOR ANY SUCH PURPOSE, IN WHOLE OR IN PART, IN ANY FORM OR MANNER OR BY ANY MEANS WHATSOEVER, BY ANY PERSON WITHOUT MOODY’S PRIOR WRITTEN CONSENT. All information contained herein is obtained by MOODY’S from sources believed by it to be accurate and reliable. Because of the possibility of human or mechanical error as well as other factors, however, such information is provided “as is” without warranty of any kind and MOODY’S, in particular, makes no representation or warranty, express or implied, as to the accuracy, timeliness, completeness, merchantability or fitness for any particular purpose of any such information. Under no circumstances shall MOODY’S have any liability to any person or entity for (a) any loss or damage in whole or in part caused by, resulting from, or relating to, any error (negligent or otherwise) or other circumstance or contingency within or outside the control of MOODY’S or any of its directors, officers, employees or agents in connection with the procurement, collection, compilation, analysis, interpretation, communication, publication or delivery of any such information, or (b) any direct, indirect, special, consequential, compensatory or incidental damages whatsoever (including without limitation, lost profits), even if MOODY’S is advised in advance of the possibility of such damages, resulting from the use of or inability to use, any such information. The credit ratings and financial reporting analysis observations, if any, constituting part of the information contained herein are, and must be construed solely as, statements of opinion and not statements of fact or recommendations to purchase, sell or hold any securities. NO WARRANTY, EXPRESS OR IMPLIED, AS TO THE ACCURACY, TIMELINESS, COMPLETENESS, MERCHANTABILITY OR FITNESS FOR ANY PARTICULAR PURPOSE OF ANY SUCH RATING OR OTHER OPINION OR INFORMATION IS GIVEN OR MADE BY MOODY’S IN ANY FORM OR MANNER WHATSOEVER. Each rating or other opinion must be weighed solely as one factor in any investment decision made by or on behalf of any user of the information contained herein, and each such user must accordingly make its own study and evaluation of each security and of each issuer and guarantor of, and each provider of credit support for, each security that it may consider purchasing, holding or selling. MOODY’S hereby discloses that most issuers of debt securities (including corporate and municipal bonds, debentures, notes and commercial paper) and preferred stock rated by MOODY’S have, prior to assignment of any rating, agreed to pay to MOODY’S for appraisal and rating services rendered by it fees ranging from $1,500 to approximately $2,400,000. Moody’s Corporation (MCO) and its wholly-owned credit rating agency subsidiary, Moody’s Investors Service (MIS), also maintain policies and procedures to address the independence of MIS’s ratings and rating processes. Information regarding certain affiliations that may exist between directors of MCO and rated entities, and between entities who hold ratings from MIS and have also publicly reported to the SEC an ownership interest in MCO of more than 5%, is posted annually on Moody’s website at www.moodys.com under the heading “Shareholder Relations — Corporate Governance — Director and Shareholder Affiliation Policy.”
Report Number: 121772
Authors Senior Production Associate
Jennifer Tennant
Albert Metz
Wing Chan


![[XLS]dev.eiopa.europa.eu · Web view2 6 6 7/7/2014 8 7/7/2014 1 7 7 7/7/2014 9 7/7/2014 1 8 8 7/7/2014 10 7/7/2014 1 9 9 7/7/2014 11 7/7/2014 1 10 10 7/7/2014 12 7/7/2014 1 11 11](https://img.pdfslide.net/doc/110x75/5ae5800d7f8b9a8b2b8bf1f3/xlsdeveiopa-view2-6-6-772014-8-772014-1-7-7-772014-9-772014-1-8-8-772014.jpg)


![December 21, 2015 - Wisconsin Supreme Court · RB-1 (2015) [?\^]`_ acbedgfhbeij[ ahik[ l 1. mon#p qsrHt`rvuxwnzye{E|}ux~)r 'p n#w )rv|}ux~x 7 7 7 7 7 7 7 7 7 7 7 7 7 7 7 7 7 7 7 7](https://img.pdfslide.net/doc/110x75/5fb3422fccf05f68ab3a22e4/december-21-2015-wisconsin-supreme-court-rb-1-2015-acbedgfhbeij-ahik.jpg)