Embed Size (px)
Citation preview

JICA Training Course 2009
TSUNAMI NUMERICAL SIMULATIONAPPLIED TO TSUNAMI EARLY WARNING SYSTEM
ALONG SUMATRA REGION
Wiko Setyonegoro * ***Meteorological Climatological and Geophysical Agency INDONESIA**2009, JICA Participant Training Course, Nagoya University JAPAN
ABSTRACTIn the purposes of tsunami disaster preventions, required modeling scenarios of tsunami that will be used to determine the tsunami hazard potential. To create a tsunami modeling for the TEWS, required millions variations of fault parameter scenarios. Tsunami modeling have been made previously will be used to quickly determine tsunami hazard potential and evacuation decisions for the community. To create a tsunami modeling generally necessary information about the fault parameters which can be done by observing such as crustal deformation or displacement in kind of case relative or double-couple movement, so that the variation of the direction and values of the fault parameters will be modified similar faults with fault conditions that would be occur to predict the tsunamis in the future. In this study used several methods to determine the parameters of fault scenarios, consisting of ; using historical data, calculate the selection parameters, and validation with the reference of the survey results.
1. INTRODUCTION
1.1. Active TectonicsIndonesia is the region of confluence of three major plates such as subduction process in the Western part of Sumatra, the Indian plate moving under the crust subducted to Sumatra with velocity rate 50 mm/ year. Active tectonics in the Sumatran region has often caused by the earthquake, shown in Figure 1, plots by using GMT (General Mapping Tools), which shows the distribution of areas with shallow earthquakes and has a high intensity. Several events can generate earthquake-tsunami in the western part of Sumatra, and the result will be very destructive. In this case the focus mechanism of data analysis according to the USGS said that Sumatra has a kind of reverse fault side, indicates that subduction activity is not the only cause of earthquakes, but a several "lock" positions on Sumatra, which caused movement of double-couple, which will lead to a series of displacement for the next earthquake. Earthquakes are often associated with serious
issues about the potential of tsunami. This research is expected to further useful for determining the location of mitigation in the development and an early warning system efforts in Indonesia.
Figure 1. Active tectonic in Indonesia, ploting using GMT, shown earthquake distribution with
depth parameters around Sumatran trench.
1
JICA Training Course 2009
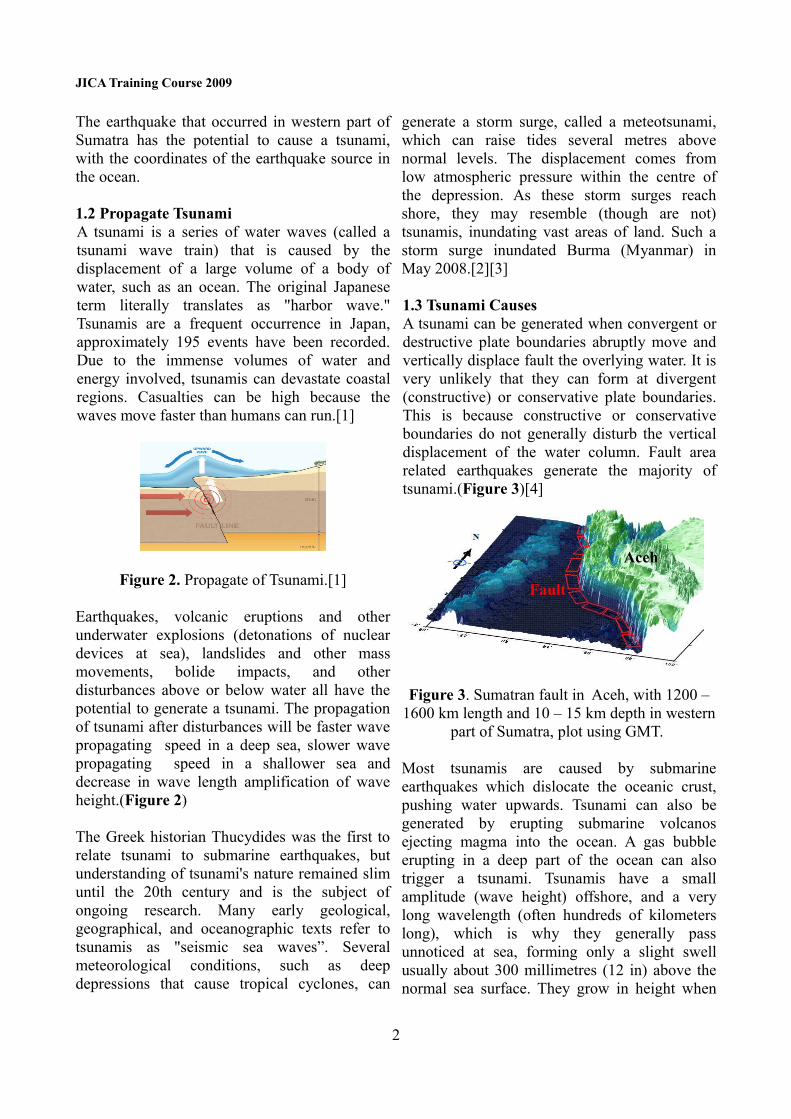
The earthquake that occurred in western part of Sumatra has the potential to cause a tsunami, with the coordinates of the earthquake source in the ocean.
1.2 Propagate TsunamiA tsunami is a series of water waves (called a tsunami wave train) that is caused by the displacement of a large volume of a body of water, such as an ocean. The original Japanese term literally translates as "harbor wave." Tsunamis are a frequent occurrence in Japan, approximately 195 events have been recorded. Due to the immense volumes of water and energy involved, tsunamis can devastate coastal regions. Casualties can be high because the waves move faster than humans can run.[1]
Figure 2. Propagate of Tsunami.[1]
Earthquakes, volcanic eruptions and other underwater explosions (detonations of nuclear devices at sea), landslides and other mass movements, bolide impacts, and other disturbances above or below water all have the potential to generate a tsunami. The propagation of tsunami after disturbances will be faster wave propagating speed in a deep sea, slower wave propagating speed in a shallower sea and decrease in wave length amplification of wave height.(Figure 2)
The Greek historian Thucydides was the first to relate tsunami to submarine earthquakes, but understanding of tsunami's nature remained slim until the 20th century and is the subject of ongoing research. Many early geological, geographical, and oceanographic texts refer to tsunamis as "seismic sea waves”. Several meteorological conditions, such as deep depressions that cause tropical cyclones, can
generate a storm surge, called a meteotsunami, which can raise tides several metres above normal levels. The displacement comes from low atmospheric pressure within the centre of the depression. As these storm surges reach shore, they may resemble (though are not) tsunamis, inundating vast areas of land. Such a storm surge inundated Burma (Myanmar) in May 2008.[2][3]
1.3 Tsunami CausesA tsunami can be generated when convergent or destructive plate boundaries abruptly move and vertically displace fault the overlying water. It is very unlikely that they can form at divergent (constructive) or conservative plate boundaries. This is because constructive or conservative boundaries do not generally disturb the vertical displacement of the water column. Fault area related earthquakes generate the majority of tsunami.(Figure 3)[4]
Figure 3. Sumatran fault in Aceh, with 1200 – 1600 km length and 10 – 15 km depth in western
part of Sumatra, plot using GMT.
Most tsunamis are caused by submarine earthquakes which dislocate the oceanic crust, pushing water upwards. Tsunami can also be generated by erupting submarine volcanos ejecting magma into the ocean. A gas bubble erupting in a deep part of the ocean can also trigger a tsunami. Tsunamis have a small amplitude (wave height) offshore, and a very long wavelength (often hundreds of kilometers long), which is why they generally pass unnoticed at sea, forming only a slight swell usually about 300 millimetres (12 in) above the normal sea surface. They grow in height when
2
Aceh
Fault

JICA Training Course 2009
they reach shallower water, in a wave shoaling process described below. A tsunami can occur in any tidal state and even at low tide can still inundate coastal areas.[4]
1.4 Background of ProblemOn April 1, 1946, a magnitude-7.8 (Richter Scale) earthquake occurred near the Aleutian Islands, Alaska. It generated a tsunami which inundated Hilo on the island of Hawai'i with a 14 metres (46 ft) high surge. The area where the earthquake occurred is where the Pacific Ocean floor is subducting (or being pushed downwards) under Alaska. Examples of tsunami at locations away from convergent boundaries include Storegga about 8,000 years ago, Grand Banks 1929, Papua New Guinea 1998 (Tappin, 2001). The Grand Banks and Papua New Guinea tsunamis came from earthquakes which destabilized sediments, causing them to flow into the ocean and generate a tsunami. They dissipated before traveling transoceanic distances. The cause of the Storegga sediment failure is unknown. Possibilities include an overloading of the sediments, an earthquake or a release of gas hydrates (methane etc.)[4]
The 1960 Valdivia earthquake (Mw 9.5) (19:11 hrs UTC), 1964 Alaska earthquake (Mw 9.2), and 2004 Indian Ocean earthquake (Mw 9.2) (00:58:53 UTC) are recent examples of powerful megathrust earthquakes that generated tsunamis (known as teletsunamis) that can cross entire oceans. The deadliest tsunami recorded was on December 26, 2004. It was caused by an earthquake. The earthquake was said to had magnitude 9.3 on the Richter scale. It was centered in the ocean near the coast of Sumatra, Indonesia. Over 215,000 people died from this disaster. The giant wave moved very quickly. Hundreds of thousands of people in Indonesia, Sri Lanka, Thailand, India, Somalia, and other nations, were killed or injured by it. Smaller (Mw 4.2) earthquakes in Japan can trigger tsunamis (called local and regional tsunamis) that can only devastate nearby coasts, but can do so in only a few minutes. In the 1950s, it was hypothesised that larger tsunamis than had
previously been believed possible may be caused by landslides, explosive volcanic eruptions (e.g., Santorini and Krakatau), and impact events when they contact water. These phenomena rapidly displace large water volumes, as energy from falling debris or expansion transfers to the water at a rate faster than the water can absorb. The media dub them megatsunami.[4]
Tsunamis caused by these mechanisms, unlike the trans-oceanic tsunami, may dissipate quickly and rarely affect distant coastlines due to the small sea area affected. These events can give rise to much larger local shock waves (solitons), such as the landslide at the head of Lituya Bay 1958, which produced a wave with an initial surge estimated at 524 meters (1,720 ft). However, an extremely large landslide might generate a megatsunami that can travel trans-oceanic distances, although there is no geological evidence to support this hypothesis. Tsunamis are often called tidal waves. This is misleading, because tsunamis are not related to tides. [4]
2. PURPOSE1. Determine the correct fault parameter to
make tsunami numerical modeling, through calculation, historical data of earthquake and references validation from research, survey and monitoring (GPS and seismology measurements)
2. Applying scenarios of tsunami numerical modeling to TEWS (Tsunami Early Warning System, intended to disaster mitigation and prevention for community.
3. OUTLINE1. Observation of the crustal movement,
displacement, deformation and fault parameters along Sumatra trench.
2. Tsunami modeling for tsunami early warning system as a step tsunami warning against. Modeling tsunami simulation as a supporter of DSS (Decision Support System) which has been done in BMKG 2010.
3

JICA Training Course 2009
4. METHODE AND PROCESSINGTo create the model, necessary information of focal mechanism (wphase moment tensor solution), so that the direction and value of fault
parameters can be modeled to determine the run-up and innundation in the area around the shoreline.(Figure 4)
Figure 4. Methodology on tsunami hazard potential
4.1. Using Historical DataDetermine fault parameters using historical data on this study with use data will be used to determine the fault parameters in tsunami scenario is data fochal mechanism of wphase moment tensor solution. Further data will be used as estimates for determining further more scenarios in the research area.(Figure 4)
Of an earthquake event, the essential data is the focal mechanism of fault, such as : length of fault, width, slip, depth, dip, strike accuracy parameters which will determine the maximum run-up that will occur along the Coastline.
This relationship is very closely related to the relationship equation between the Magnitude, and wide area fault. (Wells and Coopersmith, 1994). Reference parameters data for fault parameters by focal mechanism (wphase moment tensor solution) from USGS.[7]
4.2. Using CalculationsDetermine fault parameters using calculation process, there are two assumptions that are used to input parameters fault, according to some cases, as follows:
1. In assumption fault length is not devided.2. In assumption fault length devided
become subfault.
Data which use in tsunami numerical simulation by Etopo2 (Bathimetry data).[6]
4.2.1. Length of Fault Not DevidedAssumption on this case, an earthquake fault is extremely long, then the assumption is a long straight faults by eliminating the momentum correction. Here there is no difference angle correction for strike direction, or in general, there is no correction factor for the actual contours of faults which not exactly straight. (Figure 6)
4
JICA Training Course 2009
4.2.2 Length of Fault Devided
Equation 1. Moment Magnitude [11][13]
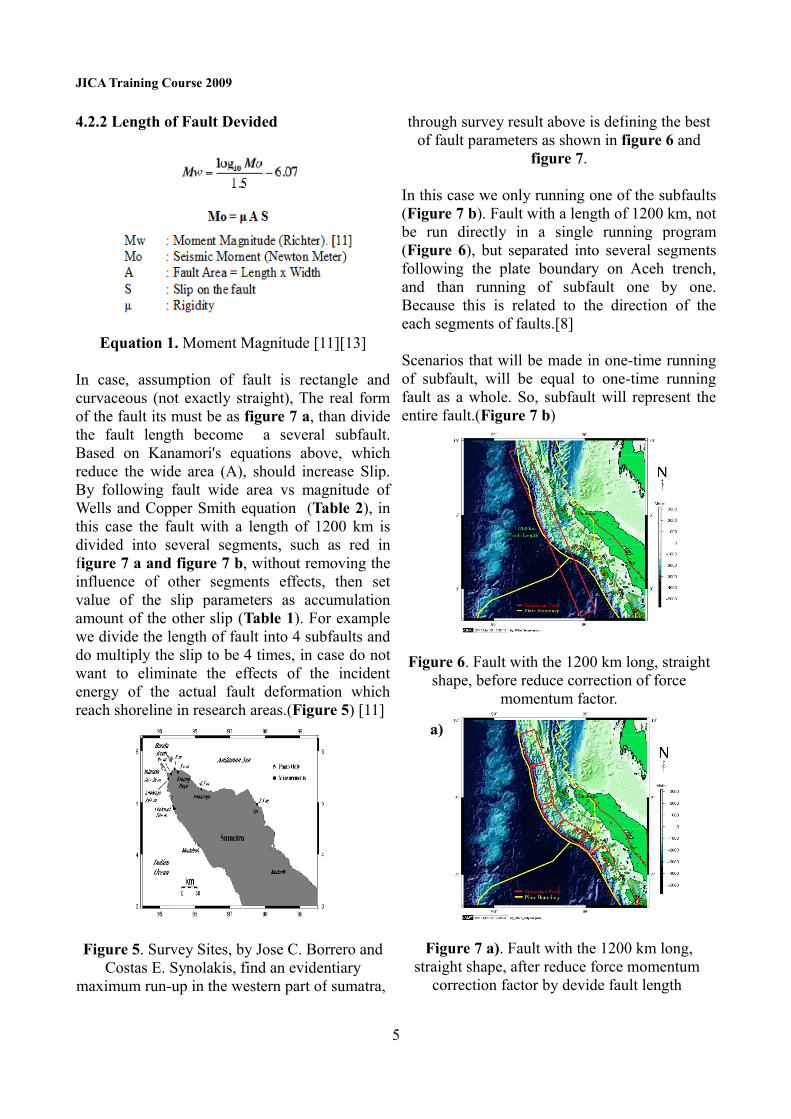
In case, assumption of fault is rectangle and curvaceous (not exactly straight), The real form of the fault its must be as figure 7 a, than divide the fault length become a several subfault. Based on Kanamori's equations above, which reduce the wide area (A), should increase Slip. By following fault wide area vs magnitude of Wells and Copper Smith equation (Table 2), in this case the fault with a length of 1200 km is divided into several segments, such as red in figure 7 a and figure 7 b, without removing the influence of other segments effects, then set value of the slip parameters as accumulation amount of the other slip (Table 1). For example we divide the length of fault into 4 subfaults and do multiply the slip to be 4 times, in case do not want to eliminate the effects of the incident energy of the actual fault deformation which reach shoreline in research areas.(Figure 5) [11]
Figure 5. Survey Sites, by Jose C. Borrero and Costas E. Synolakis, find an evidentiary
maximum run-up in the western part of sumatra,
through survey result above is defining the best of fault parameters as shown in figure 6 and
figure 7.
In this case we only running one of the subfaults (Figure 7 b). Fault with a length of 1200 km, not be run directly in a single running program (Figure 6), but separated into several segments following the plate boundary on Aceh trench, and than running of subfault one by one. Because this is related to the direction of the each segments of faults.[8]
Scenarios that will be made in one-time running of subfault, will be equal to one-time running fault as a whole. So, subfault will represent the entire fault.(Figure 7 b)
Figure 6. Fault with the 1200 km long, straight shape, before reduce correction of force
momentum factor.
Figure 7 a). Fault with the 1200 km long, straight shape, after reduce force momentum
correction factor by devide fault length
5
a)
JICA Training Course 2009
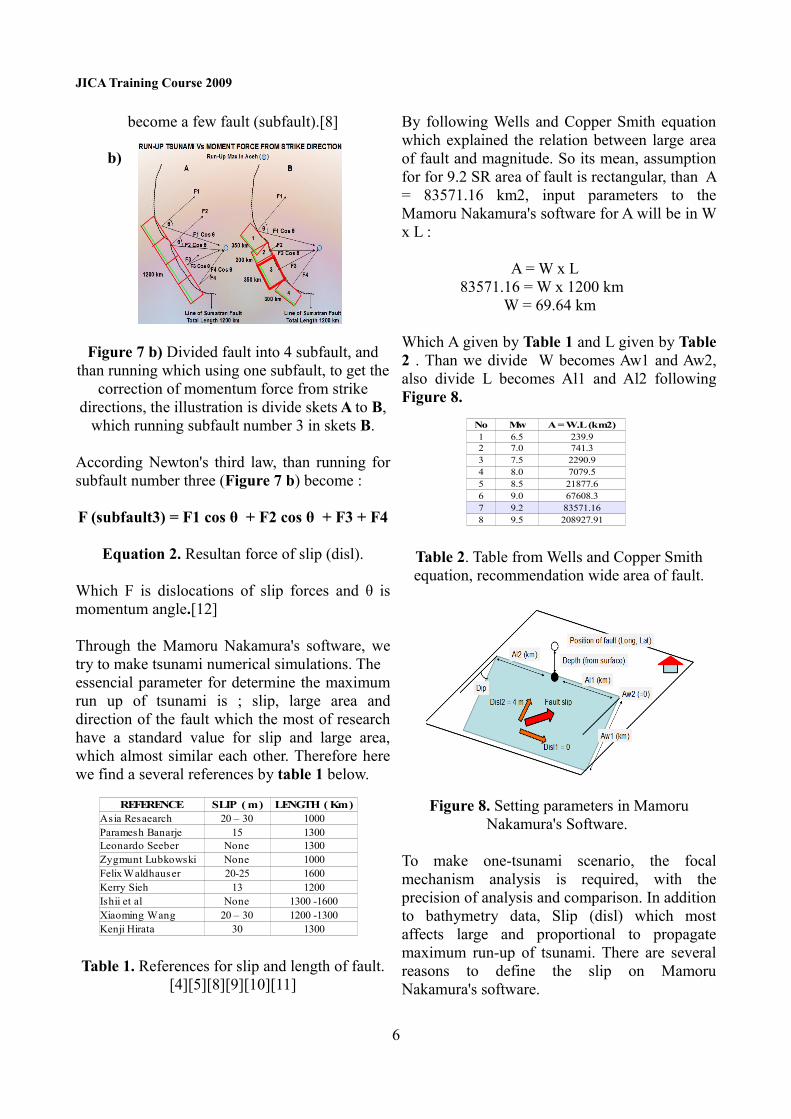
become a few fault (subfault).[8]
Figure 7 b) Divided fault into 4 subfault, and than running which using one subfault, to get the
correction of momentum force from strike directions, the illustration is divide skets A to B,
which running subfault number 3 in skets B.
According Newton's third law, than running for subfault number three (Figure 7 b) become :
F (subfault3) = F1 cos θ + F2 cos θ + F3 + F4
Equation 2. Resultan force of slip (disl).
Which F is dislocations of slip forces and θ is momentum angle.[12]
Through the Mamoru Nakamura's software, we try to make tsunami numerical simulations. The essencial parameter for determine the maximum run up of tsunami is ; slip, large area and direction of the fault which the most of research have a standard value for slip and large area, which almost similar each other. Therefore here we find a several references by table 1 below.
Table 1. References for slip and length of fault. [4][5][8][9][10][11]
By following Wells and Copper Smith equation which explained the relation between large area of fault and magnitude. So its mean, assumption for for 9.2 SR area of fault is rectangular, than A = 83571.16 km2, input parameters to the Mamoru Nakamura's software for A will be in W x L :
A = W x L 83571.16 = W x 1200 km W = 69.64 km
Which A given by Table 1 and L given by Table 2 . Than we divide W becomes Aw1 and Aw2, also divide L becomes Al1 and Al2 following Figure 8.
Table 2. Table from Wells and Copper Smith equation, recommendation wide area of fault.
Figure 8. Setting parameters in Mamoru Nakamura's Software.
To make one-tsunami scenario, the focal mechanism analysis is required, with the precision of analysis and comparison. In addition to bathymetry data, Slip (disl) which most affects large and proportional to propagate maximum run-up of tsunami. There are several reasons to define the slip on Mamoru Nakamura's software.
6
b)
No Mw A = W.L (km2)1 6.5 239.92 7.0 741.33 7.5 2290.94 8.0 7079.55 8.5 21877.66 9.0 67608.37 9.2 83571.168 9.5 208927.91
REFERENCE SLIP ( m ) LENGTH ( Km )Asia Resaearch 20 – 30 1000Paramesh Banarje 15 1300Leonardo Seeber None 1300Zygmunt Lubkowski None 1000Felix Waldhauser 20-25 1600Kerry Sieh 13 1200Ishii et al None 1300 -1600Xiaoming Wang 20 – 30 1200 -1300Kenji Hirata 30 1300

JICA Training Course 2009
Through trial and error to determine moment tensor solution of earthquakes :
• Choose the best fault parameters to make tsunami scenarios, to fitting with the observation data of Aceh tsunami on December 2004. (Kanamori).
• Run-up tsunami is strong affected by the large of slip and direction of fault. (Wells and Copper Smith)
Actual fault length is around 1200 - 1600 km and slip is around to 15 – 80 m (Equation 1 and
Equation 2), with a few assumptions to eliminate the effect of the moment force from strike direction. Based on :
1. Comparison of fault parameter model with data moment tensor USGS (dip, slip, strike, depth and magnitude).
2. Calculation of resultant force.3. Validations to survey results in Aceh by
following a few research papers.
Then, obtained the output of processing results which are described below.
4.2.3 Scenarios Simulation result of Run-Up Maximum on Aceh Tsunami 2004
Table 3. Scenarios with each fault parameters to find the correct parameters by ; validation, data and survey, to determine the correct parameters in Aceh tsunami 2004.
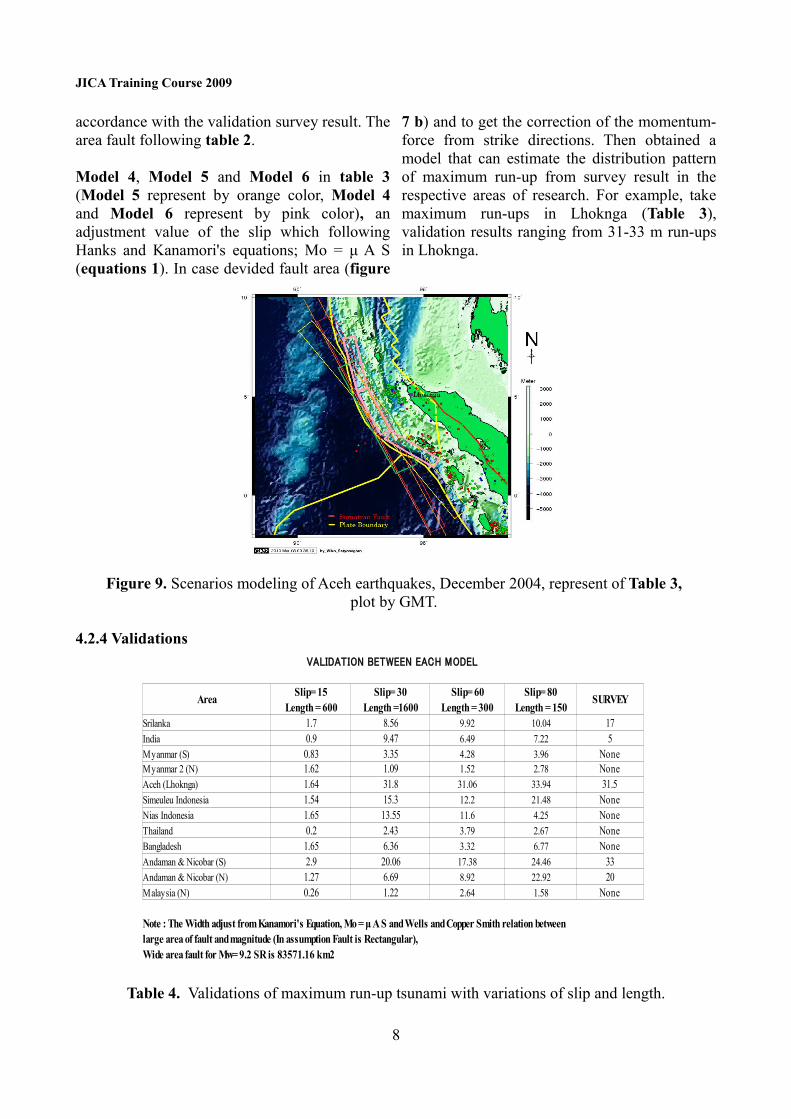
Model 1 in table 3 (represent by red color in figure 9, is the smallest of the fault scenario according to Table 1 (About Reference for Slip and length of Fault), the result is the run-up max tsunami in Lhoknga not in accordance with the validation survey result. The area fault following Table 2.
Model 2 in table 3 (represent by the yellow color in figure 9, the scenario with the strike of
fault position not straight face to Lhoknga (other parameter values the same as Model 1), the result is the run-up max tsunami in Lhoknga validation not in accordance with the validation survey result. The area fault following Table 2.
Model 3 in table 3 (represent by the green color in figure 9), decreasing wide area of faults without increasing the slip, the result showing run-up maximum tsunami in Lhoknga is not in
7
FAULT PARAMETERS FOR EACH SCENARIOS USED FOR TSUNAMI SIMULATION
PARAMETERSMODEL 1 MODEL 2 MODEL 3 MODEL 4 MODEL 5 MODEL 6
SURVEY(Min Value of ref.) (Loss Force) (Loss Wide) (Gain Strength) (Max Value of ref.) (Slip Amaunt)
Length (km)Al1 600 600 300 150 800 75
NONE
Al2 600 600 300 150 800 75
Width (km)Aw1 75 75 150 56 56 150
Aw2 0 0 0 0 0 0
Depth (km) 10 10 10 10 10 10
Str ike(Degree) 345 310 345 345 345 345
Dip (Degree) 15 15 15 15 15 15
Sl ip (m) 15 15 15 60 30 80
Mw (Richter) 9.2 9.2 9.2 9.2 9.2 9.2
Center Fau lt Latitude 5.5 5.5 5.5 5.5 5.5 5.5
Coordinate Longitude 93.85 93.85 93.85 93.85 93.85 93.85Run Up Max in Lhoknga, Aceh 8.8 m 6.2 m 2.79 m 31.8 31 .06 m 32.5 31.3 m
Note : Wells and Copper Smith relation between large area of fault and magnitude (In assumption Fault is Rectangular)Wide area fault for Mw= 9.2 SR is 83571.16 km2
REFERENCE SLIP (m) LENGTH (KM)
No Mw A=W.L(km2) Asia Reaearch 20 – 30 1000
1 6.5 239.9 Paramesh Banarje 15 1300
2 7.0 741.3 Leonardo Seeber None 1300
3 7.5 2290.9 Zygmunt Lubkowski None 1000
4 8.0 7079.5 Felix Waldhauser 20-25 1600
5 8.5 21877.6 Kerry Sieh 13 1200
6 9.0 67608.3 Ishii et al None 1300 -1600
7 9.2 83571.16 Xiaoming Wang 20 – 30 1200 -1300
8 9.5 208927.91 Kenji Hirata 30 1300
JICA Training Course 2009
accordance with the validation survey result. The area fault following table 2.
Model 4, Model 5 and Model 6 in table 3 (Model 5 represent by orange color, Model 4 and Model 6 represent by pink color), an adjustment value of the slip which following Hanks and Kanamori's equations; Mo = μ A S (equations 1). In case devided fault area (figure
7 b) and to get the correction of the momentum-force from strike directions. Then obtained a model that can estimate the distribution pattern of maximum run-up from survey result in the respective areas of research. For example, take maximum run-ups in Lhoknga (Table 3), validation results ranging from 31-33 m run-ups in Lhoknga.
Figure 9. Scenarios modeling of Aceh earthquakes, December 2004, represent of Table 3, plot by GMT.
4.2.4 Validations
Table 4. Validations of maximum run-up tsunami with variations of slip and length.
8
VALIDATION BETWEEN EACH MODEL
Area Slip= 15 Slip= 30 Slip= 60 Slip= 80 SURVEYLength = 600 Length =1600 Length = 300 Length = 150
Srilanka 1.7 8.56 9.92 10.04 17India 0.9 9.47 6.49 7.22 5Myanmar (S) 0.83 3.35 4.28 3.96 NoneMyanmar 2 (N) 1.62 1.09 1.52 2.78 NoneAceh (Lhoknga) 1.64 31.8 31.06 33.94 31.5Simeuleu Indonesia 1.54 15.3 12.2 21.48 NoneNias Indonesia 1.65 13.55 11.6 4.25 NoneThailand 0.2 2.43 3.79 2.67 NoneBangladesh 1.65 6.36 3.32 6.77 NoneAndaman & Nicobar (S) 2.9 20.06 17.38 24.46 33Andaman & Nicobar (N) 1.27 6.69 8.92 22.92 20Malaysia (N) 0.26 1.22 2.64 1.58 None
Note : The Width adjust from Kanamori's Equation, Mo = μ A S and Wells and Copper Smith relation between large area of fault and magnitude (In assumption Fault is Rectangular), Wide area fault for Mw= 9.2 SR is 83571.16 km2
JICA Training Course 2009
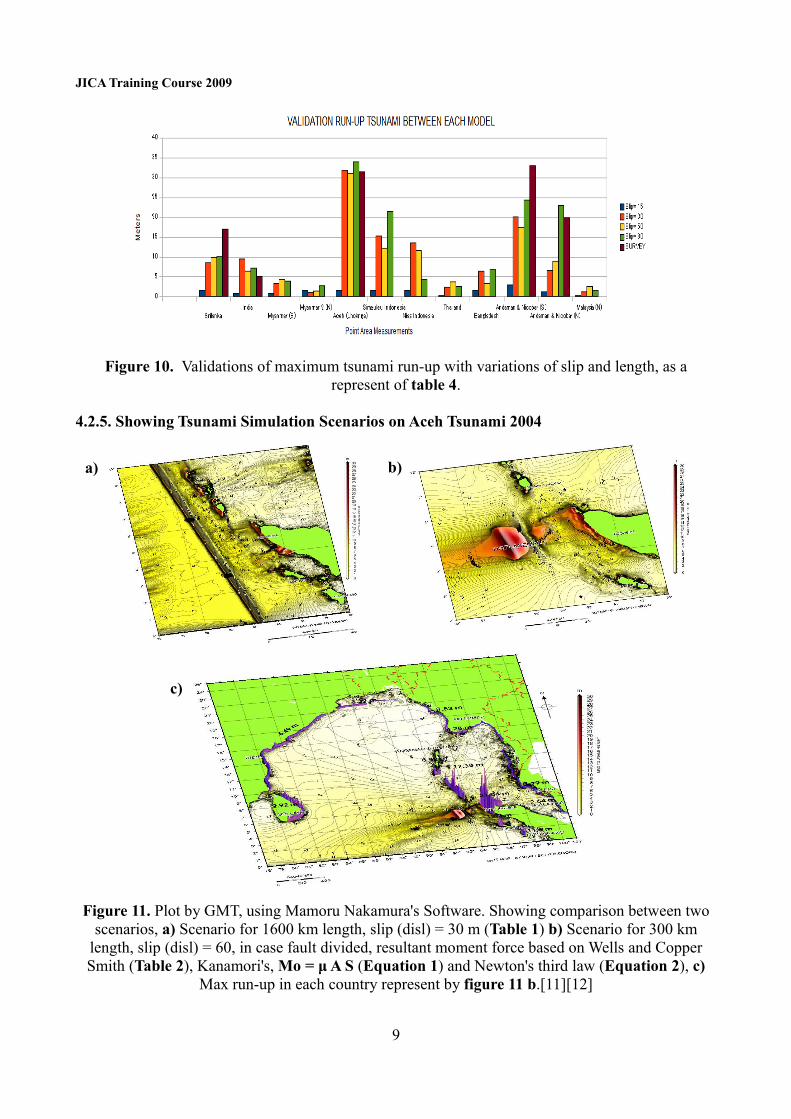
Figure 10. Validations of maximum tsunami run-up with variations of slip and length, as a represent of table 4.
4.2.5. Showing Tsunami Simulation Scenarios on Aceh Tsunami 2004
Figure 11. Plot by GMT, using Mamoru Nakamura's Software. Showing comparison between two scenarios, a) Scenario for 1600 km length, slip (disl) = 30 m (Table 1) b) Scenario for 300 km
length, slip (disl) = 60, in case fault divided, resultant moment force based on Wells and Copper Smith (Table 2), Kanamori's, Mo = μ A S (Equation 1) and Newton's third law (Equation 2), c)
Max run-up in each country represent by figure 11 b.[11][12]
9
a) b)
c)

JICA Training Course 2009
Tabel 5. Output of tsunami numerical modeling in Aceh tsunami, December 2004. List of analysis in each research areas, scenario for 300 km length, slip (disl) = 60 m, in case fault divided, resultant moment force based on Wells and Copper Smith (Table 2), Kanamori's, Mo = μ A S (Equation 1)
and Newton's third law (Equation 2).[11][12]
Figure 12. Travel time of tsunami simulation using Mamoru Nakamura's software. scenario for 150 km length, slip (disl) = 80 m, in case fault divided, resultant moment force based on Wells and
Copper Smith (Table 2), Kanamori's, Mo = μ A S (Equation 1) and Newton's third law (Equation 2).[11][12]
10

JICA Training Course 2009
Figure 13. Maximum tsunami height vs ocean bottom in Aceh region, output of Mamoru Nakamura's software, showing how tsunami generate by ocean bottom. Scenario for 300 km length, slip (disl) = 60 m, in case fault divided, resultant moment force based on Wells and Copper Smith (Table 2), Kanamori's, Mo = μ A S (Equation 1) and Newton's third law (Equation 2).[11][12]
11

JICA Training Course 2009
4.3. References for Fault DeterminationsTo create tsunami simulation , in additional as a reference from research, survey and monitoring, also by using GPS and seismology measurements are required to define the model of the fault by validation. Direction of fault according to the GPS measurement and analysis of crustal deformation can be used as a parameter to determine the fault parameters. Following the requirements of the strike fault directions will determine the moment of force to produce the run-up in the shoreline. (Figure 14)
Fault determinations above consisting of :1. Determine fault parameters using
references from GPS measurements.2. Determine fault parameters using
references from seismology analysis.
4.3.1. Using GPS Measurements References
Figure 14. Crustal motion in indonesia using GPS measurements, Y. Bock, L. Prawirodirdjo
and J. F. Genrich C, to be explained crustal movements in the western part of Sumatra.[5]
Determine fault parameters by GPS validations of velocity field in Sumatra and adjacent areas relative to the estimated Sunda Shelf reference frame. Arrows show the principal strain rate axes for the northern, central, and southern parts of the Sumatra forearc. GPS velocity vectors in the estimated Sunda Shelf reference frame. Some stations on Sumatra have been omitted to preserve clarity. Heavy dashed lines indicate crustal block boundaries. The velocity estimates
for sites in southern Sumatra are not well constrained. And cannot be used to perform a detailed analysis of deformation in the southern Sumatran fault and forearc. Nevertheless, the north components suggest that the southern part of the back arc moves similarly to the northern part. If we assume that the entire Sumatra back arc is not deforming significantly, then the arc-parallel components suggest that the southern part of Sumatran fault slips at a lower rate than the northern part (Figure 14). This observation would be consistent with the prediction of a northward increase in slip rates on the fault based on subduction earthquake slip vectors (McCaffrey, 1991), with geological slip rate estimates (e.g., 11 mm/yr), (Sieh et al., 1994) and 5.5 ± 1.9 mm/yr, (Bellier et al., 1999).
Figure 15. Seismic active in Sumatra. Plot using GMT, represent distribution earthquake with
focal mechanism between the Indonesian plate boundary (yellow line) and Sumatran fault (red
line).
Through image above could certainly provide a definition of focal mechanism, while to obtains accurate data, available to download from the USGS data of wphase moment tensor solution. (Figure 15)
4.3.2. Using Seismology ReferencesBelow is an analysis of determine fault position using seismology references, as one way of defining fault with detection horizontal displacements along the Sumatra region.
12

JICA Training Course 2009
The 3D observation data will be validated with the results predicted, where the anomalies which appear in the observation data, it will be analyzed with the results predicted anomalies. Validation is also performed on the GPS measurement Vs Model (Wiko, 2007). (Figure 16). Indian plate was moving relatively from the West to the East around Sumatra region, exactly the trench which extends from Aceh to the Andaman and Nicobar island with the movement reached 55 mm / year. A simple analysis, the
magnitude accumulation area (concave-shaped contour) indicated the “lock position” by points A and B in figure 16 a. According to Kenneth W. Hudnut, uses the model of Perfettini and Avouac 2004 and GPS measurements by Figure 16 c and figure 16 d, a few area in Sumatra is “lock”, given analysis validation between model of Perfettini and Avouac, 2004 and model of Wiko, 2007 (figure 16 b) it's showing indicated the conkave contour area is not move.[9]
Figure 16. a) In the vertical cross-section of Sumatra map, ploting by GMT, shows a very steep topography on the plate boundary, which certainly can produce a tsunami run-up high on the
shorelines. b) Original output of Model, the 3D plot distributions of accumulation magnitude for Sumatra with pseudo color, (Wiko, 2007), showing indication possibility in the points A and B is “locked area” (seismic gaps). c) Kenneth W. Hudnut, 2005. Deep after slip patterns fit in neatly downdip from each of the two largest coseismic slip patches, d) Postseismic slip resolved on the
plate interface 2005)[9], b) Validation GPS measurements Vs model (Wiko, 2007). The possibility of the existence of seismic gaps or lock position of the crustal indicated by points A and B in figure 16 a and figure 16 b, the validations is the horizontal displacements in figure 16 c and figure 16 d
located between points A and B.[7]
13

JICA Training Course 2009
4.3.3. Validation
Figure 17. Validations area of maximum run-up tsunami in Western part of Aceh.
Table 6. Validation maximum tsunami height on each area.
By doing validation, will be known to what extent the accuracy of tsunami scenarios that have been made, as an example is the validation of the model with the results of a survey conducted by Jose C. Borrero, 2005. [9]
Figure 18. Validation maximum run-up between model vs survey of Jose C. Borrero,
2005, in each area.(residu is 6.47 m)
The validated region is the western part of Aceh, is shown in figure 17, then the data is made in table 6, to shown the pattern estimate by plotted in a curve as shown in figure 18, the objective is to see the distribution pattern of maximum run-up in each region. The result is a residue of the validation is 6.47 m. [9]
Table 7. Validation of maximum tsunami height in each area.
Validation is also done in other areas outside of Indonesia affected by tsunami, such as the Andaman and Nicobar island, and Srilanka. shown in figure 19, then the data is made in table 7, according to the table, and then plotted in a curve as shown in figure 19. Residue obtained from the validation of measurement results is 3.56 m.
Figure 19. Validation of maximum run-up between model vs survey of Jose C Borreo in
each area (residual validation is 3.56 m).
Validation of the two figure above shows the distribution pattern of the curve is following to the results of the survey curve. Residual value can be minimized by counting the number corrected, consisting of : strike correction, wide area and slip.(Equation 1 and Equation 2)
14
Raya IslandLhoknga
Great NicobarCar Nicobar
Srilanka
05
10152025303540
MODEL VS Eric L. Geist Eric L. GeistModel 2
Area
Max
Tsu
Raya IslandLhoknga
Banda AcehAceh Besar
Kreung RayaPanteraja
0
5
10
15
20
25
30
35
MODEL VS Jose C. Borrero Jose C BorreoModel 1
Points Area
Max
Tsu
Run
Up

JICA Training Course 2009
5. TSUNAMI HAZARD POTENTIALIndonesian government, with the help of donor countries, has developed a Tsunami Early Warning System for Indonesia (Indonesian Tsunami Early Warning System - InaTEWS). The system is centered on Meteorology, Climatology and Geophysical Agency (BMKG) in Jakarta. This system allows BMKG sending a tsunami warning in the event of an earthquake that caused the tsunami potential. Current system is being perfected. In the future, this system will be issued a warning level 3, in accordance with the results of calculations DSS (Decision Support System).[14]
Development of tsunami early warning system was involved many parties, both central government agencies, local governments, international agencies, non-governmental agencies. Coordinator of the Indonesian side is the Ministry of Research and Technology (RISTEK). Meanwhile, the designated agency responsible for issuing Info Earthquake and Tsunami Warning is BMKG. This system is designed to be issued a tsunami warning in time
of at least 5 minutes after the earthquake occurred.[14]
Early Warning System has 4 components : 1. Knowledge of Hazard and Risk,2. 2. Forecasting, Warning, and Reaction, 3. 3. Observation (Monitoring of the
earthquake and sea level), 4. 4. Integration and Dissemination of
Information, Preparedness. (Figure 21)[14]
Tsunami early warning system is a series of complex work systems involving many parties, on the regional, national and international tributaries of the society.[14]
In the event of an earthquake, the events were recorded by means of seismograph (earthquake recorder). Earthquake Information (strength, location and time events) are sent via satellite to BMKG Jakarta. BMKG will release the next Quake Info delivered through technical equipment simultaneously. Earthquake data included in the DSS to consider whether the earthquake has the potential to cause a tsunami.
15
Figure 20. Validation maximum run-up between model vs survey references in each
area. Residue obtained from the measurement is 6.95 m. Residue is too large for a
considerable distance. The pattern of the curve shows the suitability of the maximum run-up at each point. To predict accurately, it needed
more fault scenarios parameters obtained from the reference GPS measurements, focal
mechanisms and moment tensor data. [9][10]
Table 8. Validation of maximum tsunami height in each area, which done with both
the survey results as well, so it can be further examined on the accuracy of the
model. Average residual of the validation results is 6.95 m.

JICA Training Course 2009
The calculation is based on millions of modeling scenarios that have been made beforehand. Then, may issue BMKG tsunami warning info. This earthquake data will also be integrated with data from devices other early warning systems (GPS, Buoy, Obu and Tide Gauge) to confirm whether a tsunami had actually been formed. This information is also transmitted by BMKG. BMKG deliver tsunami warning information through an intermediary institutions, which
include (Local Government and the Media). This intermediary institutions that transmit warning information to the public. BMKG also convey information via SMS alerts to mobile phone users who are registered in the database BMKG. Earthquake Info ways of delivery for now is via SMS, facsimile, telephone, email, RANET (Internet Radio), FM RDS (Radio RDS have facilities / Radio Data System) and through the website of BMKG.[14]
Figure 21. Chart of monitoring procedures of tsunami early warning system in Indonesia.[14]
5.1 ProceduresSystem Seiscom-P BMKG releases tsunami potency earthquake parameter. Observation censor buoys, tide gauge & GPS gives verification report waving tsunami. Simulation of tsunami is implemented automatically by DSS based on earthquake parameter input Seiscom-P. DSS gives image of tsunami analysis consisting of ; location of tsunami impact coast, arrival time, wave height, level commemoration of tsunami & alternative of decision. Information of commemoration of tsunami is sent through communications 5 in 1 system in BMKG to evacuate community (Figure 21).[14]
5.2 Action Plan in BMKGIn this study, examples of research on tsunami modeling has been done will be applied to the picture 21 above. Work plan with the tsunami
scenario produces more than a million scenarios, complete with risk and vulnerability modeling. With a full predictive modeling tsunami, the potential hazard of tsunami information intended for the evacuation process will run as fast as possible.(Figure 22)
5.3 How it Works1. Models are made in the form of tables of
data with sequently of each parameters.2. Locations have been grouped according
to the fault position which nearest to the shoreline.
3. Model that has been made in the classification sequence: nearest distance to fault, strike direction, extensive fault and slip (dislocation).
4. Created tools (software) specifically to identify the best simulation of the
16

JICA Training Course 2009
millions of tsunami scenarios.5. Procurement of special instruments that
will be placed on Local Government and the regional tsunami warning center of
BMKG. Expected to accelerate the evacuation decision for the community.
Figure 22. Chart of step work from TEWS and tsunami numerical modeling scenarios
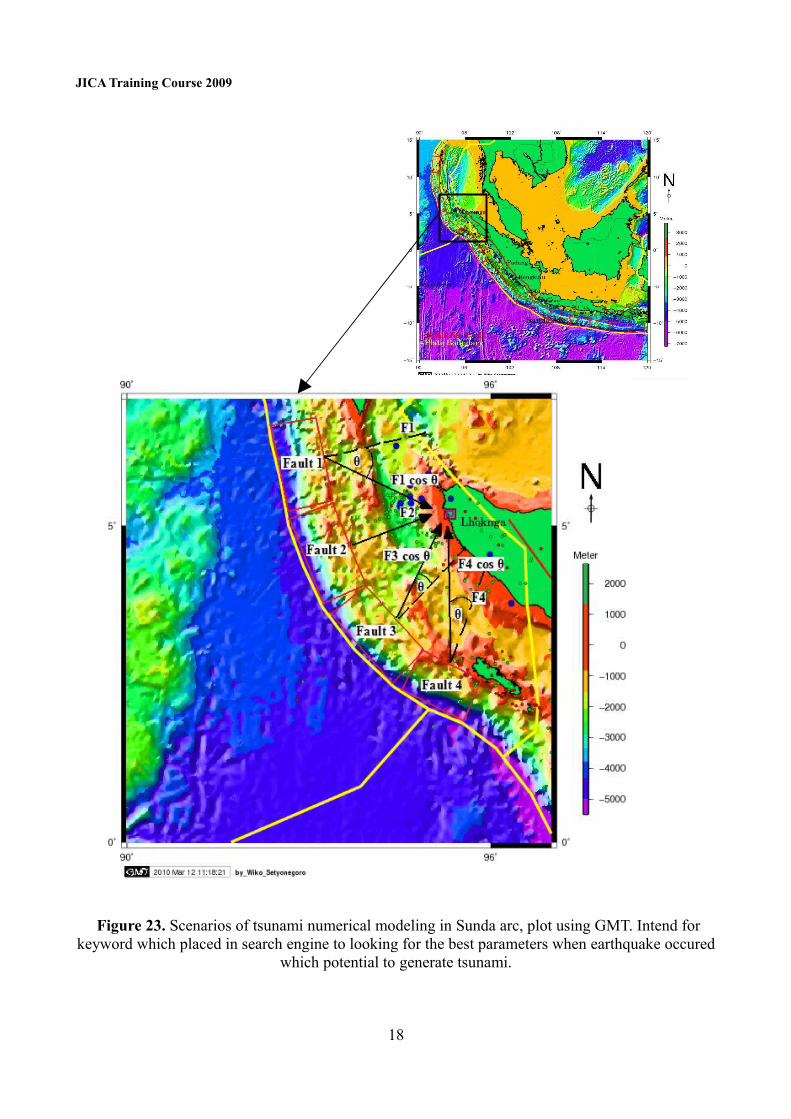
5.4 Action Plan on ScenariosTo speed the process of finding a model that has been made previously. Plan to be made is structured on a server of BMKG. Millions of these models will be stored neatly in the server, be prepared for when the real earthquake occured. Software for search engine to looking for the best parameters when earthquake potential to generate tsunami already indicated. When the the earthquake occur, the server in BMKG already have more than millions scenario. The combination of keywords that will serve as the basis of search on the server BMKG is the momentum of each subfault style nearest to the position of danger zone for determine maximum run-up, in this case for example run-up in Lhoknga which actual length is 1200 km length and 30 m slip which will get from aftershock of earthquakes data. There is four moment force (Figure 23), than the scenarios that can be done is :
1. 1st Priority keyword in search engine on BMKG's server is slip (disl) and length of fault.2. 2st Priority keyword on search engine ; F (Fault3) = F1 cos θ + F2 + F3 cos θ + F4 cos θ
which will running one time with using one fault which already devided to 4 subfaults, with slip increasing to 4 times (Hanks and Kanamori's, Mo = μ A S (Equation 1)).
3. 3st Priority keyword on search engine ; F is mean slip momentum force, F (Total) = F1 cos θ + F2 + F3 cos θ + F4 cos θ which will running 4th time with using one fault which already divided to 4 subfaults. After that we add the output result in meter, the amount of 4th
time running is the F (Total) run-up tsunami in Lhoknga.4. The next combinations to search possibility of scenarios of fault is ; distance from danger
zone. For example, priority of combinations scenario for lhoknga is fault number three in figure 23. After that, the other parameters such as ; depth, dip and other parameters will follow.
17
JICA Training Course 2009
Figure 23. Scenarios of tsunami numerical modeling in Sunda arc, plot using GMT. Intend for keyword which placed in search engine to looking for the best parameters when earthquake occured
which potential to generate tsunami.
18

JICA Training Course 2009
6. CONCLUSIONS1. Validation measurements carried out
between the model and the survey would be more accurate for areas which close to the fault position. Instead validation with remote areas of the fault, the value of validation will be slightly off the mark. This is caused by a correction factor of bathymetry data, and stike angle of the fault.
2. To calculate the maximum tsunami run-up with a very long fault, it would be more effective if used subfault, and running the program be repeated several times following the actual fault length.
3. Error factor which often occurs when creating the scenarios modeling is consisting of ; moment force from angle position of faults (F-strike) (Figure 7 b), the definition of fault length (L), the nearest distance between the fault with shoreline, and correction factor from the bathymetry condition (ocean bottom).
7. ACKNOWLEDGEMENTSThanks so much to JICA and RSVD – Nagoya University for organizing this training course on operating management of Earthquake, Tsunami and Volcano eruption observation system. For Prof. Kimata who arranged all training program, and also for all teachers who give knowledge which has supported this paper. Lastly, thanks for all friends and colleagues at JICA and RSVD for all support and cooperation along this training.
8. RFERENCES1. Fradin, Judith Bloom and Dennis
Brindell (2008). Witness to Disaster: Tsunamis. Witness to Disaster. Washington, D.C.: National Geographic Society. pp. 42, 43. Http;//shop.nationalgeographic.com/product/977/4389/971.html.
2. Http://www.answers.com/topic/tsunami tsunami.
3. Thucydides: “A History of the Peloponnesian War”, 3.89.1–4.
4. Smid, T. C. (Apr., 1970). 'Tsunamis' in Greek Literature. 17 (2nd ed.). pp. 100–104.
5. Y. Bock,1 L. Prawirodirdjo,1 J. F. Genrich,1 C. “Crustal motion in Indonesia from Global Positioning System measurements”. JOURNAL OF GEOPHYSICAL RESEARCH, VOL. 108, NO. B8, 2367, doi:10.1029/2001JB000324, 2003.
6. Etopo2,Http;//www.ngdc.noaa.gov/mgg/gdas/gd_designagrid.html.
7. Http://earthquake.usgs.gov/earthquakes/eqarchives/sopar/.
8. Kenji Hirata, The 2004 Indian Ocean tsunami: “Tsunami Source Model from Satellite Altimetry”, Program for Deep Sea Research, IFREE, Japan Agency for Marine-Earth Science and Technology, Natsushima 2-15, Yokosuka 237-0061, Japan, 2006.
9. Jose C. Borrero, Field Survey northern Sumatra and Banda Aceh, Indonesia and after the Tsunami and Earthquake of 26 December 2004, Department of Civil Engineering, University of Southern California, Los Angeles, CA 90089-2531, USA, 2005.
10. Eric L. Geist, Vasily V. Titov, Diego Arcas, Fred F. Pollitz, and Susan L. Bilek, Implications of the 26 December 2004 Sumatra–Andaman Earthquake on Tsunami Forecast and Assessment Models for Great Subduction-Zone Earthquakes, Bulletin of the Seismological Society of America, Vol. 97, No. 1A, pp. S249–S270, January 2007.
11. Hanks, Thomas C.; Kanamori, Hiroo (05/1979). "Moment magnitude scale". Journal of Geophysical Research 84 (B5): 2348–2350. Retrieved 2007-10-06.
12. Feynman, R. P., Leighton, R. B., Sands, M. (1963). Lectures on Physics, Vol 1. Addison-Wesley. ; Kleppner, Daniel; Robert Kolenkow (1973). An Introduction to Mechanics. McGraw-Hill. pp. 133–134. ISBN 0070350485.
19

JICA Training Course 2009
13. Kanamori and Richard Allen, Rapid magnitude determination for earthquake early warning. Allen, R.M. and H. Kanamori (2001) Rapid determination of
event source parameters in southern California for earthquake early warning, AGU 2001 fall meeting.
14. Http;//www.bmg.go.id.
20