Embed Size (px)
Citation preview

CHAPTER
CHAPTER VII
INTERSECTORAL LINKAGES AND HEALTH DEVELOPMENT
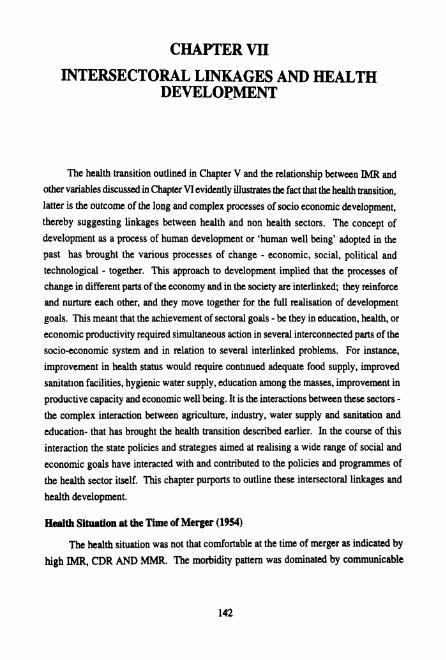
The health transition outlined in Chapter V and the relationship between IMR and other variables discussed in Chapter VI evidently illustrates the fact that the health transition,
latter is the outcome of the long and complex processes of socio economic development,
thereby suggesting linkages between health and non health sectors. The concept of
development as a process of human development or 'human well being' adopted in the
past has brought the various processes of change - economic, social, political and technological - together. This approach to development implied that thc processes of change in different parts of the economy and in the society are interlinked; they reinforce and nurture each other, and they move together for the full realisation of development goals. This meant that the achievement of sectoral goals -be they in education, health, or economic productivity required simultaneous action in several interconnected parts of the socio-economic system and in relation to several interlinked problems. For instance,
improvement in health status would require conbnued adequate food supply, improved
sanitation facilities, hygienic water supply, education among the masses, improvement in productive capacity and economic well being. It is the interactions between these sectors - the complex interaction between agriculture, industry, water supply and sanitation and
education- that has brought the health transition described earlier. In the course of this
interaction the state policies and strategies aimed at realising a wide range of social and economic goals have interacted with and contributed to the policies and programmes of
the health sector itself. This chapter purports to outline these intersectoral linkages and
health development.
Health Situation at the Time of Merger (1954)
The health situation was not that comfortable at the time of merger as indicated by
high IMR, CDR AND MMR. The morbidity pattern was dominated by communicable
and respiratory diseases. Most of these leading diseases were caused by or associated with the then existing physical, economic, social and cultural environment. Poor water supply, sewage system, personal hygiene, latrine facility, lack of facilities for the disposal of night soil, contamination in water, lack of health consciousness (due to high illiteracy), increasing poverty, unemployment, shortage of foodgrains caused by backward agriculture and lack of infrastructure like roads and communications.
There was one doctor for a population of 5.500, one nurse for 7,800 and one mid wife for 4,300. Rural areas were not adequately covered by sanitary inspectors, health visitors, vaccinators, etc. There were only 34 hospitals with a total of 568 beds in the Territory. Municipal health administration was poor due to paucity of finance wd&ned personnel. The system of school health inspection was not followed_up. Thus the health situation on the eve of merger suggest that the low health status was linked to low level of socio economic situation which evidently indicates intersectoral linkages and health
development.
Health Development, 1956-1978
The health situation started improving from 1954 when the Territory was brought under the ambit of economic planning. The changing health situation could be seen from
the perceptible decline in death rates. For instance, during the period 1956-1978 the IMR fell from 136.2 to 56.0 per 1000 births and CDR from 22.5 to 12.0 per 1000 population and the MMR from 3.9 to 1 .O. Smallpox was completely wiped out and the Territory was
declared free from this scourge in 1967'. The intensity and the magnitude of some of the erstwhile major diseases like plague, cholera, and malaria have been reduced to a large extent. Some of the diseases accounting for infant mortality like tetanus, pneumonia,
diahonea, jaundice, diptheria, wooping cough and measles have been overcome. In other words, the Territory has achieved considerable success in controlling communicable
diseases and this marks a remarkable morbidity transition in Pondicherry.
This achievement has been made possible chiefly by three factors, namely, the
consistent and systematic increase in conventional health care inputs, the vigorous efforts of the Government to promote public health as a means of promoting social welfare and
more general social and economic improvements originating outside the health sector.
Regarding health care inputs, between 1956 and 1978, the number of doctors rose from 52
to 208 or fium 0.1 5 to 0.36 per 1000 population. The provision of beds rose fium 771 to 1457 or from 2.22 to 2.70 per 1000 population. Other health workers increased from 243
to 889 or from 0.87 to 1.63 per 1000 population.
Government's concern and commitment to augment health facilitaties was reflected 143
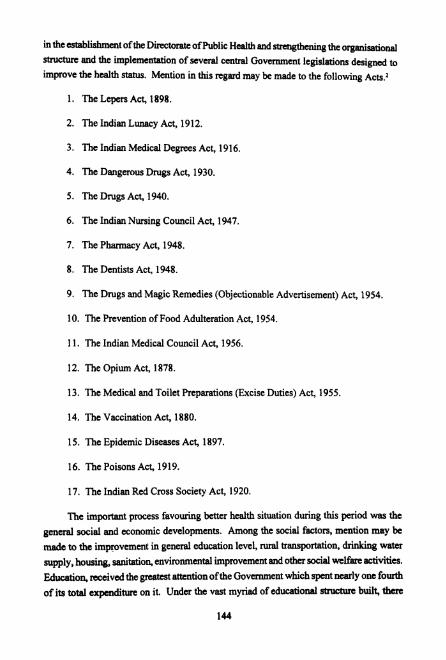
in the establishment of the Directorate of Public Health and sangthcning the organisational structure and the implementation of several central Government legislations designed to improve the health status. Mention in this regard may be made to the following Acts.l
1. The Lepers Act, 1898.
2. The Indian Lunacy Act, 1912.
3. The Indian Medical Degrees Act, 1916.
4. The Dangerous Drugs Act, 1930.
5. The Drugs Act, 1940.
6. The Indian Nursing Council Act, 1947.
7. The Pharmacy Act, 1948.
8. The Dentists Act, 1948.
9. The Drugs and Magic Remedies (Objectionable Advertisement) Act, 1954.
10. The Prevention of Food Adulteration Act, 1954.
1 1. The Indian Medical Council Act, 1956.
12. The Opium Act, 1878.
13. The Medical and Toilet Preparations (Excise Duties) Act, 1955.
14. The Vaccination Act, 1880.
15. The Epidemic Diseases Act, 1897.
16. The Poisons Act, 1919.
17. The Indian Red Cross Society Act, 1920.
The important process favouring better health situation during this period was the
general social and economic developments. Among the social factors, mention may be made to the improvement in general education level, rural transportation, drinking water
supply, housing, sanitation, environmental improvement and other social welfare activities.
Education, nceived the greatest attention of the Government which spent marly one fourth
of its total expenditure on it. Under the vast myriad of educational structun built, there
has been good progress in universalisatlon of elementary education of girls and scheduled
caste members. Theie was 76 fold increase in educational expenditure and the rate of
literacy improved from 23 to 52 per cent.
The unsatisfactory road and transport conditions came to be improved vastly through the process of construction of new roads and renovation of existing roads. All villages
were connected to the regional headquarters which helped the rural people to have access
to urban health facilities. The total length of road has increased from 329.29 kms. to 377.73 kms. denoting 1.14 fold increase. The number of vehicles rose from 1121 to
16845 signifying 15 fold increase. Water supply in both rural and urban areas was
augmented considerably. While in the urban areas the entire population was covered by
protected water supply in 1972, only 52 per cent of the rural population had access to
protected water supply. The per capita water supply increased from 90 litres to 140 litres
in urban mas . The acute shortage of houses was met by the implementation of schemes
like Low Income Gmup Housing Scheme, Integrated Subsidized Housing Scheme for
Industrial Workers, Village House Project Scheme, Land Acquisition and Development
Scheme, Subsidized Industrial and Rental House Scheme.
With a view to maintain good sanitary conditions, inspection of restaurants, clean
upkeep of mads and streets, and drainage and sewage water were taken up. The Pondicherry
Municipality Act, 1973 and the Pondicherry Villages and Commune Panchayat Act, 1973
enjoined upon the MayorsExecutive Officers of the Municipalities and Panchayats the
obligation of maintaining the cleanliness of the thoroughfares, residential places, workshops,
industries, hospitals, slaughter houses and other public places. The drainage system was
improved rather slowly. An underground drainage system was sanctioned in 1963 under
the National Water Supply and Sanitary Programme. The drainage system in Karaikal
was unsatisfactory and there were no underground drainage system in Mahe and Yanam. The system of excreta disposal showed little change. Government constructed public
toilets in urban areas and the households also provided for septic tank latrines in urban
areas. But in rural areas the situation dld not improve and a majority of the people used the
open fields only. During this period all villages were electrified which is one of the unique
achievements made by the Tenitory.
Social welfare activities organised by the State Social Welfare Board, Social Welfare
Department and the Harijan Welfare Department contributed to the health of the children
and lactating mothers. Extension of Children Act, 1960, establishment of a Children Welfare
Board, implementation of special nutrition programmes have enhanced the health of
children.
Economic factors which help to provide consumption goods, employment and income were clearly favourable for health development during this period. Under the impetus of planning and massive investment, the economy has been growing steadily raising the per capita income from Rs.341.18 to Rs. 2,309 impking a 6.7 fold increase. The increasing share of manufacturing and tertiary sectors in tf;e State Domestic product reflected the
dynamic growth of the economy.
The objective of self sufficiency in foodgrains was planned to be achieved by the introduction of Intensive Agricultural District Programme and multiple cropping. Consequently, the Territory could achieve self-sufficiency in food grains by the end of Fourth Plan3. The total foodgrains production during this period has increased from 39,446 to 72,423 metric tonnes thereby causing rise in the per capita availability of foodgrains from 106 kgs., to 133.3 kgs. The per capita availability or rice increased from 97.4 kgs. to 108.4 kgs. The fish production increased from 8728 metric tonnes to 13955 metric tonnes thereby increasing annual per capita fish availability from 23.4 kgms to 25.6 kgms.
The estimated total production of milk in 1965 was 84,134 quintals and per capita availability was 59 gms. per day which was far below the national requirements. But subsequently, several steps have been taken to promote milk production. The milk production has increased to 16000 tomes per year and the per capita availability of milk
has increased but it did not increase to the level suggested by the Indian Council of Medical
Research (2 13 gms per day). Growth of industries, especially small ones had contributed
to income, employment the supply of consumption articles.
The above analysis of the first phase of health transition shows that the health
improvement has come along with the positive development in socio economic sectors thereby providing evidence of intersectoral linkages and health development.
Health Development 1979-1991
Health development continued to occur during this period also with steady decline
in IMR from 56.0 to 34 per thousand live births; and CDR from 12.0 to 9.9 per 1000 population. No death due to cholera, smallpox, plague and malaria has been reported during
this period. The deaths due to other fever and dysentery and diahoma have declined continuously and the mortality from the respiratory diseases registered sharp decline. This changing mortality pattern is indicative of the fact that the incidence of deaths due to
poverty, malnutrition, unsatisfactory water supply, poor sanitation and hygiene and
W u t e housing have been weakening. The morbidity due to cancer, diabetes and
other diseases due to circulatory and nervous system showed a rising trend. In other words, the morbidity pattern during this period shows perceptible decline in poverty rrlated diseases but an increase in diseases that are normally associated with urbanization, the stresses of modem living and the prolongation of life. This is the second stage in health transition. It is to be remarked in this context that between 1978 and 1991 Pondicheny made the transition from a health situation oft+ developing countries to a situation in which its health problems are becoming recognizably akin to those of the industrialized
world.
This noteworty transition was associated with quantitative and qualitative changes in the health and non-health sectors. For one thing, there has been substantial incrcase in inputs. Per capita expenditure on government health senices was Rs. 130 in 1982 whneas, it was Rs. 363.7 in 1990-91.
Consequently, the number of beds in the Government hospitals primary health centres and subsidiary health centres rose from 1422 in 1979 to 2063 in 1991, doctors from 214 to
475 (excluding JIPMER) and nurses from 442 to 772 (excluding JIPMER). As a result, there was one doctor per 1701 people, one nurse per 1046 people and one bed per 392 people in 1991. There was one doctor for 4 beds and one nurse for 3 beds. Medical services to the people were available in close proximity of 2 kms.
Some of the qualitative changes in health services during this period also deserve
mention. Firstly, the very concept of health has been changed from curative aspect to one of the promotion and prevention reflecting Government's concern towards health related improvements like sanitation, nutrition in addition to health care services. Secondly, the professional efficiency of doctors and nurses improved thanks to training offered in JIPMER and the School of Nursing. Periodic training programmes, short term courses, and seminars organised for health inspectors, dais, community workers and other professional workers have contributed to improved quality of their work. Thirdly, greater nual orientation was given to health care senices to bridge the rural urban gap. Provision of modern facilities
such as solar heaters, cooking equipments, cold chain e q u i p m a on rural hospitals, periodic
visit of specialists to rural hospitals, visit of a mobile dental van to rural areas, examination for STD of pregnant rural mothers, the deployment of trained dais to look after rural deliveries, implementation of model mother scheme, accent on nual immunization
programme, treatment of eye problems were some of the measures intended to strmghthen the rural health hfktmcture and scenario. Fourthly, the urban hospitals wm equipped
with modem treatment units and sophisticated equipmmts. The establiehment of urology and cardiology units took care of the cumnt mortality pnm. Lastly, there was $nata
effectiveness of the available drugs and chemicals in controUrng the U t i d discam 147

like malaria and respiratory diseases.
Model Mother Scheme to involve rural women in health service, universal immunization programme for 100 per cent coverage of children against vaccine preventable diseases and 100 per cent coverage of women with tetanus toxoid, G m n card scheme to encourage family planning, Aids Control Programme to screen STD patients for Aids test, and the programme for control of blindness we% some of the new schemes implemented during this period. The Family Welfare Programme continued to make further strides. The percentage of eligible couples protected in 1991 rose to 60.60 which was the target fixed by the Government of India to be achieved by the Temtory in 2000 A.D. and the couple protection rate was 63.4 per cent in 1993. Promotion of family p l d n g became a massive ofticial activity. The performance under Universal Immunisation Programme has been exceeding the prescribed annual targets. Supplementary programmes like CARE and ICDS have helped to strengthen the MCH services.
These noteworthy medical developments must be viewed in the background of the continuation and strengthening of the intersectral action begun in the previous period. Efforts to promote literacy through formal, informal and non formal streems continued with new thrust (in the wake of New Education Policy, 1986), as a result of which the lteracy and awareness among the people increased considerably. Enrolment of students in 755 educational institutions crossed 2.1 lakh mark in 1990-91, and the number of educational institutions are 759 and enrolment of students are 223472 in 1993. Universalisation of
primary education has been accomplished during this period. Girl's education was s p d m g rather rapidly, adult illiteracy was being eradicated through several schemes and the Temtory achieved 100 per cent adult literacy in 1991.
Road and transport facilities have been further augmented. Widening of existing
roads and improvements of rural roads under minimum needs programme received major thrust. Measures to interlink villages and nearest towns, nearest highway villages and neighbouring villages and the nearest market centres were also initiated. Qualitative improvements were also made to the rural roads. While the total length of surfaced road increased from 370.19 kms. in 1979 to 472 kms. in 1989 and 589 kms in 1991, the total
number of motor vehicles used increased from 16,845 in 1979,87,089 in 1991 and 96,464 in 1993. By 1985, the entire rural population of the Territory had access to drinking water
and all identified problem villages were served with protected water supply. The per capita w t e r supply in nnal areas was around 40 litres per head in 1991. The urban water supply was also stepped up and the per capita urban water supply was around 140 li-s
per head per day. House construction became a matter of priority and eleven housing shemes were implemented during the Sixth and Seventh Plan periods. IrnpIcmentation
148
of new schemes, provision of house sites with financial assistance, reservation of houses constructed to the economically and socially backward people wen some of the important measures initiated.
Sanitary conditions were beig improved through specific programmes. Under the Community Development Programme, supply of sanitary fittings, construction of side drains, dhobi canals, bus shelters, and construction of rural sanitary latrines have been
undertaken. During this period, more tham 124 kms. of open side drains wen laid in various villages of Pondicheny region. Further, 50 per cent subsidy was granted from
1984-8s to rural families for the construction of latrines. Under the Rural Latrine Programmes implemented in 1986 construction of nual latrines was taken up at the cost of Rs. 1,700 lakhs. The Central Rural Sanitation Programme also envisaged the construction
of sanitary latrines for the rural poor.
Under the impact of all these programmes the sanitary condition in the Territory has improved. The Urban Basic Services Programme was also implemented as a joint
programme of the Government of India and UNICEF. This programme incorporates the UNICEF supported Urban Community Development Programmes, the Small and Medium Town Development programme and the low cost sanitation programme.
Under the Integrated Child Development Programme and Special Nutrition
Programme, Balwadies, Anganwadies and Creches have been organised. Balwadies take care of children between 3 years and 5 years of age. Non formal education is imparted and nutritious food is supplied to the children in rural and urban areas. The food served in
these centres provides approximately 300 calories and 10 to 12 grams of protein for c h i l h , 50 calories and 16 to 20 grams of protein for mothers.
At the Anganwadi centn, children and expectant and nursing mothers are provided medical facility and the Medical Oficer of the Primary Health Centre in the area visits the Anganwadi Centres periodically. All children in the area are immunized against diptheria, whooping cough, tetanus, polionletics and tuberculosis. Measles vaccinations are also provided now-a-days. All pregnant women are immunized against tetanus. A programme
of non formal education on 'Nutrition and Health' is organised at the Anganwadi centres for mothers and pregnant women. All women between 15 and 45 years especially prrgnsnt
or nursing mothers and mothers of children who suffer from illness, malnutrition etc., should attend this programme.
Economic situation was, however, disquieting during this period due to the of a number of unfavoumble factors. It is buc that the per capita income at current prices

increased from Rs.2.759 in 1979-80 to Rs.7534 in 1990 - 91 and Rs.8,567 in 1993. But the growth rate has started declining since 1980; the deceleration process that continued through the mid 80s showed signs of negative growth, agricultural stagnation, and
fluctuations in the overall economic growth.
Foodgrains production actually declined from 93,458 metric tonnes in 1980-81 to 67,170 metric tonnes. This decline occured at atime when population expanded rapidly as a result of which the per capita availability of foodgrains decreased from 159.916 kgs. to
89.04 kgs. Rice output has also declined from 74,295 metric tonnes to 63,000 metric tonnes which led to a decline in per capita avilability from 134.5 kgs. to 79.04 kgs. This situation, compounded by rising prices of foodgrains, had a serious implication for the nutritional status of the people especially, the poor.
Although no authentic data on the extent of poverty is available one can safely surmise that about 76 per cent of the population in rural areas are still below poverty line. It has been shown that poverty leads to ill health. Work participation rate has actually declined to 33.08 per cent in 1991. By 1989 nearly one lakh and in 1991,1,29,765 educated persons
were registered as unemployed with Employment Exchange. All accounts show that
employment situation has deteriorated in the Territory keeping down the level of income and living standards of the masses. Another consequence of economic development during this period has been the phenomenol progress of urbanization and the stupendous growth
of slums.
With the advent of urbanisation, new colonies have sprung up. House construction activities have been accelerated in low lying areas which were either paddy fields or coconut grooves. With the conversion of most of the fields into house sites, the irrigation tanks silted up and canals lost their trace. Whenever new colonies have come up, real estate
dealers had not cared to provide sewage canals. This has led to water stagnation and mosquito breeding. In fact, urbanisation has led to disequilibrium between the demand for and supply of public services.
Such a situation has lowered the quantity and quality of public services available to the urbanites. The deterioration in quality of urban medical services is a case. in point.
Health care services have not kept pace with the growth of urban population in the last two
decades. It is a common sight that most of the patients wait for a long time to get poor quality of medical services. The weaker sections especially in urban areas suffer a lot in this process.
A direct corollary of urbanisation is the sNpendous growth of slums which do not
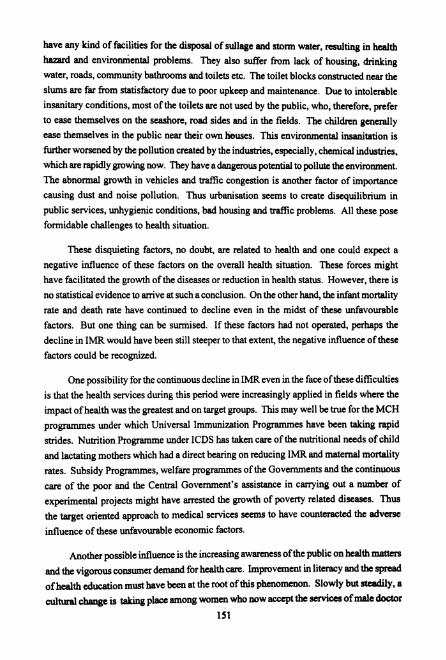
have any kind of facilities for the disposal of sullage and storm water, nsulting in health hazard and environmental problems. They also suffer from lack of housing, drinking water, roads, community bathrooms and toilets etc. The toilet blocks constructed near the slums are far from statisfactory due to poor upkeep and maintenance. Due to intolerable insanitary conditions, most of the toilets are not used by the public, who, therefore, prefer to ease themselves on the seashore, road sides and in the fields. The children generally ease themselves in the public near their own buses. This environmental insanitation is further worsened by the pollution created by the industries, especially, chemical industries, which are rapidly growing now. They have a dangerous potential to pollute the environment. The abnormal growth in vehicles and WIC congestion is another factor of importance causing dust and noise pollution. Thus urbanisation seems to create disequilibrium in public services, unhygienic conditions, bad housing and traffic problems. All these pose formidable challenges to health situation.
These disquieting factors, no doubt, are related to health and one could expect a
negative influence of these factors on the overall health situation. These forces might have facilitated the growth of the diseases or reduction in health status. However, there is no statistical evidence to arrive at such a conclusion. On the other hand, the infant mortality rate and death rate have continued to decline even in the midst of these unfavourable
factors. But one thing can be surmised. If these factors had not operated, perhaps the decline in IMR would have been still steeper to that extent, the negative influence of these
factors could be recognized.
One possibility for the continuous decline in IMR even in the face of these difficulties
is that the health services during this period were increasingly applied in fields where the impact of health was the greatest and on target groups. This may well be true for the MCH programmes under which Universal Immunization Programmes have been taking rapid strides. Nutrition Programme under ICDS has taken care of the nutritional needs of child and lactating mothers which had a direct bearing on reducing IMR and maternal mortality
rates. Subsidy Programmes, welfare programmes of the Governments and the continuous care of the poor and the Central Government's assistance in carrying out a number of
experimental projects might have arrested the growth of poverty related diseases. Thus the target oriented approach to medical services seems to have counteracted the adverse
influence of these unfavourable economic factors.
Another possible influence is the increasing awareness of the public on health matters and the vigorous consumer demand for health care. Improvement in literacy and the spread
of health education must have been at the root of this phenomenon. Slowly but steadily, a culhual change is taking place among women who now accept the services of male Qctor
151
even for deliveries. This, again 1s an instance of incnasing awareness caused by cultural
changes.
By and large, the evidence from the second penod also vindicated positive linkages
between health status and soclo economc developments.
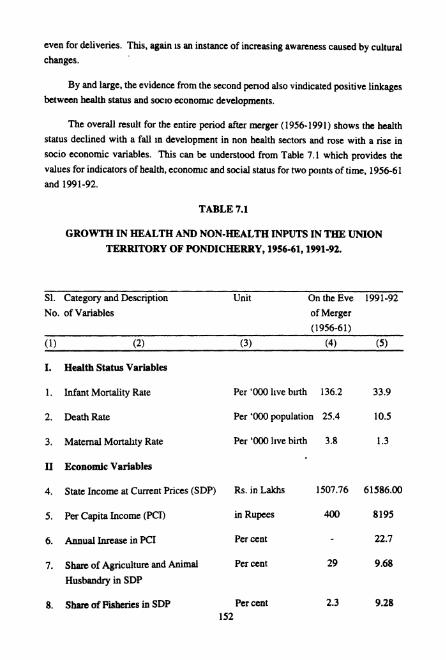
The overall result for the entire period after merger (1956-1991) shows the health
status declined with a fall m development in non health sectors and rose with a rise in
socio economic variables. This can be understood from Table 7.1 which provides the
values for indicators of health, economc and social status for two points of time. 1956-61
and 1991-92.
TABLE 7.1
GROWTH IN HEALTH AND NON-HEALTH INPUTS IN THE UNION TERRITORY OF PONDICHERRY, 1956-61,1991-92.
S1. Category and Description Unit On the Eve 1991-92
No. of Variables of Merger
(1956-61)
(1) (2) (3) (4) (5)
I. Health Status Variables
1. Infant Mortality Rate Per '000 l~ve birth 136.2 33.9
2. Death Rate Per '000 population 25.4 10.5
3. Maternal Mortality Rate Per '000 l~ve birth 3.8 1.3
I1 Economic Variables
4. State. Income at Current Prices (SDP) Rs. in Lakhs 1507.76 61586.00
5. Per Capita Income ( P a ) in Rupees 400 8195
6. Annual Inrease in PC1 Per cent 22.7
7. Share of Agriculture and Animal Per cent 29 9.68
Husbandry in SDP
8. Share of Fisheries in SDP Per cent 2.3 9.28 152

( 1 ) .(2) (3) (4) ( 5 )
9. Food Graina output '000 M.T. 44.7 67.1
10. Per capita availability of food grains
1 1. Rice Production
12. Per capita availability of rice
13. Fish output
14. Per capita availability of Fish
15. Production of Milk per year
16. Per capita availability of milk
17. Labow force participation
Kgms.
'000 tonnes
Kgms.
in Quintals
Kgrns.
M.T.
gms.
Per cent
18. Unemployed as registered in In Lakhs employment exchange
19. People below poverty line (Rural) Per cent
20. Per capita revenue expenditure in Rupees
111 Social Variables
21. Population
22. Child Population (0-14 years)
23. Density of population
24. S.C. Population
25. Literacy
26. Urban Population
27. Educational Institutions
28. Students
29. Educational Expenditure in total revenue expenditure
in Lakhs
Per cent
Per sq. km.
Per cent
Per cent
Per cent
Numbers
in Lakhs
Per cent
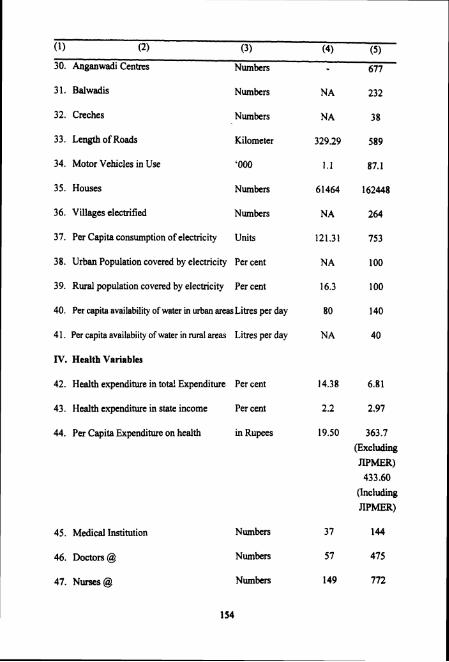
30. Anganwadi Centres Numbers 677
31. Balwadis Numbers
32. Creches Numbers
33. Length of Roads Kilometer
34. Motor Vehicles in Use '000
35. Houses Numbers
36. Villages electrified Numbers
37. Per Capita consumption of electricity Units
38. Urban Population covered by electricity Per cent
39. Rural population covered by electricity Per cent
40. Per capita availability of water in urban areas Litres per day
41. Per capita availabiity of water in rural areas Litres per day
IV. Health Variables
42. Health expenditure in tota! Expenditure Per cent
43. Health expenditure in state income Per cent
44. Per Capita Expenditure on health in Rupees
45. Medical Institution
46. Doctors @
47. Nurses @
Numbers
Numbers
Numbers
363.7 (Excluding JIPMER)
433.60 (Including
JIPMER)
(1) (2) (3) (4) ( 5 )
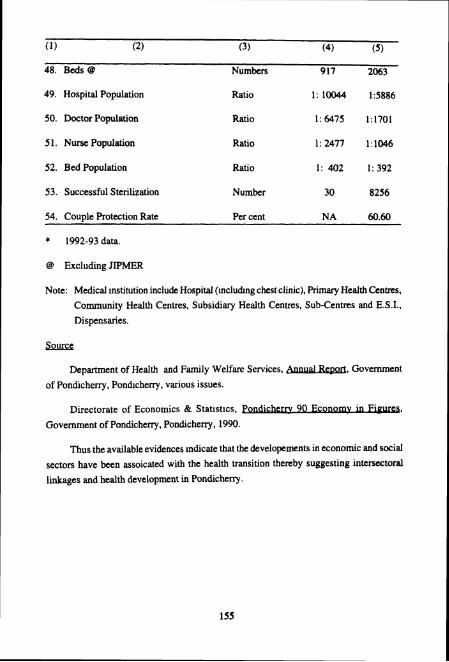
48. Beds @ Numbers 917 2063
49. Hospital Population Ratio 1: 10044 15886
50. Doctor Population Ratio 1: 6475 1:1701
5 1. Nurse Population Ratio 1:2477 1:1W6
52. Bed Population Ratio 1 :402 1:392
53. Successful Sterilization Number 30 8256
54. Couple Protection Rate Per cent NA 60.60
* 1992-93 data.
@ Excluding JIPMER
Note: Medical Institution include Hospital (inclu&ng chest clinic), Primary Health Centres, Community Health Centres, Subsidiary Health Centres, Sub-Centres and E.S.I.,
Dispensaries.
Department of Health and Family Welfare Services. AnnualReDort, Government
of Pondicheny, Pond~cheny, various issues.
, . Directorate of Economics & Stat~stics, FWdickrrv 90 Ec-,
Government of Pondicherry, Pondicheny, 1990.
Thus the available evidences Indicate that the developements in economic and social
sectors have been assoicated with the health transition thereby suggesting intersectoral
linkages and health development in Pondicheq.
REFERENCES
1 . Department of Health and Family Welfare Services, AnnualReoort, m, Government of Pondicherry.
. . 2. F. Cyril Antony, o f , A T e m t o F i i n i s t r a t i o n
of the Union Temtory of Pondicherry, Vol. 11, 1982, P.1354.
3. Finance Department, Draft Five Year Plan 1966-71: PrppIBmmefPtthc
Fourth, Government of Pondicherry, p. I .