Embed Size (px)
Citation preview
7th Grade Mathematics Curriculum
Course Description: In grade 7, instructional time should focus on four critical areas: (1)
developing understanding of and applying proportional relationships; (2) developing
understanding of operations with rational numbers and working with expressions and
linear equations; (3) solving problems involving scale drawings and informal geometric
constructions, and working with two-and three-dimensional shapes to solve problems
involving area, surface area, and volume; and (4) drawing inferences about populations
based on samples.
Scope and Sequence:
Time Frame Unit
18 blocks Rational Numbers
18 blocks Expressions, Equations, and
Inequalities
19 blocks Ratios/Proportions/Percents
12 blocks Probability and Statistics
7 blocks Geometric Shapes and Angles
9 blocks Surface Area and Volume
Board Approved: February 7, 2019 2 | P a g e
Board First Read with Revisions: May 14, 2020
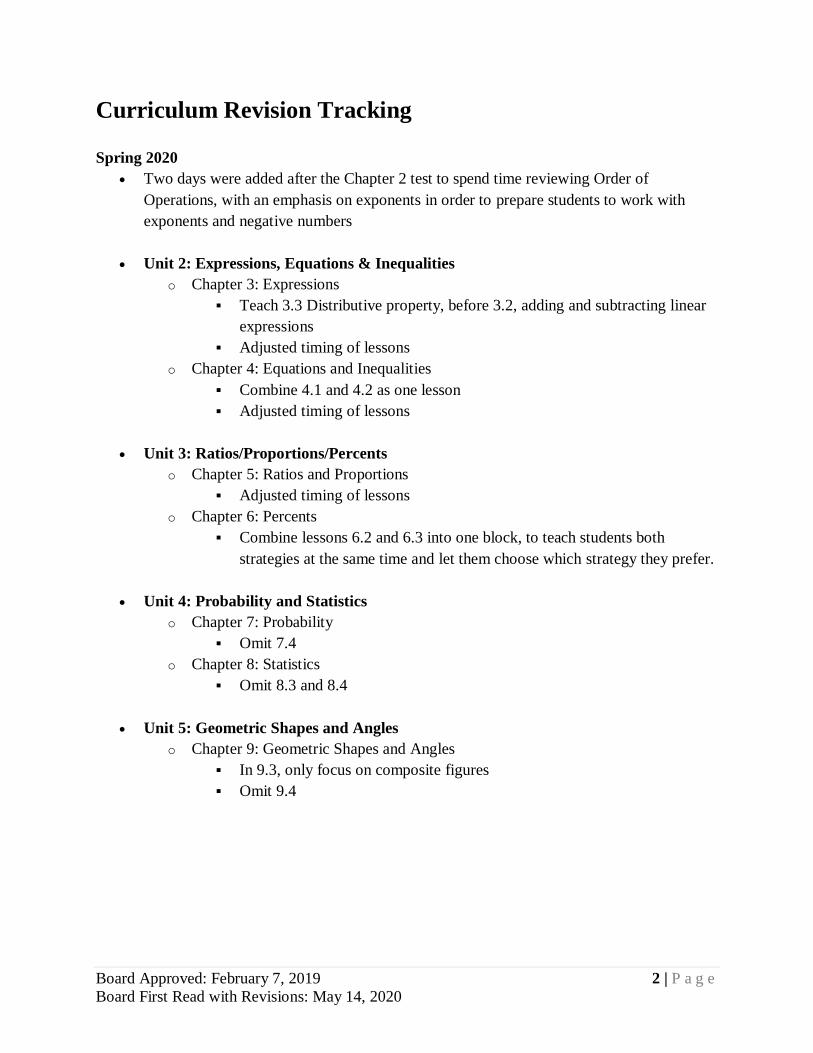
Curriculum Revision Tracking
Spring 2020
Two days were added after the Chapter 2 test to spend time reviewing Order of
Operations, with an emphasis on exponents in order to prepare students to work with
exponents and negative numbers
Unit 2: Expressions, Equations & Inequalities
o Chapter 3: Expressions
Teach 3.3 Distributive property, before 3.2, adding and subtracting linear
expressions
Adjusted timing of lessons
o Chapter 4: Equations and Inequalities
Combine 4.1 and 4.2 as one lesson
Adjusted timing of lessons
Unit 3: Ratios/Proportions/Percents
o Chapter 5: Ratios and Proportions
Adjusted timing of lessons
o Chapter 6: Percents
Combine lessons 6.2 and 6.3 into one block, to teach students both
strategies at the same time and let them choose which strategy they prefer.
Unit 4: Probability and Statistics
o Chapter 7: Probability
Omit 7.4
o Chapter 8: Statistics
Omit 8.3 and 8.4
Unit 5: Geometric Shapes and Angles
o Chapter 9: Geometric Shapes and Angles
In 9.3, only focus on composite figures
Omit 9.4
Board Approved: February 7, 2019 3 | P a g e
Board First Read with Revisions: May 14, 2020
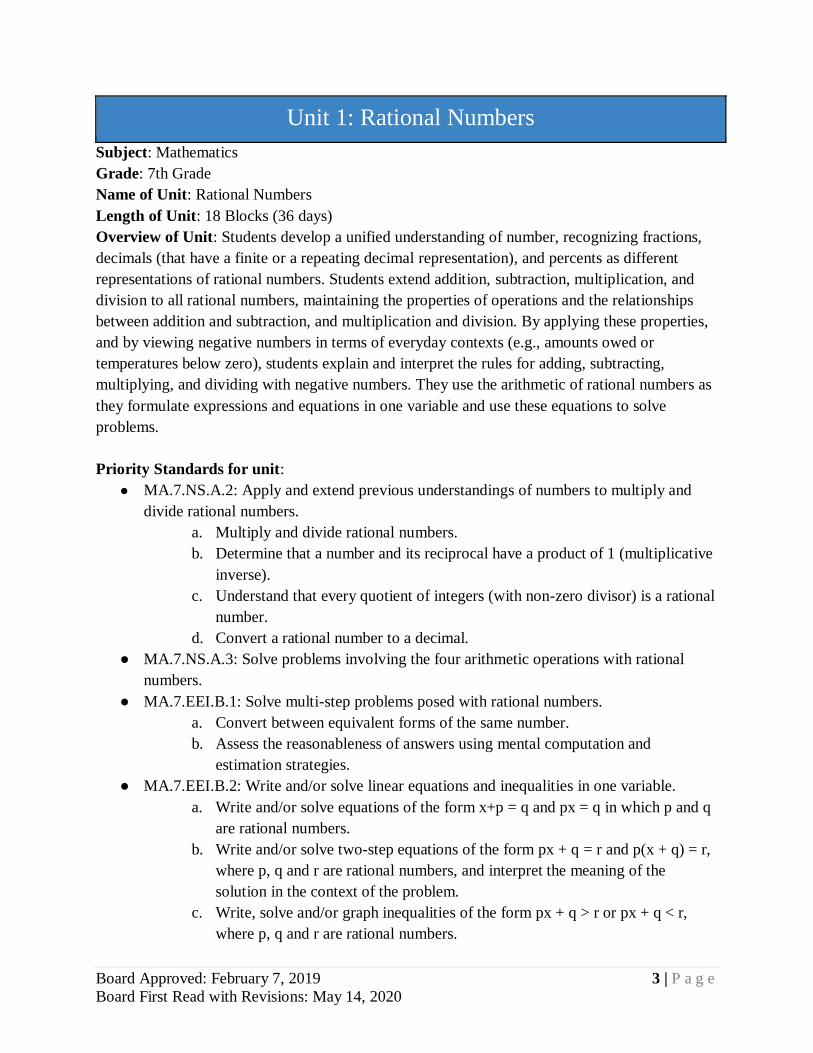
Unit 1: Rational Numbers
Subject: Mathematics
Grade: 7th Grade
Name of Unit: Rational Numbers
Length of Unit: 18 Blocks (36 days)
Overview of Unit: Students develop a unified understanding of number, recognizing fractions,
decimals (that have a finite or a repeating decimal representation), and percents as different
representations of rational numbers. Students extend addition, subtraction, multiplication, and
division to all rational numbers, maintaining the properties of operations and the relationships
between addition and subtraction, and multiplication and division. By applying these properties,
and by viewing negative numbers in terms of everyday contexts (e.g., amounts owed or
temperatures below zero), students explain and interpret the rules for adding, subtracting,
multiplying, and dividing with negative numbers. They use the arithmetic of rational numbers as
they formulate expressions and equations in one variable and use these equations to solve
problems.
Priority Standards for unit:
● MA.7.NS.A.2: Apply and extend previous understandings of numbers to multiply and
divide rational numbers.
a. Multiply and divide rational numbers.
b. Determine that a number and its reciprocal have a product of 1 (multiplicative
inverse).
c. Understand that every quotient of integers (with non-zero divisor) is a rational
number.
d. Convert a rational number to a decimal.
● MA.7.NS.A.3: Solve problems involving the four arithmetic operations with rational
numbers.
● MA.7.EEI.B.1: Solve multi-step problems posed with rational numbers.
a. Convert between equivalent forms of the same number.
b. Assess the reasonableness of answers using mental computation and
estimation strategies.
● MA.7.EEI.B.2: Write and/or solve linear equations and inequalities in one variable.
a. Write and/or solve equations of the form x+p = q and px = q in which p and q
are rational numbers.
b. Write and/or solve two-step equations of the form px + q = r and p(x + q) = r,
where p, q and r are rational numbers, and interpret the meaning of the
solution in the context of the problem.
c. Write, solve and/or graph inequalities of the form px + q > r or px + q < r,
where p, q and r are rational numbers.
Board Approved: February 7, 2019 4 | P a g e
Board First Read with Revisions: May 14, 2020
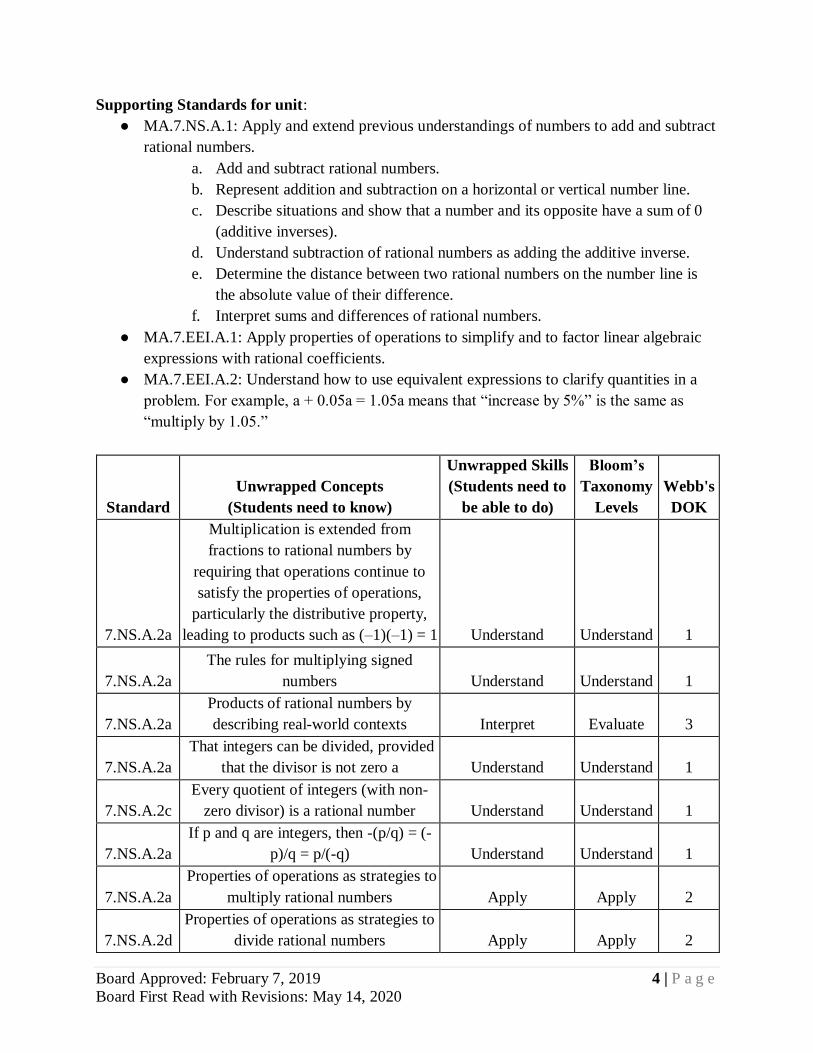
Supporting Standards for unit:
● MA.7.NS.A.1: Apply and extend previous understandings of numbers to add and subtract
rational numbers.
a. Add and subtract rational numbers.
b. Represent addition and subtraction on a horizontal or vertical number line.
c. Describe situations and show that a number and its opposite have a sum of 0
(additive inverses).
d. Understand subtraction of rational numbers as adding the additive inverse.
e. Determine the distance between two rational numbers on the number line is
the absolute value of their difference.
f. Interpret sums and differences of rational numbers.
● MA.7.EEI.A.1: Apply properties of operations to simplify and to factor linear algebraic
expressions with rational coefficients.
● MA.7.EEI.A.2: Understand how to use equivalent expressions to clarify quantities in a
problem. For example, a + 0.05a = 1.05a means that “increase by 5%” is the same as
“multiply by 1.05.”
Standard
Unwrapped Concepts
(Students need to know)
Unwrapped Skills
(Students need to
be able to do)
Bloom’s
Taxonomy
Levels
Webb's
DOK
7.NS.A.2a
Multiplication is extended from
fractions to rational numbers by
requiring that operations continue to
satisfy the properties of operations,
particularly the distributive property,
leading to products such as (–1)(–1) = 1 Understand Understand 1
7.NS.A.2a
The rules for multiplying signed
numbers Understand Understand 1
7.NS.A.2a
Products of rational numbers by
describing real-world contexts Interpret Evaluate 3
7.NS.A.2a
That integers can be divided, provided
that the divisor is not zero a Understand Understand 1
7.NS.A.2c
Every quotient of integers (with non-
zero divisor) is a rational number Understand Understand 1
7.NS.A.2a
If p and q are integers, then -(p/q) = (-
p)/q = p/(-q) Understand Understand 1
7.NS.A.2a
Properties of operations as strategies to
multiply rational numbers Apply Apply 2
7.NS.A.2d
Properties of operations as strategies to
divide rational numbers Apply Apply 2
Board Approved: February 7, 2019 5 | P a g e
Board First Read with Revisions: May 14, 2020
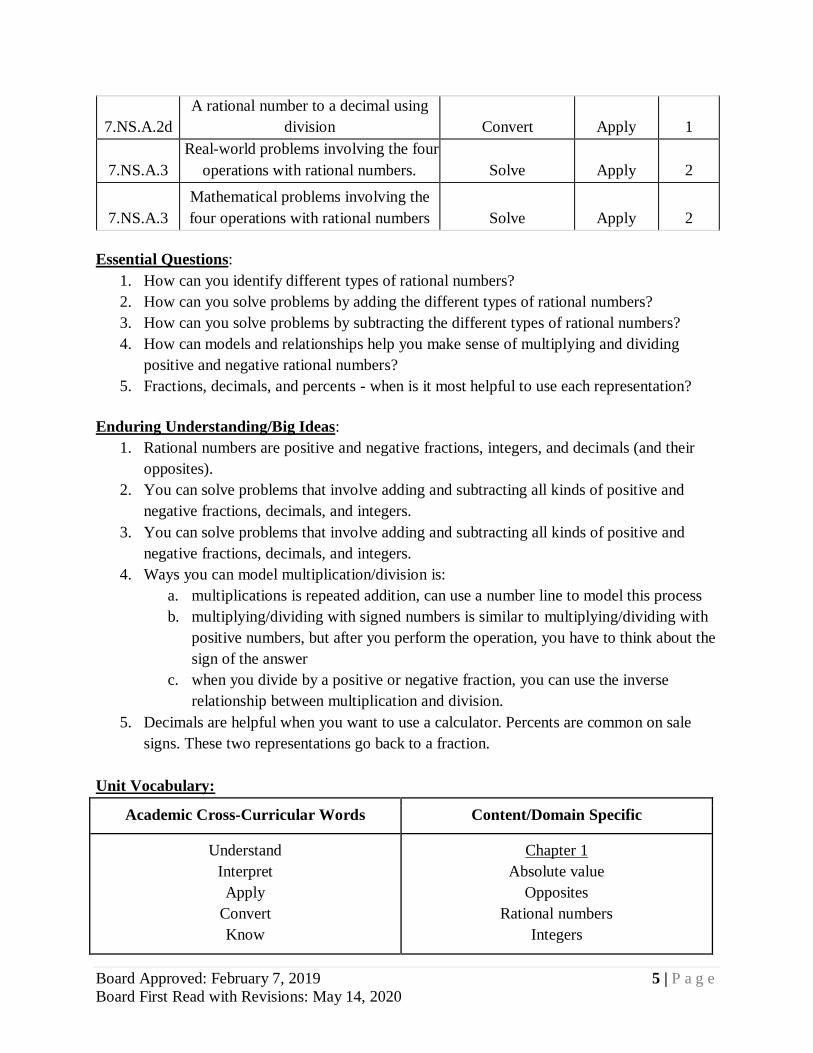
7.NS.A.2d
A rational number to a decimal using
division Convert Apply 1
7.NS.A.3
Real-world problems involving the four
operations with rational numbers. Solve Apply 2
7.NS.A.3
Mathematical problems involving the
four operations with rational numbers Solve Apply 2
Essential Questions:
1. How can you identify different types of rational numbers?
2. How can you solve problems by adding the different types of rational numbers?
3. How can you solve problems by subtracting the different types of rational numbers?
4. How can models and relationships help you make sense of multiplying and dividing
positive and negative rational numbers?
5. Fractions, decimals, and percents - when is it most helpful to use each representation?
Enduring Understanding/Big Ideas:
1. Rational numbers are positive and negative fractions, integers, and decimals (and their
opposites).
2. You can solve problems that involve adding and subtracting all kinds of positive and
negative fractions, decimals, and integers.
3. You can solve problems that involve adding and subtracting all kinds of positive and
negative fractions, decimals, and integers.
4. Ways you can model multiplication/division is:
a. multiplications is repeated addition, can use a number line to model this process
b. multiplying/dividing with signed numbers is similar to multiplying/dividing with
positive numbers, but after you perform the operation, you have to think about the
sign of the answer
c. when you divide by a positive or negative fraction, you can use the inverse
relationship between multiplication and division.
5. Decimals are helpful when you want to use a calculator. Percents are common on sale
signs. These two representations go back to a fraction.
Unit Vocabulary:
Academic Cross-Curricular Words Content/Domain Specific
Understand
Interpret
Apply
Convert
Know
Chapter 1
Absolute value
Opposites
Rational numbers
Integers
Board Approved: February 7, 2019 6 | P a g e
Board First Read with Revisions: May 14, 2020
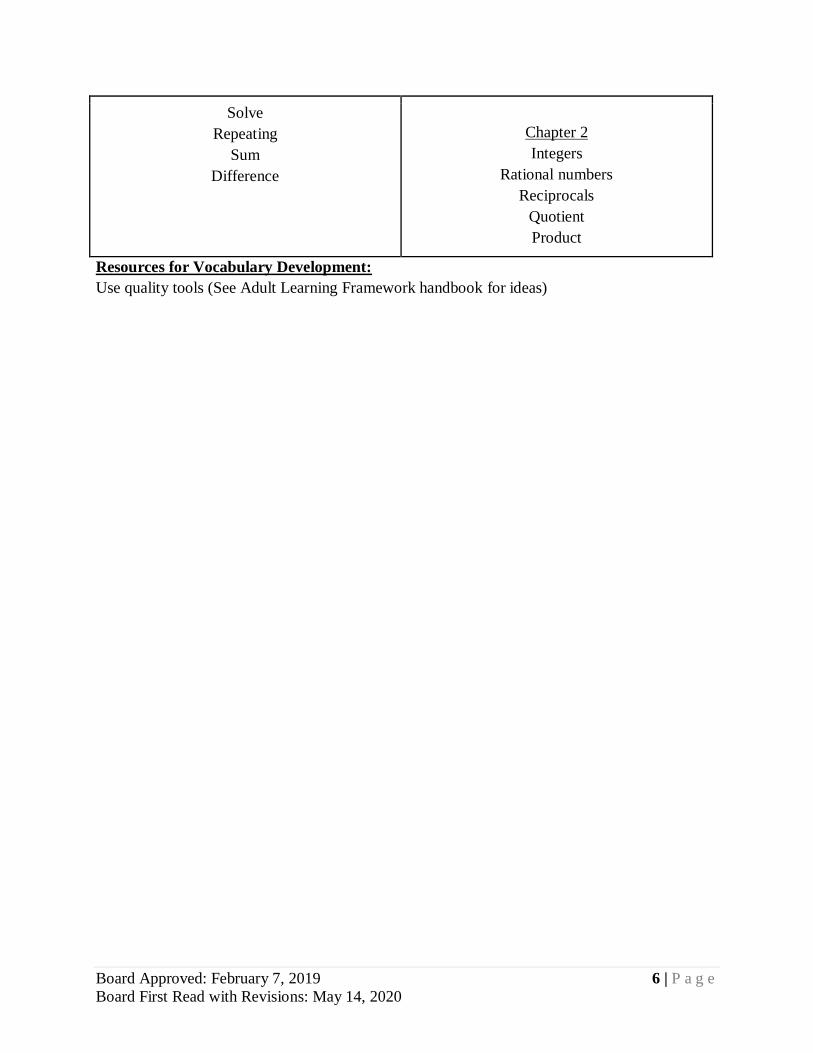
Solve
Repeating
Sum
Difference
Chapter 2
Integers
Rational numbers
Reciprocals
Quotient
Product
Resources for Vocabulary Development:
Use quality tools (See Adult Learning Framework handbook for ideas)
Board Approved: February 7, 2019 7 | P a g e
Board First Read with Revisions: May 14, 2020
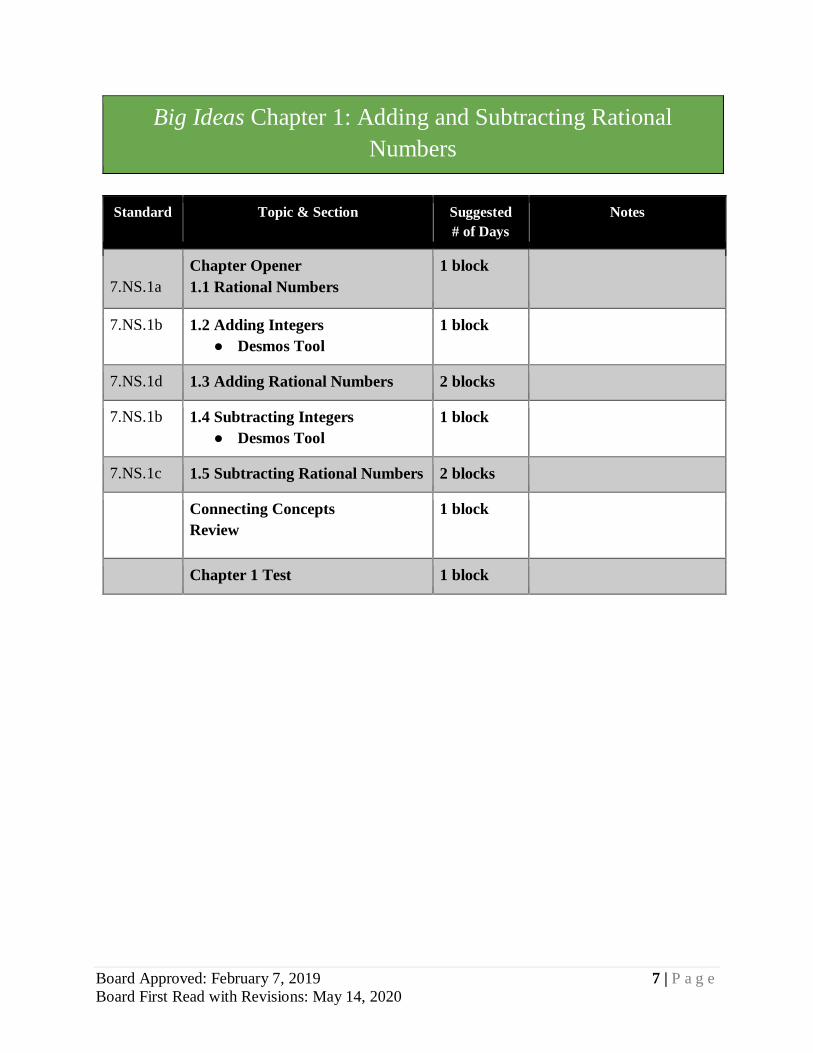
Big Ideas Chapter 1: Adding and Subtracting Rational
Numbers
Standard Topic & Section Suggested
# of Days
Notes
7.NS.1a
Chapter Opener
1.1 Rational Numbers
1 block
7.NS.1b 1.2 Adding Integers
● Desmos Tool
1 block
7.NS.1d 1.3 Adding Rational Numbers 2 blocks
7.NS.1b
1.4 Subtracting Integers
● Desmos Tool
1 block
7.NS.1c 1.5 Subtracting Rational Numbers 2 blocks
Connecting Concepts
Review
1 block
Chapter 1 Test 1 block
Board Approved: February 7, 2019 8 | P a g e
Board First Read with Revisions: May 14, 2020
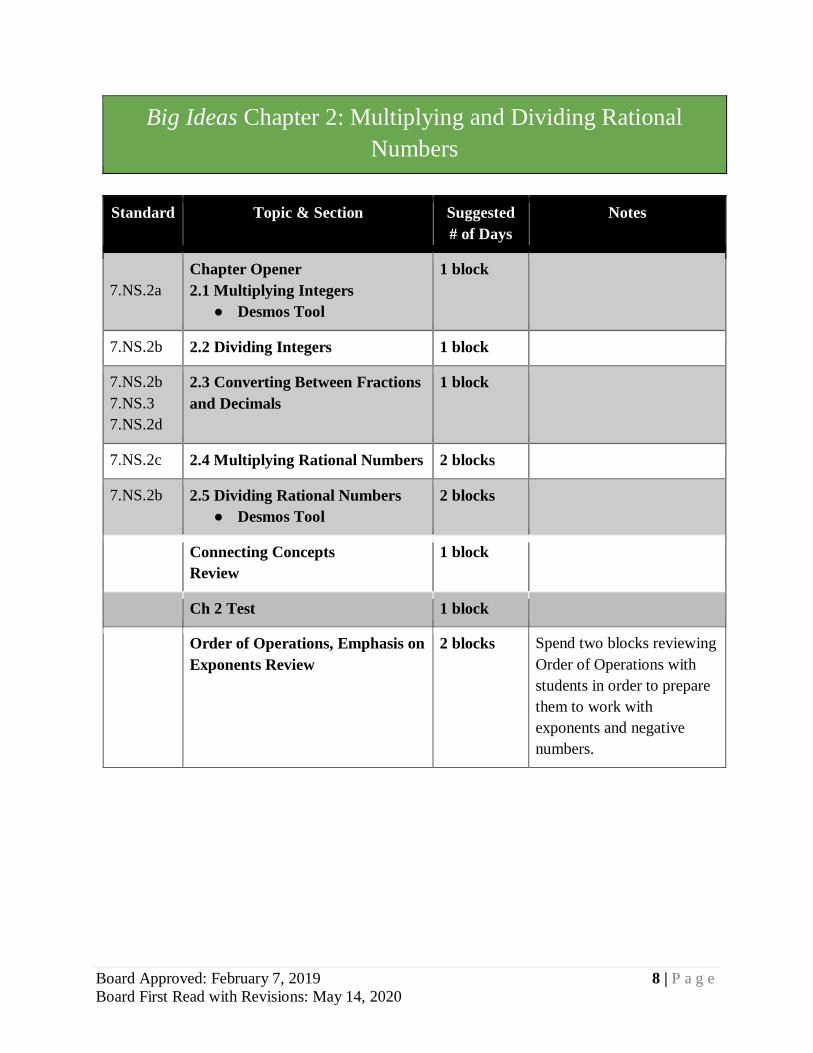
Big Ideas Chapter 2: Multiplying and Dividing Rational
Numbers
Standard Topic & Section Suggested
# of Days
Notes
7.NS.2a
Chapter Opener
2.1 Multiplying Integers
● Desmos Tool
1 block
7.NS.2b 2.2 Dividing Integers 1 block
7.NS.2b
7.NS.3
7.NS.2d
2.3 Converting Between Fractions
and Decimals
1 block
7.NS.2c 2.4 Multiplying Rational Numbers 2 blocks
7.NS.2b 2.5 Dividing Rational Numbers
● Desmos Tool
2 blocks
Connecting Concepts
Review
1 block
Ch 2 Test 1 block
Order of Operations, Emphasis on
Exponents Review
2 blocks Spend two blocks reviewing
Order of Operations with
students in order to prepare
them to work with
exponents and negative
numbers.
Board Approved: February 7, 2019 9 | P a g e
Board First Read with Revisions: May 14, 2020
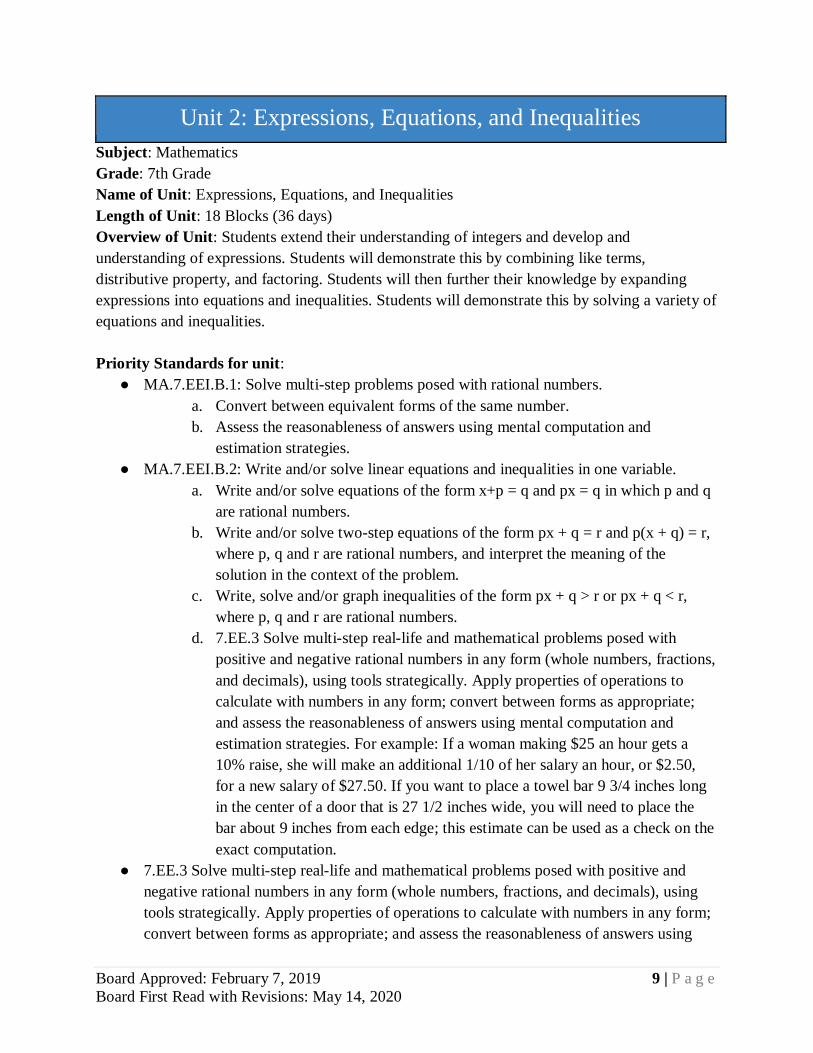
Unit 2: Expressions, Equations, and Inequalities
Subject: Mathematics
Grade: 7th Grade
Name of Unit: Expressions, Equations, and Inequalities
Length of Unit: 18 Blocks (36 days)
Overview of Unit: Students extend their understanding of integers and develop and
understanding of expressions. Students will demonstrate this by combining like terms,
distributive property, and factoring. Students will then further their knowledge by expanding
expressions into equations and inequalities. Students will demonstrate this by solving a variety of
equations and inequalities.
Priority Standards for unit:
● MA.7.EEI.B.1: Solve multi-step problems posed with rational numbers.
a. Convert between equivalent forms of the same number.
b. Assess the reasonableness of answers using mental computation and
estimation strategies.
● MA.7.EEI.B.2: Write and/or solve linear equations and inequalities in one variable.
a. Write and/or solve equations of the form x+p = q and px = q in which p and q
are rational numbers.
b. Write and/or solve two-step equations of the form px + q = r and p(x + q) = r,
where p, q and r are rational numbers, and interpret the meaning of the
solution in the context of the problem.
c. Write, solve and/or graph inequalities of the form px + q > r or px + q < r,
where p, q and r are rational numbers.
d. 7.EE.3 Solve multi-step real-life and mathematical problems posed with
positive and negative rational numbers in any form (whole numbers, fractions,
and decimals), using tools strategically. Apply properties of operations to
calculate with numbers in any form; convert between forms as appropriate;
and assess the reasonableness of answers using mental computation and
estimation strategies. For example: If a woman making $25 an hour gets a
10% raise, she will make an additional 1/10 of her salary an hour, or $2.50,
for a new salary of $27.50. If you want to place a towel bar 9 3/4 inches long
in the center of a door that is 27 1/2 inches wide, you will need to place the
bar about 9 inches from each edge; this estimate can be used as a check on the
exact computation.
● 7.EE.3 Solve multi-step real-life and mathematical problems posed with positive and
negative rational numbers in any form (whole numbers, fractions, and decimals), using
tools strategically. Apply properties of operations to calculate with numbers in any form;
convert between forms as appropriate; and assess the reasonableness of answers using
Board Approved: February 7, 2019 10 | P a g e
Board First Read with Revisions: May 14, 2020
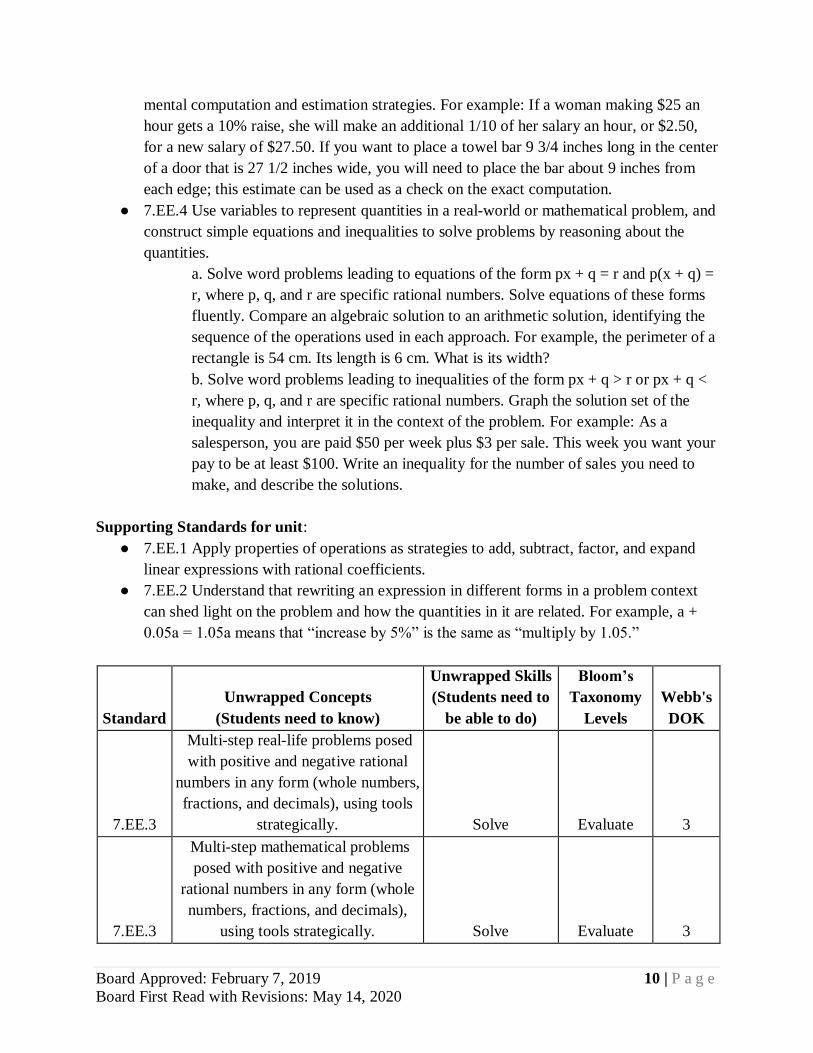
mental computation and estimation strategies. For example: If a woman making $25 an
hour gets a 10% raise, she will make an additional 1/10 of her salary an hour, or $2.50,
for a new salary of $27.50. If you want to place a towel bar 9 3/4 inches long in the center
of a door that is 27 1/2 inches wide, you will need to place the bar about 9 inches from
each edge; this estimate can be used as a check on the exact computation.
● 7.EE.4 Use variables to represent quantities in a real-world or mathematical problem, and
construct simple equations and inequalities to solve problems by reasoning about the
quantities.
a. Solve word problems leading to equations of the form px + q = r and p(x + q) =
r, where p, q, and r are specific rational numbers. Solve equations of these forms
fluently. Compare an algebraic solution to an arithmetic solution, identifying the
sequence of the operations used in each approach. For example, the perimeter of a
rectangle is 54 cm. Its length is 6 cm. What is its width?
b. Solve word problems leading to inequalities of the form px + q > r or px + q <
r, where p, q, and r are specific rational numbers. Graph the solution set of the
inequality and interpret it in the context of the problem. For example: As a
salesperson, you are paid $50 per week plus $3 per sale. This week you want your
pay to be at least $100. Write an inequality for the number of sales you need to
make, and describe the solutions.
Supporting Standards for unit:
● 7.EE.1 Apply properties of operations as strategies to add, subtract, factor, and expand
linear expressions with rational coefficients.
● 7.EE.2 Understand that rewriting an expression in different forms in a problem context
can shed light on the problem and how the quantities in it are related. For example, a +
0.05a = 1.05a means that “increase by 5%” is the same as “multiply by 1.05.”
Standard
Unwrapped Concepts
(Students need to know)
Unwrapped Skills
(Students need to
be able to do)
Bloom’s
Taxonomy
Levels
Webb's
DOK
7.EE.3
Multi-step real-life problems posed
with positive and negative rational
numbers in any form (whole numbers,
fractions, and decimals), using tools
strategically. Solve Evaluate 3
7.EE.3
Multi-step mathematical problems
posed with positive and negative
rational numbers in any form (whole
numbers, fractions, and decimals),
using tools strategically. Solve Evaluate 3
Board Approved: February 7, 2019 11 | P a g e
Board First Read with Revisions: May 14, 2020
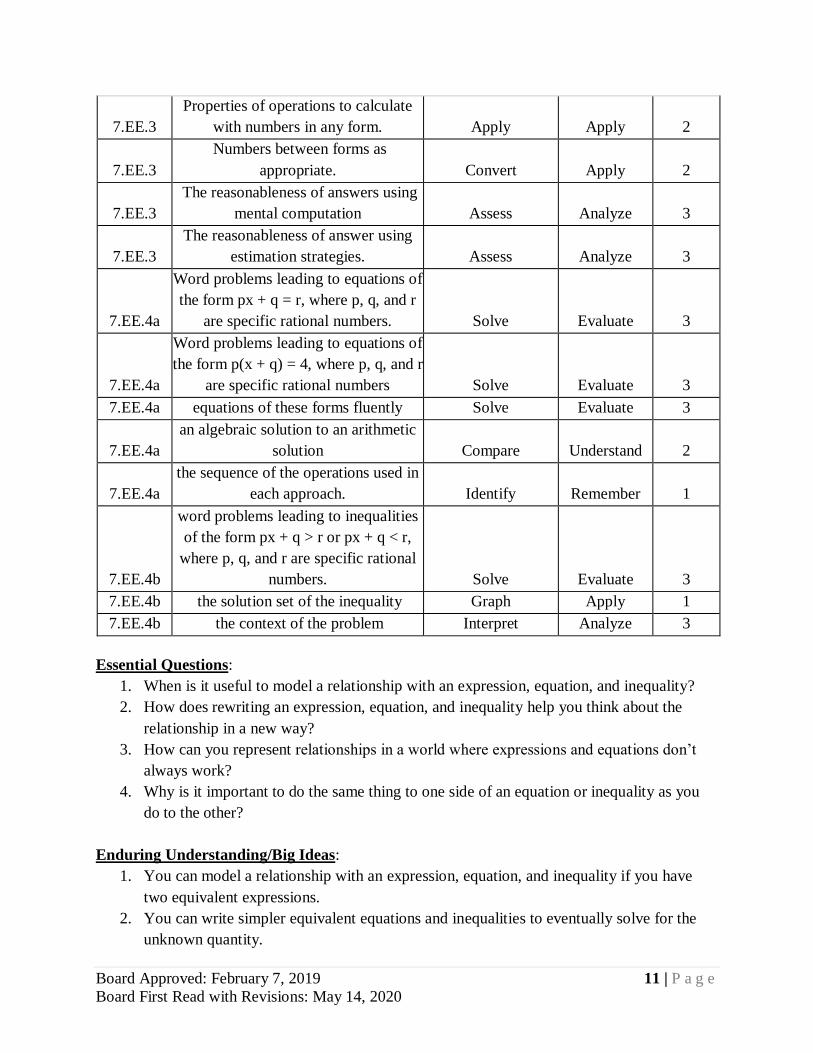
7.EE.3
Properties of operations to calculate
with numbers in any form. Apply Apply 2
7.EE.3
Numbers between forms as
appropriate. Convert Apply 2
7.EE.3
The reasonableness of answers using
mental computation
Assess Analyze 3
7.EE.3
The reasonableness of answer using
estimation strategies. Assess Analyze 3
7.EE.4a
Word problems leading to equations of
the form px + q = r, where p, q, and r
are specific rational numbers. Solve Evaluate 3
7.EE.4a
Word problems leading to equations of
the form p(x + q) = 4, where p, q, and r
are specific rational numbers Solve Evaluate 3
7.EE.4a equations of these forms fluently Solve Evaluate 3
7.EE.4a
an algebraic solution to an arithmetic
solution Compare Understand 2
7.EE.4a
the sequence of the operations used in
each approach. Identify Remember 1
7.EE.4b
word problems leading to inequalities
of the form px + q > r or px + q < r,
where p, q, and r are specific rational
numbers. Solve Evaluate 3
7.EE.4b the solution set of the inequality Graph Apply 1
7.EE.4b the context of the problem Interpret Analyze 3
Essential Questions:
1. When is it useful to model a relationship with an expression, equation, and inequality?
2. How does rewriting an expression, equation, and inequality help you think about the
relationship in a new way?
3. How can you represent relationships in a world where expressions and equations don’t
always work?
4. Why is it important to do the same thing to one side of an equation or inequality as you
do to the other?
Enduring Understanding/Big Ideas:
1. You can model a relationship with an expression, equation, and inequality if you have
two equivalent expressions.
2. You can write simpler equivalent equations and inequalities to eventually solve for the
unknown quantity.
Board Approved: February 7, 2019 12 | P a g e
Board First Read with Revisions: May 14, 2020
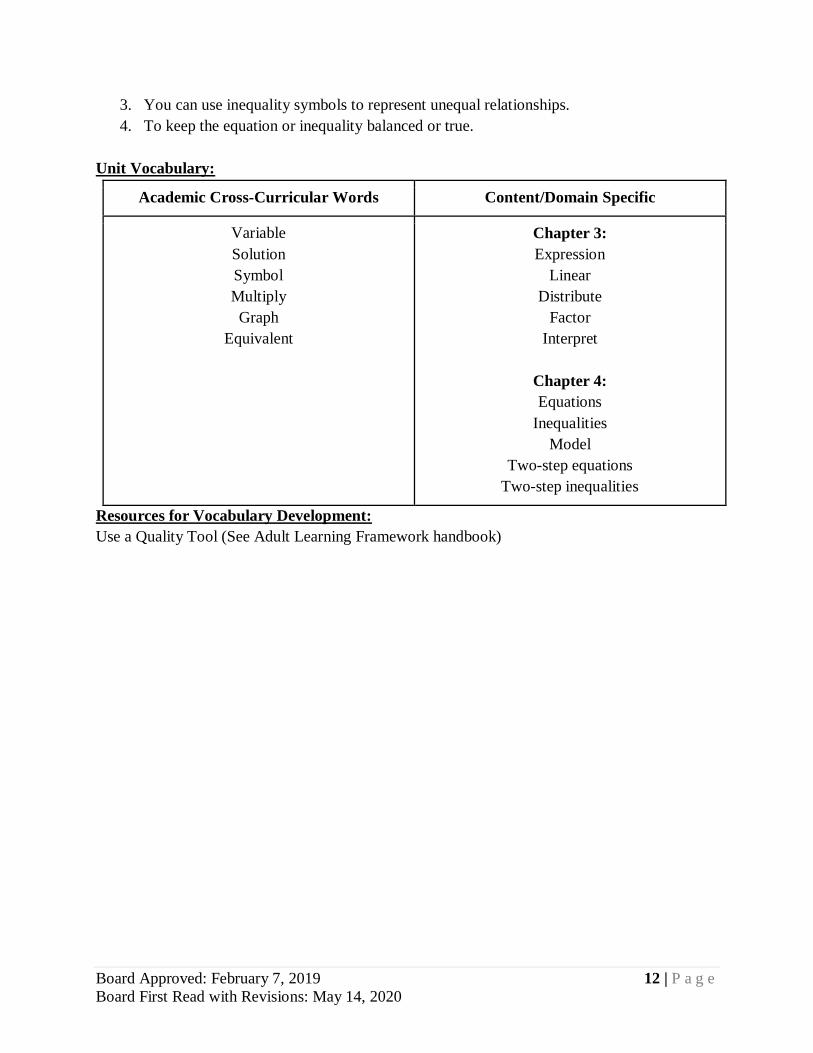
3. You can use inequality symbols to represent unequal relationships.
4. To keep the equation or inequality balanced or true.
Unit Vocabulary:
Academic Cross-Curricular Words Content/Domain Specific
Variable
Solution
Symbol
Multiply
Graph
Equivalent
Chapter 3:
Expression
Linear
Distribute
Factor
Interpret
Chapter 4:
Equations
Inequalities
Model
Two-step equations
Two-step inequalities
Resources for Vocabulary Development:
Use a Quality Tool (See Adult Learning Framework handbook)

Board Approved: February 7, 2019 13 | P a g e
Board First Read with Revisions: May 14, 2020
Big Ideas Chapter 3: Expressions
Standard Topic & Section Suggested
# of Days
Notes
7.EE.1
7.EE.2
Chapter opener
3.1 Algebraic Expressions
1 block
7.EE.1
7.EE.2
3.3 Distributive property 2 blocks
7.EE.1
7.EE.2
3.2 Adding and subtracting linear
expression
2 blocks
7.EE.1
7.EE.2
3.4 Factoring expressions 1 block
Connecting concepts
Review
1 block
Ch 3 Test 1 block
Board Approved: February 7, 2019 14 | P a g e
Board First Read with Revisions: May 14, 2020
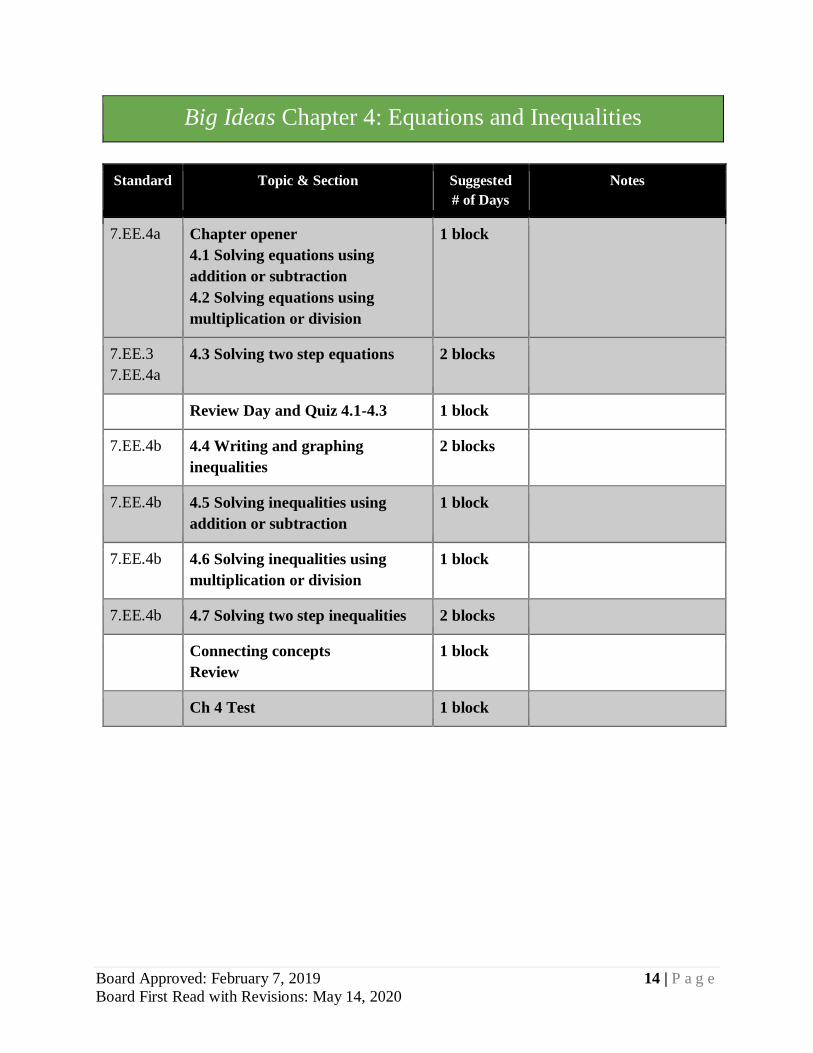
Big Ideas Chapter 4: Equations and Inequalities
Standard Topic & Section Suggested
# of Days
Notes
7.EE.4a Chapter opener
4.1 Solving equations using
addition or subtraction
4.2 Solving equations using
multiplication or division
1 block
7.EE.3
7.EE.4a
4.3 Solving two step equations 2 blocks
Review Day and Quiz 4.1-4.3 1 block
7.EE.4b 4.4 Writing and graphing
inequalities
2 blocks
7.EE.4b 4.5 Solving inequalities using
addition or subtraction
1 block
7.EE.4b 4.6 Solving inequalities using
multiplication or division
1 block
7.EE.4b 4.7 Solving two step inequalities 2 blocks
Connecting concepts
Review
1 block
Ch 4 Test 1 block
Board Approved: February 7, 2019 15 | P a g e
Board First Read with Revisions: May 14, 2020
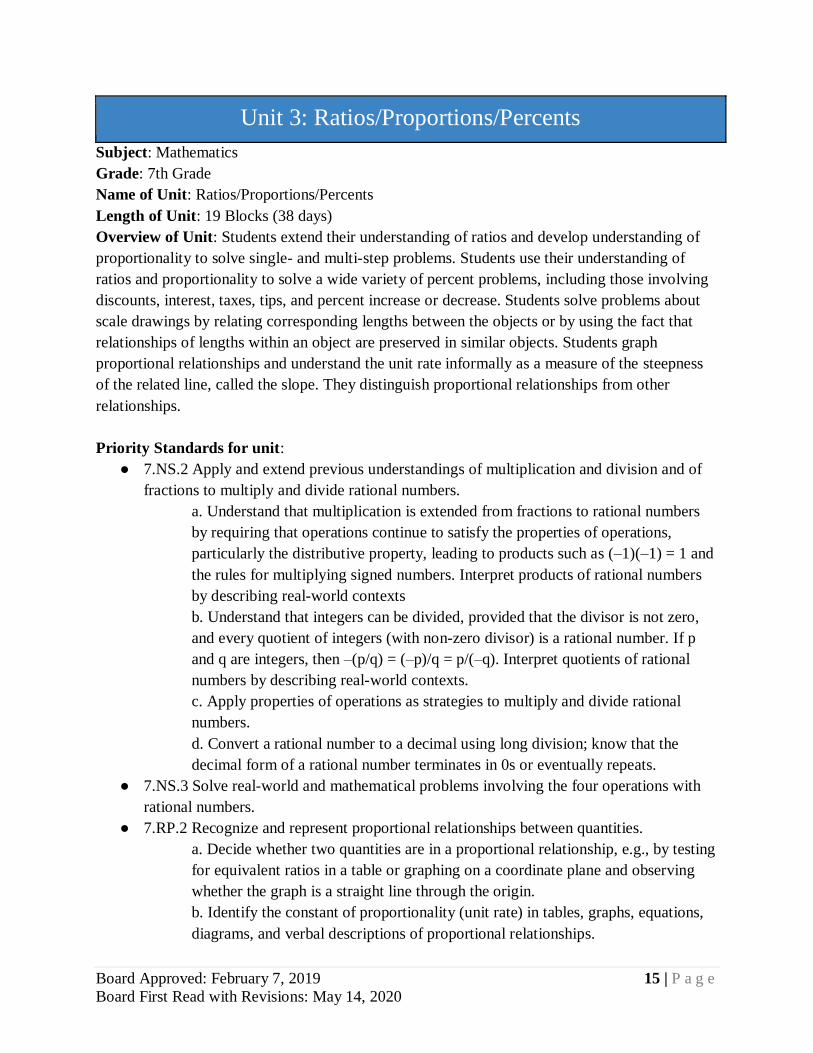
Unit 3: Ratios/Proportions/Percents
Subject: Mathematics
Grade: 7th Grade
Name of Unit: Ratios/Proportions/Percents
Length of Unit: 19 Blocks (38 days)
Overview of Unit: Students extend their understanding of ratios and develop understanding of
proportionality to solve single- and multi-step problems. Students use their understanding of
ratios and proportionality to solve a wide variety of percent problems, including those involving
discounts, interest, taxes, tips, and percent increase or decrease. Students solve problems about
scale drawings by relating corresponding lengths between the objects or by using the fact that
relationships of lengths within an object are preserved in similar objects. Students graph
proportional relationships and understand the unit rate informally as a measure of the steepness
of the related line, called the slope. They distinguish proportional relationships from other
relationships.
Priority Standards for unit:
● 7.NS.2 Apply and extend previous understandings of multiplication and division and of
fractions to multiply and divide rational numbers.
a. Understand that multiplication is extended from fractions to rational numbers
by requiring that operations continue to satisfy the properties of operations,
particularly the distributive property, leading to products such as (–1)(–1) = 1 and
the rules for multiplying signed numbers. Interpret products of rational numbers
by describing real-world contexts
b. Understand that integers can be divided, provided that the divisor is not zero,
and every quotient of integers (with non-zero divisor) is a rational number. If p
and q are integers, then –(p/q) = (–p)/q = p/(–q). Interpret quotients of rational
numbers by describing real-world contexts.
c. Apply properties of operations as strategies to multiply and divide rational
numbers.
d. Convert a rational number to a decimal using long division; know that the
decimal form of a rational number terminates in 0s or eventually repeats.
● 7.NS.3 Solve real-world and mathematical problems involving the four operations with
rational numbers.
● 7.RP.2 Recognize and represent proportional relationships between quantities.
a. Decide whether two quantities are in a proportional relationship, e.g., by testing
for equivalent ratios in a table or graphing on a coordinate plane and observing
whether the graph is a straight line through the origin.
b. Identify the constant of proportionality (unit rate) in tables, graphs, equations,
diagrams, and verbal descriptions of proportional relationships.
Board Approved: February 7, 2019 16 | P a g e
Board First Read with Revisions: May 14, 2020
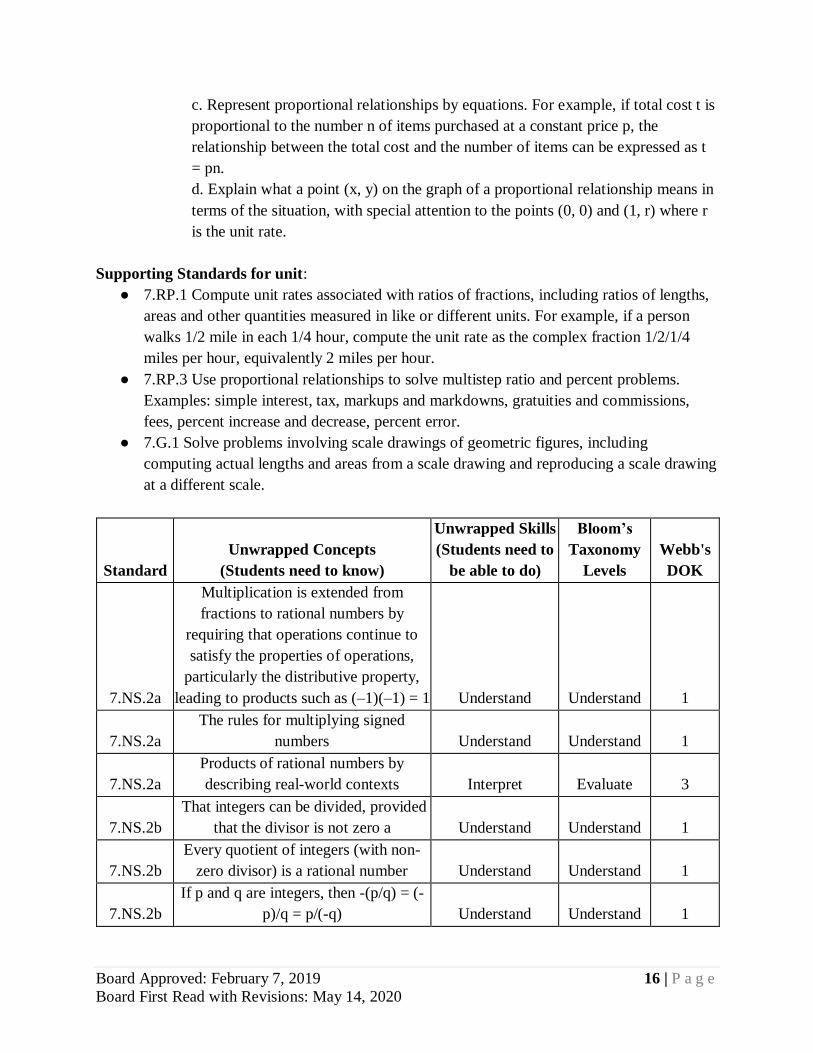
c. Represent proportional relationships by equations. For example, if total cost t is
proportional to the number n of items purchased at a constant price p, the
relationship between the total cost and the number of items can be expressed as t
= pn.
d. Explain what a point (x, y) on the graph of a proportional relationship means in
terms of the situation, with special attention to the points (0, 0) and (1, r) where r
is the unit rate.
Supporting Standards for unit:
● 7.RP.1 Compute unit rates associated with ratios of fractions, including ratios of lengths,
areas and other quantities measured in like or different units. For example, if a person
walks 1/2 mile in each 1/4 hour, compute the unit rate as the complex fraction 1/2/1/4
miles per hour, equivalently 2 miles per hour.
● 7.RP.3 Use proportional relationships to solve multistep ratio and percent problems.
Examples: simple interest, tax, markups and markdowns, gratuities and commissions,
fees, percent increase and decrease, percent error.
● 7.G.1 Solve problems involving scale drawings of geometric figures, including
computing actual lengths and areas from a scale drawing and reproducing a scale drawing
at a different scale.
Standard
Unwrapped Concepts
(Students need to know)
Unwrapped Skills
(Students need to
be able to do)
Bloom’s
Taxonomy
Levels
Webb's
DOK
7.NS.2a
Multiplication is extended from
fractions to rational numbers by
requiring that operations continue to
satisfy the properties of operations,
particularly the distributive property,
leading to products such as (–1)(–1) = 1 Understand Understand 1
7.NS.2a
The rules for multiplying signed
numbers Understand Understand 1
7.NS.2a
Products of rational numbers by
describing real-world contexts Interpret Evaluate 3
7.NS.2b
That integers can be divided, provided
that the divisor is not zero a Understand Understand 1
7.NS.2b
Every quotient of integers (with non-
zero divisor) is a rational number Understand Understand 1
7.NS.2b
If p and q are integers, then -(p/q) = (-
p)/q = p/(-q) Understand Understand 1
Board Approved: February 7, 2019 17 | P a g e
Board First Read with Revisions: May 14, 2020
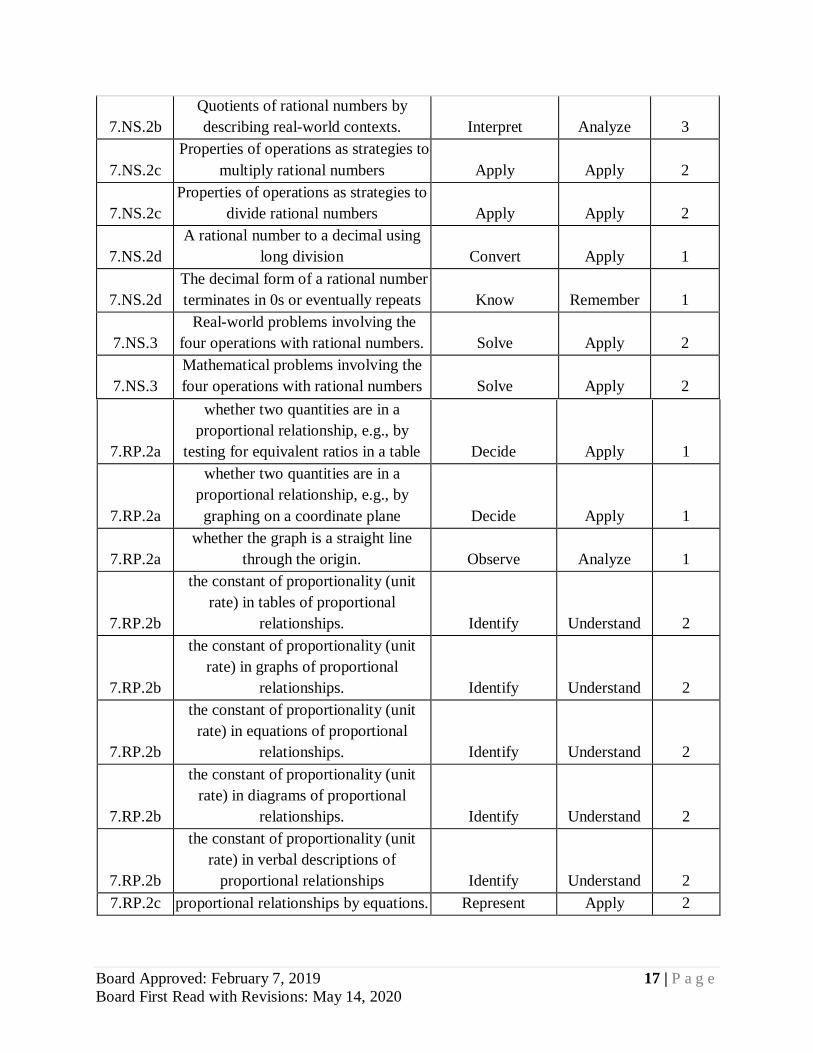
7.NS.2b
Quotients of rational numbers by
describing real-world contexts. Interpret Analyze 3
7.NS.2c
Properties of operations as strategies to
multiply rational numbers Apply Apply 2
7.NS.2c
Properties of operations as strategies to
divide rational numbers Apply Apply 2
7.NS.2d
A rational number to a decimal using
long division Convert Apply 1
7.NS.2d
The decimal form of a rational number
terminates in 0s or eventually repeats Know Remember 1
7.NS.3
Real-world problems involving the
four operations with rational numbers. Solve Apply 2
7.NS.3
Mathematical problems involving the
four operations with rational numbers Solve Apply 2
7.RP.2a
whether two quantities are in a
proportional relationship, e.g., by
testing for equivalent ratios in a table Decide Apply 1
7.RP.2a
whether two quantities are in a
proportional relationship, e.g., by
graphing on a coordinate plane Decide Apply 1
7.RP.2a
whether the graph is a straight line
through the origin. Observe Analyze 1
7.RP.2b
the constant of proportionality (unit
rate) in tables of proportional
relationships. Identify Understand 2
7.RP.2b
the constant of proportionality (unit
rate) in graphs of proportional
relationships. Identify Understand 2
7.RP.2b
the constant of proportionality (unit
rate) in equations of proportional
relationships. Identify Understand 2
7.RP.2b
the constant of proportionality (unit
rate) in diagrams of proportional
relationships. Identify Understand 2
7.RP.2b
the constant of proportionality (unit
rate) in verbal descriptions of
proportional relationships Identify Understand 2
7.RP.2c proportional relationships by equations. Represent Apply 2
Board Approved: February 7, 2019 18 | P a g e
Board First Read with Revisions: May 14, 2020
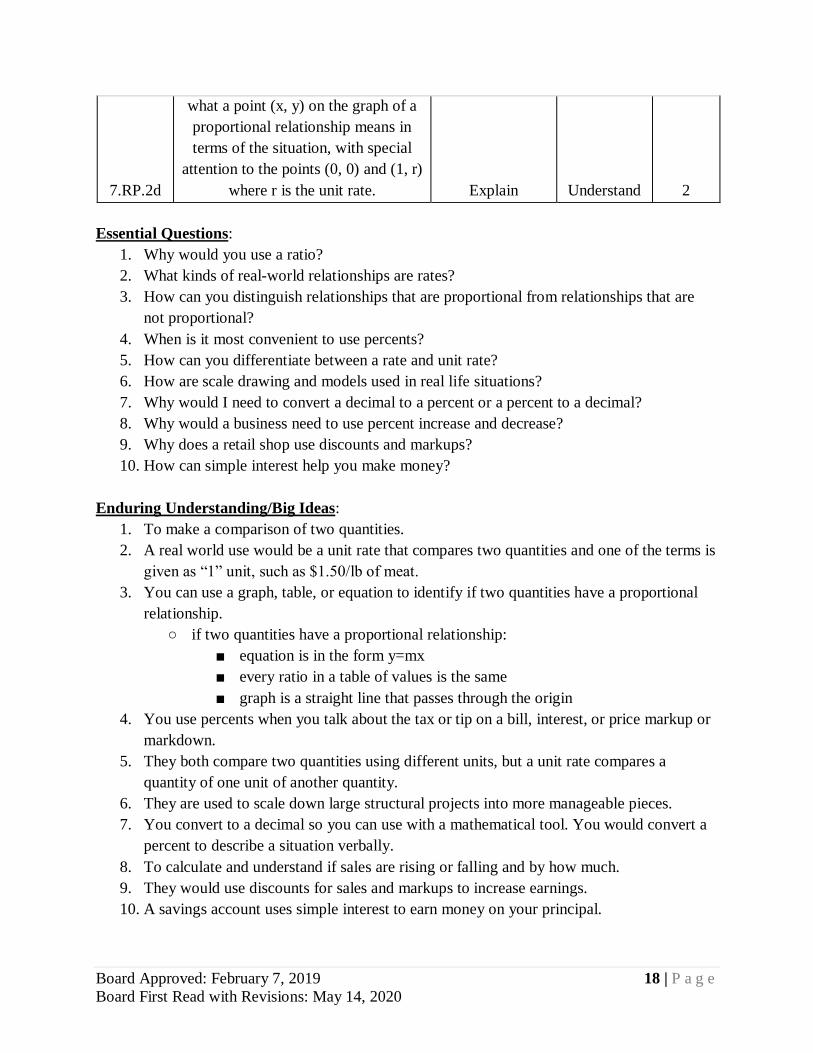
7.RP.2d
what a point (x, y) on the graph of a
proportional relationship means in
terms of the situation, with special
attention to the points (0, 0) and (1, r)
where r is the unit rate. Explain Understand 2
Essential Questions:
1. Why would you use a ratio?
2. What kinds of real-world relationships are rates?
3. How can you distinguish relationships that are proportional from relationships that are
not proportional?
4. When is it most convenient to use percents?
5. How can you differentiate between a rate and unit rate?
6. How are scale drawing and models used in real life situations?
7. Why would I need to convert a decimal to a percent or a percent to a decimal?
8. Why would a business need to use percent increase and decrease?
9. Why does a retail shop use discounts and markups?
10. How can simple interest help you make money?
Enduring Understanding/Big Ideas:
1. To make a comparison of two quantities.
2. A real world use would be a unit rate that compares two quantities and one of the terms is
given as “1” unit, such as $1.50/lb of meat.
3. You can use a graph, table, or equation to identify if two quantities have a proportional
relationship.
○ if two quantities have a proportional relationship:
■ equation is in the form y=mx
■ every ratio in a table of values is the same
■ graph is a straight line that passes through the origin
4. You use percents when you talk about the tax or tip on a bill, interest, or price markup or
markdown.
5. They both compare two quantities using different units, but a unit rate compares a
quantity of one unit of another quantity.
6. They are used to scale down large structural projects into more manageable pieces.
7. You convert to a decimal so you can use with a mathematical tool. You would convert a
percent to describe a situation verbally.
8. To calculate and understand if sales are rising or falling and by how much.
9. They would use discounts for sales and markups to increase earnings.
10. A savings account uses simple interest to earn money on your principal.
Board Approved: February 7, 2019 19 | P a g e
Board First Read with Revisions: May 14, 2020
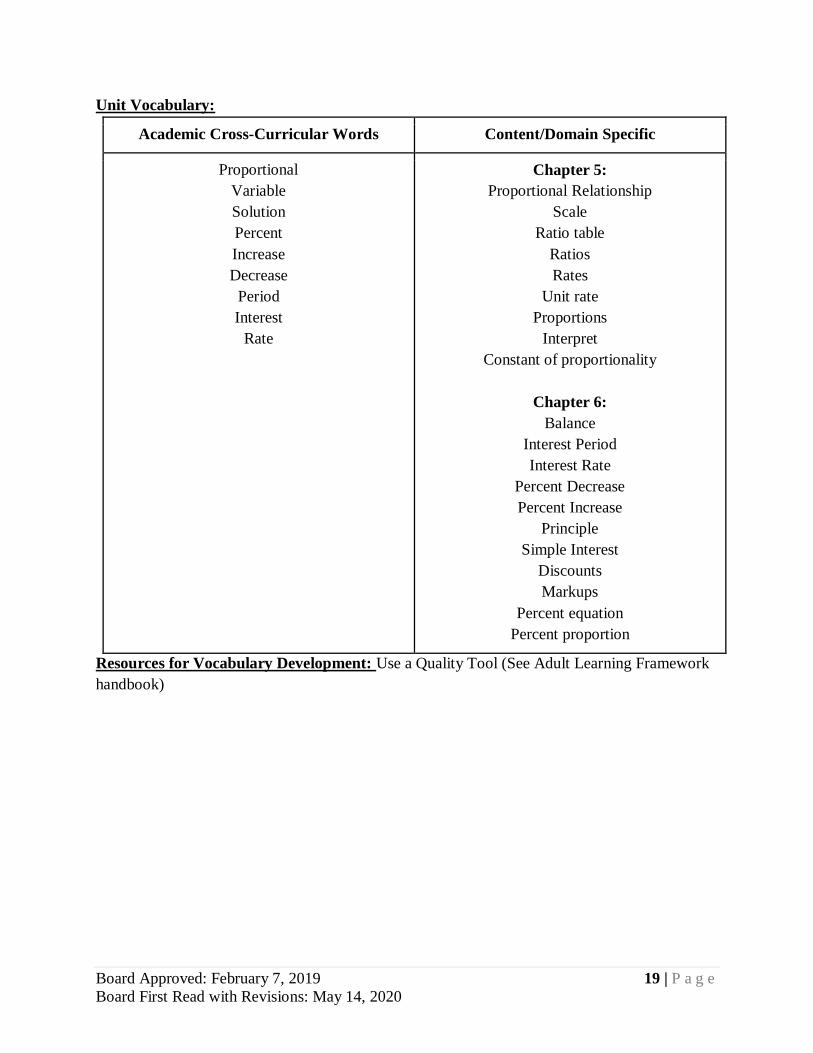
Unit Vocabulary:
Academic Cross-Curricular Words Content/Domain Specific
Proportional
Variable
Solution
Percent
Increase
Decrease
Period
Interest
Rate
Chapter 5:
Proportional Relationship
Scale
Ratio table
Ratios
Rates
Unit rate
Proportions
Interpret
Constant of proportionality
Chapter 6:
Balance
Interest Period
Interest Rate
Percent Decrease
Percent Increase
Principle
Simple Interest
Discounts
Markups
Percent equation
Percent proportion
Resources for Vocabulary Development: Use a Quality Tool (See Adult Learning Framework
handbook)
Board Approved: February 7, 2019 20 | P a g e
Board First Read with Revisions: May 14, 2020
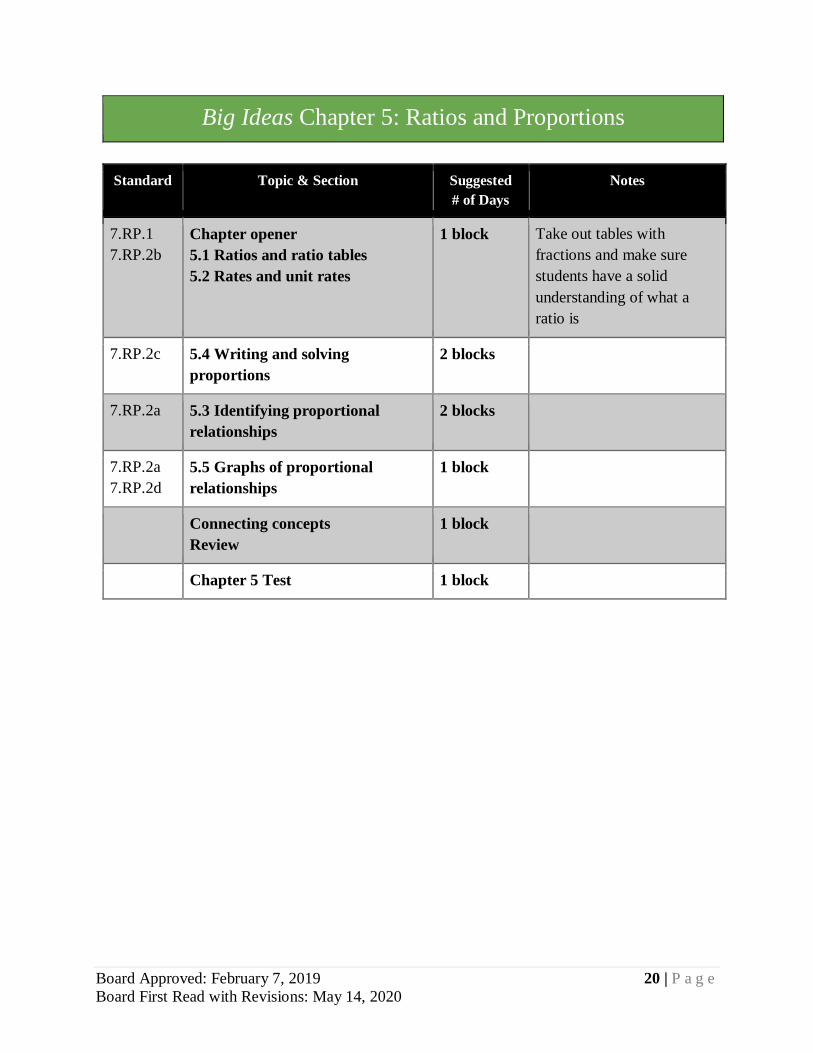
Big Ideas Chapter 5: Ratios and Proportions
Standard Topic & Section Suggested
# of Days
Notes
7.RP.1
7.RP.2b
Chapter opener
5.1 Ratios and ratio tables
5.2 Rates and unit rates
1 block Take out tables with
fractions and make sure
students have a solid
understanding of what a
ratio is
7.RP.2c 5.4 Writing and solving
proportions
2 blocks
7.RP.2a 5.3 Identifying proportional
relationships
2 blocks
7.RP.2a
7.RP.2d
5.5 Graphs of proportional
relationships
1 block
Connecting concepts
Review
1 block
Chapter 5 Test 1 block
Board Approved: February 7, 2019 21 | P a g e
Board First Read with Revisions: May 14, 2020
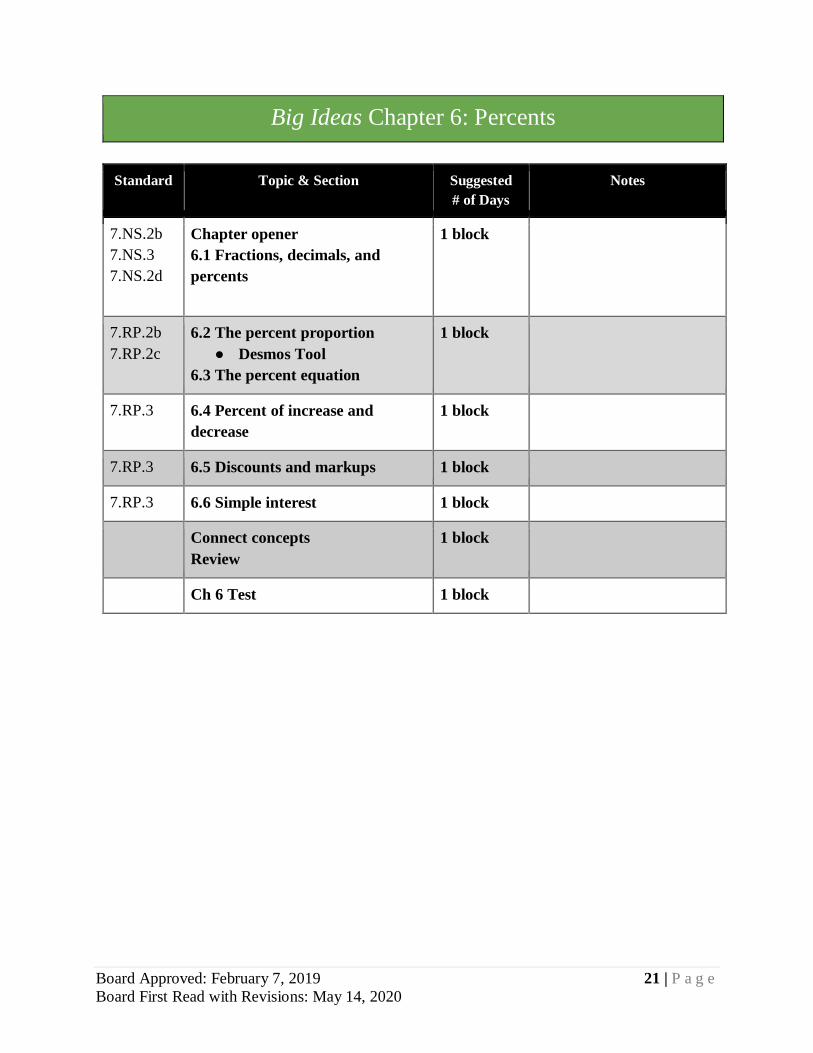
Big Ideas Chapter 6: Percents
Standard Topic & Section Suggested
# of Days
Notes
7.NS.2b
7.NS.3
7.NS.2d
Chapter opener
6.1 Fractions, decimals, and
percents
1 block
7.RP.2b
7.RP.2c
6.2 The percent proportion
● Desmos Tool
6.3 The percent equation
1 block
7.RP.3 6.4 Percent of increase and
decrease
1 block
7.RP.3 6.5 Discounts and markups 1 block
7.RP.3 6.6 Simple interest 1 block
Connect concepts
Review
1 block
Ch 6 Test 1 block
Board Approved: February 7, 2019 22 | P a g e
Board First Read with Revisions: May 14, 2020
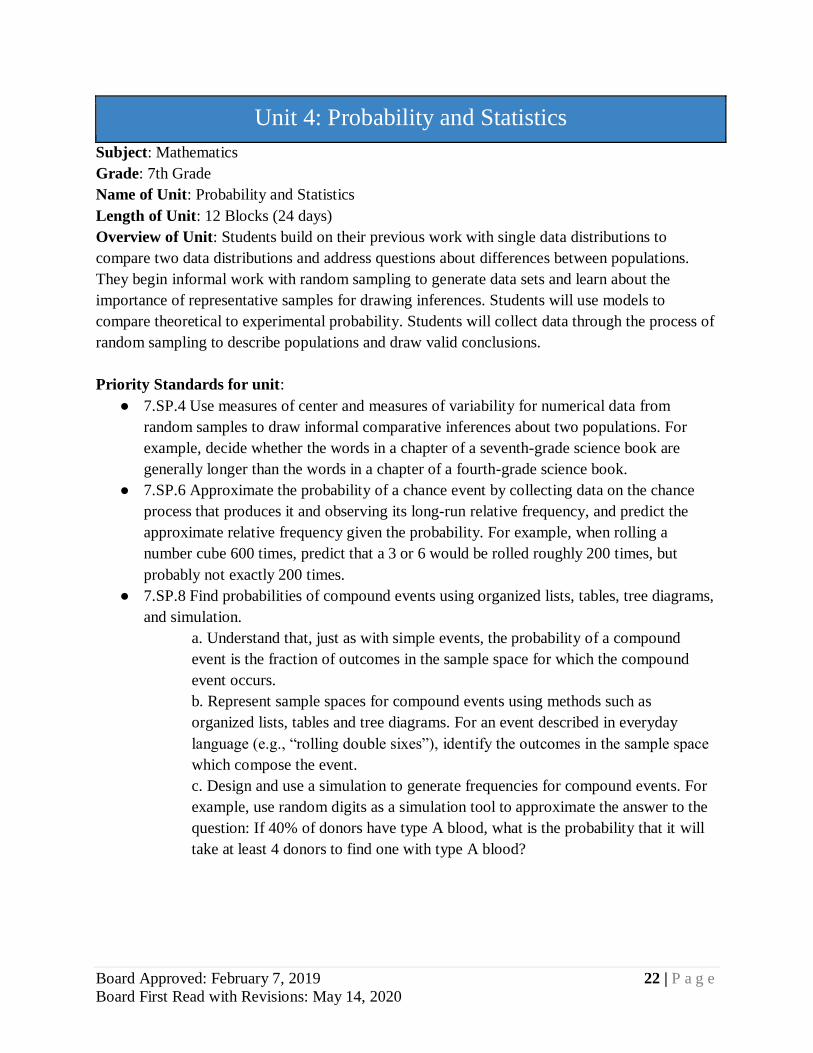
Unit 4: Probability and Statistics
Subject: Mathematics
Grade: 7th Grade
Name of Unit: Probability and Statistics
Length of Unit: 12 Blocks (24 days)
Overview of Unit: Students build on their previous work with single data distributions to
compare two data distributions and address questions about differences between populations.
They begin informal work with random sampling to generate data sets and learn about the
importance of representative samples for drawing inferences. Students will use models to
compare theoretical to experimental probability. Students will collect data through the process of
random sampling to describe populations and draw valid conclusions.
Priority Standards for unit:
● 7.SP.4 Use measures of center and measures of variability for numerical data from
random samples to draw informal comparative inferences about two populations. For
example, decide whether the words in a chapter of a seventh-grade science book are
generally longer than the words in a chapter of a fourth-grade science book.
● 7.SP.6 Approximate the probability of a chance event by collecting data on the chance
process that produces it and observing its long-run relative frequency, and predict the
approximate relative frequency given the probability. For example, when rolling a
number cube 600 times, predict that a 3 or 6 would be rolled roughly 200 times, but
probably not exactly 200 times.
● 7.SP.8 Find probabilities of compound events using organized lists, tables, tree diagrams,
and simulation.
a. Understand that, just as with simple events, the probability of a compound
event is the fraction of outcomes in the sample space for which the compound
event occurs.
b. Represent sample spaces for compound events using methods such as
organized lists, tables and tree diagrams. For an event described in everyday
language (e.g., “rolling double sixes”), identify the outcomes in the sample space
which compose the event.
c. Design and use a simulation to generate frequencies for compound events. For
example, use random digits as a simulation tool to approximate the answer to the
question: If 40% of donors have type A blood, what is the probability that it will
take at least 4 donors to find one with type A blood?
Board Approved: February 7, 2019 23 | P a g e
Board First Read with Revisions: May 14, 2020
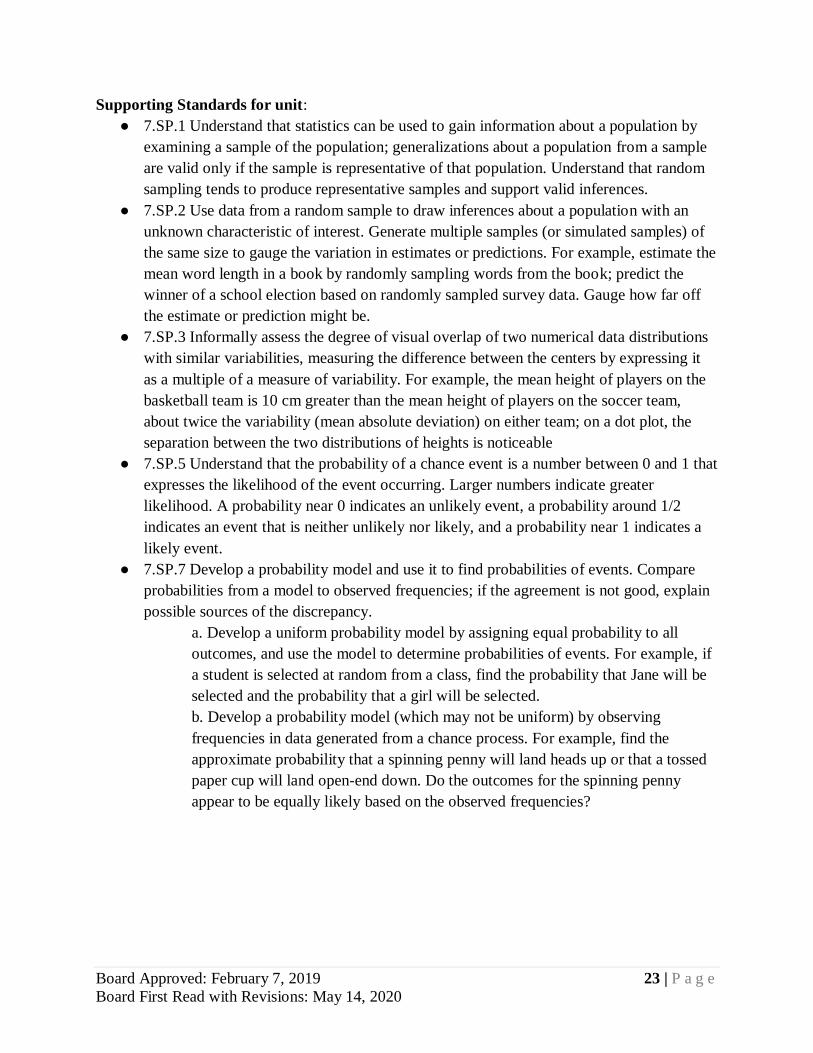
Supporting Standards for unit:
● 7.SP.1 Understand that statistics can be used to gain information about a population by
examining a sample of the population; generalizations about a population from a sample
are valid only if the sample is representative of that population. Understand that random
sampling tends to produce representative samples and support valid inferences.
● 7.SP.2 Use data from a random sample to draw inferences about a population with an
unknown characteristic of interest. Generate multiple samples (or simulated samples) of
the same size to gauge the variation in estimates or predictions. For example, estimate the
mean word length in a book by randomly sampling words from the book; predict the
winner of a school election based on randomly sampled survey data. Gauge how far off
the estimate or prediction might be.
● 7.SP.3 Informally assess the degree of visual overlap of two numerical data distributions
with similar variabilities, measuring the difference between the centers by expressing it
as a multiple of a measure of variability. For example, the mean height of players on the
basketball team is 10 cm greater than the mean height of players on the soccer team,
about twice the variability (mean absolute deviation) on either team; on a dot plot, the
separation between the two distributions of heights is noticeable
● 7.SP.5 Understand that the probability of a chance event is a number between 0 and 1 that
expresses the likelihood of the event occurring. Larger numbers indicate greater
likelihood. A probability near 0 indicates an unlikely event, a probability around 1/2
indicates an event that is neither unlikely nor likely, and a probability near 1 indicates a
likely event.
● 7.SP.7 Develop a probability model and use it to find probabilities of events. Compare
probabilities from a model to observed frequencies; if the agreement is not good, explain
possible sources of the discrepancy.
a. Develop a uniform probability model by assigning equal probability to all
outcomes, and use the model to determine probabilities of events. For example, if
a student is selected at random from a class, find the probability that Jane will be
selected and the probability that a girl will be selected.
b. Develop a probability model (which may not be uniform) by observing
frequencies in data generated from a chance process. For example, find the
approximate probability that a spinning penny will land heads up or that a tossed
paper cup will land open-end down. Do the outcomes for the spinning penny
appear to be equally likely based on the observed frequencies?
Board Approved: February 7, 2019 24 | P a g e
Board First Read with Revisions: May 14, 2020
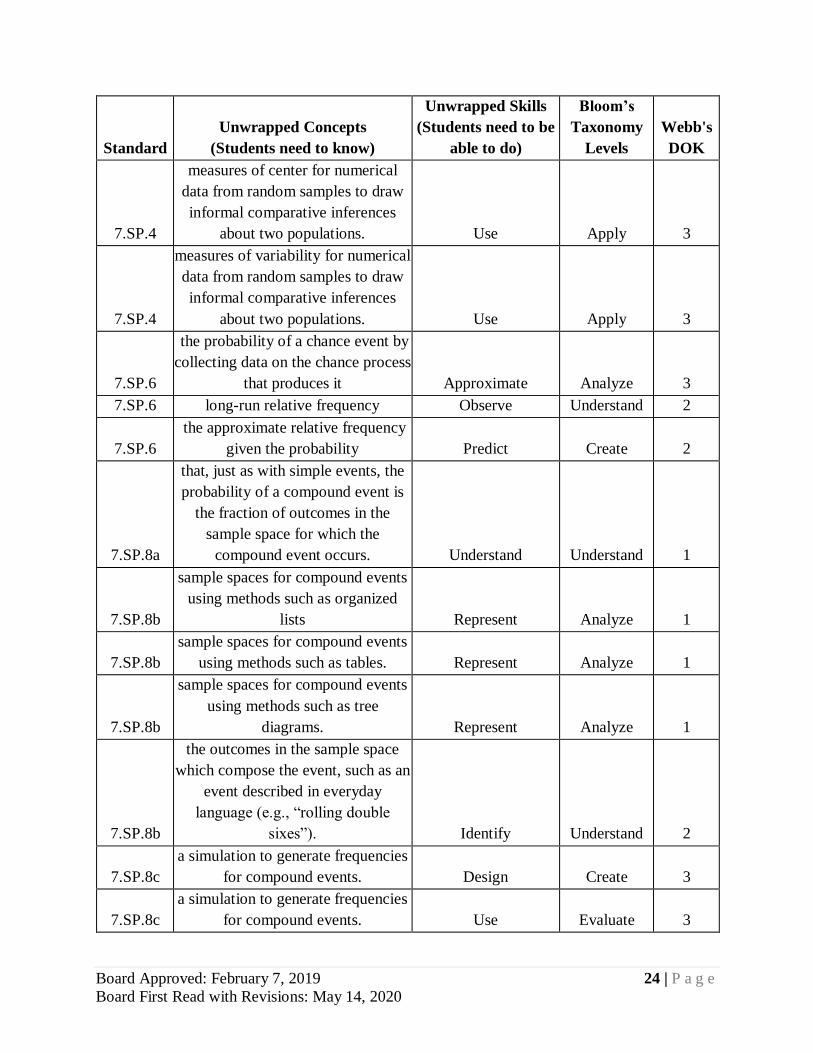
Standard
Unwrapped Concepts
(Students need to know)
Unwrapped Skills
(Students need to be
able to do)
Bloom’s
Taxonomy
Levels
Webb's
DOK
7.SP.4
measures of center for numerical
data from random samples to draw
informal comparative inferences
about two populations. Use Apply 3
7.SP.4
measures of variability for numerical
data from random samples to draw
informal comparative inferences
about two populations. Use Apply 3
7.SP.6
the probability of a chance event by
collecting data on the chance process
that produces it Approximate Analyze 3
7.SP.6 long-run relative frequency Observe Understand 2
7.SP.6
the approximate relative frequency
given the probability Predict Create 2
7.SP.8a
that, just as with simple events, the
probability of a compound event is
the fraction of outcomes in the
sample space for which the
compound event occurs. Understand Understand 1
7.SP.8b
sample spaces for compound events
using methods such as organized
lists Represent Analyze 1
7.SP.8b
sample spaces for compound events
using methods such as tables. Represent Analyze 1
7.SP.8b
sample spaces for compound events
using methods such as tree
diagrams. Represent Analyze 1
7.SP.8b
the outcomes in the sample space
which compose the event, such as an
event described in everyday
language (e.g., “rolling double
sixes”). Identify Understand 2
7.SP.8c
a simulation to generate frequencies
for compound events. Design Create 3
7.SP.8c
a simulation to generate frequencies
for compound events. Use Evaluate 3

Board Approved: February 7, 2019 25 | P a g e
Board First Read with Revisions: May 14, 2020
Board Approved: February 7, 2019 26 | P a g e
Board First Read with Revisions: May 14, 2020
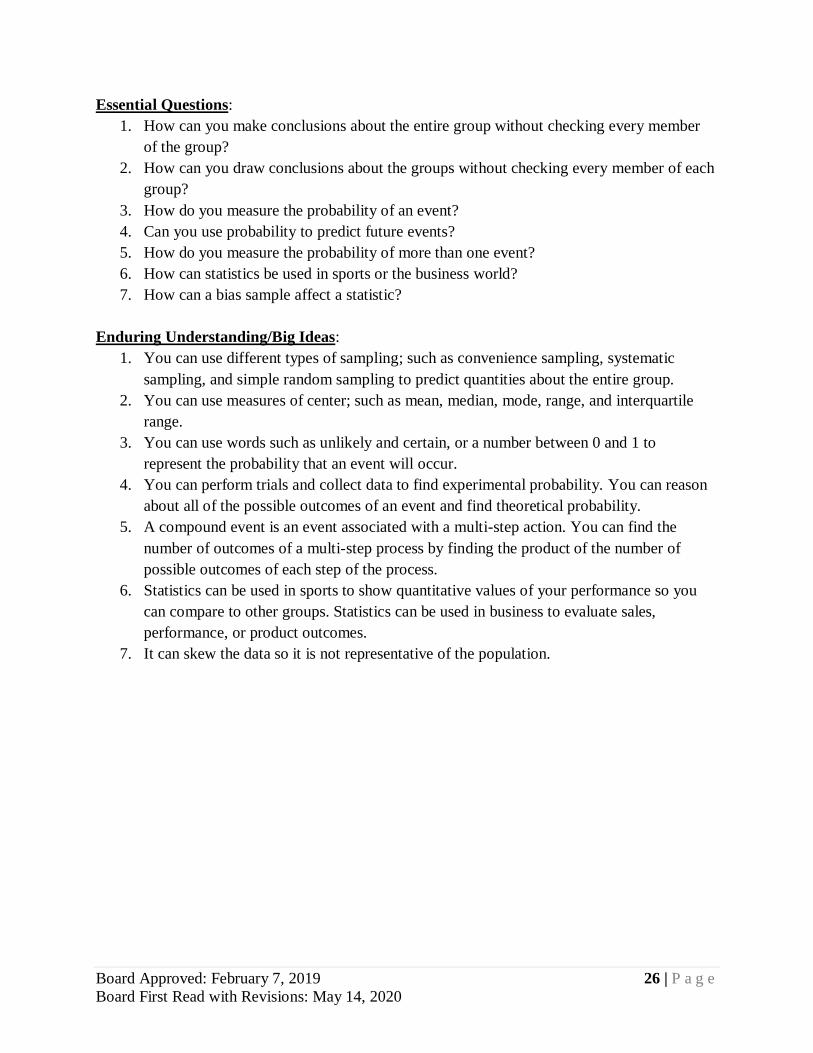
Essential Questions:
1. How can you make conclusions about the entire group without checking every member
of the group?
2. How can you draw conclusions about the groups without checking every member of each
group?
3. How do you measure the probability of an event?
4. Can you use probability to predict future events?
5. How do you measure the probability of more than one event?
6. How can statistics be used in sports or the business world?
7. How can a bias sample affect a statistic?
Enduring Understanding/Big Ideas:
1. You can use different types of sampling; such as convenience sampling, systematic
sampling, and simple random sampling to predict quantities about the entire group.
2. You can use measures of center; such as mean, median, mode, range, and interquartile
range.
3. You can use words such as unlikely and certain, or a number between 0 and 1 to
represent the probability that an event will occur.
4. You can perform trials and collect data to find experimental probability. You can reason
about all of the possible outcomes of an event and find theoretical probability.
5. A compound event is an event associated with a multi-step action. You can find the
number of outcomes of a multi-step process by finding the product of the number of
possible outcomes of each step of the process.
6. Statistics can be used in sports to show quantitative values of your performance so you
can compare to other groups. Statistics can be used in business to evaluate sales,
performance, or product outcomes.
7. It can skew the data so it is not representative of the population.
Board Approved: February 7, 2019 27 | P a g e
Board First Read with Revisions: May 14, 2020
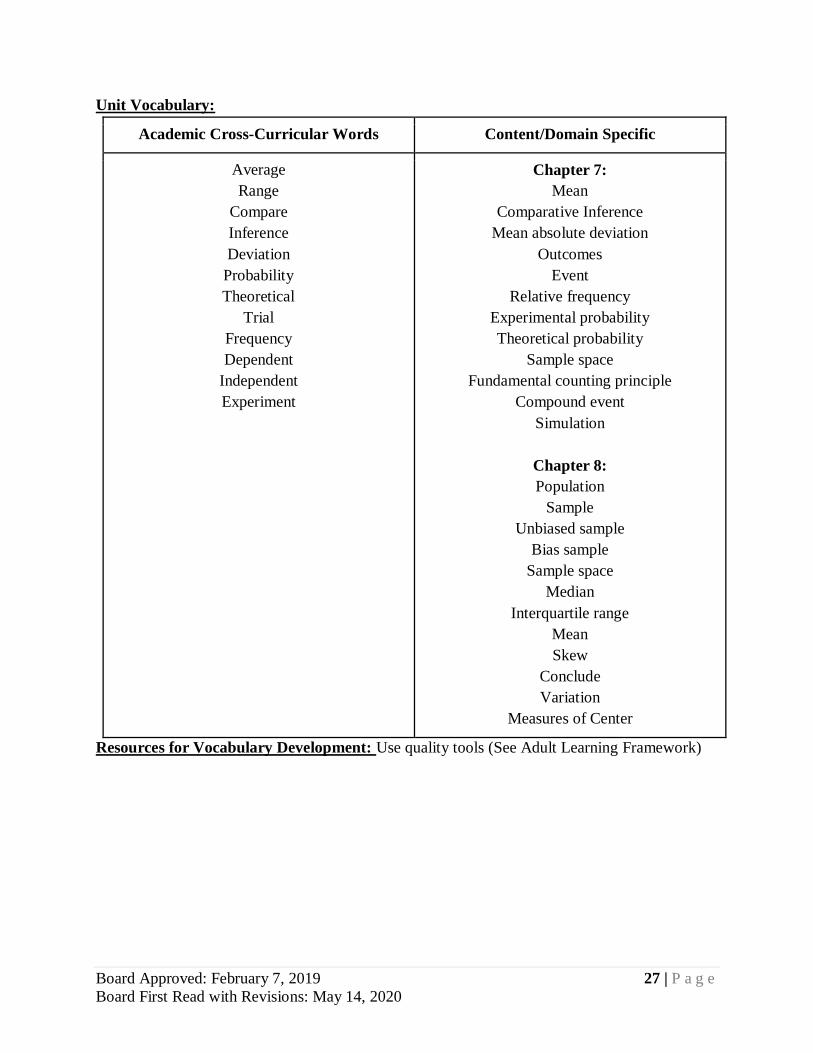
Unit Vocabulary:
Academic Cross-Curricular Words Content/Domain Specific
Average
Range
Compare
Inference
Deviation
Probability
Theoretical
Trial
Frequency
Dependent
Independent
Experiment
Chapter 7:
Mean
Comparative Inference
Mean absolute deviation
Outcomes
Event
Relative frequency
Experimental probability
Theoretical probability
Sample space
Fundamental counting principle
Compound event
Simulation
Chapter 8:
Population
Sample
Unbiased sample
Bias sample
Sample space
Median
Interquartile range
Mean
Skew
Conclude
Variation
Measures of Center
Resources for Vocabulary Development: Use quality tools (See Adult Learning Framework)
Board Approved: February 7, 2019 28 | P a g e
Board First Read with Revisions: May 14, 2020
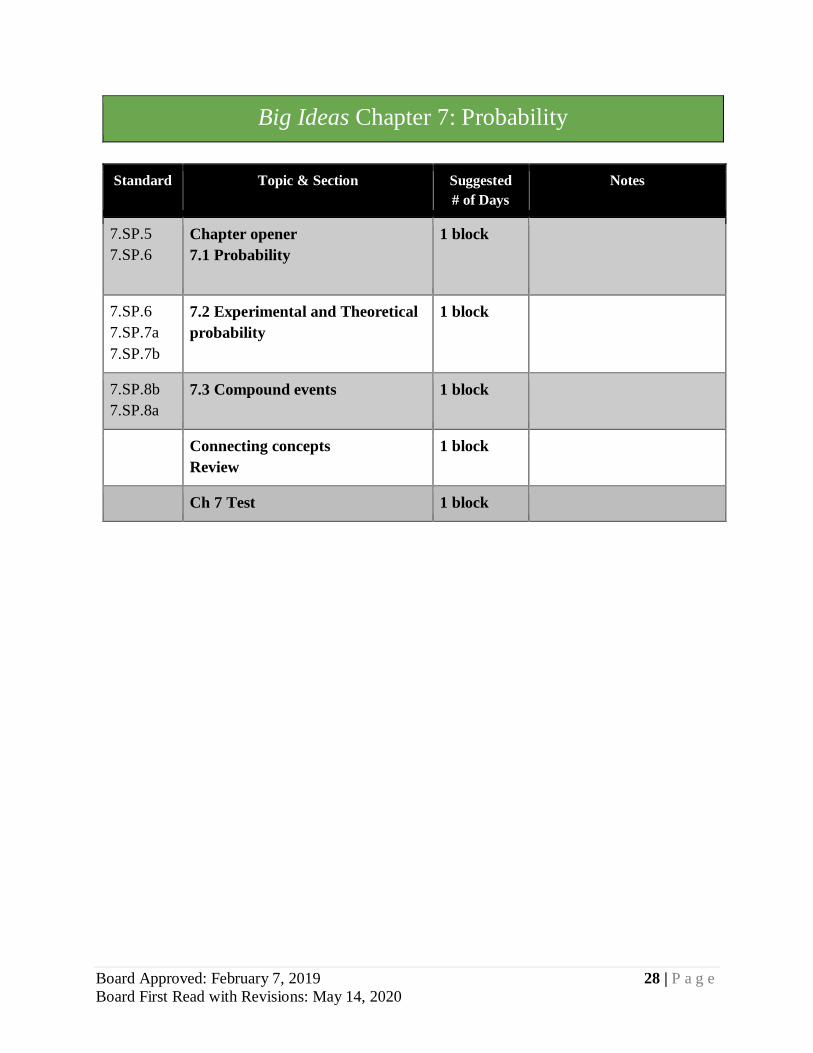
Big Ideas Chapter 7: Probability
Standard Topic & Section Suggested
# of Days
Notes
7.SP.5
7.SP.6
Chapter opener
7.1 Probability
1 block
7.SP.6
7.SP.7a
7.SP.7b
7.2 Experimental and Theoretical
probability
1 block
7.SP.8b
7.SP.8a
7.3 Compound events 1 block
Connecting concepts
Review
1 block
Ch 7 Test 1 block
Board Approved: February 7, 2019 29 | P a g e
Board First Read with Revisions: May 14, 2020
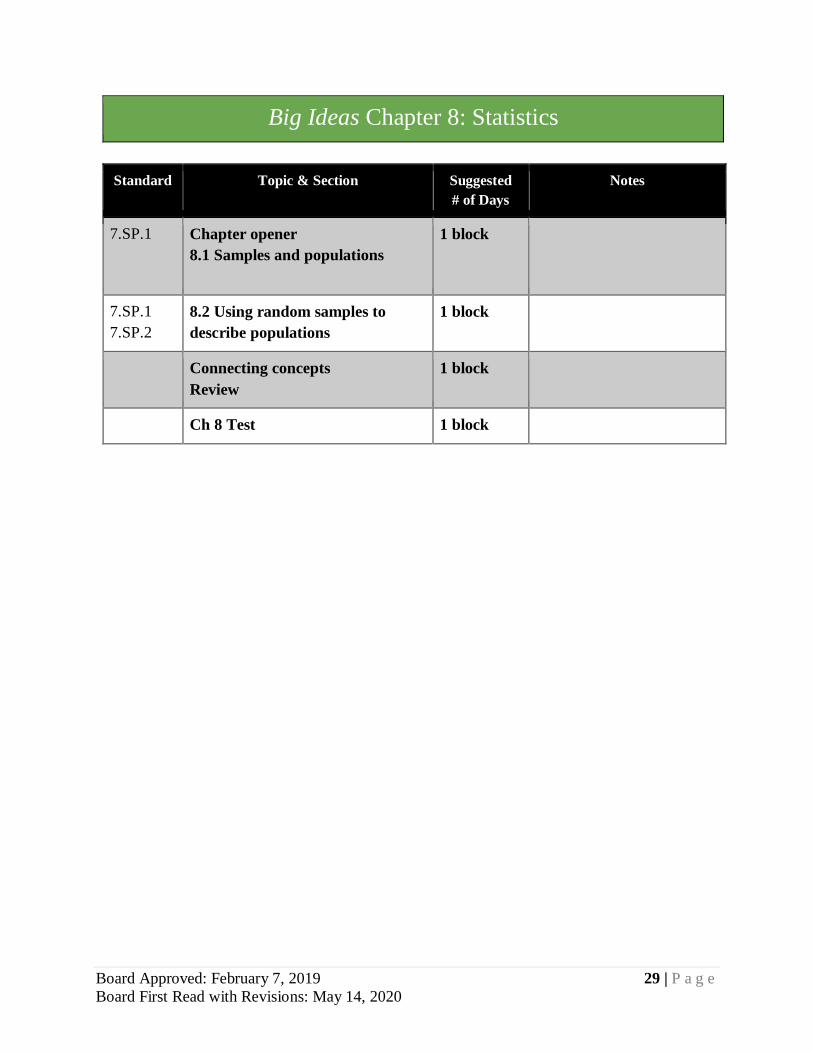
Big Ideas Chapter 8: Statistics
Standard Topic & Section Suggested
# of Days
Notes
7.SP.1 Chapter opener
8.1 Samples and populations
1 block
7.SP.1
7.SP.2
8.2 Using random samples to
describe populations
1 block
Connecting concepts
Review
1 block
Ch 8 Test 1 block
Board Approved: February 7, 2019 30 | P a g e
Board First Read with Revisions: May 14, 2020
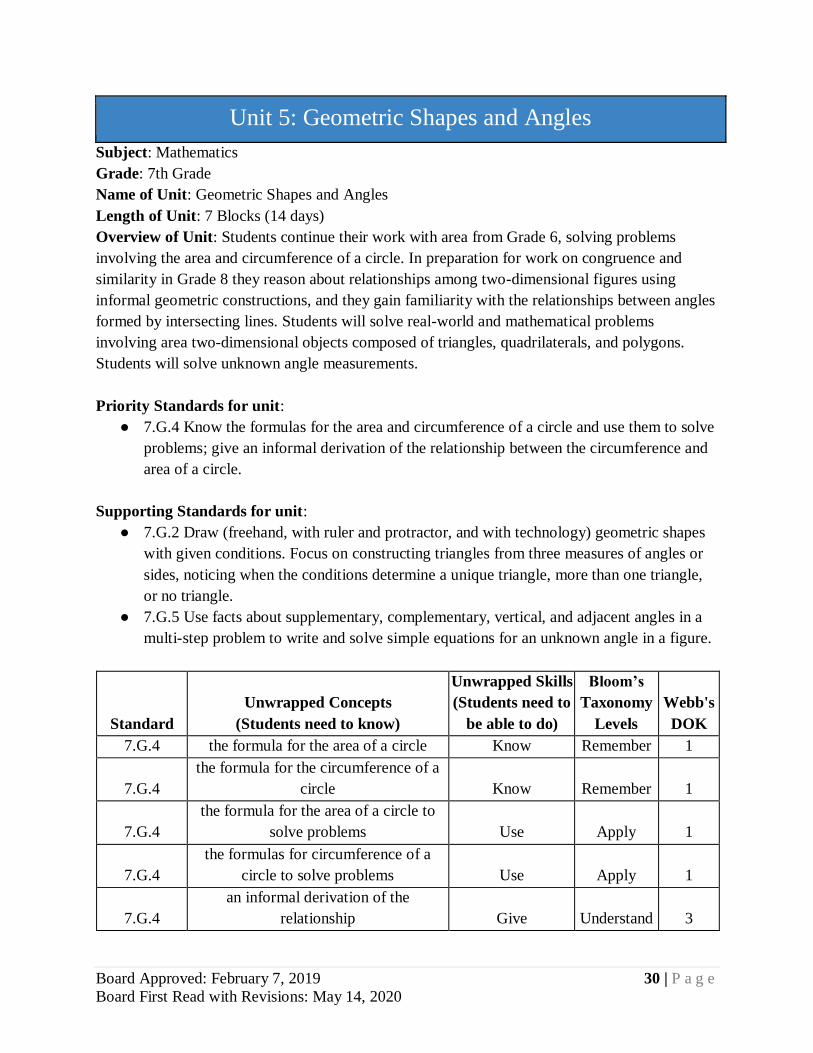
Unit 5: Geometric Shapes and Angles
Subject: Mathematics
Grade: 7th Grade
Name of Unit: Geometric Shapes and Angles
Length of Unit: 7 Blocks (14 days)
Overview of Unit: Students continue their work with area from Grade 6, solving problems
involving the area and circumference of a circle. In preparation for work on congruence and
similarity in Grade 8 they reason about relationships among two-dimensional figures using
informal geometric constructions, and they gain familiarity with the relationships between angles
formed by intersecting lines. Students will solve real-world and mathematical problems
involving area two-dimensional objects composed of triangles, quadrilaterals, and polygons.
Students will solve unknown angle measurements.
Priority Standards for unit:
● 7.G.4 Know the formulas for the area and circumference of a circle and use them to solve
problems; give an informal derivation of the relationship between the circumference and
area of a circle.
Supporting Standards for unit:
● 7.G.2 Draw (freehand, with ruler and protractor, and with technology) geometric shapes
with given conditions. Focus on constructing triangles from three measures of angles or
sides, noticing when the conditions determine a unique triangle, more than one triangle,
or no triangle.
● 7.G.5 Use facts about supplementary, complementary, vertical, and adjacent angles in a
multi-step problem to write and solve simple equations for an unknown angle in a figure.
Standard
Unwrapped Concepts
(Students need to know)
Unwrapped Skills
(Students need to
be able to do)
Bloom’s
Taxonomy
Levels
Webb's
DOK
7.G.4 the formula for the area of a circle Know Remember 1
7.G.4
the formula for the circumference of a
circle Know Remember 1
7.G.4
the formula for the area of a circle to
solve problems Use Apply 1
7.G.4
the formulas for circumference of a
circle to solve problems Use Apply 1
7.G.4
an informal derivation of the
relationship Give Understand 3
Board Approved: February 7, 2019 31 | P a g e
Board First Read with Revisions: May 14, 2020
between the circumference and area of a
circle
Essential Questions:
1. How can you define a circle?
2. What does it mean to talk about the size of a circle?
3. Are some measurements more useful in certain situations than others?
4. How can you differentiate between radius and diameter?
5. How can you differentiate between circumference and area?
6. How can you find the area of a composite figure?
Enduring Understanding/Big Ideas:
1. The set of points in a plane that are the same distance from another point define a circle.
2. The radius, diameter, circumference, and area of a circle are related; you can use them to
talk about the size of a circle.
3. Yes depending on what the situation calls for; space occupied by objects or space within
an object. The formula will determine what measurement to apply.
4. Radius is half way across the circle and diameter is all the way across the circle, both
have to be through the center point.
5. The circumference the distance around a circle and the area is the space inside.
6. Break it into basic shapes like triangles, squares, rectangles, and semicircles. You then
find their individual areas and add them together.
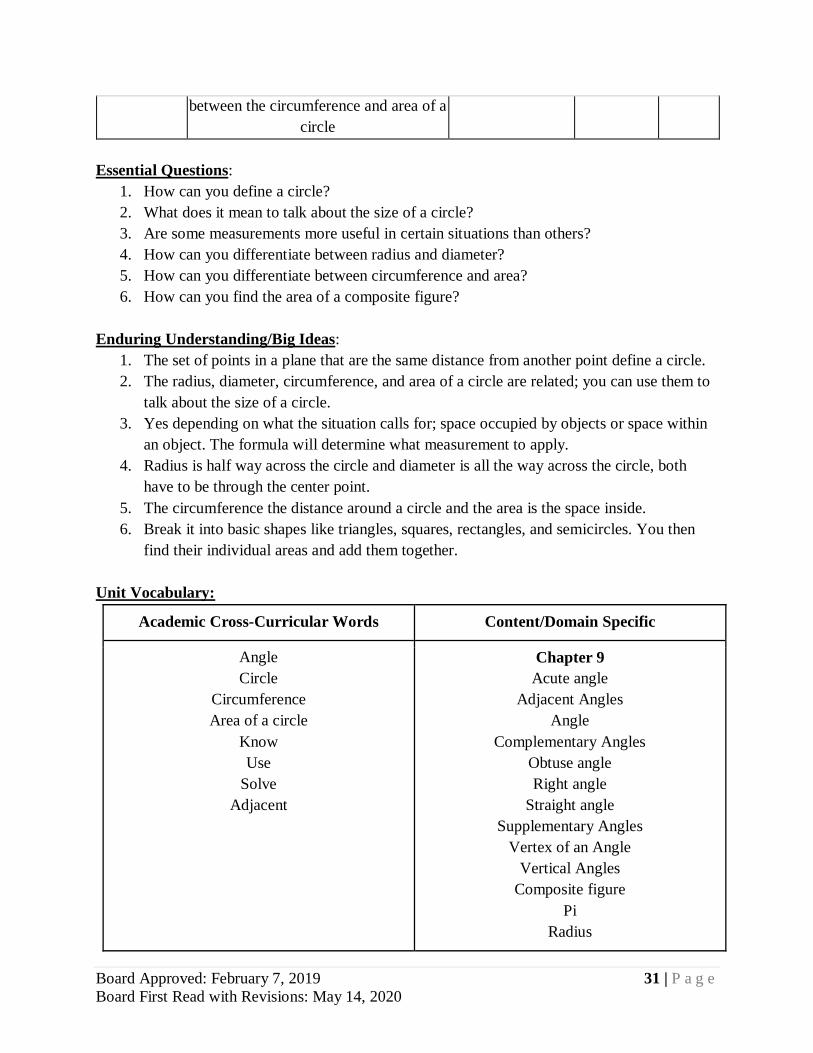
Unit Vocabulary:
Academic Cross-Curricular Words Content/Domain Specific
Angle
Circle
Circumference
Area of a circle
Know
Use
Solve
Adjacent
Chapter 9
Acute angle
Adjacent Angles
Angle
Complementary Angles
Obtuse angle
Right angle
Straight angle
Supplementary Angles
Vertex of an Angle
Vertical Angles
Composite figure
Pi
Radius
Board Approved: February 7, 2019 32 | P a g e
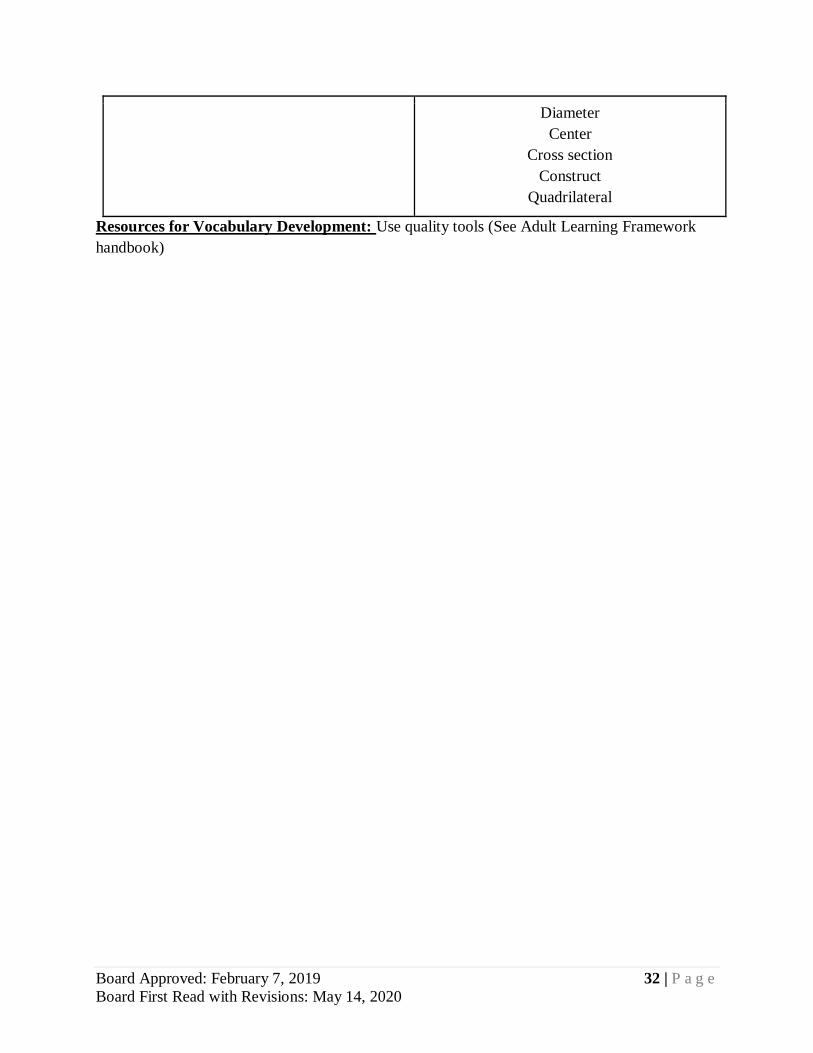
Board First Read with Revisions: May 14, 2020
Diameter
Center
Cross section
Construct
Quadrilateral
Resources for Vocabulary Development: Use quality tools (See Adult Learning Framework
handbook)
Board Approved: February 7, 2019 33 | P a g e
Board First Read with Revisions: May 14, 2020
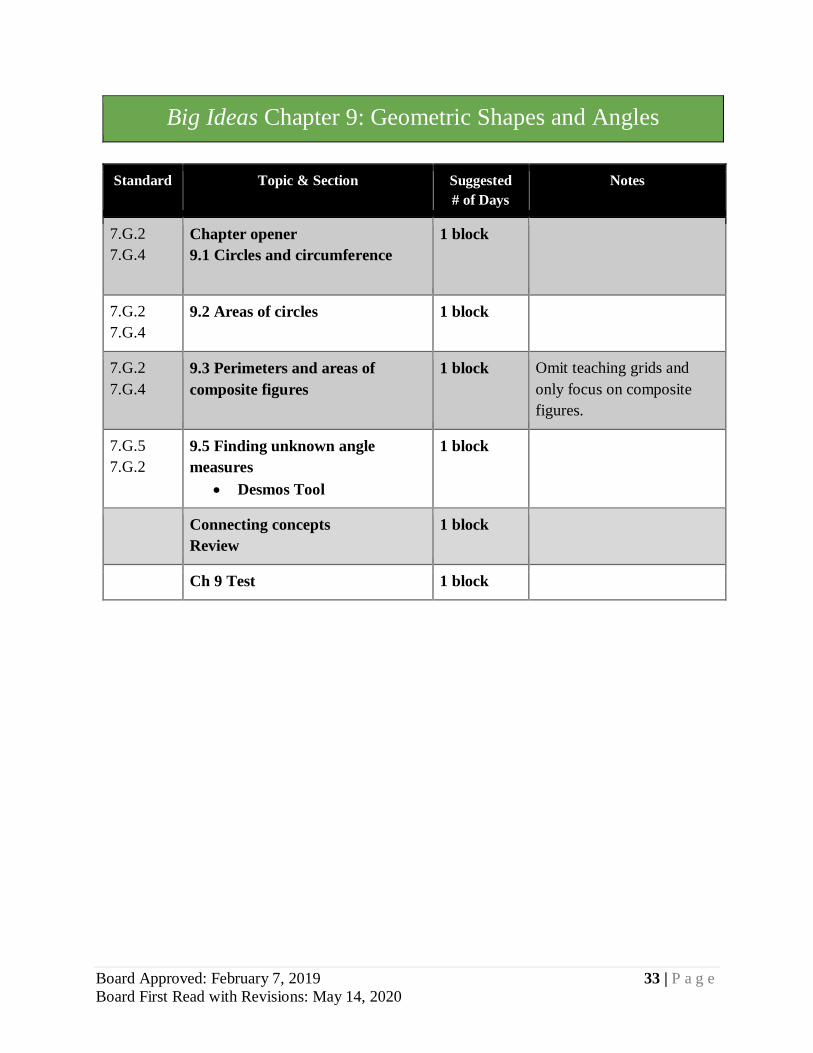
Big Ideas Chapter 9: Geometric Shapes and Angles
Standard Topic & Section Suggested
# of Days
Notes
7.G.2
7.G.4
Chapter opener
9.1 Circles and circumference
1 block
7.G.2
7.G.4
9.2 Areas of circles 1 block
7.G.2
7.G.4
9.3 Perimeters and areas of
composite figures
1 block Omit teaching grids and
only focus on composite
figures.
7.G.5
7.G.2
9.5 Finding unknown angle
measures
Desmos Tool
1 block
Connecting concepts
Review
1 block
Ch 9 Test 1 block
Board Approved: February 7, 2019 34 | P a g e
Board First Read with Revisions: May 14, 2020
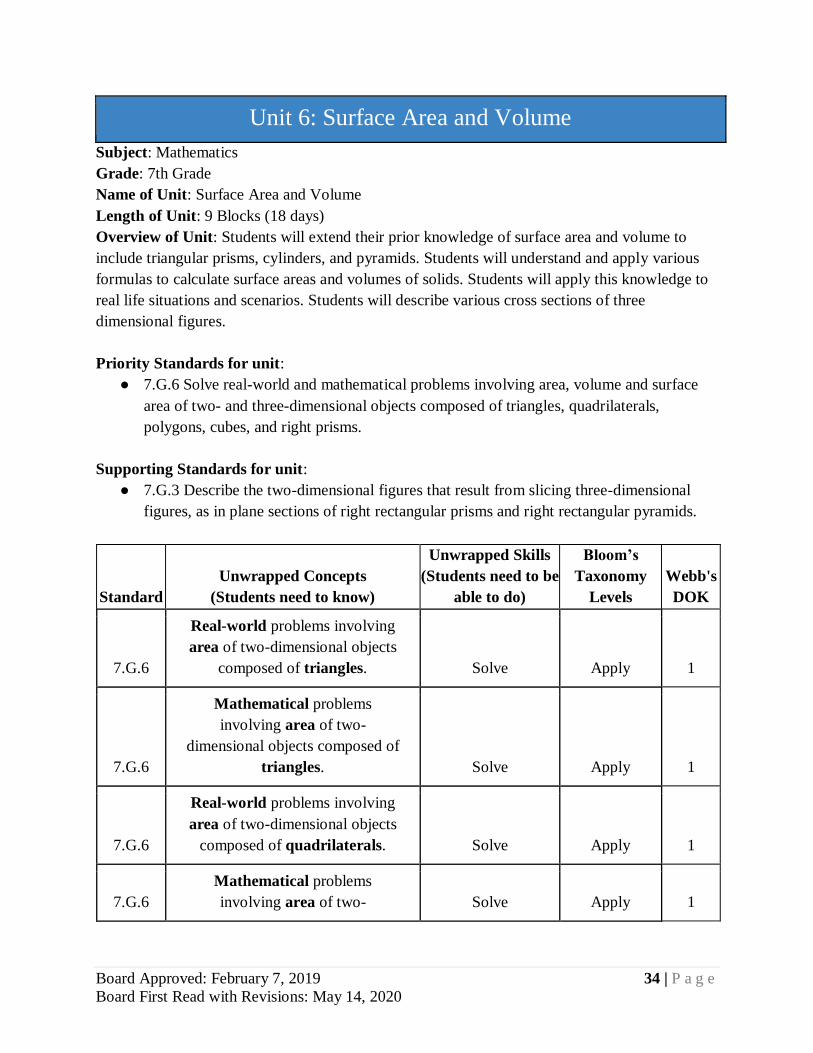
Unit 6: Surface Area and Volume
Subject: Mathematics
Grade: 7th Grade
Name of Unit: Surface Area and Volume
Length of Unit: 9 Blocks (18 days)
Overview of Unit: Students will extend their prior knowledge of surface area and volume to
include triangular prisms, cylinders, and pyramids. Students will understand and apply various
formulas to calculate surface areas and volumes of solids. Students will apply this knowledge to
real life situations and scenarios. Students will describe various cross sections of three
dimensional figures.
Priority Standards for unit:
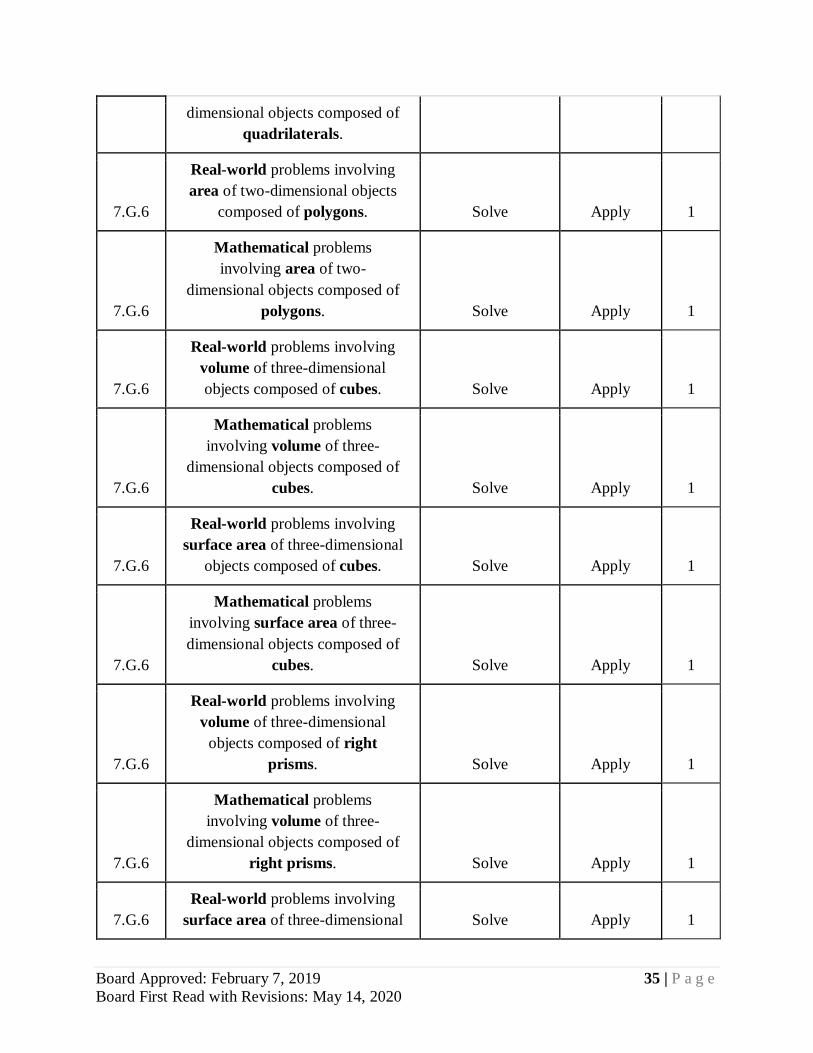
● 7.G.6 Solve real-world and mathematical problems involving area, volume and surface
area of two- and three-dimensional objects composed of triangles, quadrilaterals,
polygons, cubes, and right prisms.
Supporting Standards for unit:
● 7.G.3 Describe the two-dimensional figures that result from slicing three-dimensional
figures, as in plane sections of right rectangular prisms and right rectangular pyramids.
Standard
Unwrapped Concepts
(Students need to know)
Unwrapped Skills
(Students need to be
able to do)
Bloom’s
Taxonomy
Levels
Webb's
DOK
7.G.6
Real-world problems involving
area of two-dimensional objects
composed of triangles. Solve Apply 1
7.G.6
Mathematical problems
involving area of two-
dimensional objects composed of
triangles. Solve Apply 1
7.G.6
Real-world problems involving
area of two-dimensional objects
composed of quadrilaterals. Solve Apply 1
7.G.6
Mathematical problems
involving area of two- Solve Apply 1
Board Approved: February 7, 2019 35 | P a g e
Board First Read with Revisions: May 14, 2020
dimensional objects composed of
quadrilaterals.
7.G.6
Real-world problems involving
area of two-dimensional objects
composed of polygons. Solve Apply 1
7.G.6
Mathematical problems
involving area of two-
dimensional objects composed of
polygons. Solve Apply 1
7.G.6
Real-world problems involving
volume of three-dimensional
objects composed of cubes. Solve Apply 1
7.G.6
Mathematical problems
involving volume of three-
dimensional objects composed of
cubes. Solve Apply 1
7.G.6
Real-world problems involving
surface area of three-dimensional
objects composed of cubes. Solve Apply 1
7.G.6
Mathematical problems
involving surface area of three-
dimensional objects composed of
cubes. Solve Apply 1
7.G.6
Real-world problems involving
volume of three-dimensional
objects composed of right
prisms. Solve Apply 1
7.G.6
Mathematical problems
involving volume of three-
dimensional objects composed of
right prisms. Solve Apply 1
7.G.6
Real-world problems involving
surface area of three-dimensional Solve Apply 1
Board Approved: February 7, 2019 36 | P a g e
Board First Read with Revisions: May 14, 2020
objects composed of right
prisms.
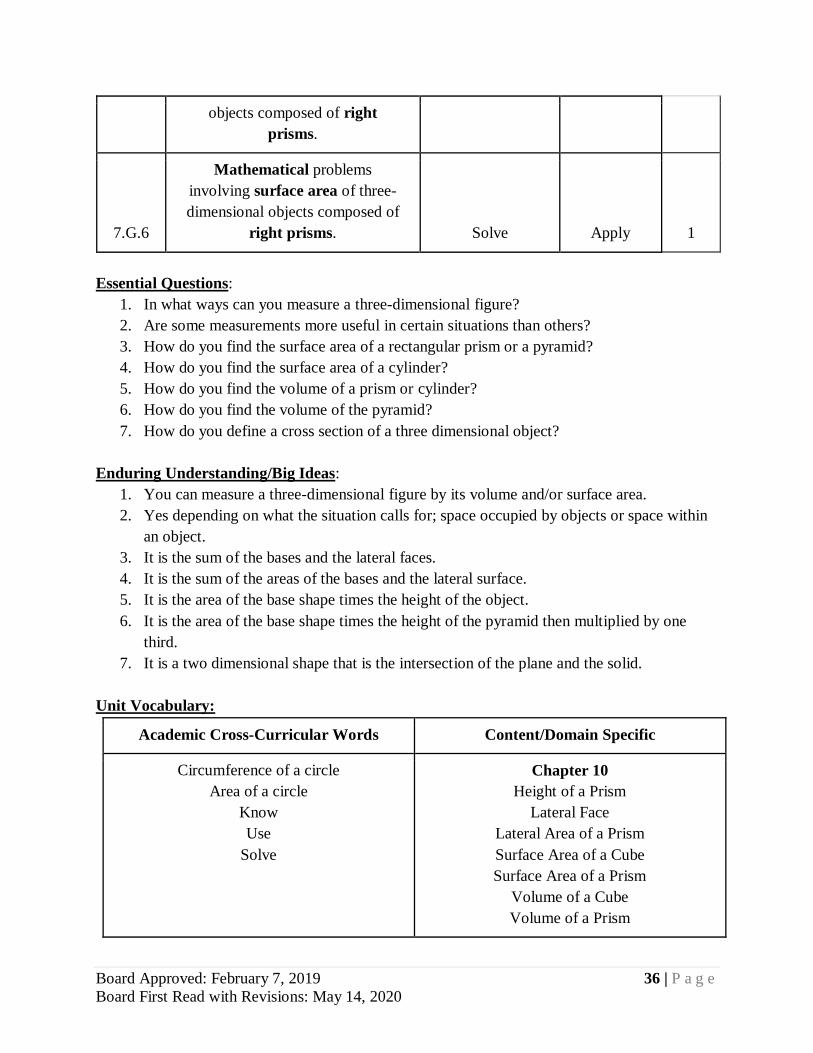
7.G.6
Mathematical problems
involving surface area of three-
dimensional objects composed of
right prisms. Solve Apply 1
Essential Questions:
1. In what ways can you measure a three-dimensional figure?
2. Are some measurements more useful in certain situations than others?
3. How do you find the surface area of a rectangular prism or a pyramid?
4. How do you find the surface area of a cylinder?
5. How do you find the volume of a prism or cylinder?
6. How do you find the volume of the pyramid?
7. How do you define a cross section of a three dimensional object?
Enduring Understanding/Big Ideas:
1. You can measure a three-dimensional figure by its volume and/or surface area.
2. Yes depending on what the situation calls for; space occupied by objects or space within
an object.
3. It is the sum of the bases and the lateral faces.
4. It is the sum of the areas of the bases and the lateral surface.
5. It is the area of the base shape times the height of the object.
6. It is the area of the base shape times the height of the pyramid then multiplied by one
third.
7. It is a two dimensional shape that is the intersection of the plane and the solid.
Unit Vocabulary:
Academic Cross-Curricular Words Content/Domain Specific
Circumference of a circle
Area of a circle
Know
Use
Solve
Chapter 10
Height of a Prism
Lateral Face
Lateral Area of a Prism
Surface Area of a Cube
Surface Area of a Prism
Volume of a Cube
Volume of a Prism
Board Approved: February 7, 2019 37 | P a g e
Board First Read with Revisions: May 14, 2020
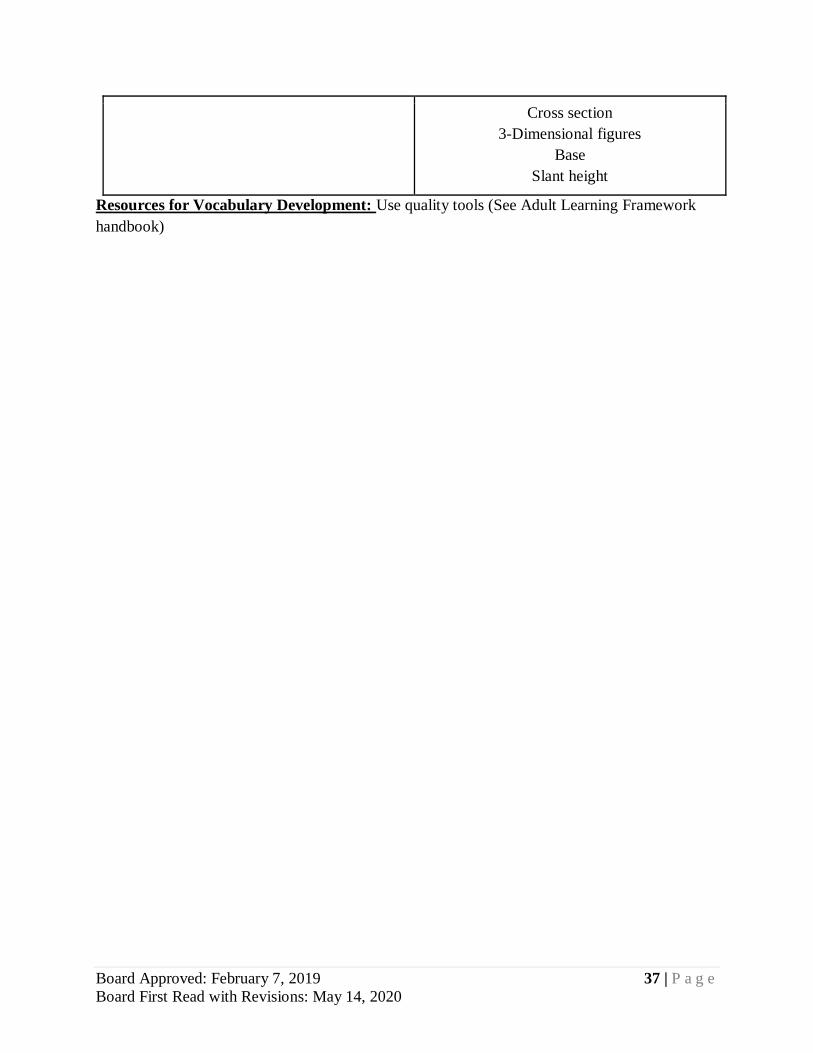
Cross section
3-Dimensional figures
Base
Slant height
Resources for Vocabulary Development: Use quality tools (See Adult Learning Framework
handbook)
Board Approved: February 7, 2019 38 | P a g e
Board First Read with Revisions: May 14, 2020
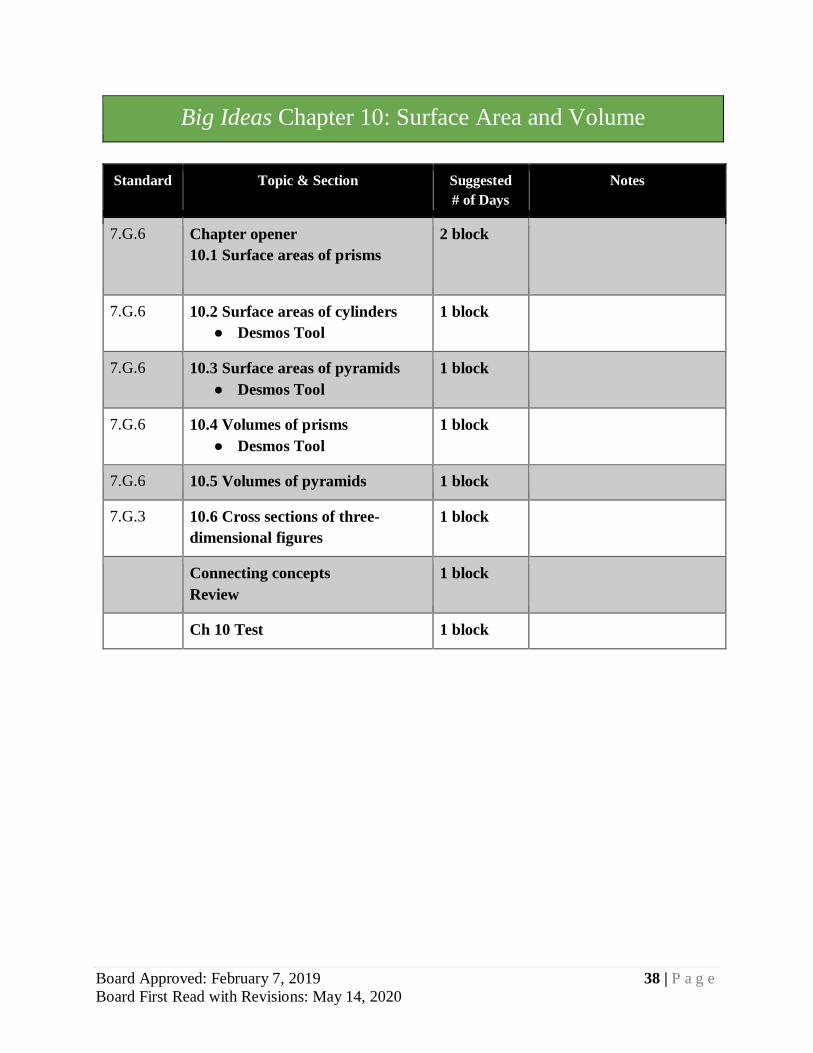
Big Ideas Chapter 10: Surface Area and Volume
Standard Topic & Section Suggested
# of Days
Notes
7.G.6 Chapter opener
10.1 Surface areas of prisms
2 block
7.G.6 10.2 Surface areas of cylinders
● Desmos Tool
1 block
7.G.6
10.3 Surface areas of pyramids
● Desmos Tool
1 block
7.G.6
10.4 Volumes of prisms
● Desmos Tool
1 block
7.G.6 10.5 Volumes of pyramids 1 block
7.G.3 10.6 Cross sections of three-
dimensional figures
1 block
Connecting concepts
Review
1 block
Ch 10 Test 1 block
Board Approved: February 7, 2019 39 | P a g e
Board First Read with Revisions: May 14, 2020
Unit of Study Terminology
Appendices: All Appendices and supporting material can be found in this course’s shell course
in the District’s Learning Management System.
Assessment Leveling Guide: A tool to use when writing assessments in order to maintain the
appropriate level of rigor that matches the standard.
Big Ideas/Enduring Understandings: Foundational understandings teachers want students to
be able to discover and state in their own words by the end of the unit of study. These are
answers to the essential questions.
Engaging Experience: Each topic is broken into a list of engaging experiences for students.
These experiences are aligned to priority and supporting standards, thus stating what students
should be able to do. An example of an engaging experience is provided in the description, but a
teacher has the autonomy to substitute one of their own that aligns to the level of rigor stated in
the standards.
Engaging Scenario: This is a culminating activity in which students are given a role, situation,
challenge, audience, and a product or performance is specified. Each unit contains an example of
an engaging scenario, but a teacher has the ability to substitute with the same intent in mind.
Essential Questions: Engaging, open-ended questions that teachers can use to engage students
in the learning.
Priority Standards: What every student should know and be able to do. These were chosen
because of their necessity for success in the next course, the state assessment, and life.
Supporting Standards: Additional standards that support the learning within the unit.
Topic: These are the main teaching points for the unit. Units can have anywhere from one topic
to many, depending on the depth of the unit.
Unit of Study: Series of learning experiences/related assessments based on designated priority
standards and related supporting standards.
Unit Vocabulary: Words students will encounter within the unit that are essential to
understanding. Academic Cross-Curricular words (also called Tier 2 words) are those that can be
found in multiple content areas, not just this one. Content/Domain Specific vocabulary words are
those found specifically within the content.