Embed Size (px)
Citation preview

7th IEA-IEF-OPEC Outlook SymposiumComparative Analysis Findings
Riyadh| February 15 | 2017
Richard G. Newell, President, Resources for the Future
Flow
1. Short-term IEA and OPEC outlooks
2. Medium-term IEA and OPEC outlooks
3. Long-term IEA and OPEC outlooks
4. Key remaining differences
5. Remarks on outlook comparability

Flow
1. Short-term IEA and OPEC outlooks
2. Medium-term IEA and OPEC outlooks
3. Long-term IEA and OPEC outlooks
4. Key remaining differences
5. Remarks on outlook comparability

Short-term World Liquids Demand: 2015-2017
A 1.7 mb/d difference in base year 2015 liquids demand creates significant demand forecast differences

IEA and OPEC made modest adjustments to liquids demand growth forecasts during 2016, mostly in OECD countries
Monthly Revisions of Annual Estimates for 2016 World, OECD, and Non-OECD Liquids Demand Growth

Short-term World Liquids Demand Annual Growth
Differences in annual demand growth estimates relate to both Non-OECD Asia and OECD Americas

Monthly Revisions of Annual Estimates for 2016 Non-OPEC Liquids Supply Growth
Non-OPEC liquids supply growth forecasts have been revised downwards during 2016

Short-term Non-OPEC Liquids Supply Annual Growth
Short-term forecasts of non-OPEC supplies show negative growth in 2016 followed by modest gains in 2017

Short-term Liquids Supply Net Annual Growth Forecasts
2016 and 2017 supply growth is led by OPEC, OECD Americas and non-OECD producers recover somewhat in 2017

Flow
1. Short-term IEA and OPEC outlooks
2. Medium-term IEA and OPEC outlooks
3. Long-term IEA and OPEC outlooks
4. Key remaining differences
5. Remarks on outlook comparability

Medium-term Oil Price Assumptions (nominal US$)
Medium-term price assumptions diverge by $11 to $20/bblthrough 2021
80
65

Medium-term Liquids Demand
IEA projects demand growth to be slightly faster and reach higher levels than OPEC
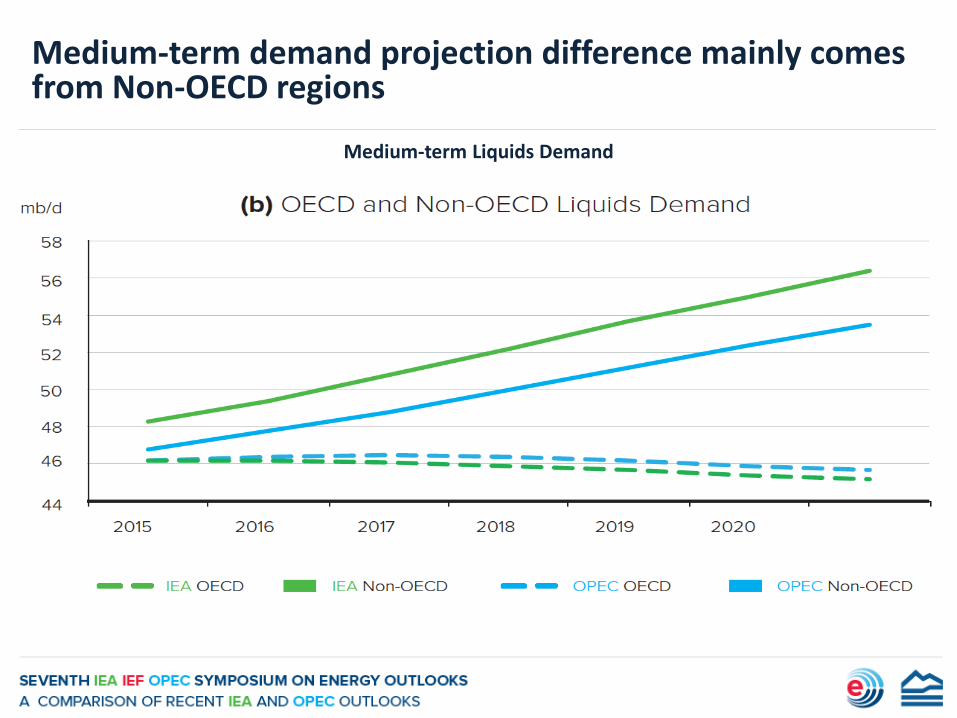
Medium-term Liquids Demand
Medium-term demand projection difference mainly comes from Non-OECD regions

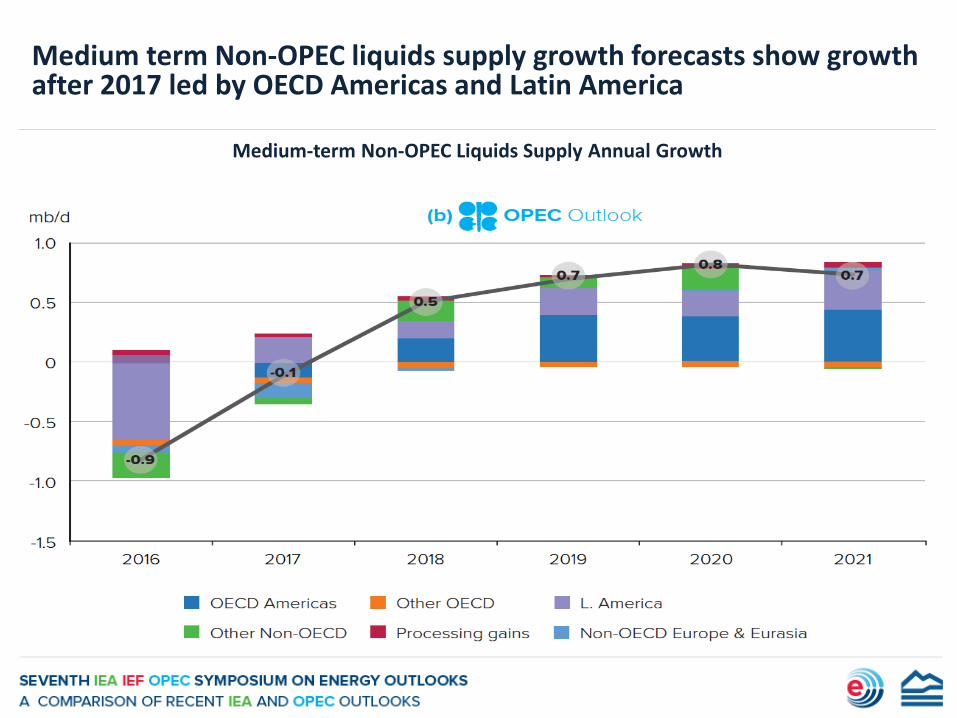
Medium-term Non-OPEC Liquids Supply Annual Growth
Medium term Non-OPEC liquids supply growth forecasts show growth after 2017 led by OECD Americas and Latin America
Medium-term Non-OPEC Liquids Supply Annual Growth
Medium term Non-OPEC liquids supply growth forecasts show growth after 2017 led by OECD Americas and Latin America

Medium-term US and Canadian Oil Supply (excluding biofuels)
IEA and OPEC differ on US and Canadian supply growth outlooks

Flow
1. Short-term IEA and OPEC outlooks
2. Medium-term IEA and OPEC outlooks
3. Long-term IEA and OPEC outlooks
4. Key remaining differences
5. Remarks on outlook comparability

Long-term GDP Growth Assumptions for Selected Regions
Global GDP projections show significant differences for China, India, and Russia after 2030

Long-Term Oil Price Assumptions (real 2015 US$/bbl)
IEA’s long-term oil price assumptions are substantially higher than those of OPEC

World Primary Energy in 2014 and Outlook for 2040 (mboe/d)
OPEC’s Reference Case is close to IEA’s Current Policies Scenario estimate of total primary demand
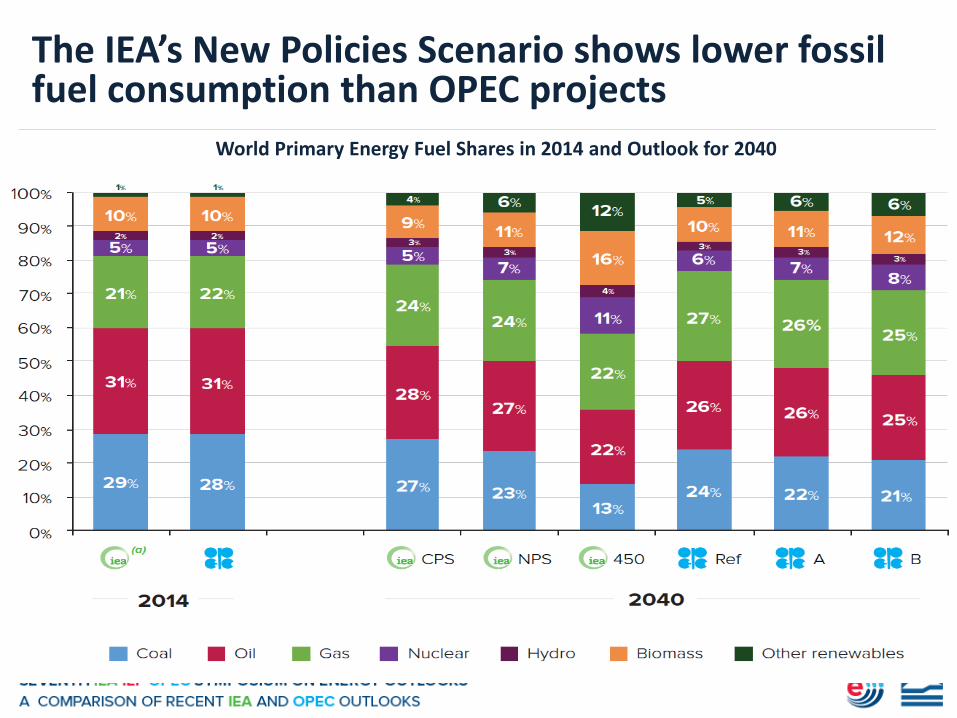
World Primary Energy Fuel Shares in 2014 and Outlook for 2040
The IEA’s New Policies Scenario shows lower fossil fuel consumption than OPEC projects
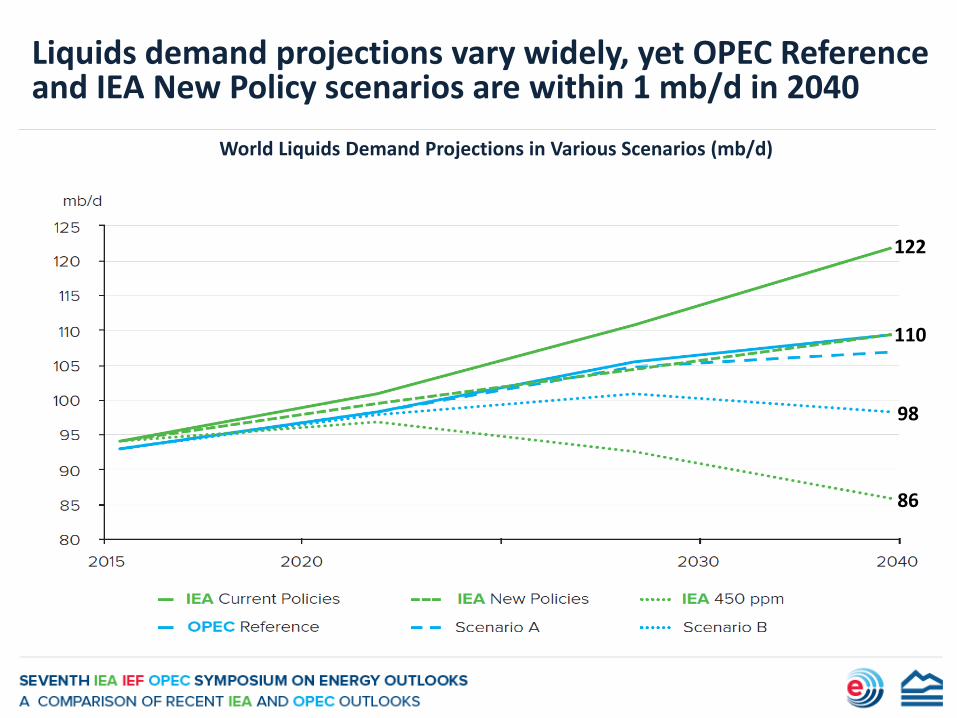
World Liquids Demand Projections in Various Scenarios (mb/d)
Liquids demand projections vary widely, yet OPEC Reference and IEA New Policy scenarios are within 1 mb/d in 2040
122
110
86
98

OECD and Non-OECD Shares of Liquids Demand in 2015 and Outlook for 2040
Outlooks for the share of OECD and Non-OECD demand are strikingly similar across all scenarios

Non-OPEC conventional supply declines but unconventional supply grows
Liquids Supply Sources in 2015 and Outlook for 2040 (mb/d)
6.9
32.2 43.6
11.2

The share of OPEC crude grows in all scenarios
Share of Liquids Supply by Types in 2015 and Outlook for 2040

Long-term oil supply scenarios vary strongly, yet similar projections for OPEC Reference and IEA New Policies scenarios
2040 Liquids Supply Outlook in Different Scenarios (mb/d)

Flow
1. Short-term IEA and OPEC outlooks
2. Medium-term IEA and OPEC outlooks
3. Long-term IEA and OPEC outlooks
4. Key remaining differences
5. Remarks on outlook comparability

Key remaining differences in IEA OPEC outlooks
• World liquids baseline demand and supply differ by 1.7 mb/d and 1.4 mb/d, respectively
• Different publication dates of medium-term outlooks make direct comparisons difficult
• Different units (mb/d, mboe/d, mtoe), and sometimes unclear conversion factors between units
• Different treatment of biofuels/bunkers within global versus regional liquids supply
• Different regional groupings, in particular separate OPEC treatment of member country demand in medium-term projections
• Different conception of “central” policy scenarios
• Oil price assumptions
Flow
1. Short-term IEA and OPEC outlooks
2. Medium-term IEA and OPEC outlooks
3. Long-term IEA and OPEC outlooks
4. Key differences and similarities
5. Remarks on outlook comparability
IEA and OPEC in the context of other long-term energy outlooks
30Richard G. Newell, Feb. 15, 2017, Riyadh

Challenges in comparing IEA and OPEC projections to other energy outlooks
31
Some challenges similar to comparison of IEA and OPEC• Different primary energy units and fuel-specific physical units• Different categorization of biofuels and renewable power• Different regional groupings• Different assumptions for policy and about economic growth
Plus, several additional challenges• Assumptions about energy content of fossil fuels can vary by 1-12%• Different conversion factors for renewables and nuclear can alter
primary energy estimates for these sources by -65% to +153%• Omission of traditional non-marketed biomass by U.S. EIA and BP
leads to primary energy consumption estimates that are 10-16% lower than other outlooks
Richard G. Newell, Feb. 15, 2017, Riyadh

0
100
200
300
400
500
600
BP U.S. EIA ExxonMobil IEA OPEC
quadrillion Btu2014 Primary Energy Consumption
Non-hydroRenewables
Hydro
Nuclear
Coal
Gas
Liquids
Differences in baseline primary energy consumption data exist among various long-term outlooks
32
* *
* BP and U.S. EIA do not include non-marketed energy
Richard G. Newell, Feb. 15, 2017, Riyadh

Future energy consumption growth varies widely across energy outlook scenarios, depending largely on policy assumptions
33
2014/15-2040 growth range
Outlook sources: IEA 2016, OPEC 2016, US EIA 2016, BP 2016, ExxonMobil 2017, Shell 2013. Note that U.S. EIA and BP estimates omit non-marketed biomass.
43%
9%
//
Richard G. Newell, Feb. 15, 2017, Riyadh

0%
20%
40%
60%
80%
100%
Renewables
Nuclear
Natural gas
Liquids
Coal
Global fuel shares: history and future scenarios
34
EIA and BP omit non-marketed biomass
2040
1950 data from Grubler (2008). 1980 and 2010 data from IEA (2014). Outlook sources: IEA 2016, OPEC 2016, US EIA 2016, BP 2016, ExxonMobil 2017, Shell 2013.
Richard G. Newell, Feb. 15, 2017, Riyadh

Liquids consumption growth shifts decisively to the East
35
mb/d
Outlook sources: IEA 2016, OPEC 2016, US EIA 2016, BP 2016, ExxonMobil 2017, Shell 2013. Note that U.S. EIA and BP estimates omit non-marketed biomass.
Richard G. Newell, Feb. 15, 2017, Riyadh