Embed Size (px)
Citation preview

7th International Conference on
Wind Turbine Noise Rotterdam - 2nd to -5th May 2017
An Experimental Parametric Study of Airfoil Trailing Edge
Serrations
T. Carolus University of Siegen , 57068 Siegen, Germany
E-Mail: [email protected]
F. Manegar University of Siegen, 57068 Siegen, Germany
E-Mail: [email protected]
E. Thouant École Centrale de Lyon, Lyon, France
E-Mail: [email protected]
K. Volkmer University of Siegen , 57068 Siegen, Germany
E-Mail: [email protected]
I. Schmich-Yamane Électricité de France, Grenoble, France
E-Mail: [email protected]
ABSTRACT Self-noise of an airfoil arises due to different mechanisms. In applications such as wind turbines the turbulent boundary layer interacting with the trailing edge is thought to be the dominant mechanism. In this study, a parametric study of add-on sawtooth type trailing edge serrations is carried out for trailing edge noise reduc-tion. The main parameters which are known to control the performance of this trailing edge serrations type are the height and width of the serration teeth (i.e., amplitude and wavelength, respectively). Several parameters have been inves-tigated experimentally in an aero-acoustic wind tunnel at the University of Siegen on a Somers S834 airfoil section. These parameters include the two main pa-rameters mentioned above as well as orientation, thickness and the side on the airfoil, where serrations are attached. The experimental results show a maximum noise reduction for thin, long and narrow serration teeth, attached on the pressure side and oriented along the wake of the airfoil.

2
1. INTRODUCTION Wind energy is a renewable source of energy and wind turbines convert energy
without causing substantial adverse effects to the environment. However, the wide spread of wind turbines near densely populated regions is restricted mainly due to the emitted noise. Studies conducted to identify the noise sources from wind turbines have revealed that the dominant noise source is the flow induced trailing edge noise (TEN) [1]. An airfoil immerged in a flow emits TEN when the turbulent structures within the turbulent boundary layer (TBL) convect past the trailing edge (TE). These turbulent structures are scattered and radiated into the free field because of the edge discontinuity. TEN is broadband in nature [1].
Noise reduction techniques for TEN have been investigated since almost half a century now. They are classified into two types, active and passive. Some active techniques involve trailing edge blowing [2] and trailing edge suction [3]. Exam-ples of passive techniques are the inclusion of porous trailing edges [4], serra-tions [5] and brushes [6] at the TE. Noise reduction techniques for wind turbines considering the practical constraints, converge towards trailing edge serrations (TES).
HOWE [7] contributed to the understanding of the effect of TES by deriving an analytical noise radiation model for low Mach number (Ma) flows to predict the noise reduction caused by sawtooth serrations on an infinite flat plate airfoil at zero angle of attack. More about HOWE's theory will be discussed in chapter 2. Many experimental works reported large deviations between the noise reduction experimentally achieved with TES and the noise reduction predicted with HOWE's model [5, 8-10]. LYU et al. [11] developed a new theoretical model and compared it with HOWE's model. In LUY's model the convection effects are incorporated in the convected wave equation, thereby making the model valid for all Ma numbers. In addition, by taking the effects of incident wall pressure gust into consideration the model tends to narrow down the deviation with the experiments. It was also enlightened that noise reduction is caused due to the destructive interference, i.e., out-of-phased scattered pressure in the vicinity of the TE.
JONES et al. [12] conducted direct numerical simulations (DNS) of the flow around a NACA-0012 airfoil with and without TES to understand the physical mechanism of TES. Two serration geometries were investigated, one with an amplitude 2h (see Fig. 1) equal to the boundary layer thickness at the TE (named as short) and another one with an amplitude of 2 (named as long), with wavelength being constant for both designs. Compared to the short TES the long TES provided higher noise reduction for all frequencies. The short TES pro-vided less noise reduction and this only in a finite frequency range, above which the noise level increased. An interesting observation in this study was that the aerodynamic properties remained unchanged upstream of the TE for both cases, with and without TES. Hence the noise reduction is attributed to be caused due to the changes in scattering process and also due to the changes in the aerody-namic behavior in the direct vicinity of the serrations.
GRUBER [5] who did an extensive study of TES showed that the noise reduc-tion is due to the reduction of phase speed at which the turbulence is convected near the sawtooth edges. In addition to that, a reduction of coherence of pressure measured along the sawtooth is also reported in the frequency band where noise reduction happens. OERLEMANS et al. [10] measured noise emission of a large scale wind turbine with one optimized blade, with serrations on another blade and the third blade remaining unaltered. His findings were that serrations resulted in a noise reduction of 2 – 3 dB; at higher frequencies a noise increase was observed,
3
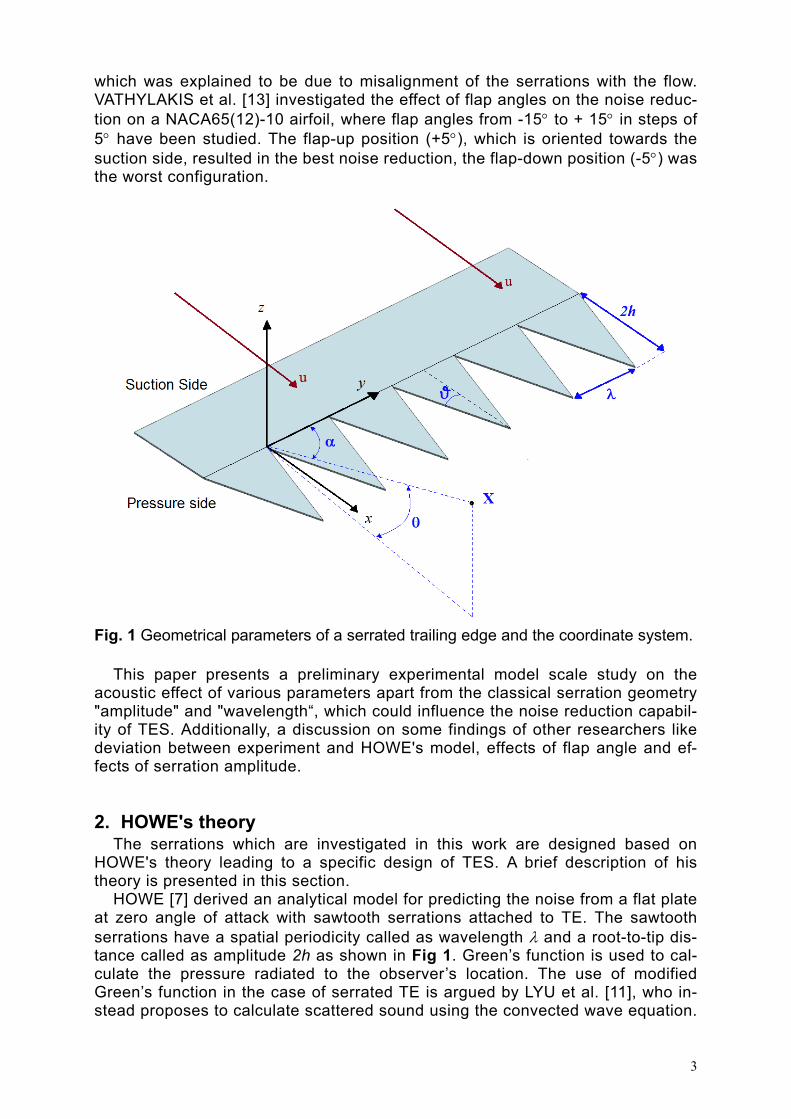
which was explained to be due to misalignment of the serrations with the flow. VATHYLAKIS et al. [13] investigated the effect of flap angles on the noise reduc-tion on a NACA65(12)-10 airfoil, where flap angles from -15 to + 15 in steps of 5 have been studied. The flap-up position (+5), which is oriented towards the suction side, resulted in the best noise reduction, the flap-down position (-5) was the worst configuration.
Fig. 1 Geometrical parameters of a serrated trailing edge and the coordinate system.
This paper presents a preliminary experimental model scale study on the
acoustic effect of various parameters apart from the classical serration geometry "amplitude" and "wavelength“, which could influence the noise reduction capabil-ity of TES. Additionally, a discussion on some findings of other researchers like deviation between experiment and HOWE's model, effects of flap angle and ef-fects of serration amplitude.
2. HOWE's theory The serrations which are investigated in this work are designed based on
HOWE's theory leading to a specific design of TES. A brief description of his theory is presented in this section.
HOWE [7] derived an analytical model for predicting the noise from a flat plate at zero angle of attack with sawtooth serrations attached to TE. The sawtooth serrations have a spatial periodicity called as wavelength and a root-to-tip dis-tance called as amplitude 2h as shown in Fig 1. Green’s function is used to cal-culate the pressure radiated to the observer’s location. The use of modified Green’s function in the case of serrated TE is argued by LYU et al. [11], who in-stead proposes to calculate scattered sound using the convected wave equation.

4
This is the reason why HOWE’s model is valid only for low Ma numbers, because it neglects the effects of convection (the direct radiation to the far field due to the quadrupole sources in the boundary layer). HOWE also assumes that the prop-erties of turbulence remain the same before and after the TE within the boundary layer, in other words, he assumes a frozen turbulence.
Using CHASE’s [14] model for wavenumber frequency spectrum of the blocked wall pressure inside the turbulent boundary layer, the far-field sound power spectrum at the observer point at a distance |X| from TE is given as in eq. (1)
22
22*
0
,sin sin
2mC
lc
, (1)
where is the fluid density, l is the span, c0 is the speed of sound, is the tur-bulent boundary layer thickness, and are respectively polar and azimuthal observer angles, = 2f, where f is the frequency, skin friction coefficient * 0.03 ;u 0.1533, 0.133mC are constants and the convection velocity is
0.7cU u . The non-dimensional edge noise spectrum is
11 , , ; ,
2 c
h hf
U
where
32
2 2 2 2
22
264 cosh cos1
, , ; 1sinh
, 1 4 , , 1.332
c
c
c
hh c ah Uh hf
U ab a ab c a
a b h cU
The normalized spectra 10log dB for /h = 0.25, 1, 5 and h/ = 1 and
h/ = 3, along with the spectrum for unserrated edge (not defined here, refer [7]) are plotted in Fig 2.
The important factors which control the noise reduction mechanism according to HOWE are as follows:
1) Noise reduction takes place when the non-dimensional frequency /u is larger than 1.
2) The angle between mean flow and the local tangent to the wetted region should be less than 45º, i.e., the sharper the serrations, the higher the noise reduction.
3) Higher noise reductions occur when the dimensions of the serrations are of the order of the turbulent boundary layer thickness and more.

5
Fig. 2 HOWE's model: Normalized acoustic pressure frequency spectrum for unser-
rated and serrated edge as a function of /h and h/ .
3. Experimental setup
3.1 Airfoil investigated and aero-acoustic wind tunnel The experimental investigation was carried out with SOMERS S834 airfoil
segment, with a chord length of 0.2 m and a span of 0.266 m in an aero-acoustic wind tunnel facility at the University of Siegen shown in Fig. 3. For an airfoil in a confined jet, it is essential to apply a correction factor for the angle of attack (AOA) as stated by BROOKS et al. [15]. This is due to the fact that the lifts pro-duced by an airfoil in a free stream and in a confined jet are not the same, as the finiteness of the jet leads to significant flow deflection. The effective AOA for this study has been chosen such that an infinitely long span of the airfoil has maxi-mum glide ratio. It has been calculated using XFOIL. The result is 4.7. On ap-plying the correction factor, the geometric AOA is obtained as 12.7.
The airfoil segment is mounted between the side plates at the end of the con-tracting nozzle. A centrifugal fan is used to create the desired flow rate and the air is passed through a series of screens, honeycomb and silencers. The aero-acoustic wind tunnel provides a maximum flow velocity u = 25.55 m/s. The chord based Reynolds number (Re) is 350000. In order to replicate or mimic the real conditions in a large wind turbine, a ten times higher Re has to be achieved. Hence the airfoil is tripped at the natural transition position that occur at 3.5106. The tripping positions are calculated using XFOIL and a zig zag trip is applied along the complete span at 34 mm from the leading edge (LE) on the suction side (SS) and 152 mm from the LE on the pressure side (PS).
3.2 Acoustic measurement The wind tunnel exhausts in a semi-anechoic chamber which allows the acoustic measurements according to ISO 3745. The cut-off frequency of the chamber is 125 Hz. The dimensions of the semi-anechoic chamber are 4.5 m x 3.23 m x

6
2.9 m. The turbulence intensity of the jet is 0.2 % at a plane 0.01 m downstream the exit of the nozzle. The floor in the chamber is reflective and has an opening covered with grid, through which the flow recirculates. More details about the semi-anechoic chamber can be read in [16].
Fig. 3 Schematic diagram of aero-acoustic wind tunnel (not to scale)
Three microphones (1/2'' Brüel & Kjaer TM, type 4190) are used to measure
synchronously the noise being emitted from the airfoil. The microphones are covered with wind screens to avoid any flow induced pseudo sound and are lo-cated at a distance of 2.5 times chord (500 mm) from the TE as shown in Fig 4. All measurements are captured with a sampling rate of fs = 51.2 kHz. The spectral analysis is based on the power spectral density Spp obtained using the pwelch routine in Matlab™ Vers. R2014b (fref = 1 Hz, p0 = 210-5 Pa). LSpp is defined as shown in eq. (2)
pp refSpp
S fL f
p20
10 lg
[dB] (2)
Fig. 4 Left: Schematic diagram of microphone locations, right: Microphones in semi
anechoic chamber. During TEN measurements the background noise due to the wind tunnel con-
taminates the acoustic signature of the airfoil Therefore, the measurements were

7
done once with the reference airfoil and once without, to estimate the influence of the background noise. The Lspp spectrum of all three microphones averaged is shown in Fig 5. It has to be noticed that the signal to noise ratio is bad in fre-quency ranges above 3000 Hz, i.e., the background noise is too high in these frequency to separate airfoil from background noise. Hence in this study, the in-vestigations of TES will be only displayed in a frequency range from 200 Hz to 3000 Hz.
Fig. 5 Lspp of reference airfoil and background noise at microphone locations as shown
in Fig. 4 (average of 3 microphones).
3.3 Serrations investigated As mentioned earlier, the serrations in this study are designed based on
HOWE's theory and the following two parameters are defined to design the ser-ration:
The relative length h/, where h is half of serration's amplitude and is the boundary layer thickness at the TE, which is obtained from the ex-perimental results of reference airfoil for the same flow characteristics conducted by GERHARD [17]. The here used value of is 9 mm.
The relative wavelength /h, where being serration's wavelength. To achieve noise reduction, the designed serrations must satisfy the following
two conditions stated by HOWE: 1 < h/ |< 10 /h < 4 or < 45
Before the various designs were investigated, a parametric study of three fol-lowing important parameters was carried out:
Fixation side: The side on which serrations are glued. Orientation: The angle the serration makes with respect to the camber
line of the airfoil. The serrations oriented towards the suction side (SS) have positive values of and the serrations oriented towards the pres-sure side (PS) have negative values of . The serration aligned to camber line has = 0. Orientation angles between +15 and -15 in steps of -5 have been investigated.
8
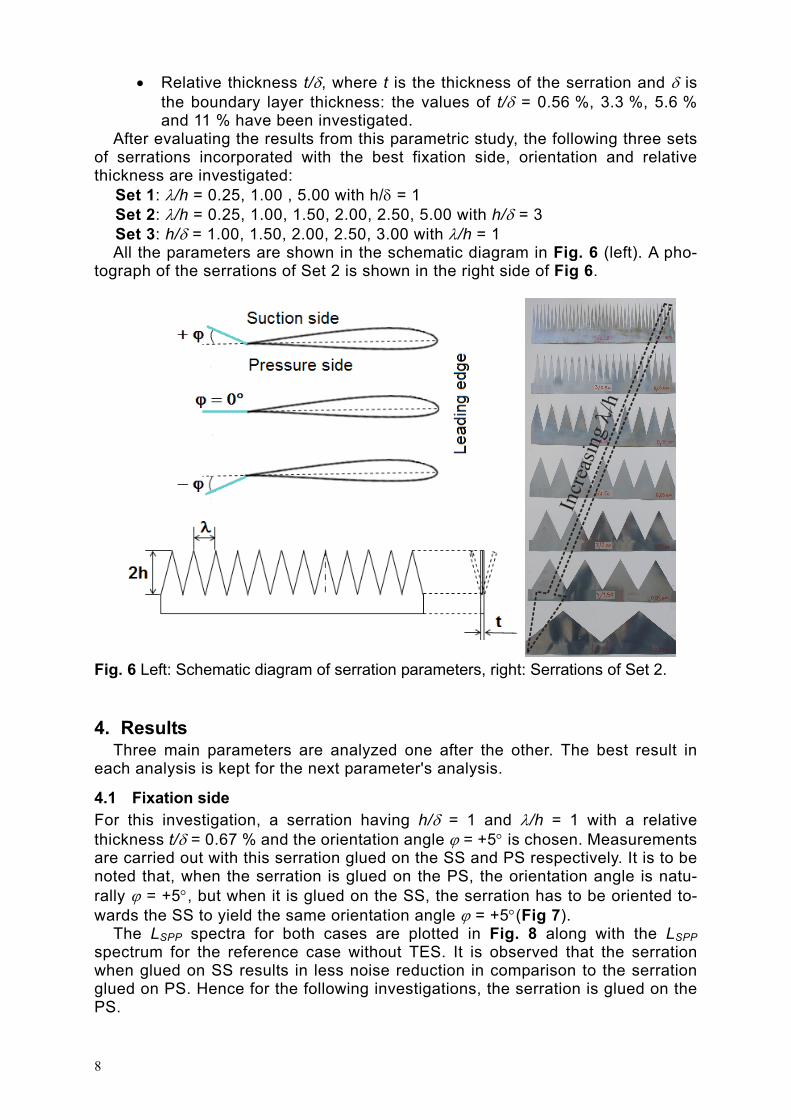
Relative thickness t/, where t is the thickness of the serration and is the boundary layer thickness: the values of t/ = 0.56 %, 3.3 %, 5.6 % and 11 % have been investigated.
After evaluating the results from this parametric study, the following three sets of serrations incorporated with the best fixation side, orientation and relative thickness are investigated:
Set 1: /h = 0.25, 1.00 , 5.00 with h/ = 1 Set 2: /h = 0.25, 1.00, 1.50, 2.00, 2.50, 5.00 with h/ = 3 Set 3: h/ = 1.00, 1.50, 2.00, 2.50, 3.00 with /h = 1 All the parameters are shown in the schematic diagram in Fig. 6 (left). A pho-
tograph of the serrations of Set 2 is shown in the right side of Fig 6.
Incr
easi
ngh
Fig. 6 Left: Schematic diagram of serration parameters, right: Serrations of Set 2.
4. Results Three main parameters are analyzed one after the other. The best result in
each analysis is kept for the next parameter's analysis.
4.1 Fixation side For this investigation, a serration having h/ = 1 and /h = 1 with a relative thickness t/ = 0.67 % and the orientation angle = +5 is chosen. Measurements are carried out with this serration glued on the SS and PS respectively. It is to be noted that, when the serration is glued on the PS, the orientation angle is natu-rally = +5, but when it is glued on the SS, the serration has to be oriented to-wards the SS to yield the same orientation angle = +5(Fig 7).
The LSPP spectra for both cases are plotted in Fig. 8 along with the LSPP spectrum for the reference case without TES. It is observed that the serration when glued on SS results in less noise reduction in comparison to the serration glued on PS. Hence for the following investigations, the serration is glued on the PS.

9
Fig. 8 Effect of fixation side of serrations.
4.2 Orientation For this investigation, a serration having h/ = 1 and /h = 1 with a relative
thickness of t/ = 3.3 % is chosen and glued on the PS. Measurements are carried out for orientation angles = +15 to -15 in steps of -5. As mentioned earlier, the serrations orienting towards SS have positive values of and the serrations orienting towards PS have negative values of . The serration aligned to the camber line has an angle = 0. The results are presented in three figures. First a comparison of = +15, 0 and -15 is shown in Fig 9a. It is to be noted that the serration oriented towards SS ( = +15) brings a potential reduction only beyond 600 Hz. On the contrary, the serration oriented towards PS ( = -15) in-creases noise emission beyond 600 Hz. The serration aligned with camber line ( = 0) reduces the TEN almost in the entire frequency range displayed. In Fig. 9b, the comparison of = -10, 0 and 10 is shown. The same tendency is observed here except for the fact that the frequency at which the change of behavior hap-pens is shifted to 750 Hz, which was 600 Hz in the previous case.
Fig. 7 Schematic diagram of different fixation sides of TES.

10
a)
b)
c)
Fig. 9 Effect of orientation angle .
The serration aligned with the camber line ( = 0) seems to be still the best
configuration. Finally the comparison of = -5, 0 and +5 is shown in Fig 9c. Here it is observed that, all three orientation angle reduce the noise emission and the best noise reduction is provided by the serration with = -5. This is contra-dicting with the results presented by VATHYLAKIS et al. [13]. However, for the next investigations, the orientation angle = +5 will be implemented, because to achieve = -5, the serrations have to be bent manually towards the SS and the risks of misaligning some of the tooth is high, whereas with = +5 the serrations
11
need to be glued on the PS and requires no further bending.
4.3 Relative thickness Another interesting parameter to be investigated is the relative thickness of the
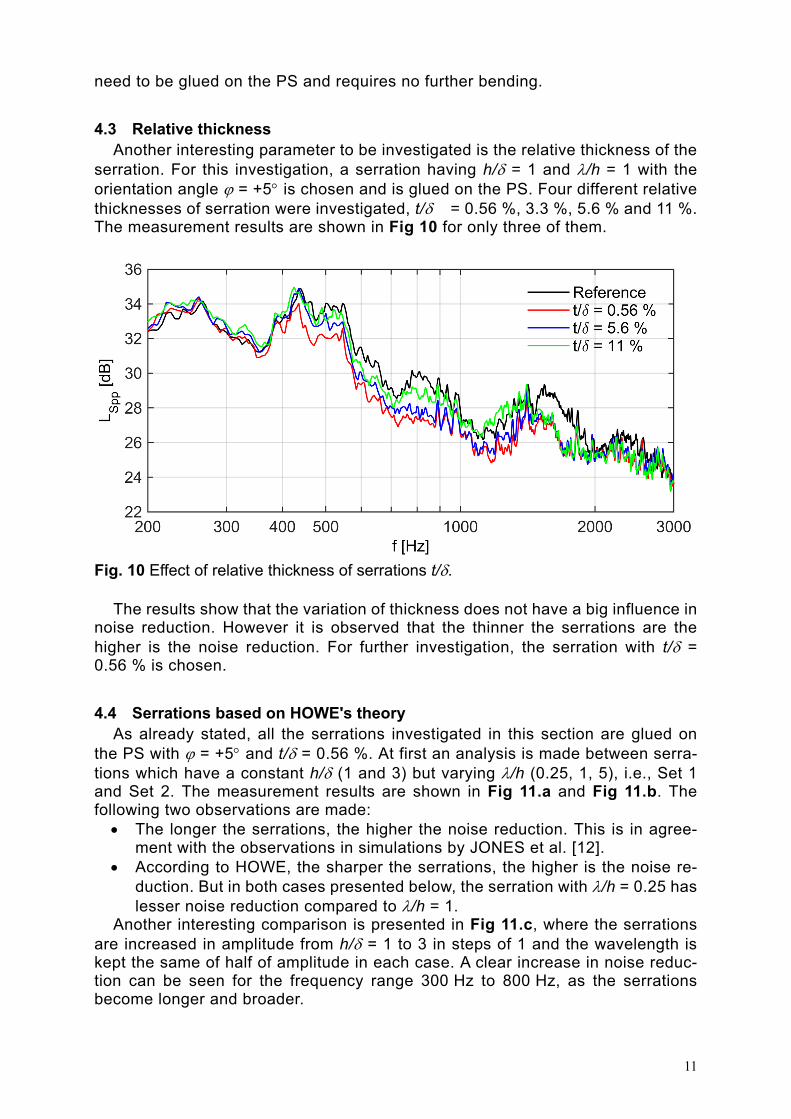
serration. For this investigation, a serration having h/ = 1 and /h = 1 with the orientation angle = +5 is chosen and is glued on the PS. Four different relative thicknesses of serration were investigated, t/ = 0.56 %, 3.3 %, 5.6 % and 11 %. The measurement results are shown in Fig 10 for only three of them.
Fig. 10 Effect of relative thickness of serrations t/.
The results show that the variation of thickness does not have a big influence in
noise reduction. However it is observed that the thinner the serrations are the higher is the noise reduction. For further investigation, the serration with t/ = 0.56 % is chosen.
4.4 Serrations based on HOWE's theory As already stated, all the serrations investigated in this section are glued on
the PS with = +5 and t/ = 0.56 %. At first an analysis is made between serra-tions which have a constant h/ (1 and 3) but varying /h (0.25, 1, 5), i.e., Set 1 and Set 2. The measurement results are shown in Fig 11.a and Fig 11.b. The following two observations are made: The longer the serrations, the higher the noise reduction. This is in agree-
ment with the observations in simulations by JONES et al. [12]. According to HOWE, the sharper the serrations, the higher is the noise re-
duction. But in both cases presented below, the serration with /h = 0.25 has lesser noise reduction compared to /h = 1.
Another interesting comparison is presented in Fig 11.c, where the serrations are increased in amplitude from h/ = 1 to 3 in steps of 1 and the wavelength is kept the same of half of amplitude in each case. A clear increase in noise reduc-tion can be seen for the frequency range 300 Hz to 800 Hz, as the serrations become longer and broader.

12
a)
b)
c)
Fig. 11 Effect of "amplitude" and "wave length" of serrations; a) set 1, b) set 2, c)
set 3. The results of other investigated serrations are not shown here. The serration
which brought about the least noise reduction was h/ = 1 and /h = 0.25. The best serration is the one with h/ = 3 and /h = 1. With this geometry a noise re-duction of 3 dB was achieved in the frequency range from 300 Hz to 900 Hz with a maximum of 5 dB noise attenuation at the TE peak around 500 Hz. This finding corresponds to GRUBER's [5] who also reported that the serrations with h/ > 2

13
yield the maximum noise reduction. However, the increase in noise beyond f/u > 1, as reported by Gruber, was not observed here due to the insufficient sig-nal-to-noise ratio.
5. Conclusion In this study a variety of triangular type trailing edge serrations have been de-
signed based on HOWE's theory and eventually investigated in model scale ex-periments. On top of the classical design parameters h/ and /h, more techno-logical parameters have been investigated. The outcome was that it is beneficial to glue the serration on the pressure side rather than the suction side and to keep the thickness at 0.05 mm (i.e., t/ = 0.56 %). The best angle of orientation is = +5, which means the serration is oriented towards the pressure side, aligning most probably with the wake, which has not been quantified in this study. The investigation of various serrations based on HOWE's theory showed that the serrations having h/ = 3 and /h = 1 bring best results. Previous predictions that smaller values of /h result in better noise reduction could not be confirmed within this study.
ACKNOWLEDGEMENTS
The authors would like to thank Michel Roger (École Centrale de Lyon) and Marlene Sanjose (University of Sherbrooke) for their technical advice and also the workshop at University of Siegen for manufacturing the serrations. Part of this work has been funded by the Federal Ministry for Economic Affairs and Energy of Germany (BMWi) within the project RENEW (FKZ 0325838B).
REFERENCES
[1] OERLEMANS, S., SIJTSMA, P., MÉNDEZ LÓPEZ, B.M., 2007, ''Location and quantifi-
cation of noise sources on a wind turbine'', Journal of Sound and Vibration, 299: 869-883.
[2] GERHARD, T., ERBSLÖH, S., CAROLUS, T., 2014, ''Reduction of airfoil trailing edge noise by trailing edge blowing'', Journal of Physics, 524: 012123.
[3] WOLF, A., LUTZ, T.H., WURZ, W., KRAMER, E., STALNOV, O., SEIFERT, A., 2015, ''Trailing edge noise reduction of wind turbine blades by active flow control'', Wind Energy 18, 909.
[4] SARRADJ, E., GEYER, T., 2007, ''Noise generation by porous airfoils'', 28th AIAA Aeroacoustics Conference. 2007-3719.
[5] GRUBER, M., 2012, ''Airfoil noise reduction by edge treatments'', Ph. D. thesis. [6] HERR, M., 2013, ''Trailing edge noise - Reduction concepts and scaling laws'',
Ph. D. thesis. [7] HOWE, M.S., 1991, ''Noise produced by a sawtooth trailing edge'', The Journal of
the Acoustical Society of America, 90: 482-487. [8] DASSEN, A.G.M., PARCHEN, R., BRUGGEMAN, J., HAGG, F., 1996, ''Results of a wind
tunnel study on the reduction of airfoil self-noise by the application of serrated blade trailing edges'', Proceeding of the European Union Wind Energy Confer-ence and Exhibition, pp. 800-803.
[9] PARCHEN, R., HOFFMANS, W., GORDNER, A., BRAUN, K., 1999, ''Reduction of airfoil self-noise at low Mach number with a serrated trailing edge'', 6th International

14
Congress on Sound and Vibration, pp. 3433-3440.
[10] OERLEMANS, S., FISHER, M., MAEDER, T., KÖGLER, K., 2009, ''Reduction of wind turbine noise using optimized airfoils and trailing-edge serrations'', AIAA Journal, Vol. 47, pp. 1470-1481.
[11] LYU, B., AZARPEYVAND, M., SINAYOKO, S., 2015, ''A trailing-edge noise model for serrated edges'', 21st AIAA/CEAS Aeroacoustics Conference, pp. 1-24.
[12] JONES, L.E., SANDBERG, R.D., 2012, ''Acoustic and hydrodynamic analysis of the flow around an aerofoil with trailing-edge serrations'', Journal of Fluid Mechan-ics, Vol. 706, pp. 295-322.
[13] VATHYLAKIS, A., CHONG, T.P., PARUCHURI, C., JOSEPH, P. F., 2016, ''Acoustic and hydrodynamic analysis of the flow around an aerofoil with trailing-edge serra-tions'', 22st AIAA/CEAS Aeroacoustics Conference.
[14] CHASE, D.M., 1987, ''The character of the turbulent wall pressure spectrum at subconvective wavenumbers and a suggested comprehensive model'', Journal of Sound and Vibration, Vol. 112, pp. 125-147
[15] BROOKS, T.F., MARCOLINI, M.A., POPE, D.S., 1984, ''Airfoil trailing edge flow measurements and comparison with theory incorporating open wind tunnel cor-rections'', Proc. AIAA/NASA 9th Aeroacoustics Conference, 1-12.
[16] WINKLER, J., TEMEL, F.Z., CAROLUS, T., 2007, ''Concept, design and characteri-zation of a small aeroacoustic wind tunnel facility with application to fan blade measurements'', Fan Noise, pp. 1-12.
[17] GERHARD, T., 2015, ''Umströmte Tragflügelsegmente: Auswirkungen des Hin-terkantenausblasens auf Strömungsgrenzschicht und Schallemission'', Ph. D. thesis, Universität Siegen.