Embed Size (px)
Citation preview
STUDIES OF GLYCOGENMETABOLISMIN LIVER GLYCOGENDISEASE(VON GIERKE'S DISEASE): SIX CASESWITH SIMILAR METABOLIC
ABNORMALITIES ANDRESPONSESTO GLUCAGON*
BY JOSEPHE. SOKAL, CHARLESU. LOWE, EDWARDJ. SARCIONE, LUIS L.MOSOVICHAND BERNARDH. DORAYWITH THE TECHNICALASSISTANCEOF SYLVIA FLEISSNER ANDJOYCEGOLDSTEIN
(From the Division of Medicine, Roswell Park Memorial Institute and the Statler ResearchLaboratories of the Children's Hospital and the Department of Pediatrics,
The University of Buffalo School of Medicine, Buffalo, N. Y.)
(Submitted for publication July 8, 1960; accepted October 20, 1960)
Glycogen disease of the liver (von Gierke'sdisease) is a rare and incompletely understooddisorder of childhood. It is characterized by de-fective breakdown of liver glycogen to glucose.In most cases, excessive liver glycogen depositionoccurs, reaching levels as high as 14 to 17 percent of the wet liver weight (1, 2). Major clin-ical manifestations include hepatomegaly; fastinghypoglycemia, acidosis and ketosis; delayedgrowth and development, and increased morbiditywith even minor infections. The most severelyaffected children have usually died during infancy.Histologic studies of autopsy or biopsy specimensof liver reveal essentially normal architecture, buthepatic cells contain excessive amounts of glyco-gen and often, fat. The glycogen is usually normalin structure (3) and can be broken down to glu-cose by homogenates of normal animal or humanliver (2, 4, 5). Spontaneous breakdown of glyco-gen during in vitro incubation of liver tissue fromaffected children is deficient (2, 4, 6).
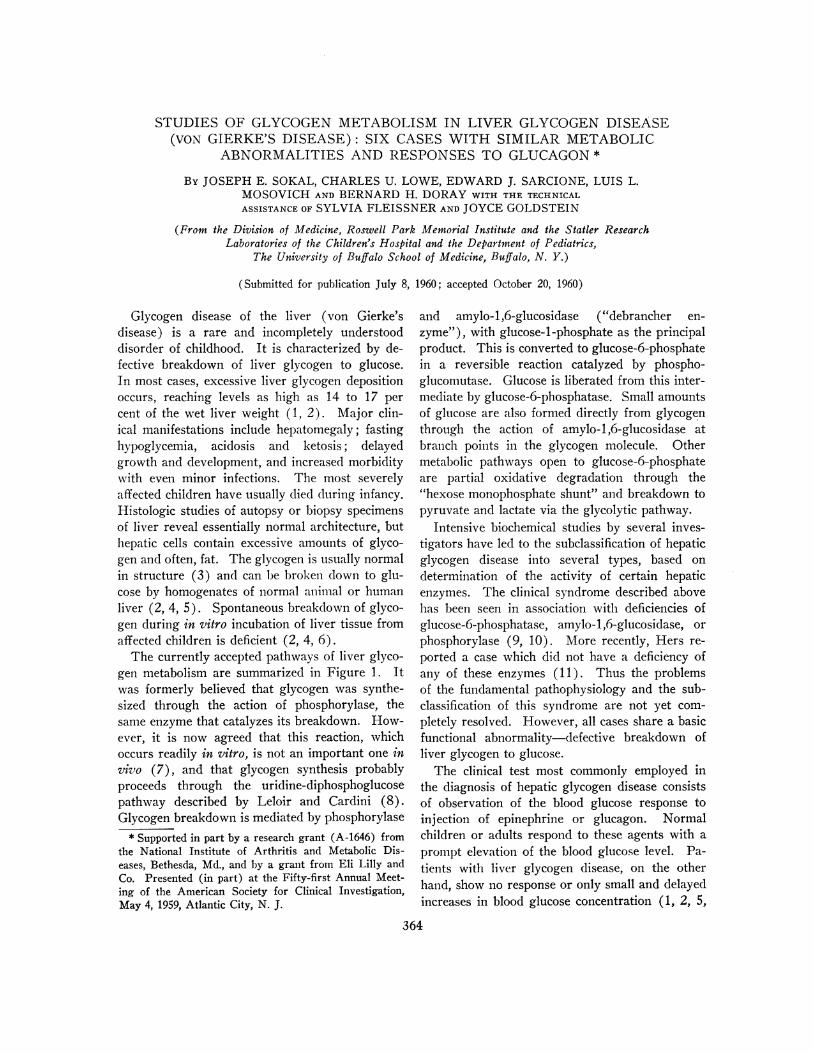
The currently accepted pathways of liver glyco-gen metabolism are summarized in Figure 1. Itwas formerly believed that glycogen was synthe-sized through the action of phosphorylase, thesame enzyme that catalyzes its breakdown. How-ever, it is now agreed that this reaction, whichoccurs readily in vitro, is not an important one invivo (7), and that glycogen synthesis probablyproceeds through the uridine-diphosphoglucosepathway described by Leloir and Cardini (8).Glycogen breakdown is mediated by phosphorylase
* Supported in part by a research grant (A-1646) fromthe National Institute of Arthritis and Metabolic Dis-eases, Bethesda, Md., and by a grant from Eli Lilly andCo. Presented (in part) at the Fifty-first Annual Meet-ing of the American Society for Clinical Investigation,May 4, 1959, Atlantic City, N. J.
and amylo-1,6-glucosidase ("debrancher en-zyme"), with glucose-l-phosphate as the principalproduct. This is converted to glucose-6-phosphatein a reversible reaction catalyzed by phospho-glucomutase. Glucose is liberated from this inter-mediate by glucose-6-phosphatase. Small amountsof glucose are also formed directly from glycogenthrough the action of amylo-1,6-glucosidase atbranch points in the glycogen molecule. Othermetabolic pathways open to glucose-6-phosphateare partial oxidative degradation through the"hexose monophosphate shunt" and breakdown topyruvate and lactate via the glycolytic pathway.
Intensive biochemical studies by several inves-tigators have led to the subclassification of hepaticglycogen disease into several types, based ondetermination of the activity of certain hepaticenzymes. The clinical syndrome described abovehas been seen in association with deficiencies ofglucose-6-phosphatase, amylo-1,6-glucosidase, orphosphorylase (9, 10). More recently, Hers re-ported a case which did not have a deficiency ofany of these enzymes (11). Thus the problemsof the fundamental pathophysiology and the sub-classification of this syndrome are not yet com-pletely resolved. However, all cases share a basicfunctional abnormality-defective breakdown ofliver glycogen to glucose.
The clinical test most commonly employed inthe diagnosis of hepatic glycogen disease consistsof observation of the blood glucose response toinjection of epinephrine or glucagon. Normalchildren or adults respond to these agents with aprompt elevation of the blood glucose level. Pa-tients with liver glycogen disease, on the otherhand, show no response or only small and delayedincreases in blood glucose concentration (1, 2, 5,
364
GLYCOGENMETABOLISMIN LIVER GLYCOGENDISEASE: EFFECT OF GLUCAGON
a7),O-t,4,40-GLYCOGEN
MPGtrarse phosphory/aseornylo- /, 6-glucosidose
URIDINE DIPNOSPNO GLUCOSE | \
I-G LUCOSE-I- P04Ig/ucose;6-
|§LUCO~~l| > 9 C phospholose lCUOI
HEXOSE-PO4|SHUNT-&
PAT
CITRICACID
FIG. 1. CURRENTLYACCEPTEDPATHWAYSOF LIVER GLY-
COGENSYNTHESIS AND BREAKDOWN.
12-14). This has been considered as evidencethat these hormones are ineffective or, at best, onlypartially effective in inducing hepatic glycogenoly-sis in this disease.
In the course of studies of glycogen depositiondiseases, we have encountered six cases of liverglycogen disease with similar metabolic abnor-malities and responses to glucagon. Observationsin one of these cases (J.B.) were reportedpreviously (15). The studies described belowsuggest that hepatic glycogenolysis occurred spon-
taneously in these patients in response to hypo-
glycemia and that injections of glucagon inducedrapid breakdown of liver glycogen. However, theprincipal end-product of hepatic glycogenolysisappeared to be lactate rather than glucose.
METHODSAND CLINICAL MATERIAL
Glucose was determined by the Nelson method (16).Lactate was determined by the Barker-Summersonmethod (17) and by an enzymatic method using lacticdehydrogenase (18). Both procedures gave similar re-
sults, but since the latter is more specific and proved tobe convenient and dependable, it was used for most ofthe determinations. Glycogen was determined by themethod of Good, Kramer and Somogyi (19), using theNelson technique for the determination of glucose afterhydrolysis.
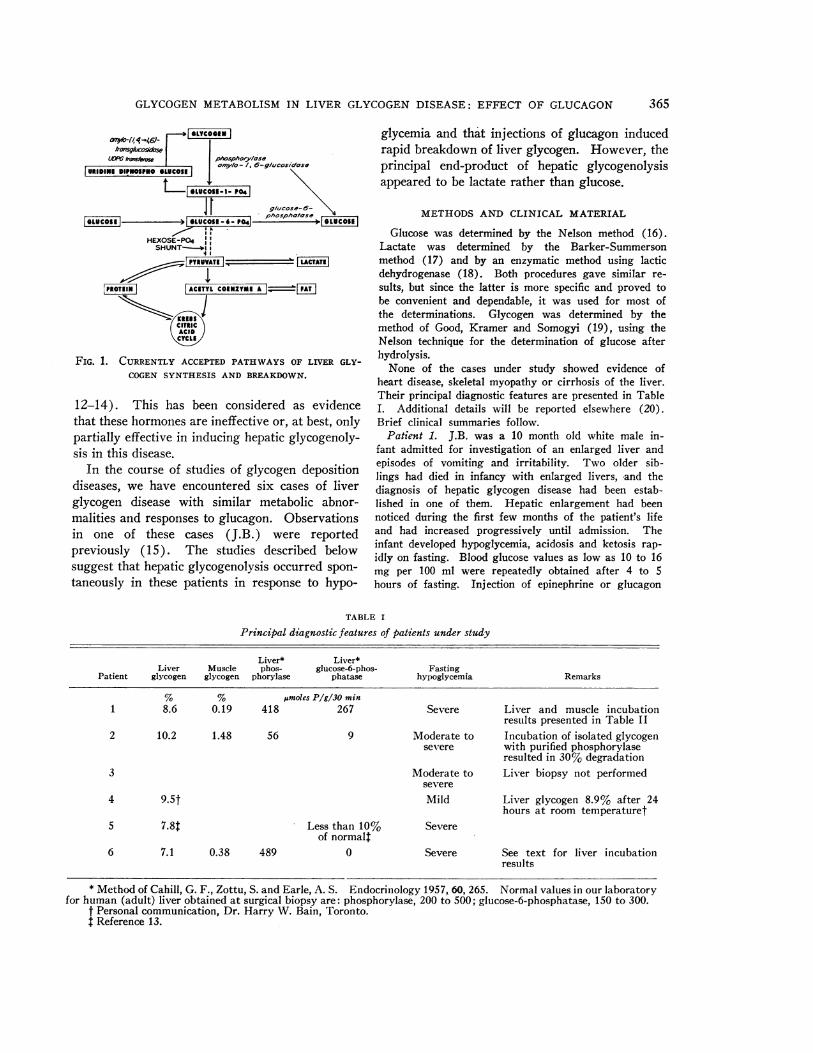
None of the cases under study showed evidence ofheart disease, skeletal myopathy or cirrhosis of the liver.Their principal diagnostic features are presented in TableI. Additional details will be reported elsewhere (20).Brief clinical summaries follow.
Patient 1. J.B. was a 10 month old white male in-fant admitted for investigation of an enlarged liver andepisodes of vomiting and irritability. TWO older sib-lings had died in infancy with enlarged livers, and thediagnosis of hepatic glycogen disease had been estab-lished in one of them. Hepatic enlargement had beennoticed during the first few months of the patient's lifeand had increased progressively until admission. Theinfant developed hypoglycemia, acidosis and ketosis rap-
idly on fasting. Blood glucose values as low as 10 to 16mg per 100 ml were repeatedly obtained after 4 to 5hours of fasting. Injection of epinephrine or glucagon
TABLE I
Principal diagnostic features of patients under study
Liver* Liver*Liver Muscle phos- glucose-6-phos- Fasting
Patient glycogen glycogen phorylase phatase hypoglycemia Remarks
% % ljmoles P/g/30 min1 8.6 0.19 418 267 Severe Liver and muscle incubation
results presented in Table II2 10.2 1.48 56 9 Moderate to Incubation of isolated glycogen
severe with purified phosphorylaseresulted in 30% degradation
3 Moderate to Liver biopsy not performedsevere
4 9.5t Mild Liver glycogen 8.9% after 24hours at room temperaturet
5 7.8t Less than 10% Severeof normalt
6 7.1 0.38 489 0 Severe See text for liver incubationresults
* Method of Cahill, G. F., Zottu, S. and Earle, A. S. Endocrinology 1957, 60, 265. Normal values in our laboratoryfor human (adult) liver obtained at surgical biopsy are: phosphorylase, 200 to 500; glucose-6-phosphatase, 150 to 300.
t Personal communication, Dr. Harry W. Bain, Toronto.I Reference 13.
365
SOKAL, LOWE, SARCIONE, MOSOVICHAND DORAY
produced slight or no rise in the blood glucose level. Hehad hyperlipemia. Laparotomy, and liver and musclebiopsy were performed. Histologic diagnosis was liverglycogen disease. Liver glycogen concentration was 8.6per cent.
Patient 2. S. J. was a 2 year old white female infant ad-mitted for investigation of a greatly enlarged liver. Anenlarged abdomen was noted soon after birth. Therewas no familial history of glycogen disease. Moderateto severe hypoglycemia was noted after overnight fasting;on two occasions values below 20 mg per 100 ml wererecorded. Mild acidosis and ketosis developed duringfasting. Subcutaneous inj ection of epinephrine resultedin little or no rise of blood glucose (maximal increase,16 mg per 100 ml). Injection of glucagon resulted insmall and delayed rises in blood glucose. She hadmoderate hyperlipemia. Laparotomy, and liver and mus-cle biopsy were performed. Histologic diagnosis wasliver glycogen disease. Liver glycogen concentrationwas 10.2 per cent.
Patient 3. Jay F. was a 6 year old white female ad-mitted with the diagnosis of hepatic glycogen disease.An older sibling (Patient 4) also had the disease. En-largement of the abdomen had been noticed at the age of4 months, and increasing hepatomegaly was recordedfrom the age of 7 months. The patient's growth was re-tarded but her mental development was normal. She hadbeen maintained in relatively good condition by very fre-quent feedings. However, her course was marked byepisodes of infection, acidosis, and severe epistaxis. Shewas an abnormally small child for her age, with a greatlyenlarged liver. She developed moderate to severe hypo-glycemia on fasting, with blood glucose levels falling aslow as 17 mg per 100 ml. Injection of epinephrine pro-duced an insignificant rise in the blood glucose concen-tration. Injection of glucagon resulted in a small anddelayed rise in the blood glucose level. Liver and musclebiopsies were not performed.
Patient 4. Jill F. was a 12 year old white female, theolder sister of Patient 3. The diagnosis of hepatic glycogendisease had been established at the age of 17 months byclinical studies and liver biopsy. Injection of epinephrineresulted in a maximal rise of 12 mg per 100 ml in theblood glucose concentration. Histologic diagnosis wasliver glycogen disease. Liver glycogen concentration was9.5 per cent; there was only slight glycogenolysis in thebiopsy specimen during 24 hours at room temperature.Her course since then has been characterized by frequentinfections, bouts of acidosis, severe epistaxes and greatlyretarded growth. Mental development was normal. Shehad a huge abdomen with massive hepatomegaly.
Patient 5. J.K. was a 6 year old white male. Thediagnosis of liver glycogen disease had been establishedin the immediate neonatal period, when he was foundto have hepatomegaly, severe hypoglycemia and acidosis.Intensive studies at that time (13), including liver bi-opsy, revealed the following. Moderate fasting inducedsevere hypoglycemia and acidosis, with occasional con-vulsions. There was little or no rise in blood glucoseafter injection of epinephrine or glucagon. Liver gly-
cogen concentration was 7.8 per cent and hepatic glu-cose-6-phosphatase was greatly reduced. Histologic diag-nosis was liver glycogen disease. One sibling had diedin infancy of liver glycogen disease. The child's coursesince infancy was characterized by occasional episodesof severe hypoglycemia (despite a regimen of frequentfeedings), hyperlipemia and xanthomata, and delayedgrowth. Mental development was normal. He was anabnormally small child (bone age 3.25 years) with a pro-tuberant abdomen and a greatly enlarged liver.
Patient 6. M.M. was a 1 year old white female in-fant admitted with the diagnosis of liver glycogen dis-ease. At 2 days of age she had been found to havehepatomegaly and a blood glucose level of 2 mg per 100ml. Liver biopsy at 5 days of age revealed a histologicappearance typical of liver glycogen disease (no chemi-cal determination of glycogen content). She was a small,weak infant, with a greatly enlarged liver, who developedsevere hypoglycemia after 4 hours of fasting. Bone agewas 6 months. There was virtually no rise in bloodglucose concentration after glucagon injection. She hadhyperlipemia. Repeat liver biopsy revealed a glycogenconcentration of 7.1 per cent.
RESULTS
In vitro incubation studies. After the comple-tion of preliminary clinical studies, laparotomywas performed in Patient 1. This patient, whotolerated fasting very poorly, received a slowinfusion of glucose during the night before sur-gery. At laparotomy a piece of liver and a smallsample of rectus muscle were obtained for in vitrostudy. The specimens were chilled rapidly andtransported to the laboratory under refrigeration.Tissue slices were cut as rapidly as possible andadded to flasks containing Krebs-Ringer phos-phate buffer, pH 7.4, chilled to 20 C. The orderof slices entering the duplicate incubation flaskswas such that no systematic effect attributable tothe time of slicing would occur; i.e., the patternused was ab . . . ba rather than aabb . . . . Aliver sample was withdrawn midway through theslicing procedure for determination of the initialglycogen concentration. Refrigeration of the in-cubation flasks was continued until slicing wascompleted. All flasks were then placed in aDubnoff shaker-incubator and incubated for 2hours at 370 C under a continuous flow of oxygen.
Liver slices were incubated in buffer alone andwith several additives. At the end of 2 hours, analiquot was withdrawn from each flask for glucosedetermination, 30 per cent potassium hydroxidewas added to the incubation flasks, and glycogen
366

GLYCOGENMETABOLISMIN LIVER GLYCOGENDISEASE: EFFECT OF GLUCAGON
TABLE II
Results oj in vitro liver slice incubations,(Patient 1)
Glyco- Glu-gen cose
Wt of Glyco- de- re-slices Type of incubation* gen crease covered
mg mg glucoseig tissue153 Not incubated; 86
initial glycogen176 After incubation; 79 7 0137 without additives 79 7 0165 After incubation with 64 22 490 50 gg glucagon/flask 48 38 10
162 After incubation with 58 28 27190 rat liver homogenatet 60 26 29
* All incubations conducted in 3 ml Krebs-Ringer phosphate buffercontaining additives as described.
t Each flask contained 638 mg of rat liver homogenized in buffer.The results shown are after correction for incubated rat liver blanks,which were: glycogen 0, 0; glucose 4.9, 4.7 mg per g.
determination was performed. Muscle slices wereincubated in Krebs-Ringer phosphate buffer with-out additives.
Table II presents the results of liver slice incu-bations without additives, with glucagon, and witha homiogenate of liver obtained from a fasted nor-mal rat. The initial liver glycogen concentrationwas 86 mg per g. Slices incubated without addi-tives showed only a slight decline in glycogencontent during incubation and no glucose produc-tioll. Unequivocal stimulation of glycogenolysiswas induced by glucagon. However, only smallamounts of glucose appeared in the incubationmedium. Incubation with rat liver homogenate,on the other hand, resulted in the production ofglucose in amounts corresponding to the loss ofglycogen.
In contrast to the defective glycogenolysis ob-served during incubation of liver slices, normalglycogen breakdown was observed during incuba-tion of muscle. The initial muscle glycogen con-centration was 1.9 mgper g, a relatively low value.After incubation it was 0.3 mg per g.
The failure to account for the products of glyco-genolysis during incubation of liver slices was notanticipated and did not become known in time topermit analyses for other possible metabolites ofglycogen. However, material from another incu-bation experiment, performed at the same time,was available. Liver slices had been incubatedwith C14-glucose, without hormonal additives.The flask contents had been frozen and stored forlater study. This material was thawed and an-alyzed for glycogen, glucose and lactate. The
amnotunt of glucose recovered was 0.59 ing perflask, virtually the same as the amount added-0.54 mg. Glycogen concentration was 68 mg perg, indicating breakdown of 18 mg per g, morethan was observed in the control incubationsshown in Table II. The amount of lactate re-covered was equivalent to 21 mg per g of liver.Determination of radioactivity demonstrated thatvery little of this lactate could have been derivedfrom the added glucose. Although the originalconcentration of lactate in this liver specimen hadnot been determined, it is most unlikely that itcould have been high enough to account for theamount recovered (about 2,600 mg per 100 ml ofliver water). Thus, it must be concluded that thelactate recovered was formed during incubationfrom precursors in the liver slices, and it appearslikely that it arose from liver glycogen. No dataare available on lactate production during incuba-tion with glucagon.
In vitro incubation of liver slices was also per-formed in Patient 6. In this case, however, no ef-fect of glucagon could be demonstrated. The initialglycogen concentration was 71 mg per g (individ-ual specimens, 72 and 69). After 1 hour of incu-bation in Krebs-Ringer phosphate buffer, theglycogen concentration was 65 mg per g (speci-mens 68, 60, 70, 58, 68). After incubation withglucagon, it was 63 mg per g (specimens 61, 64,55, 72). Both in the control and the glucagonincubations, lactate was the principal metaboliterecovered. Initial concentrations of glucose andlactate in the liver slices were 0.7 and 0.9 mg perg, respectively. An average of 1.5 mg per g ofglucose and 2.3 mg per g of lactate appeared dur-ing incubation.
Blood lactate studies. Marked elevations offasting blood lactate levels were observed in allsix children. These are shown in Table III. Thelowest value recorded was 30 mg per 100 ml, ob-served once in Patient 2. On numerous otheroccasions, however, this child had higher levels,and her average fasting blood lactate concentrationwas 86 mg per 100 ml. In contrast, among 52consecutive determinations in healthy controls andpatients with various other diseases, includingboth infants and adults, the highest value observedwas 26 mgper 100 ml (average, 13).
Numerous determinations of blood lactate con-centration were performed in five of the patients
367
SOKAL, LOWE, SARCIONE, MOSOVICHAND DORAY
'TALE III
Levels of lactate in blood of fasting subjects
No. of Lactatedetermin-
Patient ations Range Mean
mg/100 ml1 18 40-128 932 27 30-130 863 8 55- 85 664 1 695 10 72-122 886 4 52-130 105
43 healthy andsick adults and 52 3- 26 13children withoutglycogen disease
C,
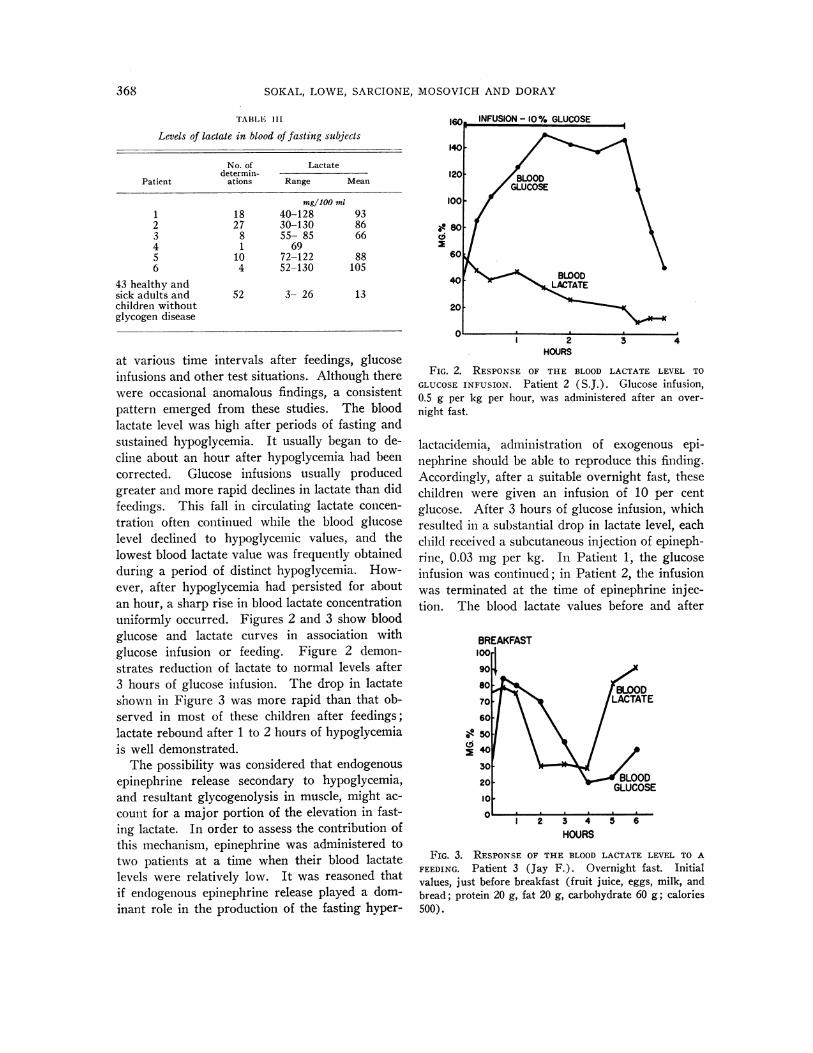
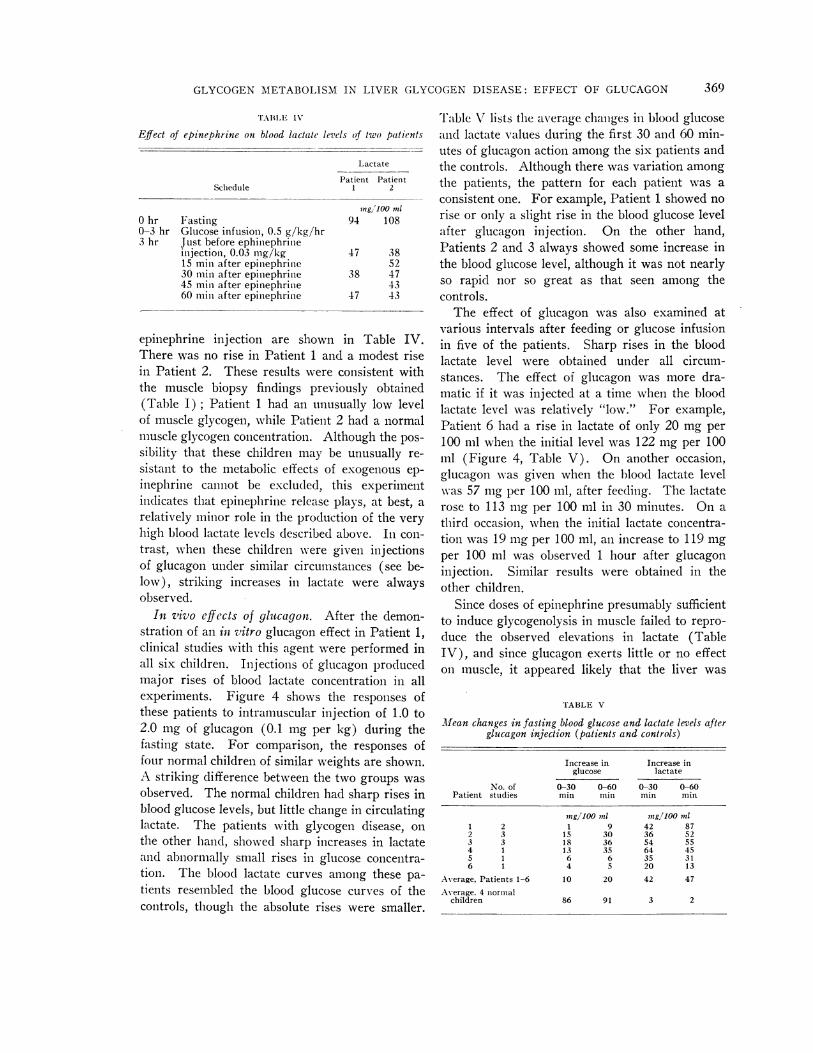
at various time intervals after feedings, glucoseinfusions and other test situations. Although therewere occasional anomalous findings, a consistentpattern emerged from these studies. The bloodlactate level was high after periods of fasting andsustained hypoglycemia. It usually began to de-cline about an hour after hypoglycemia had beencorrected. Glucose infusions usually producedgreater and more rapid declines in lactate than didfeedings. This fall in circulating lactate concen-tration often continued while the blood glucoselevel declined to hypoglycemic values, and thelowest blood lactate value was frequently obtainedduring a period of distinct hypoglycemia. How-ever, after hypoglycemia had persisted for aboutan hour, a sharp rise in blood lactate concentrationuniformly occurred. Figures 2 and 3 show bloodglucose and lactate curves in association withglucose infusion or feeding. Figure 2 demon-strates reduction of lactate to normal levels after3 hours of glucose infusion. The drop in lactateshown in Figure 3 was more rapid than that ob-served in most of these children after feedings;lactate rebound after 1 to 2 hours of hypoglycemiais well demonstrated.
The possibility was considered that endogenousepinephrine release secondary to hypoglycemia,and resultant glycogenolysis in muscle, might ac-count for a major portion of the elevation in fast-ing lactate. In order to assess the contribution ofthis mechanism, epinephrine was administered totwo patients at a time when their blood lactatelevels were relatively low. It was reasoned thatif endogenous epinephrine release played a dom-inant role in the production of the fasting hyper-
HOURS
FIG. 2. RESPONSEOF THE BLOOD LACTATE LEVEL TOGLUCOSEINFUSION. Patient 2 (S.J.). Glucose infusion,0.5 g per kg per hour, was administered after an over-night fast.
lactacidemia, administration of exogenous epi-nephrine should be able to reproduce this finding.Accordingly, after a suitable overnight fast, thesechildren were given an infusion of 10 per centglucose. After 3 hours of glucose infusion, whichresulted in a substantial drop in lactate level, eachchild received a subcutaneous injection of epineph-rine, 0.03 mg per kg. In Patient 1, the glucoseinfusion was continued; in Patient 2, the infusionwas terminated at the time of epinephrine injec-tion. The blood lactate values before and after
BREAKFAST100
90
70 LACTATE60
O 0
~40
HOURS
FIG. 3. RESPONSEOF THE BLOOD LACTATE LEVEL TO AFEEDING. Patient 3 (Jay F.). Overnight fast. Initialvalues, just before breakfast (fruit juice, eggs, milk, andbread; protein 20 g, fat 20 g, carbohydrate 60 g; calories500).
368
GLYCOGENMETABOLISMIN LIVER GLYCOGENDISEASE: EFFECT OF GLUCAGON
TABLE IV
Effect of epinephrine on blood lactate levels of two patients
Lactate
Patient PatientSchedule 1 2
mngl100 ml0 hr Fasting 94 1080-3 hr Glucose infusion, 0.5 g/kg/hr3 hr Just before ephiniephrinie
injection, 0.03 mig/kg 47 3815 min after epinephrine 5230 min after epinephrine 38 4745 min after epinephrine 4360 mil after epinephrine 47 43
epinephrine injection are shown in Table IV.There was no rise in Patient 1 and a modest risein Patient 2. These results were consistent withthe muscle biopsy findings previously obtained(Table I); Patient 1 had an unusually low levelof muscle glycogen, while Patient 2 had a normalmuscle glycogen concentration. Although the pos-
sibility that these children may be unusually re-
sistant to the metabolic effects of exogenous ep-
inephrine cannot be excluded, this experimentindicates that epinephrine release plays, at best, a
relatively minor role in the productioii of the very
high blood lactate levels described above. Ill con-
trast, when these children weere given injectionsof glucagon under similar circumstances (see be-low), striking increases in lactate were alwaysobserved.
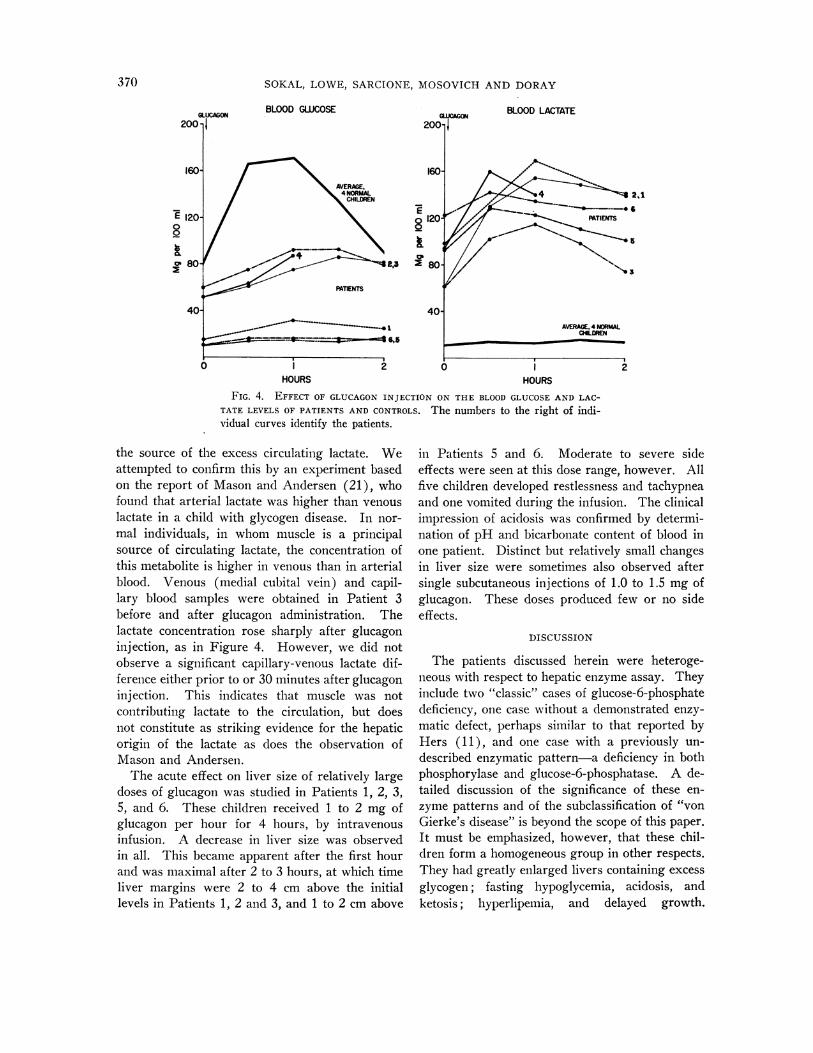
In vivo effects of glucagon. After the demon-stration of an in vitro glucagon effect in Patient 1,clinical studies with this agent were performed inall six children. Injections of glucagon producedmajor rises of blood lactate concentration in allexperiments. Figure 4 shows the responses ofthese patients to intramuscular injection of 1.0 to2.0 mg of glucagon (0.1 mg per kg) during thefasting state. For comparison, the responses offour normal children of similar weights are shown.A striking difference between the two groups was
observed. The normal children had sharp rises inblood glucose levels, but little change in circulatinglactate. The patients with glycogen disease, on
the other hand, showed sharp increases in lactateand abnormally small rises in glucose concentra-tion. The blood lactate curves among these pa-
tients resembled the blood glucose curves of thecontrols, though the absolute rises were smaller.
Table V lists the averag,-e changes in blood glucoseand lactate values during the first 30 and 60 min-utes of glucagon action among the six patients andthe controls. Although there was variation amongthe patients, the pattern for each patient was aconsistent one. For example, Patient 1 showed norise or only a slight rise in the blood glucose levelafter glucagon injection. On the other hand,Patients 2 and 3 always showed some increase inthe blood glucose level, although it was not nearlyso rapid nor so great as that seen among thecontrols.
The effect of glucagon was also examined atvarious intervals after feeding or glucose infusionin five of the patients. Sharp rises in the bloodlactate level were obtained under all circum-stances. The effect of glucagon was more dra-matic if it was injected at a time when the bloodlactate level was relatively "low." For example,Patient 6 had a rise in lactate of only 20 mg per100 ml when the initial level was 122 mg per 100ml (Figure 4, Table V). On another occasion,glucagon wvas given when the blood lactate levelwvas 57 mg per 100 ml, after feeding. The lactaterose to 113 mg per 100 ml in 30 minutes. On athird occasion, when the initial lactate concentra-tion was 19 mg per 100 ml, an increase to 119 mgper 100 ml was observed 1 hour after glucagoninjection. Similar results were obtained in theother children.
Since doses of epinephrine presumably sufficientto induce glycogenolysis in muscle failed to repro-duce the observed elevations in lactate (TableIV), and since glucagon exerts little or no effecton muscle, it appeared likely that the liver was
TABLE V
Mean changes in fasting blood glucose and lactate levels afterglucagon injection (patients and controls)
Increase in Increase inglucose lactate
No. of 0-30 0-60 0-30 0-60Patient studies min min min min
ing/100 anl sng/100 ?nl1 2 1 9 42 872 3 15 30 36 523 3 18 36 54 554 1 13 35 64 455 1 6 6 35 316 1 4 5 20 13
Average, Patients 1-6 10 20 42 47Average. 4 normal
children 86 91 3 2
369
SOKAL, LOWE, SARCIONE, MOSOVICHAND DORAY
200-BLOODGWCOSE BLOODLACTATEAwBAGON
E 120-00
80- 2 3
PATIENTS
40-
0 1 2HOURS
FIG. 4. EFFECT OF GLUCAGONINJECTATE LEVELS OF PATIENTS AND CONTROIvidual curves identify the patients.
the source of the excess circulating lactate. Weattempted to confirm this by an experiment basedon the report of Mason and Andersen (21), whofound that arterial lactate was higher than venouslactate in a child with glycogen disease. In nor-mal individuals, in whom muscle is a principalsource of circulating lactate, the concentration ofthis metabolite is higher in venous than in arterialblood. Venous (medial cubital vein) and capil-lary blood samples were obtained in Patient 3before and after glucagon administration. Thelactate concentration rose sharply after glucagoninjection, as in Figure 4. However, we did notobserve a significant capillary-venous lactate dif-ference either prior to or 30 minutes after glucagoninjection. This indicates that muscle was notcontributing lactate to the circulation, but doesnot constitute as striking evidence for the hepaticorigin of the lactate as does the observation ofMason and Andersen.
The acute effect on liver size of relatively largedoses of glucagon was studied in Patients 1, 2, 3,5, and 6. These children received 1 to 2 mg ofglucagon per hour for 4 hours, by intravenousinfusion. A decrease in liver size was observedin all. This became apparent after the first hourand was maximal after 2 to 3 hours, at which timeliver margins were 2 to 4 cm above the initiallevels in Patients 1, 2 and 3, and 1 to 2 cm above
0 IHOURS
CTION ON THE BLOODGLUCOSEAND LAC-)LS. The numbers to the right of indi-
in Patients 5 and 6. Moderate to severe sideeffects were seen at this dose range, however. Allfive children developed restlessness and tachypneaand one vomited during the infusion. The clinicalimpression of acidosis was confirmed by determi-nation of pH and bicarbonate content of blood inone patient. Distinct but relatively small changesin liver size were sometimes also observed aftersingle subcutaneous injections of 1.0 to 1.5 mg ofglucagon. These doses produced few or no sideeffects.
DISCUSSION
The patients discussed herein were heteroge-neous with respect to hepatic enzyme assay. Theyinclude two "classic" cases of glucose-6-phosphatedeficiency, one case without a demonstrated enzy-matic defect, perhaps similar to that reported byHers (11), and one case with a previously un-described enzymatic pattern-a deficiency in bothphosphorylase and glucose-6-phosphatase. A de-tailed discussion of the significance of these en-zyme patterns and of the subclassification of "vonGierke's disease" is beyond the scope of this paper.It must be emphasized, however, that these chil-dren form a homogeneous group in other respects.They had greatly enlarged livers containing excessglycogen; fasting hypoglycemia, acidosis, andketosis; hyperlipemia, and delayed growth.
370
GLYCOGENMETABOLISMIN LIVER GLYCOGENDISEASE: EFFECT OF GLUCAGON
Neither glucagon nor epinephrine evoked a hyper-glycemic response. Spontaneous it vitro break-down of glycogen to glucose was defective in thepatients in whom this was studied. They hadsimilar metabolic abnormalities and similar re-sponses to glucagon. Thus, it seems appropriateto consider them together despite the differencesin hepatic enzyme patterns.
Unequivocal stimulation of glycogenolysis byglucagon was demonstrated during in vitro incuba-tion of liver slices in Patient 1. The principalend-product of this glycogenolysis was not glu-cose; indirect evidence suggests that it was lactate.In all six patients of this group, glucagon adminis-tration was followed by marked rises in bloodlactate concentration. These increases in lactateresembled the increases in blood glucose concen-tration following the administration of glucagon tonormal children. Comparison of capillary andvenous lactate levels in one case indicated that theincrement in lactate did not come from muscle.In all five children given glucagon infusions, anacute decrease in liver size was observed. Takentogether, these findings suggest strongly thatglucagon exerted its usual glycogeniolytic effect onthe liver in these cases, but that the principal end-product of glycogen breakdown was lactate ratherthan glucose. The failure to demonstrate a gluca-gon response in vitro in Patient 6 is disturbingand, so far, unexplained. However, this child'sclinical behavior and in vivo response to glucagonwas similar to that of Patient 1, where an effecton liver slices was demonstrated.
Normally, the blood lactate level is low in thefasting state and rises after a carbohydrate load(22). The fasting venous lactate concentration ishigher than the arterial concentration, as muscleis a principal source of this metabolite, while theliver withdraws it from the circulation. In ourpatients, however, the blood lactate level washighest during fasting and decreased after feedingor glucose infusion. Muscle was not a majorsource of lactate. This "paradoxical" behavior isreadily explained by the hypothesis that hepaticglycogenolysis was the principal source of circulat-ing lactate in these cases. In the fasting state,hypoglycemia developed, hepatic glycogenolysiswas stimulated, and the blood lactate level rose.After feeding or glucose infusion, hepatic glyco-genolysis ceased, glycogen deposition supervened,
and the blood lactate level fell. Glucagon pro-duced sharp increases in blood lactate concentra-tion under all circumstances by inducing rapidhepatic glycogenolysis.
Our conclusion that glucagon may induce he-patic glycogenolysis in some children with liverglycogen disease, just as it does in normal chil-dren, is not really in conflict with the findings ofother investigators. A glucagon effect was lookedfor as early as 1932 by van Creveld (23), whoadministered an intravenous injection of insulincontaining the "hyperglycemic factor" to a childwith the disease. However, van Creveld exam-ined only the response of the blood glucose levelto such injection. L ater investigators similarlyfailed to consider the possibility that some othermetabolite might be the end-product of glycogen-olysis. However, our observation of a decrease inliver size during glucagon administration may notbe unique. Gitzelmnann (24) observed a reductionin liver size, comparable wvith that reported here,in a child thought to have a mild form of liverglycogen disease. He administered smaller dosesover a longer period of time, and avoided the sideeffects we observed with intravenous infusions.
Most reports on liver glycogen disease do notinclude data on blood lactate levels. However,some authors have recorded strikingly increasedfasting blood lactate values in this disorder (21,25, 26). Mason and Sly (25) observed, as wehave, that the blood lactate level was markedlyelevated during periods of prolonged hypoglycemiaand that it fell toward normal values when theblood glucose level was maintained by frequentadministration of glucose. Mason and Andersen(21) presented evidence that the liver, rather thanmuscle, was the source of the excess lactate duringfasting. Excessive production of lactic acid maybe largely responsible for the fasting acidosis insome cases of this disease (21, 26).
Confirmation of the points made above has re-cently appeared in an abstract by Howell, Ashtonand Wyngaarden (27). These authors studiedthree siblings with liver glycogen disease, one ofwhom was subjected to liver biopsy and found tohave a deficiency of hepatic glucose-6-phosphatase.All had high fasting blood lactate levels, compara-ble with those reported here. Glucagon infusionsresulted in rapid and striking rises of blood lactate,but only slow increases in blood glucose. Liver
371

SOKAL, LOWE, SARCIONE, MOSOVICHAND DORAY
Normal
|GLYCOGEN
r GLUCOSE-6.PO41 e
Hzose -P04 gcofc
PYRUVATE LACTATE
/I
Liver Glycogen Disease
I GLYCOGEN]
0,GLUCOSE 6-P-P04 LUCOSE/e-/P4 9VBro/yfc
PYRUVATE _
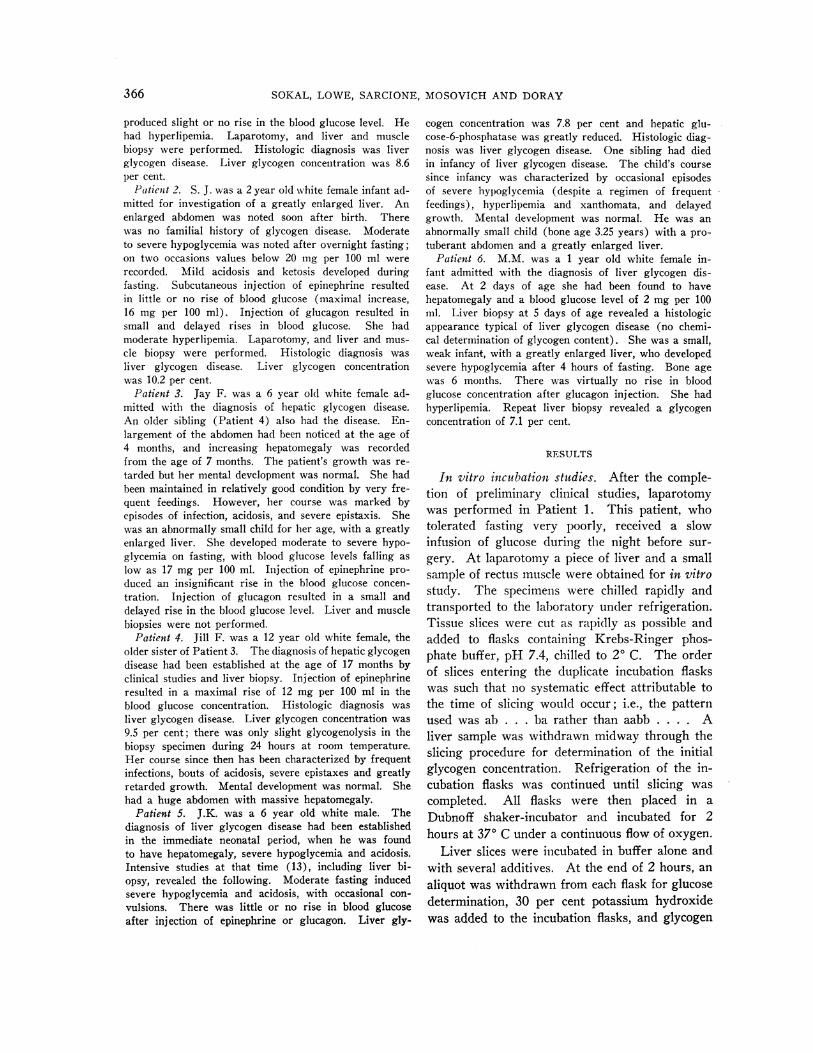
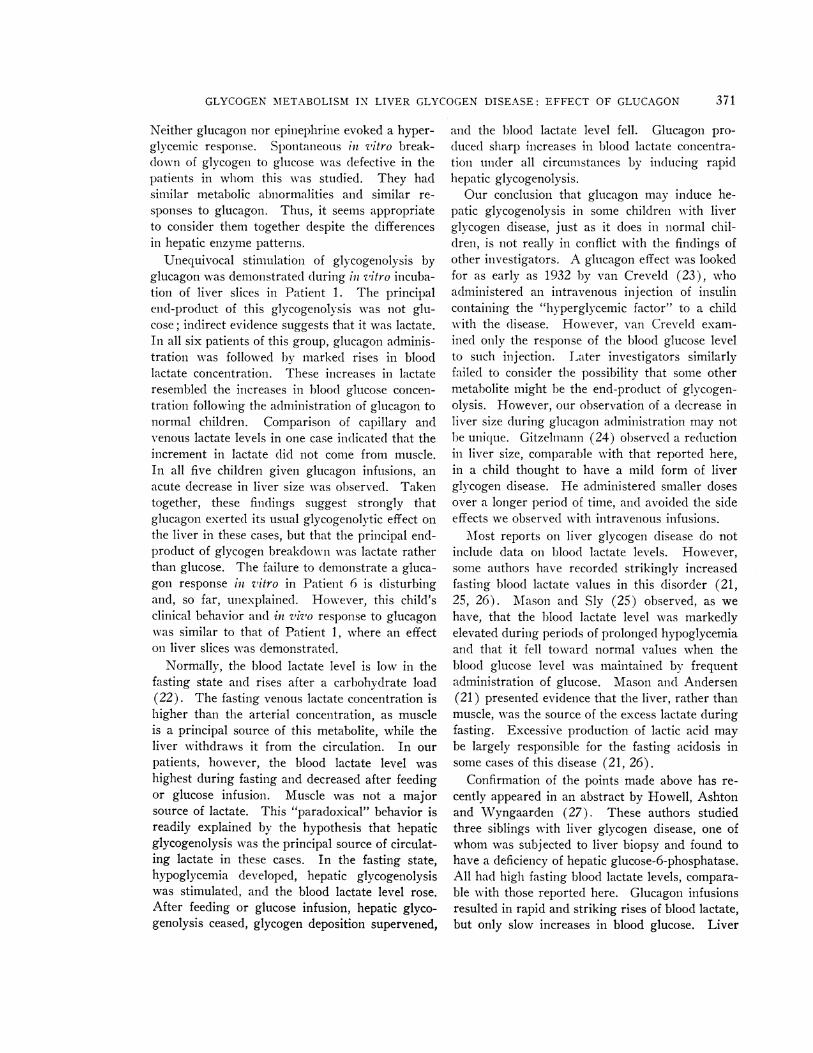
/IFIG. 5. SCHEMATIC REPRESENTATIONOF LIVER GLYCOGENBREAKDOWNIN
PATIENTS 1-6, AS COMPAREDWITH NORMAL INDIVIDUALS. Normally, glu-cose is the principal product of hepatic glycogenolysis. In these patients,lactic acid was the principal product.
slices incubated with glucagon showed appreciableglycogen breakdown and lactate production. Thelactate concentration was higher in peripheral ar-terial than in venous blood, indicating that musclewas withdrawing, rather than contributing lactateto the circulation.
The phenomena discussed above are not seen inall cases of liver glycogen disease, however. Lind-say, Ross and Wigglesworth (28) reported a childwhose fasting blood lactate level was only 25 mgper 100 ml. In two cases, van Creveld (23) per-formed blood lactate determinations; his reportdoes not give the actual values but it may be as-sumed from the context that they were not re-markable. In one proven case of liver glycogendisease with glucose-6-phosphatase deficiency, re-cently brought under study, we have found anormal fasting blood lactate level, which did notrise after glucagon administration. No decreasein liver size was observed when this child wasgiven a glucagon infusion. Thus, the findingsdescribed in this paper apply only to certain casesof this puzzling disorder.
Our explanation of the hyperlactacidemia insome cases of liver glycogen disease, and itsamelioration by glucose, postulates spontaneoushepatic glycogenolysis in response to fasting hypo-glycemia and shift toward glycogen depositionwhen the blood glucose level is raised-i.e., metab-olic turnover of liver glycogen. This view waspresented earlier by Mason and Sly. This is con-tradictory to the concept of storage of meta-bolically unavailable liver glycogen expressed bysome authors and implied in the term "glycogen
storage disease," used by many. On criticalexamination, however, the evidence against activemetabolic turnover of glycogen in this diseaseproves to be largely inferential. Many observershave assumed that failure of the blood glucose torise after administration of glucagon or epineph-rine indicates that glycogenolysis did not occur.Such an assumption may be quite erroneous evenwhen the pathways of glycogen breakdown arenormal (29) and would certainly be erroneous ifthe end-product of glycogenolysis is lactate. Thefact that glycogenolysis could occur in this disease,either through the glycolytic pathway or throughthe phosphogluconate pathway, was emphasized byCori and Cori (30).
In the six patients forming the subject of thisreport, lactate replaced glucose as the major invivo end-product of hepatic glycogenolysis. As-suming that as in the normal, glucose-6-phosphateis the intermediate from which the metabolic path-ways diverge, the sequence of events in these casesmight be represented as in Figure 5. The initialstage of glycogen breakdown proceeds much as innormal. Deviations from the normal occur in themetabolism of glucose-6-phosphate and subsequentcompounds. No data are, available on the relativeimportance of the hexose monophosphate shuntversus the glycolytic pathway; these are repre-sented by interrupted lines. This scheme postu-lates quantitative, rather than qualitative, differ-ences from the normal. However, our data donot rule out the possibility that aberrant metabolicpathways may exist in liver glycogen disease; nor
372
GLYCOGENMETABOLISM IN LIVER GLYCOGENDISEASE: EFFECT OF GLUCAGON 373
do they defille the basic etiologic mechanism forthe various ablnormialities in this disorder.
SUMMARY
Six children with liver glycogen disease hadstrikingly elevated fasting blood lactate levels. Inall five so studied, the blood lactate concentrationfell when hypoglycemia was corrected by feedingor glucose infusions. Rapid return to markedlyabnormal blood lactate values was observed afterhypoglycemia was allowed to recur. In all sixchildren, glucagon injection resulted in little or no
rise in blood glucose, but in prompt and largeincreases of blood lactate levels. Intravenousinfusions of glucagon produced acute decreases ofliver size in all the five patients so treated.
Glucagon stimulated glycogenolysis during invitro incubation of liver slices obtained from one
of these patients, but only traces of glucose ap-
peared in the medium.It is concluded that active breakdown of liver
glycogen occurred in these patients in response tothe stimulus of hypoglycemia, and that glucagonexerted its usual hepatic glycogenolytic effect.However, the principal end-product of liver glyco-gen breakdown, whether spontaneous or glucagon-induced, was lactic acid rather than glucose.
ACKNOWLEDGMENT
XVe are indebted to Dr. Theodore C. Jewett for hiscooperation in performing liver biopsies and to the fol-lowing physicians who referred the patients discussed inthis paper: Dr. Harry W. Bain, Dr. Eunice B. Miles,Dr. Malcolm L. Peterson, Dr. George B. Rosenfeld andDr. Lester Schiff.
REFERENCES
1. van Creveld, S. Glycogen disease. Medicine (Balti-more) 1939, 18, 1.
2. Bridge, E. M., and Holt, L. E., Jr. Glycogen storagedisease. Observations on the pathologic physiol-ogy of two cases of the hepatic form of the disease.J. Pediat. 1945, 27, 299.
3. Illingworth, B., and Cori, G. T. Structure of glyco-gens and amylopectins. III. Normal and abnormalhuman glycogens. J. biol. Chem. 1952, 199, 653.
4. Sch6nheimer, R. Ueber eine eigenartige Stdrungdes Kohlehydrat-Stoffweclsels. Z. physiol. Chem.1929, 182, 148.
5. Mason, H. H., and Andersen, D. H. Glycogen dis-ease. Amer. J. Dis. Child. 1941, 61, 795.
6. Unshelm, E. Die Glykogenkrankheit (zuigleicl cinBeitrag zur Frage des hepatogenen Iifantilismllus).Jb. Kinderheilk. 1932, 137, 257.
7. White, A., Handler, P., Smith, E. L., and Stetten, D.,Jr. Principles of Biochemistry, 2nd ed. New York,McGraw-Hill, 1959, pp. 430-431.
8. Leloir, L. F., and Cardini, C. E. Biosynthesis ofglycogen from uridine diphosphate glucose. J.Amer. chem. Soc. 1957, 79, 6340.
9. Cori, G. T. Biochemical aspects of glycogen depo-sition disease. Mod. Probl. Pddiat. 1958, 3, 344.
10. Hers, H. G. Etudes enzymatiques sur fragmentshepatiques: Application a la classification desglycogenoses. Rev. int. Hepat. 1959, 9, 35.
11. Hers, H. G. Conference on Hereditary MetabolicDiseases, IX Internat. Congr. Pediatrics, Mon-treal, 1959. Unpublished.
12. Ellis, R. WV. B., and Payne, W. W. Glycogen dis-ease (Von Gierke's disease: Hepato (nephro) me-galia glycogenica). Quart. J. Med. 1936, 5, 31.
13. Schulman, J. L., and Saturen, P. Glycogen storagedisease of the liver. I. Clinical studies during theearly neonatal period. Pediatrics 1954, 14, 632.
14. Koulischer, N., and Pickering, D. E. Glycogen-storage disease. A study on effect of sodium1-thyroxine and glucagon. Amer. J. Dis. Child.1956, 91, 103.
15. Lowe, C. U., Doray, B. H., Sokal, J. E., and Sarci-one, E. J. Carbohydrate metabolism in glycogenstorage disease and the mode of action of insulin.Mod. Probl. Pddiat. 1959, 4, 157.
16. Nelson, N. A photometric adaptation of the Somogyimethod for the determination of glucose. J. biol.Chem. 1944, 153, 375.
17. Barker, S. B., and Summerson, WV. H. Colorimetricdetermination of lactic acid in biological material.J. biol. Chem. 1941, 138, 535.
18. Horn, H. D., and Bruns, F. H. Quantitative Bestim-mung von L (+) -Milchsdure mit Milchsdiuredehy-drogenase. Biochim. biophys. Acta 1956, 21, 378.
19. Good, C. A., Kramer, H., and Somogyi, M. The de-termination of glycogen. J. biol. Chem. 1933, 100,485.
20. Lowe, C. U., Sokal, J. E., Mosovitch, L. L., Doray,B. H., and Sarcione, E. J. Metabolic studies inliver glycogen disease. In preparation.
21. Mason, H. H., and Andersen, D. H. Glycogen dis-ease of the liver (Von Gierke's disease) with hepa-tomata. Case report with metabolic studies. Pe-diatrics 1955, 16, 785.
22. White, A., Handler, P., Smith, E. IL, and Stetten, D.,Jr. Principles of Biochemistry, 2nd ed. NewYork, McGraw-Hill, 1959, p. 439.
23. van Creveld, S. Investigations on glycogen disease.Arch. Dis. Childh. 1934, 9, 9.
24. Gitzelmann, R. Glukagonprobleme bei den Glykogen-speicherkrankheiten. Helv. paediat. Acta 1957, 12,425.
373

SOKAL, LOWE, SARCIONE, MOSOVICHAND DORAY
25. Mason, H. H., and Sly, G. E. Blood lactic acid in
liver glycogen disease. Proc. Soc. exp. Biol.(N. Y.) 1943, 53, 145.
26. Schwartz, R., Ashmore, J., and Renold, A. E. Galac-
tose tolerance in glycogen storage disease. Pedi-trics 1957, 19, 585.
27. Howell, R. R., Ashton, D., and Wyngaarden, J. B.
Lipid, carbohydrate and purine abnormalities inVon Gierke's disease (abstract). J. clin. Invest.1960, 39, 997.
28. Lindsay, L. M., Ross, A., aiid( Wiggleswortli, F. W.Von Gierke's glycogenl discase. Ann. initerni. Med.1935, 9, 274.
29. Sokal, J. E., and Sarcione, E. J. Failure of blood glu-cose levels to reflect hepatic glycogenolysis; ex-
periences with glucagon. Proc. Soc. exp. Biol.(N. Y.) 1958, 98, 879.
30. Cori, G. T., and Cori, C. F. Glucose-6-phosphataseof the liver in glycogen storage disease. J. biol.Chem. 1952, 199, 661.
374