Embed Size (px)
Citation preview

Teerapol Udomvej, CFA [email protected]
+66 2611 3535
PREPARED BY FSS INTERNATIONAL INVESTMENT ADVISORY SECURITIES CO LTD (FSSIA). ANALYST CERTIFICATION AND IMPORTANT DISCLOSURES CAN BE FOUND AT THE END OF THIS REPORT
EQUITY RESEARCH - COMPANY REPORT
8 NOVEMBER 2021 THAILAND / HEALTHCARE
RAMKHAMHAENG HOSPITAL RAM TB
BUY UNCHANGED
Healthier earnings and liquidity
Expect 3Q21 core profit to jump four-fold y-y to THB579m We expect the revenues of RAM flagship and Vibharam group (VBR; RAM holds a 50% stake) to grow by 10% q-q and 80% q-q, respectively, led by Covid-related services which we estimate to contribute around 15-20% for RAM flagship and 60% for VBR, up from 8% and 40% in 2Q21. Share income should also grow by 15% q-q, as all associate hospitals should benefit from Covid-related services. We expect dividend income to drop by 60-70% on the low season for dividend payments. Overall, we forecast 3Q21 core profit to grow by 436% y-y and 15% q-q to THB579m.
Organic growth should resume in 4Q21 onward Although Covid-related revenue should slow down in 4Q21, we expect non-Covid patient revenue to partially offset Covid patent revenue. In addition, RAM should start to book Moderna vaccination revenue from 4Q21 on. Overall, we estimate 4Q21 core profit to continue to grow on a y-y basis, but should decline q-q due to lower Covid-related revenue. We also expect RAM to maintain strong earnings of cTHB1.7b-1.8b in 2022, exceeding the pre-Covid level by c20%, led by organic growth, especially for VBR which recently turned profitable and entered a harvesting period.
Trading liquidity may improve after splitting par At its recent EGM, shareholders approved a par split from THB0.5/shr to THB0.1/shr and to trade at the new par effective on 9 Nov-21. In addition, shareholders also approved capital raising of 60m newly issued shares (at the par of THB0.1/shr, equivalent to 5% of total paid-up shares) via private placement under general mandate. RAM would get proceeds of up to cTHB1.9b (based on the current share price). This would not only strengthen its balance sheet to support four new greenfield projects over 2022-24, but also improve its free float from 20% currently. These two transactions should improve its trading liquidity and turn the market’s attention to RAM.
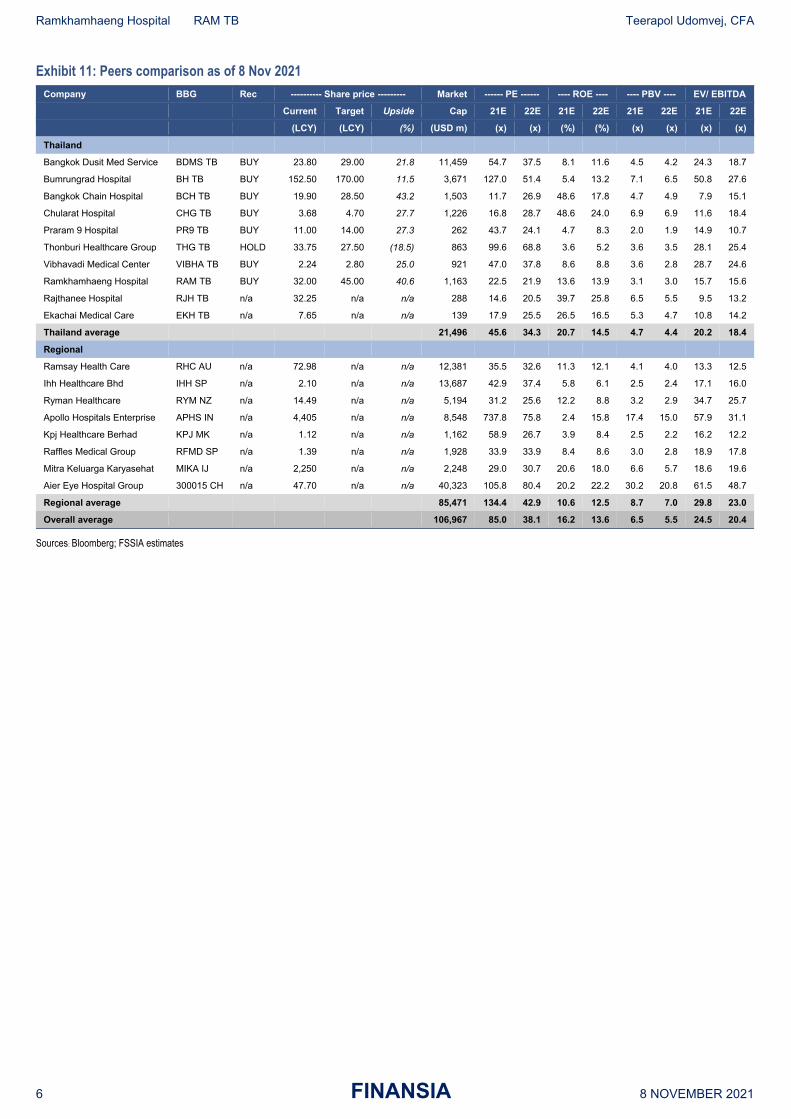
Re-rating from strong earnings and improving trading liquidity RAM is trading at a cheap valuation of 22x 2022E P/E, lower than its peers’ average of 38x. We expect its valuation will gradually re-rate to its peers’ level after its trading liquidity improves. RAM is the cheapest investing option for a hospital chain in Thailand, with a market cap/bed of only THB21m vs the THB34m average for other hospital chains. Note that our target price after the par split is THB45/shr (unchanged from THB225/shr at THB0.5/shr).
TARGET PRICE THB45.00
CLOSE THB32.00
UP/DOWNSIDE +40.6%
PRIOR TP THB45.00
CHANGE IN TP UNCHANGED
TP vs CONSENSUS +0.0%
KEY STOCK DATA
YE Dec (THB m) 2020 2021E 2022E 2023E
Revenue 7,822 9,789 9,513 9,993
Net profit 632 1,704 1,750 1,921
EPS (THB) 0.53 1.42 1.46 1.60
vs Consensus (%) - 0.0 0.1 -
EBITDA 1,404 3,348 3,295 3,549
Core net profit 632 1,704 1,750 1,921
Core EPS (THB) 0.53 1.42 1.46 1.60
Chg. In EPS est. (%) - - - -
EPS growth (%) (57.1) 169.6 2.7 9.8
Core P/E (x) 60.8 22.5 21.9 20.0
Dividend yield (%) 2.3 2.7 3.2 3.5
EV/EBITDA (x) 37.2 15.7 15.6 14.2
Price/book (x) 3.0 3.1 3.0 2.8
Net debt/Equity (%) 48.5 51.6 43.2 35.3
ROE (%) 5.0 13.6 13.9 14.4
Share price performance 1 Month 3 Month 12 Month
Absolute (%) 1.9 6.0 13.9
Relative to country (%) 2.7 (0.8) (11.8)
Mkt cap (USD m) 1,163
3m avg. daily turnover (USD m) 1.0
Free float (%) 20
Major shareholder F&S 79 (23%)
12m high/low (THB) 34.60/27.10
Issued shares (m) 1,200.00
Par value changed to THB0.1/shr from THB0.5/shr, effective on 9 Nov-21 Sources: Bloomberg consensus; FSSIA estimates
(25)
(20)
(15)
(10)
(5)
0
0
5
10
15
20
25
30
35
40
Nov‐20 Jan‐21 Mar‐21May‐21 Jul‐21 Sep‐21
(%)(THB)RAM Relative to SET
Nov‐20 Feb‐21 May‐21 Aug‐21 Nov‐21
Ramkhamhaeng Hospital RAM TB Teerapol Udomvej, CFA
2 FINANSIA 8 NOVEMBER 2021
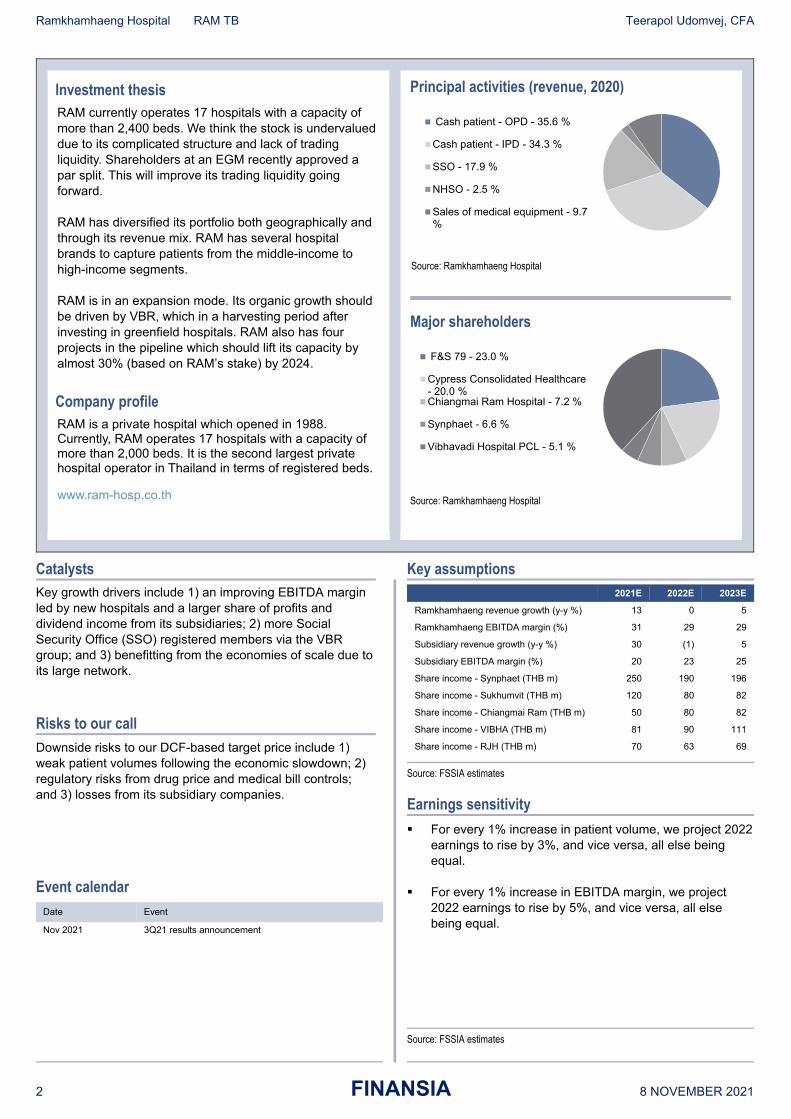
Investment thesis RAM currently operates 17 hospitals with a capacity of more than 2,400 beds. We think the stock is undervalued due to its complicated structure and lack of trading liquidity. Shareholders at an EGM recently approved a par split. This will improve its trading liquidity going forward. RAM has diversified its portfolio both geographically and through its revenue mix. RAM has several hospital brands to capture patients from the middle-income to high-income segments. RAM is in an expansion mode. Its organic growth should be driven by VBR, which in a harvesting period after investing in greenfield hospitals. RAM also has four projects in the pipeline which should lift its capacity by almost 30% (based on RAM’s stake) by 2024. Company profile RAM is a private hospital which opened in 1988. Currently, RAM operates 17 hospitals with a capacity of more than 2,000 beds. It is the second largest private hospital operator in Thailand in terms of registered beds.
www.ram-hosp.co.th
Principal activities (revenue, 2020)
Source: Ramkhamhaeng Hospital
Major shareholders
Source: Ramkhamhaeng Hospital
Cash patient - OPD - 35.6 %
Cash patient - IPD - 34.3 %
SSO - 17.9 %
NHSO - 2.5 %
Sales of medical equipment - 9.7%
F&S 79 - 23.0 %
Cypress Consolidated Healthcare- 20.0 %Chiangmai Ram Hospital - 7.2 %
Synphaet - 6.6 %
Vibhavadi Hospital PCL - 5.1 %
Catalysts Key growth drivers include 1) an improving EBITDA margin led by new hospitals and a larger share of profits and dividend income from its subsidiaries; 2) more Social Security Office (SSO) registered members via the VBR group; and 3) benefitting from the economies of scale due to its large network.
Risks to our call
Downside risks to our DCF-based target price include 1) weak patient volumes following the economic slowdown; 2) regulatory risks from drug price and medical bill controls; and 3) losses from its subsidiary companies.
Event calendar Date Event
Nov 2021 3Q21 results announcement
Key assumptions 2021E 2022E 2023E
Ramkhamhaeng revenue growth (y-y %) 13 0 5
Ramkhamhaeng EBITDA margin (%) 31 29 29
Subsidiary revenue growth (y-y %) 30 (1) 5
Subsidiary EBITDA margin (%) 20 23 25
Share income - Synphaet (THB m) 250 190 196
Share income - Sukhumvit (THB m) 120 80 82
Share income - Chiangmai Ram (THB m) 50 80 82
Share income - VIBHA (THB m) 81 90 111
Share income - RJH (THB m) 70 63 69
Source: FSSIA estimates
Earnings sensitivity
For every 1% increase in patient volume, we project 2022 earnings to rise by 3%, and vice versa, all else being equal.
For every 1% increase in EBITDA margin, we project 2022 earnings to rise by 5%, and vice versa, all else being equal.
Source: FSSIA estimates
Ramkhamhaeng Hospital RAM TB Teerapol Udomvej, CFA
3 FINANSIA 8 NOVEMBER 2021
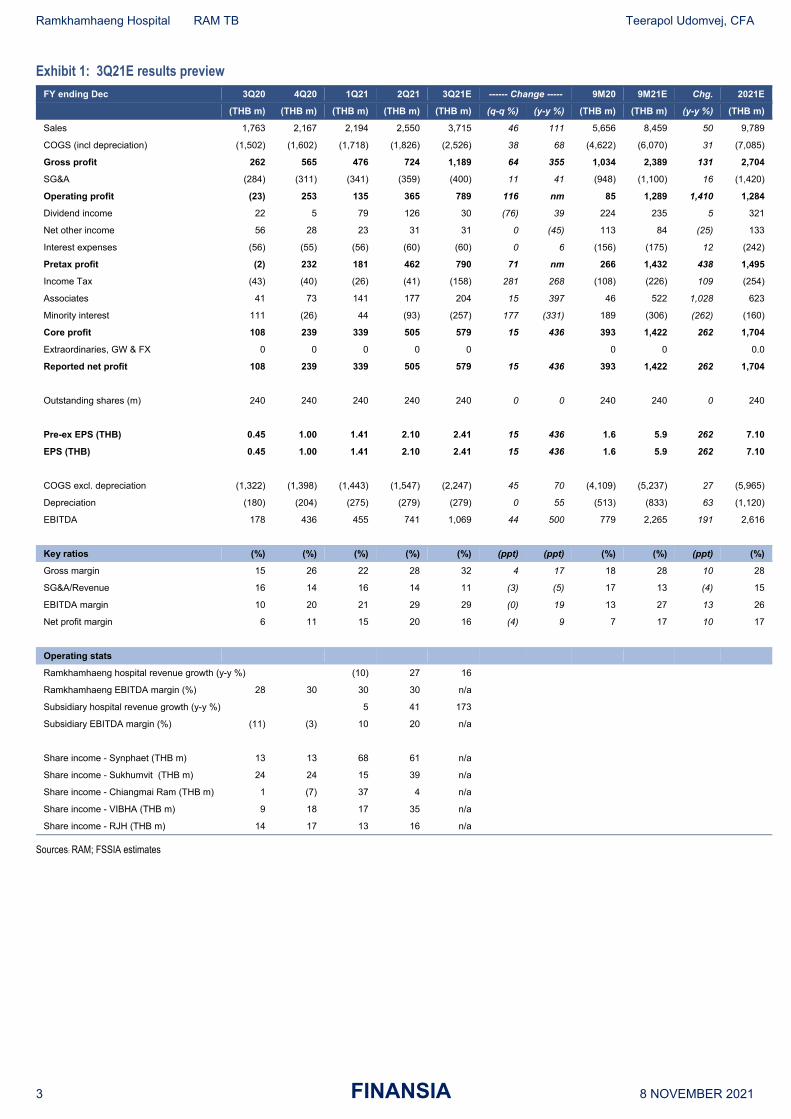
Exhibit 1: 3Q21E results preview
FY ending Dec 3Q20 4Q20 1Q21 2Q21 3Q21E ------ Change ----- 9M20 9M21E Chg. 2021E
(THB m) (THB m) (THB m) (THB m) (THB m) (q-q %) (y-y %) (THB m) (THB m) (y-y %) (THB m)
Sales 1,763 2,167 2,194 2,550 3,715 46 111 5,656 8,459 50 9,789
COGS (incl depreciation) (1,502) (1,602) (1,718) (1,826) (2,526) 38 68 (4,622) (6,070) 31 (7,085)
Gross profit 262 565 476 724 1,189 64 355 1,034 2,389 131 2,704
SG&A (284) (311) (341) (359) (400) 11 41 (948) (1,100) 16 (1,420)
Operating profit (23) 253 135 365 789 116 nm 85 1,289 1,410 1,284
Dividend income 22 5 79 126 30 (76) 39 224 235 5 321
Net other income 56 28 23 31 31 0 (45) 113 84 (25) 133
Interest expenses (56) (55) (56) (60) (60) 0 6 (156) (175) 12 (242)
Pretax profit (2) 232 181 462 790 71 nm 266 1,432 438 1,495
Income Tax (43) (40) (26) (41) (158) 281 268 (108) (226) 109 (254)
Associates 41 73 141 177 204 15 397 46 522 1,028 623
Minority interest 111 (26) 44 (93) (257) 177 (331) 189 (306) (262) (160)
Core profit 108 239 339 505 579 15 436 393 1,422 262 1,704
Extraordinaries, GW & FX 0 0 0 0 0 0 0 0.0
Reported net profit 108 239 339 505 579 15 436 393 1,422 262 1,704
Outstanding shares (m) 240 240 240 240 240 0 0 240 240 0 240
Pre-ex EPS (THB) 0.45 1.00 1.41 2.10 2.41 15 436 1.6 5.9 262 7.10
EPS (THB) 0.45 1.00 1.41 2.10 2.41 15 436 1.6 5.9 262 7.10
COGS excl. depreciation (1,322) (1,398) (1,443) (1,547) (2,247) 45 70 (4,109) (5,237) 27 (5,965)
Depreciation (180) (204) (275) (279) (279) 0 55 (513) (833) 63 (1,120)
EBITDA 178 436 455 741 1,069 44 500 779 2,265 191 2,616
Key ratios (%) (%) (%) (%) (%) (ppt) (ppt) (%) (%) (ppt) (%)
Gross margin 15 26 22 28 32 4 17 18 28 10 28
SG&A/Revenue 16 14 16 14 11 (3) (5) 17 13 (4) 15
EBITDA margin 10 20 21 29 29 (0) 19 13 27 13 26
Net profit margin 6 11 15 20 16 (4) 9 7 17 10 17
Operating stats
Ramkhamhaeng hospital revenue growth (y-y %) (10) 27 16
Ramkhamhaeng EBITDA margin (%) 28 30 30 30 n/a
Subsidiary hospital revenue growth (y-y %) 5 41 173
Subsidiary EBITDA margin (%) (11) (3) 10 20 n/a
Share income - Synphaet (THB m) 13 13 68 61 n/a
Share income - Sukhumvit (THB m) 24 24 15 39 n/a
Share income - Chiangmai Ram (THB m) 1 (7) 37 4 n/a
Share income - VIBHA (THB m) 9 18 17 35 n/a
Share income - RJH (THB m) 14 17 13 16 n/a
Sources: RAM; FSSIA estimates
Ramkhamhaeng Hospital RAM TB Teerapol Udomvej, CFA
4 FINANSIA 8 NOVEMBER 2021
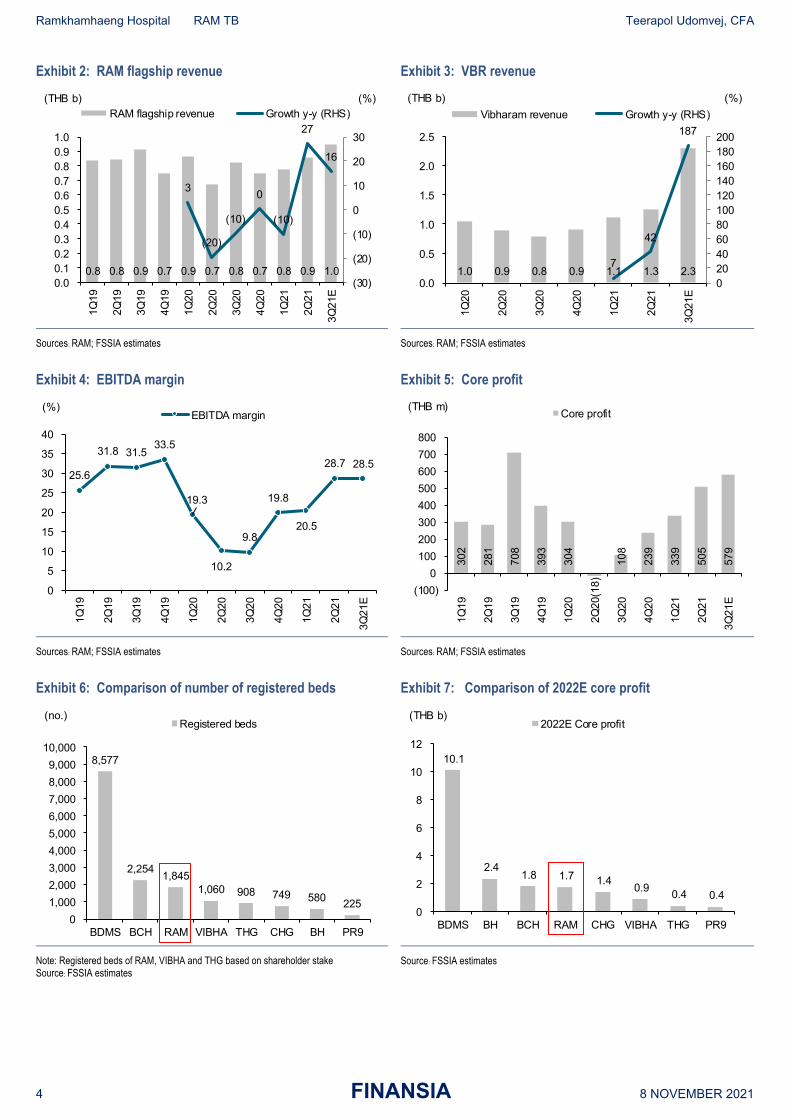
Exhibit 2: RAM flagship revenue Exhibit 3: VBR revenue
Sources: RAM; FSSIA estimates
Sources: RAM; FSSIA estimates
Exhibit 4: EBITDA margin Exhibit 5: Core profit
Sources: RAM; FSSIA estimates
Sources: RAM; FSSIA estimates
Exhibit 6: Comparison of number of registered beds Exhibit 7: Comparison of 2022E core profit
Note: Registered beds of RAM, VIBHA and THG based on shareholder stake Source: FSSIA estimates
Source: FSSIA estimates
0.8 0.8 0.9 0.7 0.9 0.7 0.8 0.7 0.8 0.9 1.0
3
(20)
(10)
0
(10)
27
16
(30)
(20)
(10)
0
10
20
30
0.00.10.20.30.40.50.60.70.80.91.0
1Q19
2Q19
3Q19
4Q19
1Q20
2Q20
3Q20
4Q20
1Q21
2Q21
3Q21
E
(%)(THB b)RAM flagship revenue Growth y-y (RHS)
1.0 0.9 0.8 0.9 1.1 1.3 2.3 7
42
187
020406080100120140160180200
0.0
0.5
1.0
1.5
2.0
2.5
1Q20
2Q20
3Q20
4Q20
1Q21
2Q21
3Q21
E
(%)(THB b)
Vibharam revenue Growth y-y (RHS)
25.6
31.8 31.5 33.5
19.3
10.2
9.8
19.8
20.5
28.7 28.5
0
5
10
15
20
25
30
35
40
1Q19
2Q19
3Q19
4Q19
1Q20
2Q20
3Q20
4Q20
1Q21
2Q21
3Q21
E
(%)EBITDA margin
302
281
708
393
304
(18)
108
239
339
505
579
(100)
0
100
200
300
400
500
600
700
800
1Q19
2Q19
3Q19
4Q19
1Q20
2Q20
3Q20
4Q20
1Q21
2Q21
3Q21
E
(THB m)Core profit
8,577
2,254 1,845
1,060 908 749 580 225
0
1,000
2,000
3,000
4,000
5,000
6,000
7,000
8,000
9,000
10,000
BDMS BCH RAM VIBHA THG CHG BH PR9
(no.)Registered beds
10.1
2.4 1.8 1.7 1.4
0.9 0.4 0.4
0
2
4
6
8
10
12
BDMS BH BCH RAM CHG VIBHA THG PR9
(THB b)2022E Core profit
Ramkhamhaeng Hospital RAM TB Teerapol Udomvej, CFA
5 FINANSIA 8 NOVEMBER 2021
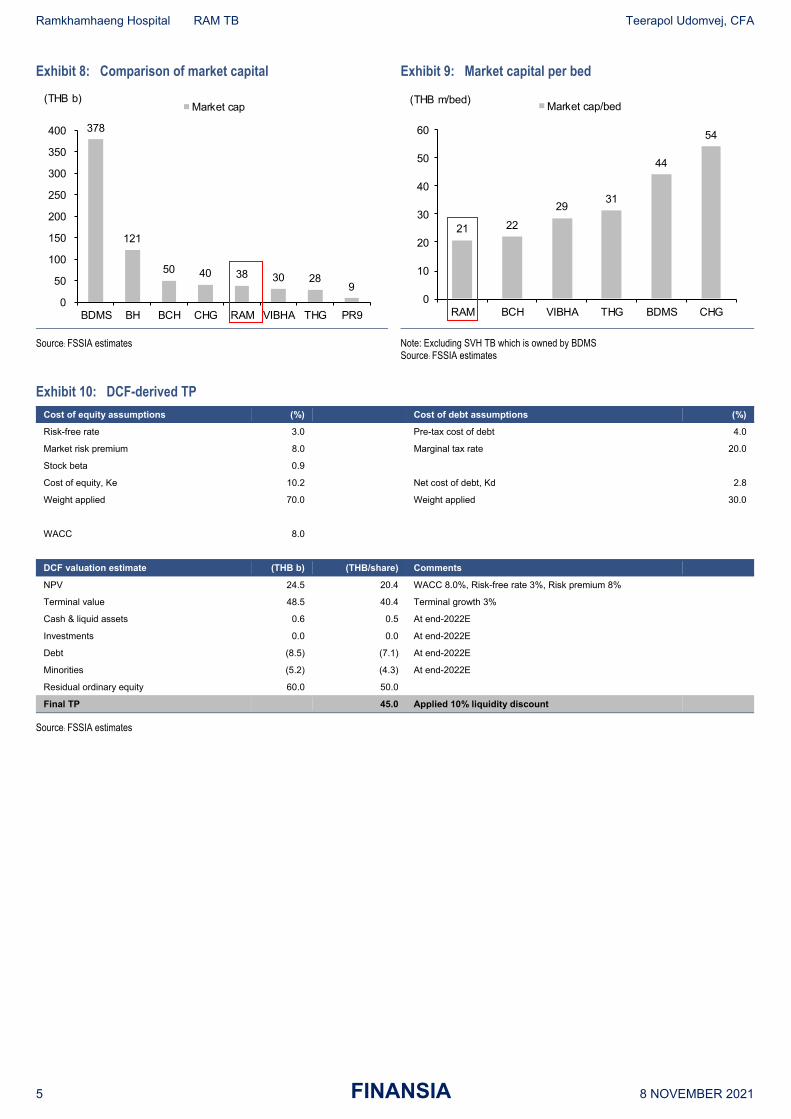
Exhibit 8: Comparison of market capital Exhibit 9: Market capital per bed
Source: FSSIA estimates
Note: Excluding SVH TB which is owned by BDMS Source: FSSIA estimates
Exhibit 10: DCF-derived TP
Cost of equity assumptions (%) Cost of debt assumptions (%)
Risk-free rate 3.0 Pre-tax cost of debt 4.0
Market risk premium 8.0 Marginal tax rate 20.0
Stock beta 0.9
Cost of equity, Ke 10.2 Net cost of debt, Kd 2.8
Weight applied 70.0 Weight applied 30.0
WACC 8.0
DCF valuation estimate (THB b) (THB/share) Comments
NPV 24.5 20.4 WACC 8.0%, Risk-free rate 3%, Risk premium 8%
Terminal value 48.5 40.4 Terminal growth 3%
Cash & liquid assets 0.6 0.5 At end-2022E
Investments 0.0 0.0 At end-2022E
Debt (8.5) (7.1) At end-2022E
Minorities (5.2) (4.3) At end-2022E
Residual ordinary equity 60.0 50.0
Final TP 45.0 Applied 10% liquidity discount
Source: FSSIA estimates
378
121
50 40 38 30 28 9
0
50
100
150
200
250
300
350
400
BDMS BH BCH CHG RAM VIBHA THG PR9
(THB b)Market cap
21 22
2931
44
54
0
10
20
30
40
50
60
RAM BCH VIBHA THG BDMS CHG
Market cap/bed(THB m/bed)
Ramkhamhaeng Hospital RAM TB Teerapol Udomvej, CFA
6 FINANSIA 8 NOVEMBER 2021
Exhibit 11: Peers comparison as of 8 Nov 2021
Company BBG Rec ---------- Share price --------- Market ------ PE ------ ---- ROE ---- ---- PBV ---- EV/ EBITDA
Current Target Upside Cap 21E 22E 21E 22E 21E 22E 21E 22E
(LCY) (LCY) (%) (USD m) (x) (x) (%) (%) (x) (x) (x) (x)
Thailand
Bangkok Dusit Med Service BDMS TB BUY 23.80 29.00 21.8 11,459 54.7 37.5 8.1 11.6 4.5 4.2 24.3 18.7
Bumrungrad Hospital BH TB BUY 152.50 170.00 11.5 3,671 127.0 51.4 5.4 13.2 7.1 6.5 50.8 27.6
Bangkok Chain Hospital BCH TB BUY 19.90 28.50 43.2 1,503 11.7 26.9 48.6 17.8 4.7 4.9 7.9 15.1
Chularat Hospital CHG TB BUY 3.68 4.70 27.7 1,226 16.8 28.7 48.6 24.0 6.9 6.9 11.6 18.4
Praram 9 Hospital PR9 TB BUY 11.00 14.00 27.3 262 43.7 24.1 4.7 8.3 2.0 1.9 14.9 10.7
Thonburi Healthcare Group THG TB HOLD 33.75 27.50 (18.5) 863 99.6 68.8 3.6 5.2 3.6 3.5 28.1 25.4
Vibhavadi Medical Center VIBHA TB BUY 2.24 2.80 25.0 921 47.0 37.8 8.6 8.8 3.6 2.8 28.7 24.6
Ramkhamhaeng Hospital RAM TB BUY 32.00 45.00 40.6 1,163 22.5 21.9 13.6 13.9 3.1 3.0 15.7 15.6
Rajthanee Hospital RJH TB n/a 32.25 n/a n/a 288 14.6 20.5 39.7 25.8 6.5 5.5 9.5 13.2
Ekachai Medical Care EKH TB n/a 7.65 n/a n/a 139 17.9 25.5 26.5 16.5 5.3 4.7 10.8 14.2
Thailand average 21,496 45.6 34.3 20.7 14.5 4.7 4.4 20.2 18.4
Regional
Ramsay Health Care RHC AU n/a 72.98 n/a n/a 12,381 35.5 32.6 11.3 12.1 4.1 4.0 13.3 12.5
Ihh Healthcare Bhd IHH SP n/a 2.10 n/a n/a 13,687 42.9 37.4 5.8 6.1 2.5 2.4 17.1 16.0
Ryman Healthcare RYM NZ n/a 14.49 n/a n/a 5,194 31.2 25.6 12.2 8.8 3.2 2.9 34.7 25.7
Apollo Hospitals Enterprise APHS IN n/a 4,405 n/a n/a 8,548 737.8 75.8 2.4 15.8 17.4 15.0 57.9 31.1
Kpj Healthcare Berhad KPJ MK n/a 1.12 n/a n/a 1,162 58.9 26.7 3.9 8.4 2.5 2.2 16.2 12.2
Raffles Medical Group RFMD SP n/a 1.39 n/a n/a 1,928 33.9 33.9 8.4 8.6 3.0 2.8 18.9 17.8
Mitra Keluarga Karyasehat MIKA IJ n/a 2,250 n/a n/a 2,248 29.0 30.7 20.6 18.0 6.6 5.7 18.6 19.6
Aier Eye Hospital Group 300015 CH n/a 47.70 n/a n/a 40,323 105.8 80.4 20.2 22.2 30.2 20.8 61.5 48.7
Regional average 85,471 134.4 42.9 10.6 12.5 8.7 7.0 29.8 23.0
Overall average 106,967 85.0 38.1 16.2 13.6 6.5 5.5 24.5 20.4
Sources: Bloomberg; FSSIA estimates
Ramkhamhaeng Hospital RAM TB Teerapol Udomvej, CFA
7 FINANSIA 8 NOVEMBER 2021
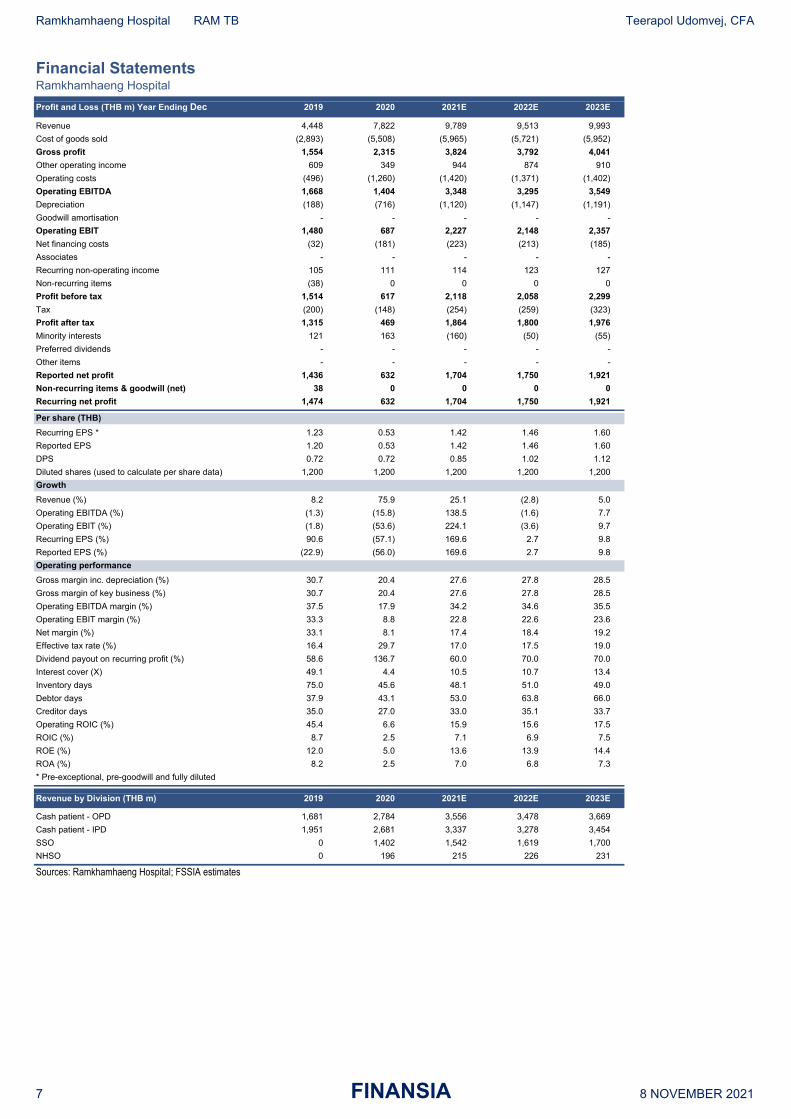
Financial Statements Ramkhamhaeng Hospital
Profit and Loss (THB m) Year Ending Dec 2019 2020 2021E 2022E 2023E
Revenue 4,448 7,822 9,789 9,513 9,993
Cost of goods sold (2,893) (5,508) (5,965) (5,721) (5,952)
Gross profit 1,554 2,315 3,824 3,792 4,041
Other operating income 609 349 944 874 910
Operating costs (496) (1,260) (1,420) (1,371) (1,402)
Operating EBITDA 1,668 1,404 3,348 3,295 3,549
Depreciation (188) (716) (1,120) (1,147) (1,191)
Goodwill amortisation - - - - -
Operating EBIT 1,480 687 2,227 2,148 2,357
Net financing costs (32) (181) (223) (213) (185)
Associates - - - - -
Recurring non-operating income 105 111 114 123 127
Non-recurring items (38) 0 0 0 0
Profit before tax 1,514 617 2,118 2,058 2,299
Tax (200) (148) (254) (259) (323)
Profit after tax 1,315 469 1,864 1,800 1,976
Minority interests 121 163 (160) (50) (55)
Preferred dividends - - - - -
Other items - - - - -
Reported net profit 1,436 632 1,704 1,750 1,921
Non-recurring items & goodwill (net) 38 0 0 0 0
Recurring net profit 1,474 632 1,704 1,750 1,921
Per share (THB)
Recurring EPS * 1.23 0.53 1.42 1.46 1.60
Reported EPS 1.20 0.53 1.42 1.46 1.60
DPS 0.72 0.72 0.85 1.02 1.12
Diluted shares (used to calculate per share data) 1,200 1,200 1,200 1,200 1,200
Growth
Revenue (%) 8.2 75.9 25.1 (2.8) 5.0
Operating EBITDA (%) (1.3) (15.8) 138.5 (1.6) 7.7
Operating EBIT (%) (1.8) (53.6) 224.1 (3.6) 9.7
Recurring EPS (%) 90.6 (57.1) 169.6 2.7 9.8
Reported EPS (%) (22.9) (56.0) 169.6 2.7 9.8
Operating performance
Gross margin inc. depreciation (%) 30.7 20.4 27.6 27.8 28.5
Gross margin of key business (%) 30.7 20.4 27.6 27.8 28.5
Operating EBITDA margin (%) 37.5 17.9 34.2 34.6 35.5
Operating EBIT margin (%) 33.3 8.8 22.8 22.6 23.6
Net margin (%) 33.1 8.1 17.4 18.4 19.2
Effective tax rate (%) 16.4 29.7 17.0 17.5 19.0
Dividend payout on recurring profit (%) 58.6 136.7 60.0 70.0 70.0
Interest cover (X) 49.1 4.4 10.5 10.7 13.4
Inventory days 75.0 45.6 48.1 51.0 49.0
Debtor days 37.9 43.1 53.0 63.8 66.0
Creditor days 35.0 27.0 33.0 35.1 33.7
Operating ROIC (%) 45.4 6.6 15.9 15.6 17.5
ROIC (%) 8.7 2.5 7.1 6.9 7.5
ROE (%) 12.0 5.0 13.6 13.9 14.4
ROA (%) 8.2 2.5 7.0 6.8 7.3
* Pre-exceptional, pre-goodwill and fully diluted
Revenue by Division (THB m) 2019 2020 2021E 2022E 2023E
Cash patient - OPD 1,681 2,784 3,556 3,478 3,669
Cash patient - IPD 1,951 2,681 3,337 3,278 3,454
SSO 0 1,402 1,542 1,619 1,700
NHSO 0 196 215 226 231
Sources: Ramkhamhaeng Hospital; FSSIA estimates
Ramkhamhaeng Hospital RAM TB Teerapol Udomvej, CFA
8 FINANSIA 8 NOVEMBER 2021
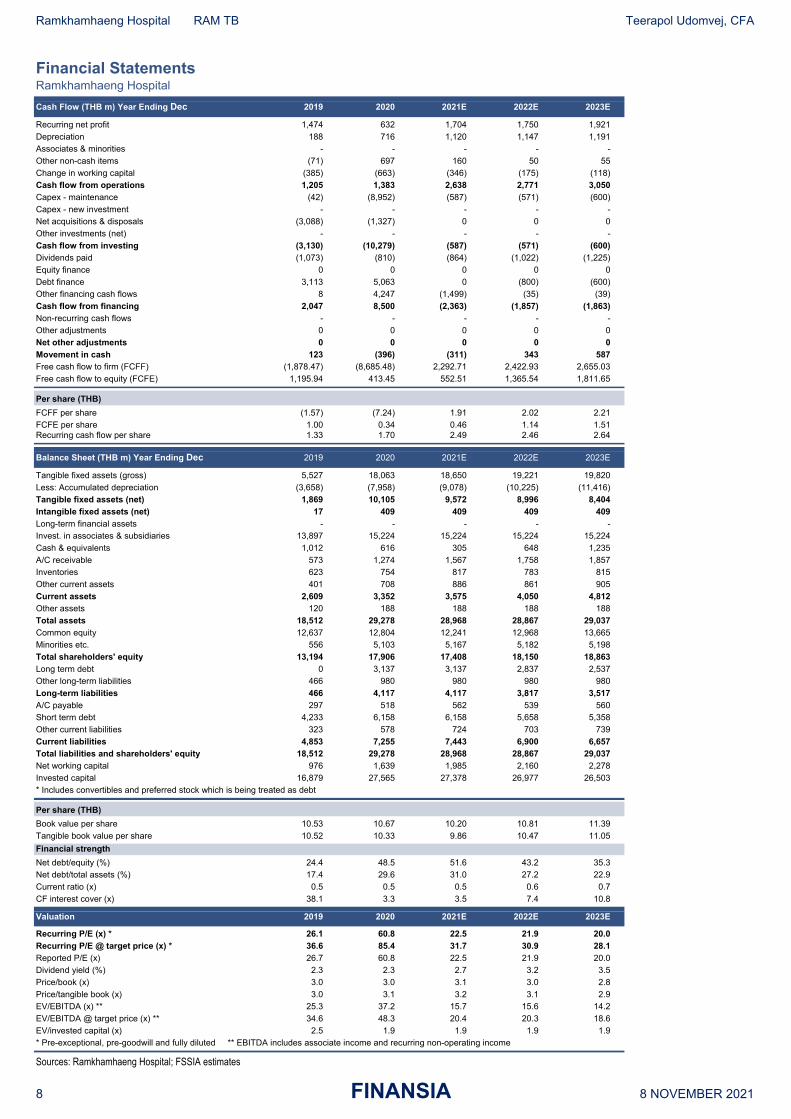
Financial Statements Ramkhamhaeng Hospital
Cash Flow (THB m) Year Ending Dec 2019 2020 2021E 2022E 2023E
Recurring net profit 1,474 632 1,704 1,750 1,921
Depreciation 188 716 1,120 1,147 1,191
Associates & minorities - - - - -
Other non-cash items (71) 697 160 50 55
Change in working capital (385) (663) (346) (175) (118)
Cash flow from operations 1,205 1,383 2,638 2,771 3,050
Capex - maintenance (42) (8,952) (587) (571) (600)
Capex - new investment - - - - -
Net acquisitions & disposals (3,088) (1,327) 0 0 0
Other investments (net) - - - - -
Cash flow from investing (3,130) (10,279) (587) (571) (600)
Dividends paid (1,073) (810) (864) (1,022) (1,225)
Equity finance 0 0 0 0 0
Debt finance 3,113 5,063 0 (800) (600)
Other financing cash flows 8 4,247 (1,499) (35) (39)
Cash flow from financing 2,047 8,500 (2,363) (1,857) (1,863)
Non-recurring cash flows - - - - -
Other adjustments 0 0 0 0 0
Net other adjustments 0 0 0 0 0
Movement in cash 123 (396) (311) 343 587
Free cash flow to firm (FCFF) (1,878.47) (8,685.48) 2,292.71 2,422.93 2,655.03
Free cash flow to equity (FCFE) 1,195.94 413.45 552.51 1,365.54 1,811.65
Per share (THB)
FCFF per share (1.57) (7.24) 1.91 2.02 2.21
FCFE per share 1.00 0.34 0.46 1.14 1.51 Recurring cash flow per share 1.33 1.70 2.49 2.46 2.64
Balance Sheet (THB m) Year Ending Dec 2019 2020 2021E 2022E 2023E
Tangible fixed assets (gross) 5,527 18,063 18,650 19,221 19,820
Less: Accumulated depreciation (3,658) (7,958) (9,078) (10,225) (11,416)
Tangible fixed assets (net) 1,869 10,105 9,572 8,996 8,404
Intangible fixed assets (net) 17 409 409 409 409
Long-term financial assets - - - - -
Invest. in associates & subsidiaries 13,897 15,224 15,224 15,224 15,224
Cash & equivalents 1,012 616 305 648 1,235
A/C receivable 573 1,274 1,567 1,758 1,857
Inventories 623 754 817 783 815
Other current assets 401 708 886 861 905
Current assets 2,609 3,352 3,575 4,050 4,812
Other assets 120 188 188 188 188
Total assets 18,512 29,278 28,968 28,867 29,037
Common equity 12,637 12,804 12,241 12,968 13,665
Minorities etc. 556 5,103 5,167 5,182 5,198
Total shareholders' equity 13,194 17,906 17,408 18,150 18,863
Long term debt 0 3,137 3,137 2,837 2,537
Other long-term liabilities 466 980 980 980 980
Long-term liabilities 466 4,117 4,117 3,817 3,517
A/C payable 297 518 562 539 560
Short term debt 4,233 6,158 6,158 5,658 5,358
Other current liabilities 323 578 724 703 739
Current liabilities 4,853 7,255 7,443 6,900 6,657
Total liabilities and shareholders' equity 18,512 29,278 28,968 28,867 29,037
Net working capital 976 1,639 1,985 2,160 2,278
Invested capital 16,879 27,565 27,378 26,977 26,503
* Includes convertibles and preferred stock which is being treated as debt
Per share (THB)
Book value per share 10.53 10.67 10.20 10.81 11.39
Tangible book value per share 10.52 10.33 9.86 10.47 11.05
Financial strength
Net debt/equity (%) 24.4 48.5 51.6 43.2 35.3
Net debt/total assets (%) 17.4 29.6 31.0 27.2 22.9
Current ratio (x) 0.5 0.5 0.5 0.6 0.7
CF interest cover (x) 38.1 3.3 3.5 7.4 10.8
Valuation 2019 2020 2021E 2022E 2023E
Recurring P/E (x) * 26.1 60.8 22.5 21.9 20.0
Recurring P/E @ target price (x) * 36.6 85.4 31.7 30.9 28.1
Reported P/E (x) 26.7 60.8 22.5 21.9 20.0
Dividend yield (%) 2.3 2.3 2.7 3.2 3.5
Price/book (x) 3.0 3.0 3.1 3.0 2.8
Price/tangible book (x) 3.0 3.1 3.2 3.1 2.9
EV/EBITDA (x) ** 25.3 37.2 15.7 15.6 14.2
EV/EBITDA @ target price (x) ** 34.6 48.3 20.4 20.3 18.6
EV/invested capital (x) 2.5 1.9 1.9 1.9 1.9
* Pre-exceptional, pre-goodwill and fully diluted ** EBITDA includes associate income and recurring non-operating income
Sources: Ramkhamhaeng Hospital; FSSIA estimates
Ramkhamhaeng Hospital RAM TB Teerapol Udomvej, CFA
9 FINANSIA 8 NOVEMBER 2021
Corporate Governance report of Thai listed companies 2020
EXCELLENT LEVEL AAV ADVANC AF AIRA AKP AKR ALT AMA AMATA AMATAV ANAN AOT AP ARIP ARROW ASP BAFS BANPU BAY BCP BCPG BDMS BEC BEM BGRIM BIZ BKI BLA BOL BPP BRR BTS BWG CENTEL CFRESH CHEWA CHO CIMBT CK CKP CM CNT COL COMAN COTTO CPALL CPF CPI CPN CSS DELTA DEMCO DRT DTAC DTC DV8 EA EASTW ECF ECL EGCO EPG ETE FNS FPI FPT FSMART GBX GC GCAP GEL GFPT GGC GPSC GRAMMY GUNKUL HANA HARN HMPRO ICC ICHI III ILINK INTUCH IRPC IVL JKN JSP JWD K KBANK KCE KKP KSL KTB KTC LANNA LH LHFG LIT LPN MAKRO MALEE MBK MBKET MC MCOT METCO MFEC MINT MONO MOONG MSC MTC NCH NCL NEP NKI NOBLE NSI NVD NYT OISHI ORI OTO PAP PCSGH PDJ PG PHOL PLANB PLANET PLAT PORT PPS PR9 PREB PRG PRM PSH PSL PTG PTT PTTEP PTTGC PYLON Q-CON QH QTC RATCH RS S S & J SAAM SABINA SAMART SAMTEL SAT SC SCB SCC SCCC SCG SCN SDC SEAFCO SEAOIL SE-ED SELIC SENA SIRI SIS SITHAI SMK SMPC SNC SONIC SORKON SPALI SPI SPRC SPVI SSSC SST STA SUSCO SUTHA SVI SYMC SYNTEC TACC TASCO TCAP TFMAMA THANA THANI THCOM THG THIP THRE THREL TIP TIPCO TISCO TK TKT TTB TMILL TNDT TNL TOA TOP TPBI TQM TRC TSC TSR TSTE TSTH TTA TTCL TTW TU TVD TVI TVO TWPC U UAC UBIS UV VGI VIH WACOAL WAVE WHA WHAUP WICE WINNER TRUE
VERY GOOD LEVEL 2S ABM ACE ACG ADB AEC AEONTS AGE AH AHC AIT ALLA AMANAH AMARIN APCO APCS APURE AQUA ASAP ASEFA ASIA ASIAN ASIMAR ASK ASN ATP30 AUCT AWC AYUD B BA BAM BBL BFIT BGC BJC BJCHI BROOK BTW CBG CEN CGH CHARAN CHAYO CHG CHOTI CHOW CI CIG CMC COLOR COM7 CPL CRC CRD CSC CSP CWT DCC DCON DDD DOD DOHOME EASON EE ERW ESTAR FE FLOYD FN FORTH FSS FTE FVC GENCO GJS GL GLAND GLOBAL GLOCON GPI GULF GYT HPT HTC ICN IFS ILM IMH INET INSURE IRC IRCP IT ITD ITEL J JAS JCK JCKH JMART JMT KBS KCAR KGI KIAT KOOL KTIS KWC KWM L&E LALIN LDC LHK LOXLEY LPH LRH LST M MACO MAJOR MBAX MEGA META MFC MGT MILL MITSIB MK MODERN MTI MVP NETBAY NEX NINE NTV NWR OCC OGC OSP PATO PB PDG PDI PICO PIMO PJW PL PM PPP PRIN PRINC PSTC PT QLT RCL RICHY RML RPC RWI S11 SALEE SAMCO SANKO SAPPE SAWAD SCI SCP SE SEG SFP SGF SHR SIAM SINGER SKE SKR SKY SMIT SMT SNP SPA SPC SPCG SR SRICHA SSC SSF STANLY STI STPI SUC SUN SYNEX T TAE TAKUNI TBSP TCC TCMC TEAM TEAMG TFG TIGER TITLE TKN TKS TM TMC TMD TMI TMT TNITY TNP TNR TOG TPA TPAC TPCORP TPOLY TPS TRITN TRT TRU TSE TVT TWP UEC UMI UOBKH UP UPF UPOIC UT UTP UWC VL VNT VPO WIIK WP XO YUASA ZEN ZIGA ZMICO
GOOD LEVEL 7UP A ABICO AJ ALL ALUCON AMC APP ARIN AS AU B52 BC BCH BEAUTY BGT BH BIG BKD BLAND BM BR BROCK BSBM BSM BTNC CAZ CCP CGD CITY CMAN CMO CMR CPT CPW CRANE CSR D EKH EP ESSO FMT GIFT GREEN GSC GTB HTECH HUMAN IHL INOX INSET IP JTS JUBILE KASET KCM KKC KUMWEL KUN KWG KYE LEE MATCH MATI M-CHAI MCS MDX MJD MM MORE NC NDR NER NFC NNCL NPK NUSA OCEAN PAF PF PK PLE PMTA POST PPM PRAKIT PRECHA PRIME PROUD PTL RBF RCI RJH ROJNA RP RPH RSP SF SFLEX SGP SISB SKN SLP SMART SOLAR SPG SQ SSP STARK STC SUPER SVOA TC TCCC THMUI TIW TNH TOPP TPCH TPIPP TPLAS TTI TYCN UKEM UMS VCOM VRANDA WIN WORK WPH
Description Score Range
Excellent 90-100
Very Good 80-89
Good 70-79
Disclaimer: The disclosure of the survey results of the Thai Institute of Directors Association (‘IOD”) regarding corporate governance is made pursuant to the policy of the Office of the Securities and Exchange Commission. The survey of the IOD is based on the information of a company listed on the Stock Exchange of Thailand and the Market for Alternative Investment disclosed to the public and able to be accessed by a general public investor. The result, therefore, is from the perspective of a third party. It is not an evaluation of operation and is not based on inside information. The survey result is as of the date appearing in the Corporate Governance Report of Thai Listed Companies. As a result, the survey results may be changed after that date. FSS International Investment Advisory Company Limited does not confirm nor certify the accuracy of such survey results. * CGR scoring should be considered with news regarding wrong doing of the company or director or executive of the company such unfair practice on securities trading, fraud, and corruption SEC imposed a civil sanction against insider trading of director and executive; ** delisted Source: Thai Institute of Directors Association (IOD); FSSIA’s compilation

Ramkhamhaeng Hospital RAM TB Teerapol Udomvej, CFA
10 FINANSIA 8 NOVEMBER 2021
Anti-corruption Progress Indicator 2020 CERTIFIED
2S ADVANC AI AIE AIRA AKP AMA AMANAH AP AQUA ARROW
ASK ASP AYUD B BAFS BANPU BAY BBL BCH BCP BCPG
BGC BGRIM BJCHI BKI BLA BPP BROOK BRR BSBM BTS BWG
CEN CENTEL CFRESH CGH CHEWA CHOTI CHOW CIG CIMBT CM CMC
COL COM7 CPALL CPF CPI CPN CSC DCC DELTA DEMCO DIMET
DRT DTAC DTC EASTW ECL EGCO FE FNS FPI FPT FSS
FTE GBX GC GCAP GEL GFPT GGC GJS GPSC GSTEEL GUNKUL
HANA HARN HMPRO HTC ICC ICHI IFS INET INSURE INTUCH IRPC
ITEL IVL K KASET KBANK KBS KCAR KCE KGI KKP KSL
KTB KTC KWC L&E LANNA LHFG LHK LPN LRH M MAKRO
MALEE MBAX MBK MBKET MC MCOT MFC MFEC MINT MONO MOONG
MPG MSC MTC MTI NBC NEP NINE NKI NMG NNCL NSI
NWR OCC OCEAN OGC ORI PAP PATO PB PCSGH PDG PDI
PDJ PE PG PHOL PL PLANB PLANET PLAT PM PPP PPPM
PPS PREB PRG PRINC PRM PSH PSL PSTC PT PTG PTT
PTTEP PTTGC PYLON Q-CON QH QLT QTC RATCH RML RWI S & J
SABINA SAT SC SCB SCC SCCC SCG SCN SEAOIL SE-ED SELIC
SENA SGP SIRI SITHAI SMIT SMK SMPC SNC SNP SORKON SPACK
SPC SPI SPRC SRICHA SSF SSSC SST STA SUSCO SVI SYNTEC
TAE TAKUNI TASCO TBSP TCAP TCMC TFG TFI TFMAMA THANI THCOM
THIP THRE THREL TIP TIPCO TISCO TKT TTB TMD TMILL TMT
TNITY TNL TNP TNR TOG TOP TPA TPCORP TPP TRU TSC
TSTH TTCL TU TVD TVI TVO TWPC U UBIS UEC UKEM
UOBKH UWC VGI VIH VNT WACOAL WHA WHAUP WICE WIIK XO
ZEN TRUE
DECLARED
7UP ABICO AF ALT AMARIN AMATA AMATAV ANAN APURE B52 BKD
BM BROCK BUI CHO CI COTTO DDD EA EFORL EP ERW
ESTAR ETE EVER FSMART GPI ILINK IRC J JKN JMART JMT
JSP JTS KWG LDC MAJOR META NCL NOBLE NOK PK PLE
ROJNA SAAM SAPPE SCI SE SHANG SINGER SKR SPALI SSP STANLY
SUPER SYNEX THAI TKS TOPP TRITN TTA UPF UV WIN ZIGA
Level
Certified This level indicates practical participation with thoroughly examination in relation to the recommended procedures from the audit committee or the SEC’s certified auditor, being a certified member of Thailand's Private Sector Collective Action Coalition Against Corruption programme (Thai CAC) or already passed examination to ensure independence from external parties.
Declared This level indicates determination to participate in the Thailand's Private Sector Collective Action Coalition Against Corruption programme (Thai CAC)
Disclaimer: The disclosure of the Anti-Corruption Progress Indicators of a listed company on the Stock Exchange of Thailand, which is assessed by Thaipat Institute, is made in order to comply with the policy and sustainable development plan for the listed companies of th e Office of the Securities and Exchange Commission. Thaipat Institute made this assessment based on the information received from the listed company, as stipulated in the form for the assessment of Anti-corruption which refers to the Annual Registration Statement (Form 56-1), Annual Report (Form 56-2), or other relevant documents or reports of such listed company . The assessment result is therefore made from the perspective of Thaipat Institute that is a third party. It is not an assessment of operation and is not based on any inside information. Since this assessment is only the assessment result as of the date appearing in the assessment result, it may be changed after that date or when there is any change to the relevant information. Nevertheless, FSS International Investment Advisory Company Limited does not confirm, verify, or certify the accuracy and completeness of the assessment results.
Note: Companies participating in Thailand's Private Sector Collective Action Coalition Against Corruption programme (Thai CAC) under Thai Institute of Directors (as of June 24, 2019) are categorised into: 1) companies that have declared their intention to join CAC, and; 2) companies certified by CAC. Source: The Securities and Exchange Commission, Thailand; * FSSIA’s compilation
Ramkhamhaeng Hospital RAM TB Teerapol Udomvej, CFA
11 FINANSIA 8 NOVEMBER 2021
GENERAL DISCLAIMER
ANALYST(S) CERTIFICATION
Teerapol Udomvej, CFA FSS International Investment Advisory Securities Co., Ltd
The individual(s) identified above certify(ies) that (i) all views expressed in this report accurately reflect the personal view of the analyst(s) with regard to
any and all of the subject securities, companies or issuers mentioned in this report; and (ii) no part of the compensation of the analyst(s) was, is, or will
be, directly or indirectly, related to the specific recommendations or views expressed herein.
This report has been prepared by FSS International Investment Advisory Company Limited (FSSIA). The information herein has been obtained from
sources believed to be reliable and accurate; however FSS makes no representation as to the accuracy and completeness of such information.
Information and opinions expressed herein are subject to change without notice. FSS has no intention to solicit investors to buy or sell any security in
this report. In addition, FSS does not guarantee returns nor price of the securities described in the report nor accept any liability for any loss or damage
of any kind arising out of the use of such information or opinions in this report. Investors should study this report carefully in making investment
decisions. All rights are reserved.
This report may not be reproduced, distributed or published by any person in any manner for any purpose without permission of FSSIA. Investment in
securities has risks. Investors are advised to consider carefully before making investment decisions.
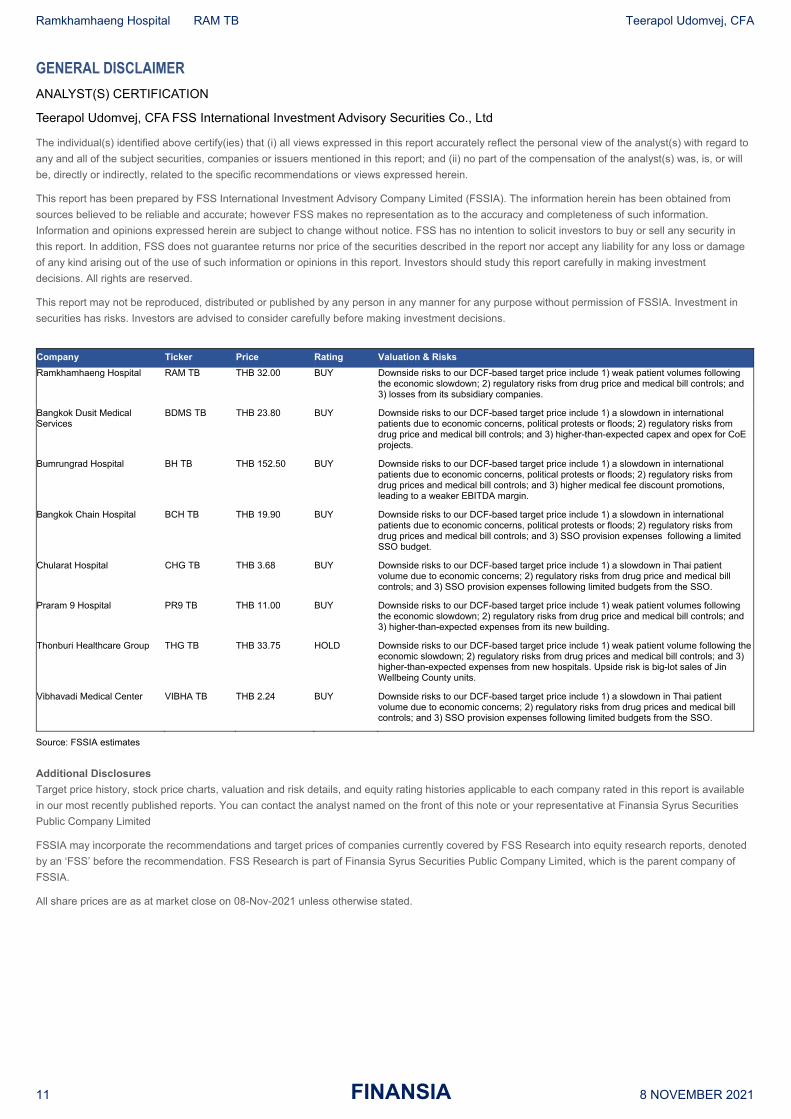
Company Ticker Price Rating Valuation & Risks
Ramkhamhaeng Hospital RAM TB THB 32.00 BUY Downside risks to our DCF-based target price include 1) weak patient volumes following the economic slowdown; 2) regulatory risks from drug price and medical bill controls; and 3) losses from its subsidiary companies.
Bangkok Dusit Medical Services
BDMS TB THB 23.80 BUY Downside risks to our DCF-based target price include 1) a slowdown in international patients due to economic concerns, political protests or floods; 2) regulatory risks from drug price and medical bill controls; and 3) higher-than-expected capex and opex for CoE projects.
Bumrungrad Hospital BH TB THB 152.50 BUY Downside risks to our DCF-based target price include 1) a slowdown in international patients due to economic concerns, political protests or floods; 2) regulatory risks from drug prices and medical bill controls; and 3) higher medical fee discount promotions, leading to a weaker EBITDA margin.
Bangkok Chain Hospital BCH TB THB 19.90 BUY Downside risks to our DCF-based target price include 1) a slowdown in international patients due to economic concerns, political protests or floods; 2) regulatory risks from drug prices and medical bill controls; and 3) SSO provision expenses following a limited SSO budget.
Chularat Hospital CHG TB THB 3.68 BUY Downside risks to our DCF-based target price include 1) a slowdown in Thai patient volume due to economic concerns; 2) regulatory risks from drug price and medical bill controls; and 3) SSO provision expenses following limited budgets from the SSO.
Praram 9 Hospital PR9 TB THB 11.00 BUY Downside risks to our DCF-based target price include 1) weak patient volumes following the economic slowdown; 2) regulatory risks from drug price and medical bill controls; and 3) higher-than-expected expenses from its new building.
Thonburi Healthcare Group THG TB THB 33.75 HOLD Downside risks to our DCF-based target price include 1) weak patient volume following the economic slowdown; 2) regulatory risks from drug prices and medical bill controls; and 3) higher-than-expected expenses from new hospitals. Upside risk is big-lot sales of Jin Wellbeing County units.
Vibhavadi Medical Center VIBHA TB THB 2.24 BUY Downside risks to our DCF-based target price include 1) a slowdown in Thai patient volume due to economic concerns; 2) regulatory risks from drug prices and medical bill controls; and 3) SSO provision expenses following limited budgets from the SSO.
Source: FSSIA estimates
Additional Disclosures
Target price history, stock price charts, valuation and risk details, and equity rating histories applicable to each company rated in this report is available
in our most recently published reports. You can contact the analyst named on the front of this note or your representative at Finansia Syrus Securities
Public Company Limited
FSSIA may incorporate the recommendations and target prices of companies currently covered by FSS Research into equity research reports, denoted
by an ‘FSS’ before the recommendation. FSS Research is part of Finansia Syrus Securities Public Company Limited, which is the parent company of
FSSIA.
All share prices are as at market close on 08-Nov-2021 unless otherwise stated.
Ramkhamhaeng Hospital RAM TB Teerapol Udomvej, CFA
12 FINANSIA 8 NOVEMBER 2021
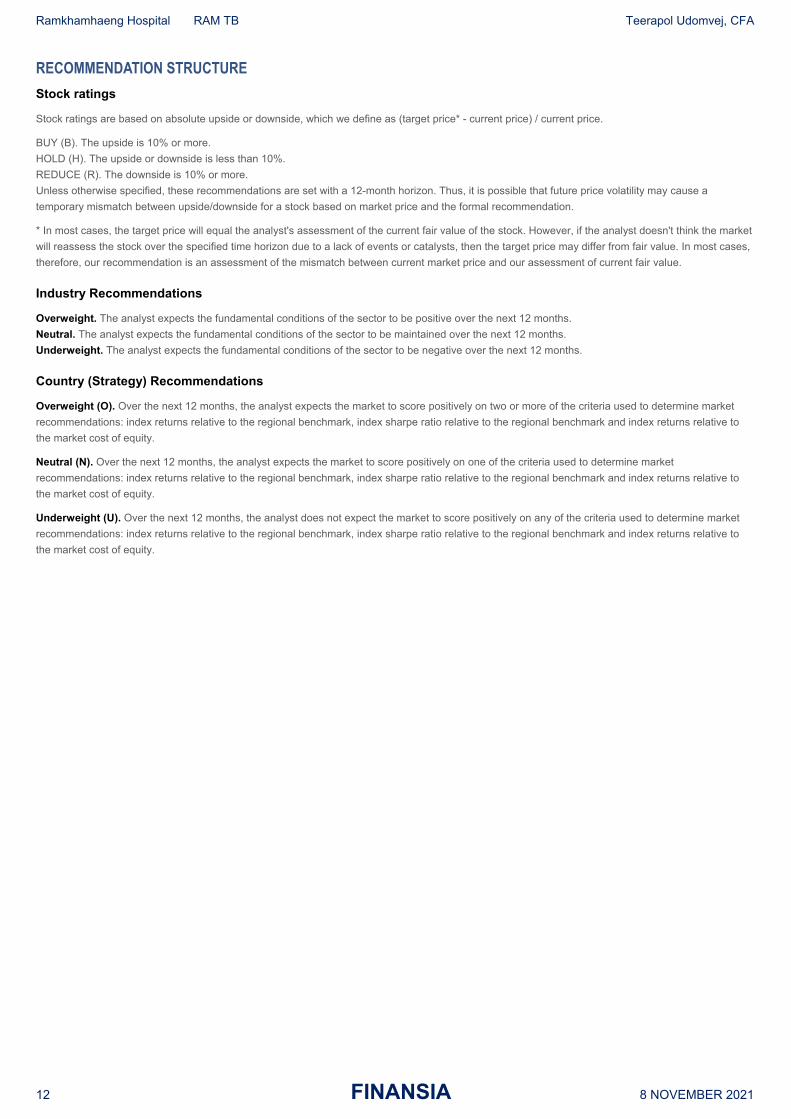
RECOMMENDATION STRUCTURE
Stock ratings
Stock ratings are based on absolute upside or downside, which we define as (target price* - current price) / current price.
BUY (B). The upside is 10% or more.
HOLD (H). The upside or downside is less than 10%.
REDUCE (R). The downside is 10% or more.
Unless otherwise specified, these recommendations are set with a 12-month horizon. Thus, it is possible that future price volatility may cause a
temporary mismatch between upside/downside for a stock based on market price and the formal recommendation.
* In most cases, the target price will equal the analyst's assessment of the current fair value of the stock. However, if the analyst doesn't think the market
will reassess the stock over the specified time horizon due to a lack of events or catalysts, then the target price may differ from fair value. In most cases,
therefore, our recommendation is an assessment of the mismatch between current market price and our assessment of current fair value.
Industry Recommendations
Overweight. The analyst expects the fundamental conditions of the sector to be positive over the next 12 months.
Neutral. The analyst expects the fundamental conditions of the sector to be maintained over the next 12 months.
Underweight. The analyst expects the fundamental conditions of the sector to be negative over the next 12 months.
Country (Strategy) Recommendations
Overweight (O). Over the next 12 months, the analyst expects the market to score positively on two or more of the criteria used to determine market
recommendations: index returns relative to the regional benchmark, index sharpe ratio relative to the regional benchmark and index returns relative to
the market cost of equity.
Neutral (N). Over the next 12 months, the analyst expects the market to score positively on one of the criteria used to determine market
recommendations: index returns relative to the regional benchmark, index sharpe ratio relative to the regional benchmark and index returns relative to
the market cost of equity.
Underweight (U). Over the next 12 months, the analyst does not expect the market to score positively on any of the criteria used to determine market
recommendations: index returns relative to the regional benchmark, index sharpe ratio relative to the regional benchmark and index returns relative to
the market cost of equity.