Embed Size (px)
Citation preview
©CAB International 2011. The Genetics of the Pig,2nd Edn (eds M.F. Rothschild and A. Ruvinsky) 179
Introduction
The systematic characterization and mapping of the porcine genome started in the late 1980s and early 1990s following the emer-gence of genome research stimulated by the Human Genome Organisation (HUGO) with its goal to map and sequence the complete human genome. The EU-funded Pig Gene Mapping Project (PiGMaP) constituted the first internationally coordinated effort to map the porcine genome, and with this, the pig was the first livestock species whose scientific com-munity organized to completely map the pig genome (Haley et al., 1990). The initial efforts of the PiGMaP project focused on the develop-ment of genetic markers in the pig (Davies et al., 1994; Coppieters et al., 1995; Groenen et al., 1995), and the establishment of a genetic linkage map (Archibald et al., 1995) and a cytogenetic map (Echard et al., 1992; Yerle et al., 1995). In September 2003, the sequencing of the complete genome of the pig
formally started with the establishment of the Swine Genome Sequencing Consortium (SGSC) by representatives from academia, government and industry (Schook et al., 2005). The necessary foundation towards this goal had been set up in the previous decade through the development of detailed linkage maps (Ellegren et al., 1994; Rohrer et al., 1994, 1996; Archibald et al., 1995) and phys-ical maps based on a variety of methods such as somatic cell hybrids (Rettenberger et al., 1994, 1996; Yerle et al., 1996), in situ hybridization (Frönicke et al., 1996; Goureau et al., 1996; Chowdhary et al., 1998) and whole-genome radiation hybrid (RH) mapping (Yerle et al., 1998, 2002; Hawken et al., 1999). In this chapter, the focus is on com-parative genome maps, genomic resources, genome variation and sequencing of the por-cine genome. Other maps will be briefly dis-cussed when relevant to these subjects. Because systematic genome mapping in the pig started with the generation of comprehensive linkage
8 Pig Genomics
Martien A.M. Groenen,1 Lawrence B. Schook2 and Alan L. Archibald3
1Wageningen University, The Netherlands; 2University of Illinois, USA; 3The Roslin Institute and University of Edinburgh, UK
Introduction 179Porcine Expressed Sequence Tag (EST) Sequencing and Clustering 180Expression Profiling of the Porcine Transcriptome 180Non-coding and Regulatory RNAs in the Porcine Genome 184Porcine Linkage Maps 185A Highly Continuous BAC Map of the Porcine Genome 185Genome Sequencing and Sequence Assembly 186Comparative Genomics 189Variation in the Porcine Genome 190The Future of Porcine Genomics 193References 194
Rothschild_CH-08.indd 179Rothschild_CH-08.indd 179 9/28/2010 2:45:05 PM9/28/2010 2:45:05 PM
180 M.A.M. Groenen et al.
maps, and because the bacterial artificial chro-mosome (BAC) map of the porcine genome has provided the template for the generation and assembly of the high-quality anchored sequence of the porcine genome (Schook et al, 2005 Humphray et al., 2007), we will also dis-cuss these maps in more detail in this chapter.
Porcine Expressed Sequence Tag (EST) Sequencing and Clustering
Partial sequencing of expressed sequences is an efficient and economical method to rapidly acquire information about the gene content of an organism. Pioneered in the early 1990s by Craig Venter and co-workers (Adams et al., 1991), it has become an important genome resource in functional genomics (expression studies), as well an invaluable tool for the anno-tation of the genome sequence and the con-struction of gene models. The generation of pig ESTs was initiated by several groups (Tuggle et al., 1994; Winterø et al., 1996; Tosser-Klopp et al., 1997); in particular, the Sino–Danish Pig Genome Project has boosted the number of porcine ESTs by sequencing over one million porcine ESTs derived from 97 dif-ferent cDNA (complementary DNA) libraries (Gorodkin et al., 2007). The current (11 December 2009) number of pig ESTs in the Expressed Sequence Tags database (dbEST) at NCBI (the US National Center for Biotechnology Information) is 1,538,441 (http://www.ncbi.nlm.nih.gov/dbEST/index.html) with the most recent UniGene Build (No. 38, 1 August 2009; http://www.ncbi.nlm.nih.gov/unigene/estpro fileviewer) comprising 51,576 different Unigene clusters. Similarly, within the Gene Index Project (Lee et al., 2005), the Computational Biology and Functional Genomics Laboratory at the Dana Farber Cancer Institute has used the porcine EST and mRNA sequences to pro-duce a gene index of transcripts found in the pig. Within this project, more stringent cluster-ing parameters were used, resulting in higher numbers of clusters than obtained with Unigene. Based on 1,319,682 EST and mRNA sequences, the clustering resulted in a total of 104,293 different clusters and 132,636 singleton ESTs (Release 13, July 2008).
Expression Profiling of the Porcine Transcriptome
Although there are numerous methods for the study of the expression of specific genes, for studying gene expression on a genome-wide scale (i.e. for studying all transcripts within a sample – e.g. cell, tissue, etc. – simultane-ously), in essence only two fundamentally different methodologies are utilized. The most widely used technique is based on hybridiza-tion of the transcripts against an array of probes representing all the genes (Schena et al., 1995). The alternative method is to sequence a representative part of all the transcripts present within the sample being analysed and count the number of times a transcript is observed (Velculescu, 1995; Mardis 2008). The first large-scale porcine expression profiling experiments were pio-neered using human microarrays (Medhora et al., 2002; Moody et al., 2002), rapidly followed by the design and use of porcine-specific microarrays (Bai et al., 2003; Nobis et al., 2003). Since that time, the number of porcine-specific microarrays, including com-mercially manufactured arrays, designed and used has increased dramatically (see Table 8.1 for microarray data deposited at the Gene Expression Omnibus of the NCBI). The number of genes and transcripts investigated in these different studies varied dramatically, from a few hundred to thousands. However, even the studies with in which the expression of a few thousands porcine genes were assayed suffered from being incomplete, as there are estimated to be 20,000–25,000 protein- coding genes in the pig genome. Moreover, there are multiple differently spliced transcripts for many of these genes. For comparison, the human genome contains about 23,500 protein-coding genes and encodes more than 140,000 different gene transcripts. Thus, it is only recently, after the completion of a draft sequence of the porcine genome, that it has become possible to design more comprehen-sive microarrays representing the majority of the porcine genes. For a recent more extensive review of the microarray studies per-formed in the pig, readers are referred to the paper by Tuggle et al. (2007).
Rothschild_CH-08.indd 180Rothschild_CH-08.indd 180 9/28/2010 2:45:05 PM9/28/2010 2:45:05 PM

Pig Genomics 181
Table 8.1. Microarray experiments deposited in Gene Expression Omnibus (GEO). The table provides information on the collection of 36 different microarray platforms used for the pig and deposited in the GEO, which is available at http://www.ncbi.nlm.nih.gov/geo/. The GEO is a public functional genomics data repository for microarray data. As of 16 March 2010, the GEO contains submissions for 148 porcine microarray expression data sets based on 38 different GEO platforms (GPLs). The table only shows the 36 platforms related to gene expression microarrays.
GEO accession no.
Approximate no. of genes (max.) Probe type No. of samples Array description Contact
GPL336 870 cDNA 2 Porcine Brain Library array
Steven Paul Suchyta
GPL518 1,272 cDNA 6 UIUC Porcine muscle plus
Yewon Cheon
GPL1209 1,021 cDNA 16 Porcine 1000 embryo gene array
Christopher K. Tuggle
GPL1270 10 SAGE:10:NlaIII:Sus scrofa
GEO
GPL1624 2,423 cDNA 15 PorkChip 2,600 cDNA array
Kendra A. Hyland
GPL1881 12,302 oligo 200 Qiagen-NRSP-8 porcine oligo array
Christopher K. Tuggle
GPL2731 3,456 cDNA 118 Spotting_muscle_21OCT03
Laurence Liaubet
GPL3461 10,665 oligo 104 Duke Operon Porcine 10.5K Oligo Array
Heather Anne Himburg
GPL3533 20,201 oligo 399 [Porcine] Affymetrix Porcine Genome Array
Affymetrix, Inc.
GPL3585 26,877 cDNA 10 DIAS_PIG_55K2_v1 Jakob HedegaardGPL3594 5,375 cDNA 6 DIAS_PIG_27K2_v2 Jakob HedegaardGPL3608 26,877 cDNA 138 DIAS_PIG_55K3_v1 Jakob HedegaardGPL3707 10,665 oligo 30 Pig_Array_Ready
Oligo set v1.0Bhupinder Juneja
GPL3729 9,216 cDNA 84 AGENAE_PigGeneric2_9216
Karine Hugot
GPL3764 192 oligo 36 Porcine oligo micro array version 3
Shila Mortensen
GPL3970 4,608 cDNA 24 scag_scai Sus scrofa 4.6K triplicate array
Gwenola Tosser-Klopp
GPL3971 1,152 cDNA 28 scag_scai Sus scrofa 1.2K mono array
Gwenola Tosser-Klopp
GPL3978 2,854 cDNA 46 INRA Sus scrofa 4K Agnes BonnetGPL4061 10 SAGE:17:NlaIII:Sus
scrofaGEO
GPL4262 2 SAGE:10:Sau3A:Sus scrofa
GEO
GPL4872 9,729 oligo 0 SBTM Microarray Laboratory Operon Pig v1.0
Vincent VanBuren
GPL4930 9,556 oligo 32 Intestinal epithelial crypt and villi in conventional relative to germfree pig
H. Rex Gaskins
GPL5171 656 oligo 38 Pork Quality Operon 70-mer oligo array
Mingzhou Li
Continued
Rothschild_CH-08.indd 181Rothschild_CH-08.indd 181 9/28/2010 2:45:05 PM9/28/2010 2:45:05 PM
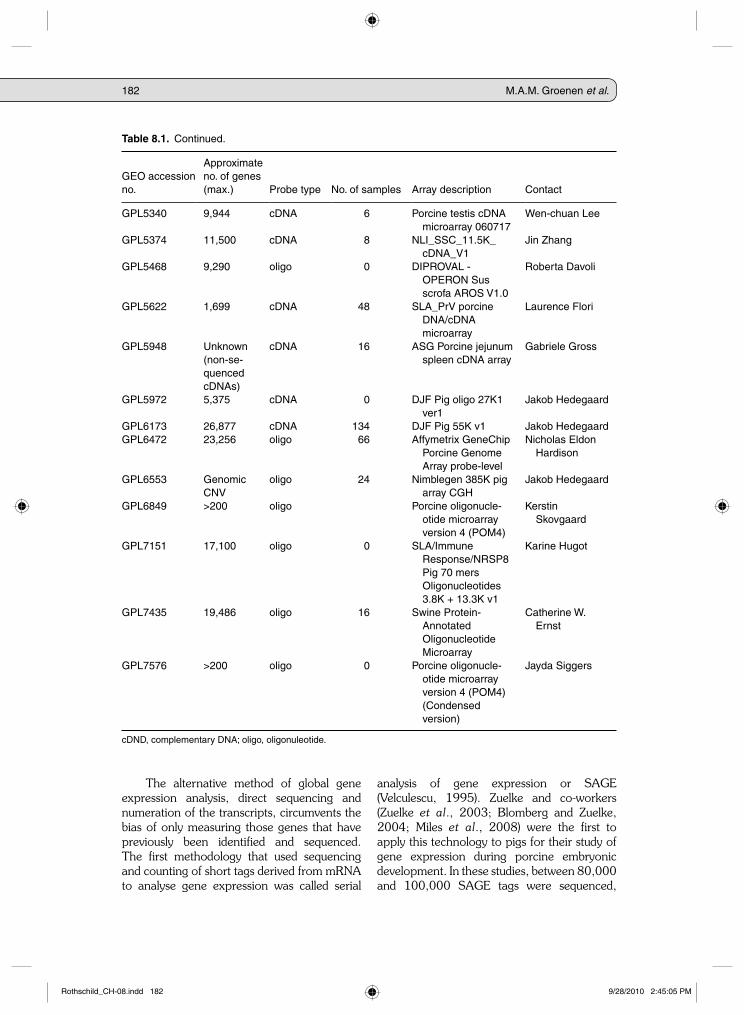
182 M.A.M. Groenen et al.
Table 8.1. Continued.
GEO accession no.
Approximate no. of genes (max.) Probe type No. of samples Array description Contact
GPL5340 9,944 cDNA 6 Porcine testis cDNA microarray 060717
Wen-chuan Lee
GPL5374 11,500 cDNA 8 NLI_SSC_11.5K_cDNA_V1
Jin Zhang
GPL5468 9,290 oligo 0 DIPROVAL - OPERON Sus scrofa AROS V1.0
Roberta Davoli
GPL5622 1,699 cDNA 48 SLA_PrV porcine DNA/cDNA microarray
Laurence Flori
GPL5948 Unknown (non-se-quenced cDNAs)
cDNA 16 ASG Porcine jejunum spleen cDNA array
Gabriele Gross
GPL5972 5,375 cDNA 0 DJF Pig oligo 27K1 ver1
Jakob Hedegaard
GPL6173 26,877 cDNA 134 DJF Pig 55K v1 Jakob HedegaardGPL6472 23,256 oligo 66 Affymetrix GeneChip
Porcine Genome Array probe-level
Nicholas Eldon Hardison
GPL6553 Genomic CNV
oligo 24 Nimblegen 385K pig array CGH
Jakob Hedegaard
GPL6849 >200 oligo Porcine oligonucle-otide microarray version 4 (POM4)
Kerstin Skovgaard
GPL7151 17,100 oligo 0 SLA/Immune Response/NRSP8 Pig 70 mers Oligonucleotides 3.8K + 13.3K v1
Karine Hugot
GPL7435 19,486 oligo 16 Swine Protein-Annotated Oligonucleotide Microarray
Catherine W. Ernst
GPL7576 >200 oligo 0 Porcine oligonucle-otide microarray version 4 (POM4) (Condensed version)
Jayda Siggers
cDND, complementary DNA; oligo, oligonuleotide.
The alternative method of global gene expression analysis, direct sequencing and numeration of the transcripts, circumvents the bias of only measuring those genes that have previously been identified and sequenced. The first methodology that used sequencing and counting of short tags derived from mRNA to analyse gene expression was called serial
analysis of gene expression or SAGE (Velculescu, 1995). Zuelke and co-workers (Zuelke et al., 2003; Blomberg and Zuelke, 2004; Miles et al., 2008) were the first to apply this technology to pigs for their study of gene expression during porcine embryonic development. In these studies, between 80,000 and 100,000 SAGE tags were sequenced,
Rothschild_CH-08.indd 182Rothschild_CH-08.indd 182 9/28/2010 2:45:05 PM9/28/2010 2:45:05 PM
Pig Genomics 183
which represented 20,000–23,000 putative porcine transcripts. However, because at that time the complete sequence of the porcine genome was not yet available, the number of different genes represented by these tags was not known. More recently, SAGE has also been used for the identification of porcine long non-coding RNA (ncRNA) (Ren et al., 2009). Although the SAGE technology circumvents the problem of the absence of sequence informa-tion for many porcine genes, and in principle allows an unbiased and sensitive analysis of gene expression, sequencing costs using traditional Sanger capillary sequencing prohibited exten-sive large-scale studies using this approach.
The opportunities to pursue the approach of assaying gene expression by comprehensive transcript sequencing have been changed dramatically by the recent development of so-called next generation sequence technol-ogy. In particular, the next-generation sequenc-ing technologies that generate millions of short-sequence reads, such as the Illumina GA, ABI SoliD and Helicos sequence technologies, are increasingly being used to study gene expression (Mardis 2008). Next-generation
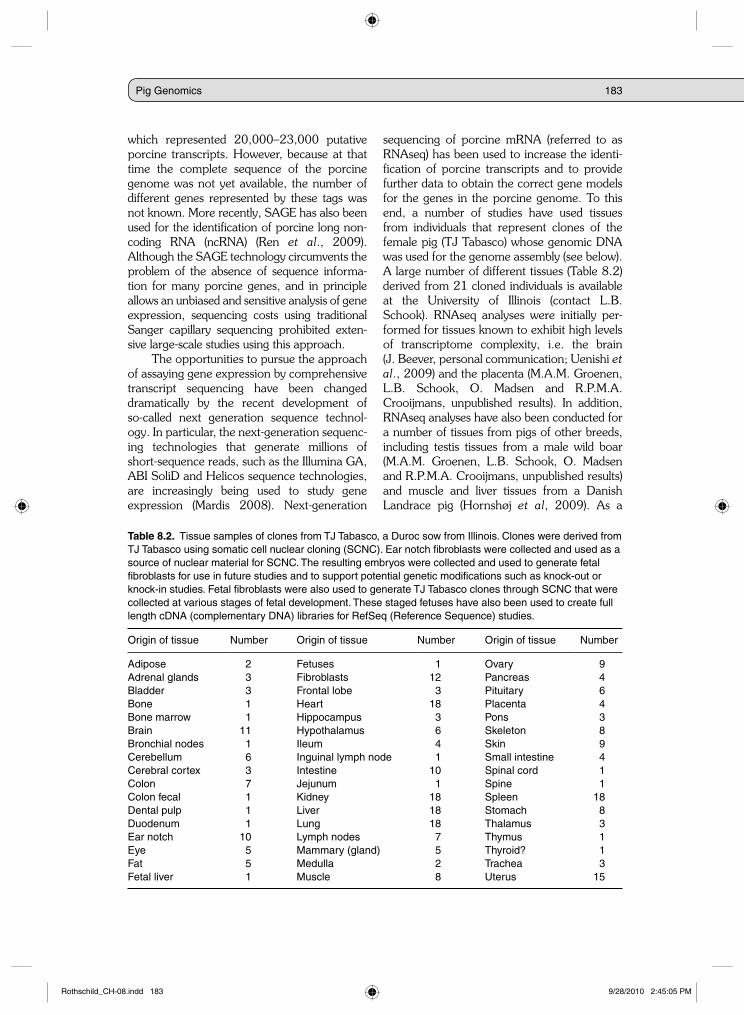
sequencing of porcine mRNA (referred to as RNAseq) has been used to increase the identi-fication of porcine transcripts and to provide further data to obtain the correct gene models for the genes in the porcine genome. To this end, a number of studies have used tissues from individuals that represent clones of the female pig (TJ Tabasco) whose genomic DNA was used for the genome assembly (see below). A large number of different tissues (Table 8.2) derived from 21 cloned individuals is available at the University of Illinois (contact L.B. Schook). RNAseq analyses were initially per-formed for tissues known to exhibit high levels of transcriptome complexity, i.e. the brain (J. Beever, personal communication; Uenishi et al., 2009) and the placenta (M.A.M. Groenen, L.B. Schook, O. Madsen and R.P.M.A. Crooijmans, unpublished results). In addition, RNAseq analyses have also been conducted for a number of tissues from pigs of other breeds, including testis tissues from a male wild boar (M.A.M. Groenen, L.B. Schook, O. Madsen and R.P.M.A. Crooijmans, unpublished results) and muscle and liver tissues from a Danish Landrace pig (Hornshøj et al, 2009). As a
Table 8.2. Tissue samples of clones from TJ Tabasco, a Duroc sow from Illinois. Clones were derived from TJ Tabasco using somatic cell nuclear cloning (SCNC). Ear notch fibroblasts were collected and used as a source of nuclear material for SCNC. The resulting embryos were collected and used to generate fetal fibroblasts for use in future studies and to support potential genetic modifications such as knock-out or knock-in studies. Fetal fibroblasts were also used to generate TJ Tabasco clones through SCNC that were collected at various stages of fetal development. These staged fetuses have also been used to create full length cDNA (complementary DNA) libraries for RefSeq (Reference Sequence) studies.
Origin of tissue Number Origin of tissue Number Origin of tissue Number
Adipose 2 Fetuses 1 Ovary 9Adrenal glands 3 Fibroblasts 12 Pancreas 4Bladder 3 Frontal lobe 3 Pituitary 6Bone 1 Heart 18 Placenta 4Bone marrow 1 Hippocampus 3 Pons 3Brain 11 Hypothalamus 6 Skeleton 8Bronchial nodes 1 Ileum 4 Skin 9Cerebellum 6 Inguinal lymph node 1 Small intestine 4Cerebral cortex 3 Intestine 10 Spinal cord 1Colon 7 Jejunum 1 Spine 1Colon fecal 1 Kidney 18 Spleen 18Dental pulp 1 Liver 18 Stomach 8Duodenum 1 Lung 18 Thalamus 3Ear notch 10 Lymph nodes 7 Thymus 1Eye 5 Mammary (gland) 5 Thyroid? 1Fat 5 Medulla 2 Trachea 3Fetal liver 1 Muscle 8 Uterus 15
Rothschild_CH-08.indd 183Rothschild_CH-08.indd 183 9/28/2010 2:45:05 PM9/28/2010 2:45:05 PM
184 M.A.M. Groenen et al.
further tool for future functional genomics stud-ies, and to improve gene models in the pig, several groups initiated sequencing of cDNA libraries that had been enriched for full-length cDNAs. These include a normalized full-length cDNA library constructed and sequenced from a pool of ten different tissues (kidney, liver, lymph node, cerebellum, placenta, colon, hypothalamus, frontal lobe, spleen, small intes-tine and lung; M.A.M. Groenen, L.B. Schook and R.P.M.A. Crooijmans, unpublished results) and the sequencing of clones derived from 28 full-length-enriched cDNA libraries from 25 different porcine tissue and cell lines, including brain, ovary, colon and hypothalamus from clones of TJ Tabasco (Uenishi et al., 2009).
The availability of the sequence of full-length transcripts of the porcine genome will greatly facilitate the correct identification of the transcription start sites (TSS) of the porcine genes. This is not only extremely important to obtain correct gene models, but also for the pre-cise localization of the porcine promoters. The present algorithms designed to predict regula-tory elements within promoters have often proven unsatisfactory to a large extent because they assume correct identification of the TSS of the genes being compared, something that often is not the case. Although full-length cDNA sequences already provide the necessary infor-mation for correct assignment of TSS, this is further enhanced by the use of cap analysis gene expression (CAGE; Shiraki et al., 2003). As for RNAseq, the combined use of CAGE and next-generation sequencing (also referred to as deepCAGE) adds a further dimension to the methodology, and in particular enables the iden-tification of less frequently used alternative pro-moters and tissue specific promoters (de Hoon and Hayashizaki, 2008). In pigs, deepCage has been done on placenta, testis (M.A.M. Groenen, L.B. Schook and R.P.M.A. Crooijmans, unpub-lished results) and macrophages (D.A. Hume and A.L. Archibald, unpublished results).
Non-coding and Regulatory RNAs in the Porcine Genome
Transcripts that do not encode proteins are referred to as non-protein-coding or non-coding RNAs (ncRNAs). A key question arising from
the observation of widespread transcription is whether these transcripts are biologically func-tional. Increasingly, several specific classes of ncRNAs have been shown to be involved in a wide spectrum of regulatory functions, and an increasing number of such ncRNAs are being discovered in the genomes of metazoans (Mattick, 2009). The best known and most studied class of ncRNAs are the microRNAs (miRNAs), which have been shown to be involved in the regulation of many genes. In addition, numerous other classes of short RNAs, such as Piwi protein-interacting RNA (piRNA) and small nucleolar RNA (snoRNA), and RNAs derived from the XIST locus on the X chromo-some (xiRNAs), have been described (Filipowicz et al., 2008). Likewise, long regulatory inter-genic ncRNAs are increasingly being studied, although is not yet clear to what extent these are functional (Louro et al., 2008). Wernersson et al. (2005) analysed genomic sequence data representing an estimated 50% of the porcine genome for the presence of conserved miRNA sequences. By comparison with the sequences present in the miRNA hairpin database (Griffiths-Jones, 2004), a total of 51 mature miRNA sequences could be identified. To identify novel pig ncRNAs, rather than only ncRNAs that are conserved in other species, Seemann et al. (2007) constructed a bioinformatics pipeline, EST2ncRNA, and searched within the 1 million porcine ESTs for potential functional ncRNAs. Within the 48,000 EST contigs (contiguous sets of overlapping DNA segments) and 73,000 singleton ESTs, they identified 1399 different potential ncRNAs, 137 of which were homolo-gous to known ncRNAs and a further 270 of which overlap with existing human ncRNA pre-dictions. Based on 92 different non-normalized cDNA libraries, the highest number of ncRNA predictions was derived from developmental and neuronal tissues. This high number does not appear to be caused by the complexity of the libraries, as only a small number of ncRNAs were observed in the testis, a tissue normally considered to be among the tissues with the highest different number of expressed genes.
In a preliminary analysis of chromosomes 7 and 14, at the time when sequence coverage of these two chromosomes exceeded 95%, over 850 potential miRNAs were identified, as well as an additional 3000 putative ncRNAs (J. Gorodkin and M. Fredholm, personal
Rothschild_CH-08.indd 184Rothschild_CH-08.indd 184 9/28/2010 2:45:05 PM9/28/2010 2:45:05 PM
Pig Genomics 185
communication). Although the false discovery rate of the ncRNA prediction programs used in this analysis (RNAz and RNAmicro) is relatively high, this nevertheless provides a good indica-tion regarding the abundance of such sequences in the porcine genome. The fact that these two chromosomes together comprise 231 Mb of sequence indicates that the porcine genome would be predicted to contain over 37,000 ncRNAs and over 1000 miRNAs.
Porcine Linkage Maps
The first coordinated efforts to better under-stand the pig genome focused on the genera-tion of linkage maps based on polymorphic DNA markers. The major contributors to this effort have been international collaborative projects based in Europe – the PiGMaP consor-tium (Archibald et al., 1995) and the related Nordic collaboration (Ellegren et al., 1994; Marklund et al., 1996), and the efforts of the USDA Meat Animal Research Center (Rohrer et al., 1994, 1996). These combined efforts resulted in the placement of over 1500 poly-morphic genetic markers on the porcine link-age map. However, integration of all the linkage information from the different studies into a single consensus map was not very practical and has never been attempted. The majority of the markers on the pig linkage map are micro-satellite markers, short sequences comprising 1–4 bp direct repeats of at least eight copies. Because of the abundance of such sequences in the genomes of vertebrates and many other eukaryotes, these have been the markers of
choice for the construction of comprehensive genome-wide linkage maps during the 1990s. In the years following the publication of the first porcine linkage maps, the growth of such link-age maps has slowed. Nevertheless, the number of markers added to these maps has steadily increased through the further mapping of addi-tional new microsatellites and other types of mostly anonymous polymorphic DNA markers, including amplified fragment length polymor-phisms (AFLPs) (Rothschild, 2004) and single nucleotide polymorphisms (SNPs) (Vingborg et al., 2009). Currently, over 5000 loci includ-ing several hundred genes are located on the different maps (www.thearkdb.org). Gradually, efforts to increase the number of markers on the porcine map has shifted towards the use of physical maps such as the RH (radiation hybrid panel) maps (Yerle et al., 1998, 2002; Hawken et al., 1999) and the BAC maps (discussed in the next section).
A Highly Continuous BAC Map of the Porcine Genome
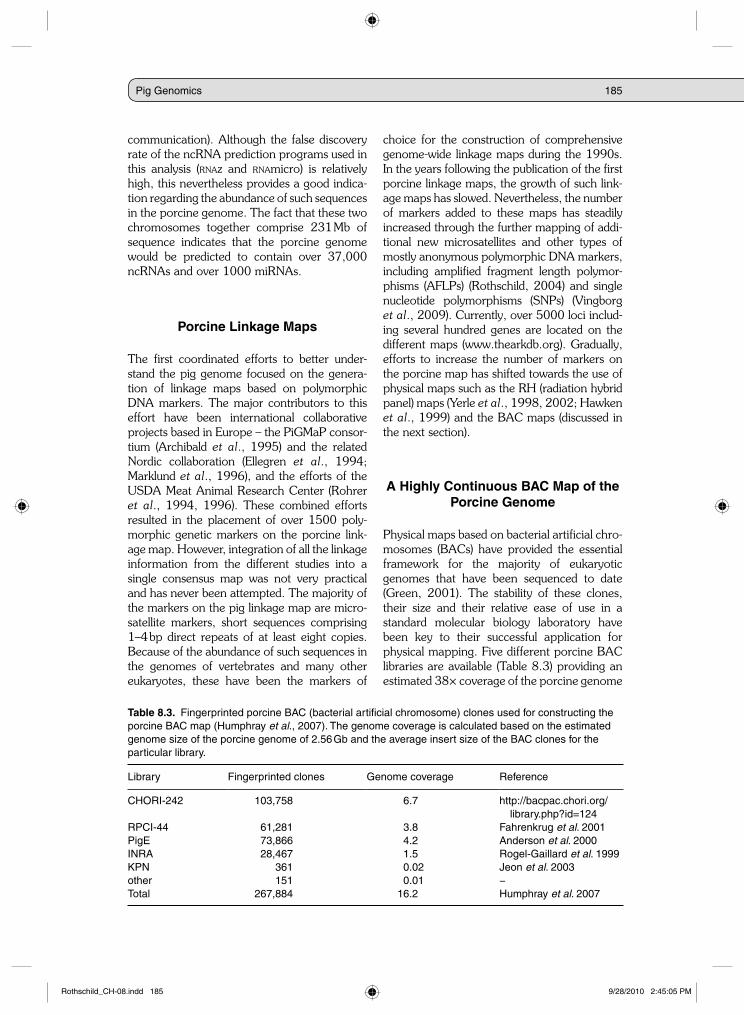
Physical maps based on bacterial artificial chro-mosomes (BACs) have provided the essential framework for the majority of eukaryotic genomes that have been sequenced to date (Green, 2001). The stability of these clones, their size and their relative ease of use in a standard molecular biology laboratory have been key to their successful application for physical mapping. Five different porcine BAC libraries are available (Table 8.3) providing an estimated 38× coverage of the porcine genome
Table 8.3. Fingerprinted porcine BAC (bacterial artificial chromosome) clones used for constructing the porcine BAC map (Humphray et al., 2007). The genome coverage is calculated based on the estimated genome size of the porcine genome of 2.56 Gb and the average insert size of the BAC clones for the particular library.
Library Fingerprinted clones Genome coverage Reference
CHORI-242 103,758 6.7 http://bacpac.chori.org/library.php?id=124
RPCI-44 61,281 3.8 Fahrenkrug et al. 2001PigE 73,866 4.2 Anderson et al. 2000INRA 28,467 1.5 Rogel-Gaillard et al. 1999KPN 361 0.02 Jeon et al. 2003other 151 0.01 −Total 267,884 16.2 Humphray et al. 2007
Rothschild_CH-08.indd 185Rothschild_CH-08.indd 185 9/28/2010 2:45:05 PM9/28/2010 2:45:05 PM
186 M.A.M. Groenen et al.
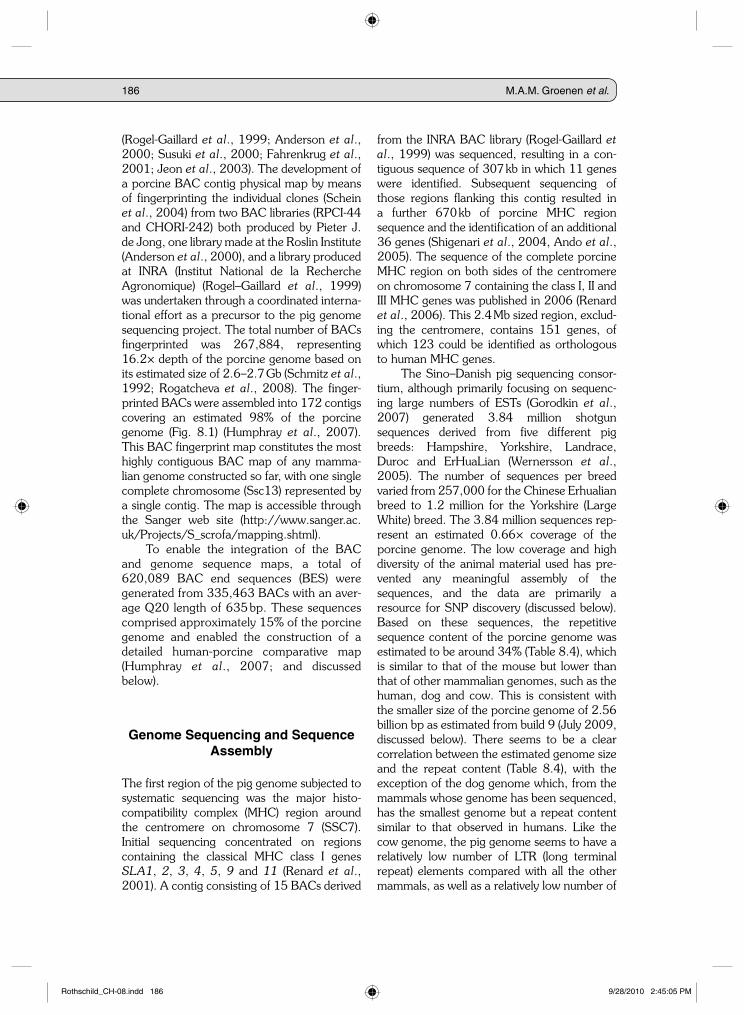
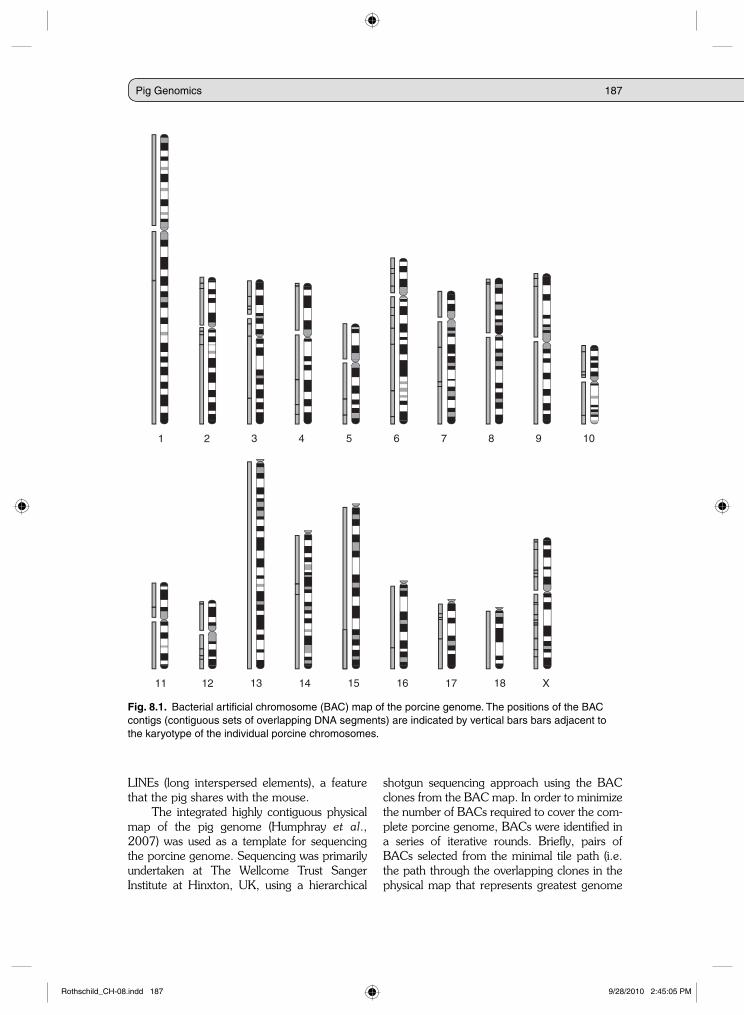
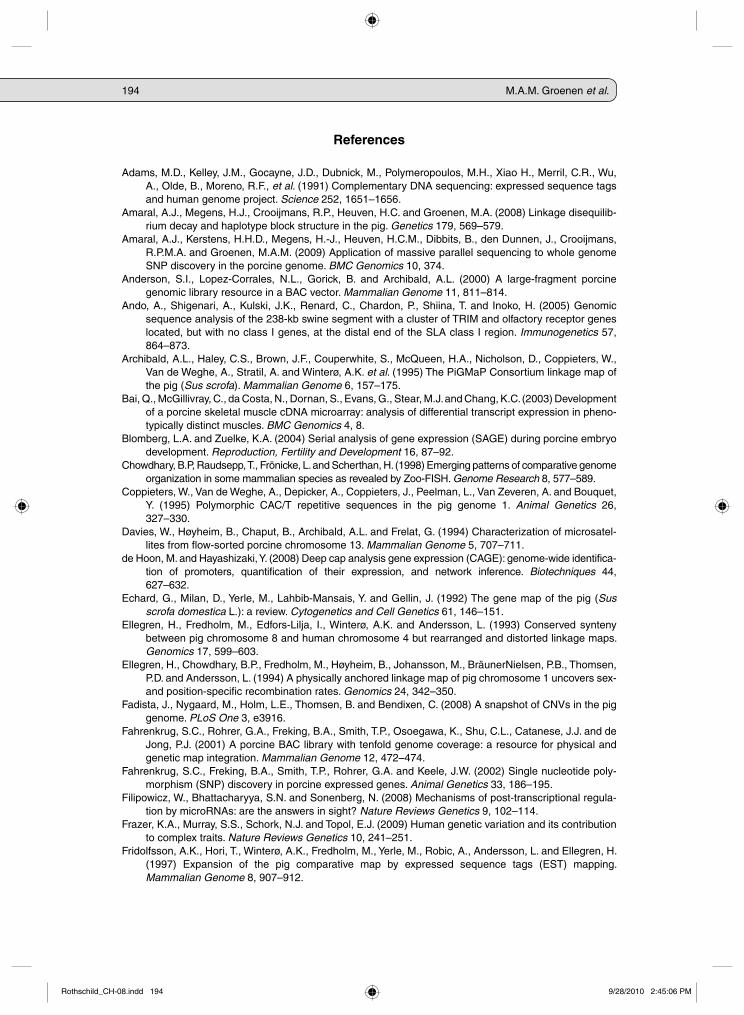
(Rogel-Gaillard et al., 1999; Anderson et al., 2000; Susuki et al., 2000; Fahrenkrug et al., 2001; Jeon et al., 2003). The development of a porcine BAC contig physical map by means of fingerprinting the individual clones (Schein et al., 2004) from two BAC libraries (RPCI-44 and CHORI-242) both produced by Pieter J. de Jong, one library made at the Roslin Institute (Anderson et al., 2000), and a library produced at INRA (Institut National de la Recherche Agronomique) (Rogel–Gaillard et al., 1999) was undertaken through a coordinated interna-tional effort as a precursor to the pig genome sequencing project. The total number of BACs fingerprinted was 267,884, representing 16.2× depth of the porcine genome based on its estimated size of 2.6–2.7 Gb (Schmitz et al., 1992; Rogatcheva et al., 2008). The finger-printed BACs were assembled into 172 contigs covering an estimated 98% of the porcine genome (Fig. 8.1) (Humphray et al., 2007). This BAC fingerprint map constitutes the most highly contiguous BAC map of any mamma-lian genome constructed so far, with one single complete chromosome (Ssc13) represented by a single contig. The map is accessible through the Sanger web site (http://www.sanger.ac.uk/Projects/S_scrofa/mapping.shtml).
To enable the integration of the BAC and genome sequence maps, a total of 620,089 BAC end sequences (BES) were generated from 335,463 BACs with an aver-age Q20 length of 635 bp. These sequences comprised approximately 15% of the porcine genome and enabled the construction of a detailed human-porcine comparative map (Humphray et al., 2007; and discussed below).
Genome Sequencing and Sequence Assembly
The first region of the pig genome subjected to systematic sequencing was the major histo-compatibility complex (MHC) region around the centromere on chromosome 7 (SSC7). Initial sequencing concentrated on regions containing the classical MHC class I genes SLA1, 2, 3, 4, 5, 9 and 11 (Renard et al., 2001). A contig consisting of 15 BACs derived
from the INRA BAC library (Rogel-Gaillard et al., 1999) was sequenced, resulting in a con-tiguous sequence of 307 kb in which 11 genes were identified. Subsequent sequencing of those regions flanking this contig resulted in a further 670 kb of porcine MHC region sequence and the identification of an additional 36 genes (Shigenari et al., 2004, Ando et al., 2005). The sequence of the complete porcine MHC region on both sides of the centromere on chromosome 7 containing the class I, II and III MHC genes was published in 2006 (Renard et al., 2006). This 2.4 Mb sized region, exclud-ing the centromere, contains 151 genes, of which 123 could be identified as orthologous to human MHC genes.
The Sino–Danish pig sequencing consor-tium, although primarily focusing on sequenc-ing large numbers of ESTs (Gorodkin et al., 2007) generated 3.84 million shotgun sequences derived from five different pig breeds: Hampshire, Yorkshire, Landrace, Duroc and ErHuaLian (Wernersson et al., 2005). The number of sequences per breed varied from 257,000 for the Chinese Erhualian breed to 1.2 million for the Yorkshire (Large White) breed. The 3.84 million sequences rep-resent an estimated 0.66× coverage of the porcine genome. The low coverage and high diversity of the animal material used has pre-vented any meaningful assembly of the sequences, and the data are primarily a resource for SNP discovery (discussed below). Based on these sequences, the repetitive sequence content of the porcine genome was estimated to be around 34% (Table 8.4), which is similar to that of the mouse but lower than that of other mammalian genomes, such as the human, dog and cow. This is consistent with the smaller size of the porcine genome of 2.56 billion bp as estimated from build 9 (July 2009, discussed below). There seems to be a clear correlation between the estimated genome size and the repeat content (Table 8.4), with the exception of the dog genome which, from the mammals whose genome has been sequenced, has the smallest genome but a repeat content similar to that observed in humans. Like the cow genome, the pig genome seems to have a relatively low number of LTR (long terminal repeat) elements compared with all the other mammals, as well as a relatively low number of
Rothschild_CH-08.indd 186Rothschild_CH-08.indd 186 9/28/2010 2:45:05 PM9/28/2010 2:45:05 PM
Pig Genomics 187
LINEs (long interspersed elements), a feature that the pig shares with the mouse.
The integrated highly contiguous physical map of the pig genome (Humphray et al., 2007) was used as a template for sequencing the porcine genome. Sequencing was primarily undertaken at The Wellcome Trust Sanger Institute at Hinxton, UK, using a hierarchical
shotgun sequencing approach using the BAC clones from the BAC map. In order to minimize the number of BACs required to cover the com-plete porcine genome, BACs were identified in a series of iterative rounds. Briefly, pairs of BACs selected from the minimal tile path (i.e. the path through the overlapping clones in the physical map that represents greatest genome
1
11 12 13 14 15 16 17 18 X
2 3 4 5 6 7 8 9 10
Fig. 8.1. Bacterial artificial chromosome (BAC) map of the porcine genome. The positions of the BAC contigs (contiguous sets of overlapping DNA segments) are indicated by vertical bars bars adjacent to the karyotype of the individual porcine chromosomes.
Rothschild_CH-08.indd 187Rothschild_CH-08.indd 187 9/28/2010 2:45:05 PM9/28/2010 2:45:05 PM

188 M.A.M. Groenen et al.
coverage in the smallest number of clones) and at multiple dispersed locations in the genome were sequenced; the sequence contigs from this first wave of sequenced BAC clones were used to identify a second wave of BAC clones from the minimal tile path exploiting the BAC end sequence data to confirm and minimize the overlaps between clones sequenced in the first and second waves. This selection process was repeated iteratively to extend and close gaps in the sequence map. The initial aim was to obtain a 4× sequence depth across the genome through a minimal tile path BAC-by-BAC approach (i.e. sequencing each BAC clone in turn and inde-pendently), with clones being preferentially selected from the CHORI-242 BAC library which had been generated from a single Duroc sow (TJ Tabasco). To further minimize the number of clones needed to cover the complete genome, a fosmid library was produced using TJ Tabasco DNA with an average insert size of 40 kb. End sequences were obtained for the fos-mid clones in order to align these clones with the emerging sequence map. Fosmid clones were used to bridge the remaining small gaps in the genome sequence. In earlier releases of the porcine genome, the 2.4 Mb sequence of the MHC region (Renard et al., 2006) was incorpo-
rated, but in the latest release this sequence has been replaced by sequences derived from CHORI-242 clones.
The current assembly (at the time of writing) of the draft pig genome sequence (build 9; Sscrofa9) is accessible in the Ensembl genome browser (http://www.ensembl.org/Sus_scrofa/Info/Index). This assembly was established from the BAC clone derived sequences as available in April 2009, and cov-ers about 89% of the pig genome. The Ensembl team established the first gene build for the pig as follows: (i) starting with 9277 pig proteins from RefSeq (the NCBI Reference Sequence database, excluding all the predicted models) and UniProt (Universal Protein Resource) sequences of which 7144 aligned uniquely; (ii) and also starting with 19,384 pig cDNA sequences (after predicted cDNAs were removed), of which 11,930 cDNAs met the criteria (i.e. aligned with identity ³97% and coverage ³90%); (iii) from 1,532,435 pig ESTs of which 898,859 ESTs passed the same score cut-off (i.e. aligned with identity ³97% and cov-erage ³90%); and (iv) ∼130,000 additional proteins, mostly from other mammals, and ∼20,000 human Ensembl models, of which around 50% aligned with >90% coverage. All
Table 8.4. Comparison of genome size and repeat content of sequenced mammalian genomes. The repeat count for the pig is based on 0.66× genome coverage (Wernersson et al. 2005). Short interspersed elements (SINEs) and long interspersed elements (LINEs) together with the LTRs (long terminal elements) are three different classes of repetitive elements that all transpose through an RNA intermediate (retrotransposition) as opposed to other types of transposons that transpose directly as DNA (i.e. DNA elements). Satellite repeats are a class of repetitive sequences mostly found within centromeric and pericentromeric regions. Simple repeats and low complexity repetitive sequences are mainly microsatellite and minisatellite repeats.
Dog Mouse Pig Rat Human Cow
SINEs 7.96 7.63 11.3 7.78 13.14 17.66LINEs 19.54 16.46 16.14 20.1 20.42 23.29LTR elements 10.39 8.72 2.8 10.28 8.29 3.2DNA elements 0.88 0.36 1.51 0.86 2.84 1.96Unclassified 0.32 0.37 0 0.37 0.14 naSmall RNA 0.06 0.04 0.02 0.03 na naSatellite repeats 0.04 na 1.47 0.31 na naSimple repeats 2.39 na 0.62 2.41 na 2.27Low complexity repetitive
sequences0.73 na 0.53 na na na
Total 42.31 33.58 34.39 42.14 44.83 48.38Genome size 2.45 2.5 2.56 2.75 2.85 2.87
na, not available.
Rothschild_CH-08.indd 188Rothschild_CH-08.indd 188 9/28/2010 2:45:06 PM9/28/2010 2:45:06 PM
Pig Genomics 189
the gene predictions were merged, giving pri-ority to pig-specific proteins to give a final gene set of 17,493 genes and 520 pseudogenes.
The next assembly (Sscrofa10), which will form the basis for the publication of a draft pig genome sequence, will incorporate not only sequence data from BAC clones that extend the coverage of the genome, but also whole genome shotgun sequence data generated by the Korea National Livestock Research Institute. The por-cine genome will be further improved by the incorporation of whole genome shotgun reads representing 24-fold genome coverage and derived from TJ Tabasco, generated using next- generation sequencing performed by the Beijing Genome Institute (BGI) using the Illumina GA sequencing platform, and consisting of 44-bp paired end reads totalling 66.6 Gb of sequence data (Jun Wang, personal communication).
Comparative Genomics
As the number of genes mapped across the genomes of different species increased in the late 1980s, it quickly became apparent that the homologues of genes that co-localized on the same chromosome in one species were often also co-localized in other species; this phenomenon was referred to as ‘conserved synteny’ (Nadeau, 1989). Conserved syntenies were defined as homologous segments in dif-ferent organisms composed of at least two pairs of homologous genes located on the same chromosome, regardless of gene order. As the number of mapped genes increased fur-ther and, in particular, after the characteriza-tion of the complete genome sequence of multiple species, the definitions ‘conserved synteny block’ and ‘conserved synteny seg-ment’ were often used (Waterston et al., 2002), although this nomenclature has not been used uniformly in genome sequencing papers pub-lished in the last decade. Within this chapter, the term ‘conserved block’ is used for regions that are on the same chromosome between species (e.g. pig chromosome 8 and human chromosome 4) and that, at the resolution used, are not interrupted by regions homolo-gous to other chromosomes. Where the homologous sequences and/or genes are in
the same order in the two species are referred to as ‘conserved segments’.
Conserved synteny between the porcine and other mammalian genomes, in particular that of humans, has already been used for almost 20 years to predict the location of genes and to identify candidate genes for important traits in the pig. The first example where this approach was used successfully was the identification of the RYR1 gene as the gene for the halothane locus on porcine chromosome 6 (MacLennan et al., 1990; Fujii et al., 1991; Otsu et al., 1991). Other well known examples where comparative mapping was successfully used to identify the candidate gene for the trait under investiga-tion in the pig include the identification of a mutation in the PRKAG3 gene (RN locus) responsible for the excess glycogen content in pig skeletal muscle (Milan et al., 2000), and the identification of an SNP in the IGF2 gene as the causal variation underlying an imprinted quantitative trait locus (QTL) for backfat and muscle growth on porcine chromosome 2 (Van Laere et al., 2003).
The development of a porcine-human comparative map accelerated with the increased efforts to map genes and ESTs (Fridolfsson et al. 1997; Wintero et al., 1998; Rink et al., 2002) on the porcine link-age maps (Ellegren et al., 1993, Johansson et al., 1995) and RH maps (Hawken et al., 1999; Robic et al., 1999; Lahbib-Mansais et al., 2000). The first comprehensive com-parative maps between the porcine and human genomes were obtained by bidirec-tional chromosome painting by means of fluorescent in situ hybridization using indi-vidual flow-sorted chromosomes (Rettenberger et al., 1995; Goureau et al., 1996). These results revealed the presence of at least 37 conserved synteny blocks, which was some-what lower than observed for the bovine- human comparative maps (Hayes et al., 1995; Solinas-Toldo et al., 1995). Although orthologous genes mapped in both humans and pigs, showed that several of these blocks consisted of multiple segments, the mapping resolution available at that time did not permit estimates regarding the number of conserved synteny segments between the human and porcine genomes. The first high-resolution
Rothschild_CH-08.indd 189Rothschild_CH-08.indd 189 9/28/2010 2:45:06 PM9/28/2010 2:45:06 PM
190 M.A.M. Groenen et al.
porcine-human comparative map that was able to identify conserved synteny segments within these larger conserved synteny blocks was derived from the RH mapping of 1058 ESTs (Rink et al., 2002). Using this approach, Rink et al. (2002) were able to identify at least 60 evolutionary break-points and 90 micro-rearrangements between the genomes of humans and pigs. The availability of a high-resolution physical map based on finger-printed BACs (Humphray et al., 2007), and in particular the availability of the end sequences (BES) of many of these BACs, allowed the development of even higher reso-lution human-porcine comparative maps (Meyers et al., 2005; Humphray et al., 2007). Meyers et al. (2005) used these resources to add 2068 BES to the RH map, thus further refining the resolution of the comparative map; they were able to identify 51 conserved synteny groups and 173 con-served synteny segments between the genomes of humans and pigs. Using the defi-nition of conserved synteny blocks presented here, the total number of conserved synteny blocks reported in that study is 65. Completion of the porcine genome sequence will further increase the resolution of the comparative map between the human and the pig. Comparison of the human genome sequence with the currently available pig genome sequence (build 9; Sscrofa9), which covers approximately 89% of the porcine genome, has been further extended by searching Sscrofa9 with 10 kb segments of the human genome sequence using the algorithm blat (blast-like alignment tool; Kent, 2002). The resulting comparative map (Plate 3) reveals additional evolutionary break-points as well as an additional number of (small) conserved synteny blocks not observed at previous reso-lutions, bringing the total number of con-served synteny blocks to 70 and the number of conserved synteny segments to 194. Because comparing the next pig genome assembly (Sscrofa10) against other maps, including the linkage, RH and comparative maps, will form part of the quality checks on the draft pig genome sequence before its publication, the putative evolutionary break-points revealed by these analyses will be regions that merit careful checking. However,
the modest number of conserved synteny segments suggests that the current assembly of the genome sequence data (i.e. build 9; Sscrofa9) is a good assembly.
Variation in the Porcine Genome
Establishing the complete sequence of the genome of any given species is extremely important as it allows the analysis of the com-plete gene content of that organism and facili-tating the dissection of the molecular basis of all aspects of the functioning of that particular species. Comparing the gene content and the evolution of genes and gene families between closely as well as distantly related species pro-vides further insights into understanding the molecular instructions that contribute to the development and functioning of a given organ-ism. Equally important is the characterization of the natural variation between the genomes of different individuals within a species. Genetic variation is central to the variation observed in traits within any given population, as well as a key that allows specific individuals to adapt to changes in the environment and eventually supports the emergence of new species. Furthermore, in pig breeding, the available genetic variation within the different pig popu-lations has allowed the development of specific breeds and lines, each with specific character-istics (traits), and supplies the raw material from which further improvement in productiv-ity, health and welfare can be built by the breeding industry. In this respect, the establish-ment of the genome sequence of a single indi-vidual is just the start, but it provides the necessary framework and reference to further examine the organization of the genome of a large number of individuals.
Variation within the genome involves changes of single nucleotides (SNPs), varia-tion of repetitive sequences, e.g. at mini- and micro-satellites, and even variation in the numbers of regulatory sequences and genes (copy number variation or CNV). Some of this variation has already been used in the past to develop polymorphic markers to construct the necessary linkage maps or to study spe-cific genetic variation (Chapters 2–5). Probably the first large-scale identification of genetic
Rothschild_CH-08.indd 190Rothschild_CH-08.indd 190 9/28/2010 2:45:06 PM9/28/2010 2:45:06 PM
Pig Genomics 191
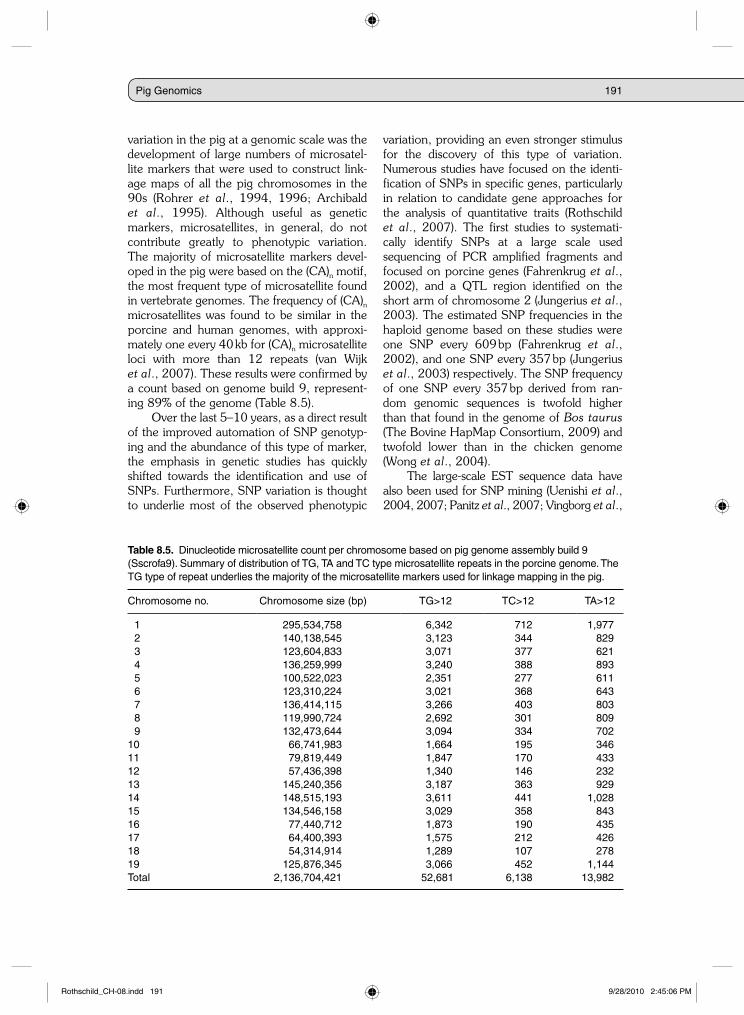
variation in the pig at a genomic scale was the development of large numbers of microsatel-lite markers that were used to construct link-age maps of all the pig chromosomes in the 90s (Rohrer et al., 1994, 1996; Archibald et al., 1995). Although useful as genetic markers, microsatellites, in general, do not contribute greatly to phenotypic variation. The majority of microsatellite markers devel-oped in the pig were based on the (CA)n motif, the most frequent type of microsatellite found in vertebrate genomes. The frequency of (CA)n microsatellites was found to be similar in the porcine and human genomes, with approxi-mately one every 40 kb for (CA)n microsatellite loci with more than 12 repeats (van Wijk et al., 2007). These results were confirmed by a count based on genome build 9, represent-ing 89% of the genome (Table 8.5).
Over the last 5–10 years, as a direct result of the improved automation of SNP genotyp-ing and the abundance of this type of marker, the emphasis in genetic studies has quickly shifted towards the identification and use of SNPs. Furthermore, SNP variation is thought to underlie most of the observed phenotypic
variation, providing an even stronger stimulus for the discovery of this type of variation. Numerous studies have focused on the identi-fication of SNPs in specific genes, particularly in relation to candidate gene approaches for the analysis of quantitative traits (Rothschild et al., 2007). The first studies to systemati-cally identify SNPs at a large scale used sequencing of PCR amplified fragments and focused on porcine genes (Fahrenkrug et al., 2002), and a QTL region identified on the short arm of chromosome 2 (Jungerius et al., 2003). The estimated SNP frequencies in the haploid genome based on these studies were one SNP every 609 bp (Fahrenkrug et al., 2002), and one SNP every 357 bp (Jungerius et al., 2003) respectively. The SNP frequency of one SNP every 357 bp derived from ran-dom genomic sequences is twofold higher than that found in the genome of Bos taurus (The Bovine HapMap Consortium, 2009) and twofold lower than in the chicken genome (Wong et al., 2004).
The large-scale EST sequence data have also been used for SNP mining (Uenishi et al., 2004, 2007; Panitz et al., 2007; Vingborg et al.,
Table 8.5. Dinucleotide microsatellite count per chromosome based on pig genome assembly build 9 (Sscrofa9). Summary of distribution of TG, TA and TC type microsatellite repeats in the porcine genome. The TG type of repeat underlies the majority of the microsatellite markers used for linkage mapping in the pig.
Chromosome no. Chromosome size (bp) TG>12 TC>12 TA>12
1 295,534,758 6,342 712 1,9772 140,138,545 3,123 344 8293 123,604,833 3,071 377 6214 136,259,999 3,240 388 8935 100,522,023 2,351 277 6116 123,310,224 3,021 368 6437 136,414,115 3,266 403 8038 119,990,724 2,692 301 8099 132,473,644 3,094 334 702
10 66,741,983 1,664 195 34611 79,819,449 1,847 170 43312 57,436,398 1,340 146 23213 145,240,356 3,187 363 92914 148,515,193 3,611 441 1,02815 134,546,158 3,029 358 84316 77,440,712 1,873 190 43517 64,400,393 1,575 212 42618 54,314,914 1,289 107 27819 125,876,345 3,066 452 1,144Total 2,136,704,421 52,681 6,138 13,982
Rothschild_CH-08.indd 191Rothschild_CH-08.indd 191 9/28/2010 2:45:06 PM9/28/2010 2:45:06 PM
192 M.A.M. Groenen et al.
2009). The majority of these SNPs, however, have not been deposited into NCBI’s SNP data-base (dbSNP), although they are available through a number of EST specific databases. Panitz et al (2007) described the identification of 7900 candidate SNPs using a data set of over 0.8 million ESTs (Gorodkin et al., 2007). Around 3900 of these SNPs were included on a 7K Illumina iSelect beadchip (personal commu-nication, C. Bendixen and A. Archibald), and genotyping results on a wide variety of breeds indicated a validation frequency of 83%. Similar validation frequencies were observed for SNPs derived from the PEDE (Pig Expression Data Explorer) and TGI (The Gene Index Project at the Dana Farber Cancer Institute) databases (M.A.M. Groenen, unpublished results). SNP identification based on a comparison of all the available porcine genomic sequences in GenBank (the US National Institutes of Health genetic sequences database, available at NCBI) resulted in the identification of 6374 SNPs, for which both variants were observed at least twice (Kerstens et al., 2009). Similar to the putative SNPs derived from the EST sequence data, the conversion rate (i.e. the proportion of the puta-tive SNPs that could be validated and shown to be truly polymorphic) of these SNPs was 82%.
As EST data are known to also contain mitochondrial DNA (mtDNA) sequences, this resource was examined for any variation in mtDNA-derived sequences (Scheibye-Alsing et al., 2008). Although the authors described 374 putative SNPs, their validation results indi-cate that the majority were false positives, and that the number of true, reliable mtSNPs with high conversion rates that were identified was 112. Conversion rates for SNPs obtained from PCR-based re-sequencing efforts based on BES (A. Archibald, unpublished results), or from the sequence comparison of high-quality sequenced genome sequences (Amaral et al., 2008) were generally significantly higher (>95 %). More recently, several large SNP discovery projects were initiated, each of which used a different sequence methodology and strategy. Denis Milan and co-workers (INRA, France) used tra-ditional Sanger sequencing to generate a total of 1 million sequences of Large White, Landrace, Piétrain, Iberic, Göttingen, Meishan and Wild Boar. In total, over 55,000 high- quality SNPs were identified with a conversion
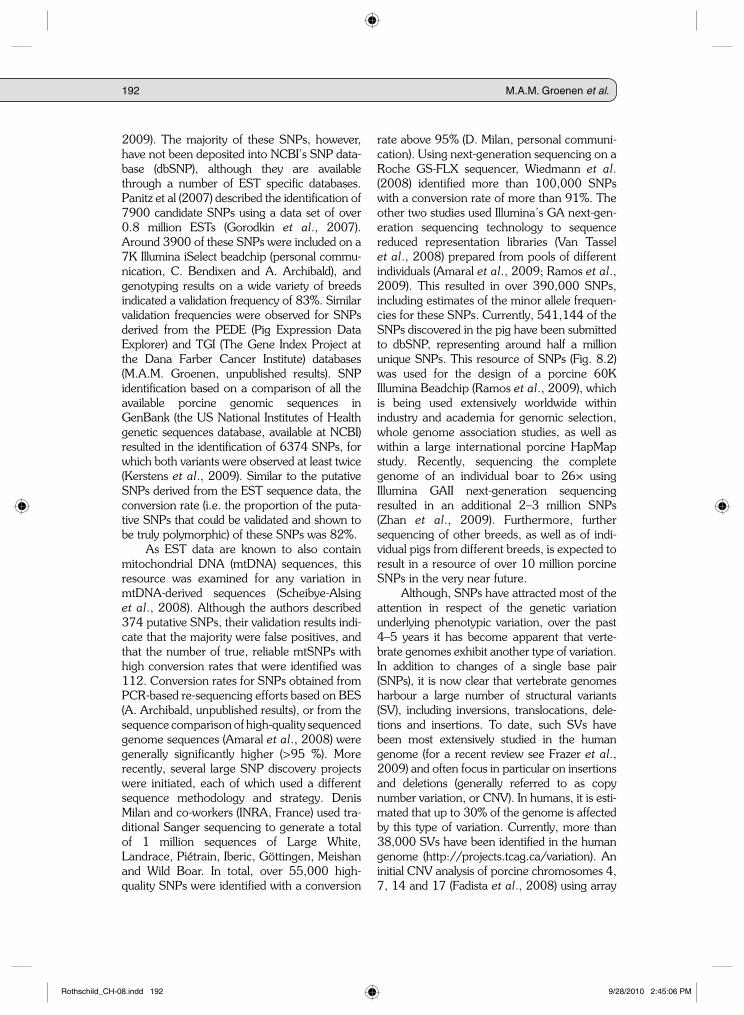
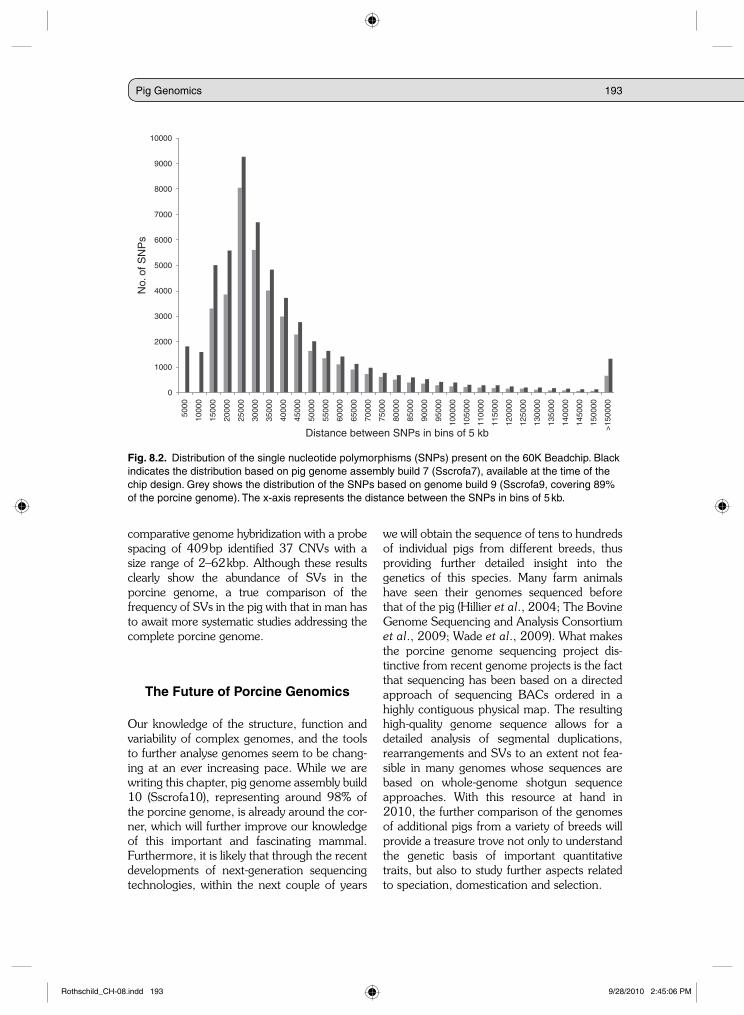
rate above 95% (D. Milan, personal communi-cation). Using next-generation sequencing on a Roche GS-FLX sequencer, Wiedmann et al. (2008) identified more than 100,000 SNPs with a conversion rate of more than 91%. The other two studies used Illumina’s GA next-gen-eration sequencing technology to sequence reduced representation libraries (Van Tassel et al., 2008) prepared from pools of different individuals (Amaral et al., 2009; Ramos et al., 2009). This resulted in over 390,000 SNPs, including estimates of the minor allele frequen-cies for these SNPs. Currently, 541,144 of the SNPs discovered in the pig have been submitted to dbSNP, representing around half a million unique SNPs. This resource of SNPs (Fig. 8.2) was used for the design of a porcine 60K Illumina Beadchip (Ramos et al., 2009), which is being used extensively worldwide within industry and academia for genomic selection, whole genome association studies, as well as within a large international porcine HapMap study. Recently, sequencing the complete genome of an individual boar to 26× using Illumina GAII next-generation sequencing resulted in an additional 2–3 million SNPs (Zhan et al., 2009). Furthermore, further sequencing of other breeds, as well as of indi-vidual pigs from different breeds, is expected to result in a resource of over 10 million porcine SNPs in the very near future.
Although, SNPs have attracted most of the attention in respect of the genetic variation underlying phenotypic variation, over the past 4–5 years it has become apparent that verte-brate genomes exhibit another type of variation. In addition to changes of a single base pair (SNPs), it is now clear that vertebrate genomes harbour a large number of structural variants (SV), including inversions, translocations, dele-tions and insertions. To date, such SVs have been most extensively studied in the human genome (for a recent review see Frazer et al., 2009) and often focus in particular on insertions and deletions (generally referred to as copy number variation, or CNV). In humans, it is esti-mated that up to 30% of the genome is affected by this type of variation. Currently, more than 38,000 SVs have been identified in the human genome (http://projects.tcag.ca/variation). An initial CNV analysis of porcine chromosomes 4, 7, 14 and 17 (Fadista et al., 2008) using array
Rothschild_CH-08.indd 192Rothschild_CH-08.indd 192 9/28/2010 2:45:06 PM9/28/2010 2:45:06 PM
Pig Genomics 193
comparative genome hybridization with a probe spacing of 409 bp identified 37 CNVs with a size range of 2–62 kbp. Although these results clearly show the abundance of SVs in the porcine genome, a true comparison of the frequency of SVs in the pig with that in man has to await more systematic studies addressing the complete porcine genome.
The Future of Porcine Genomics
Our knowledge of the structure, function and variability of complex genomes, and the tools to further analyse genomes seem to be chang-ing at an ever increasing pace. While we are writing this chapter, pig genome assembly build 10 (Sscrofa10), representing around 98% of the porcine genome, is already around the cor-ner, which will further improve our knowledge of this important and fascinating mammal. Furthermore, it is likely that through the recent developments of next-generation sequencing technologies, within the next couple of years
we will obtain the sequence of tens to hundreds of individual pigs from different breeds, thus providing further detailed insight into the genetics of this species. Many farm animals have seen their genomes sequenced before that of the pig (Hillier et al., 2004; The Bovine Genome Sequencing and Analysis Consortium et al., 2009; Wade et al., 2009). What makes the porcine genome sequencing project dis-tinctive from recent genome projects is the fact that sequencing has been based on a directed approach of sequencing BACs ordered in a highly contiguous physical map. The resulting high-quality genome sequence allows for a detailed analysis of segmental duplications, rearrangements and SVs to an extent not fea-sible in many genomes whose sequences are based on whole-genome shotgun sequence approaches. With this resource at hand in 2010, the further comparison of the genomes of additional pigs from a variety of breeds will provide a treasure trove not only to understand the genetic basis of important quantitative traits, but also to study further aspects related to speciation, domestication and selection.
0
1000
Distance between SNPs in bins of 5 kb
2000
3000
4000
5000
No.
of S
NP
s 6000
7000
8000
9000
10000
5000
1000
0
1500
0
2000
0
2500
0
3000
0
3500
0
4000
0
4500
0
5000
0
5500
0
6000
0
6500
0
7000
0
7500
0
8000
0
8500
0
9000
0
9500
0
1000
00
1050
00
1100
00
1150
00
1200
00
1250
00
1300
00
1350
00
1400
00
1450
00
1500
00
>15
0000
Fig. 8.2. Distribution of the single nucleotide polymorphisms (SNPs) present on the 60K Beadchip. Black indicates the distribution based on pig genome assembly build 7 (Sscrofa7), available at the time of the chip design. Grey shows the distribution of the SNPs based on genome build 9 (Sscrofa9, covering 89% of the porcine genome). The x-axis represents the distance between the SNPs in bins of 5 kb.
Rothschild_CH-08.indd 193Rothschild_CH-08.indd 193 9/28/2010 2:45:06 PM9/28/2010 2:45:06 PM
194 M.A.M. Groenen et al.
References
Adams, M.D., Kelley, J.M., Gocayne, J.D., Dubnick, M., Polymeropoulos, M.H., Xiao H., Merril, C.R., Wu, A., Olde, B., Moreno, R.F., et al. (1991) Complementary DNA sequencing: expressed sequence tags and human genome project. Science 252, 1651–1656.
Amaral, A.J., Megens, H.J., Crooijmans, R.P., Heuven, H.C. and Groenen, M.A. (2008) Linkage disequilib-rium decay and haplotype block structure in the pig. Genetics 179, 569–579.
Amaral, A.J., Kerstens, H.H.D., Megens, H.-J., Heuven, H.C.M., Dibbits, B., den Dunnen, J., Crooijmans, R.P.M.A. and Groenen, M.A.M. (2009) Application of massive parallel sequencing to whole genome SNP discovery in the porcine genome. BMC Genomics 10, 374.
Anderson, S.I., Lopez-Corrales, N.L., Gorick, B. and Archibald, A.L. (2000) A large-fragment porcine genomic library resource in a BAC vector. Mammalian Genome 11, 811–814.
Ando, A., Shigenari, A., Kulski, J.K., Renard, C., Chardon, P., Shiina, T. and Inoko, H. (2005) Genomic sequence analysis of the 238-kb swine segment with a cluster of TRIM and olfactory receptor genes located, but with no class I genes, at the distal end of the SLA class I region. Immunogenetics 57, 864–873.
Archibald, A.L., Haley, C.S., Brown, J.F., Couperwhite, S., McQueen, H.A., Nicholson, D., Coppieters, W., Van de Weghe, A., Stratil, A. and Winterø, A.K. et al. (1995) The PiGMaP Consortium linkage map of the pig (Sus scrofa). Mammalian Genome 6, 157–175.
Bai, Q., McGillivray, C., da Costa, N., Dornan, S., Evans, G., Stear, M.J. and Chang, K.C. (2003) Development of a porcine skeletal muscle cDNA microarray: analysis of differential transcript expression in pheno-typically distinct muscles. BMC Genomics 4, 8.
Blomberg, L.A. and Zuelke, K.A. (2004) Serial analysis of gene expression (SAGE) during porcine embryo development. Reproduction, Fertility and Development 16, 87–92.
Chowdhary, B.P, Raudsepp, T., Frönicke, L. and Scherthan, H. (1998) Emerging patterns of comparative genome organization in some mammalian species as revealed by Zoo-FISH. Genome Research 8, 577–589.
Coppieters, W., Van de Weghe, A., Depicker, A., Coppieters, J., Peelman, L., Van Zeveren, A. and Bouquet, Y. (1995) Polymorphic CAC/T repetitive sequences in the pig genome 1. Animal Genetics 26, 327–330.
Davies, W., Høyheim, B., Chaput, B., Archibald, A.L. and Frelat, G. (1994) Characterization of microsatel-lites from flow-sorted porcine chromosome 13. Mammalian Genome 5, 707–711.
de Hoon, M. and Hayashizaki, Y. (2008) Deep cap analysis gene expression (CAGE): genome-wide identifica-tion of promoters, quantification of their expression, and network inference. Biotechniques 44, 627–632.
Echard, G., Milan, D., Yerle, M., Lahbib-Mansais, Y. and Gellin, J. (1992) The gene map of the pig (Sus scrofa domestica L.): a review. Cytogenetics and Cell Genetics 61, 146–151.
Ellegren, H., Fredholm, M., Edfors-Lilja, I., Winterø, A.K. and Andersson, L. (1993) Conserved synteny between pig chromosome 8 and human chromosome 4 but rearranged and distorted linkage maps. Genomics 17, 599–603.
Ellegren, H., Chowdhary, B.P., Fredholm, M., Høyheim, B., Johansson, M., BräunerNielsen, P.B., Thomsen, P.D. and Andersson, L. (1994) A physically anchored linkage map of pig chromosome 1 uncovers sex- and position-specific recombination rates. Genomics 24, 342–350.
Fadista, J., Nygaard, M., Holm, L.E., Thomsen, B. and Bendixen, C. (2008) A snapshot of CNVs in the pig genome. PLoS One 3, e3916.
Fahrenkrug, S.C., Rohrer, G.A., Freking, B.A., Smith, T.P., Osoegawa, K., Shu, C.L., Catanese, J.J. and de Jong, P.J. (2001) A porcine BAC library with tenfold genome coverage: a resource for physical and genetic map integration. Mammalian Genome 12, 472–474.
Fahrenkrug, S.C., Freking, B.A., Smith, T.P., Rohrer, G.A. and Keele, J.W. (2002) Single nucleotide poly-morphism (SNP) discovery in porcine expressed genes. Animal Genetics 33, 186–195.
Filipowicz, W., Bhattacharyya, S.N. and Sonenberg, N. (2008) Mechanisms of post-transcriptional regula-tion by microRNAs: are the answers in sight? Nature Reviews Genetics 9, 102–114.
Frazer, K.A., Murray, S.S., Schork, N.J. and Topol, E.J. (2009) Human genetic variation and its contribution to complex traits. Nature Reviews Genetics 10, 241–251.
Fridolfsson, A.K., Hori, T., Winterø, A.K., Fredholm, M., Yerle, M., Robic, A., Andersson, L. and Ellegren, H. (1997) Expansion of the pig comparative map by expressed sequence tags (EST) mapping. Mammalian Genome 8, 907–912.
Rothschild_CH-08.indd 194Rothschild_CH-08.indd 194 9/28/2010 2:45:06 PM9/28/2010 2:45:06 PM

Pig Genomics 195
Frönicke, L., Chowdhary, B.P., Scherthan, H. and Gustavsson, I. (1996) A comparative map of the porcine and human genomes demonstrates Zoo-FISH and gene mapping-based chromosomal homologies. Mammalian Genome 7, 285–290.
Fujii, J., Otsu, K., Zorzato, F., de Leon, S., Khanna, V.K., Weiler, J.E., O’Brien, P.J. and MacLennan, D.H. (1991) Identification of a mutation in porcine ryanodine receptor associated with malignant hyperther-mia. Science 253, 448–451.
Gorodkin, J., Cirera, S., Hedegaard, J., Gilchrist, M.J., Panitz, F., Jørgensen, C., Scheibye-Knudsen, K., Arvin, T., Lumholdt, S., Sawera, M., Green, T., Nielsen, B.J., Havgaard, J.H., Rosenkilde, C., Wang, J., Li, H., Li, R., Liu, B., Hu, S., Dong, W., Li, W., Yu, J., Wang, J., Staefeldt, H.H., Wernersson, R., Madsen, L.B., Thomsen, B., Hornshøj, H., Bujie, Z., Wang, X., Wang, X., Bolund, L., Brunak, S., Yang, H., Bendixen and C. and Fredholm, M. (2007) Porcine transcriptome analysis based on 97 non-normalized cDNA libraries and assembly of 1,021,891 expressed sequence tags. Genome Biology 8, R45.
Goureau, A., Yerle, M., Schmitz, A., Riquet, J., Milan, D., Pinton, P., Frelat and G. and Gellin, J. (1996) Human and porcine correspondence of chromosome segments using bidirectional chromosome painting. Genomics 36, 252–262.
Green, E.D. (2001) Strategies for the systematic sequencing of complex genomes. Nature Reviews Genetics 2, 573–583.
Griffiths-Jones, S. (2004) The microRNA registry. Nucleic Acids Research 32 (Database issue), D109–D111.
Groenen, M.A.M., Ruyter, D., Verstege, E.J., de Vries, M. and van der Poel, J.J. (1995) Development and mapping of ten porcine microsatellite markers. Animal Genetics 26, 115–118.
Haley, C.S., Archibald, A.L., Andersson, L., Bosma, A.A., Davies, W., Fredholm, M., Geldermann, H., Groenen, M., Gustavsson, I., Ollivier, L., Tucker, E.M., and Van de Weghe, A. (1990) The Pig Gene Mapping Project – PiGMaP. Proceedings of the 4th World Congress on Genetics Applied to Livestock Production XIII, 67–70.
Hawken, R.J., Murtaugh, J., Flickinger, G.H., Yerle, M., Robic, A., Milan, D., Gellin, J.,Beattie, C.W., Schook, L.B. and Alexander, L.J. (1999) A first-generation porcine whole-genome radiation hybrid map. Mammalian Genome 10, 824–830.
Hayes, H. (1995) Chromosome painting with human chromosome specific DNA libraries reveals the extent and the distribution of conserved segments in bovine chromosomes. Cytogenetics and Cell Genetics 71, 168–174.
Hillier, L.D.W. et al. (2004) Sequence and comparative analysis of the chicken genome provide unique perspectives on vertebrate evolution. Nature 432, 695–716.
Hornshøj, H., Panitz, F., Hedegaard, J., Conley, L.N., Nielsen, R.O. and Bendixen, C. (2009) Prediction of splice junctions and exon-skipping events in porcine tissues from alignments of next generation RNA short reads to the genome sequence. Abstracts from the Pig Genome III conference, Hinxton, UK, 2–4 November. Available at: http://pignet.eu/conferences/pig-genome-iii/ (accessed 28 June 2010).
Humphray, S.J., Scott, C.E., Clark, R., Marron, B., Bender, C., Camm, N., Davis, J., Jenks, A., Noon, A., Patel, M., Sehra, H., Yang, F., Rogatcheva, M.B., Milan, D., Chardon, P., Rohrer, G., Nonneman, D., de Jong, P., Meyers, S.N., Archibald, A., Beever, J.E., Schook, L.B. and Rogers, J. (2007) A high utility integrated map of the pig genome. Genome Biology 8, R139.
Jeon, J.T., Park, E.W., Jeon, H.J., Kim, T.H., Lee, K.T. and Cheong, I.C. (2003) A large-insert porcine library with sevenfold genome coverage: a tool for positional cloning of candidate genes for major quantita-tive traits. Molecules and Cells 16, 113–116.
Johansson, M., Ellegren, H. and Andersson, L. (1995) Comparative mapping reveals extensive linkage conservation – but with gene order rearrangements – between the pig and the human genomes. Genomics 25, 682–690.
Jungerius, B.J., Rattink, A.P., Crooijmans, R.P., van der Poel, J.J., van Oost, B.A., te Pas, M.F. and Groenen, M.A.M. (2003) Development of a single nucleotide polymorphism map of porcine chromosome 2. Animal Genetics 34, 429–437.
Kent, J.W. (2002) BLAT – The BLAST-Like Alignment Tool. Genome Research 12, 656–664.Kerstens, H.H.D., Kollers, S., Kommadath, A., Del Rosario, M., Dibbits, B., Kinders, S.M., Crooijmans,
R.P.M.A. and Groenen, M.A.M. (2009) Mining for single nucleotide polymorphisms in pig genome sequence data. BMC Genomics 10, 4.
Lahbib-Mansais, Y., Leroux, S., Milan, D., Yerle, M., Robic, A., Jiang, Z., André, C. and Gellin, J. (2000) Comparative mapping between humans and pigs: localization of 58 anchorage markers (TOASTs) by use of porcine somatic cell and radiation hybrid panels. Mammalian Genome 11, 1098–1106.
Rothschild_CH-08.indd 195Rothschild_CH-08.indd 195 9/28/2010 2:45:06 PM9/28/2010 2:45:06 PM
196 M.A.M. Groenen et al.
Lee, Y., Tsai, J., Sunkara, S., Karamycheva, S., Pertea, G., Sultana, R., Antonescu, V., Chan, A., Cheung, F. and Quackenbush, J. (2005) The TIGR gene indices: clustering and assembling EST and known genes and integration with eukaryotic genomes. Nucleic Acids Research 33 (Database issue), D71–4.
Louro, R., Smirnova, A.S. and Verjovski-Almeida, S. (2008) Long intronic noncoding RNA transcription: expression noise or expression choice? Genomics 93, 291–298.
MacLennan, D.H., Duff, C., Zorzato, F., Fujii, J., Phillips, M., Korneluk, R.G., Frodis, W., Britt, B.A. and Worton, R.G. (1990) Ryanodine receptor gene is a candidate for predisposition to malignant hyper-thermia. Nature 343, 559–561.
Mardis, E.R. (2008) Next-generation DNA sequencing methods. Annual Review of Genomics and Human Genetics 9, 387–402.
Marklund, L., Johansson Moller, M., Høyheim, B., Davies, W., Fredholm, M., Juneja, R.K., Mariani, P., Coppieters, W., Ellegren, H. and Andersson, L. (1996) A comprehensive linkage map of the pig based on a wild pig-Large White intercross. Animal Genetics 4, 255–269.
Mattick, J.S. (2009) The genetic signatures of noncoding RNAs. PLoS Genetics 5, e1000459.Medhora, M., Bousamra, M. 2nd, Zhu, D., Somberg, L. and Jacobs, E.R. (2002) Upregulation of collagens
detected by gene array in a model of flow-induced pulmonary vascular remodeling. American Journal of Physiology – Heart and Circulatory Physiology 282, H414–422.
Meyers, S.N., Rogatcheva, M.B., Larkin, D.M., Yerle, M., Milan, D., Hawken, R.J., Schook, L.B. and Beever, J.E. (2005) Piggy-BACing the human genome II. A high-resolution, physically anchored, comparative map of the porcine autosomes. Genomics 86, 739–752.
Miles, J.R., Blomberg, L.A., Krisher, R.L., Everts, R.E., Sonstegard, T.S., Van Tassell, C.P. and Zuelke, K.A. (2008) Comparative transcriptome analysis of in vivo- and in vitro-produced porcine blastocysts by small amplified RNA-serial analysis of gene expression (SAR-SAGE). Molecular Reproduction and Development 75, 976–988.
Milan, D., Jeon, J.T., Looft, C., Amarger, V., Robic, A., Thelander, M., Rogel-Gaillard, C., Paul, S., Iannuccelli, N., Rask, L., Ronne, H., Lundström, K., Reinsch, N., Gellin, J., Kalm, E., Roy, P.L., Chardon, P. and Andersson, L. (2000) A mutation in PRKAG3 associated with excess glycogen content in pig skeletal muscle. Science 288, 1248–1251.
Moody, D.E., Zou, Z. and McIntyre, L. (2002) Cross-species hybridisation of pig RNA to human nylon micro-arrays. BMC Genomics 3, 27.
Nadeau, J.H. (1989) Maps of linkage and synteny homologies between mouse and man. Trends in Genetics 5, 82–86.
Nobis, W., Ren, X., Suchyta, S.P., Suchyta, T.R., Zanella, A.J. and Coussens, P.M. (2003) Development of a porcine brain cDNA library, EST database, and microarray resource. Physiological Genomics 16, 153–159.
Otsu, K., Khanna, V.K., Archibald, A.L. and MacLennan, D.H. (1991) Cosegregation of porcine malignant hyperthermia and a probable causal mutation in the skeletal muscle ryanodine receptor gene in back-cross families. Genomics 11, 744–750.
Panitz, F., Stengaard, H., Hornshøj, H., Gorodkin, J., Hedegaard, J., Cirera, S., Thomsen, B., Madsen, L.B., Høj, A., Vingborg, R.K., Zahn, B., Wang, X., Wang, X., Wernersson, R., Jørgensen, C.B., Scheibye-Knudsen, K., Arvin, T., Lumholdt, S., Sawera, M., Green, T., Nielsen, B.J., Havgaard, J.H., Brunak, S., Fredholm, M., Bendixen, C. (2007) SNP mining porcine ESTs with MAVIANT, a novel tool for SNP evaluation and annotation. Bioinformatics 23, i387–391
Ramos, A.M., Crooijmans, R.P.M.A., Affara, N.A. Amaral, A.J., Archibald, A.L., Beever, J.E., Bendixen, C., Churcher, C., Clark, R., Dehais, P., Hansen, M.S., Hedegaard, J., Hu, Z.-L., Kerstens, H.H., Law, A.S., Megens, H.-J., Milan, D., Nonneman, D.J., Rohrer, G.A., Rothschild, M.F., Smith, T.P.L., Schnabel, R.D., Van Tassell, C.P., Taylor, J.F., Wiedmann, R.T., Schook, L.B. and Groenen, M.A.M. (2009) Design of a high density SNP genotyping assay in the pig using SNPs identified and characterized by next generation sequencing technology. PloS ONE 8, e6524.
Ren, H., Li, Y., Tang, Z., Yang, S., Mu, Y., Cui, W., Ao, H., Du, L., Wang, L. and Li, K. (2009) Genomic struc-ture, chromosomal localization and expression profile of a porcine long non-coding RNA isolated from long SAGE libraries. Animal Genetics 40, 499–508.
Renard, C., Vaiman, M., Chiannilkulchai, N., Cattolico, L., Robert, C. and Chardon, P. (2001) Sequence of the pig major histocompatibility region containing the classical class I genes. Immunogenetics 53, 490–500.
Renard, C., Hart, E., Sehra, H., Beasley, H., Coggill, P., Howe, K., Harrow, J., Gilbert, J., Sims, S., Rogers, J., Ando, A., Shigenari, A., Shiina, T., Inoko, H., Chardon, P and Beck, S. (2006) The genomic sequence and analysis of the swine major histocompatibility complex. Genomics 88, 96–110.
Rothschild_CH-08.indd 196Rothschild_CH-08.indd 196 9/28/2010 2:45:06 PM9/28/2010 2:45:06 PM
Pig Genomics 197
Rettenberger, G., Fredholm, M. and Fries R. (1994) Chromosomal assignment of porcine microsatellites by use of a somatic cell hybrid mapping panel. Animal Genetics 25, 343–345.
Rettenberger, G., Klett, C., Zechner, U., Kunz, J., Vogel, W. and Hameister, H. (1995) Visualization of the conservation of synteny between humans and pigs by heterologous chromosomal painting. Genomics 26, 372–378.
Rettenberger, G., Bruch, J., Fries, R., Archibald, A.L. and Hameister, H. (1996) Assignment of 19 porcine type I loci by somatic cell hybrid analysis detects new regions of conserved synteny between human and pig. Mammalian Genome 7, 275–279.
Rink, A., Santschi, E.M., Eyer, K.M., Roelofs, B., Hess, M., Godfrey, M., Karajusuf, E.K., Yerle, M., Milan, D. and Beattie, C.W. (2002) A first-generation EST RH comparative map of the porcine and human genome. Mammalian Genome 13, 578–587.
Robic, A., Seroude, V., Jeon, J.T., Yerle, M., Wasungu, L., Andersson, L., Gellin, J. and Milan, D. (1999) A radiation hybrid map of the RN region in pigs demonstrates conserved gene order compared with the human and mouse genomes. Mammalian Genome 10, 565–568.
Rogel-Gaillard, C., Bourgeaux, N., Billaut, A., Vaiman, M. and Chardon, P. (1999) Construction of a swine BAC library: application to the characterization and mapping of porcine type C endoviral elements. Cytogenetics and Cell Genetics 85, 205–211.
Rogatcheva, M.B., Chen, K., Larkin, D.M., Meyers, S.N., Marron, B.M., He, W., Schook, L.B. and Beever, J.E. (2008) Piggy-BACing the human genome I: constructing a porcine BAC physical map through comparative genomics. Animal Biotechnology 19, 28–42.
Rohrer, G.A., Alexander, L.J., Keele, J.W., Smith, T.P. and Beattie, C.W. (1994) A microsatellite linkage map of the porcine genome. Genetics 136, 231–245.
Rohrer, G.A., Alexander, L.J., Hu, Z., Smith, T.P., Keele, J.W. and Beattie, C.W. (1996) A comprehensive map of the porcine genome. Genome Research 6, 371–391.
Rothschild, M.F. (2004) Porcine genomics delivers new tools and results: this little piggy did more than just go to market. Genetics Research 83, 1–6.
Rothschild, M.F., Hu, Z.L. and Jiang, Z. (2007) Advances in QTL mapping in pigs. International Journal of Biological Science 3, 192–197.
Schena, M., Shalon, D., Davis, R.W. and Brown, P.O. (1995) Quantitative monitoring of gene expression patterns with a complementary DNA microarray. Science 270, 467–470.
Scheibye-Alsing, K., Cirera, S., Gilchrist, M.J., Fredholm, M. and Gorodkin, J. (2008) SNP-finding in pig mitochondrial ESTs. Animal Genetics 39, 193–195.
Schein, J., Kucaba, T., Sekhon, M., Smalius, D., Waterston, R. and Marra, M. (2004) High-throughput BAC fingerprinting. Methods in Molecular Biology 255, 143–156.
Schmitz, A., Chaput, B., Fouchet, P., Guilly, M.N., Frelat, G. and Vaiman, M. (1992) Swine chromosomal DNA quantification by bivariate flow karyotyping and karyotype interpretation. Cytometry 13, 703–710.
Schook, L.B., Beever, J.E., Rogers, J., Humphray, S., Archibald, A., Chardon, P., Milan, D., Rohrer, G. and Eversole, K. (2005) Swine Genome Sequencing Consortium (SGSC): a strategic roadmap for sequencing the pig genome. Comparative and Functional Genomics 6, 251–255.
Seemann, S.E., Gilchrist, M.J., Hofacker, I.L., Stadler, P.F. and Gorodkin, J. (2007) Detection of RNA struc-tures in porcine EST data and related mammals. BMC Genomics 10, 316.
Shigenari, A., Ando, A., Renard, C., Chardon, P., Shiina, T., Kulski, J.K., Yasue, H. and Inoko, H. (2004) Nucleotide sequencing analysis of the swine 433-kb genomic segment located between the non-classical and classical SLA class I gene clusters. Immunogenetics 55, 695–705.
Shiraki, T., Kondo, S., Katayama, S., Waki, K., Kasukawa, T., Kawaji, H., Kodzius, R., Watahiki, A., Nakamura, M., Arakawa, T., Fukuda, S., Sasaki, D., Podhajska, A., Harbers, M., Kawai, J., Carninci, P. and Hayashizaki, Y. (2003) Cap analysis gene expression for high-throughput analysis of transcrip-tional starting point and identification of promoter usage. Proceedings of the National Academy of Sciences of the USA 100, 15776–15781.
Solinas-Toldo, S., Lengauer, C., and Fries, R. (1995) Comparative genome map of human and cattle. Genomics 27, 489–496.
Suzuki, K., Asakawa, S., Iida, M., Shimanuki, S., Fujishima, N., Hiraiwa, H., Murakami, Y., Shimizu, N. and Yasue, H. (2000) Construction and evaluation of a porcine bacterial artificial chromosome library. Animal Genetics 31, 8–12.
The Bovine Genome Sequencing and Analysis Consortium, Elsik, C.G., Tellam, R.L., Worley, K.C. et al. (2009) The genome sequence of taurine cattle: a window to ruminant biology and evolution. Science 324, 522–528.
Rothschild_CH-08.indd 197Rothschild_CH-08.indd 197 9/28/2010 2:45:06 PM9/28/2010 2:45:06 PM
198 M.A.M. Groenen et al.
The Bovine HapMap Consortium (2009) Genome-Wide Survey of SNP Variation Uncovers the Genetic Structure of Cattle Breeds. Science 324, 528–532.
Tosser-Klopp, G., Benne, F., Bonnet, A., Mulsant, P., Gasser, F. and Hatey, F. (1997) A first catalog of genes involved in pig ovarian follicular differentiation. Mammalian Genome 8, 250–254.
Tuggle, C.K. and Schmitz, C.B. (1994) Cloning and characterization of pig muscle cDNAs by an expressed sequence tag approach. Animal Biotechnology 5, 1–13.
Tuggle, C.K., Wang, Y. and Couture, O. (2007) Advances in swine transcriptomics. International Journal of Biological Sciences 3, 132–152
Uenishi, H., Eguchi, T., Suzuki, K., Sawazaki, T., Toki, D., Shinkai, H., Okumura, N., Hamasima, N. and Awata, T. (2004) PEDE (Pig EST Data Explorer): construction of a database for ESTs derived from porcine full-length cDNA libraries. Nucleic Acids Research 32, D484–488.
Uenishi, H., Eguchi-Ogawa, T., Shinkai, H., Okumura, N., Suzuki, K., Toki, D., Hamasima, N. and Awata, T. (2007) PEDE (Pig EST Data Explorer) has been expanded into Pig Expression Data Explorer, includ-ing 10 147 porcine full-length cDNA sequences. Nucleic Acids Research 35, D650–653.
Uenishi, H., Morozumi, T., Toki, D., Tanaka-Matsuda, M., Eguchi-Ogawa, T., Rund, L. and Schook, L.B. (2009) Sequencing of porcine full-length-enriched cDNA clones and its contribution to annotation of the draft sequence of pig genome. Abstracts from the Pig Genome III conference, Hinxton, UK, 2–4 November. Available at: http://pignet.eu/conferences/pig-genome-iii/ (accessed 28 June 2010).
Van Laere, A.S., Nguyen, M., Braunschweig, M., Nezer, C., Collette, C., Moreau, L., Archibald, A.L., Haley, C.S., Buys, N., Tally, M., Andersson, G., Georges, M. and Andersson, L. (2003) A regulatory mutation in IGF2 causes a major QTL effect on muscle growth in the pig. Nature 425, 832–836.
Van Tassell, C.P., Smith, T.P., Matukumalli, L.K., Taylor, J.F., Schnabel, R.D., Lawley, C.T., Haudenschild, C., Moore, S.S., Warren, W.C. and Sonstegard, T.S. (2008) SNP discovery and allele frequency estima-tion by deep sequencing of reduced representation libraries. Nature Methods 5, 247–252.
van Wijk, H.J., Harlizius, B., Liefers, S.C., Buschbell, H., Dibbits, B. and Groenen, M.A.M. (2007) In silico identification and mapping of microsatellite markers on Sus scrofa chromosome 4. Animal Biotechnology 18, 251–261.
Velculescu, V.E., Zhang, L., Vogelstein, B. and Kinzler, K.W. (1995) Serial analysis of gene expression. Science 270, 484–487.
Vingborg, R.K., Gregersen, V.R., Zhan, B., Panitz, F., Høj, A., Sørensen, K.K., Madsen, L.B., Larsen, K., Hornshøj, H., Wang, X. and Bendixen, C. (2009) A robust linkage map of the porcine autosomes based on gene-associated SNPs. BMC Genomics 10, 134.
Wade, C.M., Giulotto, E., Sigurdsson, S., Zoli, M., Gnerre, S., Imsland, F., Lear, T.L., Adelson, D.L., Bailey, E., Bellone, R.R. et al. (2009) Genome sequence, comparative analysis, and population genetics of the domestic horse. Science 326, 865–867.
Waterston, R.H., Lindblad-Toh, K., Birney, E., Rogers, J., Abril, J.F., Agarwal, P., Agarwala, R., Ainscough, R., Alexandersson, M., An, P., Antonarakis, S.E. et al. (2002) Initial sequencing and comparative analysis of the mouse genome. Nature 420, 520–562.
Wernersson, R., Schierup, M.H., Jørgensen, F.G., Gorodkin, J., Panitz, F., Stærfeldt, H.H., Christensen, O.F., Mailund, T., Hornshoj, H., Klein, A., Wang, J., Liu, B., Hu, S., Dong, W., Li, W., Wong, G.K.S., Yu, J., Bendixen, C., Fredholm, M., Brunak, S., Yang, H., and Bolund, L. (2005) Pigs in sequence space: a 0.66X coverage pig genome survey based on shotgun sequencing. BMC Genomics 6, 70.
Wiedmann, R.T., Smith, T.P. and Nonneman, D.J. (2008) SNP discovery in swine by reduced representation and high throughput pyrosequencing. BMC Genetics 9, 81.
Winterø, A.K., Fredholm, M. and Davies, W. (1996) Evaluation and characterization of a porcine small intestine cDNA library: analysis of 839 clones. Mammalian Genome 7, 509–517.
Winterø, A.K., Jørgensen, C.B., Robic, A., Yerle, M. and Fredholm, M. (1998) Improvement of the porcine transcription map: localization of 33 genes, of which 24 are orthologous. Mammalian Genome 9, 366–372.
Wong, G.K., Liu, B., Wang, J., Zhang, Y., Yang, X., Zhang, Z., Meng, Q., Zhou, J., Li, D., Zhang et al. (2004) A genetic variation map for chicken with 2.8 million single-nucleotide polymorphisms. International Chicken Polymorphism Map Consortium. Nature 432, 717–722.
Yerle, M., Lahbib-Mansais, Y., Mellink, C., Goureau, A., Pinton, P., Echard, G., Gellin, J., Zijlstra, C., De Haan, N., Bosma, A.A., Chowdhary, B., Gu, F., Gustavsson, I., Thomsen, P.D., Christensen, K., Rettenberger, G., Hameister, H., Schmittz, A., Chaput, B. and Frelat, G. (1995) The PiGMaP con-sortium cytogenetic map of the domestic pig (Sus scrofa domestica). Mammalian Genome 6, 176–186.
Rothschild_CH-08.indd 198Rothschild_CH-08.indd 198 9/28/2010 2:45:06 PM9/28/2010 2:45:06 PM
Pig Genomics 199
Yerle, M., Echard, G., Robic, A., Mairal, A., Dubut-Fontana, C., Riquet, J., Pinton, P., Milan, D., Lahbib-Mansais, Y. and Gellin, J. (1996) A somatic cell hybrid panel for pig regional gene mapping character-ized by molecular cytogenetics. Cytogenetics and Cell Genetics 73, 194–202.
Yerle, M., Pinton, P., Robic, A., Alfonso, A., Palvadeau, Y., Delcros, C., Hawken, R., Alexander, L., Beattie, C., Schook, L., Milan, D. and Gellin, J. (1998) Construction of a whole-genome radiation hybrid panel for high-resolution gene mapping in pigs. Cytogenetics and Cell Genetics 82, 182–188.
Yerle, M., Pinton, P., Delcros, C., Arnal, N., Milan, D. and Robic, A. (2002) Generation and characterization of a 12,000-rad radiation hybrid panel for fine mapping in pig. Cytogenetics and Genome Research 97, 219–228.
Zhan, B., Fadista, J., Jensen, H. H., Hedegaard, J., Bendixen, C. and Panitz, F. (2009) Global single nucle-otide polymorphism discovery by whole genome sequencing a single boar. Abstracts from the Pig genome III conference, Hinxton, UK, 2–4 November. Available at: http://pignet.eu/conferences/pig-genome-iii/ (accessed 28 June 2010).
Zuelke, K.A., Blomberg, L.A., Long, E.L. and Sonstegard, T.S. (2003) Serial analysis of gene expression (SAGE) comparisons between day 11 and day 12 porcine embryos. Theriogenology 59, 435.
Rothschild_CH-08.indd 199Rothschild_CH-08.indd 199 9/28/2010 2:45:06 PM9/28/2010 2:45:06 PM