Embed Size (px)
Citation preview
86025 Energy Systems Analysis Arnulf Grubler
A Primer on Energy Technologies and Technological Change
86025 Energy Systems Analysis Arnulf Grubler
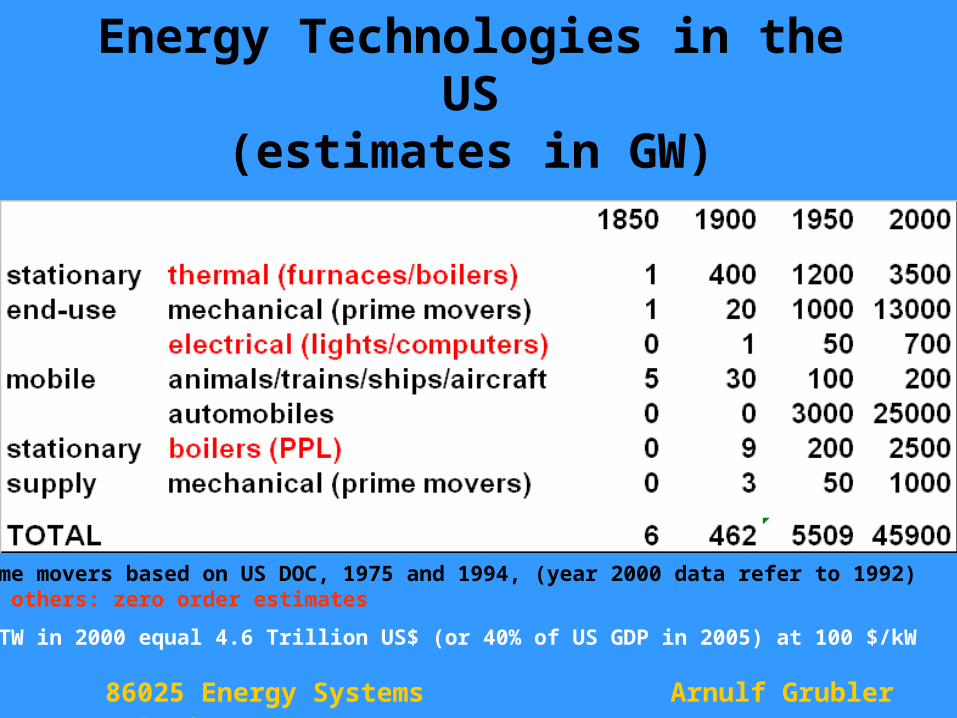
Energy Technologies in the US(estimates in GW)
Prime movers based on US DOC, 1975 and 1994, (year 2000 data refer to 1992)All others: zero order estimates
46 TW in 2000 equal 4.6 Trillion US$ (or 40% of US GDP in 2005) at 100 $/kW
86025 Energy Systems Analysis Arnulf Grubler
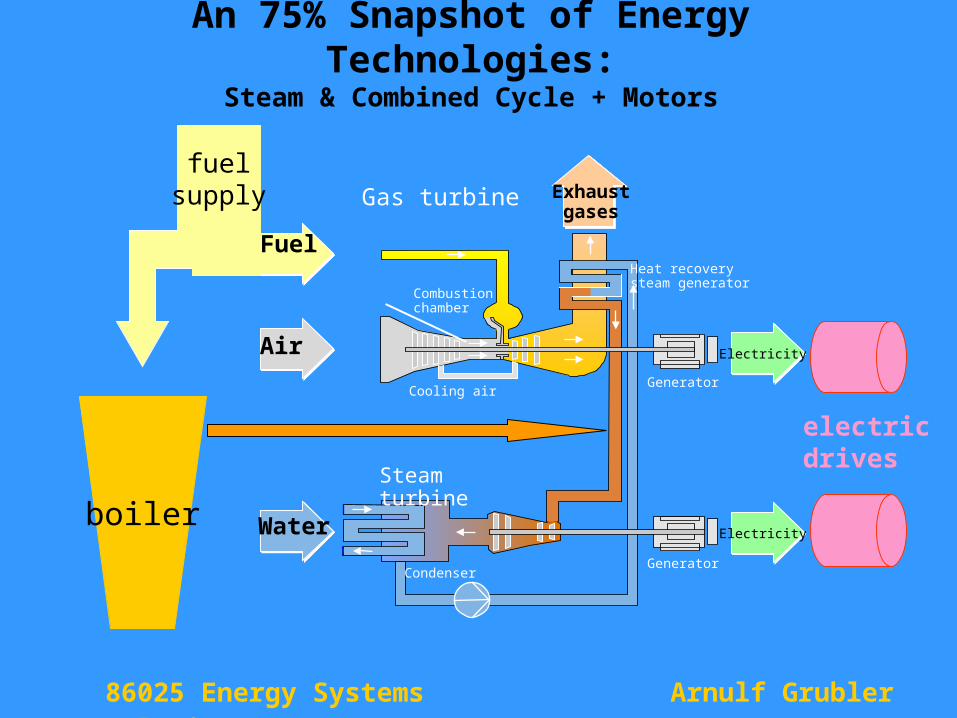
An 75% Snapshot of Energy Technologies:Steam & Combined Cycle + Motors
ElectricityWater
Generator
Generator
Heat recovery steam generator
Cooling air
Condenser
Combustion chamber
Fuel
Air
Exhaustgases
Electricity
Gas turbine
Steam turbine
boiler
electricdrives
fuelsupply
86025 Energy Systems Analysis Arnulf Grubler
Technology and Energy Economics
• Price data, while volatile indicate no resource scarcity/depletion
• Depletion mitigated by technological change, substitution, efficiency improvements
• Technological change originates both from within energy sector (off-shore oil) as well as from economy at large
• Productivity gains and cost declines yield macro-economic benefits
86025 Energy Systems Analysis Arnulf Grubler
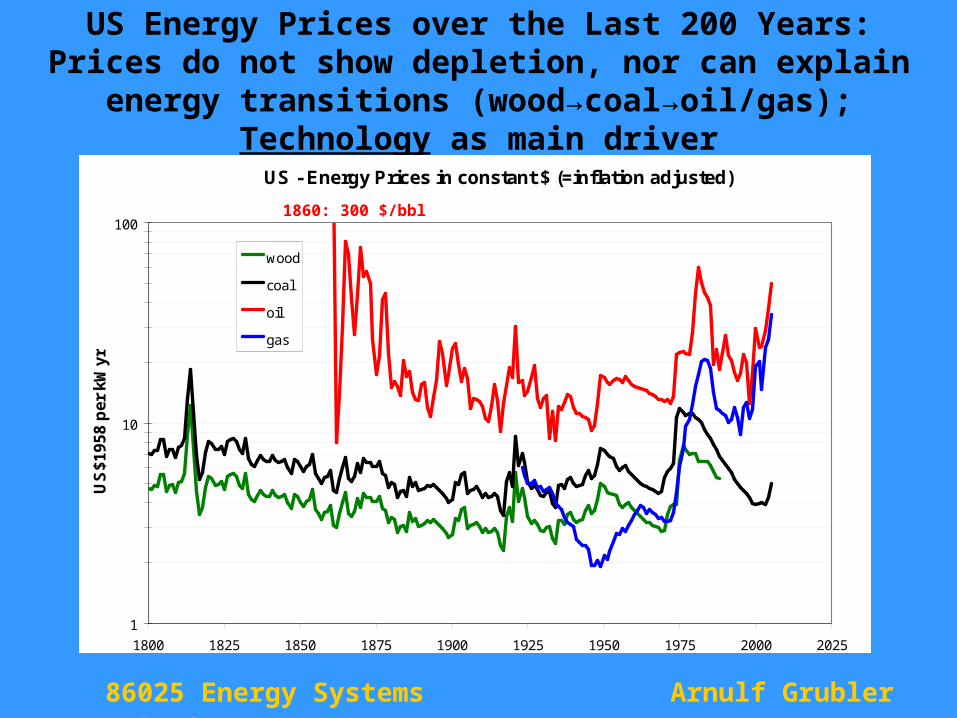
US Energy Prices over the Last 200 Years:Prices do not show depletion, nor can explain energy
transitions (wood→coal→oil/gas); Technology as main driver
US - Energy Prices in constant $ (=inflation adjusted)
1
10
100
1800 1825 1850 1875 1900 1925 1950 1975 2000 2025
US
$195
8 p
er k
Wyr
wood
coal
oil
gas
1860: 300 $/bbl
86025 Energy Systems Analysis Arnulf Grubler
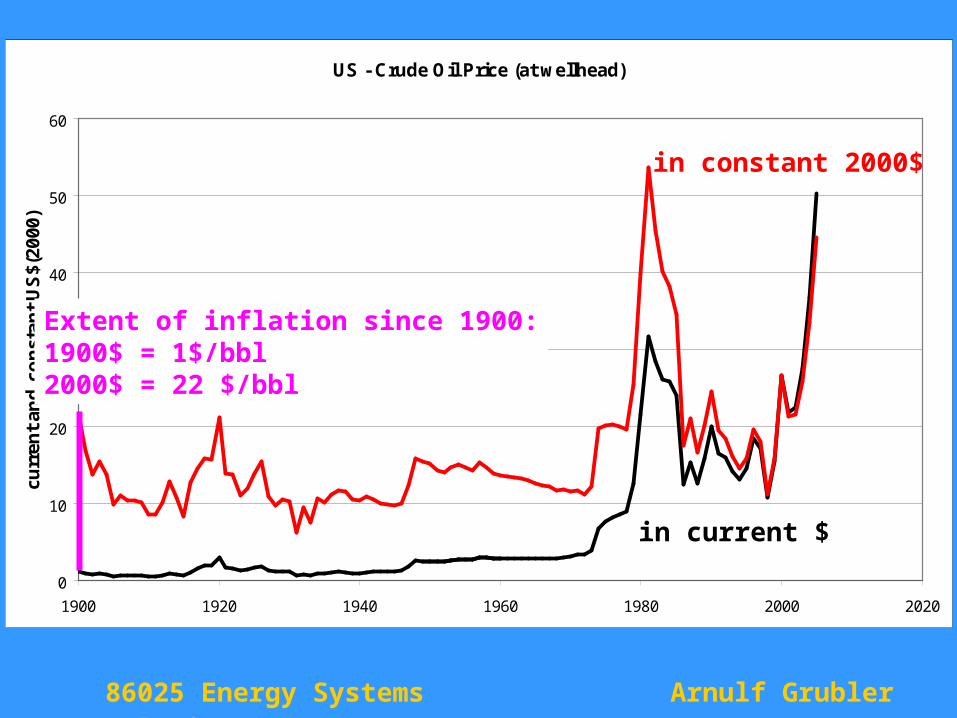
US - Crude Oil Price (at wellhead)
0
10
20
30
40
50
60
1900 1920 1940 1960 1980 2000 2020
curr
ent
and
co
nst
ant
US
$(20
00)
in constant 2000$
in current $
Extent of inflation since 1900:1900$ = 1$/bbl2000$ = 22 $/bbl
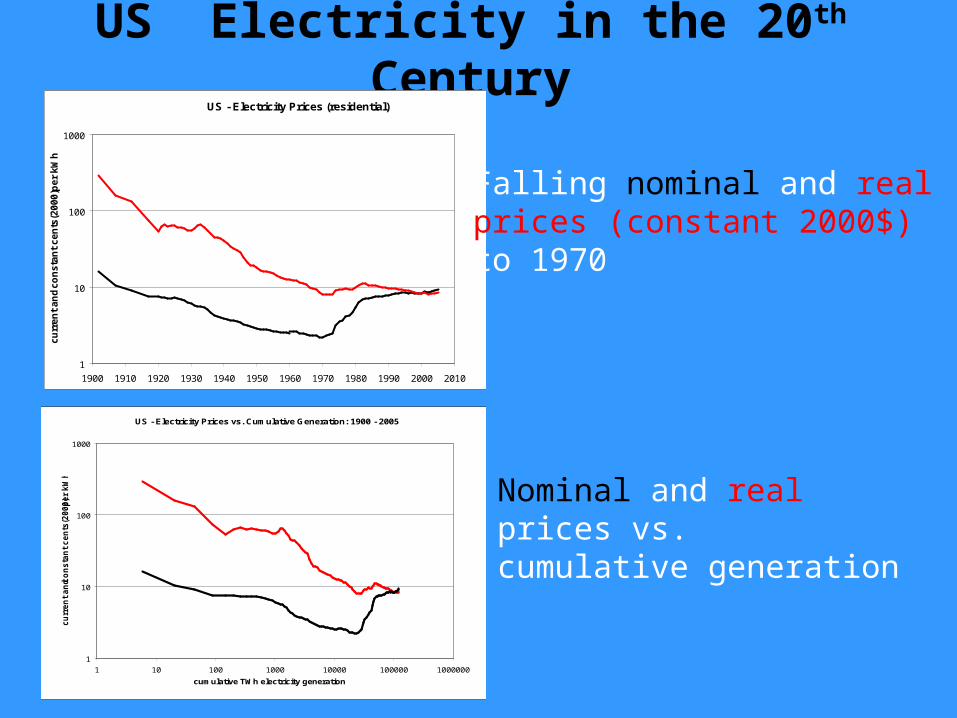
US Electricity in the 20th Century
US - Electricity Prices vs. Cumulative Generation: 1900 - 2005
1
10
100
1000
1 10 100 1000 10000 100000 1000000
cumulative TWh electricity generation
cu
rre
nt
an
d co
nsta
nt
cen
ts(2
00
0)
pe
r k
Wh
US - Electricity Prices (residential)
1
10
100
1000
1900 1910 1920 1930 1940 1950 1960 1970 1980 1990 2000 2010
cu
rren
t an
d c
on
sta
nt
cen
ts(2
000) p
er
kW
h
Falling nominal and realprices (constant 2000$)to 1970
Nominal and realprices vs.cumulative generation
86025 Energy Systems Analysis Arnulf Grubler
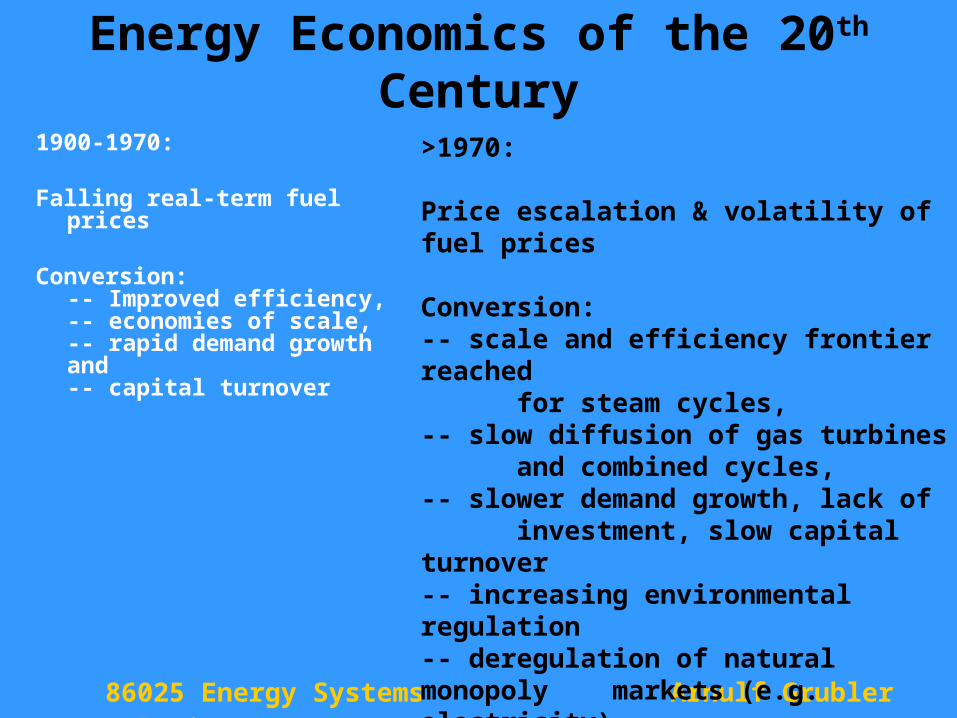
Energy Economics of the 20th Century
1900-1970:
Falling real-term fuel prices
Conversion:-- Improved efficiency,-- economies of scale,-- rapid demand growth
and-- capital turnover
>1970:
Price escalation & volatility of fuel prices
Conversion:-- scale and efficiency frontier reached
for steam cycles,-- slow diffusion of gas turbines
and combined cycles,-- slower demand growth, lack of investment, slow capital turnover-- increasing environmental regulation-- deregulation of natural monopoly markets (e.g. electricity)
86025 Energy Systems Analysis Arnulf Grubler
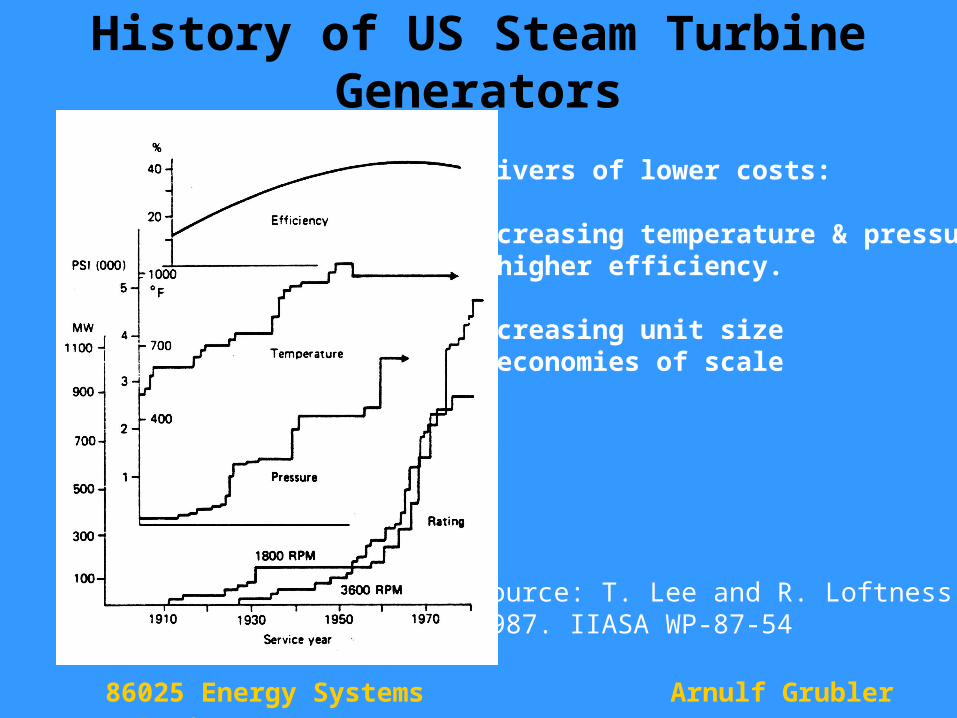
History of US Steam Turbine Generators
Source: T. Lee and R. Loftness,1987. IIASA WP-87-54
Drivers of lower costs:
Increasing temperature & pressure= higher efficiency.
Increasing unit size= economies of scale
86025 Energy Systems Analysis Arnulf Grubler
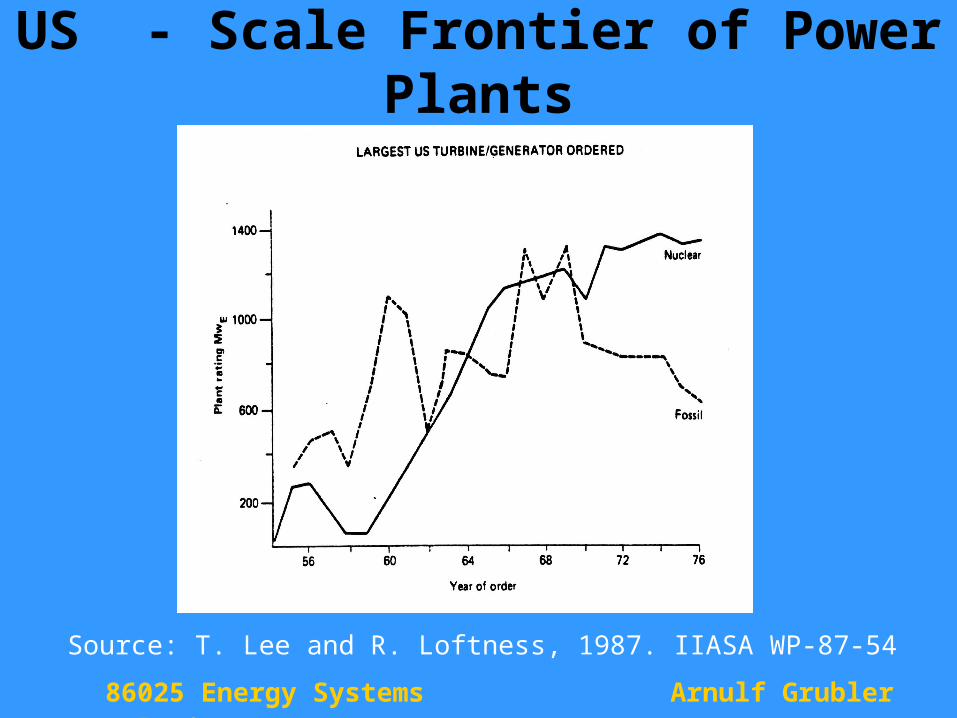
US - Scale Frontier of Power Plants
Source: T. Lee and R. Loftness, 1987. IIASA WP-87-54
86025 Energy Systems Analysis Arnulf Grubler
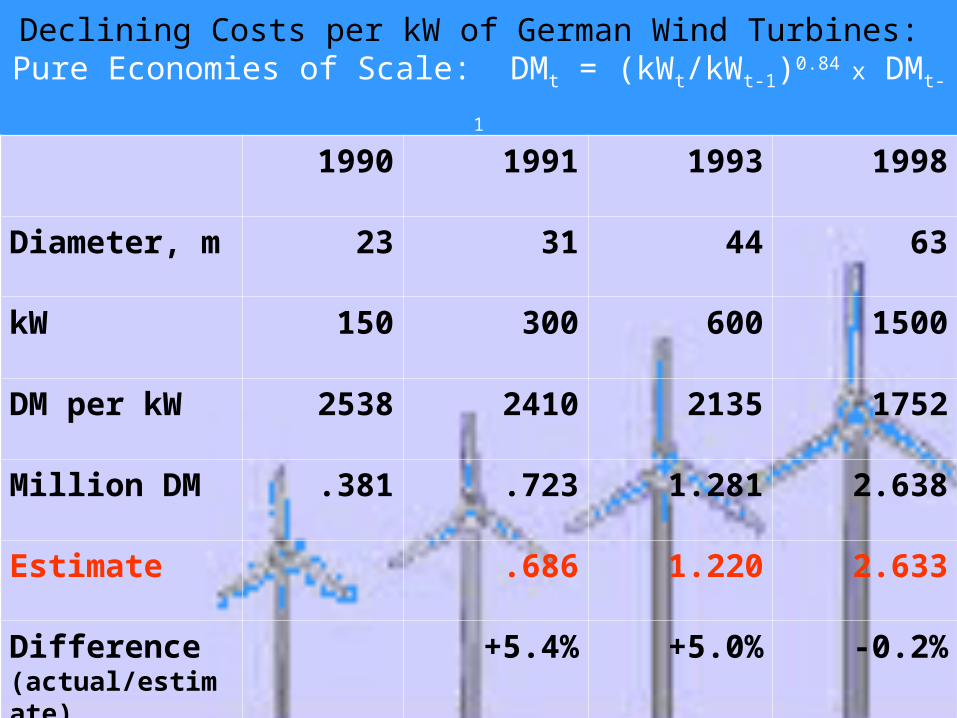
1990 1991 1993 1998
Diameter, m 23 31 44 63
kW 150 300 600 1500
DM per kW 2538 2410 2135 1752
Million DM .381 .723 1.281 2.638
Estimate .686 1.220 2.633
Difference (actual/estimate)
+5.4% +5.0% -0.2%
Declining Costs per kW of German Wind Turbines: Pure Economies of Scale: DMt = (kWt/kWt-1)0.84 x DMt-1
86025 Energy Systems Analysis Arnulf Grubler
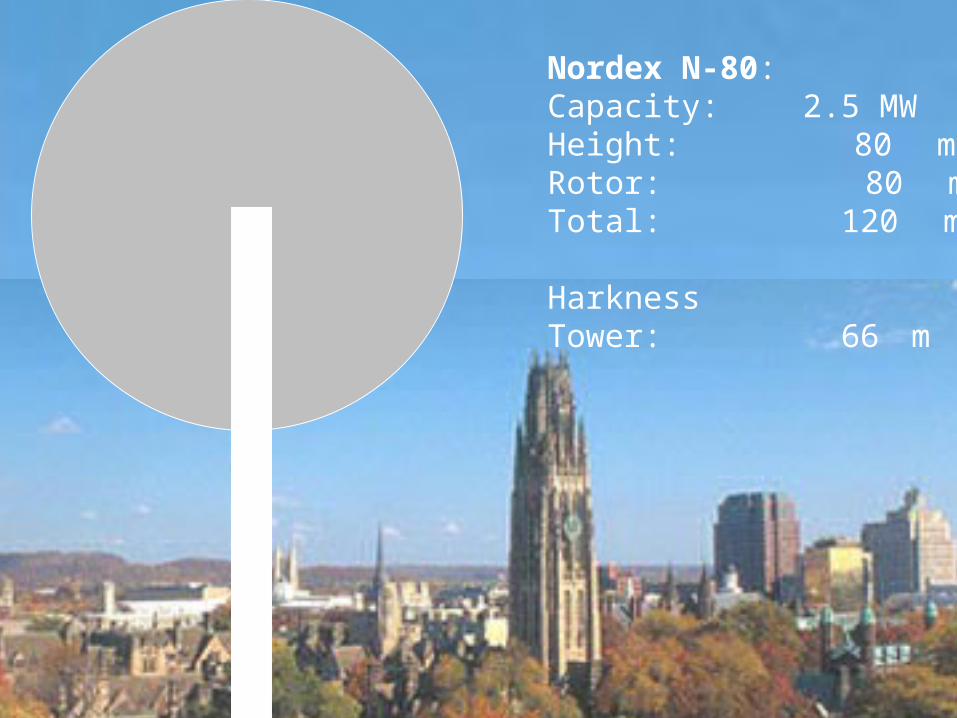
Nordex N-80: Capacity: 2.5 MWHeight: 80 mRotor: 80 mTotal: 120 m
HarknessTower: 66 m
86025 Energy Systems Analysis Arnulf Grubler
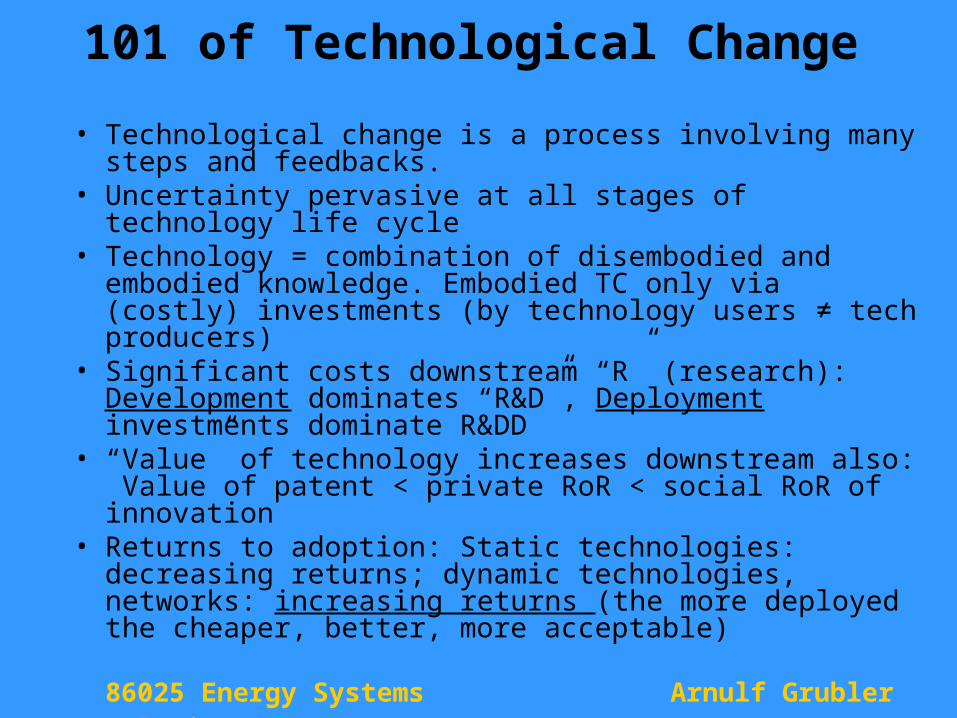
101 of Technological Change
• Technological change is a process involving many steps and feedbacks.
• Uncertainty pervasive at all stages of technology life cycle
• Technology = combination of disembodied and embodied knowledge. Embodied TC only via (costly) investments (by technology users ≠ tech producers)
• Significant costs downstream “R” (research): Development dominates “R&D”, Deployment investments dominate R&DD
• “Value” of technology increases downstream also: Value of patent < private RoR < social RoR of innovation
• Returns to adoption: Static technologies: decreasing returns; dynamic technologies, networks: increasing returns (the more deployed the cheaper, better, more acceptable)
86025 Energy Systems Analysis Arnulf Grubler
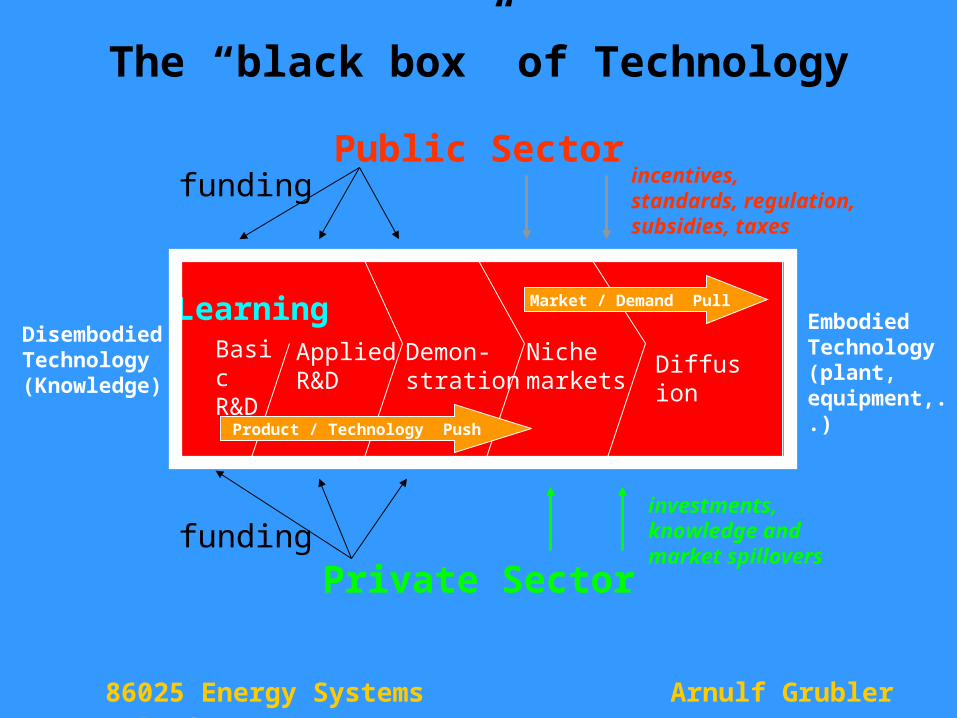
The “black box” of Technology
BasicR&D
AppliedR&D
Demon-stration
Nichemarkets
Diffusion
Product / Technology Push
Market / Demand PullLearning
Public Sector
Private Sector
DisembodiedTechnology(Knowledge)
EmbodiedTechnology(plant,equipment,..)
funding
funding incentives,standards, regulation,subsidies, taxes
investments,knowledge andmarket spillovers
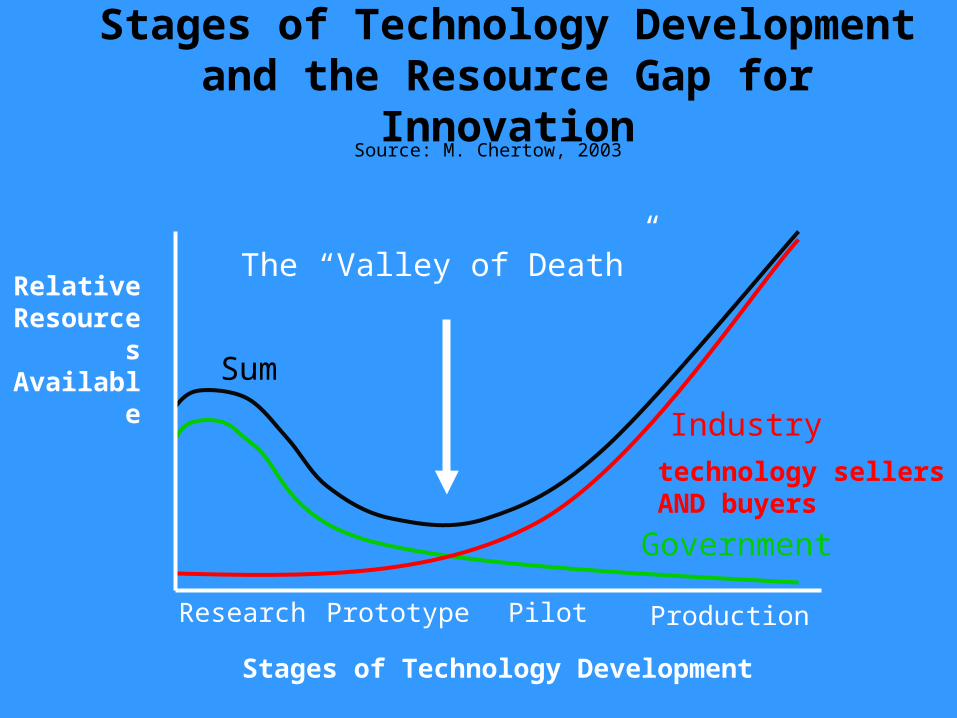
Stages of Technology Development and the Resource Gap for Innovation
Stages of Technology Development
Research Prototype Pilot Production
Sum
Government
Industry
Relative Resourc
es Availabl
e
The “Valley of Death”
Source: M. Chertow, 2003
technology sellersAND buyers
86025 Energy Systems Analysis Arnulf Grubler
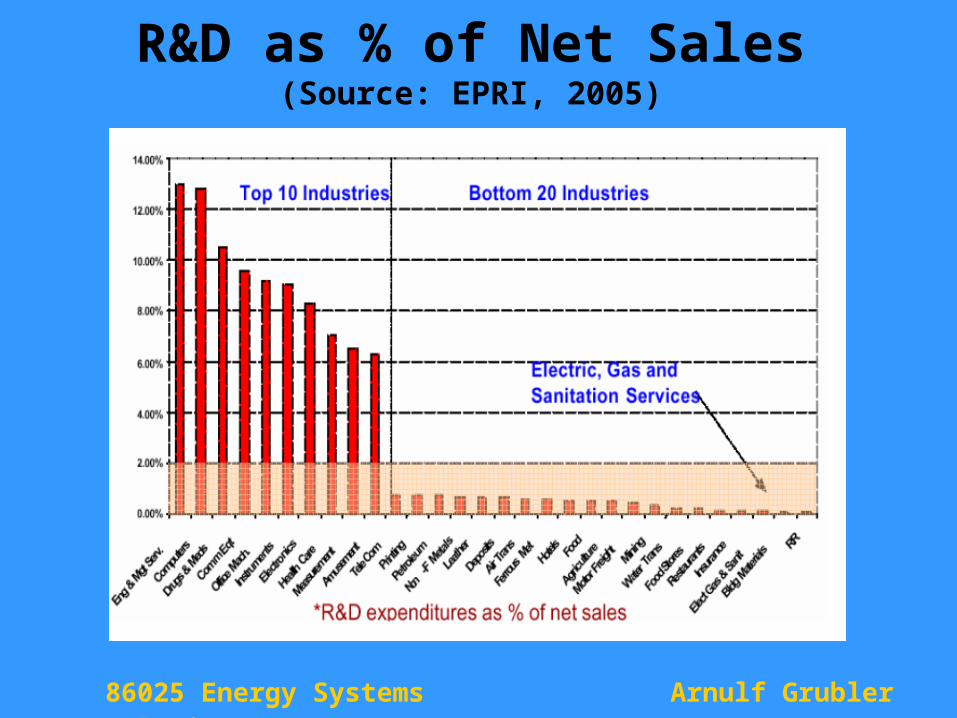
R&D as % of Net Sales(Source: EPRI, 2005)
86025 Energy Systems Analysis Arnulf Grubler
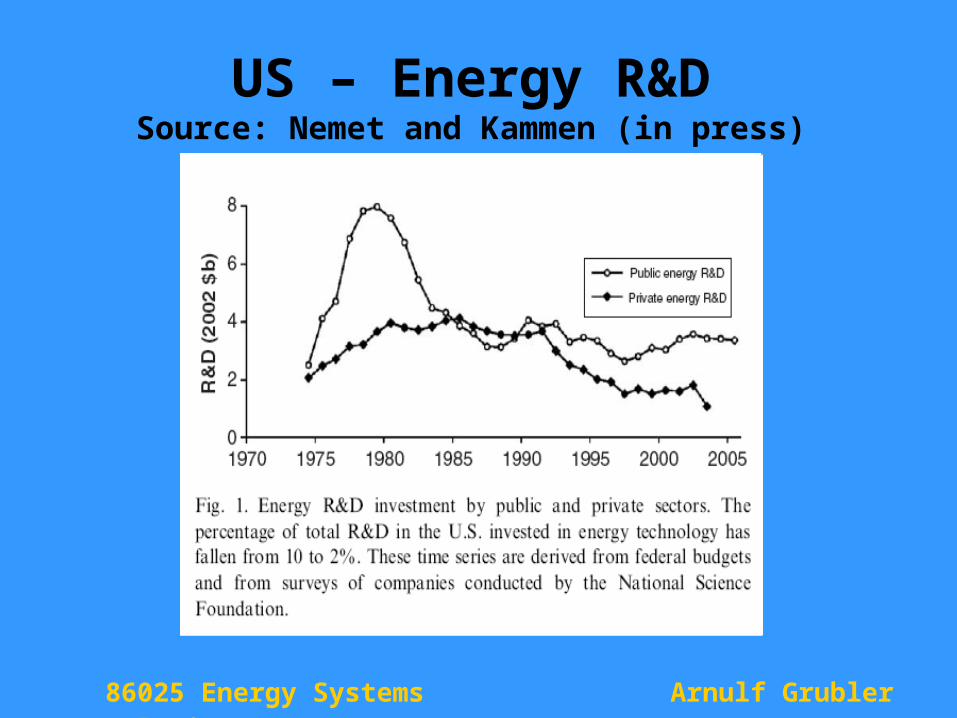
US – Energy R&DSource: Nemet and Kammen (in press)
86025 Energy Systems Analysis Arnulf Grubler
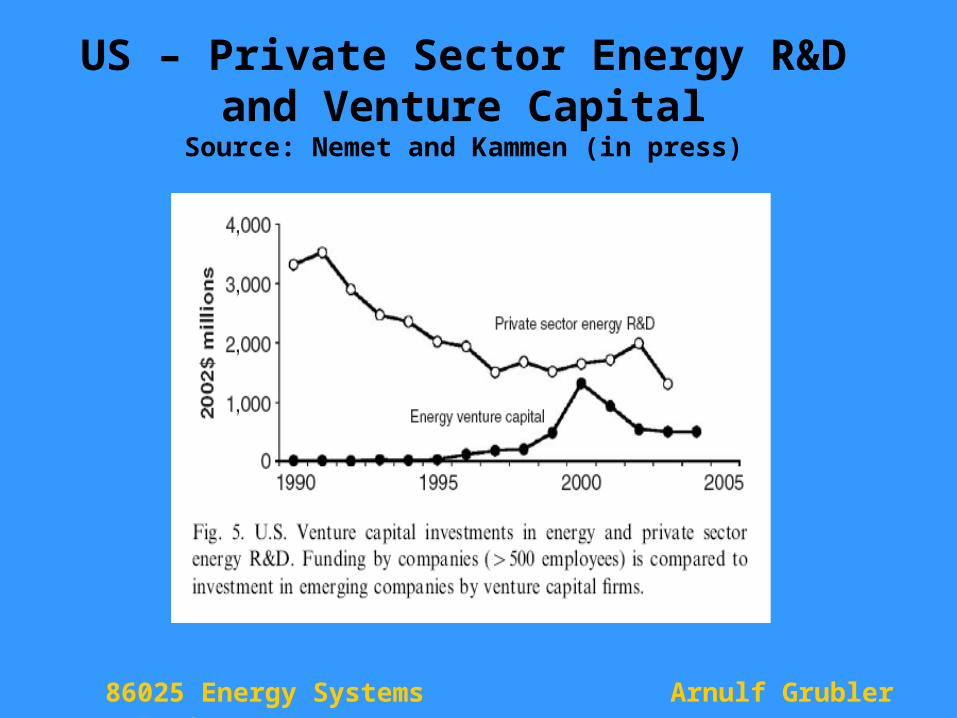
US – Private Sector Energy R&D and Venture Capital
Source: Nemet and Kammen (in press)
86025 Energy Systems Analysis Arnulf Grubler
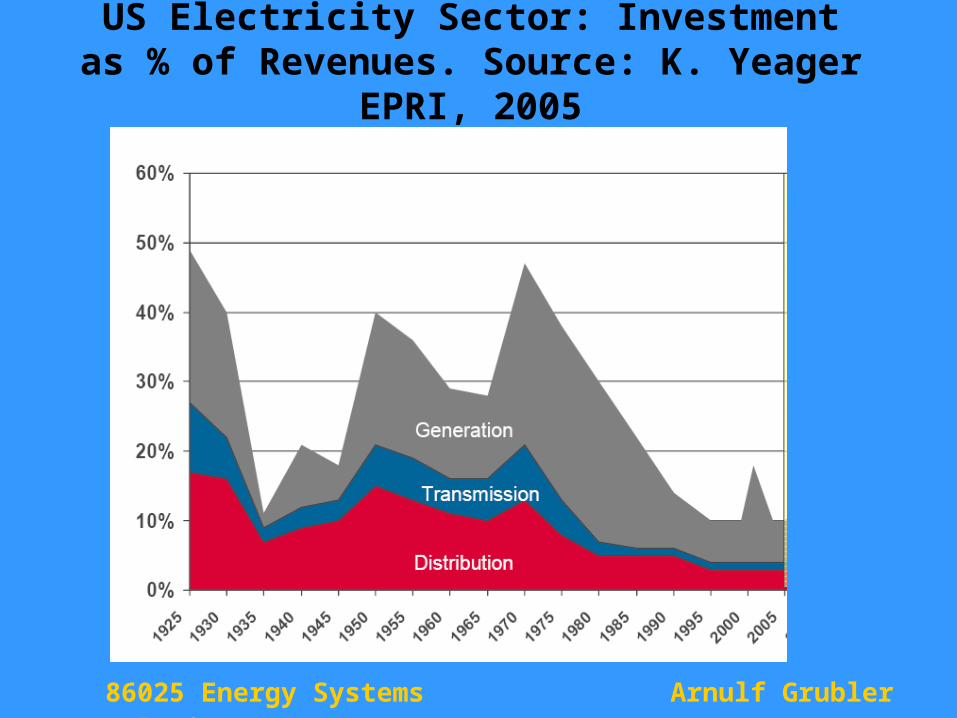
US Electricity Sector: Investment as % of Revenues. Source: K. Yeager EPRI, 2005
86025 Energy Systems Analysis Arnulf Grubler
The Energy “Valley of Tears”
• Declining R&D (public and private)
• Declining investments
• Declining venture capital
• Declining long-term R&D and investment incentives in deregulated markets
• Increasing needs for long-term strategic decision making (hedging portfolios to address climate change)
86025 Energy Systems Analysis Arnulf Grubler
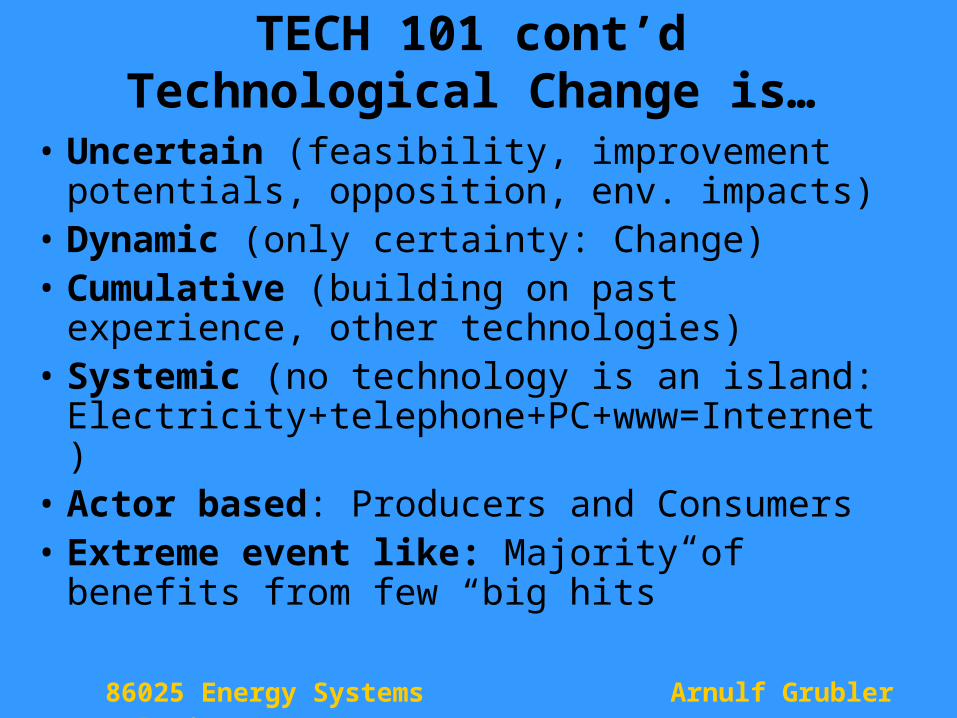
TECH 101 cont’dTechnological Change is…
• Uncertain (feasibility, improvement potentials, opposition, env. impacts)
• Dynamic (only certainty: Change)• Cumulative (building on past experience,
other technologies)• Systemic (no technology is an island:
Electricity+telephone+PC+www=Internet)• Actor based: Producers and Consumers• Extreme event like: Majority of benefits
from few “big hits”
86025 Energy Systems Analysis Arnulf Grubler
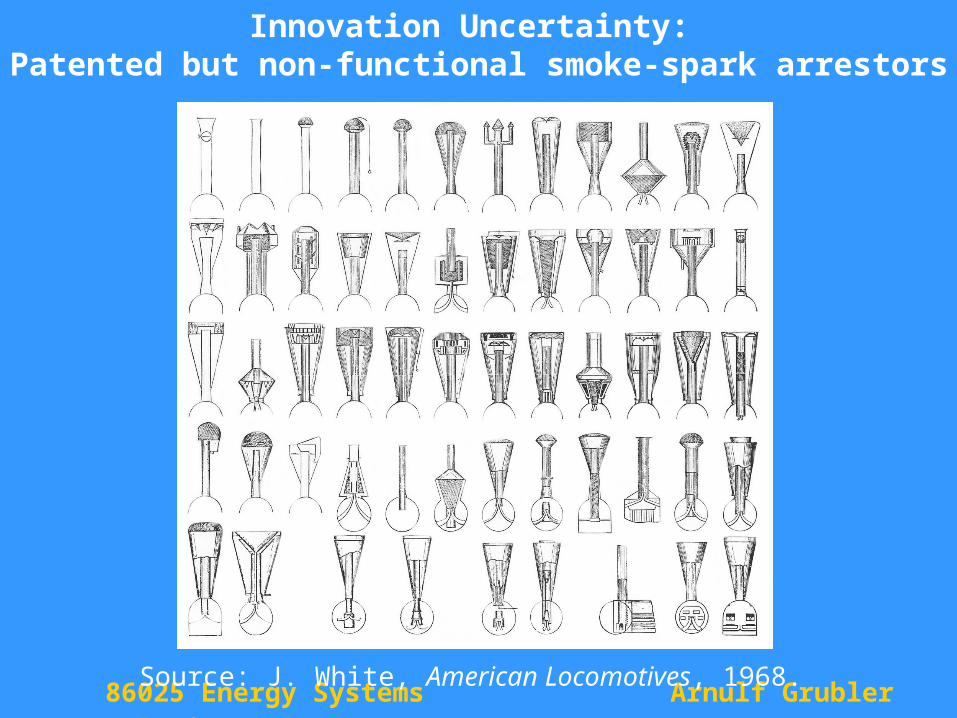
Innovation Uncertainty: Patented but non-functional smoke-spark arrestors
Source: J. White, American Locomotives, 1968.
86025 Energy Systems Analysis Arnulf Grubler
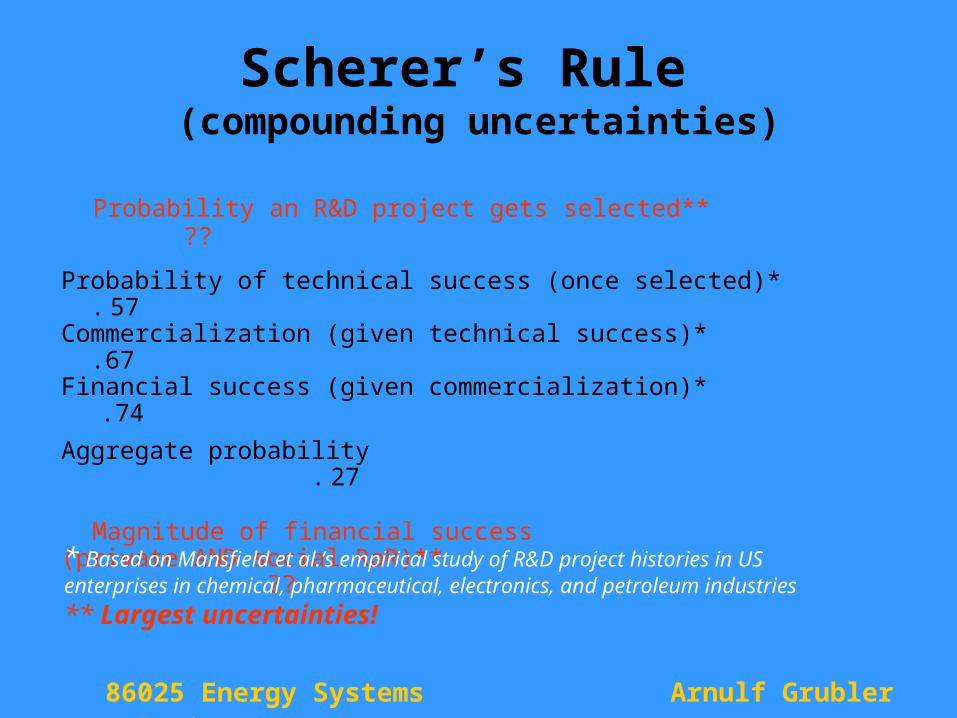
Scherer’s Rule (compounding uncertainties)
Probability an R&D project gets selected** ??
Probability of technical success (once selected)* . 57Commercialization (given technical success)* .67Financial success (given commercialization)* .74
Aggregate probability . 27
Magnitude of financial success(private AND social RoR)** ??
* Based on Mansfield et al.’s empirical study of R&D project histories in US enterprises in chemical, pharmaceutical, electronics, and petroleum industries
** Largest uncertainties!

86025 Energy Systems Analysis Arnulf Grubler
Fat tailed distributions: Pay-offs from US Pharmaceutical Innovations:
(similar as in UK and EU “patent value” studies)
Source: Scherer, 2000.
NCE: New Chemical Entities
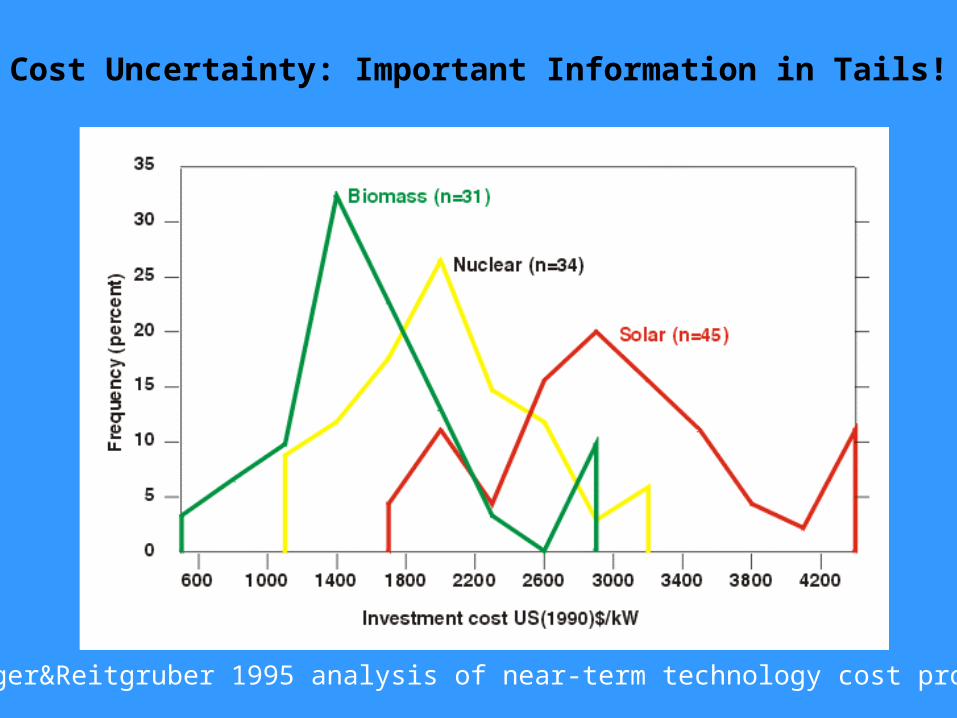
Cost Uncertainty: Important Information in Tails!
Strubegger&Reitgruber 1995 analysis of near-term technology cost projections
86025 Energy Systems Analysis Arnulf Grubler
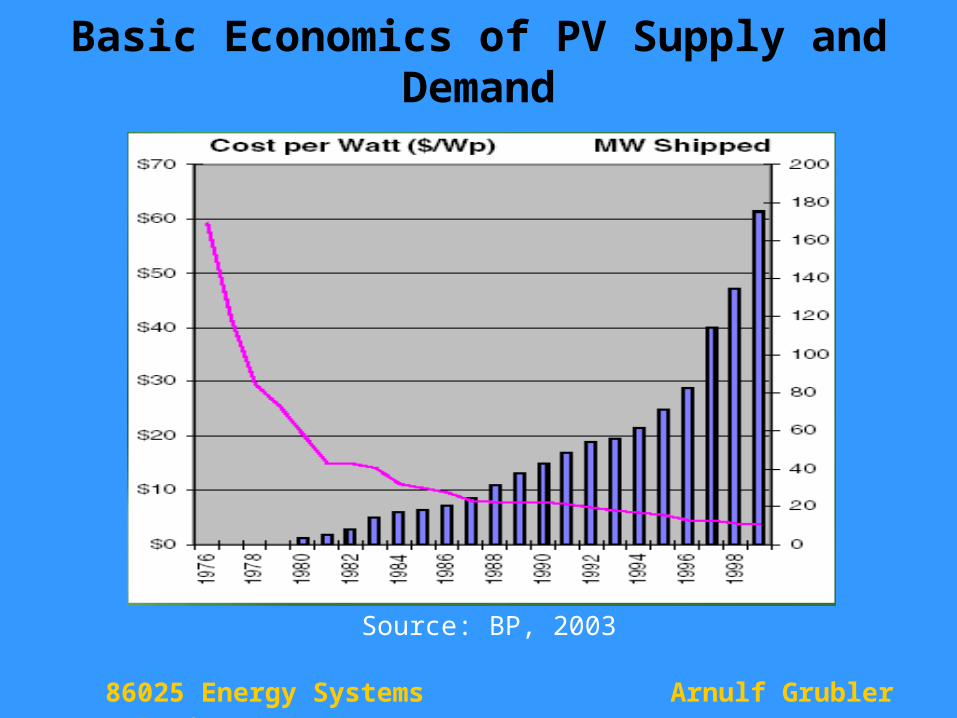
Basic Economics of PV Supply and Demand
Source: BP, 2003
86025 Energy Systems Analysis Arnulf Grubler
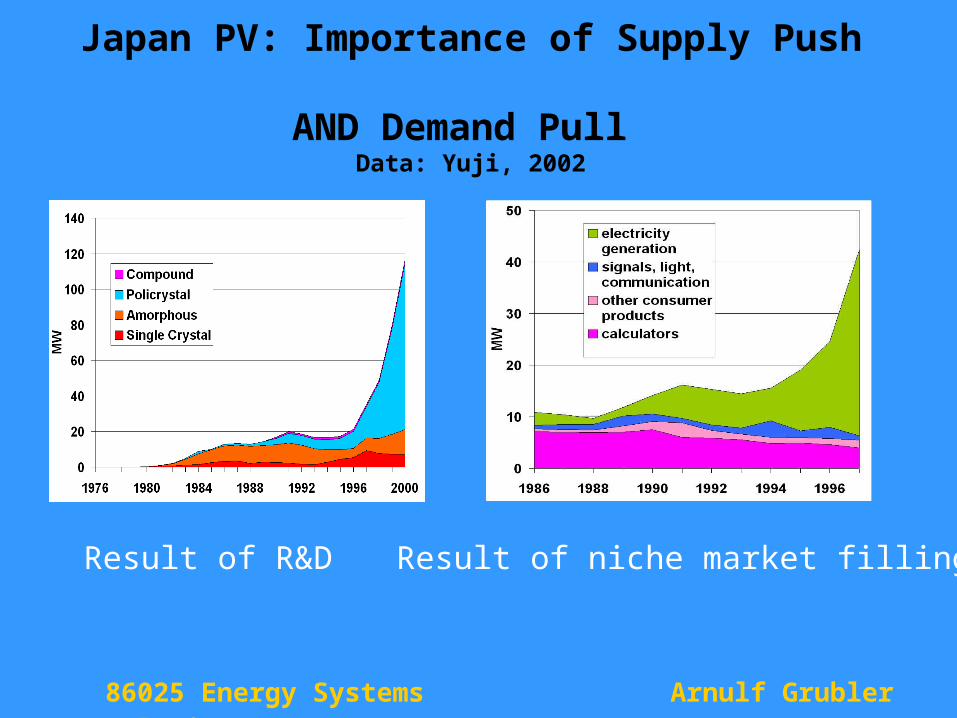
Japan PV: Importance of Supply Push AND Demand Pull
Data: Yuji, 2002
Result of R&D Result of niche market filling
100
1,000
10,000
100,000
0 0.1 1 10 100 1,000
Cumulative expenditures, billion (1985) Yen
PV
cos
ts (
198
5) Y
en p
er W
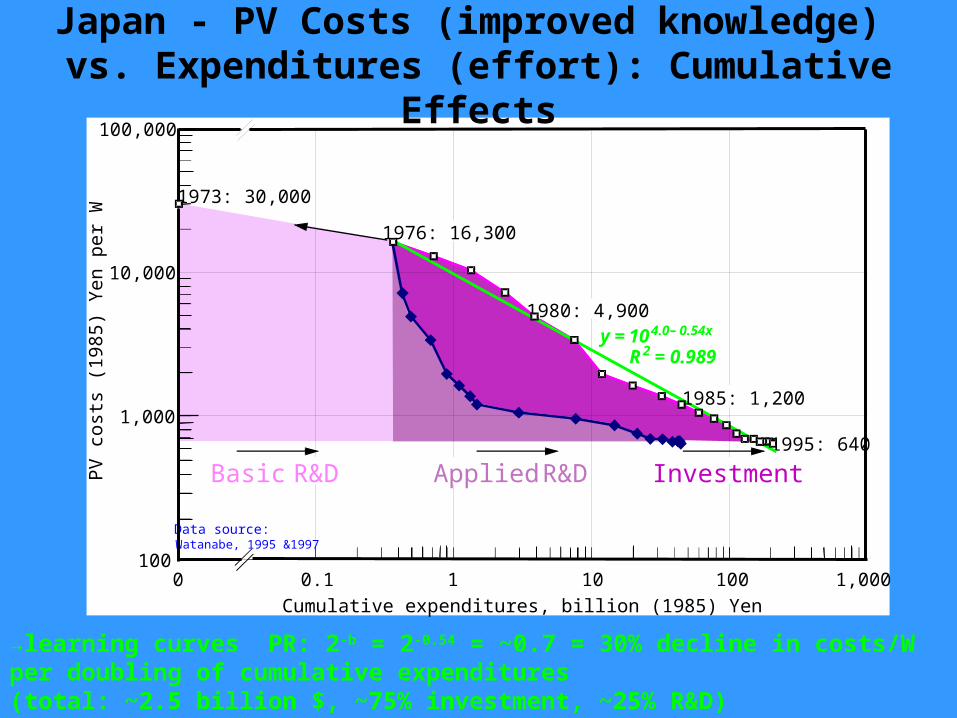
1973: 30,000
y = 10 4.0 – 0.54x
R 2 = 0.989
1995: 640
Applied R&D InvestmentBasic R&D
1976: 16,300
1980: 4,900
1985: 1,200
Data source:Watanabe, 1995 &1997
Japan - PV Costs (improved knowledge) vs. Expenditures (effort): Cumulative Effects
→learning curves PR: 2-b = 2-0.54 = ~0.7 = 30% decline in costs/Wper doubling of cumulative expenditures(total: ~2.5 billion $, ~75% investment, ~25% R&D)
86025 Energy Systems Analysis Arnulf Grubler
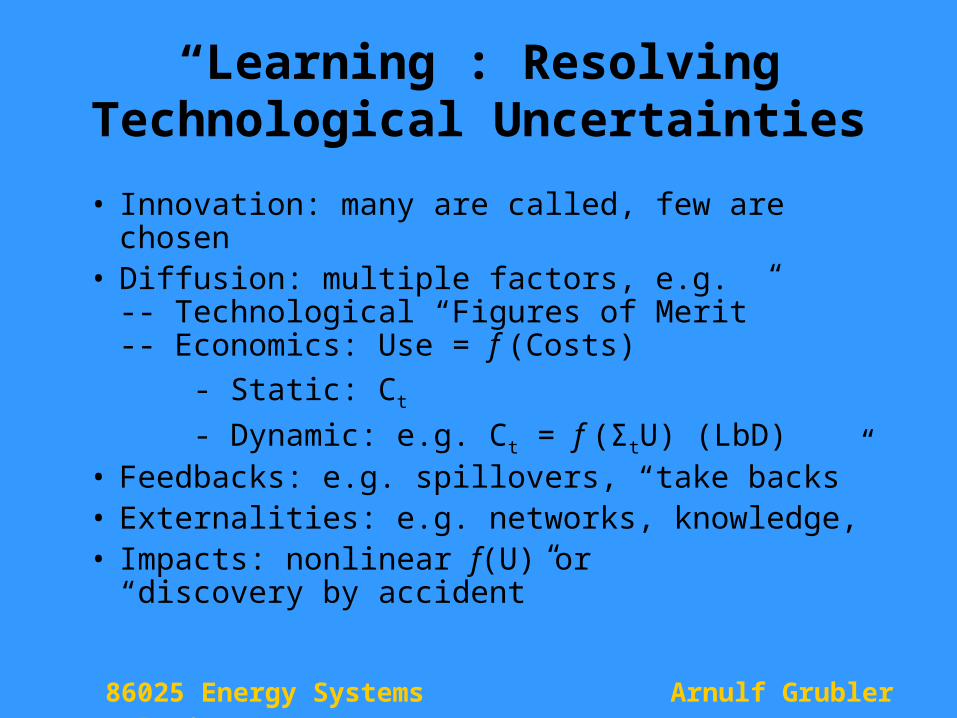
“Learning”: ResolvingTechnological Uncertainties
• Innovation: many are called, few are chosen• Diffusion: multiple factors, e.g.
-- Technological “Figures of Merit”-- Economics: Use = f (Costs)
- Static: Ct
- Dynamic: e.g. Ct = f (ΣtU) (LbD)• Feedbacks: e.g. spillovers, “take backs”• Externalities: e.g. networks, knowledge,• Impacts: nonlinear f(U) or
“discovery by accident”
86025 Energy Systems Analysis Arnulf Grubler
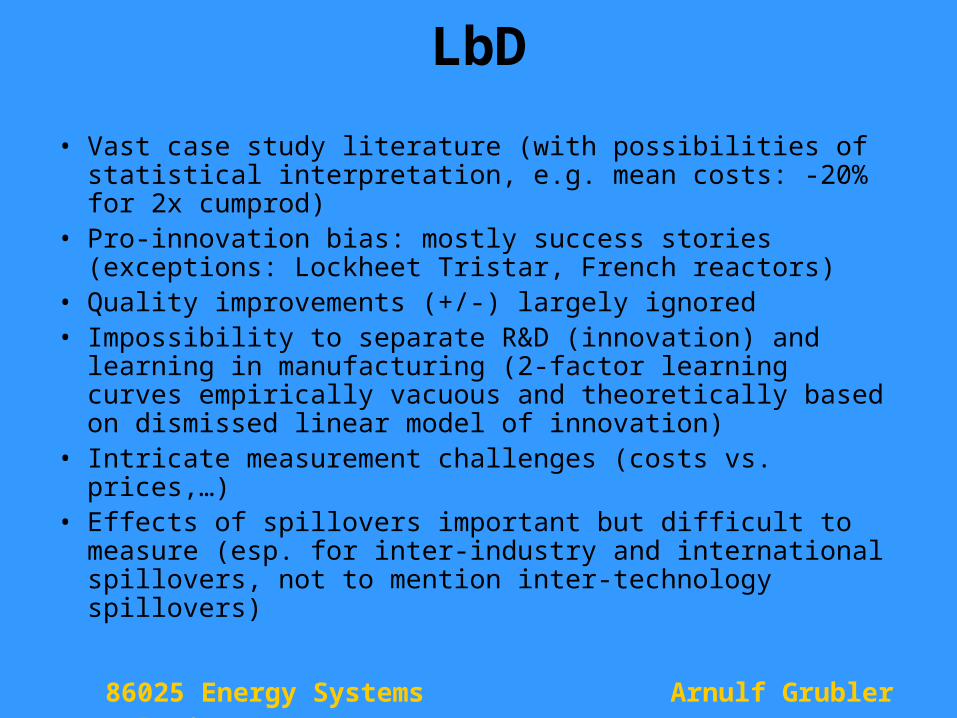
LbD
• Vast case study literature (with possibilities of statistical interpretation, e.g. mean costs: -20% for 2x cumprod)
• Pro-innovation bias: mostly success stories (exceptions: Lockheet Tristar, French reactors)
• Quality improvements (+/-) largely ignored• Impossibility to separate R&D (innovation) and learning
in manufacturing (2-factor learning curves empirically vacuous and theoretically based on dismissed linear model of innovation)
• Intricate measurement challenges (costs vs. prices,…)• Effects of spillovers important but difficult to measure
(esp. for inter-industry and internationalspillovers, not to mention inter-technology spillovers)
86025 Energy Systems Analysis Arnulf Grubler
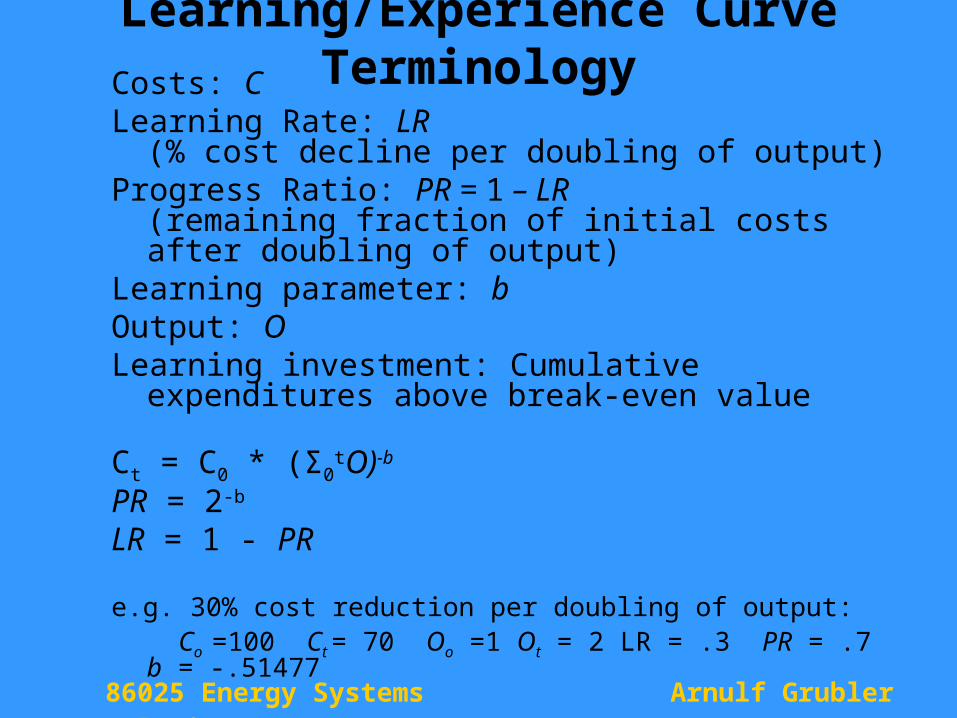
Learning/Experience Curve TerminologyCosts: CLearning Rate: LR
(% cost decline per doubling of output)Progress Ratio: PR = 1 – LR
(remaining fraction of initial costs after doubling of output)
Learning parameter: bOutput: OLearning investment: Cumulative expenditures above
break-even value
Ct = C0 * (Σ0tO)-b
PR = 2-b
LR = 1 - PR
e.g. 30% cost reduction per doubling of output: Co =100 Ct = 70 Oo =1 Ot = 2 LR = .3 PR = .7 b = -.51477
86025 Energy Systems Analysis Arnulf Grubler
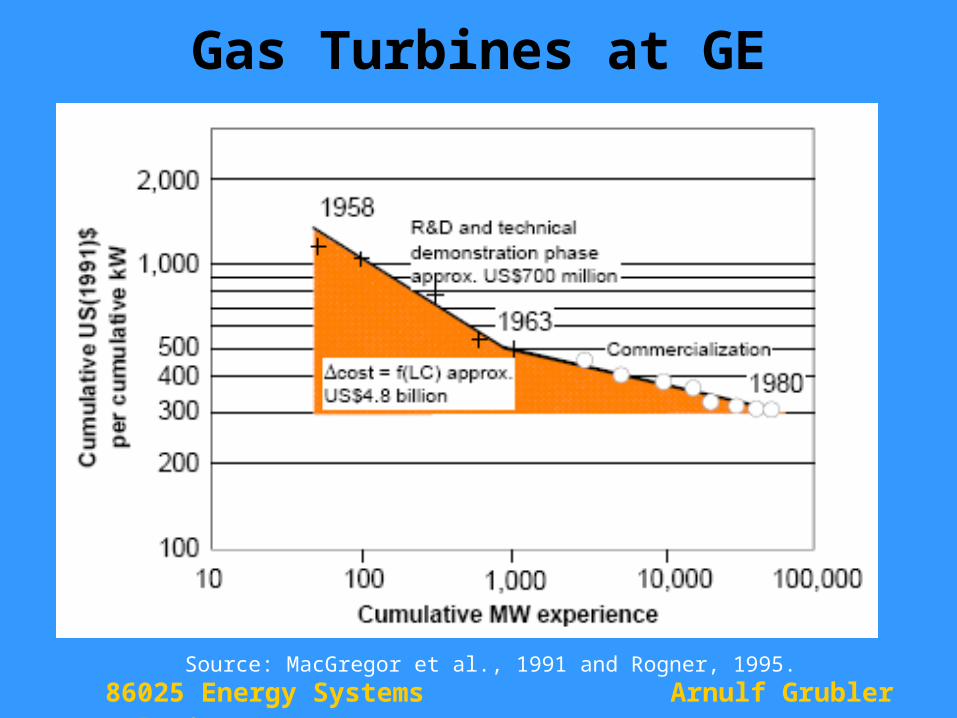
Gas Turbines at GE
Source: MacGregor et al., 1991 and Rogner, 1995.
86025 Energy Systems Analysis Arnulf Grubler
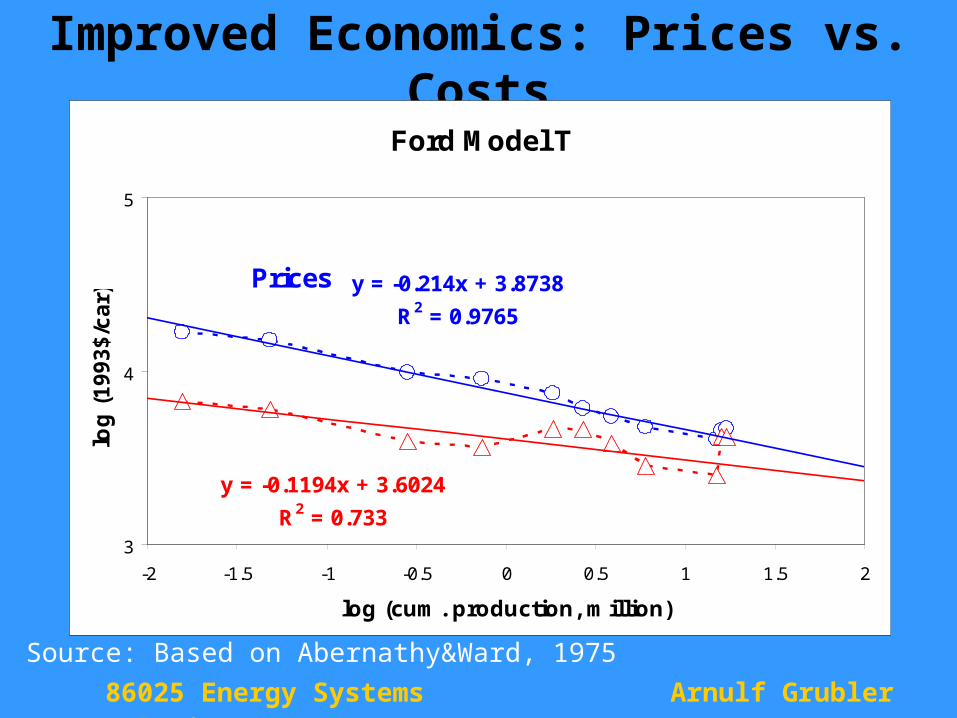
Improved Economics: Prices vs. Costs
Ford Model T
y = -0.214x + 3.8738
R2 = 0.9765
y = -0.1194x + 3.6024
R2 = 0.7333
4
5
-2 -1.5 -1 -0.5 0 0.5 1 1.5 2
log (cum. production, million)
log
(1
99
3$
/ca
r)
Prices
Costs
Source: Based on Abernathy&Ward, 1975

Learning Potentials: Number of units sold to date and cum. investments (at current replacement costs)
Cumulative number produced to date (1900-2005)
Investments, billion $
Motor vehicles/ICEs >2 10^9 42,000
Fuel cells <1 10^4 ~2
Computer microchips >1 10^11 800
PV cells >1 10^9 30
Gas turbines <1 10^5 130
Wind turbines <1 10^5 80
Nuclear reactors <1 10^3 1,000
Reminder: LbD Models need to separate economies of scale effects,i.e. consider UNITS rather than capacity
86025 Energy Systems Analysis Arnulf Grubler
Technology Learning Curves
Windmills (Germany) (learning rate <10%)
2002
1993
1990
1998
86025 Energy Systems Analysis Arnulf Grubler
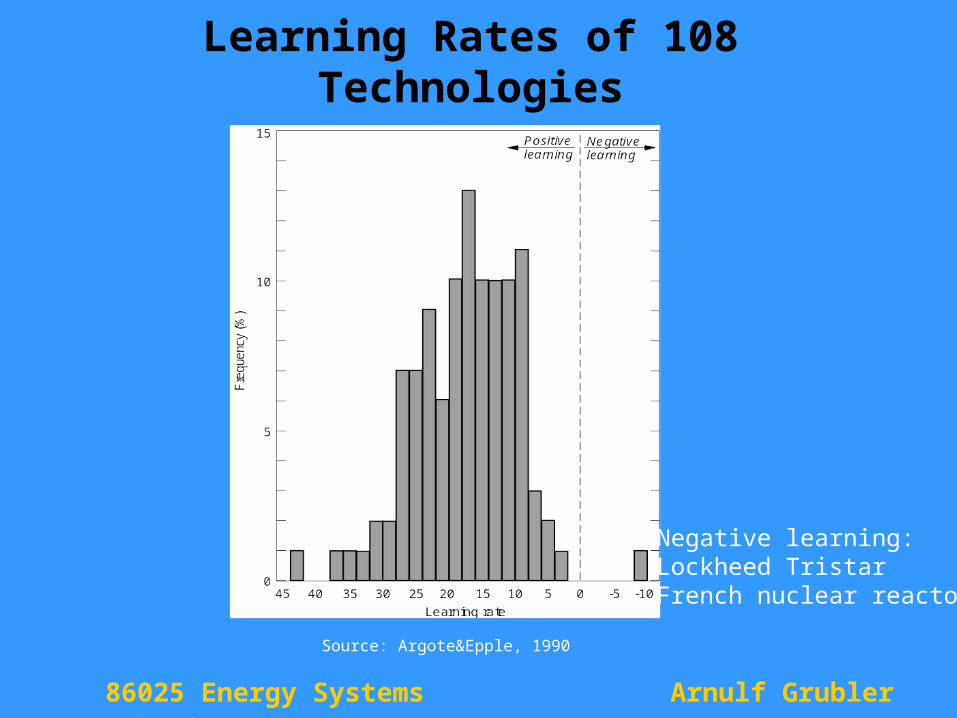
Learning Rates of 108 Technologies
Source: Argote&Epple, 1990
Negative learning:Lockheed TristarFrench nuclear reactors
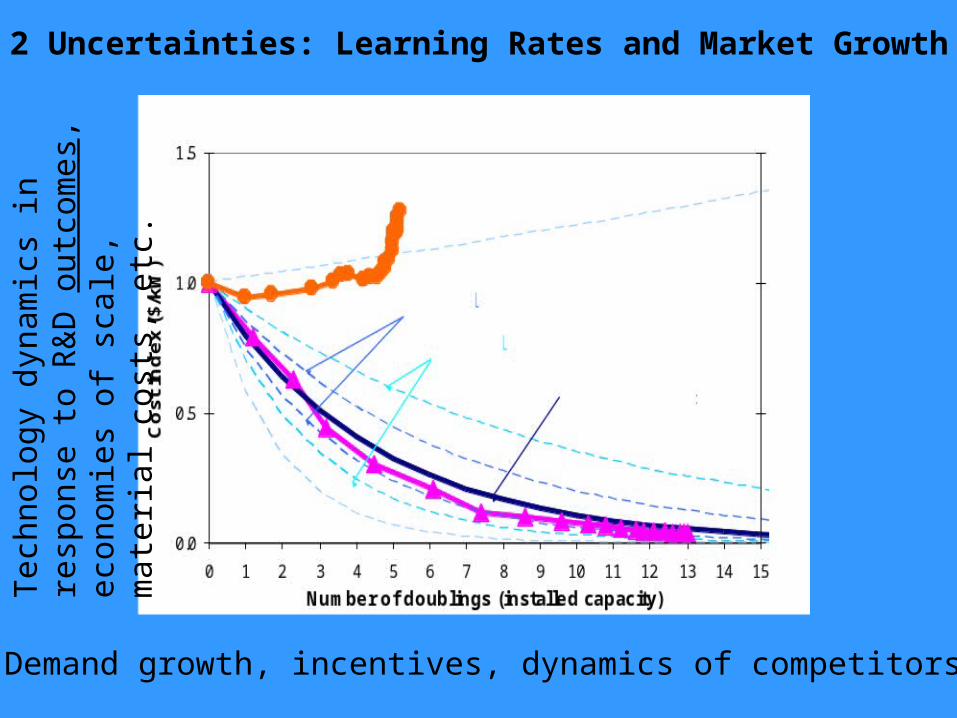
2 Uncertainties: Learning Rates and Market GrowthT
echn
olog
y dy
nam
ics
in r
espo
nse
to
R&
D o
utco
mes
, eco
nom
ies
of s
cale
, m
ater
ial c
osts
, etc
.
Demand growth, incentives, dynamics of competitors
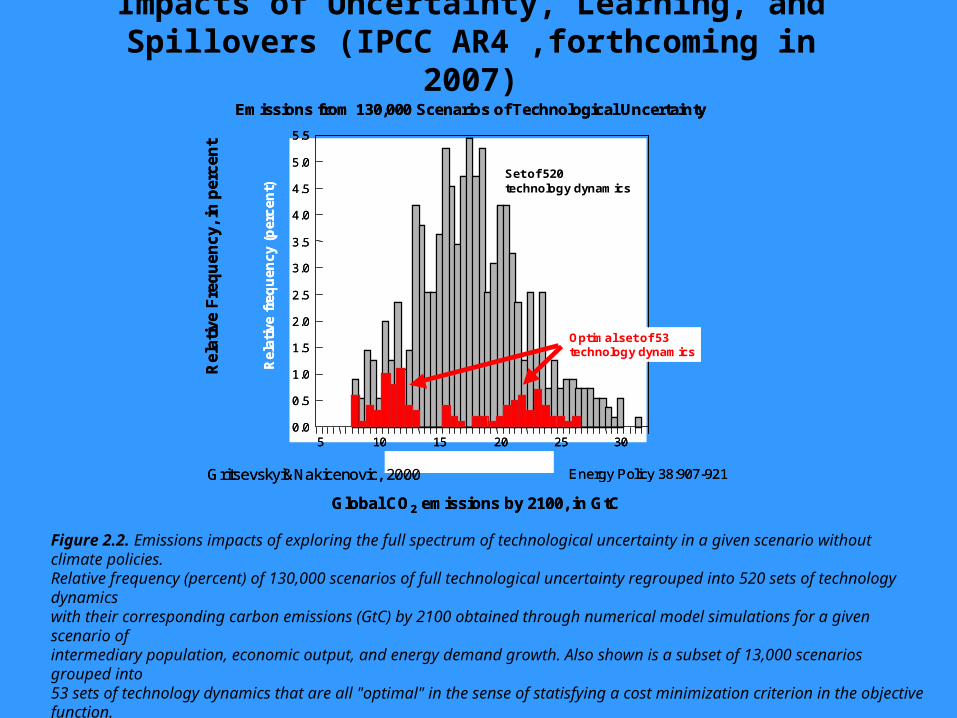
Impacts of Uncertainty, Learning, and Spillovers (IPCC AR4 ,forthcoming in 2007)
Emissions from 130,000 Scenarios of Technological Uncertainty
Emissions by 2100, GtC
Rela
tive f
req
uen
cy (
perc
en
t)
5 10 15 20 25 30
5.5
5.0
4.5
4.0
3.5
3.0
2.5
2.0
1.5
1.0
0.5
0.05 10 15 20 25 30
5.5
5.0
4.5
4.0
3.5
3.0
2.5
2.0
1.5
1.0
0.5
0.0
Set of 520 technology dynamics
Optimal set of 53technology dynamics
Gritsevskyi&Nakicenovic, 2000 Energy Policy 38:907-921
Global CO2 emissions by 2100, in GtC
Rel
ativ
e F
req
ue
nc
y, i
n p
erce
nt
Figure 2.2. Emissions impacts of exploring the full spectrum of technological uncertainty in a given scenario without climate policies. Relative frequency (percent) of 130,000 scenarios of full technological uncertainty regrouped into 520 sets of technology dynamicswith their corresponding carbon emissions (GtC) by 2100 obtained through numerical model simulations for a given scenario of intermediary population, economic output, and energy demand growth. Also shown is a subset of 13,000 scenarios grouped into 53 sets of technology dynamics that are all "optimal" in the sense of statisfying a cost minimization criterion in the objective function. The corresponding distribution function is bi-modal, illustrating "technological lock-in" into low or high emissions futures respectivelythat arise from technological interdependence and spillover effects. Baseline emissions are an important determinant for the feasibility and costs of achieving particular climate targets that are ceteris paribus cheaper with lower baseline emissions. Source: Adapted from Gritsevskyi and Nakicenovic, 2000.
86025 Energy Systems Analysis Arnulf Grubler
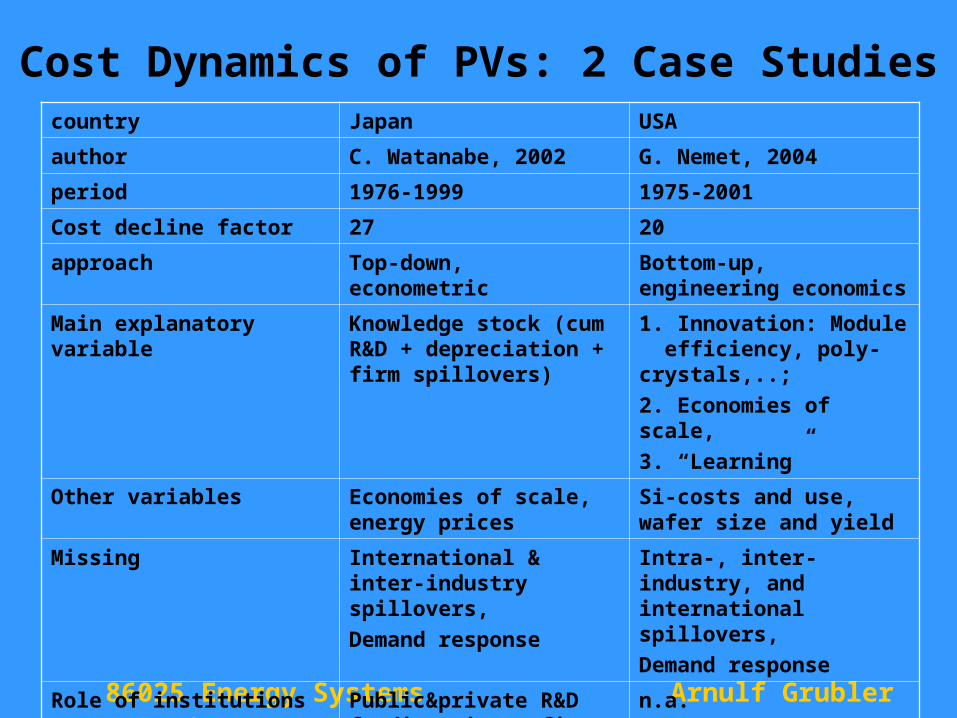
Cost Dynamics of PVs: 2 Case Studiescountry Japan USA
author C. Watanabe, 2002 G. Nemet, 2004
period 1976-1999 1975-2001
Cost decline factor 27 20
approach Top-down,econometric
Bottom-up, engineering economics
Main explanatory variable Knowledge stock (cum R&D + depreciation + firm spillovers)
1. Innovation: Module efficiency, poly-crystals,..;
2. Economies of scale,
3. “Learning”
Other variables Economies of scale,energy prices
Si-costs and use,wafer size and yield
Missing International & inter-industry spillovers,
Demand response
Intra-, inter-industry, and international spillovers,
Demand response
Role of institutions Public&private R&D funding, intra-firm spillovers
n.a.
86025 Energy Systems Analysis Arnulf Grubler
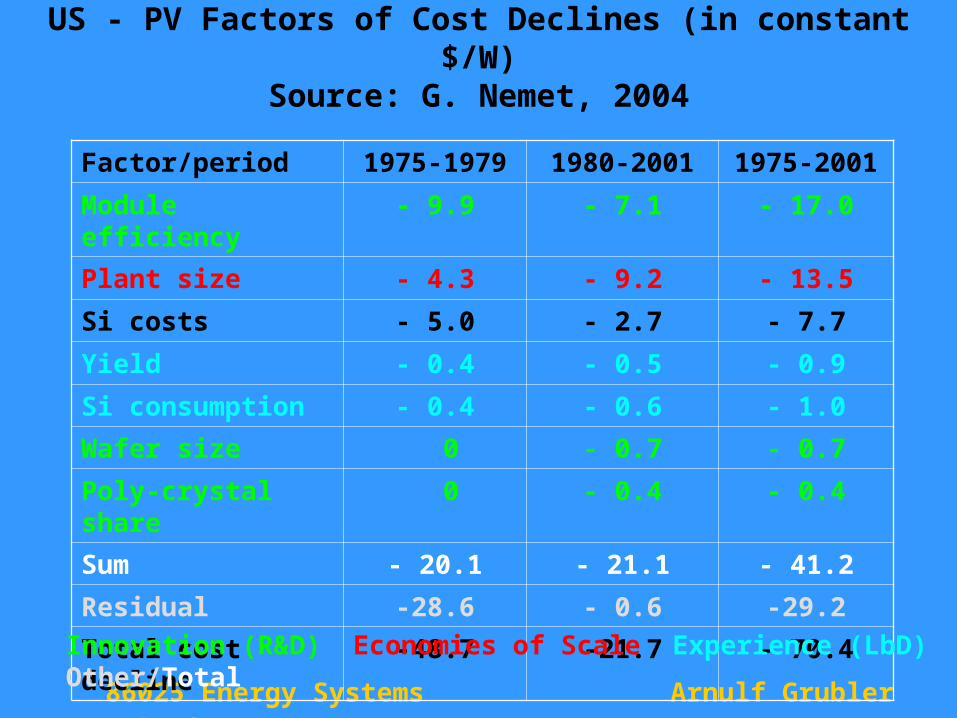
US - PV Factors of Cost Declines (in constant $/W)Source: G. Nemet, 2004
Factor/period 1975-1979 1980-2001 1975-2001
Module efficiency - 9.9 - 7.1 - 17.0
Plant size - 4.3 - 9.2 - 13.5
Si costs - 5.0 - 2.7 - 7.7
Yield - 0.4 - 0.5 - 0.9
Si consumption - 0.4 - 0.6 - 1.0
Wafer size 0 - 0.7 - 0.7
Poly-crystal share 0 - 0.4 - 0.4
Sum - 20.1 - 21.1 - 41.2
Residual -28.6 - 0.6 -29.2
Total cost decline -48.7 -21.7 - 70.4
Innovation (R&D) Economies of Scale Experience (LbD) Other/Total
86025 Energy Systems Analysis Arnulf Grubler
Summary• Technologies have emergent properties that are
constructed by “learning” processes (increasing returns!)
• Good empirical and theoretical understanding of “routine” innovations (e.g. incremental improvements via industrial R&D)
• Need to move beyond proxy drivers and black-box view of technology:Who learns what, when, and how?
• Need to move beyond pro-innovation biasin the empirical literature
• Technologies of greatest (economic, social, environmental) interest: low probability, extreme events which are difficult to anticipate or to model (→scenario approach)


![Jacobian Based Kinematic and Static Analysis of Over ... · method like Grubler-Kutzbach criteria [2] are based on only ... dom by the traditional Grubler-Kutzback criteria even though,](https://img.pdfslide.net/doc/110x75/5b79f3c77f8b9a703b8ebd9c/jacobian-based-kinematic-and-static-analysis-of-over-method-like-grubler-kutzbach.jpg)