Embed Size (px)
Citation preview
Woolworths Limited ABN 88 000 014 675
9 September 2016 ASX Market Announcements Office Australian Securities Exchange 20 Bridge Street Sydney NSW 2000 Dear Sir/Madam 2016 Annual Report Please see attached the 2016 Annual Report for Woolworths Limited. For and on behalf of WOOLWORTHS LIMITED
RICHARD DAMMERY Chief Legal Officer and Company Secretary
For
per
sona
l use
onl
y

2 0 1 6A N N U A LR E P O R T
Woolworths LimitedABN 88 000 014 675
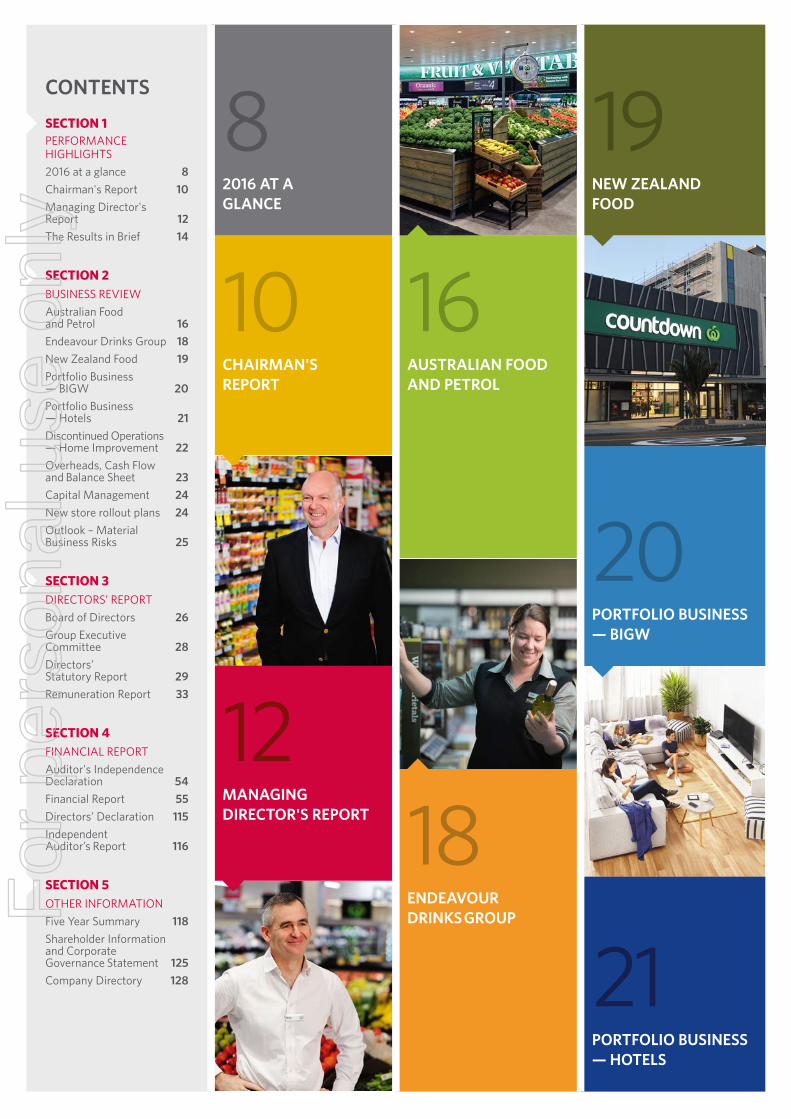
We bring a little good to
everyone, every day.
For
per
sona
l use
onl
y
12MANAGING DIRECTOR'S REPORT
21PORTFOLIO BUSINESS — HOTELS
82016 AT A GLANCE
19NEW ZEALAND FOOD
10CHAIRMAN'S REPORT
20PORTFOLIO BUSINESS — BIGW
16AUSTRALIAN FOOD AND PETROL
18ENDEAVOUR DRINKS GROUP
CONTENTSSECTION 1PERFORMANCE HIGHLIGHTS2016 at a glance 8Chairman's Report 10Managing Director's Report 12The Results in Brief 14
SECTION 2BUSINESS REVIEWAustralian Food and Petrol 16Endeavour Drinks Group 18New Zealand Food 19Portfolio Business — BIGW 20Portfolio Business — Hotels 21Discontinued Operations — Home Improvement 22Overheads, Cash Flow and Balance Sheet 23Capital Management 24New store rollout plans 24Outlook – Material Business Risks 25
SECTION 3DIRECTORS’ REPORTBoard of Directors 26Group Executive Committee 28Directors’ Statutory Report 29Remuneration Report 33
SECTION 4FINANCIAL REPORTAuditor's Independence Declaration 54Financial Report 55Directors’ Declaration 115Independent Auditor’s Report 116
SECTION 5OTHER INFORMATIONFive Year Summary 118Shareholder Information and Corporate Governance Statement 125Company Directory 128
For
per
sona
l use
onl
y
"There are some real gems here. I’ll line up specifically for the good ones. They smile all the time and are just really nice, well trained people." QLD "The checkout staff are just amazing on the whole and a real credit to the store; they’re friendly, chatty and efficient!" ACT "Why would I go anywhere else? I can park at the door and in two steps I’ve got my trolley and am shopping. It’s great." QLD "This lady is one of the great packers — soft fruit never bruised, meat kept separately, etc — however others, mainly teenagers, would benefit from more training." WA "That is a very good price. I like my half‑price deals. Why pay more?" QLD "The staff on the floor make the experience for me; they’re very friendly and really helpful, always helping you to find the unusual items!" ACT "I think there has been an improvement in the fresh fruit and veg lately. Probably changed in the lead up to Christmas." NSW "I see the manager often helping. I saw him fixing the hot cross buns. Shows me he cares about his shop." VIC "I love how it's all fresh not frozen. Makes me want to look and buy!! Best seafood
around and we come up from 20 mins away to buy it here." QLD "Always well laid out. Like the veg here. A good choice." SA "Brilliant service by this lady (Uma). She's exceptional. Efficient and friendly. We will line up for her or Alan. They're the best." NSW "Love the introduction of the Odd Bunches — we need more of them — greater range." WA "The range and presentation of the
apples is amazing." ACT "Although pricey we will splurge on wagyu occasionally. It's beautiful and tender. The meat from this display is consistently good. You'll pay more but it's worth it. Best of all it’s grass fed..." NSW "This shop is always really well stocked and the aisles are always clean and tidy." WA "Fresh Fruit for Kids promotes healthy eating for kids and is regularly stocked — even at 8pm at
night after cricket training." VIC "I love the bread roll selection; great for lunches." ACT "The meat in this store is very, very good. Lots of choice and lots of well priced items." WA "The ladies on the Deli and the guy in Seafood are all lovely. You can have a laugh with them too which is great." QLD "Bakery area is good — like the range of bread rolls. Always consistent quality." VIC
"The staff are all locals here, they are brilliant. You couldn’t meet a nicer lot." SA "The shelves and displays are always well‑filled and products are brought to the front of the shelves." ACT "Meat prices are competitive with the butcher." NSW "Fresh produce. Lettuce is always crisp. No complaints. They are the Fresh Food People!" QLD "The sushi bar is absolutely fantastic! I just wish they could do even more!" ACT
"Range is good. Even on things like stationery and beauty." NSW "I like that things on sale are put at the front and have prices big and easy to see." VIC "Great for everything you need. The store is reliable." SA "You can see lots of speciaIs in the store. Lots of good ones." SA "Love The Odd Bunch: low cost and quality isn't that bad" VIC "Always get
bargains here. Good work Woolworths." VIC "Love this sushi section. Adds a cosmopolitan feel to the store." WA "I come in to browse their half price specials. They're great." QLD "Yeah, of course I have my favourites! I would rather wait longer to be served by them!" ACT "Love the price per kg or per item on yellow tags. Great for easy price comparison." VIC "They make it look really nice. It all looks very fresh
and I can find what I need, no problem." QLD "Just the atmosphere in store is so friendly; it’s a great ambience!" ACT "You can always get specials here — they are really clear." WA "Sale items displayed look great and are easy to find." VIC "Love the healthfood section." SA "You can always find specials available here to buy." QLD "Good selection (of fruit and vegetables). Can always find what I need." WA "The counters with specials are really well‑marked, so it’s easy to find the bargains!" ACT "Service is excellent. They're always really friendly." QLD "You can find what you want — helpful staff!" WA "Staff take pride in presentation — it looks good." VIC "They widened the entrance recently and it’s so much better now!" ACT "The specials freezer is great. I always come here." QLD "Customer service staff are always friendly and helpful." VIC "Love the yellow reduced price tags. Easy to see specials." VIC "Nice and wide aisles; they just look so clean all the time!" ACT "The specials grab me. They're competitive." QLD "It just has all the fresh stuff I need." ACT
We bring a little good to
everyone, every day.
For
per
sona
l use
onl
y
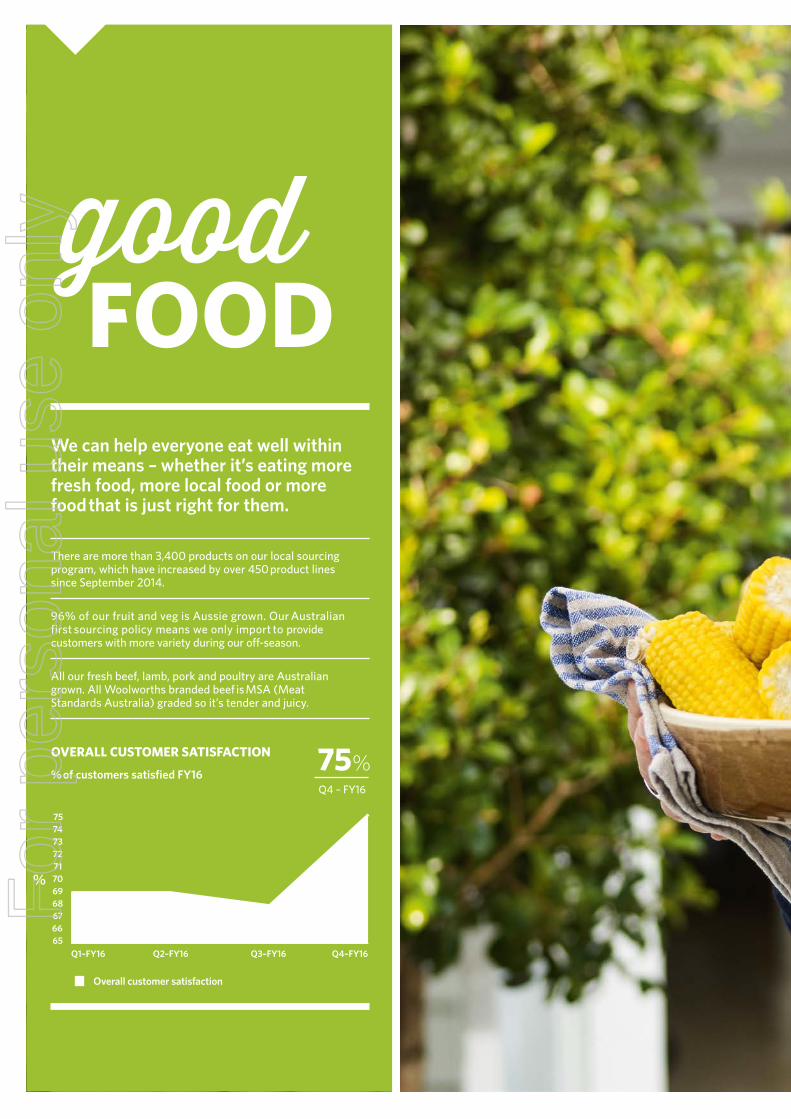
We can help everyone eat well within their means – whether it’s eating more fresh food, more local food or more food that is just right for them.
There are more than 3,400 products on our local sourcing program, which have increased by over 450 product lines since September 2014.
All our fresh beef, lamb, pork and poultry are Australian grown. All Woolworths branded beef is MSA (Meat Standards Australia) graded so it’s tender and juicy.
Overall customer satisfaction
96% of our fruit and veg is Aussie grown. Our Australian first sourcing policy means we only import to provide customers with more variety during our off-season.
OVERALL CUSTOMER SATISFACTION
% of customers satisfied FY1675%Q4 – FY16
good FOOD
Q1–FY16
75
%
65666768697071727374
Q4–FY16Q3–FY16Q2–FY16
For
per
sona
l use
onl
y

For
per
sona
l use
onl
y

For
per
sona
l use
onl
y

good PRICES
t 2.7%Q4 – FY16
Price reduction (Australian Food and Liquor)
Q1–FY16
0
%
-3
-2
-1
Q4–FY16Q3–FY16Q2–FY16
We are always competitive on price because we believe that good prices help ensure everyone can eat and live well.
Our Low Price Always promise means that customers can always get low prices on hundreds of products they always buy. Between April and June 2016, Woolworths has added an additional 183 products to the Price Dropped and Low Price Always programs, contributing to our overall price investment of over $500 million in FY16.
We’ve been dropping shelf prices across the store so customers' regular shopping costs less. This year we invested approximately $45 million into the meat category so that we could provide family favourite items, such as our Australian Lamb Leg Roast, at an affordable price.
PRICE REDUCTION
Change in average prices % FY16
For
per
sona
l use
onl
y
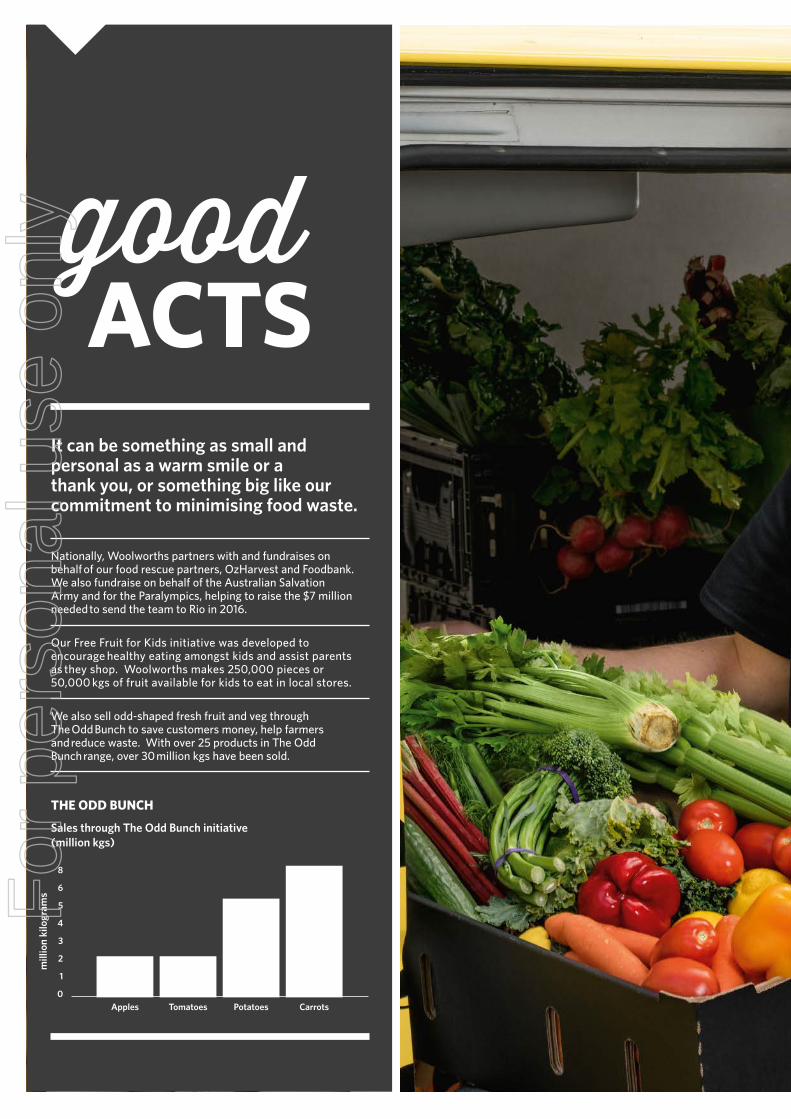
It can be something as small and personal as a warm smile or a thank you, or something big like our commitment to minimising food waste.
Nationally, Woolworths partners with and fundraises on behalf of our food rescue partners, OzHarvest and Foodbank. We also fundraise on behalf of the Australian Salvation Army and for the Paralympics, helping to raise the $7 million needed to send the team to Rio in 2016.
We also sell odd-shaped fresh fruit and veg through The Odd Bunch to save customers money, help farmers and reduce waste. With over 25 products in The Odd Bunch range, over 30 million kgs have been sold.
Our Free Fruit for Kids initiative was developed to encourage healthy eating amongst kids and assist parents as they shop. Woolworths makes 250,000 pieces or 50,000 kgs of fruit available for kids to eat in local stores.
THE ODD BUNCH
Sales through The Odd Bunch initiative (million kgs)
mill
ion
kilo
gram
s
8
0
1
2
3
4
5
6
Tomatoes
2.5million kgs
Carrots
8million kgs
Potatoes
6million kgs
Apples
2.5million kgs
good ACTS
For
per
sona
l use
onl
y

For
per
sona
l use
onl
y
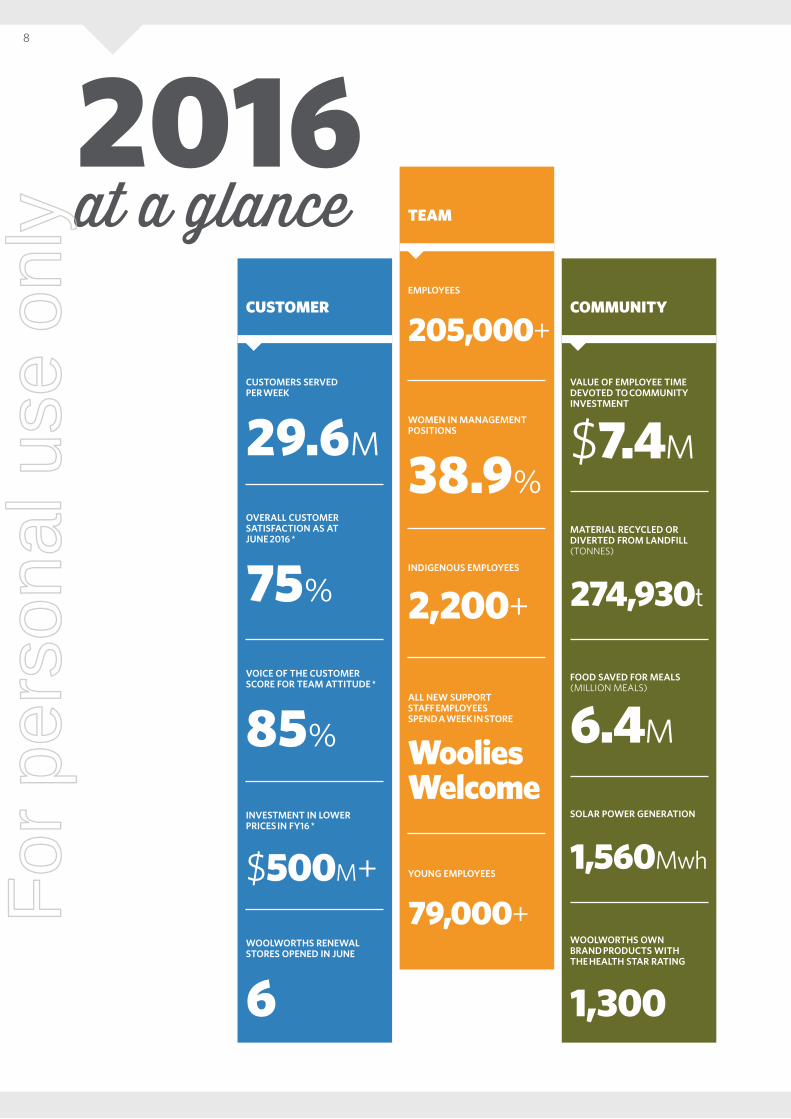
2016at a glance
CUSTOMERS SERVED PER WEEK
29.6M
EMPLOYEES
205,000+VALUE OF EMPLOYEE TIME DEVOTED TO COMMUNITY INVESTMENT
$7.4M
OVERALL CUSTOMER SATISFACTION AS AT JUNE 2016 *
75%
WOMEN IN MANAGEMENT POSITIONS
38.9%
FOOD SAVED FOR MEALS (MILLION MEALS)
6.4M
SOLAR POWER GENERATION
1,560Mwh
WOOLWORTHS OWN BRAND PRODUCTS WITH THE HEALTH STAR RATING
1,300
VOICE OF THE CUSTOMER SCORE FOR TEAM ATTITUDE *
85%
INDIGENOUS EMPLOYEES
2,200+
MATERIAL RECYCLED OR DIVERTED FROM LANDFILL (TONNES)
274,930t
WOOLWORTHS RENEWAL STORES OPENED IN JUNE
6
YOUNG EMPLOYEES
79,000+
INVESTMENT IN LOWER PRICES IN FY16 *
$500M+
ALL NEW SUPPORT STAFF EMPLOYEES SPEND A WEEK IN STORE
Woolies Welcome
CUSTOMER
TEAM
COMMUNITY
8F
or p
erso
nal u
se o
nly
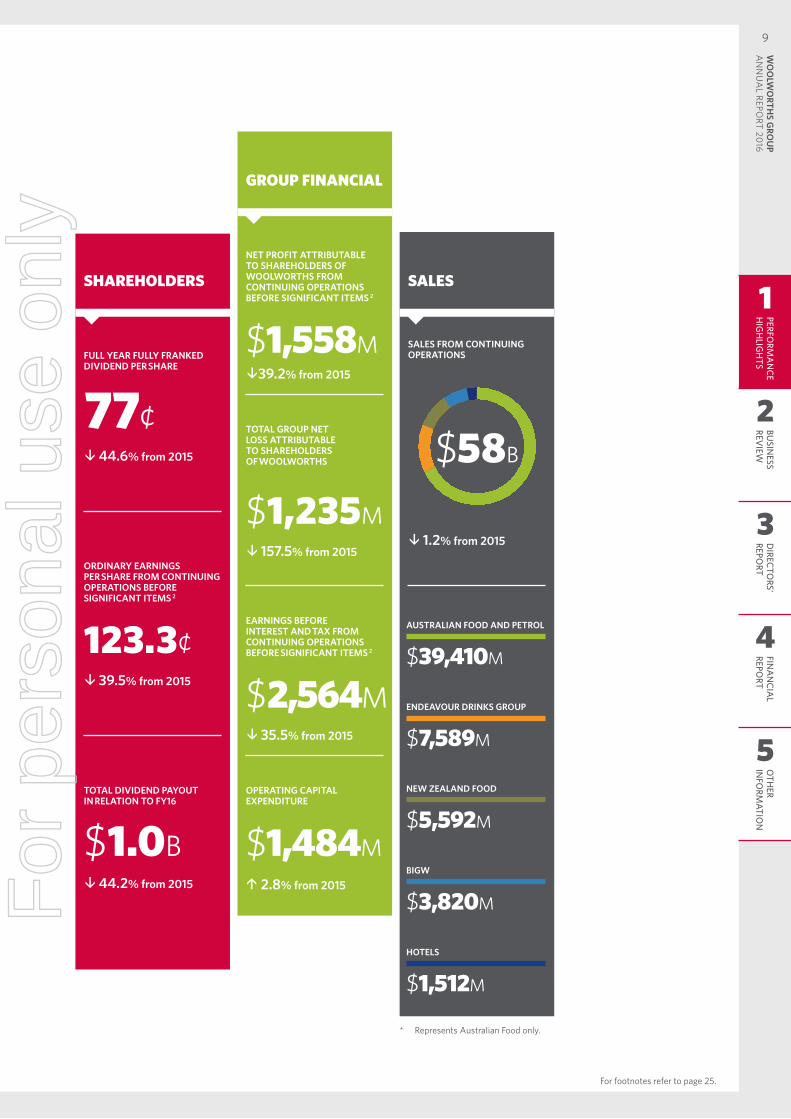
NET PROFIT ATTRIBUTABLE TO SHAREHOLDERS OF WOOLWORTHS FROM CONTINUING OPERATIONS BEFORE SIGNIFICANT ITEMS 2
$1,558Mt39.2% from 2015
SALES FROM CONTINUING OPERATIONS
t 1.2% from 2015
AUSTRALIAN FOOD AND PETROL
$39,410M
ENDEAVOUR DRINKS GROUP
$7,589M
NEW ZEALAND FOOD
$5,592M
BIGW
$3,820M
TOTAL GROUP NET LOSS ATTRIBUTABLE TO SHAREHOLDERS OF WOOLWORTHS
$1,235Mt 157.5% from 2015
EARNINGS BEFORE INTEREST AND TAX FROM CONTINUING OPERATIONS BEFORE SIGNIFICANT ITEMS 2
$2,564Mt 35.5% from 2015
OPERATING CAPITAL EXPENDITURE
$1,484Mu 2.8% from 2015
GROUP FINANCIAL
SALES
FULL YEAR FULLY FRANKED DIVIDEND PER SHARE
77¢t 44.6% from 2015
ORDINARY EARNINGS PER SHARE FROM CONTINUING OPERATIONS BEFORE SIGNIFICANT ITEMS 2
123.3¢t 39.5% from 2015
SHAREHOLDERS
TOTAL DIVIDEND PAYOUT IN RELATION TO FY16
$1.0Bt 44.2% from 2015
HOTELS
$1,512M
* Represents Australian Food only.
$58B
For footnotes refer to page 25.
1
2
3
4
5
PERFORM
AN
CEH
IGH
LIGH
TSBU
SINESS
REVIEW
DIRECTO
RS' REPO
RTFIN
AN
CIAL
REPORT
OTH
ER IN
FORM
ATION
9W
OO
LWO
RTHS G
ROU
P A
NN
UA
L REPORT 20
16
For
per
sona
l use
onl
y
Chairman's Report
We are building a strong management team, led by Brad, with some key hires across the business. This has been complemented by a renewal of the Board with 50% gender diversity, and key skills added in retailing, international and private equity. Together we will help shape an achievement culture.
We have introduced a new operating model with greater focus on our core businesses of supermarkets and liquor retailing, and an improved governance structure for our portfolio businesses. We announced the closure of Masters and separated EziBuy from BIGW and are exploring sale options for EziBuy.
We have optimised our store network with the planned closure of 30* stores, and a further 34* stores impaired due to the uncertainty surrounding lease renewals. As a result of the above restructuring, we booked significant items from continuing operations before interest and tax of $958.6 million. We have also pivoted our capex spending on stores towards refurbishing our existing network, with over 80 Australian Supermarkets planned for the upcoming year.
To complement the above, a revitalised incentive structure was introduced for our core businesses which focuses on the key drivers of the business, both short and long term, and rewards management for transformation. These incentive schemes apply uniformly down to store management.
The financial results for the year were disappointing, with sales from continuing operations down marginally to $58.1 billion and net profit after tax from continuing operations attributable to shareholders of Woolworths before significant items down 39.2% to $1.6 billion. As a result, the Board have announced a reduced final dividend of 33 cents per share, down 54.2% on prior year.
Whilst this has been a year of significant progress, there is much to do, and we appreciate your understanding. We are determined to truly transform our business into one that puts the customer at the centre of everything we do.
Gordon CairnsCHAIRMAN
The past year has been very important in the transformation of Woolworths, by laying down a sound foundation.
* Excludes BIGW.
10F
or p
erso
nal u
se o
nly
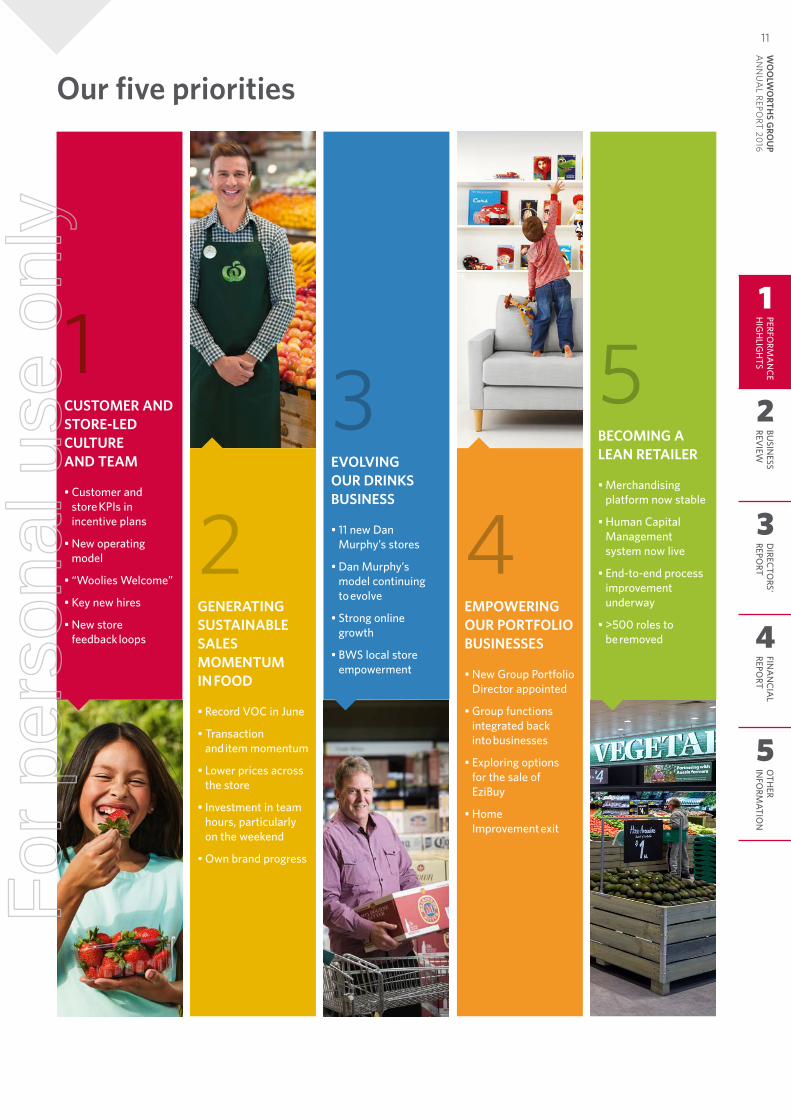
1CUSTOMER AND STORE-LED CULTURE AND TEAM
• Customer and store KPIs in incentive plans
• New operating model
• “Woolies Welcome”
• Key new hires
• New store feedback loops
2GENERATING SUSTAINABLE SALES MOMENTUM IN FOOD
• Record VOC in June
• Transaction and item momentum
• Lower prices across the store
• Investment in team hours, particularly on the weekend
• Own brand progress
3EVOLVING OUR DRINKS BUSINESS
• 11 new Dan Murphy’s stores
• Dan Murphy’s model continuing to evolve
• Strong online growth
• BWS local store empowerment
4EMPOWERING OUR PORTFOLIO BUSINESSES
• New Group Portfolio Director appointed
• Group functions integrated back into businesses
• Exploring options for the sale of EziBuy
• Home Improvement exit
5BECOMING A LEAN RETAILER
• Merchandising platform now stable
• Human Capital Management system now live
• End-to-end process improvement underway
• >500 roles to be removed
Our five priorities
1
2
3
4
5
PERFORM
AN
CEH
IGH
LIGH
TSBU
SINESS
REVIEW
DIRECTO
RS' REPO
RTFIN
AN
CIAL
REPORT
OTH
ER IN
FORM
ATION
11W
OO
LWO
RTHS G
ROU
P A
NN
UA
L REPORT 20
16
For
per
sona
l use
onl
y
My first priority as Group CEO was to focus our team on our customers. It’s pleasing to see that across our brands our customers are beginning to notice improvements. Our team is focused on providing a great shopping experience for our customers, and this has been reinforced with customer metrics. Over the last six months, we have also faced up to exiting businesses that are underperforming or loss making, changing the operating model to drive more accountability and focus on our core Food and Drinks businesses.
During the year we announced:• A new operating model with 1,000 team members moved from the Group support functions into our businesses
where they are closer to our stores and customers• The separation of BIGW and EziBuy and exploring options for the sale of EziBuy• Our planned exit from Home Improvement
We have taken the hard decisions to address underperforming businesses this year. This has resulted in significant items which have contributed to a very disappointing financial result and reduced dividends. In order to restore shareholder value we are focussed on a three to five year transformation of our business.
Our transformation is being guided by five key priorities:1. Building a customer and store-led culture and team2. Generating sustainable sales momentum in Food3. Evolving our Drinks business to provide even more value and convenience to customers4. Empowering our portfolio businesses to pursue strategies to deliver shareholder value5. Becoming a lean retailer through end-to-end process and systems excellence
Managing Director's Report
Since taking on the role as Woolworths Group CEO at the end of February 2016, the Woolworths team and I have acted quickly to address the issues facing the Group so that we can once again generate strong returns for our shareholders.
12F
or p
erso
nal u
se o
nly
The decisions we have taken and investments we have made have had a material impact on our financial results and returns to shareholders but they have been necessary to begin the rebuilding of Woolworths. All of us are committed to restoring value for you, the owners of our business.
Our Food and Drinks businesses are the centre of the Woolworths Group. They are the primary drivers of our earnings.
We are seeing the early signs of progress as we improve our offer and culture in Australian Food. Our top priority is to get customers to put us 1st and making the right decisions to make this happen. Customer metrics are improving with transactions, and more recently, sales growth, demonstrating that our customers are recognising our lower prices, better service, higher quality fresh fruit and vegetables and the improved store experience in existing and newly refurbished stores. Our new Own Brand ranges, Essentials and Woolworths, are also resonating well.
Our improving team engagement scores show we are changing our culture for the better. Supporting our store teams is key to getting customers to put us 1st and delivering improved financial results. We have invested significantly to increase store team hours to enable them to serve our customers better.
We have had a very positive response to our new brand advertising, ‘That’s why I pick Woolies’, and our sponsorship of the Olympic and Paralympic Games. Retail is about detail and we are fixing the basic, from signage upgrades to new trolleys. Importantly, we made improvements to our Woolworths Rewards program in response to feedback from our customers.
As a team we are focused on driving long-term performance through improved sales productivity in our stores, which has been reflected as a key metric in our long-term incentive plan. To achieve this, we have slowed down the rollout of new stores, and are investing in a Store Renewal program. We recognise we are at the early stages of our transformation. We are confident that the first steps we have taken have been the right ones.
We have much more to do in Food, including improving our relationships with suppliers.
Our Drinks business grew strongly. We opened 43 net new stores, established Langton’s East Asia, and our Pinnacle Wines won international platinum, gold and silver awards.
Countdown New Zealand performed well. Better prices, new stores and improved customer service drove sales higher with store team engagement and net promoter scores up.
At BIGW new CEO, Sally Macdonald, and her team are turning around one of Australia’s heritage retailers. They are refreshing stores, focusing on design-led products and improving efficiency.
The joint venture in ALH is progressing well with a new Board, a stronger discipline around capital management and a clear strategy for growth.
BIGW, ALH and Quantium now all have separate governance and are overseen by their own boards. This structure will increase transparency and better enable them to pursue the strategies and organisation structures best suited for their businesses and for unlocking shareholder value.
We operate from over 3,800 locations in Australia and New Zealand. In every one of those operations we aim to be an integral part of the community, just as we aim to be an important part of the broader national communities.
Our purpose is to 'bring a little good to everyone, every day' and our team members really take this seriously. As a company we support OzHarvest, Foodbank, SecondBite, FareShare, Churchlands, House of Hope and The Salvation Army.
This year we donated more than 400,000 items of new school equipment to 13,148 schools and early learning centres across the country. In bushfires and floods, our stores mobilise in-kind support and resources for their communities. The Countdown team in New Zealand, with the help of customers and suppliers, raised $1.2 million (NZD) for children’s hospital wards around the country.
We continue to focus on making Woolworths a safe place to work and shop. Our workplace safety and health performance significantly improved with Total Recordable Injury Frequency Rate (TRIFR) down 23.54%.
We employ over 200,000 people who serve over 29 million customers a week. We have an extraordinary team who have worked hard for our customers in a difficult time for their company and we are very proud of our people.
We are building a culture where we are listening to our customers, our team members and our suppliers. Through our Voice of the Customer program, we are listening every month to 55,000 shoppers. We hope that you continue to experience improvements in your local store.
Thank you for picking Woolies.
Brad BanducciMANAGING DIRECTOR AND CHIEF EXECUTIVE OFFICER
1
2
3
4
5
PERFORM
AN
CEH
IGH
LIGH
TSBU
SINESS
REVIEW
DIRECTO
RS' REPO
RTFIN
AN
CIAL
REPORT
OTH
ER IN
FORM
ATION
13W
OO
LWO
RTHS G
ROU
P A
NN
UA
L REPORT 20
16
For
per
sona
l use
onl
y
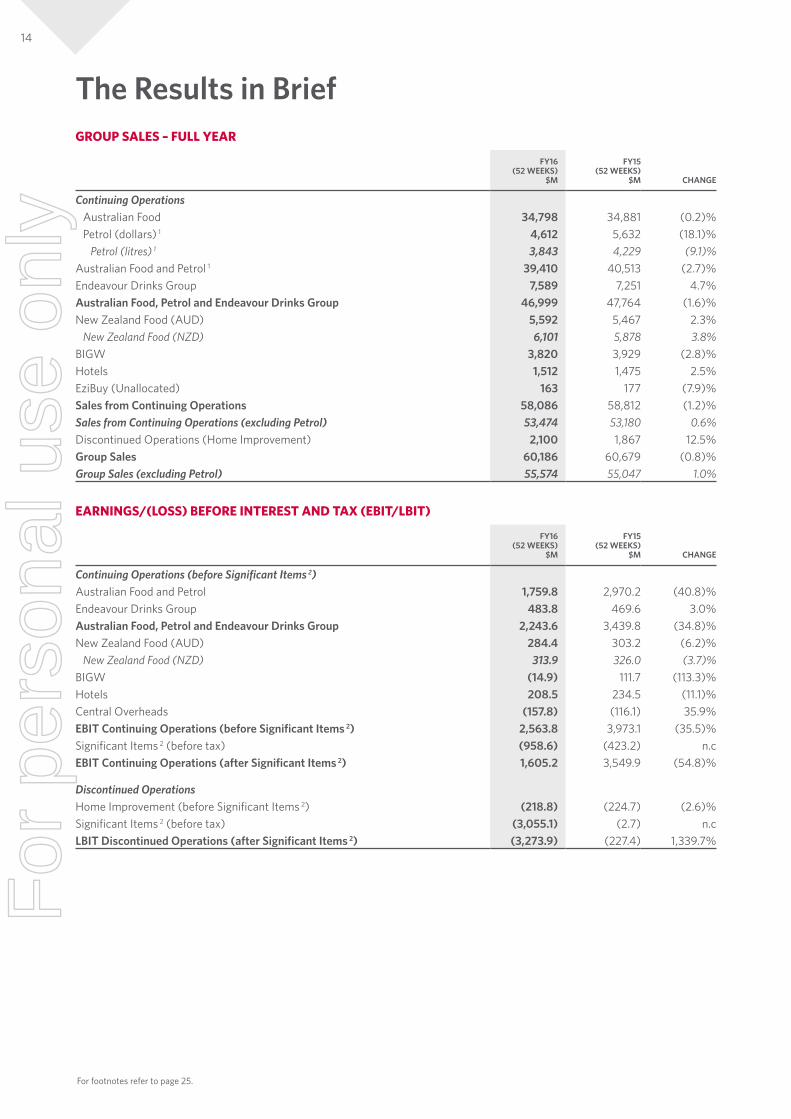
The Results in BriefGROUP SALES – FULL YEAR
FY16(52 WEEKS)
$M
FY15(52 WEEKS)
$M CHANGE
Continuing OperationsAustralian Food 34,798 34,881 (0.2)%Petrol (dollars) 1 4,612 5,632 (18.1)%
Petrol (litres) 1 3,843 4,229 (9.1)%Australian Food and Petrol 1 39,410 40,513 (2.7)%Endeavour Drinks Group 7,589 7,251 4.7%Australian Food, Petrol and Endeavour Drinks Group 46,999 47,764 (1.6)%New Zealand Food (AUD) 5,592 5,467 2.3%
New Zealand Food (NZD) 6,101 5,878 3.8%BIGW 3,820 3,929 (2.8)%Hotels 1,512 1,475 2.5%EziBuy (Unallocated) 163 177 (7.9)%Sales from Continuing Operations 58,086 58,812 (1.2)%Sales from Continuing Operations (excluding Petrol) 53,474 53,180 0.6%Discontinued Operations (Home Improvement) 2,100 1,867 12.5%Group Sales 60,186 60,679 (0.8)%Group Sales (excluding Petrol) 55,574 55,047 1.0%
EARNINGS/(LOSS) BEFORE INTEREST AND TAX (EBIT/LBIT)
FY16(52 WEEKS)
$M
FY15(52 WEEKS)
$M CHANGE
Continuing Operations (before Significant Items 2) Australian Food and Petrol 1,759.8 2,970.2 (40.8)%Endeavour Drinks Group 483.8 469.6 3.0%Australian Food, Petrol and Endeavour Drinks Group 2,243.6 3,439.8 (34.8)%New Zealand Food (AUD) 284.4 303.2 (6.2)%
New Zealand Food (NZD) 313.9 326.0 (3.7)%BIGW (14.9) 111.7 (113.3)%Hotels 208.5 234.5 (11.1)%Central Overheads (157.8) (116.1) 35.9%EBIT Continuing Operations (before Significant Items 2) 2,563.8 3,973.1 (35.5)%Significant Items 2 (before tax) (958.6) (423.2) n.cEBIT Continuing Operations (after Significant Items 2) 1,605.2 3,549.9 (54.8)%
Discontinued Operations Home Improvement (before Significant Items 2) (218.8) (224.7) (2.6)%Significant Items 2 (before tax) (3,055.1) (2.7) n.cLBIT Discontinued Operations (after Significant Items 2) (3,273.9) (227.4) 1,339.7%
For footnotes refer to page 25.
14F
or p
erso
nal u
se o
nly
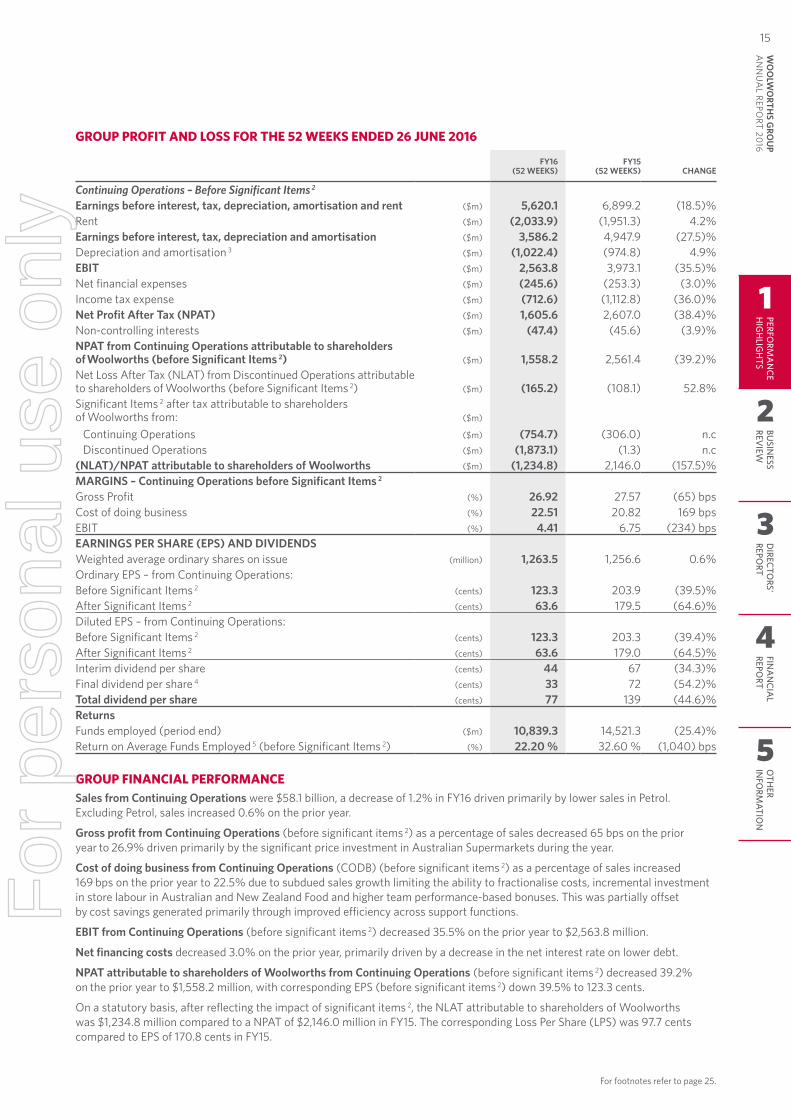
GROUP PROFIT AND LOSS FOR THE 52 WEEKS ENDED 26 JUNE 2016
FY16(52 WEEKS)
FY15(52 WEEKS) CHANGE
Continuing Operations – Before Significant Items 2
Earnings before interest, tax, depreciation, amortisation and rent ($m) 5,620.1 6,899.2 (18.5)%Rent ($m) (2,033.9) (1,951.3) 4.2%Earnings before interest, tax, depreciation and amortisation ($m) 3,586.2 4,947.9 (27.5)%Depreciation and amortisation 3 ($m) (1,022.4) (974.8) 4.9%EBIT ($m) 2,563.8 3,973.1 (35.5)%Net financial expenses ($m) (245.6) (253.3) (3.0)%Income tax expense ($m) (712.6) (1,112.8) (36.0)%Net Profit After Tax (NPAT) ($m) 1,605.6 2,607.0 (38.4)%Non-controlling interests ($m) (47.4) (45.6) (3.9)%NPAT from Continuing Operations attributable to shareholders of Woolworths (before Significant Items 2) ($m) 1,558.2 2,561.4 (39.2)%Net Loss After Tax (NLAT) from Discontinued Operations attributable to shareholders of Woolworths (before Significant Items 2) ($m) (165.2) (108.1) 52.8%Significant Items 2 after tax attributable to shareholders of Woolworths from: ($m)
Continuing Operations ($m) (754.7) (306.0) n.cDiscontinued Operations ($m) (1,873.1) (1.3) n.c
(NLAT)/NPAT attributable to shareholders of Woolworths ($m) (1,234.8) 2,146.0 (157.5)%MARGINS – Continuing Operations before Significant Items 2
Gross Profit (%) 26.92 27.57 (65) bpsCost of doing business (%) 22.51 20.82 169 bpsEBIT (%) 4.41 6.75 (234) bpsEARNINGS PER SHARE (EPS) AND DIVIDENDSWeighted average ordinary shares on issue (million) 1,263.5 1,256.6 0.6%Ordinary EPS – from Continuing Operations: Before Significant Items 2 (cents) 123.3 203.9 (39.5)%After Significant Items 2 (cents) 63.6 179.5 (64.6)%Diluted EPS – from Continuing Operations:Before Significant Items 2 (cents) 123.3 203.3 (39.4)%After Significant Items 2 (cents) 63.6 179.0 (64.5)%Interim dividend per share (cents) 44 67 (34.3)%Final dividend per share 4 (cents) 33 72 (54.2)%Total dividend per share (cents) 77 139 (44.6)%ReturnsFunds employed (period end) ($m) 10,839.3 14,521.3 (25.4)%Return on Average Funds Employed 5 (before Significant Items 2) (%) 22.20 % 32.60 % (1,040) bps
GROUP FINANCIAL PERFORMANCESales from Continuing Operations were $58.1 billion, a decrease of 1.2% in FY16 driven primarily by lower sales in Petrol. Excluding Petrol, sales increased 0.6% on the prior year.
Gross profit from Continuing Operations (before significant items 2) as a percentage of sales decreased 65 bps on the prior year to 26.9% driven primarily by the significant price investment in Australian Supermarkets during the year.
Cost of doing business from Continuing Operations (CODB) (before significant items 2) as a percentage of sales increased 169 bps on the prior year to 22.5% due to subdued sales growth limiting the ability to fractionalise costs, incremental investment in store labour in Australian and New Zealand Food and higher team performance-based bonuses. This was partially offset by cost savings generated primarily through improved efficiency across support functions.
EBIT from Continuing Operations (before significant items 2) decreased 35.5% on the prior year to $2,563.8 million.
Net financing costs decreased 3.0% on the prior year, primarily driven by a decrease in the net interest rate on lower debt.
NPAT attributable to shareholders of Woolworths from Continuing Operations (before significant items 2) decreased 39.2% on the prior year to $1,558.2 million, with corresponding EPS (before significant items 2) down 39.5% to 123.3 cents.
On a statutory basis, after reflecting the impact of significant items 2, the NLAT attributable to shareholders of Woolworths was $1,234.8 million compared to a NPAT of $2,146.0 million in FY15. The corresponding Loss Per Share (LPS) was 97.7 cents compared to EPS of 170.8 cents in FY15.
For footnotes refer to page 25.
1
2
3
4
5
PERFORM
AN
CEH
IGH
LIGH
TSBU
SINESS
REVIEW
DIRECTO
RS' REPO
RTFIN
AN
CIAL
REPORT
OTH
ER IN
FORM
ATION
15W
OO
LWO
RTHS G
ROU
P A
NN
UA
L REPORT 20
16
For
per
sona
l use
onl
y
Australian Food and Petrol
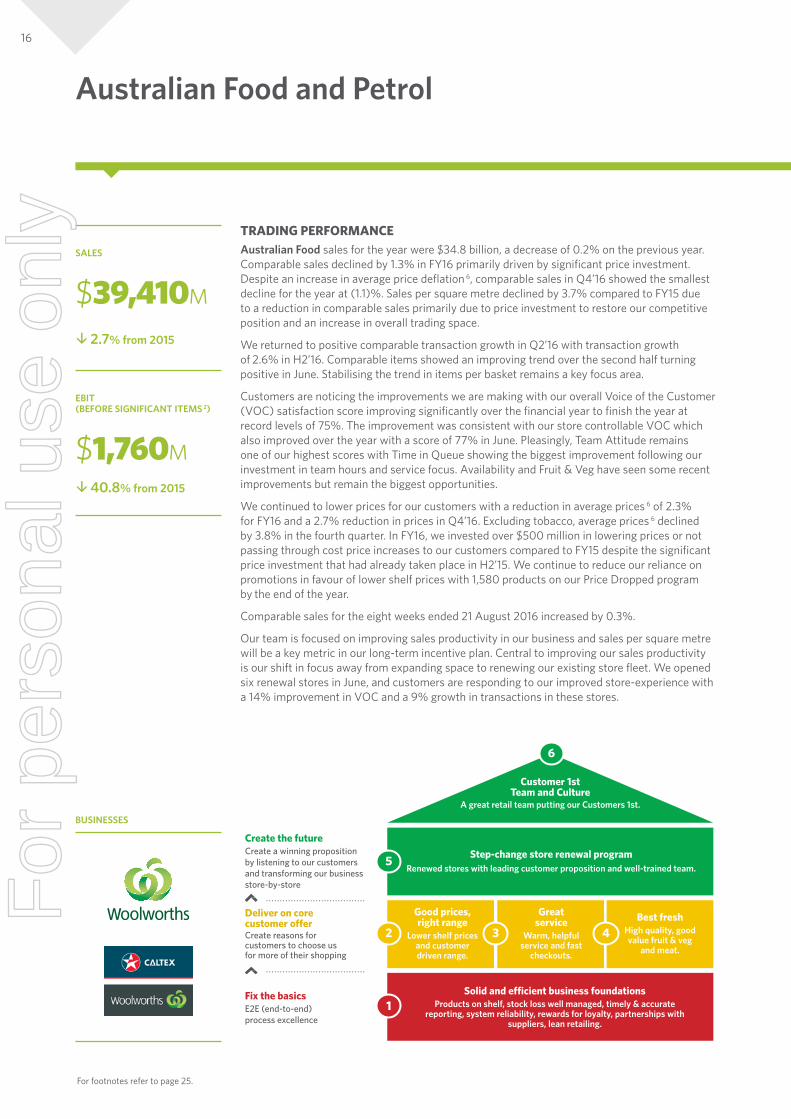
TRADING PERFORMANCEAustralian Food sales for the year were $34.8 billion, a decrease of 0.2% on the previous year. Comparable sales declined by 1.3% in FY16 primarily driven by significant price investment. Despite an increase in average price deflation 6, comparable sales in Q4’16 showed the smallest decline for the year at (1.1)%. Sales per square metre declined by 3.7% compared to FY15 due to a reduction in comparable sales primarily due to price investment to restore our competitive position and an increase in overall trading space.
We returned to positive comparable transaction growth in Q2’16 with transaction growth of 2.6% in H2’16. Comparable items showed an improving trend over the second half turning positive in June. Stabilising the trend in items per basket remains a key focus area.
Customers are noticing the improvements we are making with our overall Voice of the Customer (VOC) satisfaction score improving significantly over the financial year to finish the year at record levels of 75%. The improvement was consistent with our store controllable VOC which also improved over the year with a score of 77% in June. Pleasingly, Team Attitude remains one of our highest scores with Time in Queue showing the biggest improvement following our investment in team hours and service focus. Availability and Fruit & Veg have seen some recent improvements but remain the biggest opportunities.
We continued to lower prices for our customers with a reduction in average prices 6 of 2.3% for FY16 and a 2.7% reduction in prices in Q4’16. Excluding tobacco, average prices 6 declined by 3.8% in the fourth quarter. In FY16, we invested over $500 million in lowering prices or not passing through cost price increases to our customers compared to FY15 despite the significant price investment that had already taken place in H2’15. We continue to reduce our reliance on promotions in favour of lower shelf prices with 1,580 products on our Price Dropped program by the end of the year.
Comparable sales for the eight weeks ended 21 August 2016 increased by 0.3%.
Our team is focused on improving sales productivity in our business and sales per square metre will be a key metric in our long-term incentive plan. Central to improving our sales productivity is our shift in focus away from expanding space to renewing our existing store fleet. We opened six renewal stores in June, and customers are responding to our improved store-experience with a 14% improvement in VOC and a 9% growth in transactions in these stores.
SALES
$39,410M
t 2.7% from 2015
EBIT (BEFORE SIGNIFICANT ITEMS 2)
$1,760Mt 40.8% from 2015
5 Step-change store renewal program
Renewed stores with leading customer proposition and well-trained team.
Create the futureCreate a winning propositionby listening to our customersand transforming our businessstore-by-store
Deliver on corecustomer o�erCreate reasons forcustomers to choose usfor more of their shopping
Fix the basicsE2E (end-to-end) process excellence
2 3 4
Good prices,right range
Lower shelf pricesand customerdriven range.
Greatservice
Warm, helpfulservice and fast
checkouts.
Best freshHigh quality, goodvalue fruit & veg
and meat.
Customer 1stTeam and Culture
A great retail team putting our Customers 1st.
6
Solid and ecient business foundationsProducts on shelf, stock loss well managed, timely & accurate
reporting, system reliability, rewards for loyalty, partnerships withsuppliers, lean retailing.
1
For footnotes refer to page 25.
BUSINESSES
16F
or p
erso
nal u
se o
nly
Petrol sales were $4.6 billion, a decrease of 18.1% on the previous year (volumes decreased by 9.1%). Sales were impacted by changes to the Woolworths – Caltex alliance 1 in FY15 where sales from 131 Caltex operated sites were no longer recognised by Woolworths, and declining average fuel sell prices (unleaded FY16: 120.5 cpl; FY15: 134.4 cpl). We cycled the changes to the Woolworths – Caltex alliance 1 in December.
Comparable petrol sales (dollars) decreased 11.8% for the year due to the impacts of declining global oil prices and a decline in comparable volumes of 2.4%.
Merchandise sales for the year increased 6.4% and comparable merchandise sales increased 3.7%.
Australian Food and Petrol (AUFP) gross margin decreased 82 bps due to price investment offset somewhat by lower Petrol sales which drove a change in sales mix to the higher margin in the Food business. The impact of price investment was even more pronounced in our Australian Food business where gross margin declined by 178 bps.
AUFP CODB as a percentage of sales increased 204 bps on the prior year driven by lower sales (including the impact of the changes to the Woolworths – Caltex alliance 1), investment in team hours and higher team performance-based bonuses compared to the prior year where no bonuses were paid. This was partly offset by cost savings generated through improved efficiency across store operations and support functions.
AUFP EBIT of $1,759.8 million decreased 40.8% on the previous year, with the EBIT margin decreasing 286 bps.
BEFORE SIGNIFICANT ITEMS2FY16
52 WEEKSFY15
52 WEEKS CHANGE
SalesFood ($m) 34,798 34,881 (0.2)%Petrol 1 ($m) 4,612 5,632 (18.1)%Food and Petrol 1 ($m) 39,410 40,513 (2.7)%EBIT ($m) 1,759.8 2,970.2 (40.8)%Gross Margin (%) 25.37 26.19 (82) bpsCODB (%) 20.90 18.86 204 bpsEBIT to Sales (%) 4.47 7.33 (286) bpsSales Per Square Metre – Food ($) 16,000 16,615 (3.7)%Australian Food, Petrol and Endeavour Drinks GroupFunds Employed ($m) 3,575.2 3,662.5 (2.4)%Return on Average Funds Employed (ROFE) 7 (%) 62.00 94.93 (3,293) bps
For footnotes refer to page 25.
3
4
5
DIRECTO
RS' REPO
RTFIN
AN
CIAL
REPORT
OTH
ER IN
FORM
ATION
17W
OO
LWO
RTHS G
ROU
P A
NN
UA
L REPORT 20
16BU
SINESS
REVIEW
2
PERFORM
AN
CEH
IGH
LIGH
TS
1
For
per
sona
l use
onl
y
Endeavour Drinks Group
BUSINESSES
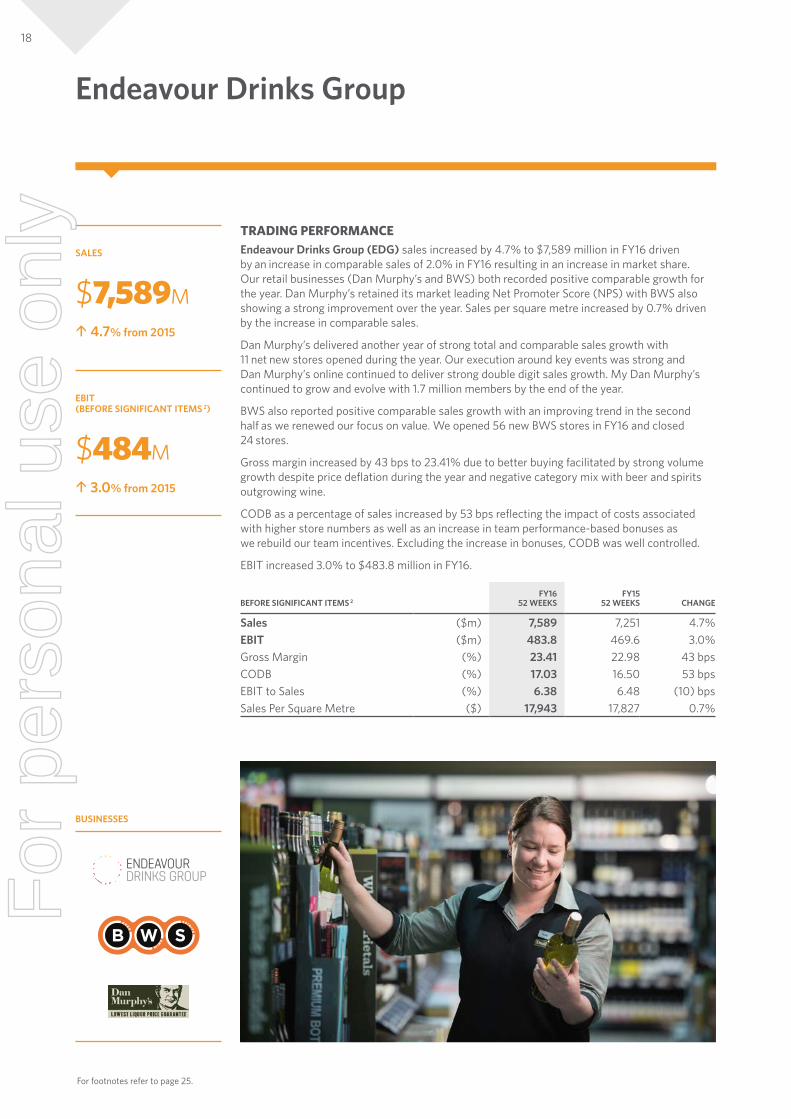
TRADING PERFORMANCEEndeavour Drinks Group (EDG) sales increased by 4.7% to $7,589 million in FY16 driven by an increase in comparable sales of 2.0% in FY16 resulting in an increase in market share. Our retail businesses (Dan Murphy’s and BWS) both recorded positive comparable growth for the year. Dan Murphy’s retained its market leading Net Promoter Score (NPS) with BWS also showing a strong improvement over the year. Sales per square metre increased by 0.7% driven by the increase in comparable sales.
Dan Murphy’s delivered another year of strong total and comparable sales growth with 11 net new stores opened during the year. Our execution around key events was strong and Dan Murphy’s online continued to deliver strong double digit sales growth. My Dan Murphy’s continued to grow and evolve with 1.7 million members by the end of the year.
BWS also reported positive comparable sales growth with an improving trend in the second half as we renewed our focus on value. We opened 56 new BWS stores in FY16 and closed 24 stores.
Gross margin increased by 43 bps to 23.41% due to better buying facilitated by strong volume growth despite price deflation during the year and negative category mix with beer and spirits outgrowing wine.
CODB as a percentage of sales increased by 53 bps reflecting the impact of costs associated with higher store numbers as well as an increase in team performance-based bonuses as we rebuild our team incentives. Excluding the increase in bonuses, CODB was well controlled.
EBIT increased 3.0% to $483.8 million in FY16.
BEFORE SIGNIFICANT ITEMS 2FY16
52 WEEKSFY15
52 WEEKS CHANGE
Sales ($m) 7,589 7,251 4.7%EBIT ($m) 483.8 469.6 3.0%Gross Margin (%) 23.41 22.98 43 bpsCODB (%) 17.03 16.50 53 bpsEBIT to Sales (%) 6.38 6.48 (10) bpsSales Per Square Metre ($) 17,943 17,827 0.7%
SALES
$7,589Mu 4.7% from 2015
EBIT (BEFORE SIGNIFICANT ITEMS 2)
$484Mu 3.0% from 2015
For footnotes refer to page 25.
18F
or p
erso
nal u
se o
nly
New Zealand Food
BUSINESSES
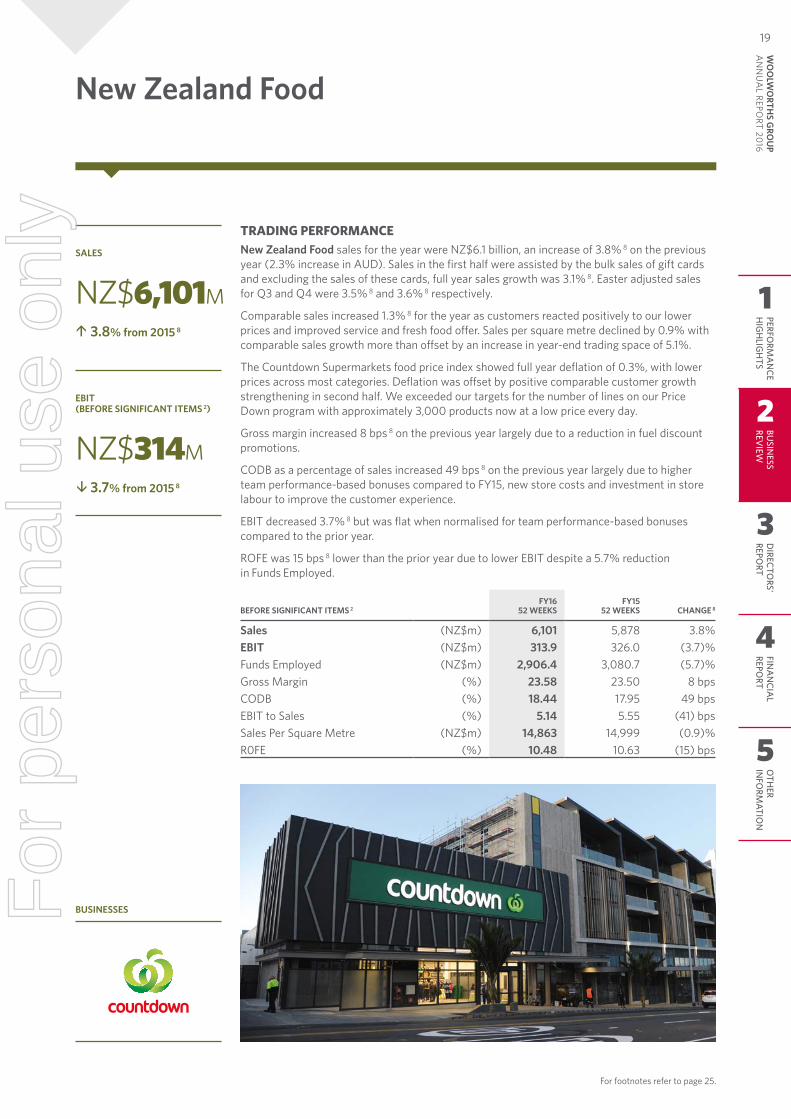
TRADING PERFORMANCENew Zealand Food sales for the year were NZ$6.1 billion, an increase of 3.8% 8 on the previous year (2.3% increase in AUD). Sales in the first half were assisted by the bulk sales of gift cards and excluding the sales of these cards, full year sales growth was 3.1% 8. Easter adjusted sales for Q3 and Q4 were 3.5% 8 and 3.6% 8 respectively.
Comparable sales increased 1.3% 8 for the year as customers reacted positively to our lower prices and improved service and fresh food offer. Sales per square metre declined by 0.9% with comparable sales growth more than offset by an increase in year-end trading space of 5.1%.
The Countdown Supermarkets food price index showed full year deflation of 0.3%, with lower prices across most categories. Deflation was offset by positive comparable customer growth strengthening in second half. We exceeded our targets for the number of lines on our Price Down program with approximately 3,000 products now at a low price every day.
Gross margin increased 8 bps 8 on the previous year largely due to a reduction in fuel discount promotions.
CODB as a percentage of sales increased 49 bps 8 on the previous year largely due to higher team performance-based bonuses compared to FY15, new store costs and investment in store labour to improve the customer experience.
EBIT decreased 3.7% 8 but was flat when normalised for team performance-based bonuses compared to the prior year.
ROFE was 15 bps 8 lower than the prior year due to lower EBIT despite a 5.7% reduction in Funds Employed.
BEFORE SIGNIFICANT ITEMS 2FY16
52 WEEKSFY15
52 WEEKS CHANGE 8
Sales (NZ$m) 6,101 5,878 3.8%EBIT (NZ$m) 313.9 326.0 (3.7)%Funds Employed (NZ$m) 2,906.4 3,080.7 (5.7)%Gross Margin (%) 23.58 23.50 8 bpsCODB (%) 18.44 17.95 49 bpsEBIT to Sales (%) 5.14 5.55 (41) bpsSales Per Square Metre (NZ$m) 14,863 14,999 (0.9)%R0FE (%) 10.48 10.63 (15) bps
SALES
NZ$6,101Mu 3.8% from 2015 8
EBIT (BEFORE SIGNIFICANT ITEMS 2)
NZ$314Mt 3.7% from 2015 8
For footnotes refer to page 25.
3
4
5
DIRECTO
RS' REPO
RTFIN
AN
CIAL
REPORT
OTH
ER IN
FORM
ATION
19W
OO
LWO
RTHS G
ROU
P A
NN
UA
L REPORT 20
16BU
SINESS
REVIEW
2
PERFORM
AN
CEH
IGH
LIGH
TS
1
For
per
sona
l use
onl
y
Portfolio Business — BIGW
BUSINESSES
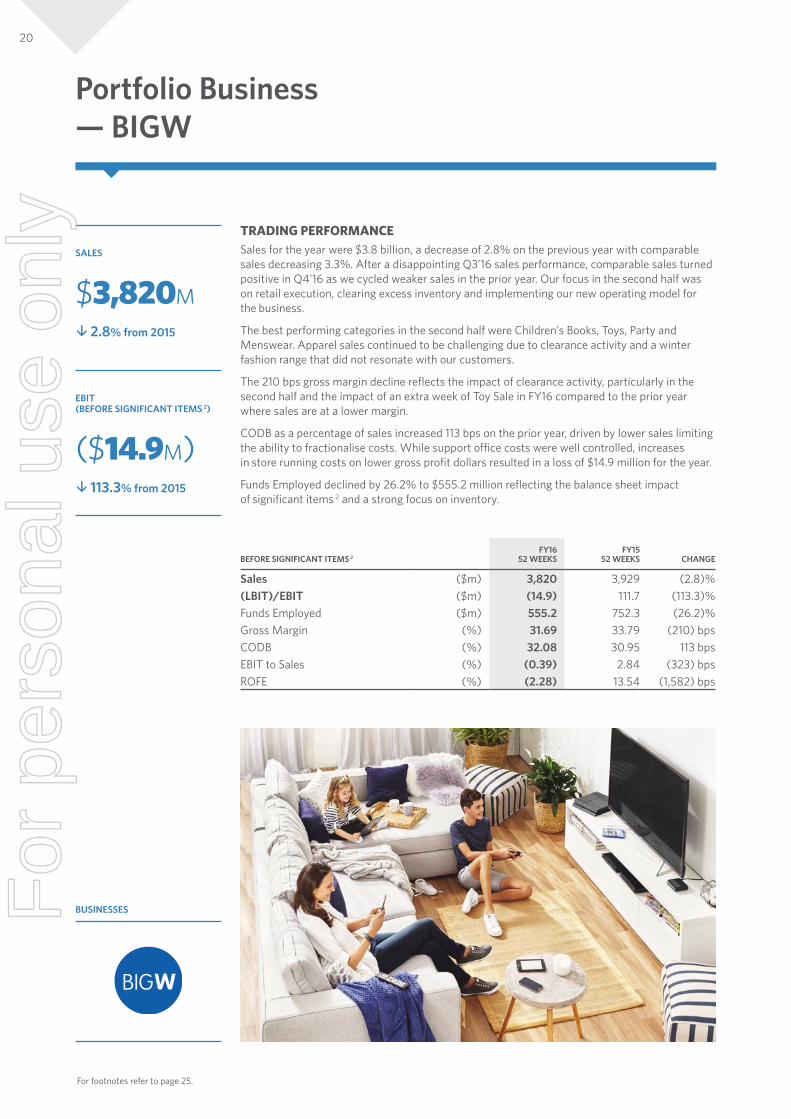
TRADING PERFORMANCESales for the year were $3.8 billion, a decrease of 2.8% on the previous year with comparable sales decreasing 3.3%. After a disappointing Q3’16 sales performance, comparable sales turned positive in Q4’16 as we cycled weaker sales in the prior year. Our focus in the second half was on retail execution, clearing excess inventory and implementing our new operating model for the business.
The best performing categories in the second half were Children’s Books, Toys, Party and Menswear. Apparel sales continued to be challenging due to clearance activity and a winter fashion range that did not resonate with our customers.
The 210 bps gross margin decline reflects the impact of clearance activity, particularly in the second half and the impact of an extra week of Toy Sale in FY16 compared to the prior year where sales are at a lower margin.
CODB as a percentage of sales increased 113 bps on the prior year, driven by lower sales limiting the ability to fractionalise costs. While support office costs were well controlled, increases in store running costs on lower gross profit dollars resulted in a loss of $14.9 million for the year.
Funds Employed declined by 26.2% to $555.2 million reflecting the balance sheet impact of significant items 2 and a strong focus on inventory.
BEFORE SIGNIFICANT ITEMS 2FY16
52 WEEKSFY15
52 WEEKS CHANGE
Sales ($m) 3,820 3,929 (2.8)%(LBIT)/EBIT ($m) (14.9) 111.7 (113.3)%Funds Employed ($m) 555.2 752.3 (26.2)%Gross Margin (%) 31.69 33.79 (210) bpsCODB (%) 32.08 30.95 113 bpsEBIT to Sales (%) (0.39) 2.84 (323) bpsROFE (%) (2.28) 13.54 (1,582) bps
SALES
$3,820Mt 2.8% from 2015
EBIT (BEFORE SIGNIFICANT ITEMS 2)
($14.9M)t 113.3% from 2015
For footnotes refer to page 25.
20F
or p
erso
nal u
se o
nly
Portfolio Business — Hotels
BUSINESSES
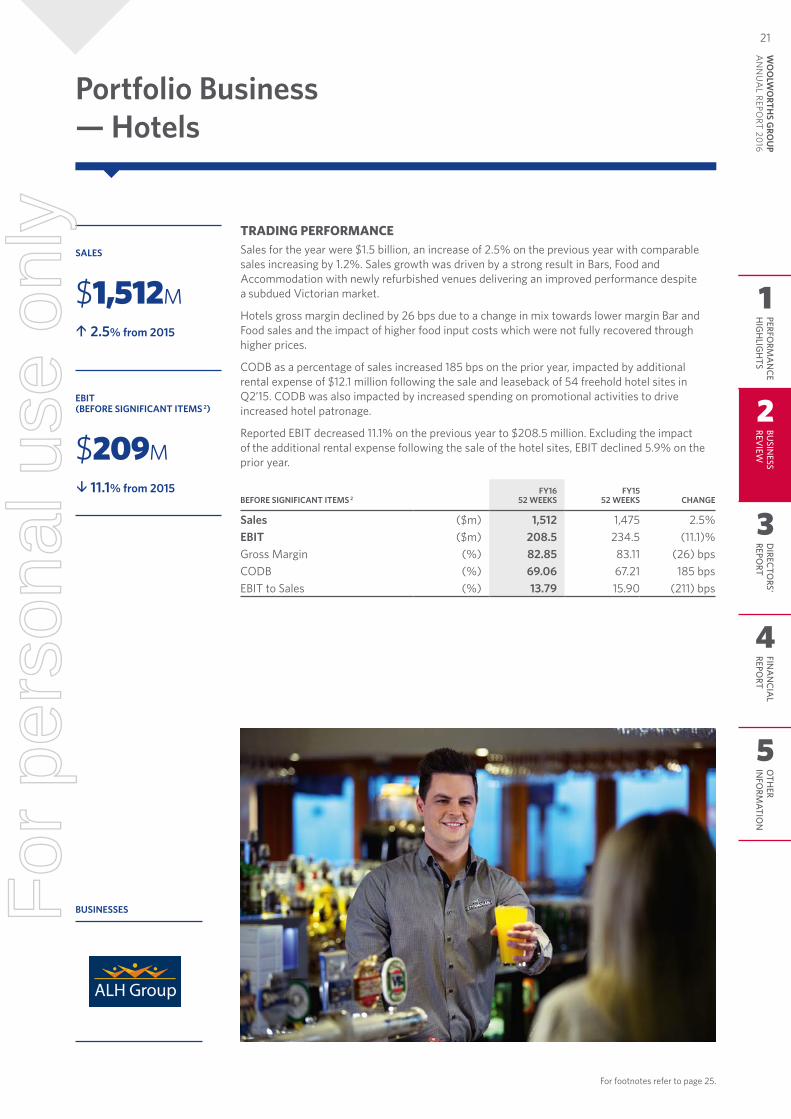
TRADING PERFORMANCESales for the year were $1.5 billion, an increase of 2.5% on the previous year with comparable sales increasing by 1.2%. Sales growth was driven by a strong result in Bars, Food and Accommodation with newly refurbished venues delivering an improved performance despite a subdued Victorian market.
Hotels gross margin declined by 26 bps due to a change in mix towards lower margin Bar and Food sales and the impact of higher food input costs which were not fully recovered through higher prices.
CODB as a percentage of sales increased 185 bps on the prior year, impacted by additional rental expense of $12.1 million following the sale and leaseback of 54 freehold hotel sites in Q2’15. CODB was also impacted by increased spending on promotional activities to drive increased hotel patronage.
Reported EBIT decreased 11.1% on the previous year to $208.5 million. Excluding the impact of the additional rental expense following the sale of the hotel sites, EBIT declined 5.9% on the prior year.
BEFORE SIGNIFICANT ITEMS 2FY16
52 WEEKSFY15
52 WEEKS CHANGE
Sales ($m) 1,512 1,475 2.5%EBIT ($m) 208.5 234.5 (11.1)%Gross Margin (%) 82.85 83.11 (26) bpsCODB (%) 69.06 67.21 185 bpsEBIT to Sales (%) 13.79 15.90 (211) bps
SALES
$1,512Mu 2.5% from 2015
EBIT (BEFORE SIGNIFICANT ITEMS 2)
$209Mt 11.1% from 2015
For footnotes refer to page 25.
3
4
5
DIRECTO
RS' REPO
RTFIN
AN
CIAL
REPORT
OTH
ER IN
FORM
ATION
21W
OO
LWO
RTHS G
ROU
P A
NN
UA
L REPORT 20
16BU
SINESS
REVIEW
2
PERFORM
AN
CEH
IGH
LIGH
TS
1
For
per
sona
l use
onl
y
TRADING PERFORMANCEMasters sales for the year were $1.1 billion, an increase of 21.8% on the prior year.
Masters loss before interest and tax (before significant items 2) decreased by 4.9% to $233.5 million driven by the strong sales performance in FY16 offset somewhat by the impact of clearance activity.
Home Timber and Hardware sales for the year were $967 million, an increase of 3.2% on the previous year driven by the sales benefit of recent acquisitions as well as comparable growth in our wholesale operations.
Home Timber and Hardware reported a 29.7% reduction in EBIT (before significant items 2) driven by price investment in a highly competitive market environment.
UPDATE ON PROCESS FOR EXIT OF HOME IMPROVEMENTAs announced on 24 August 2016, Woolworths has agreed three separate arrangements to facilitate its exit from the Home Improvement business for estimated gross proceeds of $1.5 billion to Hydrox Holdings Pty Ltd (Hydrox). Estimated net proceeds of approximately $500 million are expected after wind-down costs and prior to any shareholder payments.
Masters will cease trading at all stores on or before 11 December 2016 and Woolworths will work hard to find Masters employees jobs within the Group, or will pay redundancy where suitable roles are not available. Woolworths will honour all customer gift cards, product warranties, returns, lay-bys and contracted home improvement projects and will work constructively with all suppliers.
Metcash will acquire Home Timber and Hardware Group for a headline purchase price of $165 million. This transaction has been approved by both shareholders in Hydrox, the joint venture company owned by Woolworths and WDR Delaware Corporation (WDR), a subsidiary of Lowe’s Companies, Inc. (Lowe’s). Woolworths will also take assignment of three residual Home Timber and Hardware Group leases.
GA Australia has been appointed as exclusive agent to manage the sell-down of Masters inventory. It has provided a guarantee for the recovery of a guaranteed percentage of the cost value of Masters inventory subject to certain adjustments. This is estimated to deliver gross proceeds of approximately $500 million. The sell-down of the inventory will be conducted over the coming months, ahead of store closures by 11 December 2016.
Subject to Lowe’s consent, Home Consortium (Aurrum Group, Spotlight Group and Chemist Warehouse) has proposed to purchase the Masters properties through acquisition of 100% of the shares in Hydrox. Woolworths has granted an exclusive call option over its two-third share in Hydrox to Home Consortium on economic terms consistent with Home Consortium’s proposal to acquire 100% of the shares in Hydrox. The transaction will include 40 Masters freehold trading sites, 21 Masters freehold development sites and 21 Masters leasehold sites. Home Consortium plans to repurpose the former Masters sites into multi-tenant large format centres. Woolworths proposes to acquire three Masters freehold sites and take assignment of 12 leases to facilitate a complete exit of Hydrox. Please refer to the ‘Woolworths Update on Home Improvement Exit’ ASX release for further detail.
BEFORE SIGNIFICANT ITEMS 2FY16
52 WEEKSFY15
52 WEEKS CHANGE
SalesMasters ($m) 1,133 930 21.8%Home Timber and Hardware ($m) 967 937 3.2%Home Improvement ($m) 2,100 1,867 12.5%(LBIT)/EBITMasters ($m) (233.5) (245.6) (4.9)%Home Timber and Hardware ($m) 14.7 20.9 (29.7)%Home Improvement ($m) (218.8) (224.7) (2.6)%
Discontinued Operations — Home Improvement
For footnotes refer to page 25.
22F
or p
erso
nal u
se o
nly
OVERHEADS, CASH FLOW AND BALANCE SHEET
CENTRAL OVERHEADSCentral Overheads before significant items 2 including EziBuy were $157.8 million for the year. Excluding EziBuy, Central Overheads were $142.6 million and increased $24 million on the prior year partly driven by higher team performance-based bonuses. The loss before interest and tax for EziBuy before significant items 2 was $15.2 million compared to EBIT of $2.6 million in the prior year.
BALANCE SHEET Key balance sheet movements relative to the prior year were as follows:
• Closing inventory of $4,558.5 million decreased $314 million with $354 million of the decrease attributable to the impact of significant items 2 recognised in FY16 and the reclassification of Home Timber and Hardware (HTH) inventory within ‘net assets held for sale’. Excluding the impact of the above items, inventory increased $40 million driven by the investment in inventory in 98 net new stores partially offset by a number of initiatives aimed at reducing inventory holdings. Closing inventory days excluding Home Improvement increased 0.7 days to 35.6 days.
• Net investment in inventory was ($250.6) million or ($521) million excluding Home Improvement and significant items 2, remaining broadly flat year on year with no material differences in the timing of creditor payments (FY15: ($524) million excluding Home Improvement).
• Other creditors of $1,751.5 million increased $328 million driven by an increase in accruals for short-term team performance-based bonuses and other trading accruals.
• Provisions of $3,255.9 million increased $1,577 million driven by the recognition of onerous lease and other store exit cost provisions relating to significant items 2 recognised in FY16 of $1,494 million, of which $1,150 million relates to Home Improvement. Excluding significant items 2, provisions increased $83 million due to an increase in provisions for employee entitlements.
• Fixed assets and investments of $8,371.3 million decreased $1,793 million driven by significant item 2 impairment charges of $1,633 million relating to the impairment of Home Improvement assets of $1,432 million and impairments resulting from the FY16 Group wide review of $201 million, as well as the transfer of Home Improvement and other Group property assets to ‘net assets held for sale’ of $843 million. Excluding the impact of the above items, fixed assets and investments increased by $683 million driven by net capital expenditure of $1,713 million relating to new stores, store refurbishments and support assets offset by depreciation charges and asset disposals and retirements in the ordinary course of business.
• Net assets held for sale of $897.9 million represents assets and liabilities relating to HTH, property, plant and equipment relating to Masters and other Group properties held for sale.
• Intangible assets of $5,978.3 million decreased $266 million driven by impairment charges of $439 million primarily relating to the impairment of goodwill and other intangible assets in EziBuy and Home Improvement. Excluding these impairments, intangible assets increased $173 million primarily reflecting increased intangible assets in our New Zealand Food business attributable to the stronger New Zealand dollar.
• Total funds employed decreased $3,682 million, primarily impacted by the impairment charges and provisions recognised during the period for significant items 2.
• Net tax balances of $1,070.5 million increased $416 million primarily due to $260 million in net tax benefits associated with significant item 2 expenses and a decrease in current tax payable driven by a higher tax instalment rate applying to tax payment in the first half of FY16 on lower profits.
• Other financial assets and liabilities of $285.6 million changed by $938 million, primarily due to the $887 million movement in the valuation of Lowe’s put option in our Home Improvement business.
• Shareholders’ equity decreased $2,364 million to $8,470.6 million primarily reflecting losses from discontinued operations attributable to the shareholders of Woolworths of $2,038.3 million and dividend payments of $1,471.2 million, offset by the increase in issued share capital of $282.1 million reflecting shares issued under the dividend reinvestment plan and profits generated from continuing operations attributable to the shareholders of Woolworths of $803.5 million.
• ROFE before significant items 2 was 18.49%, a decrease of 724 bps or excluding Home Improvement was 22.2%, a decrease of 1,040 bps.
CASH FLOW Cash flow from operating activities before interest and tax decreased $1,215.8 million to $3,495.3 million and was primarily impacted by the lower trading performance and the impact of the timing of creditor payments relative to the reporting period date (approximately $155 million). Significant items 2 recognised during the year did not have a material impact on cash flows from operating activities before interest and tax. Excluding the impact of creditor timing and significant items 2, the decrease in cash flow from operating activities before interest and tax was broadly in line with the decrease in EBITDA before significant items 2 for the Group. Cash realisation ratio 9 before significant items 2 was 95.0%, impacted by the Home Improvement business. Excluding Home Improvement, our cash realisation ratio for continuing operations before significant items 2 was 103.6% (FY15: 102.7%). Net interest paid of $289.3 million decreased $21.0 million driven by lower average net debt funded by proceeds received from the sale of property assets. Tax payments decreased to $848.5 million for the year (FY15: $1,055.7 million) predominately due to the Woolworths Limited tax instalments being varied to nil from March 2016 in response to the lower FY16 trading result.
For footnotes refer to page 25.
3
4
5
DIRECTO
RS' REPO
RTFIN
AN
CIAL
REPORT
OTH
ER IN
FORM
ATION
23W
OO
LWO
RTHS G
ROU
P A
NN
UA
L REPORT 20
16BU
SINESS
REVIEW
2
PERFORM
AN
CEH
IGH
LIGH
TS
1
For
per
sona
l use
onl
y
Cash used in investing activities was $1,266.7 million, a decrease of $67.2 million on the prior year. During FY16, cash proceeds of $737.0 million were received from the sale of property, plant and equipment, a decrease of $188.4 million on the prior year which included proceeds from the sale of 54 Hotel property assets and proceeds from the sale of shares in The Warehouse Group. Payments for the purchase of businesses, primarily representing five Hotels in FY16, decreased by $66.0 million on the prior year.
Expenditure on property development of $473.3 million decreased $122.4 million (FY15: $595.7 million) driven by lower activity in the current period.
Investment in property, plant and equipment of $1,465.0 million included continued investment in new stores and store refurbishments and spend associated with supply chain and IT asset initiatives.
Cash contributions from Lowe’s in relation to our Home Improvement business were $120.0 million and relates to H1’16.
There were no proceeds from share issues during the year as the Group had fully transitioned to the use of performance rights, which do not have an exercise price, by the end of FY15.
Our fixed charges cover ratio 10 before significant items 2 is 2.3 times.
CAPITAL MANAGEMENT Woolworths introduced a 1.5% discount on the Dividend Reinvestment Plan (DRP) in April and removed the participation limit. This resulted in an increase in the participation rate to 31% for the interim dividend. Woolworths will retain a 1.5% discount on the final dividend with no participation limit. Woolworths also intends to partially underwrite the final dividend to 50% with the proceeds to be used predominantly to replace Woolworths Notes II and the balance to allow for accelerated investment in its store renewal program.
Woolworths is committed to a solid investment grade credit rating 11 and a number of actions can be undertaken to support the credit profile including the sale of non-core assets, accelerating working capital initiatives and adjusting its growth capital expenditure and property leasing profile. We are actively considering all options to enhance shareholder value in our portfolio businesses.
DividendsThe Board continues to target an after tax dividend payout ratio of 70%, subject to trading performance.
The Board has approved a final dividend per share of 33c, a decrease of 54.2% on the prior year.
The payment of the April 2016 and October 2016 dividends will return $1.0 billion and $0.4 billion in franking credits to shareholders. Woolworths expects that after these events, there will be approximately $2.3 billion of franking credits available for future distribution.
Upcoming refinancingWoolworths has approximately AUD 381 million equivalent of US144A debt maturing in the second half of FY17. This refinancing requirement has been pre-funded by additional bank facilities totalling $2.0 billion with tenors of three and five and a half years, established in April 2016. This was partially utilised to repay other debt which matured during FY16.
The five-year non-call period for the AUD 700 million Woolworths Notes II ends on 24 November 2016. Pursuant to a replacement capital covenant, the Notes may be refinanced by a hybrid containing similar characteristics (50% S&P equity credit) or a combination of debt and equity in equal proportions. As described above, the equity component of the Notes will be satisfied by the shares issued under the DRP.
NEW STORE ROLLOUT PLANS FROM CONTINUING OPERATIONSSpace rollout is supported by detailed plans for the next three to five years identifying specific sites.
FY16 NET STORE OPENINGS (INCL. ACQUISITIONS) MEDIUM TERM TARGET (NET)
Australian Supermarkets 31 • 10 – 20 new full range supermarkets per annum New Zealand FoodCountdown 7 • 3 – 4 new supermarkets per annumFranchise Stores 4Dan Murphy’s 11 • 8 – 10 new stores per annum BWS (including attached) 32 • 6 – 10 new stores per annum (standalone)Petrol 14 • Grow as appropriate to support the Supermarket new store strategy BIGW 2 • As appropriate opportunities ariseHotels (ALH Group) 1 • Acquire as appropriate opportunities arise
For footnotes refer to page 25.
CASH FLOW (CONTINUED)
24F
or p
erso
nal u
se o
nly
OUTLOOK
MATERIAL BUSINESS RISKSAs required by S.299A(1) of the Corporations Act 2001 (Cth), and in accordance with ASIC Regulatory Guide 247 Effective Disclosure in an Operating and Financial Review (RG 247) issued in March 2013, material business risks that could adversely affect financial performance include:
Market• Inability to defend against
increased competition from existing competitors and/or new entrants
• Weakening of general economic activity and the retail sector in Australia and New Zealand
• Failure to hedge appropriately or effectively against adverse fluctuations in interest rates and exchange rates or default by a hedge counterparty
• Damage or dilution to the Woolworths’ retail brands
Environmental• Woolworths’ operations, in
particular its petrol, meat processing plants and winemaking businesses, expose it to potential environmental liability for contamination, which could have an adverse effect on Woolworths’ results
• Woolworths is subject to risks from natural disasters and adverse weather conditions.
Strategic• Customer strategy
implementation fails to rebuild trust in Woolworths’ brands and loyalty, to deliver evolving customer needs for product range, value and services
• Divestment or acquisition activities result in unforeseen liabilities
• Unforeseen increase in cost structure
Regulatory• Failure to understand and
comply with existing and new legal and regulatory obligations set by the Australian Competition and Consumer Commission or other regulators
• Regulatory changes to Workplace health and safety regulations could result in significant costs
• Litigation or legal proceedings could expose Woolworths to significant liabilities
Operational• Business transformation and change programs fail
to deliver expected benefits with inability to fully deliver and absorb change
• Failure to deliver optimal store network, maintain and manage property portfolio
• Reliance on independent third party suppliers• Inability to effectively manage inventory in retail
businesses may impair competitive position• System availability and performance may be
adversely affected by ageing infrastructure and technology obsolescence
• Interruptions at Woolworths’ workplaces arising from industrial disputes, work stoppages and accidents
• Failure to meet food, liquor and general merchandise own and exclusive brands product safety and quality standards resulting in litigation and public liability claims
• Operation of certain Woolworths’ businesses through significant joint ventures and strategic alliances creates additional risks and uncertainties in its business
• Inability to attract or retain talent• Failure to establish effective security measures to
protect customer data from cyber attacks and leakages• Current and future leasing arrangement
constraining capital availability
FOOTNOTESn.c Not comparable 1 Petrol sales and volumes are not comparable with the prior period given changes to the Woolworths-Caltex alliance that became effective progressively during
Q2’15. Given operational changes under the new arrangements with Caltex, Woolworths no longer recognises sales from the Caltex-operated sites in its financial results. The new arrangements do not have a material profit impact on the Woolworths Group. Further details on the revised arrangements with Caltex are provided in our ASX announcement dated 20 November 2014.
2 In FY16, total significant items of $4,013.7 million before tax ($2,627.8 million after tax attributable to shareholders of Woolworths) were recognised. In FY15, total significant items of $425.9 million before tax ($307.3 million after tax attributable to shareholders of Woolworths) were recognised. Where noted, profit and loss items have been adjusted to reflect these significant items.
3 Excludes $88.7 million of accelerated depreciation relating to significant items recognised in FY15.4 Final 2016 dividend payable on 7 October 2016 will be fully franked.5 Excludes Home Improvement.6 We have adopted a revised method for calculating inflation for our Australian Food and Liquor business and will only disclose an average price inflation measure
going forward. In developing the revised measure we consulted with Deloitte Access Economics. The new measure uses the Fisher methodology to weight changes in average quarterly prices by the average of current quarter and preceding quarter volumes and reflects the effects of promotional activity and changes in volume. We believe this measure is the most appropriate representation of the average price changes of items that consumers have bought during the quarter. Note that due to the change in methodology, the data is not directly comparable to previously reported data. Below is restated data for FY15 using the new method.
Average price changes Q4’15 Q1’16 Q2’16 Q3’16 Q4’16Price change (% year on year) (1.2)% (1.8)% (2.5)% (2.4)% (2.7)%
7 FY15 Funds Employed for Australian Food, Petrol and Endeavour Drinks Group (FPE) has been restated to reflect a change in the classification of accounts payable balances between the FPE and Unallocated segments. Prior to the current period, FPE accounts payable balances were transferred to the Unallocated segment balance sheet when they were processed for payment, and would remain in the Unallocated segment balance sheet until they were paid. During FY16, there was a change in process which has resulted in accounts payable balances remaining in the FPE balance sheet until they are paid, no longer resulting in a transfer of accounts payable balances from FPE’s balance sheet to the Unallocated segment balance sheet. Previously reported FY15 FPE Funds Employed of $4,756.4 million and Return on Average Funds Employed of 73.71% have been restated to be consistent with FY16. This change does not impact Woolworths Group’s closing Funds Employed and Return on Average Funds Employed reported results.
8 Growth for New Zealand Food is quoted in New Zealand Dollars.9 Operating cash flow as a percentage of Group net profit after tax before depreciation and amortisation.10 Group earnings before interest, tax, depreciation, amortisation and rent (EBITDAR) divided by rent and interest costs. Rent and interest costs include capitalised
interest but exclude foreign exchange gains/losses and dividend income.11 The credit ratings referred to in this document have been issued by a credit rating agency which holds an Australian Financial Services Licence with an
authorisation to issue credit ratings to wholesale clients only. The credit ratings in this document are published for the benefit of Woolworths’ debt providers.
3
4
5
DIRECTO
RS' REPO
RTFIN
AN
CIAL
REPORT
OTH
ER IN
FORM
ATION
25W
OO
LWO
RTHS G
ROU
P A
NN
UA
L REPORT 20
16BU
SINESS
REVIEW
2
PERFORM
AN
CEH
IGH
LIGH
TS
1
For
per
sona
l use
onl
y
Board of Directors
GORDON CAIRNS MA (Hons)CHAIRMAN
Gordon Cairns is Chairman of Origin Energy Limited (Chairman since October 2013, Director since 2007), a Non-executive Director of Macquarie Group Limited (since November 2014), Macquarie Bank Limited (since November 2014), World Education Australia Limited and Quick Service Restaurant Group Pty Ltd. Mr Cairns was previously Chairman of David Jones Limited (March 2014 to August 2014) and Rebel Group Limited, and a Non-executive Director of Westpac Banking Corporation (July 2004 to December 2013). Mr Cairns has extensive Australian and international experience as a senior executive. He was previously Chief Executive Officer of Lion Nathan Limited, and held senior management positions in marketing, operations and finance with PepsiCo, Cadbury Limited and Nestle.
BRAD BANDUCCI MBA, LLB, BComm (Acc)MANAGING DIRECTOR AND CHIEF EXECUTIVE OFFICER
Brad Banducci has a Master of Business Administration from the Australian Graduate School of Management and received Bachelor of Laws and Bachelor of Commerce Degrees from the University of KwaZulu-Natal. Before his appointment as the Managing Director and Chief Executive Officer of the Group, he was Managing Director of Woolworths Food Group from March 2015 to February 2016 and he retains this responsibility pending a new appointment. He was formerly Director of Liquor from 2012 until March 2015. Brad joined the Group in 2011 after the acquisition of the Cellarmasters Group, a direct wine retail and production company. He was Chief Executive Officer of Cellarmasters from 2007 to 2011. Prior to this, he was the Chief Financial Officer and Director, and later a Non-Executive Director at Tyro Payments and a Vice President and Director with The Boston Consulting Group, where he was a core member of their retail practice for 15 years.
JILLIAN BROADBENT, AO BA (Maths & Economics)INDEPENDENT NON-EXECUTIVE DIRECTOR
Jillian Broadbent AO has a B.A. (Maths and Economics) from the University of Sydney. Ms Broadbent is currently Chair of the Board of Swiss Re Life & Health Australia Limited, Chair of the Clean Energy Finance Corporation and Chancellor of the University of Wollongong. Ms Broadbent was a Member of the Board of the Reserve Bank of Australia (1998 to 2013) and has served as a Director of ASX Limited, Coca-Cola Amatil Limited, Special Broadcasting Service Corporation (SBS), Qantas Airways Limited, Westfield Property Trusts and Woodside Petroleum Ltd. Ms Broadbent has extensive experience in corporate banking and finance in both Australia and internationally, primarily with Bankers Trust Australia.
HOLLY KRAMER BA (Hons), MBAINDEPENDENT NON-EXECUTIVE DIRECTOR
Holly Kramer has a BA with Honours in Economics and Political Science from Yale University and an MBA from Georgetown University. Ms Kramer is currently a Non-executive Director of Nine Entertainment Corporation (since May 2015), AMP Limited (since October 2015), Australia Post (since November 2015), as well as regional community-owned telco, Southern Phone Company Limited and the Alannah and Madeleine Foundation. She is also a member of Chief Executive Women. Ms Kramer has more than 20 years’ experience in general management, marketing and sales including roles at the Ford Motor Company (in the US and Australia), Pacific Brands and Telstra. Whilst at Telstra, her roles included Group Managing Director, Telstra Product Management and Chief of Marketing. Her most recent position was Chief Executive Officer of Best & Less, a subsidiary of South African retail group Pepkor.
SIOBHAN MCKENNA B.Ec (Hons), MPhilINDEPENDENT NON-EXECUTIVE DIRECTOR
Siobhan McKenna has a Bachelor of Economics (Honours) degree from the Australian National University as well as a Master of Philosophy (International Relations) from Cambridge University. Ms McKenna is currently a Director of Ten Network Holdings Limited (since 2012), Amcil Limited (since March 2016), Nova Entertainment, The Australian Ballet, and a Trustee of the MCG Trust. Ms McKenna is a former Commissioner of the Australian Productivity Commission, a former Chairman and Board Member of NBN Co Limited, and a former partner of McKinsey & Company.
SCOTT PERKINS BCom, LLB (Hons)INDEPENDENT NON-EXECUTIVE DIRECTOR
Scott Perkins has a Bachelor of Commerce and a Bachelor of Laws with Honours from Auckland University. Mr Perkins is a Non-executive Director of Brambles Limited (since 1 June 2015), Origin Energy Limited (since 1 September 2015), the Museum of Contemporary Art in Sydney (since 2011), the New Zealand Initiative (since 2012) and is Chairman of Sweet Louise (since 2005). In the past Mr Perkins was a Director of Meridian Energy (1999-2002). Mr Perkins has extensive Australian and international experience as a leading corporate adviser. He was formerly Head of Corporate Finance for Deutsche Bank Australia and New Zealand and a member of the Executive Committee with overall responsibility for the Bank’s activities in this region. He was also a member of the Asia Pacific Corporate and Investment Bank Management Committee. Prior to that he was Chief Executive Officer of Deutsche Bank New Zealand and Deputy CEO of Bankers Trust New Zealand. Mr Perkins’ experience encompasses advising leading local and international companies across a broad range of markets on strategy, mergers and acquisitions and capital markets matters. He is an active participant in not-for-profit communities in Australia and New Zealand. He has a long-standing commitment to breast cancer causes, the visual arts and public policy development.
KATHRYN (KATHEE) TESIJA BSRMMINDEPENDENT NON-EXECUTIVE DIRECTOR
Kathee Tesija has a Bachelor's Degree in Fashion Merchandising from the University of Wisconsin, USA. Ms Tesija has extensive retailing experience in the US market, particularly in merchandising and supply chain management. In her executive career, she led the merchandising and supply chain functions at Target Corporation in the US from 2008, and was the Chief Merchandising and Supply Chain Officer and Executive Vice President when she left the company in 2015. After leaving, Kathee became a Strategic Advisor to Target Corporation until 2016 and had held various senior leadership positions at Target Corporation within merchandising since joining the business in 1986. Ms Tesija, a US resident, is also an independent Director of the US telecommunications company, Verizon Communications, Inc., and is a senior advisor and consultant for Simpactful, a retail consulting agency in the US.
MICHAEL ULLMER BSc (Maths) (Hons), FCA, SF FinINDEPENDENT NON-EXECUTIVE DIRECTOR
Michael Ullmer has a degree in mathematics from the University of Sussex. Mr Ullmer is a Fellow of the Institute of Chartered Accountants and a Senior Fellow of the Financial Services Institute of Australasia. Mr Ullmer is a Director of Lend Lease (since December 2011), a Trustee of the National Gallery of Victoria and Chairman of the Melbourne Symphony Orchestra. Mr Ullmer has extensive experience in the accounting and banking sectors. He was the Deputy Group Chief
26F
or p
erso
nal u
se o
nly
Executive at National Australia Bank (NAB) from October 2007 until he stepped down from the Bank in August 2011. He joined NAB in 2004 as Finance Director and held a number of key positions including Chairman of the subsidiaries Great Western Bank (US) and JBWere. Prior to NAB, Mr Ullmer was at Commonwealth Bank of Australia initially as Chief Financial Officer and then Group Executive for Institutional and Business Banking. Before that he was a Partner at Accounting Firms KPMG (1982 to 1992) and Coopers & Lybrand (1992 to 1997). Mr Ullmer was previously a Director of National Australia Bank (2004 to 2011), Fosters Group Ltd (2008 to 2011), and Bank of New Zealand (2007 to 2011).
RALPH WATERS CPEng, HonFIEAust, M BusRETIRED 01/09/15
Ralph Waters was most recently a Director of Asciano Limited (2012 to August 2016). In the past, Mr Waters was a Director of Fletcher Building Limited (2001 to October 2014, Chairman from 2010) and Fisher and Paykel Appliances Holdings Limited (2001 to 2011, Chairman from 2009), a Director of Fonterra Co-operative Group Limited (2006 to 2013), Westpac New Zealand Limited (2006 to 2012) and a Director of Cricket World Cup 2015 Ltd (2011 to November 2015, Chairman from February 2013).
GRANT O’BRIEN Adv. Management Program HarvardRETIRED 26/02/16
Grant O’Brien’s career extended more than 25 years with Woolworths, starting as an accountant in Purity Supermarkets in Tasmania, a division of Woolworths Limited. He was appointed Managing Director and Chief Executive Officer in 2011. He has held the roles of Deputy Chief Executive Officer and CEO Designate, Chief Operating Officer Australian Food and Petrol, Director New Business Development, General Manager Woolworths Liquor, Senior Business Manager Marketing Supermarkets, and Marketing and Merchandise Manager for Purity. He completed the Advanced Management Program at Harvard in 2010.
CHRISTINE CROSS BEd, MScRETIRED 23/11/15
Christine Cross has a BEd and MSc in Food Science and a Diploma in Management. Ms Cross is a Director of Sonae SGPS SA (since 2009), Plantasgen (since 2009), Kathmandu Holdings Limited (since 2012) and Brambles Limited (since January 2014). She was formerly a Director of Next Group plc (formerly known as Next PLC) (2005–2014), of Fairmont Hotels & Resorts Inc, Empire Company Limited (2003 to 2011), Taylor Wimpey plc and Premier Foods plc (2008 to 2010). Ms Cross is a Retail Advisor to Apax Partners Venture Capital & Private Equity (since 2005).
CARLA (JAYNE) HRDLICKA BA, MBARETIRED 08/02/16
Jayne Hrdlicka is the CEO of Jetstar Group and prior to this was the Qantas Group Executive of Strategy, Technology and Transformation. Ms Hrdlicka is an experienced executive and advisor. Prior to her executive career, Jayne was a Senior Partner with management consulting firm Bain & Company.
ALLAN (DAVID) MACKAY BBARETIRED 23/10/15
David Mackay is a Director of Fortune Brands Home & Security Inc. (since 2011) and Keurig Green Mountain, Inc. (since 2012). Mr Mackay was an Independent Director and Non-executive Chairman of Beam, Inc (2011 to April 2014) and Managing Director of Sara Lee Bakery in Australia (1992 to 1998). Mr Mackay has extensive Australian and international retail and consumer goods experience. He had a long career with Kellogg Company in America and internationally, retiring as CEO and President of Kellogg Company in 2011 after holding a number of key positions within the company in the UK and the USA. Throughout his time at Kellogg, Mr Mackay was a member of Kellogg Company’s Board and the Company’s global leadership team.
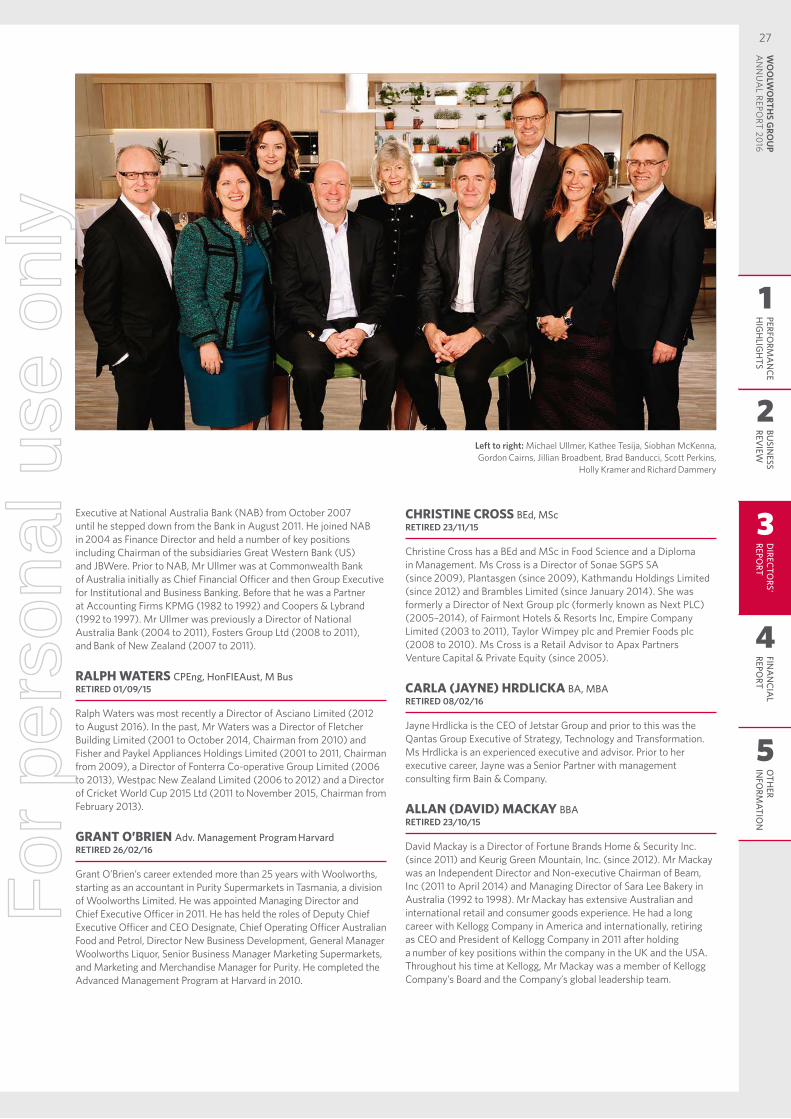
Left to right: Michael Ullmer, Kathee Tesija, Siobhan McKenna, Gordon Cairns, Jillian Broadbent, Brad Banducci, Scott Perkins,
Holly Kramer and Richard Dammery
4
5
FINA
NCIA
L REPO
RTO
THER
INFO
RMATIO
N27
WO
OLW
ORTH
S GRO
UP
AN
NU
AL REPO
RT 2016
BUSIN
ESS REV
IEW
2
PERFORM
AN
CEH
IGH
LIGH
TS
1
DIRECTO
RS' REPO
RT
3
For
per
sona
l use
onl
y
Group Executive Committee
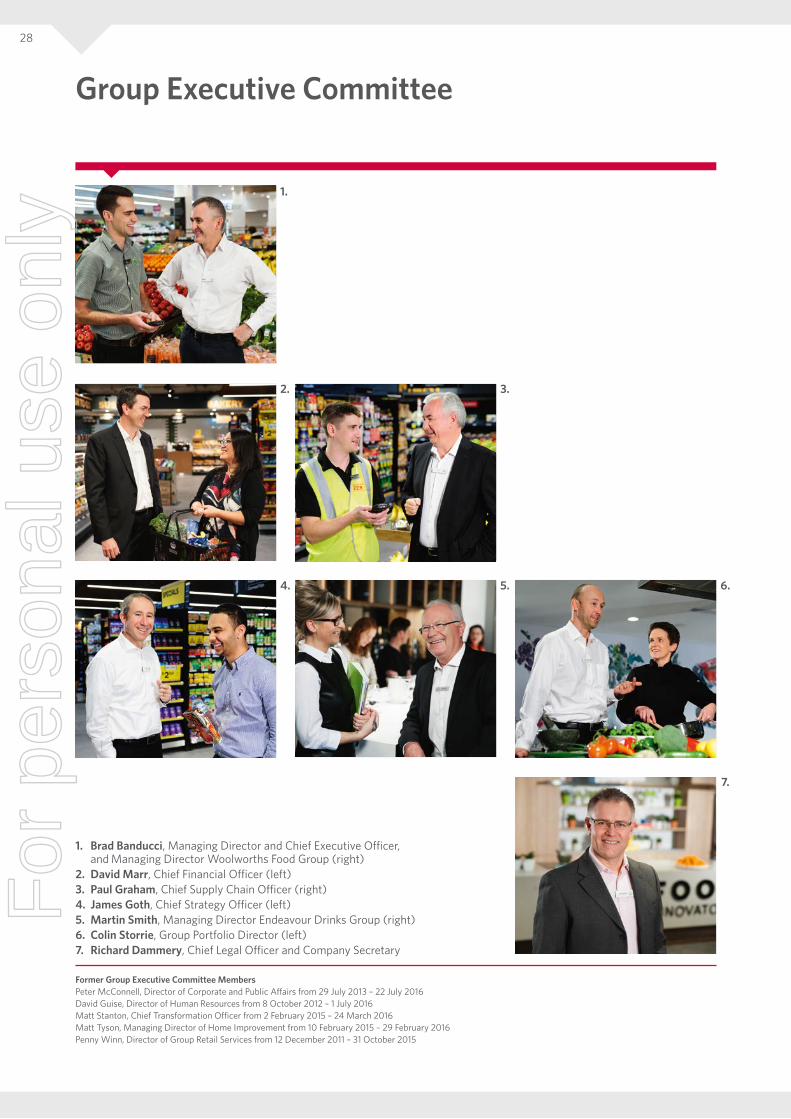
1. Brad Banducci, Managing Director and Chief Executive Officer, and Managing Director Woolworths Food Group (right)
2. David Marr, Chief Financial Officer (left)3. Paul Graham, Chief Supply Chain Officer (right)4. James Goth, Chief Strategy Officer (left)5. Martin Smith, Managing Director Endeavour Drinks Group (right)6. Colin Storrie, Group Portfolio Director (left)7. Richard Dammery, Chief Legal Officer and Company Secretary
Former Group Executive Committee MembersPeter McConnell, Director of Corporate and Public Affairs from 29 July 2013 – 22 July 2016David Guise, Director of Human Resources from 8 October 2012 – 1 July 2016Matt Stanton, Chief Transformation Officer from 2 February 2015 – 24 March 2016Matt Tyson, Managing Director of Home Improvement from 10 February 2015 – 29 February 2016Penny Winn, Director of Group Retail Services from 12 December 2011 – 31 October 2015
1.
2.
4.
3.
5. 6.
7.
28F
or p
erso
nal u
se o
nly
Directors’ Statutory Report
This Report is given by the Directors in respect of Woolworths Limited (the ‘Company’) and the entities it controlled at the end of, or during the financial period ended 26 June 2016 (together referred to as the ‘Group’).
THE DIRECTORSThe persons who have been Directors of the Company at any time during or since the end of the financial period and up to the date of this report are:
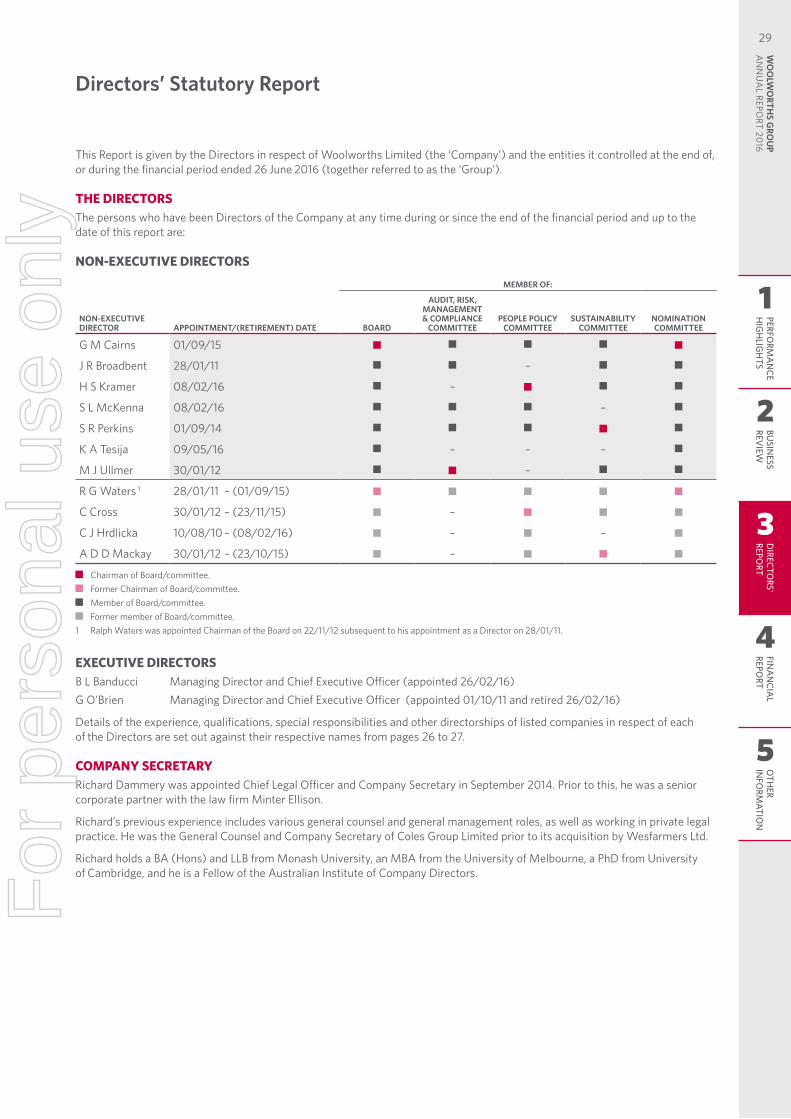
NON-EXECUTIVE DIRECTORS
NON-EXECUTIVE DIRECTOR APPOINTMENT/(RETIREMENT) DATE
MEMBER OF:
BOARD
AUDIT, RISK, MANAGEMENT & COMPLIANCE
COMMITTEEPEOPLE POLICY
COMMITTEESUSTAINABILITY
COMMITTEENOMINATION COMMITTEE
G M Cairns 01/09/15
J R Broadbent 28/01/11 –
H S Kramer 08/02/16 –
S L McKenna 08/02/16 –
S R Perkins 01/09/14
K A Tesija 09/05/16 – – –
M J Ullmer 30/01/12 –
R G Waters 1 28/01/11 – (01/09/15)
C Cross 30/01/12 – (23/11/15) –
C J Hrdlicka 10/08/10 – (08/02/16) – –
A D D Mackay 30/01/12 – (23/10/15) –
Chairman of Board/committee. Former Chairman of Board/committee. Member of Board/committee. Former member of Board/committee.
1 Ralph Waters was appointed Chairman of the Board on 22/11/12 subsequent to his appointment as a Director on 28/01/11.
EXECUTIVE DIRECTORSB L Banducci Managing Director and Chief Executive Officer (appointed 26/02/16)G O’Brien Managing Director and Chief Executive Officer (appointed 01/10/11 and retired 26/02/16)
Details of the experience, qualifications, special responsibilities and other directorships of listed companies in respect of each of the Directors are set out against their respective names from pages 26 to 27.
COMPANY SECRETARYRichard Dammery was appointed Chief Legal Officer and Company Secretary in September 2014. Prior to this, he was a senior corporate partner with the law firm Minter Ellison.
Richard’s previous experience includes various general counsel and general management roles, as well as working in private legal practice. He was the General Counsel and Company Secretary of Coles Group Limited prior to its acquisition by Wesfarmers Ltd.
Richard holds a BA (Hons) and LLB from Monash University, an MBA from the University of Melbourne, a PhD from University of Cambridge, and he is a Fellow of the Australian Institute of Company Directors.
1
2
3
4
5
PERFORM
AN
CEH
IGH
LIGH
TSBU
SINESS
REVIEW
DIRECTO
RS' REPO
RTFIN
AN
CIAL
REPORT
OTH
ER IN
FORM
ATION
29W
OO
LWO
RTHS G
ROU
P A
NN
UA
L REPORT 20
16
For
per
sona
l use
onl
y
Directors’ Statutory Report
PRINCIPAL ACTIVITIESWoolworths Limited operates primarily in Australia and New Zealand with 3,827 stores and approximately 205,000 employees at year end. The principal activities of the Group during the year were retail operations across:• Australian Food and Petrol: operating 992 Woolworths Supermarkets, five Thomas Dux stores as well as 530 petrol canopies• Endeavour Drinks Group: operating 1,486 liquor stores under the Dan Murphy’s and BWS brands and two Summergate
stores. Woolworths also operates the Cellarmasters, Langtons and winemarket.com.au online platforms• New Zealand Supermarkets: operating 184 Countdown Supermarkets as well as a wholesale operation which supplies
a further 64 stores• BIGW: operating 186 BIGW stores• Hotels: operating 331 hotels, including bars, dining, gaming, accommodation and venue hire operations• Home Improvement: operating 63 Masters stores and 43 Home Timber and Hardware stores as well as a wholesale operation
which supplies a further 349 stores. Home Improvement is reported as a discontinued operation
Woolworths also has online operations for its primary trading divisions and five EziBuy stores as well as the EziBuy direct-to-consumer online platform.
CONSOLIDATED RESULTS AND REVIEW OF THE OPERATIONSThe net amount of consolidated loss for the financial period after income tax expense attributable to members of the Company and its controlled entities was $1,234.8 million (2015: profit of $2,146.0 million).
A review of the operations of the Group and its principal businesses during the financial period and the results of those operations are set out from pages 8 to 25 inclusive in the Annual Report.
DIVIDENDSThe amounts set out below have been paid by the Company during the financial period by way of dividend or have been declared by the Directors of the Company, by way of dividend, but not paid during the financial period up to the date of this report. All dividends were fully franked at the tax rate indicated.
FRANKING TAX RATE
%DIVIDEND CENTS
PER SHARE
TOTAL PAID/ PAYABLE
$M
Final 2015 DividendPaid on 9 October 2015 30 72 912.0Interim 2016 DividendPaid on 8 April 2016 30 44 559.2Final 2016 DividendPayable on 7 October 2016 (declared on 25 August 2016) 30 33 422.0
A net increase in the issued share capital of the Company of 12,143,526 fully paid ordinary shares occurred as a result of the issue on 9 October 2015 of 4,321,933 fully paid ordinary shares and the issue on 8 April 2016 of 7,821,593 fully paid ordinary shares pursuant to the Dividend Reinvestment Plan (DRP). Neither the 2015 final dividend nor the 2016 interim dividend was underwritten and a cap of 20,000 maximum share participation in the Dividend Reinvestment Plan was in operation for the 2015 final dividend. The DRP for the 2016 final dividend will be underwritten to a maximum of 50%.
SIGNIFICANT CHANGES IN THE STATE OF AFFAIRSOther than the matters disclosed in Note 27 and Note 37 to the financial statements, there were no significant changes in the Group’s state of affairs during the financial period other than as disclosed in this Annual Report.
GRANT OF PERFORMANCE RIGHTSDuring the year, the Company made performance rights offers under both the long-term incentive (LTI) plan and the deferred short-term incentive (STI) plan with stringent performance measures. This includes:• On 20 November 2015 offers were made granting 2,020,756 performance rights with an effective date of 1 July 2015• On 4 December 2015 offers were made granting 93,524 performance rights with an effective date of 1 July 2015
A further 811,052 performance rights (attraction and retention) were offered with various effective dates between 1 July 2015 to 20 June 2016.
Between 27 June 2016 and 9 September 2016, 26,053 performance rights (attraction and retention) have been issued. No other performance rights or options have been issued during this period.
30F
or p
erso
nal u
se o
nly
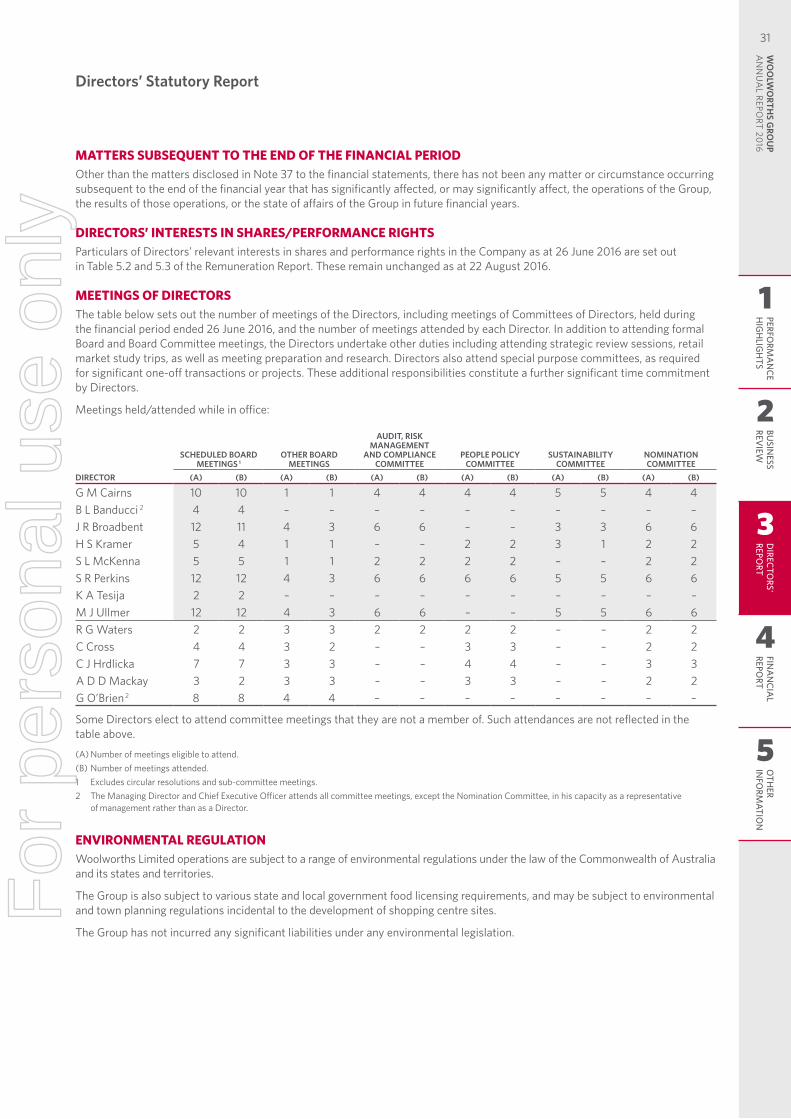
Directors’ Statutory Report
MATTERS SUBSEQUENT TO THE END OF THE FINANCIAL PERIODOther than the matters disclosed in Note 37 to the financial statements, there has not been any matter or circumstance occurring subsequent to the end of the financial year that has significantly affected, or may significantly affect, the operations of the Group, the results of those operations, or the state of affairs of the Group in future financial years.
DIRECTORS’ INTERESTS IN SHARES/PERFORMANCE RIGHTSParticulars of Directors’ relevant interests in shares and performance rights in the Company as at 26 June 2016 are set out in Table 5.2 and 5.3 of the Remuneration Report. These remain unchanged as at 22 August 2016.
MEETINGS OF DIRECTORSThe table below sets out the number of meetings of the Directors, including meetings of Committees of Directors, held during the financial period ended 26 June 2016, and the number of meetings attended by each Director. In addition to attending formal Board and Board Committee meetings, the Directors undertake other duties including attending strategic review sessions, retail market study trips, as well as meeting preparation and research. Directors also attend special purpose committees, as required for significant one-off transactions or projects. These additional responsibilities constitute a further significant time commitment by Directors.
Meetings held/attended while in office:
DIRECTOR
SCHEDULED BOARD MEETINGS 1
OTHER BOARD MEETINGS
AUDIT, RISK MANAGEMENT
AND COMPLIANCE COMMITTEE
PEOPLE POLICY COMMITTEE
SUSTAINABILITY COMMITTEE
NOMINATION COMMITTEE
(A) (B) (A) (B) (A) (B) (A) (B) (A) (B) (A) (B)
G M Cairns 10 10 1 1 4 4 4 4 5 5 4 4B L Banducci 2 4 4 – – – – – – – – – –J R Broadbent 12 11 4 3 6 6 – – 3 3 6 6H S Kramer 5 4 1 1 – – 2 2 3 1 2 2S L McKenna 5 5 1 1 2 2 2 2 – – 2 2S R Perkins 12 12 4 3 6 6 6 6 5 5 6 6K A Tesija 2 2 – – – – – – – – – –M J Ullmer 12 12 4 3 6 6 – – 5 5 6 6R G Waters 2 2 3 3 2 2 2 2 – – 2 2C Cross 4 4 3 2 – – 3 3 – – 2 2C J Hrdlicka 7 7 3 3 – – 4 4 – – 3 3A D D Mackay 3 2 3 3 – – 3 3 – – 2 2G O’Brien 2 8 8 4 4 – – – – – – – –
Some Directors elect to attend committee meetings that they are not a member of. Such attendances are not reflected in the table above.
(A) Number of meetings eligible to attend.(B) Number of meetings attended.1 Excludes circular resolutions and sub-committee meetings.2 The Managing Director and Chief Executive Officer attends all committee meetings, except the Nomination Committee, in his capacity as a representative
of management rather than as a Director.
ENVIRONMENTAL REGULATIONWoolworths Limited operations are subject to a range of environmental regulations under the law of the Commonwealth of Australia and its states and territories.
The Group is also subject to various state and local government food licensing requirements, and may be subject to environmental and town planning regulations incidental to the development of shopping centre sites.
The Group has not incurred any significant liabilities under any environmental legislation.
1
2
3
4
5
PERFORM
AN
CEH
IGH
LIGH
TSBU
SINESS
REVIEW
DIRECTO
RS' REPO
RTFIN
AN
CIAL
REPORT
OTH
ER IN
FORM
ATION
31W
OO
LWO
RTHS G
ROU
P A
NN
UA
L REPORT 20
16
For
per
sona
l use
onl
y
Directors’ Statutory Report
DIRECTORS’ AND OFFICERS’ INDEMNITY/INSURANCE(i) The Constitution of the Company provides that the Company will indemnify to the maximum extent permitted by law, any
current or former director, secretary or other officer of the Company or a wholly owned subsidiary of the Company against: (a) any liability incurred by the person in that capacity; (b) legal costs incurred in defending, or otherwise in connection with proceedings, whether civil, criminal or of an administrative or investigatory nature in which the person becomes involved because of that capacity; and (c) legal costs incurred in good faith in obtaining legal advice on issues relevant to the performance of their functions and discharge of their duties.
(ii) Each director has entered into a Deed of Indemnity, Access and Insurance which provides for indemnity against liability as a director, except to the extent of indemnity under an insurance policy or where prohibited by statute. The Deed also entitles the director to access company documents and records, subject to undertakings as to confidentiality, and to receive directors’ and officers’ insurance cover paid for by the Company (see (iii) below).
(iii) During or since the end of the financial period, the Company has paid or agreed to pay a premium in respect of a contract of insurance insuring officers and any persons who are officers in the future and employees of the Company and its subsidiaries, against certain liabilities incurred in that capacity. Disclosure of the total amount of the premiums and the nature of the liabilities in respect of such insurance is prohibited by the contract of insurance.
REMUNERATION REPORTThe Remuneration Report, which forms part of this Directors’ Report, is presented separately starting from page 33.
AUDITOR’S INDEPENDENCE DECLARATIONThe auditor’s independence declaration is included on page 54.
NON-AUDIT SERVICESDuring the year, Deloitte Touche Tohmatsu, the Company’s auditors, have performed certain other services in addition to their statutory duties. The Board is satisfied that the provision of those non-audit services during the year by the auditor is compatible with, and did not compromise, the auditor independence requirements of the Corporations Act 2001 (Cth) or as set out in Code of Conduct APES 110 Code of Ethics for Professional Accountants issued by the Accounting Professional & Ethical Standards Board, as they did not involve reviewing or auditing the auditor’s own work, acting in a management or decision making capacity for the Company, acting as an advocate for the Company or jointly sharing risks or rewards.
Details of amounts paid or payable to the auditor for non-audit services provided during the year by the auditor are outlined in Note 36 to the financial statements.
ROUNDING OF AMOUNTSThe Company is of a kind referred to in Australian Securities and Investments Commission Class Order 98/100 dated 10 July 1998 pursuant to section 341(1) of the Corporations Act 2001 (Cth) relating to the ‘rounding off’ of amounts in the Financial Report and Directors’ Report. In accordance with that Class Order, amounts therein have been rounded off to the nearest tenth of a million dollars except where otherwise indicated.
This Report is made in accordance with a Resolution of the Directors of the Company on 9 September 2016.
Gordon Cairns Chairman
Brad Banducci Managing Director and Chief Executive Officer
32F
or p
erso
nal u
se o
nly
Directors’ Statutory ReportRemuneration Report
INTRODUCTION FROM THE CHAIR OF THE PEOPLE POLICY COMMITTEEOn behalf of the Board, I am pleased to present the Remuneration Report for the financial year ended 26 June 2016 (FY16). The Board is committed to ensuring that the structure and governance of remuneration at Woolworths is both fair and responsible and supports the achievement of business outcomes which deliver sustainable returns for our shareholders.
Soon after the appointment of Brad Banducci to the role of Managing Director and Chief Executive Officer (Group CEO), the Board approved a new and refocused business strategy and operational structure. In support of this transformational agenda, the People Policy Committee (PPC) has completed a comprehensive revision of the remuneration framework, incorporating best practices where appropriate. These changes reinforce the Company’s strategic objectives by providing a clear link between business performance and reward outcomes for all relevant management, from our critically important store managers through to our newly formed senior executive team. We believe the new remuneration programs will reinforce a culture of accountability, which is vital to our long term success.
Since assuming the role of Chair of the PPC in March of this year, I have taken feedback on how we can improve this report to provide you with greater simplicity, clarity and transparency. This report includes the outcomes of the remuneration structures and policies that were put in place to drive FY16 business performance, and it reflects the fact that the Company results overall did not meet expectations. We have also focused extensively in this report on explaining the new remuneration principles and programs that will guide the business in FY17 and beyond.
The Board and the PPC trust you will find the information useful and informative.
Holly Kramer Chair – People Policy Committee
1
2
3
4
5
PERFORM
AN
CEH
IGH
LIGH
TSBU
SINESS
REVIEW
DIRECTO
RS' REPO
RTFIN
AN
CIAL
REPORT
OTH
ER IN
FORM
ATION
33W
OO
LWO
RTHS G
ROU
P A
NN
UA
L REPORT 20
16
For
per
sona
l use
onl
y
Directors’ Statutory Report: Remuneration Report
The report has been prepared and audited against the disclosure requirements of the Corporations Act 2001 (Cth).
MANAGEMENT DEFINITIONSThe Remuneration Report outlines Woolworths’ remuneration framework and the outcomes for the year ended 26 June 2016 for the Key Management Personnel (KMP). For the purposes of this report, KMP have the authority and responsibility for planning, directing and controlling the activities of the significant businesses of Woolworths.
The following terms are used throughout the report to describe different groups of executives.
TERM MEANING
Executive KMP Detailed in Section 1(i), and have been determined as defined in AASB 124 Related Party Disclosures
Group Executive Committee (Group ExCo)
Generally comprises Executive KMP and non-KMP roles, and includes the Group CEO, Chief Financial Officer (CFO), heads of business from the Woolworths Food Group and Endeavour Drinks Group, and heads of functions (note the heads of the BIGW, Home Improvement and ALH businesses are not part of the Group ExCo)
Senior Executives A group of approximately 100 senior leaders comprising Executive KMP, Group ExCo members, some of their direct reports, and in some cases the next level, whose roles make a considerable contribution to business outcomes
SUMMARY OF CONTENTS
SECTION CONTENTS PAGE
1 Key questions 35
2 Executive KMP Remuneration 2.1 What we paid and granted current Executive KMP in FY162.2 FY16 remuneration commentary and link to performance2.3 FY17 Woolworths remuneration framework changes2.4 Terms of Executive KMP service agreements
363941
46
3 Non–executive Directors’ Arrangements3.1 Non-executive Directors’ remuneration policy and structure3.2 Non-executive Directors’ minimum shareholding requirement3.3 Appointment letter, Deed of Access, Insurance and Indemnity
464747
4 Governance4.1 Role of the People Policy Committee (PPC)4.2 Use of remuneration advisors4.3 Securities Trading Policy
474747
5 KMP Statutory Disclosures 5.1 KMP remuneration table5.2 Conditional entitlements to, and share holdings, of Executive KMP5.3 KMP share movements5.4 Share rights outstanding for Executive KMP at 26 June 2016
48505152
34F
or p
erso
nal u
se o
nly
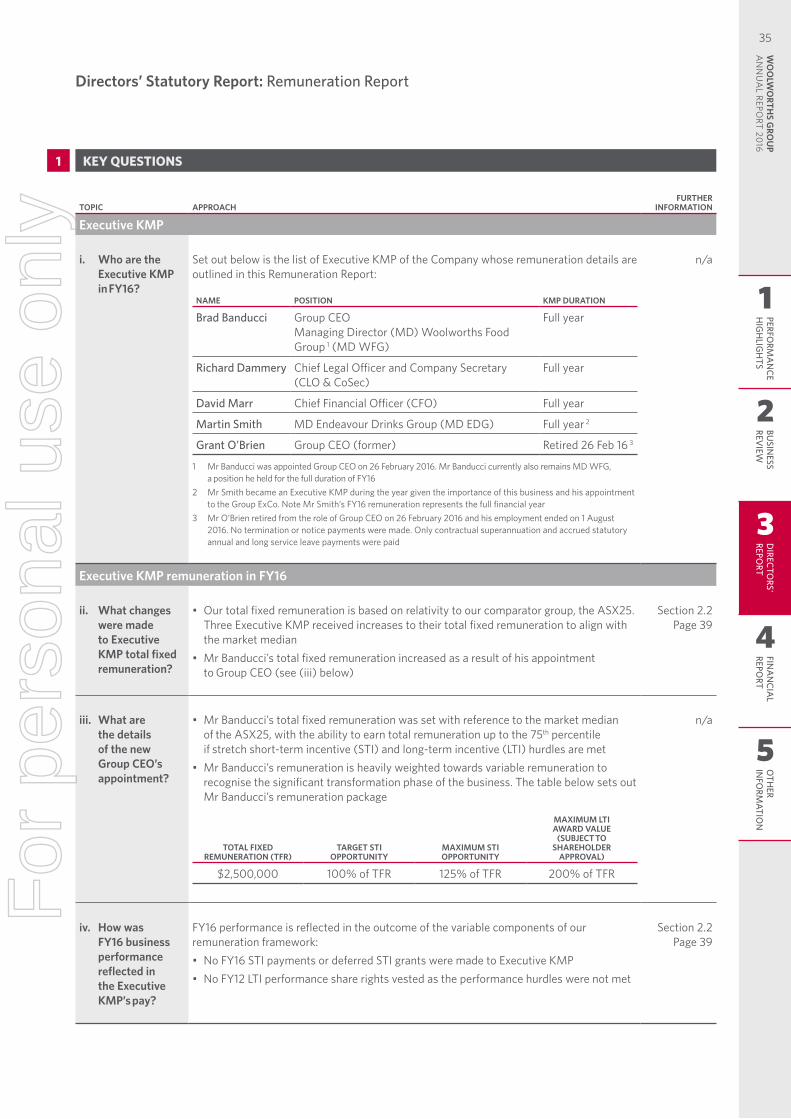
Directors’ Statutory Report: Remuneration Report
1 KEY QUESTIONS
TOPIC APPROACHFURTHER
INFORMATION
Executive KMP
i. Who are the Executive KMP in FY16?
Set out below is the list of Executive KMP of the Company whose remuneration details are outlined in this Remuneration Report:
NAME POSITION KMP DURATION
Brad Banducci Group CEO Managing Director (MD) Woolworths Food Group 1 (MD WFG)
Full year
Richard Dammery Chief Legal Officer and Company Secretary (CLO & CoSec)
Full year
David Marr Chief Financial Officer (CFO) Full year
Martin Smith MD Endeavour Drinks Group (MD EDG) Full year 2
Grant O’Brien Group CEO (former) Retired 26 Feb 16 3
1 Mr Banducci was appointed Group CEO on 26 February 2016. Mr Banducci currently also remains MD WFG, a position he held for the full duration of FY16
2 Mr Smith became an Executive KMP during the year given the importance of this business and his appointment to the Group ExCo. Note Mr Smith’s FY16 remuneration represents the full financial year
3 Mr O’Brien retired from the role of Group CEO on 26 February 2016 and his employment ended on 1 August 2016. No termination or notice payments were made. Only contractual superannuation and accrued statutory annual and long service leave payments were paid
n/a
Executive KMP remuneration in FY16
ii. What changes were made to Executive KMP total fixed remuneration?
• Our total fixed remuneration is based on relativity to our comparator group, the ASX25. Three Executive KMP received increases to their total fixed remuneration to align with the market median
• Mr Banducci’s total fixed remuneration increased as a result of his appointment to Group CEO (see (iii) below)
Section 2.2 Page 39
iii. What are the details of the new Group CEO’s appointment?
• Mr Banducci’s total fixed remuneration was set with reference to the market median of the ASX25, with the ability to earn total remuneration up to the 75th percentile if stretch short-term incentive (STI) and long-term incentive (LTI) hurdles are met
• Mr Banducci’s remuneration is heavily weighted towards variable remuneration to recognise the significant transformation phase of the business. The table below sets out Mr Banducci’s remuneration package
TOTAL FIXED REMUNERATION (TFR)
TARGET STI OPPORTUNITY
MAXIMUM STI OPPORTUNITY
MAXIMUM LTI AWARD VALUE
(SUBJECT TO SHAREHOLDER
APPROVAL)
$2,500,000 100% of TFR 125% of TFR 200% of TFR
n/a
iv. How was FY16 business performance reflected in the Executive KMP’s pay?
FY16 performance is reflected in the outcome of the variable components of our remuneration framework:• No FY16 STI payments or deferred STI grants were made to Executive KMP• No FY12 LTI performance share rights vested as the performance hurdles were not met
Section 2.2 Page 39
1
2
3
4
5
PERFORM
AN
CEH
IGH
LIGH
TSBU
SINESS
REVIEW
DIRECTO
RS' REPO
RTFIN
AN
CIAL
REPORT
OTH
ER IN
FORM
ATION
35W
OO
LWO
RTHS G
ROU
P A
NN
UA
L REPORT 20
16
For
per
sona
l use
onl
y
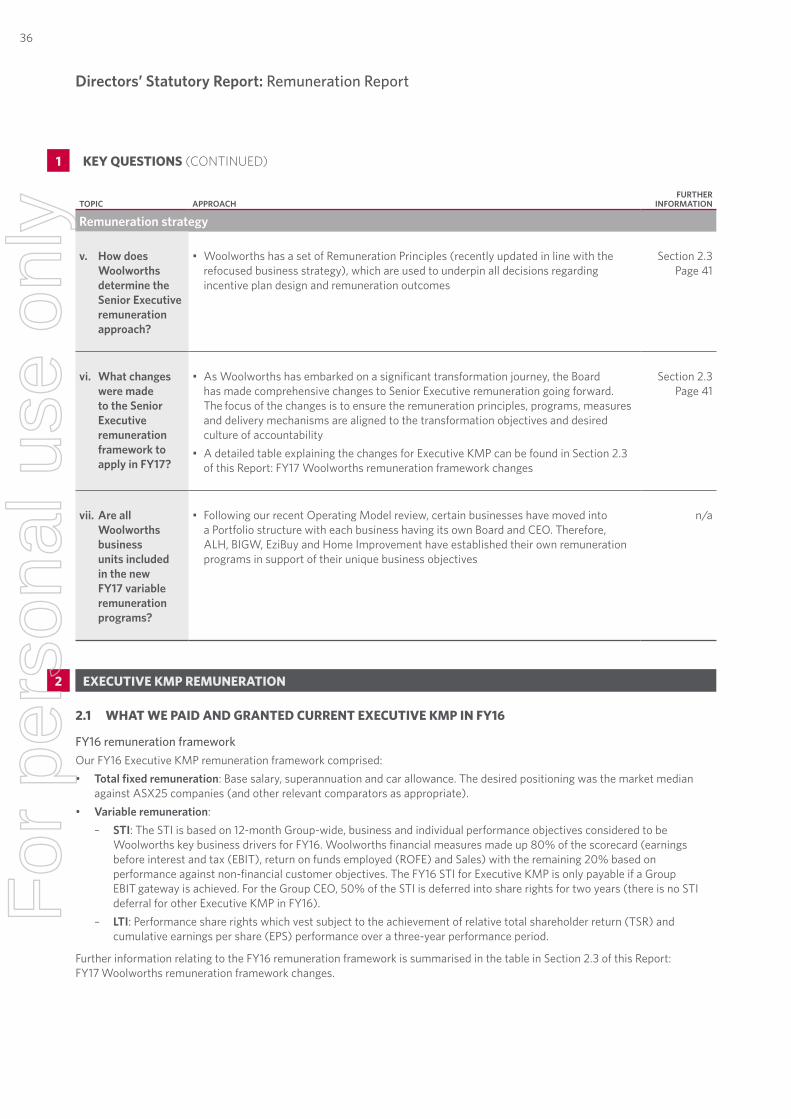
Directors’ Statutory Report: Remuneration Report
TOPIC APPROACHFURTHER
INFORMATION
Remuneration strategy
v. How does Woolworths determine the Senior Executive remuneration approach?
• Woolworths has a set of Remuneration Principles (recently updated in line with the refocused business strategy), which are used to underpin all decisions regarding incentive plan design and remuneration outcomes
Section 2.3 Page 41
vi. What changes were made to the Senior Executive remuneration framework to apply in FY17?
• As Woolworths has embarked on a significant transformation journey, the Board has made comprehensive changes to Senior Executive remuneration going forward. The focus of the changes is to ensure the remuneration principles, programs, measures and delivery mechanisms are aligned to the transformation objectives and desired culture of accountability
• A detailed table explaining the changes for Executive KMP can be found in Section 2.3 of this Report: FY17 Woolworths remuneration framework changes
Section 2.3 Page 41
vii. Are all Woolworths business units included in the new FY17 variable remuneration programs?
• Following our recent Operating Model review, certain businesses have moved into a Portfolio structure with each business having its own Board and CEO. Therefore, ALH, BIGW, EziBuy and Home Improvement have established their own remuneration programs in support of their unique business objectives
n/a
2 EXECUTIVE KMP REMUNERATION
2.1 WHAT WE PAID AND GRANTED CURRENT EXECUTIVE KMP IN FY16
FY16 remuneration frameworkOur FY16 Executive KMP remuneration framework comprised: • Total fixed remuneration: Base salary, superannuation and car allowance. The desired positioning was the market median
against ASX25 companies (and other relevant comparators as appropriate).• Variable remuneration:
– STI: The STI is based on 12-month Group-wide, business and individual performance objectives considered to be Woolworths key business drivers for FY16. Woolworths financial measures made up 80% of the scorecard (earnings before interest and tax (EBIT), return on funds employed (ROFE) and Sales) with the remaining 20% based on performance against non-financial customer objectives. The FY16 STI for Executive KMP is only payable if a Group EBIT gateway is achieved. For the Group CEO, 50% of the STI is deferred into share rights for two years (there is no STI deferral for other Executive KMP in FY16).
– LTI: Performance share rights which vest subject to the achievement of relative total shareholder return (TSR) and cumulative earnings per share (EPS) performance over a three-year performance period.
Further information relating to the FY16 remuneration framework is summarised in the table in Section 2.3 of this Report: FY17 Woolworths remuneration framework changes.
1 KEY QUESTIONS (CONTINUED)
36F
or p
erso
nal u
se o
nly
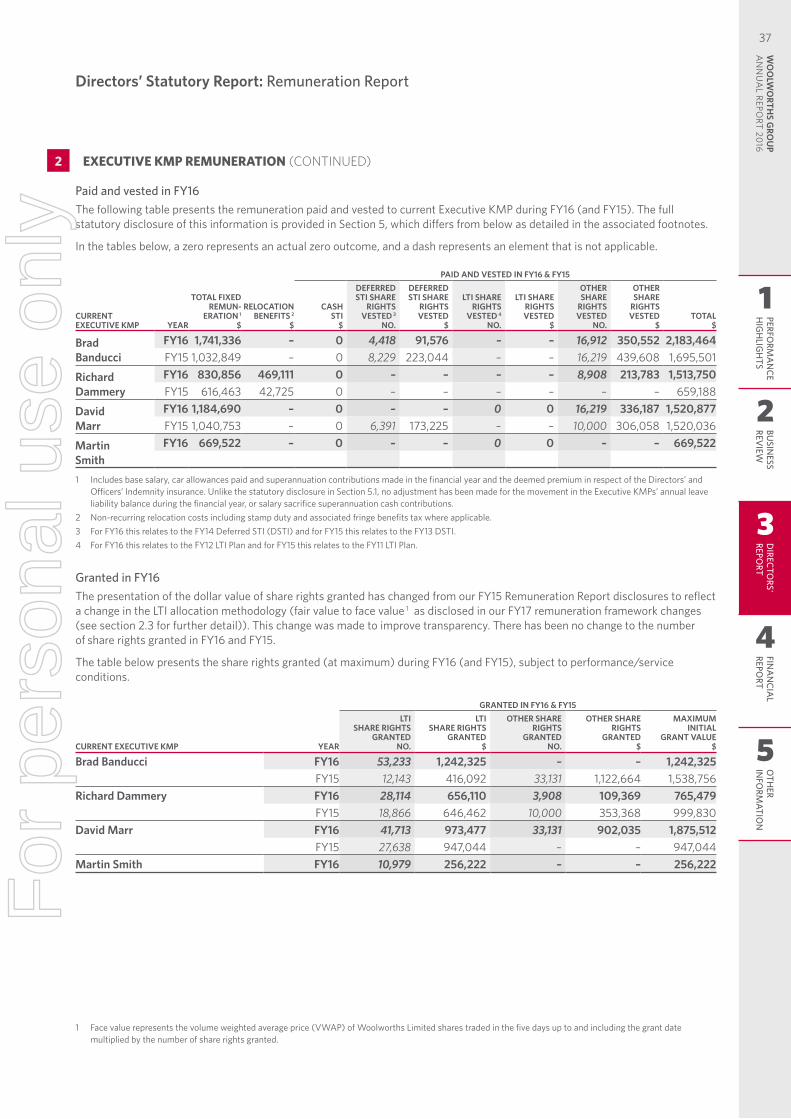
Directors’ Statutory Report: Remuneration Report
Paid and vested in FY16The following table presents the remuneration paid and vested to current Executive KMP during FY16 (and FY15). The full statutory disclosure of this information is provided in Section 5, which differs from below as detailed in the associated footnotes.
In the tables below, a zero represents an actual zero outcome, and a dash represents an element that is not applicable.
PAID AND VESTED IN FY16 & FY15
CURRENT EXECUTIVE KMP YEAR
TOTAL FIXED REMUN-
ERATION 1 $
RELOCATION BENEFITS 2
$
CASH STI
$
DEFERRED STI SHARE
RIGHTS VESTED 3
NO.
DEFERRED STI SHARE
RIGHTS VESTED
$
LTI SHARE RIGHTS
VESTED 4
NO.
LTI SHARE RIGHTS VESTED
$
OTHER SHARE
RIGHTS VESTED
NO.
OTHER SHARE
RIGHTS VESTED
$TOTAL
$
Brad Banducci
FY16 1,741,336 – 0 4,418 91,576 – – 16,912 350,552 2,183,464FY15 1,032,849 – 0 8,229 223,044 – – 16,219 439,608 1,695,501
Richard Dammery
FY16 830,856 469,111 0 – – – – 8,908 213,783 1,513,750FY15 616,463 42,725 0 – – – – – – 659,188
David Marr
FY16 1,184,690 – 0 – – 0 0 16,219 336,187 1,520,877FY15 1,040,753 – 0 6,391 173,225 – – 10,000 306,058 1,520,036
Martin Smith
FY16 669,522 – 0 – – 0 0 – – 669,522
1 Includes base salary, car allowances paid and superannuation contributions made in the financial year and the deemed premium in respect of the Directors’ and Officers’ Indemnity insurance. Unlike the statutory disclosure in Section 5.1, no adjustment has been made for the movement in the Executive KMPs’ annual leave liability balance during the financial year, or salary sacrifice superannuation cash contributions.
2 Non-recurring relocation costs including stamp duty and associated fringe benefits tax where applicable.3 For FY16 this relates to the FY14 Deferred STI (DSTI) and for FY15 this relates to the FY13 DSTI.4 For FY16 this relates to the FY12 LTI Plan and for FY15 this relates to the FY11 LTI Plan.
Granted in FY16The presentation of the dollar value of share rights granted has changed from our FY15 Remuneration Report disclosures to reflect a change in the LTI allocation methodology (fair value to face value 1 as disclosed in our FY17 remuneration framework changes (see section 2.3 for further detail)). This change was made to improve transparency. There has been no change to the number of share rights granted in FY16 and FY15.
The table below presents the share rights granted (at maximum) during FY16 (and FY15), subject to performance/service conditions.
GRANTED IN FY16 & FY15
CURRENT EXECUTIVE KMP YEAR
LTI SHARE RIGHTS
GRANTED NO.
LTI SHARE RIGHTS
GRANTED $
OTHER SHARE RIGHTS
GRANTED NO.
OTHER SHARE RIGHTS
GRANTED $
MAXIMUM INITIAL
GRANT VALUE $
Brad Banducci FY16 53,233 1,242,325 – – 1,242,325FY15 12,143 416,092 33,131 1,122,664 1,538,756
Richard Dammery FY16 28,114 656,110 3,908 109,369 765,479FY15 18,866 646,462 10,000 353,368 999,830
David Marr FY16 41,713 973,477 33,131 902,035 1,875,512FY15 27,638 947,044 – – 947,044
Martin Smith FY16 10,979 256,222 – – 256,222
1 Face value represents the volume weighted average price (VWAP) of Woolworths Limited shares traded in the five days up to and including the grant date multiplied by the number of share rights granted.
2 EXECUTIVE KMP REMUNERATION (CONTINUED)
1
2
3
4
5
PERFORM
AN
CEH
IGH
LIGH
TSBU
SINESS
REVIEW
DIRECTO
RS' REPO
RTFIN
AN
CIAL
REPORT
OTH
ER IN
FORM
ATION
37W
OO
LWO
RTHS G
ROU
P A
NN
UA
L REPORT 20
16
For
per
sona
l use
onl
y
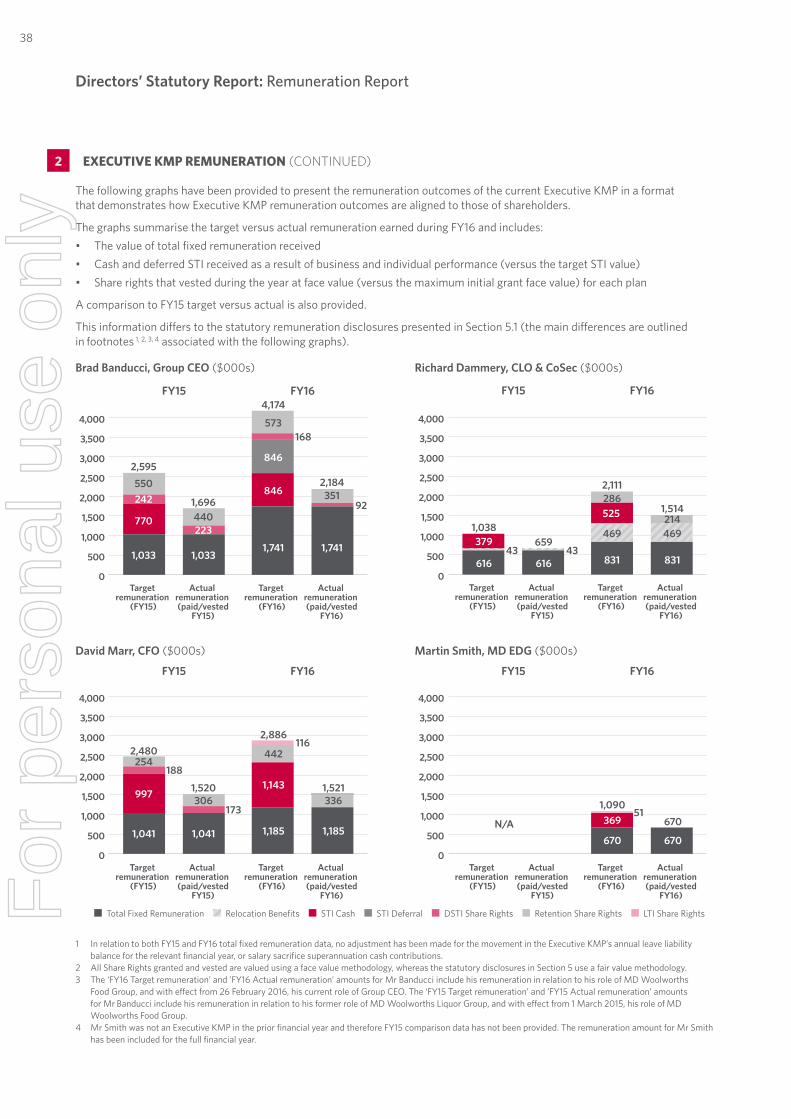
Directors’ Statutory Report: Remuneration Report
2 EXECUTIVE KMP REMUNERATION (CONTINUED)
The following graphs have been provided to present the remuneration outcomes of the current Executive KMP in a format that demonstrates how Executive KMP remuneration outcomes are aligned to those of shareholders.
The graphs summarise the target versus actual remuneration earned during FY16 and includes: • The value of total fixed remuneration received• Cash and deferred STI received as a result of business and individual performance (versus the target STI value)• Share rights that vested during the year at face value (versus the maximum initial grant face value) for each plan
A comparison to FY15 target versus actual is also provided.
This information differs to the statutory remuneration disclosures presented in Section 5.1 (the main differences are outlined in footnotes 1, 2, 3, 4 associated with the following graphs).
Brad Banducci, Group CEO ($000s) Richard Dammery, CLO & CoSec ($000s)
0
500
1,000
1,500
2,000
2,500
3,000
3,500
4,000
2,595550
1,033
770
242
4,174
168
1,741
573
846
846
2,184
1,741
923513511,696
1,033
223440
FY15 FY16
Actual remuneration (paid/vested
FY16)
Target remuneration
(FY16)
Actual remuneration (paid/vested
FY15)
Target remuneration
(FY15)
0
500
1,000
1,500
2,000
2,500
3,000
3,500
4,000
1,038
61643
379
2,111
831
286
469
525 1,514
831
469214
659
61643
FY15 FY16
Actual remuneration (paid/vested
FY16)
Target remuneration
(FY16)
Actual remuneration (paid/vested
FY15)
Target remuneration
(FY15)
David Marr, CFO ($000s) Martin Smith, MD EDG ($000s)
0
500
1,000
1,500
2,000
2,500
3,000
3,500
4,000
254188
2,480
997
1,041
2,886
442
1,185
116
1,143 1,521
1,185
336173
3061,520
1,041
FY15 FY16
Actual remuneration (paid/vested
FY16)
Target remuneration
(FY16)
Actual remuneration (paid/vested
FY15)
Target remuneration
(FY15)
0
500
1,000
1,500
2,000
2,500
3,000
3,500
4,000
1,09051
N/A670
369 670
670
FY15 FY16
Actual remuneration (paid/vested
FY16)
Target remuneration
(FY16)
Actual remuneration (paid/vested
FY15)
Target remuneration
(FY15)
Total Fixed Remuneration Relocation Benefits STI Cash STI Deferral DSTI Share Rights Retention Share Rights LTI Share Rights
1 In relation to both FY15 and FY16 total fixed remuneration data, no adjustment has been made for the movement in the Executive KMP’s annual leave liability balance for the relevant financial year, or salary sacrifice superannuation cash contributions.
2 All Share Rights granted and vested are valued using a face value methodology, whereas the statutory disclosures in Section 5 use a fair value methodology. 3 The ‘FY16 Target remuneration’ and ’FY16 Actual remuneration’ amounts for Mr Banducci include his remuneration in relation to his role of MD Woolworths
Food Group, and with effect from 26 February 2016, his current role of Group CEO. The ‘FY15 Target remuneration’ and ’FY15 Actual remuneration’ amounts for Mr Banducci include his remuneration in relation to his former role of MD Woolworths Liquor Group, and with effect from 1 March 2015, his role of MD Woolworths Food Group.
4 Mr Smith was not an Executive KMP in the prior financial year and therefore FY15 comparison data has not been provided. The remuneration amount for Mr Smith has been included for the full financial year.
38F
or p
erso
nal u
se o
nly
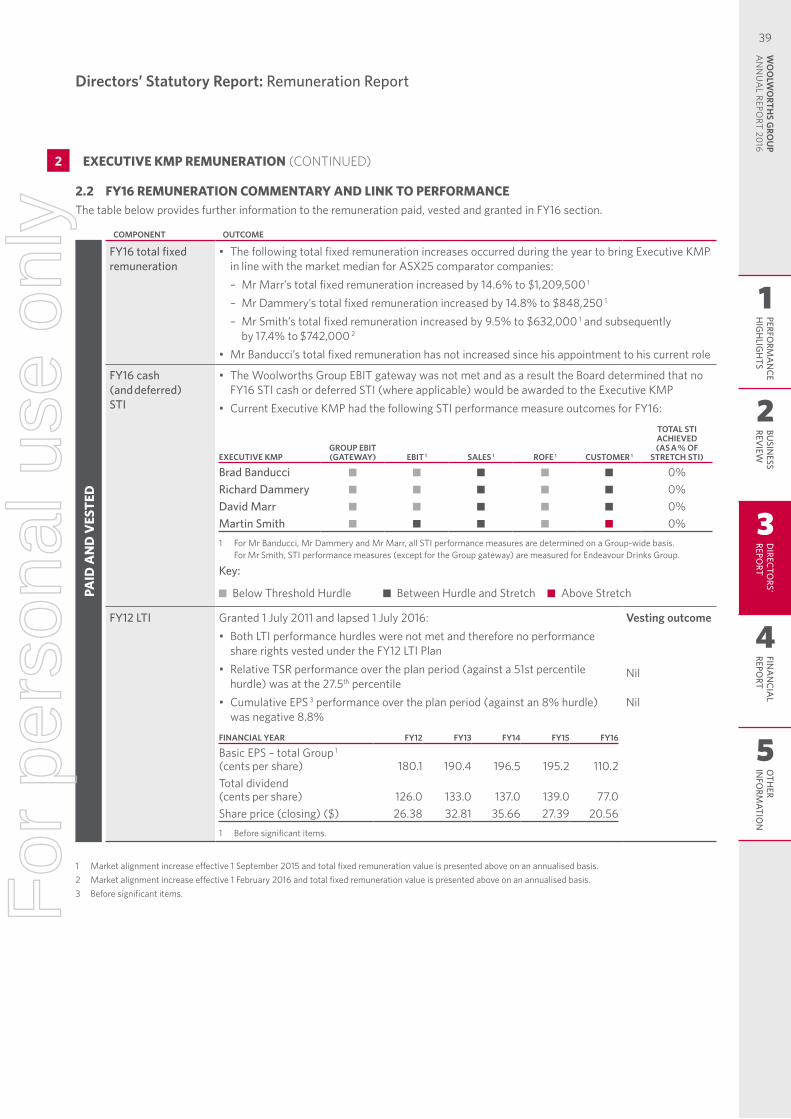
Directors’ Statutory Report: Remuneration Report
2.2 FY16 REMUNERATION COMMENTARY AND LINK TO PERFORMANCEThe table below provides further information to the remuneration paid, vested and granted in FY16 section.
COMPONENT OUTCOME
PAID
AN
D V
ESTE
D
FY16 total fixed remuneration
• The following total fixed remuneration increases occurred during the year to bring Executive KMP in line with the market median for ASX25 comparator companies:
– Mr Marr’s total fixed remuneration increased by 14.6% to $1,209,500 1
– Mr Dammery’s total fixed remuneration increased by 14.8% to $848,250 1
– Mr Smith’s total fixed remuneration increased by 9.5% to $632,000 1 and subsequently by 17.4% to $742,000 2
• Mr Banducci’s total fixed remuneration has not increased since his appointment to his current role
FY16 cash (and deferred) STI
• The Woolworths Group EBIT gateway was not met and as a result the Board determined that no FY16 STI cash or deferred STI (where applicable) would be awarded to the Executive KMP
• Current Executive KMP had the following STI performance measure outcomes for FY16:
EXECUTIVE KMPGROUP EBIT (GATEWAY) EBIT 1 SALES 1 ROFE 1 CUSTOMER 1
TOTAL STI ACHIEVED (AS A % OF
STRETCH STI)
Brad Banducci 0%Richard Dammery 0%David Marr 0%Martin Smith 0%1 For Mr Banducci, Mr Dammery and Mr Marr, all STI performance measures are determined on a Group-wide basis.
For Mr Smith, STI performance measures (except for the Group gateway) are measured for Endeavour Drinks Group.
Key:
Below Threshold Hurdle Between Hurdle and Stretch Above Stretch
FY12 LTI Granted 1 July 2011 and lapsed 1 July 2016:• Both LTI performance hurdles were not met and therefore no performance
share rights vested under the FY12 LTI Plan• Relative TSR performance over the plan period (against a 51st percentile
hurdle) was at the 27.5th percentile• Cumulative EPS 3 performance over the plan period (against an 8% hurdle)
was negative 8.8%
FINANCIAL YEAR FY12 FY13 FY14 FY15 FY16
Basic EPS – total Group 1
(cents per share) 180.1 190.4 196.5 195.2 110.2Total dividend (cents per share) 126.0 133.0 137.0 139.0 77.0Share price (closing) ($) 26.38 32.81 35.66 27.39 20.561 Before significant items.
Vesting outcome
Nil Nil
2 EXECUTIVE KMP REMUNERATION (CONTINUED)
1 Market alignment increase effective 1 September 2015 and total fixed remuneration value is presented above on an annualised basis.2 Market alignment increase effective 1 February 2016 and total fixed remuneration value is presented above on an annualised basis.3 Before significant items.
1
2
3
4
5
PERFORM
AN
CEH
IGH
LIGH
TSBU
SINESS
REVIEW
DIRECTO
RS' REPO
RTFIN
AN
CIAL
REPORT
OTH
ER IN
FORM
ATION
39W
OO
LWO
RTHS G
ROU
P A
NN
UA
L REPORT 20
16
For
per
sona
l use
onl
y
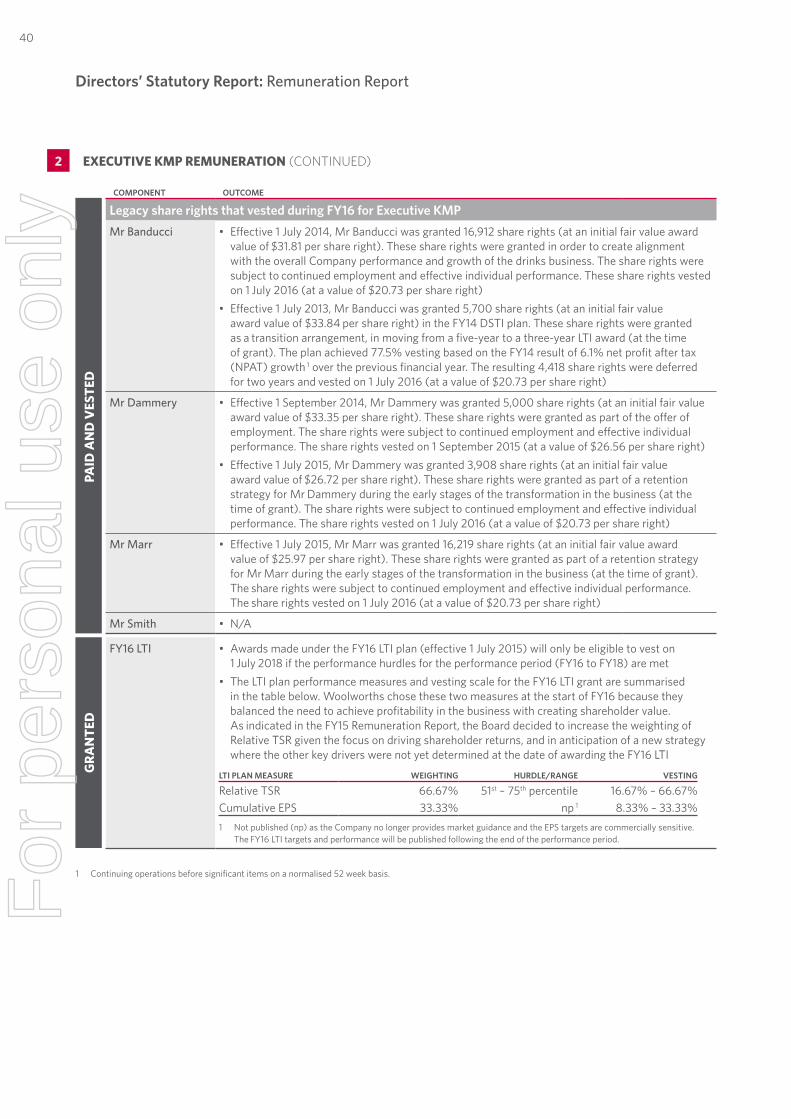
Directors’ Statutory Report: Remuneration Report
COMPONENT OUTCOME
Legacy share rights that vested during FY16 for Executive KMP
PAID
AN
D V
ESTE
D
Mr Banducci • Effective 1 July 2014, Mr Banducci was granted 16,912 share rights (at an initial fair value award value of $31.81 per share right). These share rights were granted in order to create alignment with the overall Company performance and growth of the drinks business. The share rights were subject to continued employment and effective individual performance. These share rights vested on 1 July 2016 (at a value of $20.73 per share right)
• Effective 1 July 2013, Mr Banducci was granted 5,700 share rights (at an initial fair value award value of $33.84 per share right) in the FY14 DSTI plan. These share rights were granted as a transition arrangement, in moving from a five-year to a three-year LTI award (at the time of grant). The plan achieved 77.5% vesting based on the FY14 result of 6.1% net profit after tax (NPAT) growth 1 over the previous financial year. The resulting 4,418 share rights were deferred for two years and vested on 1 July 2016 (at a value of $20.73 per share right)
Mr Dammery • Effective 1 September 2014, Mr Dammery was granted 5,000 share rights (at an initial fair value award value of $33.35 per share right). These share rights were granted as part of the offer of employment. The share rights were subject to continued employment and effective individual performance. The share rights vested on 1 September 2015 (at a value of $26.56 per share right)
• Effective 1 July 2015, Mr Dammery was granted 3,908 share rights (at an initial fair value award value of $26.72 per share right). These share rights were granted as part of a retention strategy for Mr Dammery during the early stages of the transformation in the business (at the time of grant). The share rights were subject to continued employment and effective individual performance. The share rights vested on 1 July 2016 (at a value of $20.73 per share right)
Mr Marr • Effective 1 July 2015, Mr Marr was granted 16,219 share rights (at an initial fair value award value of $25.97 per share right). These share rights were granted as part of a retention strategy for Mr Marr during the early stages of the transformation in the business (at the time of grant). The share rights were subject to continued employment and effective individual performance. The share rights vested on 1 July 2016 (at a value of $20.73 per share right)
Mr Smith • N/A
GRA
NTE
D
FY16 LTI • Awards made under the FY16 LTI plan (effective 1 July 2015) will only be eligible to vest on 1 July 2018 if the performance hurdles for the performance period (FY16 to FY18) are met
• The LTI plan performance measures and vesting scale for the FY16 LTI grant are summarised in the table below. Woolworths chose these two measures at the start of FY16 because they balanced the need to achieve profitability in the business with creating shareholder value. As indicated in the FY15 Remuneration Report, the Board decided to increase the weighting of Relative TSR given the focus on driving shareholder returns, and in anticipation of a new strategy where the other key drivers were not yet determined at the date of awarding the FY16 LTI
LTI PLAN MEASURE WEIGHTING HURDLE/RANGE VESTING
Relative TSR 66.67% 51st – 75th percentile 16.67% – 66.67%Cumulative EPS 33.33% np 1 8.33% – 33.33%1 Not published (np) as the Company no longer provides market guidance and the EPS targets are commercially sensitive.
The FY16 LTI targets and performance will be published following the end of the performance period.
1 Continuing operations before significant items on a normalised 52 week basis.
2 EXECUTIVE KMP REMUNERATION (CONTINUED)
40F
or p
erso
nal u
se o
nly
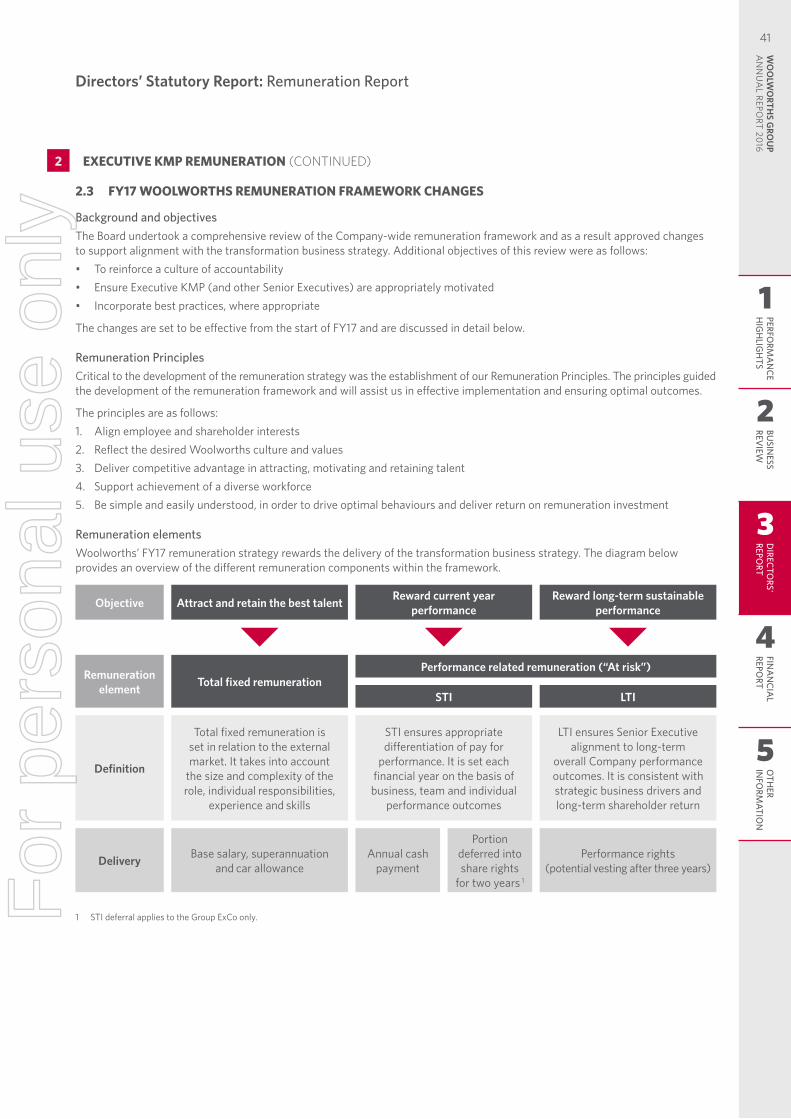
Directors’ Statutory Report: Remuneration Report
2.3 FY17 WOOLWORTHS REMUNERATION FRAMEWORK CHANGES
Background and objectivesThe Board undertook a comprehensive review of the Company-wide remuneration framework and as a result approved changes to support alignment with the transformation business strategy. Additional objectives of this review were as follows:• To reinforce a culture of accountability• Ensure Executive KMP (and other Senior Executives) are appropriately motivated• Incorporate best practices, where appropriate
The changes are set to be effective from the start of FY17 and are discussed in detail below.
Remuneration PrinciplesCritical to the development of the remuneration strategy was the establishment of our Remuneration Principles. The principles guided the development of the remuneration framework and will assist us in effective implementation and ensuring optimal outcomes.
The principles are as follows:1. Align employee and shareholder interests2. Reflect the desired Woolworths culture and values 3. Deliver competitive advantage in attracting, motivating and retaining talent 4. Support achievement of a diverse workforce5. Be simple and easily understood, in order to drive optimal behaviours and deliver return on remuneration investment
Remuneration elementsWoolworths’ FY17 remuneration strategy rewards the delivery of the transformation business strategy. The diagram below provides an overview of the different remuneration components within the framework.
Objective Attract and retain the best talent Reward current year performance
Reward long-term sustainable performance
Remuneration element Total fixed remuneration
Performance related remuneration (“At risk”)
STI LTI
Definition
Total fixed remuneration is set in relation to the external market. It takes into account
the size and complexity of the role, individual responsibilities,
experience and skills
STI ensures appropriate differentiation of pay for
performance. It is set each financial year on the basis of business, team and individual
performance outcomes
LTI ensures Senior Executive alignment to long-term
overall Company performance outcomes. It is consistent with strategic business drivers and long-term shareholder return
Delivery Base salary, superannuation and car allowance
Annual cash payment
Portion deferred into share rights
for two years 1
Performance rights (potential vesting after three years)
1 STI deferral applies to the Group ExCo only.
2 EXECUTIVE KMP REMUNERATION (CONTINUED)
1
2
3
4
5
PERFORM
AN
CEH
IGH
LIGH
TSBU
SINESS
REVIEW
DIRECTO
RS' REPO
RTFIN
AN
CIAL
REPORT
OTH
ER IN
FORM
ATION
41W
OO
LWO
RTHS G
ROU
P A
NN
UA
L REPORT 20
16
For
per
sona
l use
onl
y
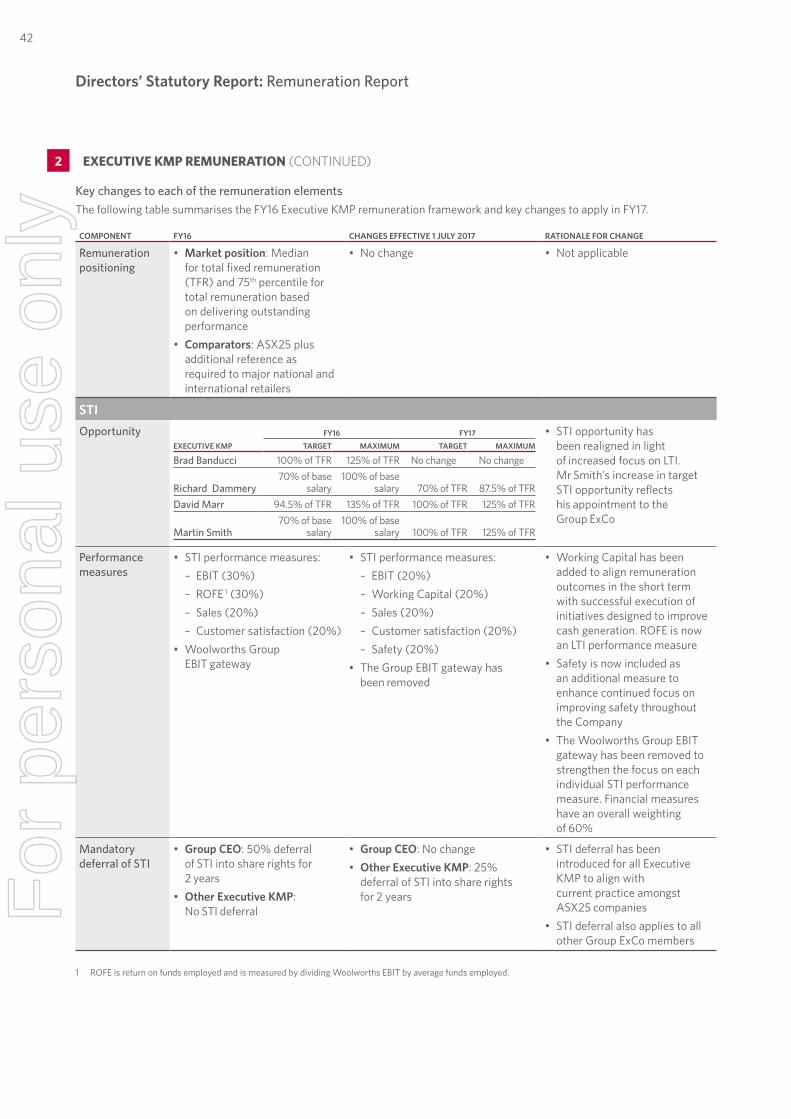
Directors’ Statutory Report: Remuneration Report
1 ROFE is return on funds employed and is measured by dividing Woolworths EBIT by average funds employed.
Key changes to each of the remuneration elementsThe following table summarises the FY16 Executive KMP remuneration framework and key changes to apply in FY17.
COMPONENT FY16 CHANGES EFFECTIVE 1 JULY 2017 RATIONALE FOR CHANGE
Remuneration positioning
• Market position: Median for total fixed remuneration (TFR) and 75th percentile for total remuneration based on delivering outstanding performance
• Comparators: ASX25 plus additional reference as required to major national and international retailers
• No change • Not applicable
STIOpportunity
EXECUTIVE KMP
FY16 FY17
TARGET MAXIMUM TARGET MAXIMUM
Brad Banducci 100% of TFR 125% of TFR No change No change
Richard Dammery70% of base
salary100% of base
salary 70% of TFR 87.5% of TFRDavid Marr 94.5% of TFR 135% of TFR 100% of TFR 125% of TFR
Martin Smith70% of base
salary100% of base
salary 100% of TFR 125% of TFR
• STI opportunity has been realigned in light of increased focus on LTI. Mr Smith’s increase in target STI opportunity reflects his appointment to the Group ExCo
Performance measures
• STI performance measures: – EBIT (30%) – ROFE 1 (30%) – Sales (20%) – Customer satisfaction (20%)
• Woolworths Group EBIT gateway
• STI performance measures: – EBIT (20%) – Working Capital (20%) – Sales (20%) – Customer satisfaction (20%) – Safety (20%)
• The Group EBIT gateway has been removed
• Working Capital has been added to align remuneration outcomes in the short term with successful execution of initiatives designed to improve cash generation. ROFE is now an LTI performance measure
• Safety is now included as an additional measure to enhance continued focus on improving safety throughout the Company
• The Woolworths Group EBIT gateway has been removed to strengthen the focus on each individual STI performance measure. Financial measures have an overall weighting of 60%
Mandatory deferral of STI
• Group CEO: 50% deferral of STI into share rights for 2 years
• Other Executive KMP: No STI deferral
• Group CEO: No change• Other Executive KMP: 25%
deferral of STI into share rights for 2 years
• STI deferral has been introduced for all Executive KMP to align with current practice amongst ASX25 companies
• STI deferral also applies to all other Group ExCo members
2 EXECUTIVE KMP REMUNERATION (CONTINUED)
42F
or p
erso
nal u
se o
nly
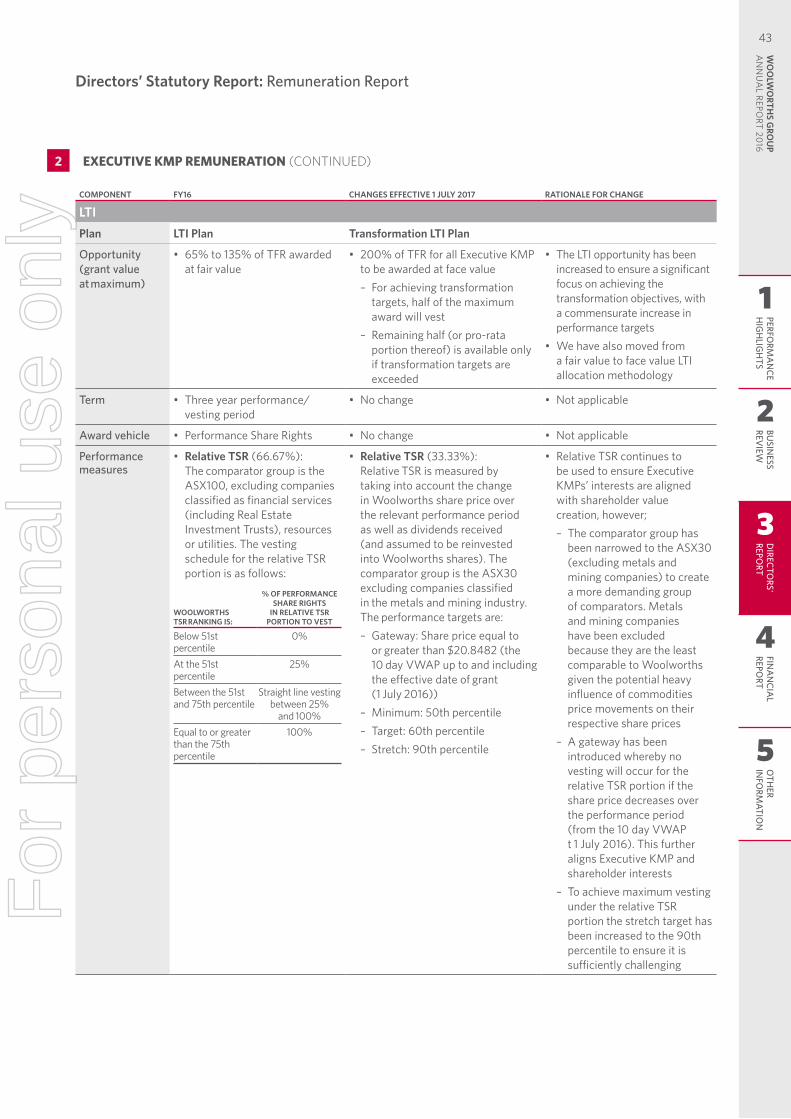
Directors’ Statutory Report: Remuneration Report
COMPONENT FY16 CHANGES EFFECTIVE 1 JULY 2017 RATIONALE FOR CHANGE
LTIPlan LTI Plan Transformation LTI Plan
Opportunity (grant value at maximum)
• 65% to 135% of TFR awarded at fair value
• 200% of TFR for all Executive KMP to be awarded at face value
– For achieving transformation targets, half of the maximum award will vest
– Remaining half (or pro-rata portion thereof) is available only if transformation targets are exceeded
• The LTI opportunity has been increased to ensure a significant focus on achieving the transformation objectives, with a commensurate increase in performance targets
• We have also moved from a fair value to face value LTI allocation methodology
Term • Three year performance/vesting period
• No change • Not applicable
Award vehicle • Performance Share Rights • No change • Not applicable
Performance measures
• Relative TSR (66.67%): The comparator group is the ASX100, excluding companies classified as financial services (including Real Estate Investment Trusts), resources or utilities. The vesting schedule for the relative TSR portion is as follows:
WOOLWORTHS TSR RANKING IS:
% OF PERFORMANCE SHARE RIGHTS
IN RELATIVE TSR PORTION TO VEST
Below 51st percentile
0%
At the 51st percentile
25%
Between the 51st and 75th percentile
Straight line vesting between 25%
and 100%Equal to or greater than the 75th percentile
100%
• Relative TSR (33.33%): Relative TSR is measured by taking into account the change in Woolworths share price over the relevant performance period as well as dividends received (and assumed to be reinvested into Woolworths shares). The comparator group is the ASX30 excluding companies classified in the metals and mining industry. The performance targets are:
– Gateway: Share price equal to or greater than $20.8482 (the 10 day VWAP up to and including the effective date of grant (1 July 2016))
– Minimum: 50th percentile – Target: 60th percentile – Stretch: 90th percentile
• Relative TSR continues to be used to ensure Executive KMPs’ interests are aligned with shareholder value creation, however;
– The comparator group has been narrowed to the ASX30 (excluding metals and mining companies) to create a more demanding group of comparators. Metals and mining companies have been excluded because they are the least comparable to Woolworths given the potential heavy influence of commodities price movements on their respective share prices
– A gateway has been introduced whereby no vesting will occur for the relative TSR portion if the share price decreases over the performance period (from the 10 day VWAP t 1 July 2016). This further aligns Executive KMP and shareholder interests
– To achieve maximum vesting under the relative TSR portion the stretch target has been increased to the 90th percentile to ensure it is sufficiently challenging
2 EXECUTIVE KMP REMUNERATION (CONTINUED)
1
2
3
4
5
PERFORM
AN
CEH
IGH
LIGH
TSBU
SINESS
REVIEW
DIRECTO
RS' REPO
RTFIN
AN
CIAL
REPORT
OTH
ER IN
FORM
ATION
43W
OO
LWO
RTHS G
ROU
P A
NN
UA
L REPORT 20
16
For
per
sona
l use
onl
y
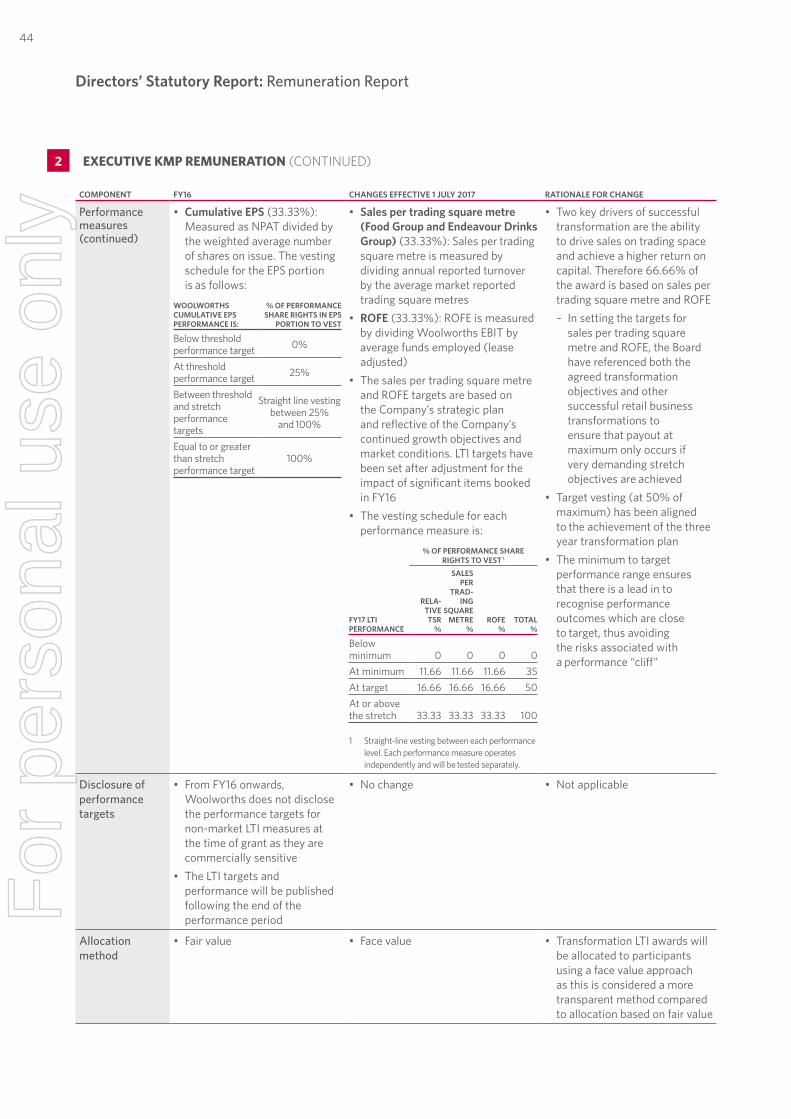
Directors’ Statutory Report: Remuneration Report
COMPONENT FY16 CHANGES EFFECTIVE 1 JULY 2017 RATIONALE FOR CHANGE
Performance measures (continued)
• Cumulative EPS (33.33%): Measured as NPAT divided by the weighted average number of shares on issue. The vesting schedule for the EPS portion is as follows:
WOOLWORTHS CUMULATIVE EPS PERFORMANCE IS:
% OF PERFORMANCE SHARE RIGHTS IN EPS
PORTION TO VEST
Below threshold performance target 0%
At threshold performance target 25%
Between threshold and stretch performance targets
Straight line vesting between 25%
and 100%
Equal to or greater than stretch performance target
100%
• Sales per trading square metre (Food Group and Endeavour Drinks Group) (33.33%): Sales per trading square metre is measured by dividing annual reported turnover by the average market reported trading square metres
• ROFE (33.33%): ROFE is measured by dividing Woolworths EBIT by average funds employed (lease adjusted)
• The sales per trading square metre and ROFE targets are based on the Company’s strategic plan and reflective of the Company’s continued growth objectives and market conditions. LTI targets have been set after adjustment for the impact of significant items booked in FY16
• The vesting schedule for each performance measure is:
% OF PERFORMANCE SHARE RIGHTS TO VEST 1
FY17 LTI PERFORMANCE
RELA-TIVE TSR
%
SALES PER
TRAD-ING
SQUARE METRE
%ROFE
% TOTAL
%
Below minimum 0 0 0 0At minimum 11.66 11.66 11.66 35At target 16.66 16.66 16.66 50At or above the stretch 33.33 33.33 33.33 100
1 Straight-line vesting between each performance level. Each performance measure operates independently and will be tested separately.
• Two key drivers of successful transformation are the ability to drive sales on trading space and achieve a higher return on capital. Therefore 66.66% of the award is based on sales per trading square metre and ROFE
– In setting the targets for sales per trading square metre and ROFE, the Board have referenced both the agreed transformation objectives and other successful retail business transformations to ensure that payout at maximum only occurs if very demanding stretch objectives are achieved
• Target vesting (at 50% of maximum) has been aligned to the achievement of the three year transformation plan
• The minimum to target performance range ensures that there is a lead in to recognise performance outcomes which are close to target, thus avoiding the risks associated with a performance “cliff”
Disclosure of performance targets
• From FY16 onwards, Woolworths does not disclose the performance targets for non-market LTI measures at the time of grant as they are commercially sensitive
• The LTI targets and performance will be published following the end of the performance period
• No change • Not applicable
Allocation method
• Fair value • Face value • Transformation LTI awards will be allocated to participants using a face value approach as this is considered a more transparent method compared to allocation based on fair value
2 EXECUTIVE KMP REMUNERATION (CONTINUED)
44F
or p
erso
nal u
se o
nly
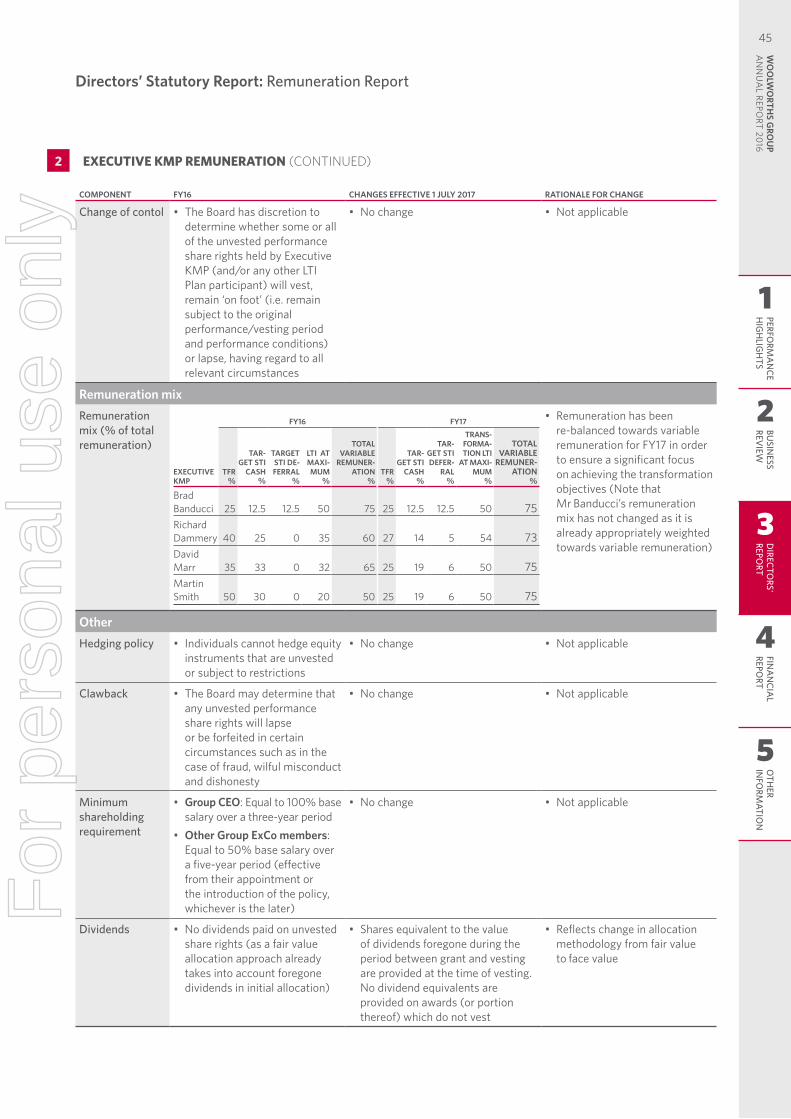
Directors’ Statutory Report: Remuneration Report
COMPONENT FY16 CHANGES EFFECTIVE 1 JULY 2017 RATIONALE FOR CHANGE
Change of contol • The Board has discretion to determine whether some or all of the unvested performance share rights held by Executive KMP (and/or any other LTI Plan participant) will vest, remain ‘on foot’ (i.e. remain subject to the original performance/vesting period and performance conditions) or lapse, having regard to all relevant circumstances
• No change • Not applicable
Remuneration mixRemuneration mix (% of total remuneration)
FY16 FY17
EXECUTIVE KMP
TFR%
TAR-GET STI
CASH%
TARGET STI DE-FERRAL
%
LTI AT MAXI-MUM
%
TOTAL VARIABLE
REMUNER-ATION
%TFR
%
TAR-GET STI
CASH%
TAR-GET STI DEFER-
RAL%
TRANS-FORMA-TION LTI
AT MAXI-MUM
%
TOTAL VARIABLE
REMUNER-ATION
%
Brad Banducci 25 12.5 12.5 50 75 25 12.5 12.5 50 75Richard Dammery 40 25 0 35 60 27 14 5 54 73David Marr 35 33 0 32 65 25 19 6 50 75Martin Smith 50 30 0 20 50 25 19 6 50 75
• Remuneration has been re-balanced towards variable remuneration for FY17 in order to ensure a significant focus on achieving the transformation objectives (Note that Mr Banducci’s remuneration mix has not changed as it is already appropriately weighted towards variable remuneration)
Other Hedging policy • Individuals cannot hedge equity
instruments that are unvested or subject to restrictions
• No change • Not applicable
Clawback • The Board may determine that any unvested performance share rights will lapse or be forfeited in certain circumstances such as in the case of fraud, wilful misconduct and dishonesty
• No change • Not applicable
Minimum shareholding requirement
• Group CEO: Equal to 100% base salary over a three-year period
• Other Group ExCo members: Equal to 50% base salary over a five-year period (effective from their appointment or the introduction of the policy, whichever is the later)
• No change • Not applicable
Dividends • No dividends paid on unvested share rights (as a fair value allocation approach already takes into account foregone dividends in initial allocation)
• Shares equivalent to the value of dividends foregone during the period between grant and vesting are provided at the time of vesting. No dividend equivalents are provided on awards (or portion thereof) which do not vest
• Reflects change in allocation methodology from fair value to face value
2 EXECUTIVE KMP REMUNERATION (CONTINUED)
1
2
3
4
5
PERFORM
AN
CEH
IGH
LIGH
TSBU
SINESS
REVIEW
DIRECTO
RS' REPO
RTFIN
AN
CIAL
REPORT
OTH
ER IN
FORM
ATION
45W
OO
LWO
RTHS G
ROU
P A
NN
UA
L REPORT 20
16
For
per
sona
l use
onl
y
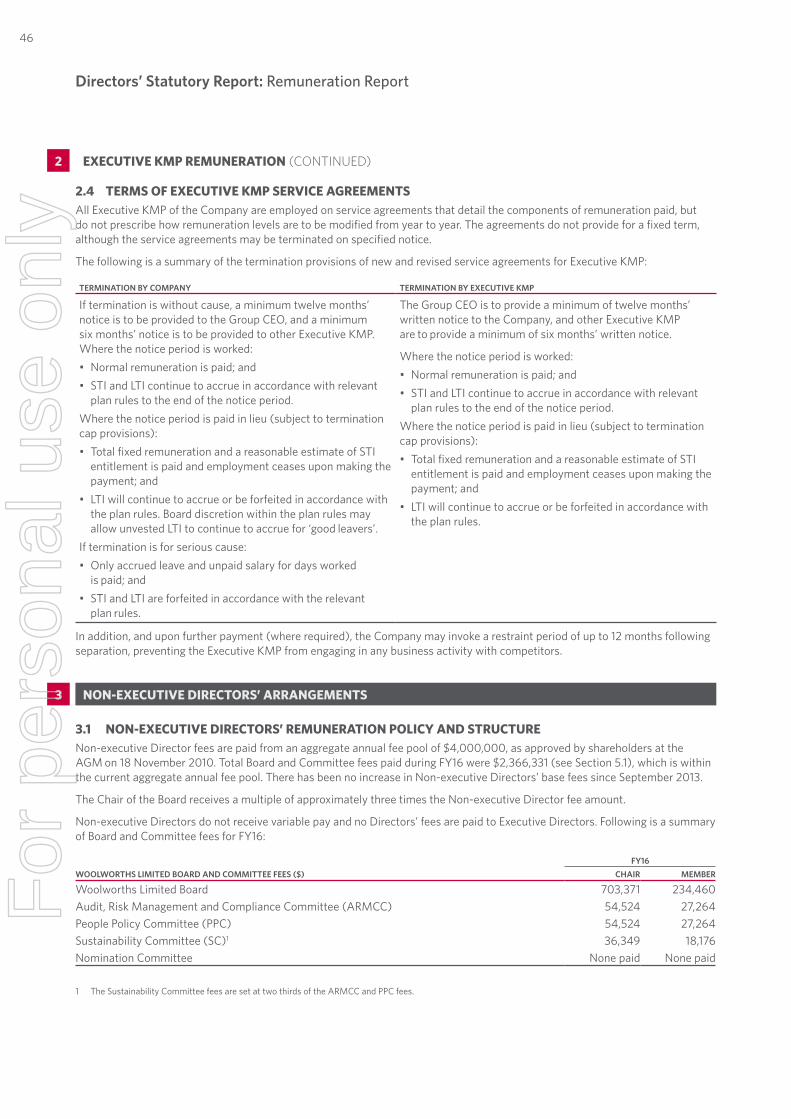
Directors’ Statutory Report: Remuneration Report
2.4 TERMS OF EXECUTIVE KMP SERVICE AGREEMENTSAll Executive KMP of the Company are employed on service agreements that detail the components of remuneration paid, but do not prescribe how remuneration levels are to be modified from year to year. The agreements do not provide for a fixed term, although the service agreements may be terminated on specified notice.
The following is a summary of the termination provisions of new and revised service agreements for Executive KMP:
TERMINATION BY COMPANY TERMINATION BY EXECUTIVE KMP
If termination is without cause, a minimum twelve months’ notice is to be provided to the Group CEO, and a minimum six months’ notice is to be provided to other Executive KMP. Where the notice period is worked:• Normal remuneration is paid; and• STI and LTI continue to accrue in accordance with relevant
plan rules to the end of the notice period.Where the notice period is paid in lieu (subject to termination cap provisions):• Total fixed remuneration and a reasonable estimate of STI
entitlement is paid and employment ceases upon making the payment; and
• LTI will continue to accrue or be forfeited in accordance with the plan rules. Board discretion within the plan rules may allow unvested LTI to continue to accrue for ‘good leavers’.
If termination is for serious cause:• Only accrued leave and unpaid salary for days worked
is paid; and• STI and LTI are forfeited in accordance with the relevant
plan rules.
The Group CEO is to provide a minimum of twelve months’ written notice to the Company, and other Executive KMP are to provide a minimum of six months’ written notice.
Where the notice period is worked:• Normal remuneration is paid; and• STI and LTI continue to accrue in accordance with relevant
plan rules to the end of the notice period.Where the notice period is paid in lieu (subject to termination cap provisions):• Total fixed remuneration and a reasonable estimate of STI
entitlement is paid and employment ceases upon making the payment; and
• LTI will continue to accrue or be forfeited in accordance with the plan rules.
In addition, and upon further payment (where required), the Company may invoke a restraint period of up to 12 months following separation, preventing the Executive KMP from engaging in any business activity with competitors.
3 NON-EXECUTIVE DIRECTORS’ ARRANGEMENTS
3.1 NON-EXECUTIVE DIRECTORS’ REMUNERATION POLICY AND STRUCTURENon-executive Director fees are paid from an aggregate annual fee pool of $4,000,000, as approved by shareholders at the AGM on 18 November 2010. Total Board and Committee fees paid during FY16 were $2,366,331 (see Section 5.1), which is within the current aggregate annual fee pool. There has been no increase in Non-executive Directors’ base fees since September 2013.
The Chair of the Board receives a multiple of approximately three times the Non-executive Director fee amount.
Non-executive Directors do not receive variable pay and no Directors’ fees are paid to Executive Directors. Following is a summary of Board and Committee fees for FY16:
WOOLWORTHS LIMITED BOARD AND COMMITTEE FEES ($)FY16
CHAIR MEMBER
Woolworths Limited Board 703,371 234,460Audit, Risk Management and Compliance Committee (ARMCC) 54,524 27,264People Policy Committee (PPC) 54,524 27,264Sustainability Committee (SC)1 36,349 18,176 Nomination Committee None paid None paid
1 The Sustainability Committee fees are set at two thirds of the ARMCC and PPC fees.
2 EXECUTIVE KMP REMUNERATION (CONTINUED)
46F
or p
erso
nal u
se o
nly
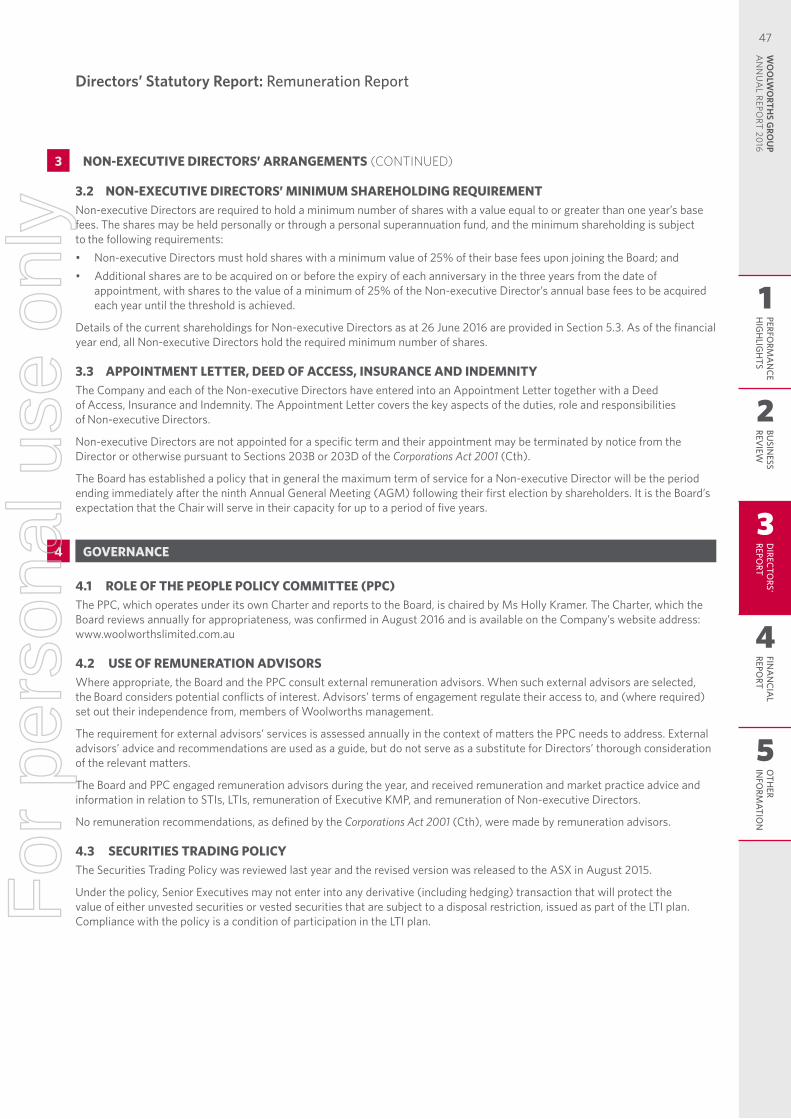
Directors’ Statutory Report: Remuneration Report
3.2 NON-EXECUTIVE DIRECTORS’ MINIMUM SHAREHOLDING REQUIREMENTNon-executive Directors are required to hold a minimum number of shares with a value equal to or greater than one year’s base fees. The shares may be held personally or through a personal superannuation fund, and the minimum shareholding is subject to the following requirements:• Non-executive Directors must hold shares with a minimum value of 25% of their base fees upon joining the Board; and• Additional shares are to be acquired on or before the expiry of each anniversary in the three years from the date of
appointment, with shares to the value of a minimum of 25% of the Non-executive Director’s annual base fees to be acquired each year until the threshold is achieved.
Details of the current shareholdings for Non-executive Directors as at 26 June 2016 are provided in Section 5.3. As of the financial year end, all Non-executive Directors hold the required minimum number of shares.
3.3 APPOINTMENT LETTER, DEED OF ACCESS, INSURANCE AND INDEMNITYThe Company and each of the Non-executive Directors have entered into an Appointment Letter together with a Deed of Access, Insurance and Indemnity. The Appointment Letter covers the key aspects of the duties, role and responsibilities of Non-executive Directors.
Non-executive Directors are not appointed for a specific term and their appointment may be terminated by notice from the Director or otherwise pursuant to Sections 203B or 203D of the Corporations Act 2001 (Cth).
The Board has established a policy that in general the maximum term of service for a Non-executive Director will be the period ending immediately after the ninth Annual General Meeting (AGM) following their first election by shareholders. It is the Board’s expectation that the Chair will serve in their capacity for up to a period of five years.
4 GOVERNANCE
4.1 ROLE OF THE PEOPLE POLICY COMMITTEE (PPC)The PPC, which operates under its own Charter and reports to the Board, is chaired by Ms Holly Kramer. The Charter, which the Board reviews annually for appropriateness, was confirmed in August 2016 and is available on the Company’s website address: www.woolworthslimited.com.au
4.2 USE OF REMUNERATION ADVISORSWhere appropriate, the Board and the PPC consult external remuneration advisors. When such external advisors are selected, the Board considers potential conflicts of interest. Advisors’ terms of engagement regulate their access to, and (where required) set out their independence from, members of Woolworths management.
The requirement for external advisors’ services is assessed annually in the context of matters the PPC needs to address. External advisors’ advice and recommendations are used as a guide, but do not serve as a substitute for Directors’ thorough consideration of the relevant matters.
The Board and PPC engaged remuneration advisors during the year, and received remuneration and market practice advice and information in relation to STIs, LTIs, remuneration of Executive KMP, and remuneration of Non-executive Directors.
No remuneration recommendations, as defined by the Corporations Act 2001 (Cth), were made by remuneration advisors.
4.3 SECURITIES TRADING POLICYThe Securities Trading Policy was reviewed last year and the revised version was released to the ASX in August 2015.
Under the policy, Senior Executives may not enter into any derivative (including hedging) transaction that will protect the value of either unvested securities or vested securities that are subject to a disposal restriction, issued as part of the LTI plan. Compliance with the policy is a condition of participation in the LTI plan.
3 NON-EXECUTIVE DIRECTORS’ ARRANGEMENTS (CONTINUED)
1
2
3
4
5
PERFORM
AN
CEH
IGH
LIGH
TSBU
SINESS
REVIEW
DIRECTO
RS' REPO
RTFIN
AN
CIAL
REPORT
OTH
ER IN
FORM
ATION
47W
OO
LWO
RTHS G
ROU
P A
NN
UA
L REPORT 20
16
For
per
sona
l use
onl
y
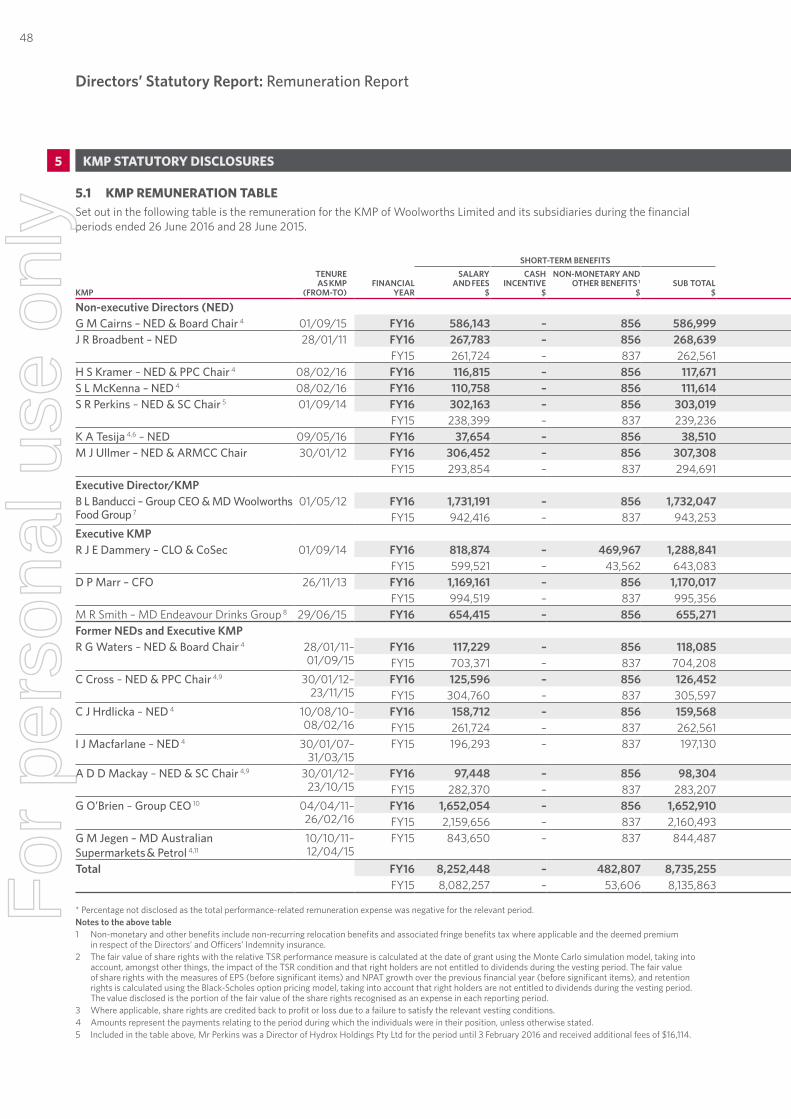
Directors’ Statutory Report: Remuneration Report
5 KMP STATUTORY DISCLOSURES
5.1 KMP REMUNERATION TABLESet out in the following table is the remuneration for the KMP of Woolworths Limited and its subsidiaries during the financial periods ended 26 June 2016 and 28 June 2015.
KMP
TENURE AS KMP
(FROM-TO)FINANCIAL
YEAR
SHORT-TERM BENEFITSPOST EMPLOYMENT
BENEFITSOTHER
LONG-TERM BENEFITSSHARE-BASED
PAYMENTS 2,3
TOTAL$
% OF POTENTIAL CASH INCENTIVE PAID
% RELATED TO PERFORMANCE
SALARY AND FEES
$
CASH INCENTIVE
$
NON-MONETARY AND OTHER BENEFITS 1
$SUB TOTAL
$
SUPERANNUATION AND OTHER
$
LONG SERVICE LEAVE
$
VALUE OF EQUITY
$
Non-executive Directors (NED)G M Cairns – NED & Board Chair 4 01/09/15 FY16 586,143 – 856 586,999 19,308 – – 606,307 – –J R Broadbent – NED 28/01/11 FY16 267,783 – 856 268,639 19,308 – – 287,947 – –
FY15 261,724 – 837 262,561 18,783 – – 281,344 – –H S Kramer – NED & PPC Chair 4 08/02/16 FY16 116,815 – 856 117,671 8,629 – – 126,300 – –S L McKenna – NED 4 08/02/16 FY16 110,758 – 856 111,614 8,485 – – 120,099 – –S R Perkins – NED & SC Chair 5 01/09/14 FY16 302,163 – 856 303,019 19,308 – – 322,327 – –
FY15 238,399 – 837 239,236 15,653 – – 254,889 – –K A Tesija 4,6 – NED 09/05/16 FY16 37,654 – 856 38,510 2,739 – – 41,249 – –M J Ullmer – NED & ARMCC Chair 30/01/12 FY16 306,452 – 856 307,308 19,308 – – 326,616 – –
FY15 293,854 – 837 294,691 18,783 – – 313,474 – –Executive Director/KMPB L Banducci – Group CEO & MD Woolworths Food Group 7
01/05/12 FY16 1,731,191 – 856 1,732,047 114,623 179,458 322,277 2,348,405 – 14%FY15 942,416 – 837 943,253 91,365 78,606 1,064,745 2,177,969 – 49%
Executive KMPR J E Dammery – CLO & CoSec 01/09/14 FY16 818,874 – 469,967 1,288,841 35,000 13,913 220,172 1,557,926 – 14%
FY15 599,521 – 43,562 643,083 30,146 8,875 337,831 1,019,935 – 33%D P Marr – CFO 26/11/13 FY16 1,169,161 – 856 1,170,017 30,000 26,306 438,882 1,665,205 – 26%
FY15 994,519 – 837 995,356 30,000 19,150 484,963 1,529,469 – 32%M R Smith – MD Endeavour Drinks Group 8 29/06/15 FY16 654,415 – 856 655,271 35,000 51,743 (3,538) 738,476 – *Former NEDs and Executive KMPR G Waters – NED & Board Chair 4 28/01/11–
01/09/15FY16 117,229 – 856 118,085 4,827 – – 122,912 – –FY15 703,371 – 837 704,208 18,783 – – 722,991 – –
C Cross – NED & PPC Chair 4,9 30/01/12–23/11/15
FY16 125,596 – 856 126,452 9,204 – – 135,656 – –FY15 304,760 – 837 305,597 18,783 – – 324,380 – –
C J Hrdlicka – NED 4 10/08/10–08/02/16
FY16 158,712 – 856 159,568 12,300 – – 171,868 – –FY15 261,724 – 837 262,561 18,783 – – 281,344 – –
I J Macfarlane – NED 4 30/01/07–31/03/15
FY15 196,293 – 837 197,130 14,088 – – 211,218 – –
A D D Mackay – NED & SC Chair 4,9 30/01/12–23/10/15
FY16 97,448 – 856 98,304 6,746 – – 105,050 – –FY15 282,370 – 837 283,207 18,783 – – 301,990 – –
G O’Brien – Group CEO 10 04/04/11–26/02/16
FY16 1,652,054 – 856 1,652,910 446,000 – – 2,098,910 – –FY15 2,159,656 – 837 2,160,493 435,000 74,672 (1,258,687) 1,411,478 – *
G M Jegen – MD Australian Supermarkets & Petrol 4,11
10/10/11– 12/04/15
FY15 843,650 – 837 844,487 23,409 (45,847) (270,066) 551,983 – *
Total FY16 8,252,448 – 482,807 8,735,255 790,785 271,420 977,793 10,775,253 – –FY15 8,082,257 – 53,606 8,135,863 752,359 135,456 358,786 9,382,464 – –
* Percentage not disclosed as the total performance-related remuneration expense was negative for the relevant period.Notes to the above table1 Non-monetary and other benefits include non-recurring relocation benefits and associated fringe benefits tax where applicable and the deemed premium
in respect of the Directors’ and Officers’ Indemnity insurance.2 The fair value of share rights with the relative TSR performance measure is calculated at the date of grant using the Monte Carlo simulation model, taking into
account, amongst other things, the impact of the TSR condition and that right holders are not entitled to dividends during the vesting period. The fair value of share rights with the measures of EPS (before significant items) and NPAT growth over the previous financial year (before significant items), and retention rights is calculated using the Black-Scholes option pricing model, taking into account that right holders are not entitled to dividends during the vesting period. The value disclosed is the portion of the fair value of the share rights recognised as an expense in each reporting period.
3 Where applicable, share rights are credited back to profit or loss due to a failure to satisfy the relevant vesting conditions.4 Amounts represent the payments relating to the period during which the individuals were in their position, unless otherwise stated.5 Included in the table above, Mr Perkins was a Director of Hydrox Holdings Pty Ltd for the period until 3 February 2016 and received additional fees of $16,114.
48F
or p
erso
nal u
se o
nly
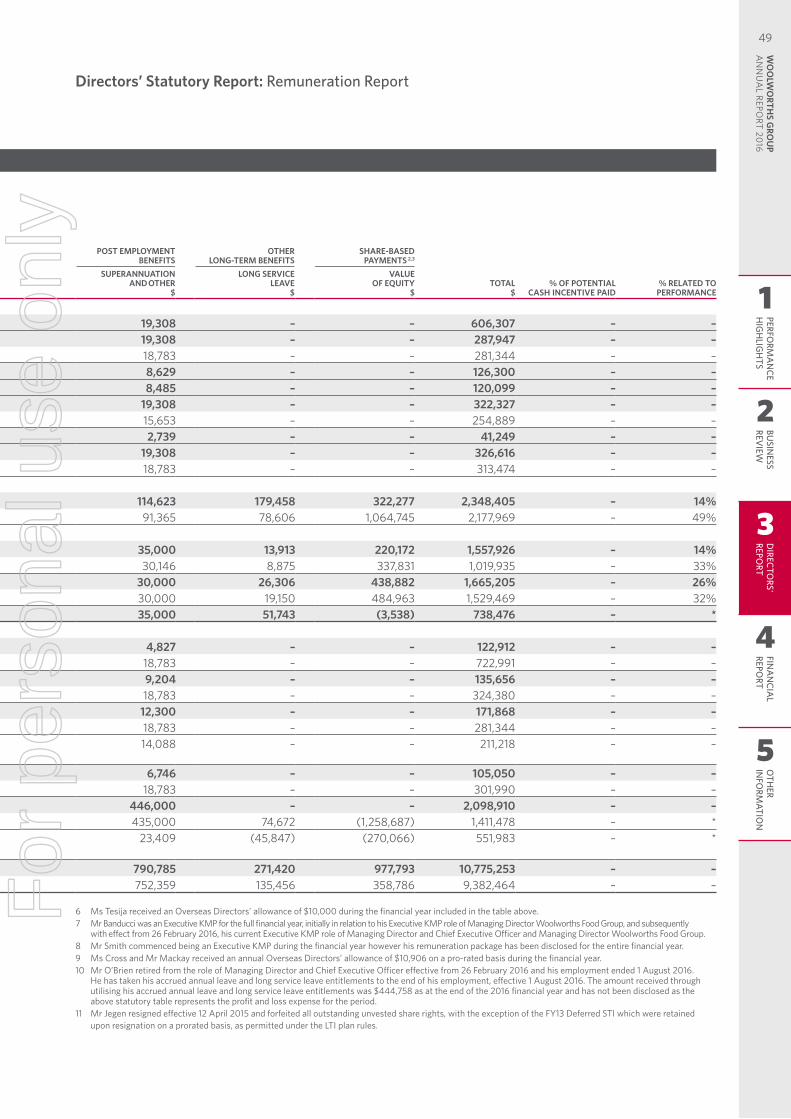
Directors’ Statutory Report: Remuneration Report
6 Ms Tesija received an Overseas Directors’ allowance of $10,000 during the financial year included in the table above. 7 Mr Banducci was an Executive KMP for the full financial year, initially in relation to his Executive KMP role of Managing Director Woolworths Food Group, and subsequently
with effect from 26 February 2016, his current Executive KMP role of Managing Director and Chief Executive Officer and Managing Director Woolworths Food Group.8 Mr Smith commenced being an Executive KMP during the financial year however his remuneration package has been disclosed for the entire financial year.9 Ms Cross and Mr Mackay received an annual Overseas Directors’ allowance of $10,906 on a pro-rated basis during the financial year.10 Mr O’Brien retired from the role of Managing Director and Chief Executive Officer effective from 26 February 2016 and his employment ended 1 August 2016.
He has taken his accrued annual leave and long service leave entitlements to the end of his employment, effective 1 August 2016. The amount received through utilising his accrued annual leave and long service leave entitlements was $444,758 as at the end of the 2016 financial year and has not been disclosed as the above statutory table represents the profit and loss expense for the period.
11 Mr Jegen resigned effective 12 April 2015 and forfeited all outstanding unvested share rights, with the exception of the FY13 Deferred STI which were retained upon resignation on a prorated basis, as permitted under the LTI plan rules.
5 KMP STATUTORY DISCLOSURES
5.1 KMP REMUNERATION TABLESet out in the following table is the remuneration for the KMP of Woolworths Limited and its subsidiaries during the financial periods ended 26 June 2016 and 28 June 2015.
KMP
TENURE AS KMP
(FROM-TO)FINANCIAL
YEAR
SHORT-TERM BENEFITSPOST EMPLOYMENT
BENEFITSOTHER
LONG-TERM BENEFITSSHARE-BASED
PAYMENTS 2,3
TOTAL$
% OF POTENTIAL CASH INCENTIVE PAID
% RELATED TO PERFORMANCE
SALARY AND FEES
$
CASH INCENTIVE
$
NON-MONETARY AND OTHER BENEFITS 1
$SUB TOTAL
$
SUPERANNUATION AND OTHER
$
LONG SERVICE LEAVE
$
VALUE OF EQUITY
$
Non-executive Directors (NED)G M Cairns – NED & Board Chair 4 01/09/15 FY16 586,143 – 856 586,999 19,308 – – 606,307 – –J R Broadbent – NED 28/01/11 FY16 267,783 – 856 268,639 19,308 – – 287,947 – –
FY15 261,724 – 837 262,561 18,783 – – 281,344 – –H S Kramer – NED & PPC Chair 4 08/02/16 FY16 116,815 – 856 117,671 8,629 – – 126,300 – –S L McKenna – NED 4 08/02/16 FY16 110,758 – 856 111,614 8,485 – – 120,099 – –S R Perkins – NED & SC Chair 5 01/09/14 FY16 302,163 – 856 303,019 19,308 – – 322,327 – –
FY15 238,399 – 837 239,236 15,653 – – 254,889 – –K A Tesija 4,6 – NED 09/05/16 FY16 37,654 – 856 38,510 2,739 – – 41,249 – –M J Ullmer – NED & ARMCC Chair 30/01/12 FY16 306,452 – 856 307,308 19,308 – – 326,616 – –
FY15 293,854 – 837 294,691 18,783 – – 313,474 – –Executive Director/KMPB L Banducci – Group CEO & MD Woolworths Food Group 7
01/05/12 FY16 1,731,191 – 856 1,732,047 114,623 179,458 322,277 2,348,405 – 14%FY15 942,416 – 837 943,253 91,365 78,606 1,064,745 2,177,969 – 49%
Executive KMPR J E Dammery – CLO & CoSec 01/09/14 FY16 818,874 – 469,967 1,288,841 35,000 13,913 220,172 1,557,926 – 14%
FY15 599,521 – 43,562 643,083 30,146 8,875 337,831 1,019,935 – 33%D P Marr – CFO 26/11/13 FY16 1,169,161 – 856 1,170,017 30,000 26,306 438,882 1,665,205 – 26%
FY15 994,519 – 837 995,356 30,000 19,150 484,963 1,529,469 – 32%M R Smith – MD Endeavour Drinks Group 8 29/06/15 FY16 654,415 – 856 655,271 35,000 51,743 (3,538) 738,476 – *Former NEDs and Executive KMPR G Waters – NED & Board Chair 4 28/01/11–
01/09/15FY16 117,229 – 856 118,085 4,827 – – 122,912 – –FY15 703,371 – 837 704,208 18,783 – – 722,991 – –
C Cross – NED & PPC Chair 4,9 30/01/12–23/11/15
FY16 125,596 – 856 126,452 9,204 – – 135,656 – –FY15 304,760 – 837 305,597 18,783 – – 324,380 – –
C J Hrdlicka – NED 4 10/08/10–08/02/16
FY16 158,712 – 856 159,568 12,300 – – 171,868 – –FY15 261,724 – 837 262,561 18,783 – – 281,344 – –
I J Macfarlane – NED 4 30/01/07–31/03/15
FY15 196,293 – 837 197,130 14,088 – – 211,218 – –
A D D Mackay – NED & SC Chair 4,9 30/01/12–23/10/15
FY16 97,448 – 856 98,304 6,746 – – 105,050 – –FY15 282,370 – 837 283,207 18,783 – – 301,990 – –
G O’Brien – Group CEO 10 04/04/11–26/02/16
FY16 1,652,054 – 856 1,652,910 446,000 – – 2,098,910 – –FY15 2,159,656 – 837 2,160,493 435,000 74,672 (1,258,687) 1,411,478 – *
G M Jegen – MD Australian Supermarkets & Petrol 4,11
10/10/11– 12/04/15
FY15 843,650 – 837 844,487 23,409 (45,847) (270,066) 551,983 – *
Total FY16 8,252,448 – 482,807 8,735,255 790,785 271,420 977,793 10,775,253 – –FY15 8,082,257 – 53,606 8,135,863 752,359 135,456 358,786 9,382,464 – –
* Percentage not disclosed as the total performance-related remuneration expense was negative for the relevant period.Notes to the above table1 Non-monetary and other benefits include non-recurring relocation benefits and associated fringe benefits tax where applicable and the deemed premium
in respect of the Directors’ and Officers’ Indemnity insurance.2 The fair value of share rights with the relative TSR performance measure is calculated at the date of grant using the Monte Carlo simulation model, taking into
account, amongst other things, the impact of the TSR condition and that right holders are not entitled to dividends during the vesting period. The fair value of share rights with the measures of EPS (before significant items) and NPAT growth over the previous financial year (before significant items), and retention rights is calculated using the Black-Scholes option pricing model, taking into account that right holders are not entitled to dividends during the vesting period. The value disclosed is the portion of the fair value of the share rights recognised as an expense in each reporting period.
3 Where applicable, share rights are credited back to profit or loss due to a failure to satisfy the relevant vesting conditions.4 Amounts represent the payments relating to the period during which the individuals were in their position, unless otherwise stated.5 Included in the table above, Mr Perkins was a Director of Hydrox Holdings Pty Ltd for the period until 3 February 2016 and received additional fees of $16,114.
1
2
3
4
5
PERFORM
AN
CEH
IGH
LIGH
TSBU
SINESS
REVIEW
DIRECTO
RS' REPO
RTFIN
AN
CIAL
REPORT
OTH
ER IN
FORM
ATION
49W
OO
LWO
RTHS G
ROU
P A
NN
UA
L REPORT 20
16
For
per
sona
l use
onl
y
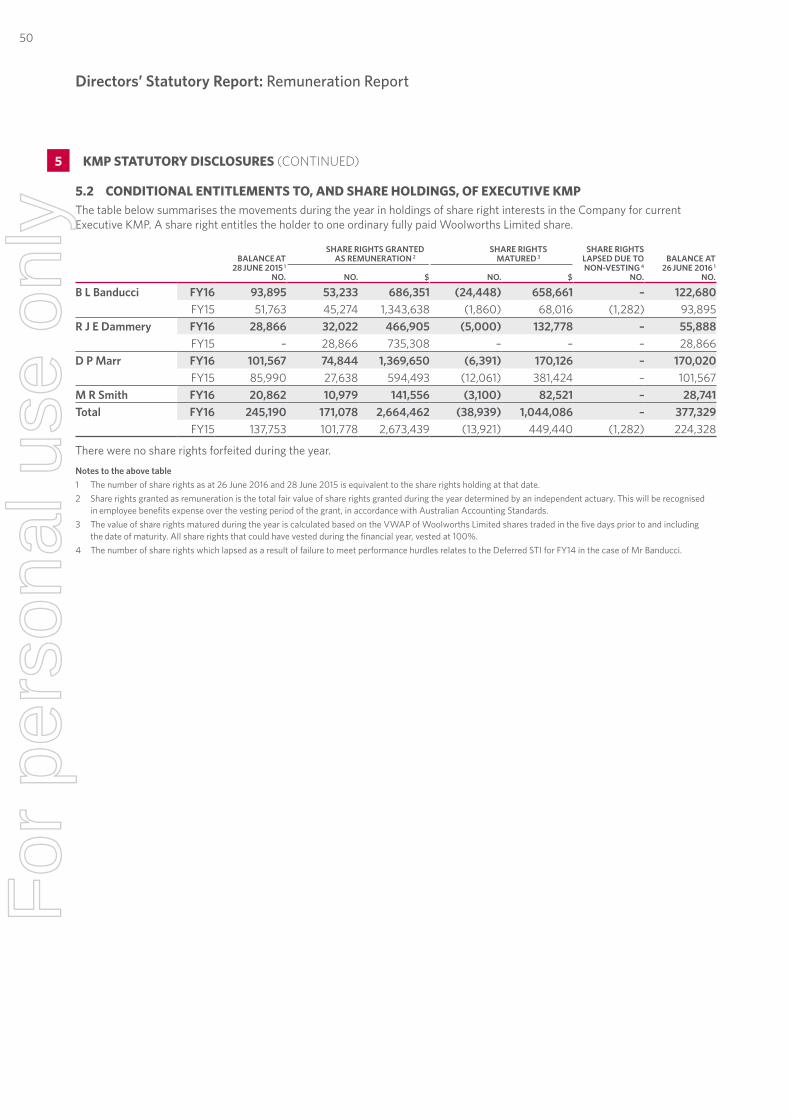
Directors’ Statutory Report: Remuneration Report
5.2 CONDITIONAL ENTITLEMENTS TO, AND SHARE HOLDINGS, OF EXECUTIVE KMPThe table below summarises the movements during the year in holdings of share right interests in the Company for current Executive KMP. A share right entitles the holder to one ordinary fully paid Woolworths Limited share.
BALANCE AT 28 JUNE 2015 1
NO.
SHARE RIGHTS GRANTED AS REMUNERATION 2
SHARE RIGHTSMATURED 3
SHARE RIGHTS LAPSED DUE TO NON-VESTING 4
NO.
BALANCE AT 26 JUNE 2016 1
NO.NO. $ NO. $
B L Banducci FY16 93,895 53,233 686,351 (24,448) 658,661 – 122,680FY15 51,763 45,274 1,343,638 (1,860) 68,016 (1,282) 93,895
R J E Dammery FY16 28,866 32,022 466,905 (5,000) 132,778 – 55,888FY15 – 28,866 735,308 – – – 28,866
D P Marr FY16 101,567 74,844 1,369,650 (6,391) 170,126 – 170,020FY15 85,990 27,638 594,493 (12,061) 381,424 – 101,567
M R Smith FY16 20,862 10,979 141,556 (3,100) 82,521 – 28,741Total FY16 245,190 171,078 2,664,462 (38,939) 1,044,086 – 377,329
FY15 137,753 101,778 2,673,439 (13,921) 449,440 (1,282) 224,328
There were no share rights forfeited during the year.
Notes to the above table1 The number of share rights as at 26 June 2016 and 28 June 2015 is equivalent to the share rights holding at that date. 2 Share rights granted as remuneration is the total fair value of share rights granted during the year determined by an independent actuary. This will be recognised
in employee benefits expense over the vesting period of the grant, in accordance with Australian Accounting Standards.3 The value of share rights matured during the year is calculated based on the VWAP of Woolworths Limited shares traded in the five days prior to and including
the date of maturity. All share rights that could have vested during the financial year, vested at 100%.4 The number of share rights which lapsed as a result of failure to meet performance hurdles relates to the Deferred STI for FY14 in the case of Mr Banducci.
5 KMP STATUTORY DISCLOSURES (CONTINUED)
50F
or p
erso
nal u
se o
nly
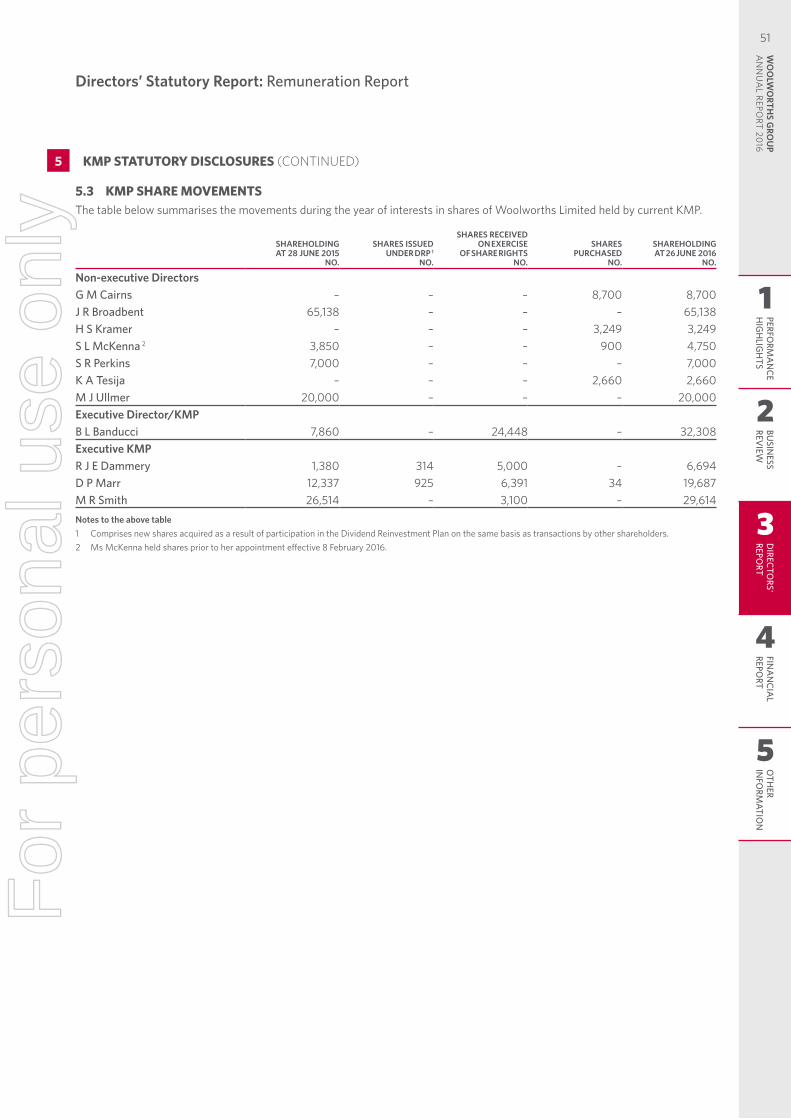
Directors’ Statutory Report: Remuneration Report
5.3 KMP SHARE MOVEMENTS The table below summarises the movements during the year of interests in shares of Woolworths Limited held by current KMP.
SHAREHOLDING AT 28 JUNE 2015
NO.
SHARES ISSUED UNDER DRP 1
NO.
SHARES RECEIVED ON EXERCISE
OF SHARE RIGHTSNO.
SHARES PURCHASED
NO.
SHAREHOLDING AT 26 JUNE 2016
NO.
Non-executive DirectorsG M Cairns – – – 8,700 8,700J R Broadbent 65,138 – – – 65,138H S Kramer – – – 3,249 3,249S L McKenna 2 3,850 – – 900 4,750S R Perkins 7,000 – – – 7,000K A Tesija – – – 2,660 2,660M J Ullmer 20,000 – – – 20,000Executive Director/KMPB L Banducci 7,860 – 24,448 – 32,308Executive KMPR J E Dammery 1,380 314 5,000 – 6,694D P Marr 12,337 925 6,391 34 19,687M R Smith 26,514 – 3,100 – 29,614Notes to the above table1 Comprises new shares acquired as a result of participation in the Dividend Reinvestment Plan on the same basis as transactions by other shareholders.2 Ms McKenna held shares prior to her appointment effective 8 February 2016.
5 KMP STATUTORY DISCLOSURES (CONTINUED)
1
2
3
4
5
PERFORM
AN
CEH
IGH
LIGH
TSBU
SINESS
REVIEW
DIRECTO
RS' REPO
RTFIN
AN
CIAL
REPORT
OTH
ER IN
FORM
ATION
51W
OO
LWO
RTHS G
ROU
P A
NN
UA
L REPORT 20
16
For
per
sona
l use
onl
y
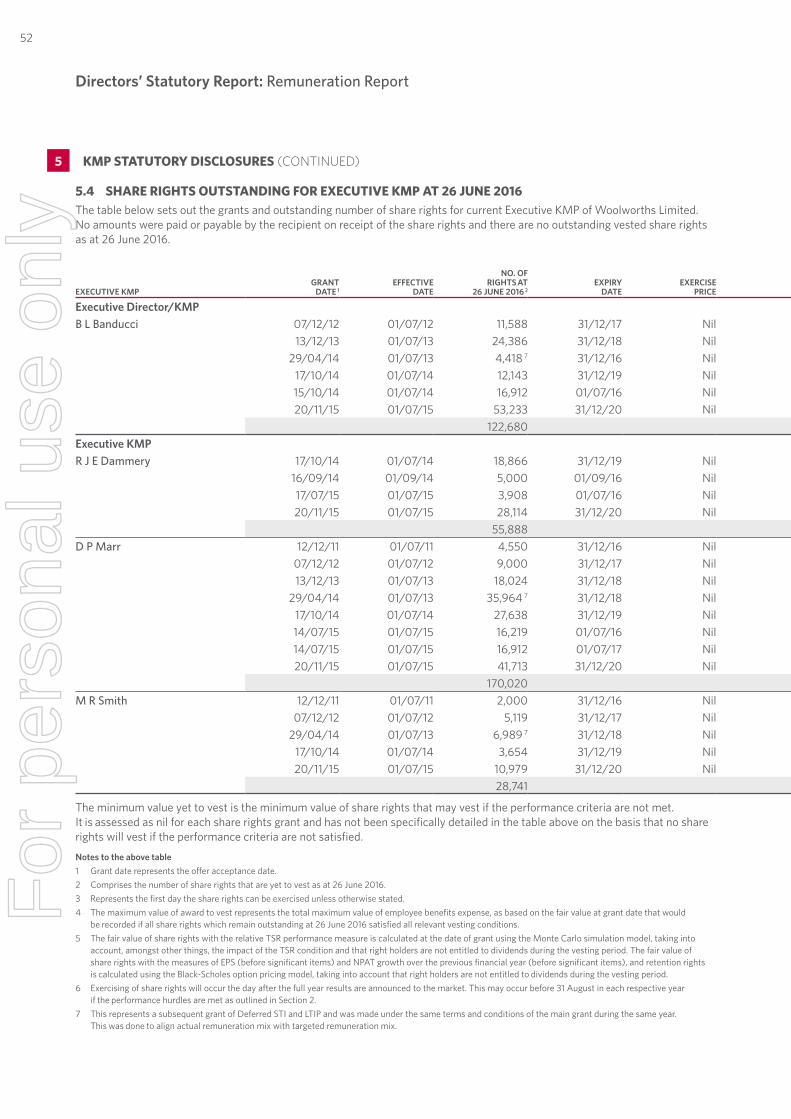
Directors’ Statutory Report: Remuneration Report
5.4 SHARE RIGHTS OUTSTANDING FOR EXECUTIVE KMP AT 26 JUNE 2016The table below sets out the grants and outstanding number of share rights for current Executive KMP of Woolworths Limited. No amounts were paid or payable by the recipient on receipt of the share rights and there are no outstanding vested share rights as at 26 June 2016.
EXECUTIVE KMPGRANT
DATE 1EFFECTIVE
DATE
NO. OF RIGHTS AT
26 JUNE 2016 2EXPIRY
DATEEXERCISE
PRICE EXERCISE
DATE 3
MAXIMUM VALUE OF AWARD TO
VEST ($) 4
FAIR VALUE PER PERFORMANCE RIGHT 5
EPS TSR NPAT RETENTION
Executive Director/KMPB L Banducci 07/12/12 01/07/12 11,588 31/12/17 Nil 31/08/17 6 212,292 $22.60 $14.04 – –
13/12/13 01/07/13 24,386 31/12/18 Nil 31/08/18 6 475,771 $25.56 $13.46 – –29/04/14 01/07/13 4,418 7 31/12/16 Nil 31/08/16 6 149,505 – – $33.84 –
17/10/14 01/07/14 12,143 31/12/19 Nil 31/08/17 6 261,196 $29.78 $13.24 – –15/10/14 01/07/14 16,912 01/07/16 Nil 01/07/16 537,971 – – – $31.8120/11/15 01/07/15 53,233 31/12/20 Nil 31/08/18 6 686,351 $19.66 $9.51 – –
122,680 2,323,086Executive KMPR J E Dammery 17/10/14 01/07/14 18,866 31/12/19 Nil 31/08/17 6 405,808 $29.78 $13.24 – –
16/09/14 01/09/14 5,000 01/09/16 Nil 01/09/16 158,050 – – – $31.6117/07/15 01/07/15 3,908 01/07/16 Nil 01/07/16 104,422 – – – $26.7220/11/15 01/07/15 28,114 31/12/20 Nil 31/08/18 6 362,483 $19.66 $9.51 – –
55,888 1,030,763D P Marr 12/12/11 01/07/11 4,550 31/12/16 Nil 31/08/16 6 73,665 $20.05 $12.33 – –
07/12/12 01/07/12 9,000 31/12/17 Nil 31/08/17 6 164,880 $22.60 $14.04 – –13/12/13 01/07/13 18,024 31/12/18 Nil 31/08/18 6 351,648 $25.56 $13.46 – –
29/04/14 01/07/13 35,964 7 31/12/18 Nil 31/08/18 6 889,570 $30.39 $19.08 – –17/10/14 01/07/14 27,638 31/12/19 Nil 31/08/17 6 594,493 $29.78 $13.24 – –14/07/15 01/07/15 16,219 01/07/16 Nil 01/07/16 421,207 – – – $25.9714/07/15 01/07/15 16,912 01/07/17 Nil 01/07/17 410,623 – – – $24.2820/11/15 01/07/15 41,713 31/12/20 Nil 31/08/18 6 537,820 $19.66 $9.51 – –
170,020 3,443,906M R Smith 12/12/11 01/07/11 2,000 31/12/16 Nil 31/08/16 6 32,380 $20.05 $12.33 – –
07/12/12 01/07/12 5,119 31/12/17 Nil 31/08/17 6 93,780 $22.60 $14.04 – –29/04/14 01/07/13 6,989 7 31/12/18 Nil 31/08/18 6 172,873 $30.39 $19.08 – –
17/10/14 01/07/14 3,654 31/12/19 Nil 31/08/17 6 78,598 $29.78 $13.24 – –20/11/15 01/07/15 10,979 31/12/20 Nil 31/08/18 6 141,556 $19.66 $9.51 – –
28,741 519,187
The minimum value yet to vest is the minimum value of share rights that may vest if the performance criteria are not met. It is assessed as nil for each share rights grant and has not been specifically detailed in the table above on the basis that no share rights will vest if the performance criteria are not satisfied.
Notes to the above table1 Grant date represents the offer acceptance date.2 Comprises the number of share rights that are yet to vest as at 26 June 2016.3 Represents the first day the share rights can be exercised unless otherwise stated.4 The maximum value of award to vest represents the total maximum value of employee benefits expense, as based on the fair value at grant date that would
be recorded if all share rights which remain outstanding at 26 June 2016 satisfied all relevant vesting conditions.5 The fair value of share rights with the relative TSR performance measure is calculated at the date of grant using the Monte Carlo simulation model, taking into
account, amongst other things, the impact of the TSR condition and that right holders are not entitled to dividends during the vesting period. The fair value of share rights with the measures of EPS (before significant items) and NPAT growth over the previous financial year (before significant items), and retention rights is calculated using the Black-Scholes option pricing model, taking into account that right holders are not entitled to dividends during the vesting period.
6 Exercising of share rights will occur the day after the full year results are announced to the market. This may occur before 31 August in each respective year if the performance hurdles are met as outlined in Section 2.
7 This represents a subsequent grant of Deferred STI and LTIP and was made under the same terms and conditions of the main grant during the same year. This was done to align actual remuneration mix with targeted remuneration mix.
5 KMP STATUTORY DISCLOSURES (CONTINUED)
52F
or p
erso
nal u
se o
nly
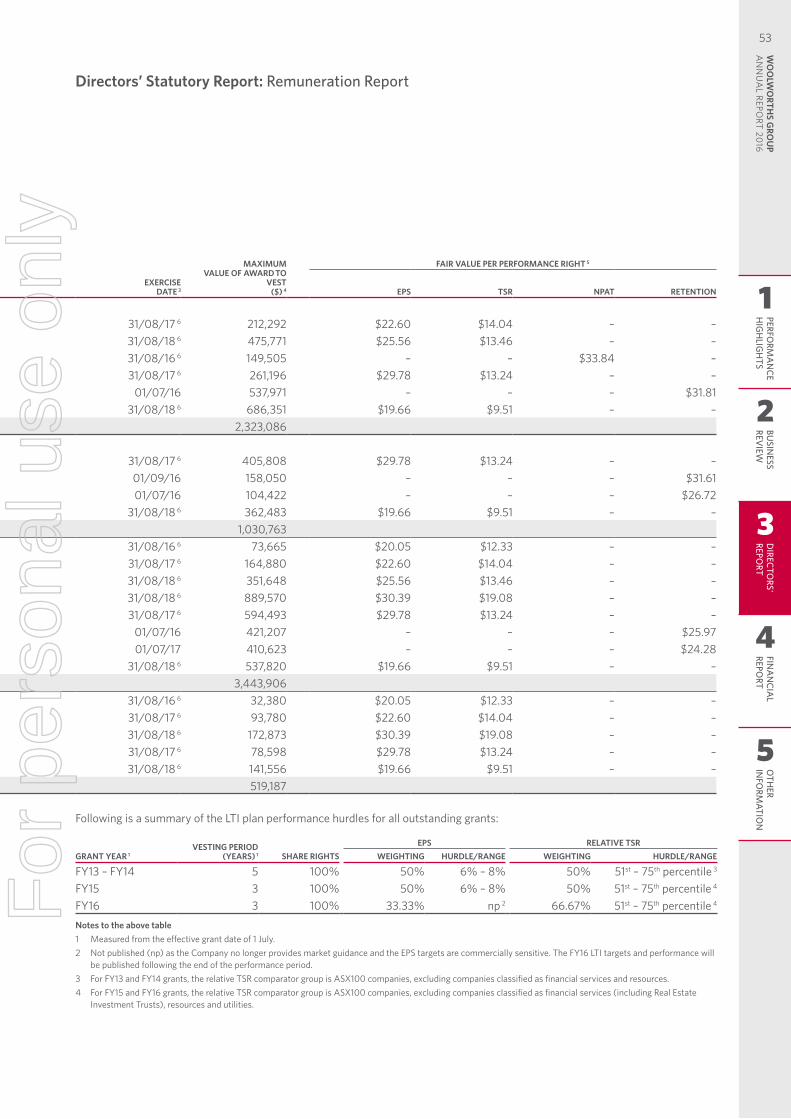
Directors’ Statutory Report: Remuneration Report
Following is a summary of the LTI plan performance hurdles for all outstanding grants:
GRANT YEAR 1VESTING PERIOD
(YEARS) 1 SHARE RIGHTSEPS RELATIVE TSR
WEIGHTING HURDLE/RANGE WEIGHTING HURDLE/RANGE
FY13 – FY14 5 100% 50% 6% – 8% 50% 51st – 75th percentile 3
FY15 3 100% 50% 6% – 8% 50% 51st – 75th percentile 4
FY16 3 100% 33.33% np 2 66.67% 51st – 75th percentile 4
Notes to the above table1 Measured from the effective grant date of 1 July.2 Not published (np) as the Company no longer provides market guidance and the EPS targets are commercially sensitive. The FY16 LTI targets and performance will
be published following the end of the performance period.3 For FY13 and FY14 grants, the relative TSR comparator group is ASX100 companies, excluding companies classified as financial services and resources.4 For FY15 and FY16 grants, the relative TSR comparator group is ASX100 companies, excluding companies classified as financial services (including Real Estate
Investment Trusts), resources and utilities.
5.4 SHARE RIGHTS OUTSTANDING FOR EXECUTIVE KMP AT 26 JUNE 2016The table below sets out the grants and outstanding number of share rights for current Executive KMP of Woolworths Limited. No amounts were paid or payable by the recipient on receipt of the share rights and there are no outstanding vested share rights as at 26 June 2016.
EXECUTIVE KMPGRANT
DATE 1EFFECTIVE
DATE
NO. OF RIGHTS AT
26 JUNE 2016 2EXPIRY
DATEEXERCISE
PRICE EXERCISE
DATE 3
MAXIMUM VALUE OF AWARD TO
VEST ($) 4
FAIR VALUE PER PERFORMANCE RIGHT 5
EPS TSR NPAT RETENTION
Executive Director/KMPB L Banducci 07/12/12 01/07/12 11,588 31/12/17 Nil 31/08/17 6 212,292 $22.60 $14.04 – –
13/12/13 01/07/13 24,386 31/12/18 Nil 31/08/18 6 475,771 $25.56 $13.46 – –29/04/14 01/07/13 4,418 7 31/12/16 Nil 31/08/16 6 149,505 – – $33.84 –
17/10/14 01/07/14 12,143 31/12/19 Nil 31/08/17 6 261,196 $29.78 $13.24 – –15/10/14 01/07/14 16,912 01/07/16 Nil 01/07/16 537,971 – – – $31.8120/11/15 01/07/15 53,233 31/12/20 Nil 31/08/18 6 686,351 $19.66 $9.51 – –
122,680 2,323,086Executive KMPR J E Dammery 17/10/14 01/07/14 18,866 31/12/19 Nil 31/08/17 6 405,808 $29.78 $13.24 – –
16/09/14 01/09/14 5,000 01/09/16 Nil 01/09/16 158,050 – – – $31.6117/07/15 01/07/15 3,908 01/07/16 Nil 01/07/16 104,422 – – – $26.7220/11/15 01/07/15 28,114 31/12/20 Nil 31/08/18 6 362,483 $19.66 $9.51 – –
55,888 1,030,763D P Marr 12/12/11 01/07/11 4,550 31/12/16 Nil 31/08/16 6 73,665 $20.05 $12.33 – –
07/12/12 01/07/12 9,000 31/12/17 Nil 31/08/17 6 164,880 $22.60 $14.04 – –13/12/13 01/07/13 18,024 31/12/18 Nil 31/08/18 6 351,648 $25.56 $13.46 – –
29/04/14 01/07/13 35,964 7 31/12/18 Nil 31/08/18 6 889,570 $30.39 $19.08 – –17/10/14 01/07/14 27,638 31/12/19 Nil 31/08/17 6 594,493 $29.78 $13.24 – –14/07/15 01/07/15 16,219 01/07/16 Nil 01/07/16 421,207 – – – $25.9714/07/15 01/07/15 16,912 01/07/17 Nil 01/07/17 410,623 – – – $24.2820/11/15 01/07/15 41,713 31/12/20 Nil 31/08/18 6 537,820 $19.66 $9.51 – –
170,020 3,443,906M R Smith 12/12/11 01/07/11 2,000 31/12/16 Nil 31/08/16 6 32,380 $20.05 $12.33 – –
07/12/12 01/07/12 5,119 31/12/17 Nil 31/08/17 6 93,780 $22.60 $14.04 – –29/04/14 01/07/13 6,989 7 31/12/18 Nil 31/08/18 6 172,873 $30.39 $19.08 – –
17/10/14 01/07/14 3,654 31/12/19 Nil 31/08/17 6 78,598 $29.78 $13.24 – –20/11/15 01/07/15 10,979 31/12/20 Nil 31/08/18 6 141,556 $19.66 $9.51 – –
28,741 519,187
The minimum value yet to vest is the minimum value of share rights that may vest if the performance criteria are not met. It is assessed as nil for each share rights grant and has not been specifically detailed in the table above on the basis that no share rights will vest if the performance criteria are not satisfied.
Notes to the above table1 Grant date represents the offer acceptance date.2 Comprises the number of share rights that are yet to vest as at 26 June 2016.3 Represents the first day the share rights can be exercised unless otherwise stated.4 The maximum value of award to vest represents the total maximum value of employee benefits expense, as based on the fair value at grant date that would
be recorded if all share rights which remain outstanding at 26 June 2016 satisfied all relevant vesting conditions.5 The fair value of share rights with the relative TSR performance measure is calculated at the date of grant using the Monte Carlo simulation model, taking into
account, amongst other things, the impact of the TSR condition and that right holders are not entitled to dividends during the vesting period. The fair value of share rights with the measures of EPS (before significant items) and NPAT growth over the previous financial year (before significant items), and retention rights is calculated using the Black-Scholes option pricing model, taking into account that right holders are not entitled to dividends during the vesting period.
6 Exercising of share rights will occur the day after the full year results are announced to the market. This may occur before 31 August in each respective year if the performance hurdles are met as outlined in Section 2.
7 This represents a subsequent grant of Deferred STI and LTIP and was made under the same terms and conditions of the main grant during the same year. This was done to align actual remuneration mix with targeted remuneration mix.
1
2
3
4
5
PERFORM
AN
CEH
IGH
LIGH
TSBU
SINESS
REVIEW
DIRECTO
RS' REPO
RTFIN
AN
CIAL
REPORT
OTH
ER IN
FORM
ATION
53W
OO
LWO
RTHS G
ROU
P A
NN
UA
L REPORT 20
16
For
per
sona
l use
onl
y
Auditor’s Independence Declaration
The Board of DirectorsWoolworths Limited1 Woolworths WayBella VistaNSW 2153
9 September 2016
Dear Board Members
Woolworths Limited
In accordance with section 307C of the Corporations Act 2001, I am pleased to provide the following declaration of independence to the Directors of Woolworths Limited.
As lead audit partner for the audit of the financial statements of Woolworths Limited for the financial year ended 26 June 2016, I declare that to the best of my knowledge and belief, there have been no contraventions of:
(i) the auditor independence requirements of the Corporations Act 2001 in relation to the audit; and
(ii) any applicable code of professional conduct in relation to the audit.
Yours sincerely
DELOITTE TOUCHE TOHMATSU
G CouttasPartnerChartered Accountants
Deloitte Touche Tohmatsu A.C.N. 74 490 121 060Grosvenor Place 225 George Street Sydney NSW 2000 PO Box N250 Grosvenor Place Sydney NSW 1217 AustraliaDX 10307SSE Tel: +61 (0) 2 9322 7000 Fax: +61 (0) 2 9322 7001www.deloitte.com.au
Liability limited by a scheme approved under Professional Standards Legislation.Member of Deloitte Touche Tohmatsu Limited
54F
or p
erso
nal u
se o
nly
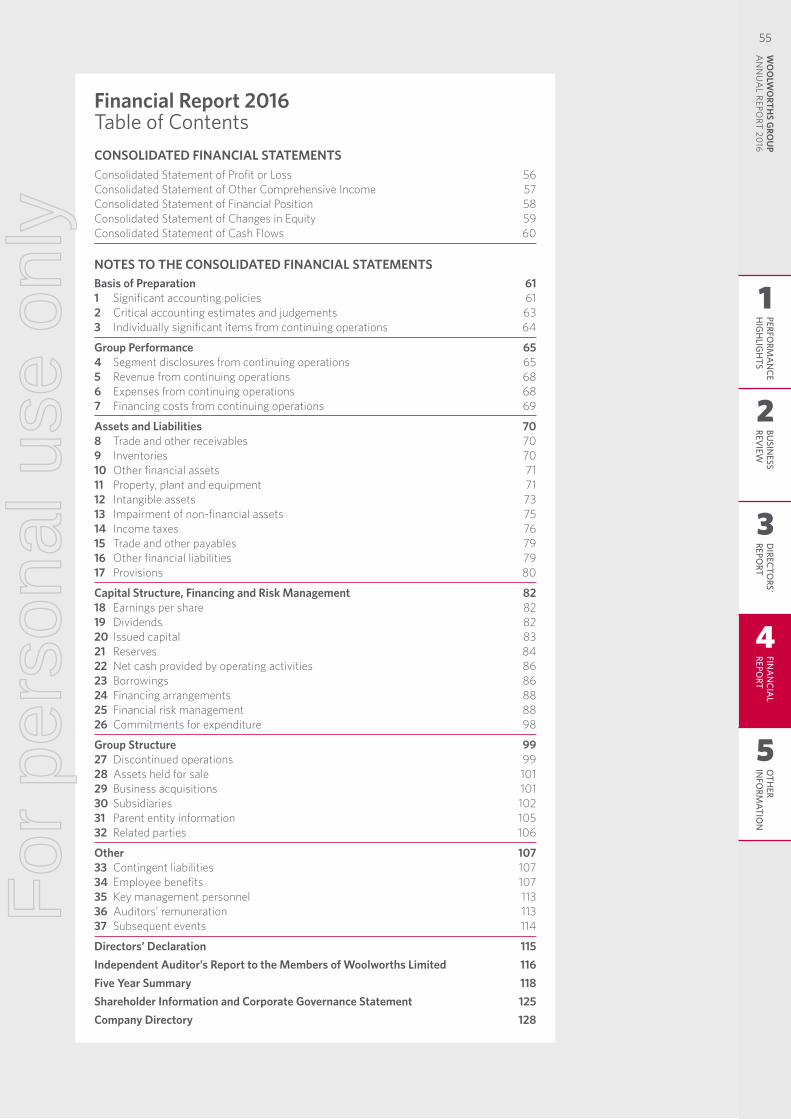
CONSOLIDATED FINANCIAL STATEMENTSConsolidated Statement of Profit or Loss 56Consolidated Statement of Other Comprehensive Income 57Consolidated Statement of Financial Position 58Consolidated Statement of Changes in Equity 59Consolidated Statement of Cash Flows 60
NOTES TO THE CONSOLIDATED FINANCIAL STATEMENTS Basis of Preparation 611 Significant accounting policies 612 Critical accounting estimates and judgements 633 Individually significant items from continuing operations 64
Group Performance 654 Segment disclosures from continuing operations 655 Revenue from continuing operations 686 Expenses from continuing operations 687 Financing costs from continuing operations 69
Assets and Liabilities 708 Trade and other receivables 709 Inventories 7010 Other financial assets 7111 Property, plant and equipment 7112 Intangible assets 7313 Impairment of non-financial assets 7514 Income taxes 7615 Trade and other payables 7916 Other financial liabilities 7917 Provisions 80
Capital Structure, Financing and Risk Management 8218 Earnings per share 8219 Dividends 8220 Issued capital 8321 Reserves 8422 Net cash provided by operating activities 8623 Borrowings 8624 Financing arrangements 8825 Financial risk management 8826 Commitments for expenditure 98
Group Structure 9927 Discontinued operations 9928 Assets held for sale 10129 Business acquisitions 10130 Subsidiaries 10231 Parent entity information 10532 Related parties 106
Other 10733 Contingent liabilities 10734 Employee benefits 10735 Key management personnel 11336 Auditors’ remuneration 11337 Subsequent events 114
Directors’ Declaration 115Independent Auditor’s Report to the Members of Woolworths Limited 116Five Year Summary 118Shareholder Information and Corporate Governance Statement 125Company Directory 128
Financial Report 2016Table of Contents
1
2
3
4
5
PERFORM
AN
CEH
IGH
LIGH
TSBU
SINESS
REVIEW
DIRECTO
RS' REPO
RTFIN
AN
CIAL
REPORT
OTH
ER IN
FORM
ATION
WO
OLW
ORTH
S GRO
UP
AN
NU
AL REPO
RT 2016
55F
or p
erso
nal u
se o
nly
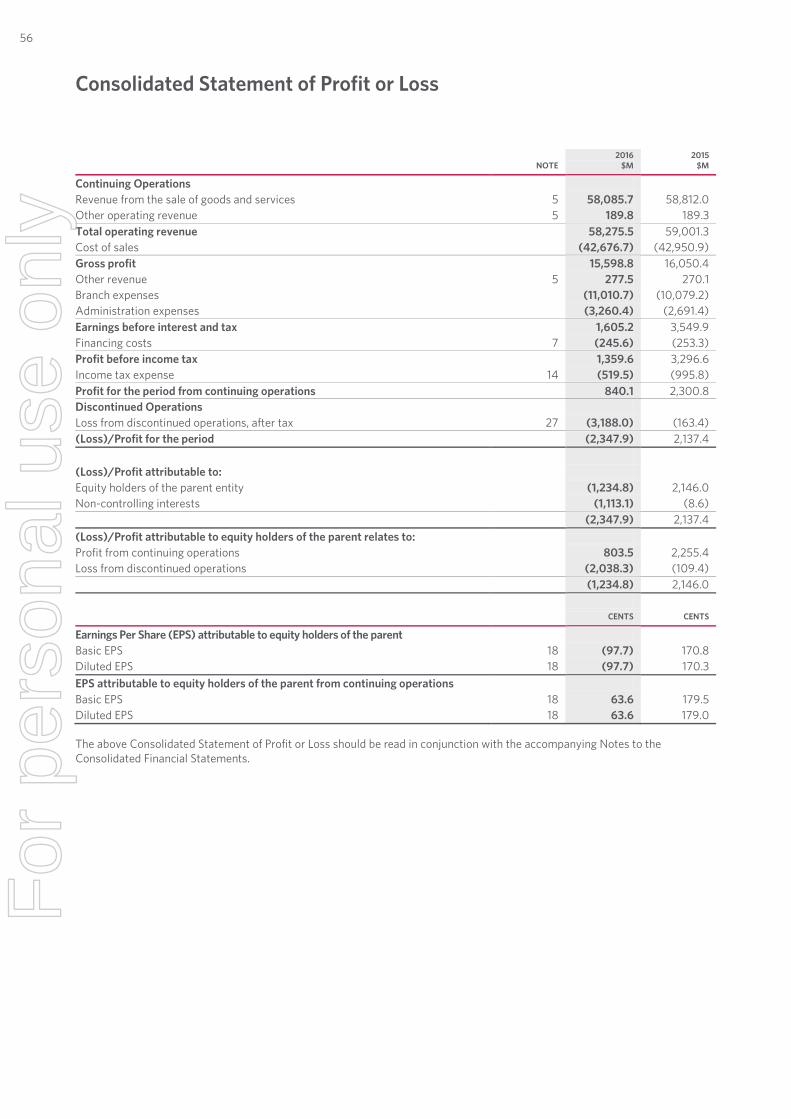
Financial Report 2016 Table of Contents
6 | WOOLWORTHS LIMITED | FINANCIAL REPORT 2016
NOTE 2016
$M 2015
$M
Continuing Operations Revenue from the sale of goods and services 5 58,085.7 58,812.0 Other operating revenue 5 189.8 189.3 Total operating revenue 58,275.5 59,001.3 Cost of sales (42,676.7) (42,950.9) Gross profit 15,598.8 16,050.4 Other revenue 5 277.5 270.1 Branch expenses (11,010.7) (10,079.2) Administration expenses (3,260.4) (2,691.4) Earnings before interest and tax 1,605.2 3,549.9 Financing costs 7 (245.6) (253.3) Profit before income tax 1,359.6 3,296.6 Income tax expense 14 (519.5) (995.8) Profit for the period from continuing operations 840.1 2,300.8 Discontinued Operations Loss from discontinued operations, after tax 27 (3,188.0) (163.4) (Loss)/Profit for the period (2,347.9) 2,137.4 (Loss)/Profit attributable to: Equity holders of the parent entity (1,234.8) 2,146.0 Non-controlling interests (1,113.1) (8.6) (2,347.9) 2,137.4 (Loss)/Profit attributable to equity holders of the parent relates to: Profit from continuing operations 803.5 2,255.4 Loss from discontinued operations (2,038.3) (109.4) (1,234.8) 2,146.0 CENTS CENTS
Earnings Per Share (EPS) attributable to equity holders of the parent Basic EPS 18 (97.7) 170.8 Diluted EPS 18 (97.7) 170.3 EPS attributable to equity holders of the parent from continuing operations Basic EPS 18 63.6 179.5 Diluted EPS 18 63.6 179.0 The above Consolidated Statement of Profit or Loss should be read in conjunction with the accompanying Notes to the Consolidated Financial Statements.
Consolidated Statement of Profit or Loss
56F
or p
erso
nal u
se o
nly
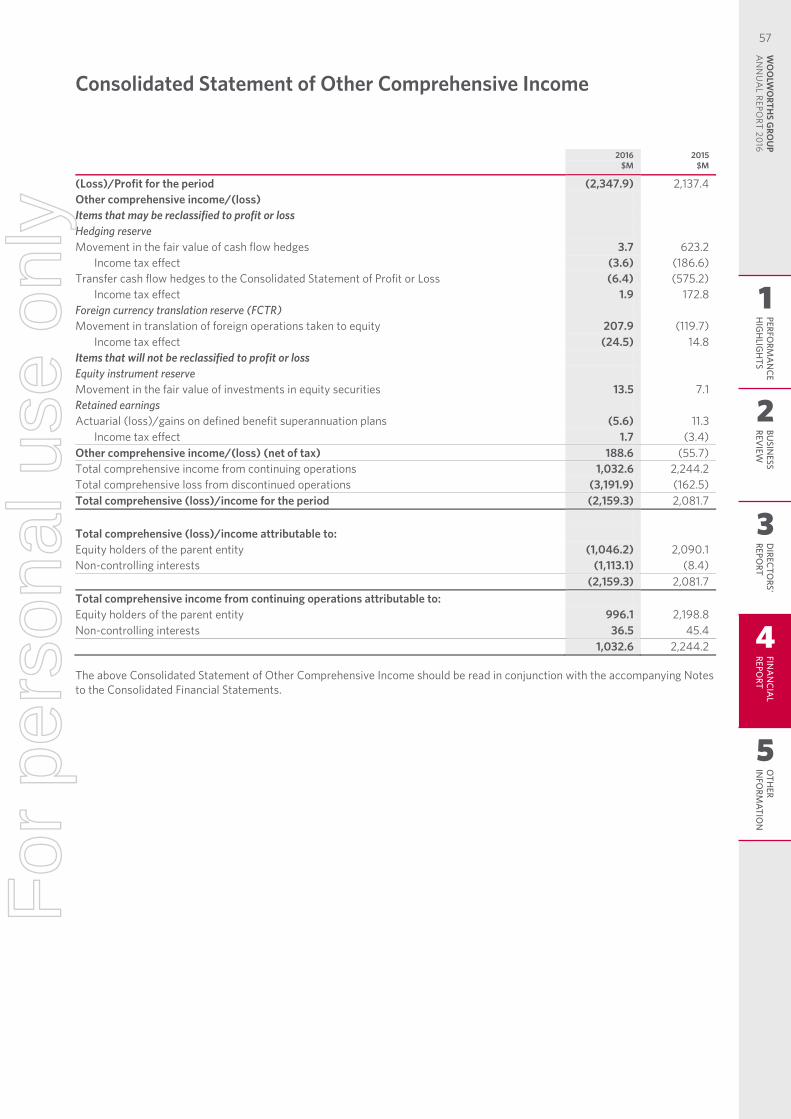
Consolidated Statement of Other Comprehensive Income
7 | WOOLWORTHS LIMITED | FINANCIAL REPORT 2016
2016
$M 2015
$M
(Loss)/Profit for the period (2,347.9) 2,137.4 Other comprehensive income/(loss) Items that may be reclassified to profit or loss Hedging reserve Movement in the fair value of cash flow hedges 3.7 623.2
Income tax effect (3.6) (186.6) Transfer cash flow hedges to the Consolidated Statement of Profit or Loss (6.4) (575.2)
Income tax effect 1.9 172.8 Foreign currency translation reserve (FCTR) Movement in translation of foreign operations taken to equity 207.9 (119.7)
Income tax effect (24.5) 14.8 Items that will not be reclassified to profit or loss Equity instrument reserve Movement in the fair value of investments in equity securities 13.5 7.1 Retained earnings Actuarial (loss)/gains on defined benefit superannuation plans (5.6) 11.3
Income tax effect 1.7 (3.4) Other comprehensive income/(loss) (net of tax) 188.6 (55.7) Total comprehensive income from continuing operations 1,032.6 2,244.2 Total comprehensive loss from discontinued operations (3,191.9) (162.5) Total comprehensive (loss)/income for the period (2,159.3) 2,081.7 Total comprehensive (loss)/income attributable to: Equity holders of the parent entity (1,046.2) 2,090.1 Non-controlling interests (1,113.1) (8.4) (2,159.3) 2,081.7 Total comprehensive income from continuing operations attributable to: Equity holders of the parent entity 996.1 2,198.8 Non-controlling interests 36.5 45.4 1,032.6 2,244.2 The above Consolidated Statement of Other Comprehensive Income should be read in conjunction with the accompanying Notes to the Consolidated Financial Statements.
Consolidated Statement of Other Comprehensive Income
1
2
3
4
5
PERFORM
AN
CEH
IGH
LIGH
TSBU
SINESS
REVIEW
DIRECTO
RS' REPO
RTFIN
AN
CIAL
REPORT
OTH
ER IN
FORM
ATION
WO
OLW
ORTH
S GRO
UP
AN
NU
AL REPO
RT 2016
57F
or p
erso
nal u
se o
nly
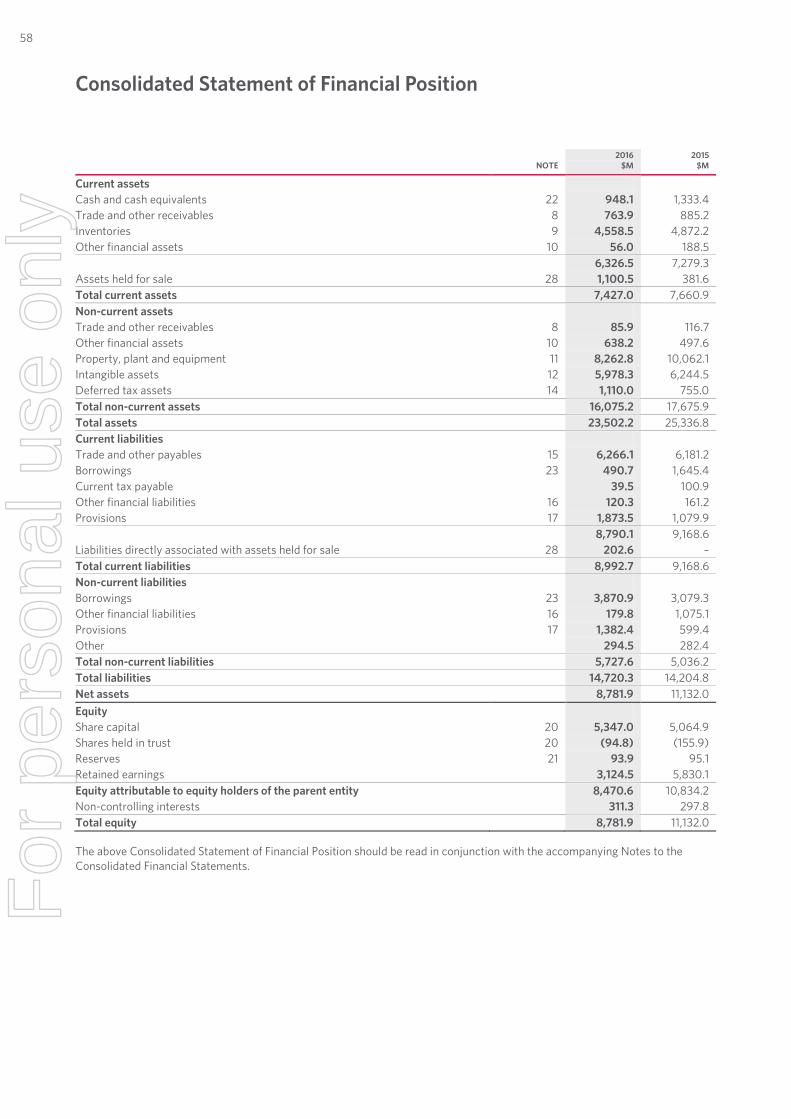
Consolidated Statement of Financial Position
8 | WOOLWORTHS LIMITED | FINANCIAL REPORT 2016
NOTE 2016
$M 2015
$M
Current assets Cash and cash equivalents 22 948.1 1,333.4 Trade and other receivables 8 763.9 885.2 Inventories 9 4,558.5 4,872.2 Other financial assets 10 56.0 188.5 6,326.5 7,279.3 Assets held for sale 28 1,100.5 381.6 Total current assets 7,427.0 7,660.9 Non-current assets Trade and other receivables 8 85.9 116.7 Other financial assets 10 638.2 497.6 Property, plant and equipment 11 8,262.8 10,062.1 Intangible assets 12 5,978.3 6,244.5 Deferred tax assets 14 1,110.0 755.0 Total non-current assets 16,075.2 17,675.9 Total assets 23,502.2 25,336.8 Current liabilities Trade and other payables 15 6,266.1 6,181.2 Borrowings 23 490.7 1,645.4 Current tax payable 39.5 100.9 Other financial liabilities 16 120.3 161.2 Provisions 17 1,873.5 1,079.9 8,790.1 9,168.6 Liabilities directly associated with assets held for sale 28 202.6 – Total current liabilities 8,992.7 9,168.6 Non-current liabilities Borrowings 23 3,870.9 3,079.3 Other financial liabilities 16 179.8 1,075.1 Provisions 17 1,382.4 599.4 Other 294.5 282.4 Total non-current liabilities 5,727.6 5,036.2 Total liabilities 14,720.3 14,204.8 Net assets 8,781.9 11,132.0 Equity Share capital 20 5,347.0 5,064.9 Shares held in trust 20 (94.8) (155.9) Reserves 21 93.9 95.1 Retained earnings 3,124.5 5,830.1 Equity attributable to equity holders of the parent entity 8,470.6 10,834.2 Non-controlling interests 311.3 297.8 Total equity 8,781.9 11,132.0 The above Consolidated Statement of Financial Position should be read in conjunction with the accompanying Notes to the Consolidated Financial Statements.
Consolidated Statement of Financial Position
58F
or p
erso
nal u
se o
nly
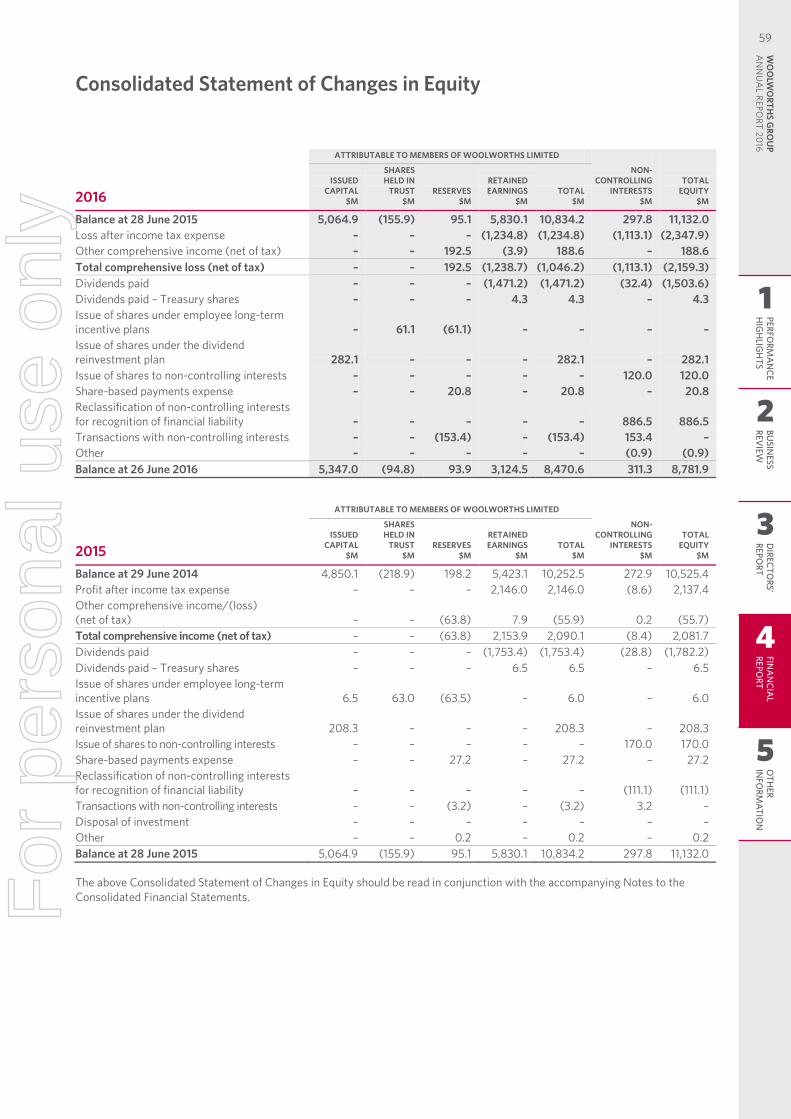
Consolidated Statement of Changes in Equity
9 | WOOLWORTHS LIMITED | FINANCIAL REPORT 2016
ATTRIBUTABLE TO MEMBERS OF WOOLWORTHS LIMITED
2016 ISSUED
CAPITAL $M
SHARES HELD IN
TRUST $M
RESERVES $M
RETAINED EARNINGS
$M TOTAL
$M
NON- CONTROLLING
INTERESTS $M
TOTAL EQUITY
$M
Balance at 28 June 2015 5,064.9 (155.9) 95.1 5,830.1 10,834.2 297.8 11,132.0 Loss after income tax expense – – – (1,234.8) (1,234.8) (1,113.1) (2,347.9) Other comprehensive income (net of tax) – – 192.5 (3.9) 188.6 – 188.6 Total comprehensive loss (net of tax) – – 192.5 (1,238.7) (1,046.2) (1,113.1) (2,159.3) Dividends paid – – – (1,471.2) (1,471.2) (32.4) (1,503.6) Dividends paid – Treasury shares – – – 4.3 4.3 – 4.3 Issue of shares under employee long-term incentive plans – 61.1 (61.1) – – – – Issue of shares under the dividend reinvestment plan 282.1 – – – 282.1 – 282.1 Issue of shares to non-controlling interests – – – – – 120.0 120.0 Share-based payments expense – – 20.8 – 20.8 – 20.8 Reclassification of non-controlling interests for recognition of financial liability – – – – – 886.5 886.5 Transactions with non-controlling interests – – (153.4) – (153.4) 153.4 – Other – – – – – (0.9) (0.9) Balance at 26 June 2016 5,347.0 (94.8) 93.9 3,124.5 8,470.6 311.3 8,781.9 ATTRIBUTABLE TO MEMBERS OF WOOLWORTHS LIMITED
2015 ISSUED
CAPITAL $M
SHARES HELD IN
TRUST $M
RESERVES $M
RETAINED EARNINGS
$M TOTAL
$M
NON- CONTROLLING
INTERESTS $M
TOTAL EQUITY
$M
Balance at 29 June 2014 4,850.1 (218.9) 198.2 5,423.1 10,252.5 272.9 10,525.4 Profit after income tax expense – – – 2,146.0 2,146.0 (8.6) 2,137.4 Other comprehensive income/(loss) (net of tax) – – (63.8) 7.9 (55.9) 0.2 (55.7) Total comprehensive income (net of tax) – – (63.8) 2,153.9 2,090.1 (8.4) 2,081.7 Dividends paid – – – (1,753.4) (1,753.4) (28.8) (1,782.2) Dividends paid – Treasury shares – – – 6.5 6.5 – 6.5 Issue of shares under employee long-term incentive plans 6.5 63.0 (63.5) – 6.0 – 6.0 Issue of shares under the dividend reinvestment plan 208.3 – – – 208.3 – 208.3 Issue of shares to non-controlling interests – – – – – 170.0 170.0 Share-based payments expense – – 27.2 – 27.2 – 27.2 Reclassification of non-controlling interests for recognition of financial liability – – – – – (111.1) (111.1) Transactions with non-controlling interests – – (3.2) – (3.2) 3.2 – Disposal of investment – – – – – – – Other – – 0.2 – 0.2 – 0.2 Balance at 28 June 2015 5,064.9 (155.9) 95.1 5,830.1 10,834.2 297.8 11,132.0 The above Consolidated Statement of Changes in Equity should be read in conjunction with the accompanying Notes to the Consolidated Financial Statements.
Consolidated Statement of Changes in Equity
1
2
3
4
5
PERFORM
AN
CEH
IGH
LIGH
TSBU
SINESS
REVIEW
DIRECTO
RS' REPO
RTFIN
AN
CIAL
REPORT
OTH
ER IN
FORM
ATION
WO
OLW
ORTH
S GRO
UP
AN
NU
AL REPO
RT 2016
59F
or p
erso
nal u
se o
nly
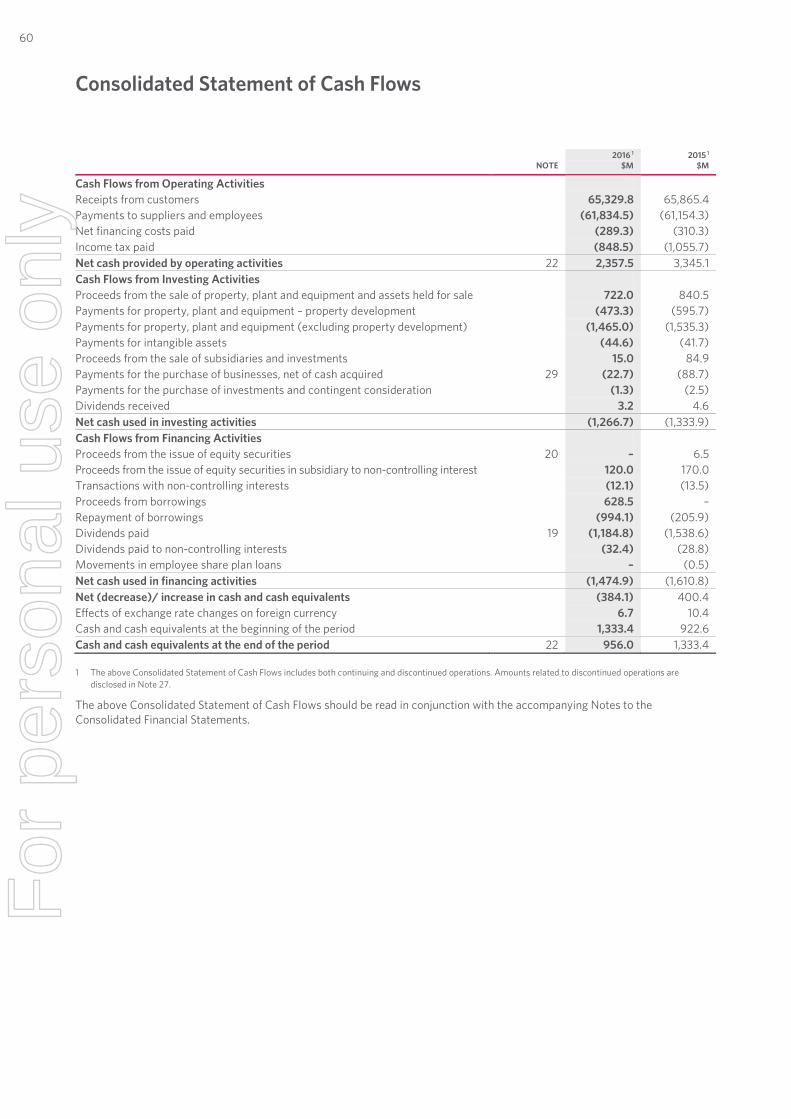
Consolidated Statement of Cash Flows
10 | WOOLWORTHS LIMITED | FINANCIAL REPORT 2016
NOTE 2016 1
$M 2015 1
$M
Cash Flows from Operating Activities Receipts from customers 65,329.8 65,865.4 Payments to suppliers and employees (61,834.5) (61,154.3) Net financing costs paid (289.3) (310.3) Income tax paid (848.5) (1,055.7) Net cash provided by operating activities 22 2,357.5 3,345.1 Cash Flows from Investing Activities Proceeds from the sale of property, plant and equipment and assets held for sale 722.0 840.5 Payments for property, plant and equipment – property development (473.3) (595.7) Payments for property, plant and equipment (excluding property development) (1,465.0) (1,535.3) Payments for intangible assets (44.6) (41.7) Proceeds from the sale of subsidiaries and investments 15.0 84.9 Payments for the purchase of businesses, net of cash acquired 29 (22.7) (88.7) Payments for the purchase of investments and contingent consideration (1.3) (2.5) Dividends received 3.2 4.6 Net cash used in investing activities (1,266.7) (1,333.9) Cash Flows from Financing Activities Proceeds from the issue of equity securities 20 – 6.5 Proceeds from the issue of equity securities in subsidiary to non-controlling interest 120.0 170.0 Transactions with non-controlling interests (12.1) (13.5) Proceeds from borrowings 628.5 – Repayment of borrowings (994.1) (205.9) Dividends paid 19 (1,184.8) (1,538.6) Dividends paid to non-controlling interests (32.4) (28.8) Movements in employee share plan loans – (0.5) Net cash used in financing activities (1,474.9) (1,610.8) Net (decrease)/ increase in cash and cash equivalents (384.1) 400.4 Effects of exchange rate changes on foreign currency 6.7 10.4 Cash and cash equivalents at the beginning of the period 1,333.4 922.6 Cash and cash equivalents at the end of the period 22 956.0 1,333.4 1 The above Consolidated Statement of Cash Flows includes both continuing and discontinued operations. Amounts related to discontinued operations are
disclosed in Note 27.
The above Consolidated Statement of Cash Flows should be read in conjunction with the accompanying Notes to the Consolidated Financial Statements.
Consolidated Statement of Cash Flows
60F
or p
erso
nal u
se o
nly
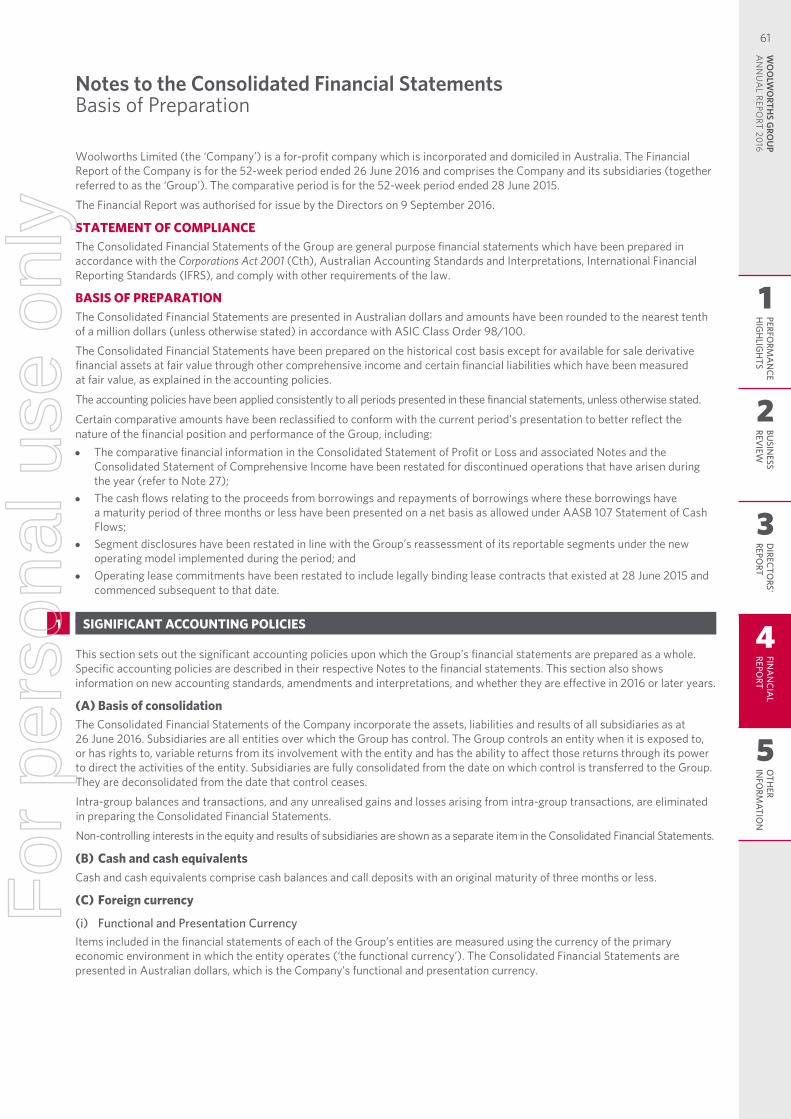
Notes to the Consolidated Financial Statements Basis of Preparation
11 | WOOLWORTHS LIMITED | FINANCIAL REPORT 2016
Woolworths Limited (the ‘Company’) is a for-profit company which is incorporated and domiciled in Australia. The Financial Report of the Company is for the 52-week period ended 26 June 2016 and comprises the Company and its subsidiaries (together referred to as the ‘Group’). The comparative period is for the 52-week period ended 28 June 2015.
The Financial Report was authorised for issue by the Directors on 9 September 2016.
STATEMENT OF COMPLIANCE The Consolidated Financial Statements of the Group are general purpose financial statements which have been prepared in accordance with the Corporations Act 2001 (Cth), Australian Accounting Standards and Interpretations, International Financial Reporting Standards (IFRS), and comply with other requirements of the law.
BASIS OF PREPARATION The Consolidated Financial Statements are presented in Australian dollars and amounts have been rounded to the nearest tenth of a million dollars (unless otherwise stated) in accordance with ASIC Class Order 98/100.
The Consolidated Financial Statements have been prepared on the historical cost basis except for available for sale derivative financial assets at fair value through other comprehensive income and certain financial liabilities which have been measured at fair value, as explained in the accounting policies.
The accounting policies have been applied consistently to all periods presented in these financial statements, unless otherwise stated.
Certain comparative amounts have been reclassified to conform with the current period’s presentation to better reflect the nature of the financial position and performance of the Group, including: • The comparative financial information in the Consolidated Statement of Profit or Loss and associated Notes and the
Consolidated Statement of Comprehensive Income have been restated for discontinued operations that have arisen during the year (refer to Note 27);
• The cash flows relating to the proceeds from borrowings and repayments of borrowings where these borrowings have a maturity period of three months or less have been presented on a net basis as allowed under AASB 107 Statement of Cash Flows;
• Segment disclosures have been restated in line with the Group’s reassessment of its reportable segments under the new operating model implemented during the period; and
• Operating lease commitments have been restated to include legally binding lease contracts that existed at 28 June 2015 and commenced subsequent to that date.
1. SIGNIFICANT ACCOUNTING POLICIES
This section sets out the significant accounting policies upon which the Group’s financial statements are prepared as a whole. Specific accounting policies are described in their respective Notes to the financial statements. This section also shows information on new accounting standards, amendments and interpretations, and whether they are effective in 2016 or later years.
(A) Basis of consolidation The Consolidated Financial Statements of the Company incorporate the assets, liabilities and results of all subsidiaries as at 26 June 2016. Subsidiaries are all entities over which the Group has control. The Group controls an entity when it is exposed to, or has rights to, variable returns from its involvement with the entity and has the ability to affect those returns through its power to direct the activities of the entity. Subsidiaries are fully consolidated from the date on which control is transferred to the Group. They are deconsolidated from the date that control ceases.
Intra-group balances and transactions, and any unrealised gains and losses arising from intra-group transactions, are eliminated in preparing the Consolidated Financial Statements.
Non-controlling interests in the equity and results of subsidiaries are shown as a separate item in the Consolidated Financial Statements.
(B) Cash and cash equivalents Cash and cash equivalents comprise cash balances and call deposits with an original maturity of three months or less.
(C) Foreign currency
(i) Functional and Presentation Currency Items included in the financial statements of each of the Group’s entities are measured using the currency of the primary economic environment in which the entity operates (‘the functional currency’). The Consolidated Financial Statements are presented in Australian dollars, which is the Company’s functional and presentation currency.
Notes to the Consolidated Financial StatementsBasis of Preparation
1 SIGNIFICANT ACCOUNTING POLICIES
1
2
3
4
5
PERFORM
AN
CEH
IGH
LIGH
TSBU
SINESS
REVIEW
DIRECTO
RS' REPO
RTFIN
AN
CIAL
REPORT
OTH
ER IN
FORM
ATION
WO
OLW
ORTH
S GRO
UP
AN
NU
AL REPO
RT 2016
61F
or p
erso
nal u
se o
nly
Notes to the Consolidated Financial Statements Basis of Preparation
12 | WOOLWORTHS LIMITED | FINANCIAL REPORT 2016
(C) Foreign currency continued
(ii) Transactions and Balances (entities with a functional currency of AUD) Foreign currency transactions are translated into Australian dollars using the exchange rates at the dates of the transactions. Assets and liabilities denominated in foreign currencies are translated to Australian dollars at reporting date at the following exchange rates: FOREIGN CURRENCY AMOUNT APPLICABLE EXCHANGE RATE
Monetary assets and liabilities Reporting date Non-monetary assets and liabilities measured at historical cost Date of transaction Non-monetary assets and liabilities measured at fair value Date fair value is determined Foreign exchange differences arising on translation are recognised in profit or loss in the period in which they arise except: • Exchange differences on transactions entered to hedge certain foreign currency risks (refer to Note 25); and • Items noted within paragraph (iii) below.
(iii) Financial statements of foreign operations (entities with a functional currency other than AUD) The results and financial position of foreign operations are translated to Australian dollars at the following exchange rates:
FOREIGN CURRENCY AMOUNT APPLICABLE EXCHANGE RATE
Revenues and expenses of foreign operations Average for the period Assets and liabilities of foreign operations, including goodwill and fair value adjustments arising on consolidation
Reporting date
Equity items Historical rates The following foreign exchange differences are recognised in other comprehensive income: • Foreign currency differences arising on translation of foreign operations; and • Exchange differences arising from a monetary item receivable from or payable to a foreign operation, the settlement of which
is neither planned nor likely in the foreseeable future. These monetary items and related hedges are considered to form part of the net investment in a foreign operation and are reclassified into profit or loss upon disposal of the net investment.
(D) Goods and Services Tax (GST) Revenue, expenses and assets are recognised net of GST, except where the GST incurred is not recoverable from the taxation authority, in which case the GST is recognised as part of the expense or cost of the asset.
Receivables and payables are stated with the amount of GST included. The net amounts of GST recoverable from or payable to the taxation authorities are included as a current asset or liability in the Consolidated Statement of Financial Position.
Cash flows are included in the Consolidated Statement of Cash Flows on a gross basis. The GST components of cash flows arising from investing and financing activities which are recoverable from or payable to taxation authorities are classified as operating cash flows.
(E) New and amended standards adopted by the Group The Group has adopted all relevant new and amended Accounting Standards and Interpretations issued by the Australian Accounting Standards Board (AASB) which are effective for annual reporting periods beginning on or after 30 June 2015.
None of the new standards or amendments to standards that are mandatory for the first time materially affected any of the amounts recognised in the current period or any prior period and are not likely to significantly affect future periods.
(i) AASB 9 Financial Instruments as amended in 2010 (AASB 9 (2010)) During the prior year, the Group elected to early adopt AASB 9 Financial Instruments (AASB 9 (2010)) as amended by AASB 2010-7, AASB 2012-6, AASB 2013-9 and AASB 2014-1.
AASB 9 (2010) contains guidance on hedge accounting that replaces the existing requirements of AASB 139 Financial Instruments: Recognition and Measurement. AASB 9 introduces changes to hedge effectiveness and eligibility requirements to align more closely with an entity’s risk management framework. There was no material impact on amounts reported in the financial statements as a result of the adoption of the standard. Additional disclosure requirements from this standard are included in Note 25.
(ii) AASB 2015-2 Amendments to Australian Accounting Standards – Disclosure Initiative: Amendments to AASB 101 During the prior year, the Group elected to early adopt AASB 2015-2 Amendments to Australian Accounting Standards – Disclosure Initiative: Amendments to AASB 101 ahead of the mandatory effective date of 1 January 2016. AASB 2015-2 amends AASB 101 Presentation of Financial Statements to provide clarification regarding the disclosure requirements in AASB 101. The Group has applied these amendments in determining relevant disclosures in the preparation of these financial statements.
1. SIGNIFICANT ACCOUNTING POLICIES CONTINUED
Notes to the Consolidated Financial Statements: Basis of Preparation
1 SIGNIFICANT ACCOUNTING POLICIES (CONTINUED)
62F
or p
erso
nal u
se o
nly
Notes to the Consolidated Financial Statements Basis of Preparation
13 | WOOLWORTHS LIMITED | FINANCIAL REPORT 2016
(F) Issued standards and interpretations not early adopted The table below lists the standards and amendments to standards that were available for early adoption and were applicable to the Group. The reported results and financial position of the Group are not expected to change on adoption of any of the amendments to current standards listed below as they do not result in any changes to the Group’s existing accounting policies.
With respect to the new standards on issue but not yet effective, AASB 15 Revenue from Contracts with Customers and AASB 9 Financial Instruments (2014), the Group has commenced an assessment of the impact of these standards on the Group’s results, financial position and disclosures. The Group does not intend on adopting these new standards or amendments before their mandatory effective dates. With respect to AASB 16 Leases, the Group is yet to assess the full impact of the new standard and has not yet decided when to adopt AASB 16. The application of AASB 16 will have a material effect on the Group’s reported assets and liabilities which will impact key financial ratios. In addition, the cost of implementing the standard may be significant.
STANDARD/AMENDMENT TO STANDARDS
EFFECTIVE DATE – ANNUAL REPORTING PERIOD BEGINNING
ON OR AFTER:
AASB 1057 Application of Australian Accounting Standards 1 January 2016 AASB 2014-4 Amendments to Australian Accounting Standards – Clarification of Acceptable Methods of Depreciation and Amortisation
1 January 2016
AASB 2014-9 Amendments to Australian Accounting Standards – Equity Method in Separate Financial Statements
1 January 2016
AASB 2015-1 Amendments to Australian Accounting Standards – Annual Improvements to Australian Accounting Standards 2012-2014 Cycle
1 January 2016
AASB 2015-9 Amendments to Australian Accounting Standards – Scope and Application Paragraphs 1 January 2016 AASB 2016-1 Amendments to Australian Accounting Standards – Recognition of Deferred Tax Assets for Unrealised Losses
1 January 2017
AASB 2016-2 Amendments to Australian Accounting Standards – Disclosure Initiative: Amendments to AASB 107
1 January 2017
AASB 2014-10 Amendments to Australian Accounting Standards – Sale or Contribution of Assets between an Investor and its Associate or Joint Venture
1 January 2018
AASB 15 Revenue from Contracts with Customers and the relevant amending standards 1 January 2018 AASB 9 (2014) Financial Instruments and the relevant amending standards 1 January 2018 AASB 2016-5 Amendments to Australian Accounting Standards – Classification and Measurement of Share-based Payment Transactions
1 January 2018
AASB 16 Leases 1 January 2019
2. CRITICAL ACCOUNTING ESTIMATES AND JUDGEMENTS
In applying the Group’s accounting policies, the Directors are required to make estimates, judgements and assumptions that affect amounts reported in this Financial Report. The estimates, judgements and assumptions are based on historical experience, adjusted for current market conditions and other factors that are believed to be reasonable under the circumstances and are reviewed on a regular basis. Actual results may differ from these estimates.
The estimates and judgements which involve a higher degree of complexity or that have a significant risk of causing a material adjustment to the carrying amounts of assets and liabilities within the next period are included in the following Notes: • Notes 11 and 12 – Estimation of useful lives of assets;
• Note 13 – Impairment of non-financial assets;
• Note 16 – Valuation of put options over non-controlling interests;
• Note 17 – Provisions; and
• Note 27 – Discontinued operations including impairments, onerous leases and associated tax balances.
Revisions to accounting estimates are recognised in the period in which the estimate is revised if the revision affects only that period; or in the period and future periods if the revision affects both current and future periods.
1. SIGNIFICANT ACCOUNTING POLICIES CONTINUED
Notes to the Consolidated Financial Statements: Basis of Preparation
1 SIGNIFICANT ACCOUNTING POLICIES (CONTINUED)
2 CRITICAL ACCOUNTING ESTIMATES AND JUDGEMENTS
1
2
3
4
5
PERFORM
AN
CEH
IGH
LIGH
TSBU
SINESS
REVIEW
DIRECTO
RS' REPO
RTFIN
AN
CIAL
REPORT
OTH
ER IN
FORM
ATION
WO
OLW
ORTH
S GRO
UP
AN
NU
AL REPO
RT 2016
63F
or p
erso
nal u
se o
nly
Notes to the Consolidated Financial Statements Basis of Preparation
14 | WOOLWORTHS LIMITED | FINANCIAL REPORT 2016
3. INDIVIDUALLY SIGNIFICANT ITEMS FROM CONTINUING OPERATIONS
2016 Included in the 2016 Consolidated Statement of Profit or Loss are certain significant expenses incurred outside the ordinary course of our trading operations resulting from a Group-wide review of all aspects of the business. In particular, these items relate to: • Operating model and strategic changes of $154.9 million before tax primarily relating to the impairment of IT and related assets,
impairment of supply chain assets and related projects, redundancy costs, and consultancy and other third party costs; • Store network optimisation and property rationalisation of $344.2 million before tax primarily relating to store asset
impairments, onerous leases and store exit costs, and other property related impairments and provisions associated with planned store closures of underperforming and non-strategic stores, as well as the deferral of non-core property development assets; and
• General Merchandise impairment of $459.5 million before tax primarily relating to the impairment of intangible assets, including goodwill in EziBuy following the strategic decision to separate BIGW and EziBuy and the significant deterioration in the trading performance of the business, the write-down of inventory in BIGW relating to product range simplification and consolidation, and redundancy and IT asset impairments.
The above expenses have been included in the Consolidated Statement of Profit or Loss as follows:
2016 COST OF
SALES $M
BRANCH EXPENSES
$M
ADMINISTRATION EXPENSES
$M
IMPACT ON PROFIT BEFORE
INCOME TAX $M
INCOME TAX BENEFIT
$M
IMPACT ON PROFIT FOR THE
PERIOD 1 $M
Operating model and strategic changes 8.9 8.6 137.4 154.9 Store network optimisation and property rationalisation – 267.1 77.1 344.2 General Merchandise impairment 30.6 126.1 302.8 459.5 Total 39.5 401.8 517.3 958.6 (193.1) 765.5 1 Comprised of $754.7 million attributable to equity holders of the parent entity and $10.8 million attributable to non-controlling interests.
Individually significant items relating to the impairment of Home Improvement assets and store exit costs are separately presented in Note 27 as the Home Improvement business has been classified as a discontinued operation.
2015 Included in the 2015 Consolidated Statement of Profit or Loss are certain significant expenses incurred outside the ordinary course of our trading operations resulting from transformation projects and property portfolio management initiatives. In particular, these items relate to: • General Merchandise transformation costs of $148.2 million before tax primarily pertaining to inventory and associated
expenses of facilitating the alignment of inventory to our customer strategy; • Business transformation costs of $196.4 million before tax primarily representing resourcing and professional services costs
associated with business transformation programs, accelerated depreciation of assets no longer in use, and inventory provisioning in the Australian Food Liquor and Petrol division due to changes in strategy;
• Redundancy costs of $43.0 million before tax primarily associated with restructuring initiatives across corporate-wide support functions, supply chain and non-customer store facing positions; and
• Property losses of $35.6 million before tax primarily associated with certain non-core property assets which are unlikely to be developed within the next five years as a result of a review of Woolworths’ property portfolio.
The above expenses have been included in the Consolidated Statement of Profit or Loss as follows:
2015 COST OF
SALES $M
BRANCH EXPENSES
$M
ADMINISTRATION EXPENSES
$M
IMPACT ON PROFIT BEFORE
INCOME TAX $M
INCOME TAX BENEFIT
$M
IMPACT ON PROFIT FOR THE
PERIOD 1 $M
General Merchandise transformation 126.4 21.8 – 148.2 Business transformation 2 38.7 12.2 145.5 196.4 Redundancy – 2.1 40.9 43.0 Property portfolio review – – 35.6 35.6 Total 165.1 36.1 222.0 423.2 (117.0) 306.2 1 Comprised of $306.0 million attributable to equity holders of the parent entity and $0.2 million attributable to non-controlling interests. 2 $2.7 million business transformation expenses within administration expenses above previously disclosed as significant items are included in loss from
discontinued operations for 2015.
Notes to the Consolidated Financial Statements: Basis of Preparation
3 INDIVIDUALLY SIGNIFICANT ITEMS FROM CONTINUING OPERATIONS
64F
or p
erso
nal u
se o
nly
Notes to the Consolidated Financial Statements Group Performance
15 | WOOLWORTHS LIMITED | FINANCIAL REPORT 2016
4. SEGMENT DISCLOSURES FROM CONTINUING OPERATIONS
(A) Operating segment reporting Reportable segments are identified on the basis of internal reports on the business units of the Group that are regularly reviewed by the Chief Executive Officer in order to allocate resources to the segment and assess its performance. These business units offer different products and services and are managed separately. The Group has reassessed the reportable segments under the new Woolworths operating model implemented during the period. Under the new operating model, the Endeavour Drinks Group was identified as a separate reportable segment (previously included within Australian Food, Liquor and Petrol) and BIGW was identified as a separate reportable segment (previously included within General Merchandise).
The Group’s reportable segments are as follows: • Australian Food and Petrol – procurement of food and petroleum products for resale to customers in Australia; • New Zealand Supermarkets – procurement of food and liquor products for resale to customers in New Zealand; • Endeavour Drinks Group – procurement of liquor products for resale to customers in Australia; • BIGW – procurement of discount general merchandise products for resale to customers in Australia; and • Hotels – provision of leisure and hospitality services including food and alcohol, accommodation, entertainment and gaming in
Australia.
On 18 January 2016, the Company announced that it intended to pursue an orderly prospective exit of the Home Improvement business. Consequently, the Home Improvement business has been classified as a discontinued operation (refer to Note 27) and this segment is no longer presented in the segment disclosures for 2016 and 2015.
The Unallocated group consists of the Group’s other operating segments that are not separately reportable as well as various support functions including property and head office costs. The revenue from the sale of goods and services included in the Unallocated group relates to EziBuy and is derived from the procurement of general merchandise products for predominately online resale to customers.
There are varying levels of integration between the Australian Food and Petrol, Endeavour Drinks Group and Hotels reportable segments. This includes the common usage of property and services and administration functions. Inter-segment pricing is determined on an arm’s length basis.
Performance is measured based on segment earnings before interest and tax (EBIT) before individually Significant Items (refer to Note 3) which is consistent with the way management monitor and report the performance of these segments.
Notes to the Consolidated Financial StatementsGroup Performance
4 SEGMENT DISCLOSURES FROM CONTINUING OPERATIONS
1
2
3
4
5
PERFORM
AN
CEH
IGH
LIGH
TSBU
SINESS
REVIEW
DIRECTO
RS' REPO
RTFIN
AN
CIAL
REPORT
OTH
ER IN
FORM
ATION
WO
OLW
ORTH
S GRO
UP
AN
NU
AL REPO
RT 2016
65F
or p
erso
nal u
se o
nly
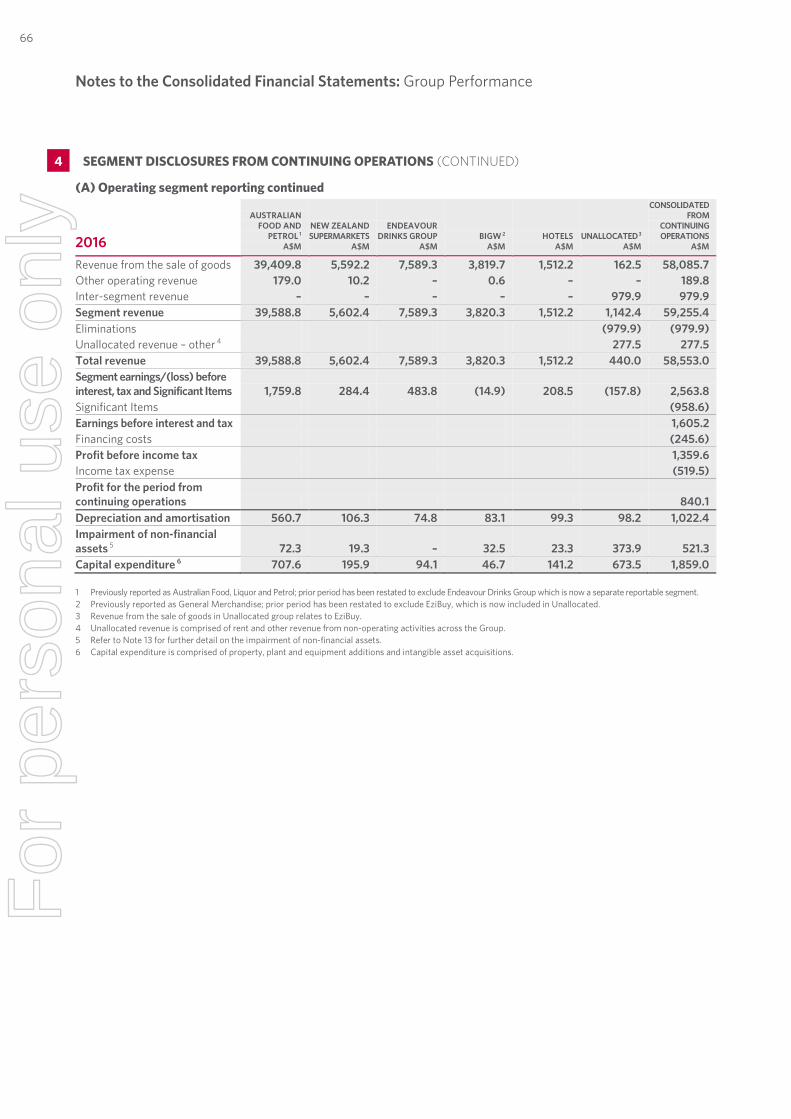
Notes to the Consolidated Financial Statements Group Performance
16 | WOOLWORTHS LIMITED | FINANCIAL REPORT 2016
(A) Operating segment reporting continued
2016
AUSTRALIAN FOOD AND
PETROL 1 A$M
NEW ZEALAND SUPERMARKETS
A$M
ENDEAVOUR DRINKS GROUP
A$M BIGW 2
A$M HOTELS
A$M UNALLOCATED 3
A$M
CONSOLIDATED FROM
CONTINUING OPERATIONS
A$M
Revenue from the sale of goods 39,409.8 5,592.2 7,589.3 3,819.7 1,512.2 162.5 58,085.7 Other operating revenue 179.0 10.2 – 0.6 – – 189.8 Inter-segment revenue – – – – – 979.9 979.9 Segment revenue 39,588.8 5,602.4 7,589.3 3,820.3 1,512.2 1,142.4 59,255.4 Eliminations (979.9) (979.9) Unallocated revenue – other 4 277.5 277.5 Total revenue 39,588.8 5,602.4 7,589.3 3,820.3 1,512.2 440.0 58,553.0 Segment earnings/(loss) before interest, tax and Significant Items 1,759.8 284.4 483.8 (14.9) 208.5 (157.8) 2,563.8 Significant Items (958.6) Earnings before interest and tax 1,605.2 Financing costs (245.6) Profit before income tax 1,359.6 Income tax expense (519.5) Profit for the period from continuing operations 840.1 Depreciation and amortisation 560.7 106.3 74.8 83.1 99.3 98.2 1,022.4 Impairment of non-financial assets 5 72.3 19.3 – 32.5 23.3 373.9 521.3 Capital expenditure 6 707.6 195.9 94.1 46.7 141.2 673.5 1,859.0 1 Previously reported as Australian Food, Liquor and Petrol; prior period has been restated to exclude Endeavour Drinks Group which is now a separate reportable segment. 2 Previously reported as General Merchandise; prior period has been restated to exclude EziBuy, which is now included in Unallocated. 3 Revenue from the sale of goods in Unallocated group relates to EziBuy. 4 Unallocated revenue is comprised of rent and other revenue from non-operating activities across the Group. 5 Refer to Note 13 for further detail on the impairment of non-financial assets. 6 Capital expenditure is comprised of property, plant and equipment additions and intangible asset acquisitions.
4. SEGMENT DISCLOSURES FROM CONTINUING OPERATIONS CONTINUED
Notes to the Consolidated Financial Statements: Group Performance
4 SEGMENT DISCLOSURES FROM CONTINUING OPERATIONS (CONTINUED)
66F
or p
erso
nal u
se o
nly
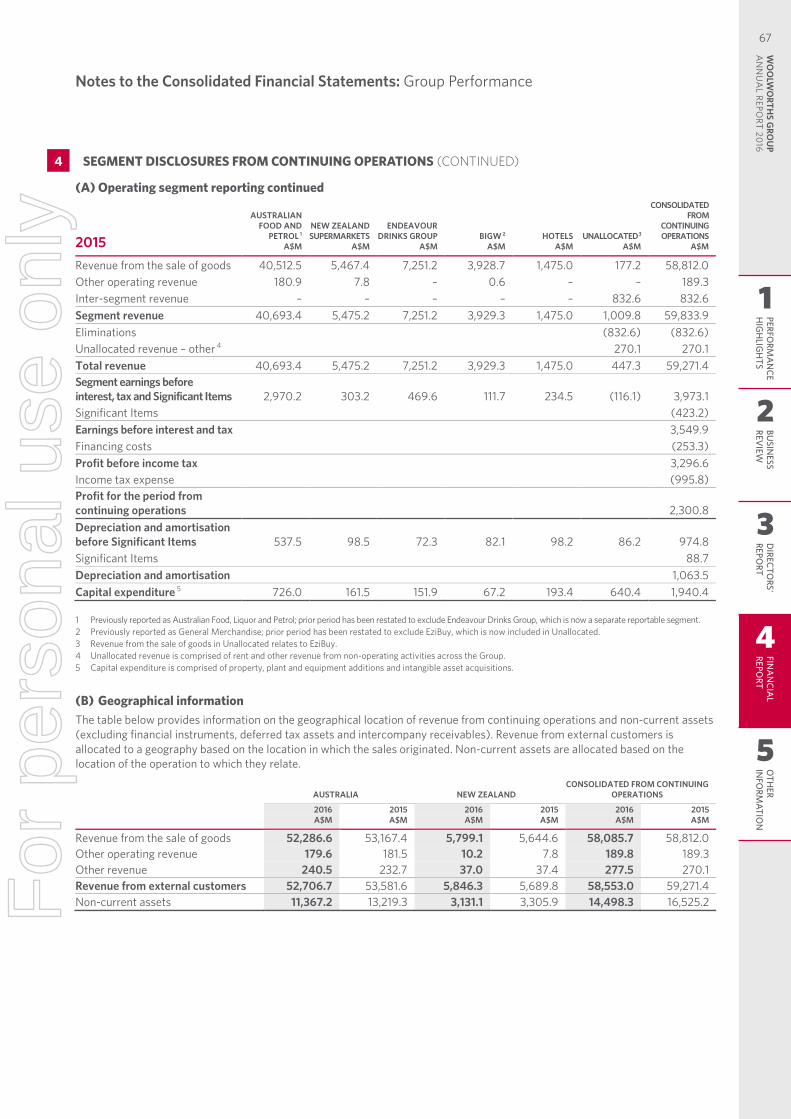
Notes to the Consolidated Financial Statements Group Performance
17 | WOOLWORTHS LIMITED | FINANCIAL REPORT 2016
(A) Operating segment reporting continued
2015
AUSTRALIAN FOOD AND
PETROL 1 A$M
NEW ZEALAND SUPERMARKETS
A$M
ENDEAVOUR DRINKS GROUP
A$M BIGW 2
A$M HOTELS
A$M UNALLOCATED 3
A$M
CONSOLIDATED FROM
CONTINUING OPERATIONS
A$M
Revenue from the sale of goods 40,512.5 5,467.4 7,251.2 3,928.7 1,475.0 177.2 58,812.0 Other operating revenue 180.9 7.8 – 0.6 – – 189.3 Inter-segment revenue – – – – – 832.6 832.6 Segment revenue 40,693.4 5,475.2 7,251.2 3,929.3 1,475.0 1,009.8 59,833.9 Eliminations
(832.6) (832.6)
Unallocated revenue – other 4
270.1 270.1 Total revenue 40,693.4 5,475.2 7,251.2 3,929.3 1,475.0 447.3 59,271.4 Segment earnings before interest, tax and Significant Items 2,970.2 303.2 469.6 111.7 234.5 (116.1) 3,973.1 Significant Items
(423.2)
Earnings before interest and tax
3,549.9 Financing costs
(253.3)
Profit before income tax
3,296.6 Income tax expense
(995.8)
Profit for the period from continuing operations
2,300.8
Depreciation and amortisation before Significant Items 537.5 98.5 72.3 82.1 98.2 86.2 974.8 Significant Items
88.7
Depreciation and amortisation
1,063.5 Capital expenditure 5 726.0 161.5 151.9 67.2 193.4 640.4 1,940.4 1 Previously reported as Australian Food, Liquor and Petrol; prior period has been restated to exclude Endeavour Drinks Group, which is now a separate reportable segment. 2 Previously reported as General Merchandise; prior period has been restated to exclude EziBuy, which is now included in Unallocated. 3 Revenue from the sale of goods in Unallocated relates to EziBuy. 4 Unallocated revenue is comprised of rent and other revenue from non-operating activities across the Group. 5 Capital expenditure is comprised of property, plant and equipment additions and intangible asset acquisitions.
(B) Geographical information The table below provides information on the geographical location of revenue from continuing operations and non-current assets (excluding financial instruments, deferred tax assets and intercompany receivables). Revenue from external customers is allocated to a geography based on the location in which the sales originated. Non-current assets are allocated based on the location of the operation to which they relate.
AUSTRALIA NEW ZEALAND CONSOLIDATED FROM CONTINUING
OPERATIONS
2016 A$M
2015 A$M
2016 A$M
2015 A$M
2016 A$M
2015 A$M
Revenue from the sale of goods 52,286.6 53,167.4 5,799.1 5,644.6 58,085.7 58,812.0 Other operating revenue 179.6 181.5 10.2 7.8 189.8 189.3 Other revenue 240.5 232.7 37.0 37.4 277.5 270.1 Revenue from external customers 52,706.7 53,581.6 5,846.3 5,689.8 58,553.0 59,271.4 Non-current assets 11,367.2 13,219.3 3,131.1 3,305.9 14,498.3 16,525.2
4. SEGMENT DISCLOSURES FROM CONTINUING OPERATIONS CONTINUED
Notes to the Consolidated Financial Statements: Group Performance
4 SEGMENT DISCLOSURES FROM CONTINUING OPERATIONS (CONTINUED)
1
2
3
4
5
PERFORM
AN
CEH
IGH
LIGH
TSBU
SINESS
REVIEW
DIRECTO
RS' REPO
RTFIN
AN
CIAL
REPORT
OTH
ER IN
FORM
ATION
WO
OLW
ORTH
S GRO
UP
AN
NU
AL REPO
RT 2016
67F
or p
erso
nal u
se o
nly
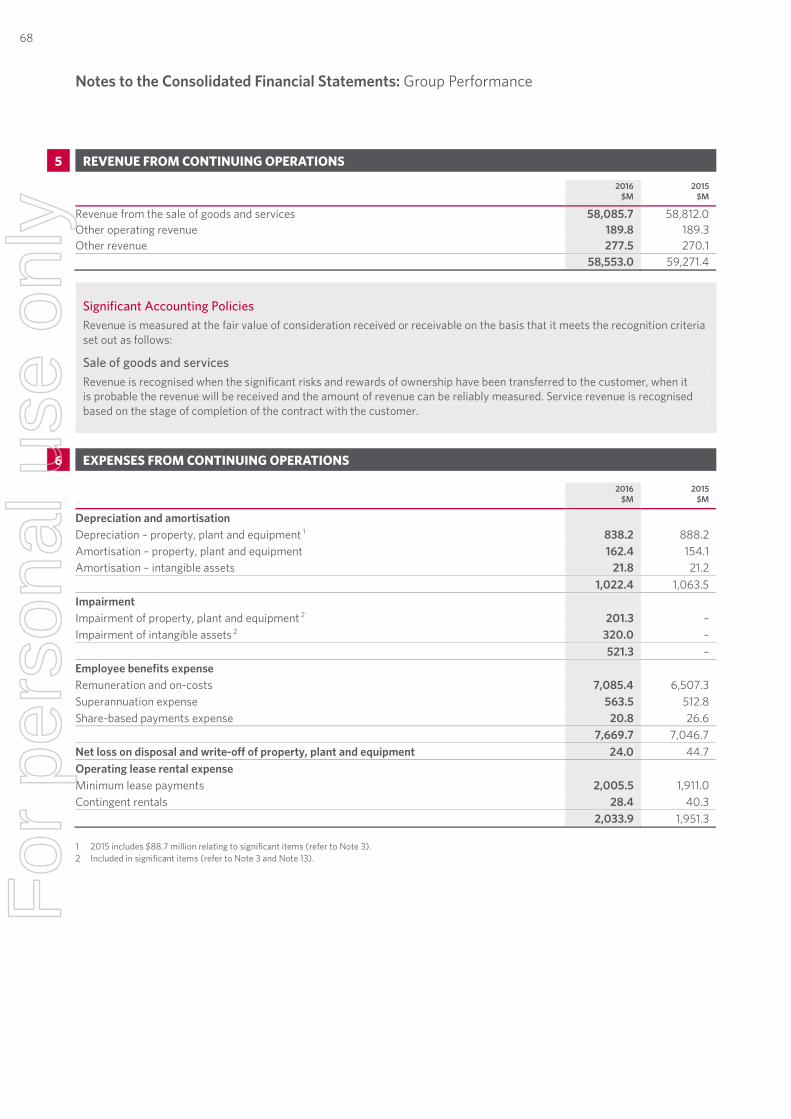
Notes to the Consolidated Financial Statements Group Performance
18 | WOOLWORTHS LIMITED | FINANCIAL REPORT 2016
5. REVENUE FROM CONTINUING OPERATIONS
2016
$M 2015
$M
Revenue from the sale of goods and services 58,085.7 58,812.0 Other operating revenue 189.8 189.3 Other revenue 277.5 270.1 58,553.0 59,271.4
Significant Accounting Policies Revenue is measured at the fair value of consideration received or receivable on the basis that it meets the recognition criteria set out as follows:
Sale of goods and services Revenue is recognised when the significant risks and rewards of ownership have been transferred to the customer, when it is probable the revenue will be received and the amount of revenue can be reliably measured. Service revenue is recognised based on the stage of completion of the contract with the customer.
6. EXPENSES FROM CONTINUING OPERATIONS
2016
$M 2015
$M
Depreciation and amortisation Depreciation – property, plant and equipment 1 838.2 888.2 Amortisation – property, plant and equipment 162.4 154.1 Amortisation – intangible assets 21.8 21.2 1,022.4 1,063.5 Impairment Impairment of property, plant and equipment 2 201.3 – Impairment of intangible assets 2 320.0 – 521.3 – Employee benefits expense Remuneration and on-costs 7,085.4 6,507.3 Superannuation expense 563.5 512.8 Share-based payments expense 20.8 26.6 7,669.7 7,046.7 Net loss on disposal and write-off of property, plant and equipment 24.0 44.7 Operating lease rental expense Minimum lease payments 2,005.5 1,911.0 Contingent rentals 28.4 40.3 2,033.9 1,951.3 1 2015 includes $88.7 million relating to significant items (refer to Note 3). 2 Included in significant items (refer to Note 3 and Note 13).
Notes to the Consolidated Financial Statements: Group Performance
6 EXPENSES FROM CONTINUING OPERATIONS
5 REVENUE FROM CONTINUING OPERATIONS
68F
or p
erso
nal u
se o
nly
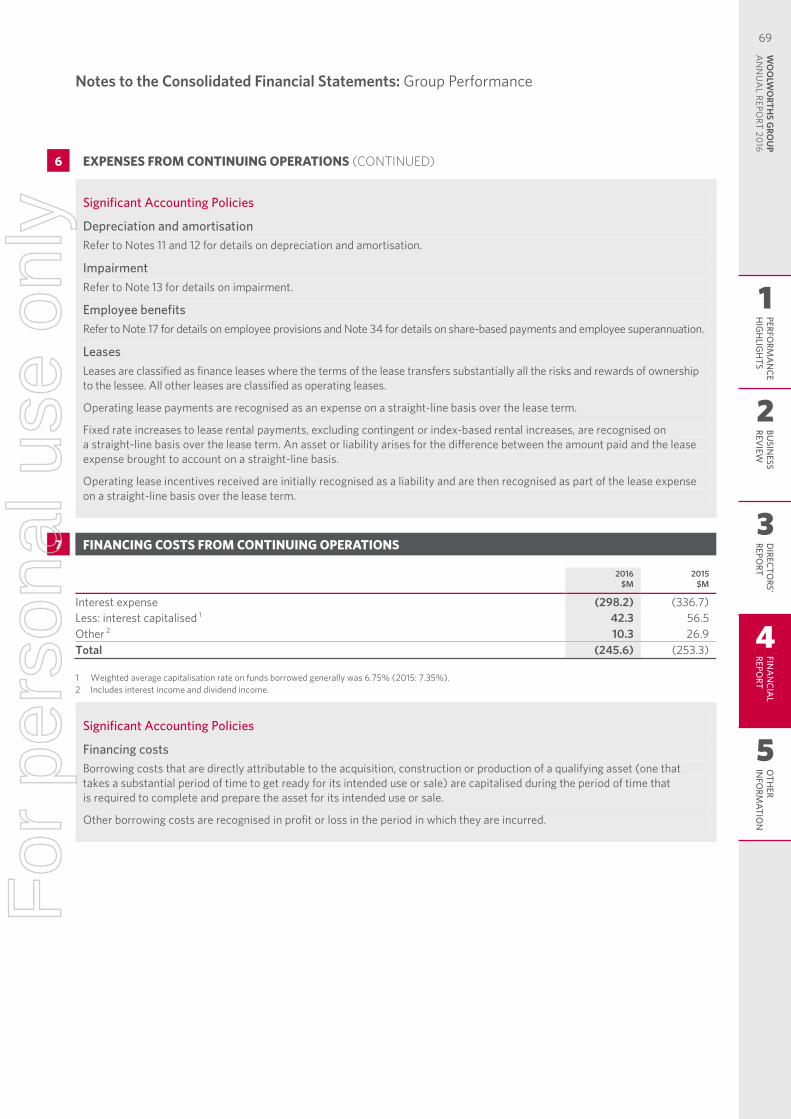
Notes to the Consolidated Financial Statements Group Performance
19 | WOOLWORTHS LIMITED | FINANCIAL REPORT 2016
Significant Accounting Policies
Depreciation and amortisation Refer to Notes 11 and 12 for details on depreciation and amortisation.
Impairment Refer to Note 13 for details on impairment.
Employee benefits Refer to Note 17 for details on employee provisions and Note 34 for details on share-based payments and employee superannuation.
Leases Leases are classified as finance leases where the terms of the lease transfers substantially all the risks and rewards of ownership to the lessee. All other leases are classified as operating leases.
Operating lease payments are recognised as an expense on a straight-line basis over the lease term.
Fixed rate increases to lease rental payments, excluding contingent or index-based rental increases, are recognised on a straight-line basis over the lease term. An asset or liability arises for the difference between the amount paid and the lease expense brought to account on a straight-line basis.
Operating lease incentives received are initially recognised as a liability and are then recognised as part of the lease expense on a straight-line basis over the lease term.
7. FINANCING COSTS FROM CONTINUING OPERATIONS
2016
$M 2015
$M
Interest expense (298.2) (336.7) Less: interest capitalised 1 42.3 56.5 Other 2 10.3 26.9 Total (245.6) (253.3) 1 Weighted average capitalisation rate on funds borrowed generally was 6.75% (2015: 7.35%). 2 Includes interest income and dividend income.
Significant Accounting Policies
Financing costs Borrowing costs that are directly attributable to the acquisition, construction or production of a qualifying asset (one that takes a substantial period of time to get ready for its intended use or sale) are capitalised during the period of time that is required to complete and prepare the asset for its intended use or sale.
Other borrowing costs are recognised in profit or loss in the period in which they are incurred.
6. EXPENSES FROM CONTINUING OPERATIONS CONTINUED
Notes to the Consolidated Financial Statements: Group Performance
7 FINANCING COSTS FROM CONTINUING OPERATIONS
6 EXPENSES FROM CONTINUING OPERATIONS (CONTINUED)
1
2
3
4
5
PERFORM
AN
CEH
IGH
LIGH
TSBU
SINESS
REVIEW
DIRECTO
RS' REPO
RTFIN
AN
CIAL
REPORT
OTH
ER IN
FORM
ATION
WO
OLW
ORTH
S GRO
UP
AN
NU
AL REPO
RT 2016
69F
or p
erso
nal u
se o
nly
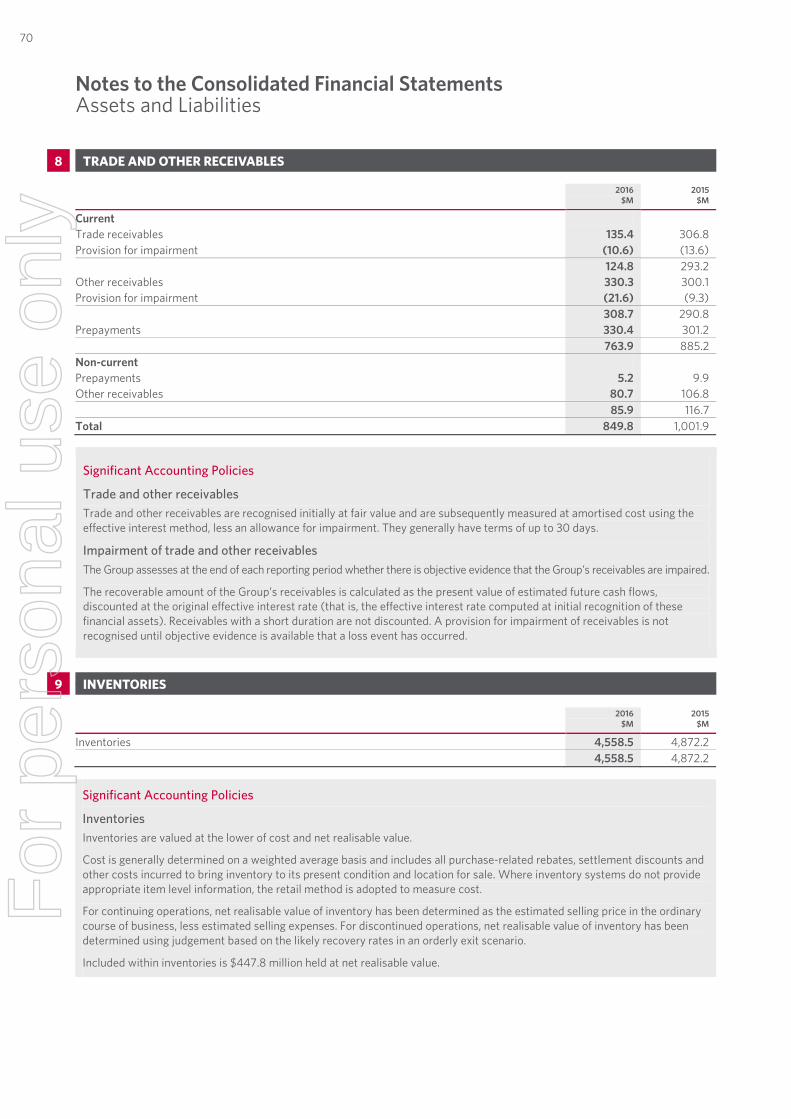
Notes to the Consolidated Financial Statements Assets and Liabilities
20 | WOOLWORTHS LIMITED | FINANCIAL REPORT 2016
8. TRADE AND OTHER RECEIVABLES
2016
$M 2015
$M
Current Trade receivables 135.4 306.8 Provision for impairment (10.6) (13.6) 124.8 293.2 Other receivables 330.3 300.1 Provision for impairment (21.6) (9.3) 308.7 290.8 Prepayments 330.4 301.2 763.9 885.2 Non-current Prepayments 5.2 9.9 Other receivables 80.7 106.8 85.9 116.7 Total 849.8 1,001.9
Significant Accounting Policies
Trade and other receivables Trade and other receivables are recognised initially at fair value and are subsequently measured at amortised cost using the effective interest method, less an allowance for impairment. They generally have terms of up to 30 days.
Impairment of trade and other receivables The Group assesses at the end of each reporting period whether there is objective evidence that the Group’s receivables are impaired.
The recoverable amount of the Group’s receivables is calculated as the present value of estimated future cash flows, discounted at the original effective interest rate (that is, the effective interest rate computed at initial recognition of these financial assets). Receivables with a short duration are not discounted. A provision for impairment of receivables is not recognised until objective evidence is available that a loss event has occurred.
9. INVENTORIES
2016
$M 2015
$M
Inventories 4,558.5 4,872.2 4,558.5 4,872.2
Significant Accounting Policies
Inventories Inventories are valued at the lower of cost and net realisable value.
Cost is generally determined on a weighted average basis and includes all purchase-related rebates, settlement discounts and other costs incurred to bring inventory to its present condition and location for sale. Where inventory systems do not provide appropriate item level information, the retail method is adopted to measure cost.
For continuing operations, net realisable value of inventory has been determined as the estimated selling price in the ordinary course of business, less estimated selling expenses. For discontinued operations, net realisable value of inventory has been determined using judgement based on the likely recovery rates in an orderly exit scenario.
Included within inventories is $447.8 million held at net realisable value.
Notes to the Consolidated Financial StatementsAssets and Liabilities
9 INVENTORIES
8 TRADE AND OTHER RECEIVABLES
70F
or p
erso
nal u
se o
nly
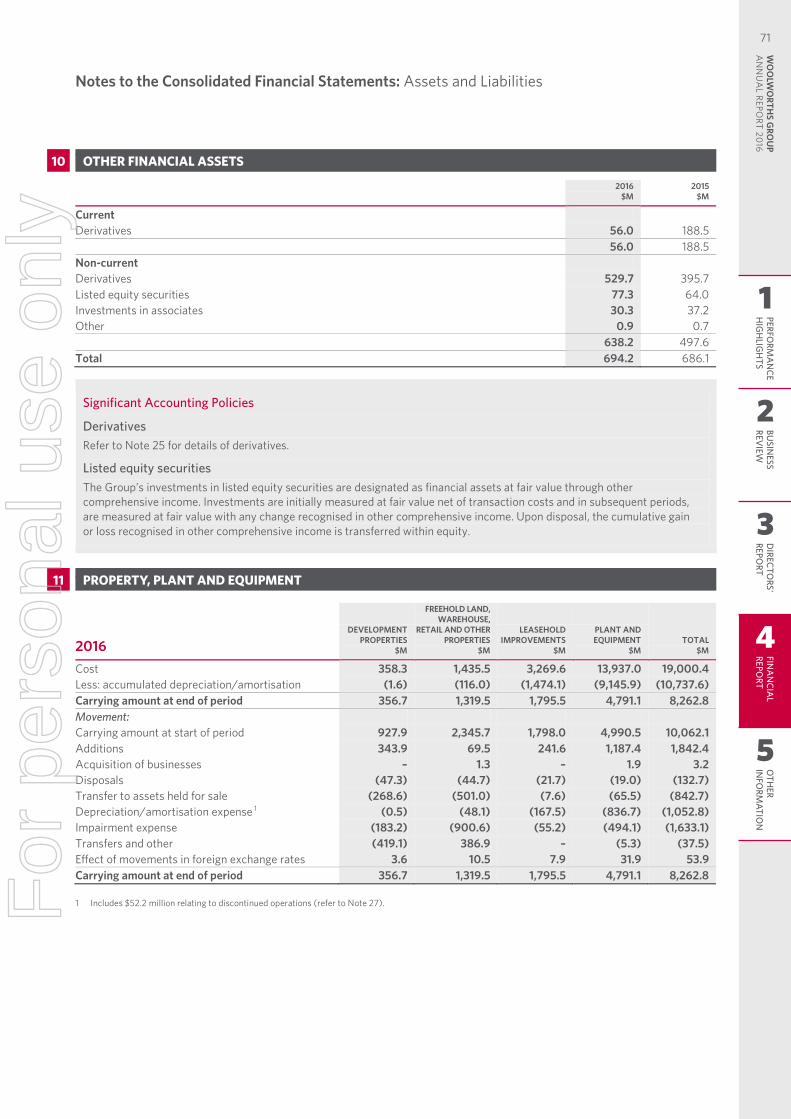
Notes to the Consolidated Financial Statements Assets and Liabilities
21 | WOOLWORTHS LIMITED | FINANCIAL REPORT 2016
10. OTHER FINANCIAL ASSETS
2016
$M 2015
$M
Current Derivatives 56.0 188.5 56.0 188.5 Non-current Derivatives 529.7 395.7 Listed equity securities 77.3 64.0 Investments in associates 30.3 37.2 Other 0.9 0.7 638.2 497.6 Total 694.2 686.1
Significant Accounting Policies
Derivatives Refer to Note 25 for details of derivatives.
Listed equity securities The Group’s investments in listed equity securities are designated as financial assets at fair value through other comprehensive income. Investments are initially measured at fair value net of transaction costs and in subsequent periods, are measured at fair value with any change recognised in other comprehensive income. Upon disposal, the cumulative gain or loss recognised in other comprehensive income is transferred within equity.
11. PROPERTY, PLANT AND EQUIPMENT
2016 DEVELOPMENT
PROPERTIES $M
FREEHOLD LAND, WAREHOUSE,
RETAIL AND OTHER PROPERTIES
$M
LEASEHOLD IMPROVEMENTS
$M
PLANT AND EQUIPMENT
$M TOTAL
$M
Cost 358.3 1,435.5 3,269.6 13,937.0 19,000.4 Less: accumulated depreciation/amortisation (1.6) (116.0) (1,474.1) (9,145.9) (10,737.6) Carrying amount at end of period 356.7 1,319.5 1,795.5 4,791.1 8,262.8 Movement: Carrying amount at start of period 927.9 2,345.7 1,798.0 4,990.5 10,062.1 Additions 343.9 69.5 241.6 1,187.4 1,842.4 Acquisition of businesses – 1.3 – 1.9 3.2 Disposals (47.3) (44.7) (21.7) (19.0) (132.7) Transfer to assets held for sale (268.6) (501.0) (7.6) (65.5) (842.7) Depreciation/amortisation expense 1 (0.5) (48.1) (167.5) (836.7) (1,052.8) Impairment expense (183.2) (900.6) (55.2) (494.1) (1,633.1) Transfers and other (419.1) 386.9 – (5.3) (37.5) Effect of movements in foreign exchange rates 3.6 10.5 7.9 31.9 53.9 Carrying amount at end of period 356.7 1,319.5 1,795.5 4,791.1 8,262.8 1 Includes $52.2 million relating to discontinued operations (refer to Note 27).
Notes to the Consolidated Financial Statements: Assets and Liabilities
11 PROPERTY, PLANT AND EQUIPMENT
10 OTHER FINANCIAL ASSETS
1
2
3
4
5
PERFORM
AN
CEH
IGH
LIGH
TSBU
SINESS
REVIEW
DIRECTO
RS' REPO
RTFIN
AN
CIAL
REPORT
OTH
ER IN
FORM
ATION
WO
OLW
ORTH
S GRO
UP
AN
NU
AL REPO
RT 2016
71F
or p
erso
nal u
se o
nly
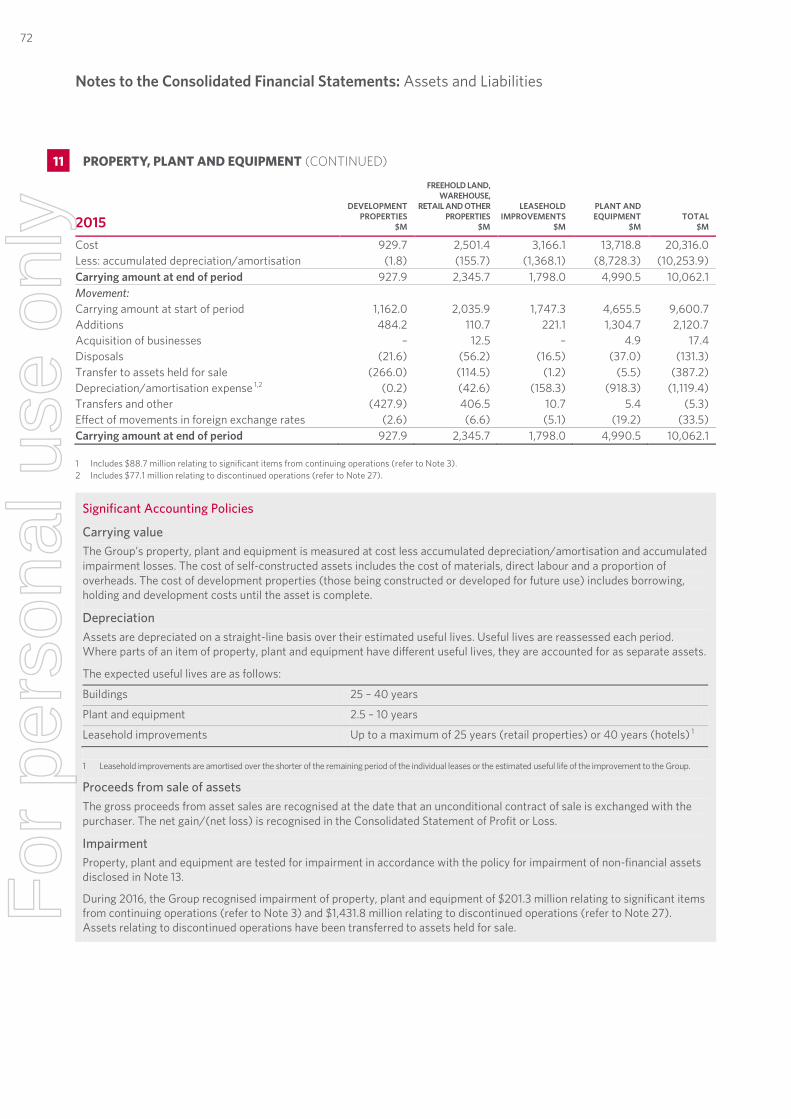
Notes to the Consolidated Financial Statements Assets and Liabilities
22 | WOOLWORTHS LIMITED | FINANCIAL REPORT 2016
2015 DEVELOPMENT
PROPERTIES $M
FREEHOLD LAND, WAREHOUSE,
RETAIL AND OTHER PROPERTIES
$M
LEASEHOLD IMPROVEMENTS
$M
PLANT AND EQUIPMENT
$M TOTAL
$M
Cost 929.7 2,501.4 3,166.1 13,718.8 20,316.0 Less: accumulated depreciation/amortisation (1.8) (155.7) (1,368.1) (8,728.3) (10,253.9) Carrying amount at end of period 927.9 2,345.7 1,798.0 4,990.5 10,062.1 Movement: Carrying amount at start of period 1,162.0 2,035.9 1,747.3 4,655.5 9,600.7 Additions 484.2 110.7 221.1 1,304.7 2,120.7 Acquisition of businesses – 12.5 – 4.9 17.4 Disposals (21.6) (56.2) (16.5) (37.0) (131.3) Transfer to assets held for sale (266.0) (114.5) (1.2) (5.5) (387.2) Depreciation/amortisation expense 1,2 (0.2) (42.6) (158.3) (918.3) (1,119.4) Transfers and other (427.9) 406.5 10.7 5.4 (5.3) Effect of movements in foreign exchange rates (2.6) (6.6) (5.1) (19.2) (33.5) Carrying amount at end of period 927.9 2,345.7 1,798.0 4,990.5 10,062.1 1 Includes $88.7 million relating to significant items from continuing operations (refer to Note 3). 2 Includes $77.1 million relating to discontinued operations (refer to Note 27).
Significant Accounting Policies
Carrying value The Group’s property, plant and equipment is measured at cost less accumulated depreciation/amortisation and accumulated impairment losses. The cost of self-constructed assets includes the cost of materials, direct labour and a proportion of overheads. The cost of development properties (those being constructed or developed for future use) includes borrowing, holding and development costs until the asset is complete.
Depreciation Assets are depreciated on a straight-line basis over their estimated useful lives. Useful lives are reassessed each period. Where parts of an item of property, plant and equipment have different useful lives, they are accounted for as separate assets.
The expected useful lives are as follows:
Buildings 25 – 40 years
Plant and equipment 2.5 – 10 years
Leasehold improvements Up to a maximum of 25 years (retail properties) or 40 years (hotels) 1
1 Leasehold improvements are amortised over the shorter of the remaining period of the individual leases or the estimated useful life of the improvement to the Group.
Proceeds from sale of assets The gross proceeds from asset sales are recognised at the date that an unconditional contract of sale is exchanged with the purchaser. The net gain/(net loss) is recognised in the Consolidated Statement of Profit or Loss.
Impairment Property, plant and equipment are tested for impairment in accordance with the policy for impairment of non-financial assets disclosed in Note 13.
During 2016, the Group recognised impairment of property, plant and equipment of $201.3 million relating to significant items from continuing operations (refer to Note 3) and $1,431.8 million relating to discontinued operations (refer to Note 27). Assets relating to discontinued operations have been transferred to assets held for sale.
11. PROPERTY, PLANT AND EQUIPMENT CONTINUED
Notes to the Consolidated Financial Statements: Assets and Liabilities
11 PROPERTY, PLANT AND EQUIPMENT (CONTINUED)
72F
or p
erso
nal u
se o
nly
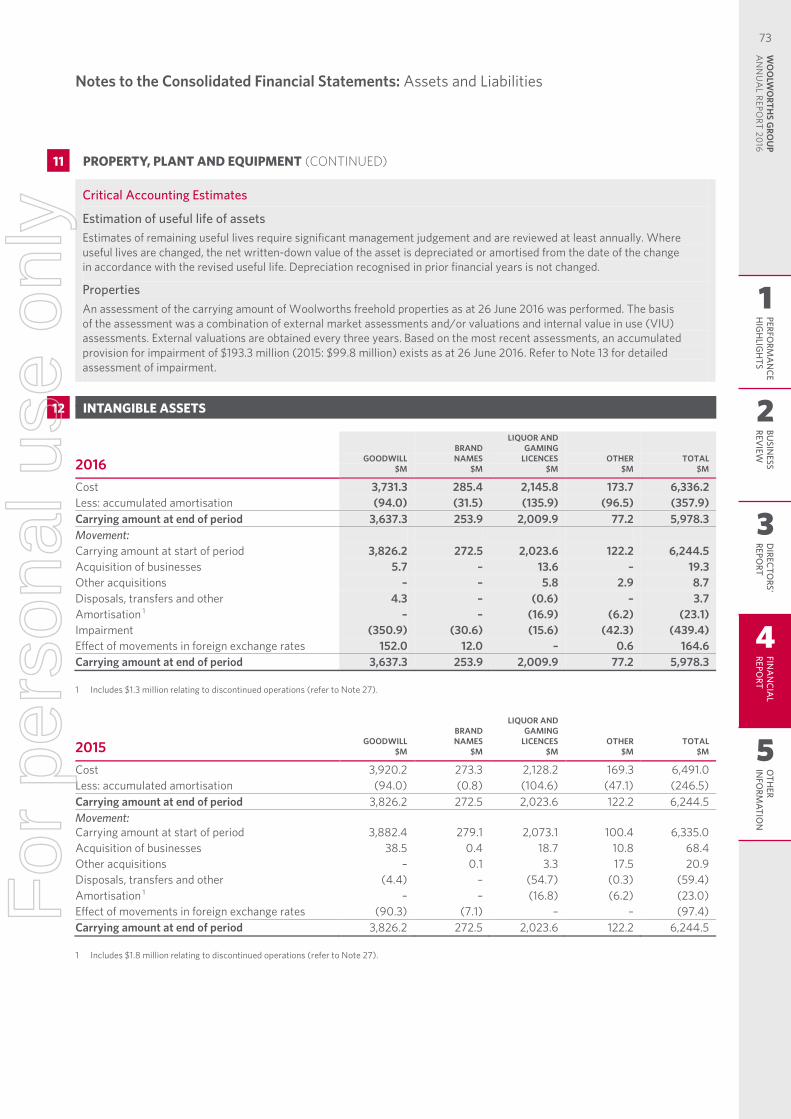
Notes to the Consolidated Financial Statements Assets and Liabilities
23 | WOOLWORTHS LIMITED | FINANCIAL REPORT 2016
Critical Accounting Estimates
Estimation of useful life of assets Estimates of remaining useful lives require significant management judgement and are reviewed at least annually. Where useful lives are changed, the net written-down value of the asset is depreciated or amortised from the date of the change in accordance with the revised useful life. Depreciation recognised in prior financial years is not changed.
Properties An assessment of the carrying amount of Woolworths freehold properties as at 26 June 2016 was performed. The basis of the assessment was a combination of external market assessments and/or valuations and internal value in use (VIU) assessments. External valuations are obtained every three years. Based on the most recent assessments, an accumulated provision for impairment of $193.3 million (2015: $99.8 million) exists as at 26 June 2016. Refer to Note 13 for detailed assessment of impairment.
12. INTANGIBLE ASSETS
2016 GOODWILL $M
BRAND NAMES
$M
LIQUOR AND GAMING
LICENCES $M
OTHER $M
TOTAL $M
Cost 3,731.3 285.4 2,145.8 173.7 6,336.2 Less: accumulated amortisation (94.0) (31.5) (135.9) (96.5) (357.9) Carrying amount at end of period 3,637.3 253.9 2,009.9 77.2 5,978.3 Movement: Carrying amount at start of period 3,826.2 272.5 2,023.6 122.2 6,244.5 Acquisition of businesses 5.7 – 13.6 – 19.3 Other acquisitions – – 5.8 2.9 8.7 Disposals, transfers and other 4.3 – (0.6) – 3.7 Amortisation 1 – – (16.9) (6.2) (23.1) Impairment (350.9) (30.6) (15.6) (42.3) (439.4) Effect of movements in foreign exchange rates 152.0 12.0 – 0.6 164.6 Carrying amount at end of period 3,637.3 253.9 2,009.9 77.2 5,978.3 1 Includes $1.3 million relating to discontinued operations (refer to Note 27).
2015 GOODWILL $M
BRAND NAMES
$M
LIQUOR AND GAMING
LICENCES $M
OTHER $M
TOTAL $M
Cost 3,920.2 273.3 2,128.2 169.3 6,491.0 Less: accumulated amortisation (94.0) (0.8) (104.6) (47.1) (246.5) Carrying amount at end of period 3,826.2 272.5 2,023.6 122.2 6,244.5 Movement: Carrying amount at start of period
3,882.4
279.1
2,073.1
100.4
6,335.0
Acquisition of businesses 38.5 0.4 18.7 10.8 68.4 Other acquisitions – 0.1 3.3 17.5 20.9 Disposals, transfers and other (4.4) – (54.7) (0.3) (59.4) Amortisation 1 – – (16.8) (6.2) (23.0) Effect of movements in foreign exchange rates (90.3) (7.1) – – (97.4) Carrying amount at end of period 3,826.2 272.5 2,023.6 122.2 6,244.5 1 Includes $1.8 million relating to discontinued operations (refer to Note 27).
11. PROPERTY, PLANT AND EQUIPMENT CONTINUED
Notes to the Consolidated Financial Statements: Assets and Liabilities
11 PROPERTY, PLANT AND EQUIPMENT (CONTINUED)
12 INTANGIBLE ASSETS
1
2
3
4
5
PERFORM
AN
CEH
IGH
LIGH
TSBU
SINESS
REVIEW
DIRECTO
RS' REPO
RTFIN
AN
CIAL
REPORT
OTH
ER IN
FORM
ATION
WO
OLW
ORTH
S GRO
UP
AN
NU
AL REPO
RT 2016
73F
or p
erso
nal u
se o
nly
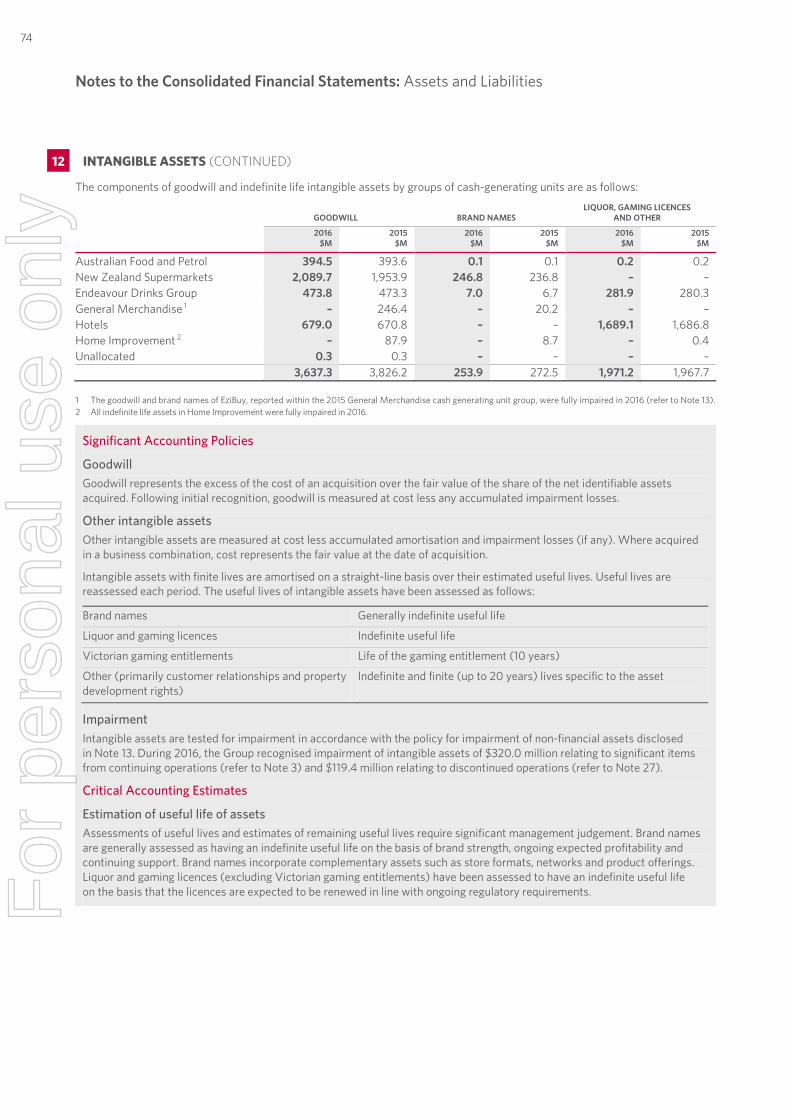
Notes to the Consolidated Financial Statements Assets and Liabilities
24 | WOOLWORTHS LIMITED | FINANCIAL REPORT 2016
The components of goodwill and indefinite life intangible assets by groups of cash-generating units are as follows:
GOODWILL BRAND NAMES LIQUOR, GAMING LICENCES
AND OTHER
2016
$M 2015
$M 2016
$M 2015
$M 2016
$M 2015
$M
Australian Food and Petrol 394.5 393.6 0.1 0.1 0.2 0.2 New Zealand Supermarkets 2,089.7 1,953.9 246.8 236.8 – – Endeavour Drinks Group 473.8 473.3 7.0 6.7 281.9 280.3 General Merchandise 1 – 246.4 – 20.2 – – Hotels 679.0 670.8 – – 1,689.1 1,686.8 Home Improvement 2 – 87.9 – 8.7 – 0.4 Unallocated 0.3 0.3 – – – – 3,637.3 3,826.2 253.9 272.5 1,971.2 1,967.7 1 The goodwill and brand names of EziBuy, reported within the 2015 General Merchandise cash generating unit group, were fully impaired in 2016 (refer to Note 13). 2 All indefinite life assets in Home Improvement were fully impaired in 2016.
Significant Accounting Policies
Goodwill Goodwill represents the excess of the cost of an acquisition over the fair value of the share of the net identifiable assets acquired. Following initial recognition, goodwill is measured at cost less any accumulated impairment losses.
Other intangible assets Other intangible assets are measured at cost less accumulated amortisation and impairment losses (if any). Where acquired in a business combination, cost represents the fair value at the date of acquisition.
Intangible assets with finite lives are amortised on a straight-line basis over their estimated useful lives. Useful lives are reassessed each period. The useful lives of intangible assets have been assessed as follows:
Brand names Generally indefinite useful life
Liquor and gaming licences Indefinite useful life
Victorian gaming entitlements Life of the gaming entitlement (10 years)
Other (primarily customer relationships and property development rights)
Indefinite and finite (up to 20 years) lives specific to the asset
Impairment Intangible assets are tested for impairment in accordance with the policy for impairment of non-financial assets disclosed in Note 13. During 2016, the Group recognised impairment of intangible assets of $320.0 million relating to significant items from continuing operations (refer to Note 3) and $119.4 million relating to discontinued operations (refer to Note 27).
Critical Accounting Estimates
Estimation of useful life of assets Assessments of useful lives and estimates of remaining useful lives require significant management judgement. Brand names are generally assessed as having an indefinite useful life on the basis of brand strength, ongoing expected profitability and continuing support. Brand names incorporate complementary assets such as store formats, networks and product offerings. Liquor and gaming licences (excluding Victorian gaming entitlements) have been assessed to have an indefinite useful life on the basis that the licences are expected to be renewed in line with ongoing regulatory requirements.
12. INTANGIBLE ASSETS CONTINUED
Notes to the Consolidated Financial Statements: Assets and Liabilities
12 INTANGIBLE ASSETS (CONTINUED)
74F
or p
erso
nal u
se o
nly
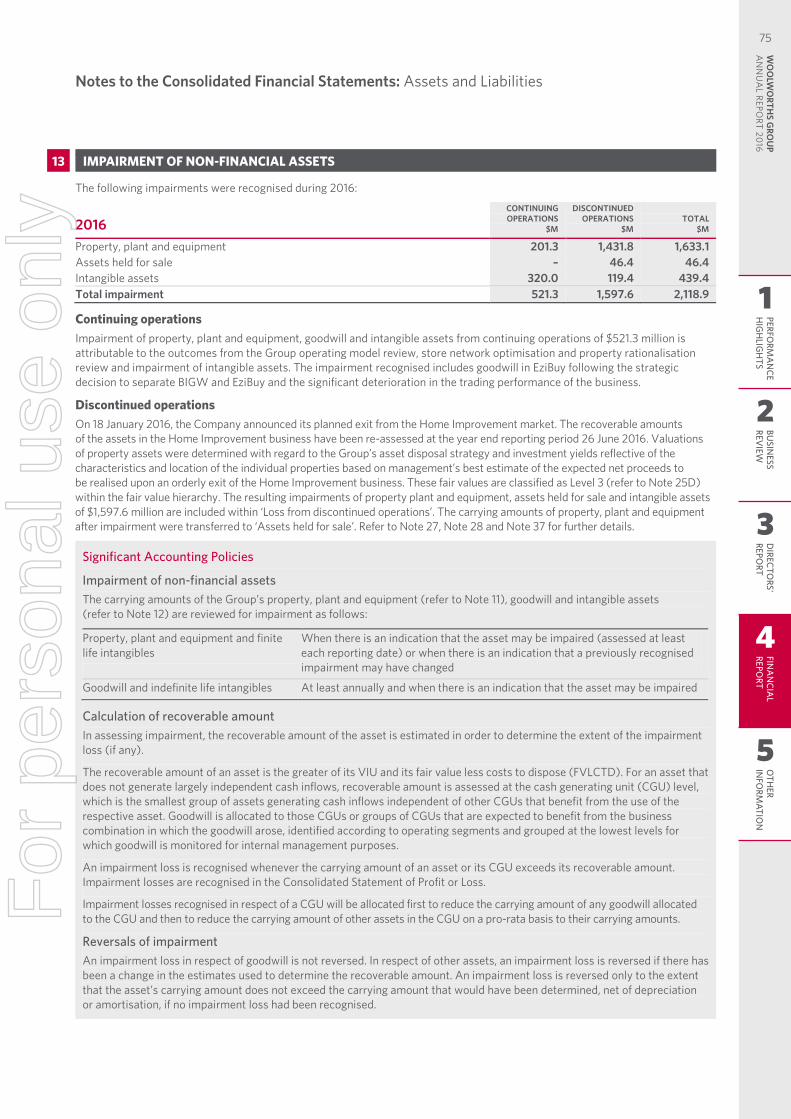
Notes to the Consolidated Financial Statements Assets and Liabilities
25 | WOOLWORTHS LIMITED | FINANCIAL REPORT 2016
13. IMPAIRMENT OF NON-FINANCIAL ASSETS
The following impairments were recognised during 2016:
2016 CONTINUING OPERATIONS
$M
DISCONTINUED OPERATIONS
$M TOTAL
$M
Property, plant and equipment 201.3 1,431.8 1,633.1 Assets held for sale – 46.4 46.4 Intangible assets 320.0 119.4 439.4 Total impairment 521.3 1,597.6 2,118.9
Continuing operations Impairment of property, plant and equipment, goodwill and intangible assets from continuing operations of $521.3 million is attributable to the outcomes from the Group operating model review, store network optimisation and property rationalisation review and impairment of intangible assets. The impairment recognised includes goodwill in EziBuy following the strategic decision to separate BIGW and EziBuy and the significant deterioration in the trading performance of the business.
Discontinued operations On 18 January 2016, the Company announced its planned exit from the Home Improvement market. The recoverable amounts of the assets in the Home Improvement business have been re-assessed at the year end reporting period 26 June 2016. Valuations of property assets were determined with regard to the Group’s asset disposal strategy and investment yields reflective of the characteristics and location of the individual properties based on management’s best estimate of the expected net proceeds to be realised upon an orderly exit of the Home Improvement business. These fair values are classified as Level 3 (refer to Note 25D) within the fair value hierarchy. The resulting impairments of property plant and equipment, assets held for sale and intangible assets of $1,597.6 million are included within ‘Loss from discontinued operations’. The carrying amounts of property, plant and equipment after impairment were transferred to ‘Assets held for sale’. Refer to Note 27, Note 28 and Note 37 for further details.
Significant Accounting Policies
Impairment of non-financial assets The carrying amounts of the Group’s property, plant and equipment (refer to Note 11), goodwill and intangible assets (refer to Note 12) are reviewed for impairment as follows:
Property, plant and equipment and finite life intangibles
When there is an indication that the asset may be impaired (assessed at least each reporting date) or when there is an indication that a previously recognised impairment may have changed
Goodwill and indefinite life intangibles At least annually and when there is an indication that the asset may be impaired
Calculation of recoverable amount In assessing impairment, the recoverable amount of the asset is estimated in order to determine the extent of the impairment loss (if any).
The recoverable amount of an asset is the greater of its VIU and its fair value less costs to dispose (FVLCTD). For an asset that does not generate largely independent cash inflows, recoverable amount is assessed at the cash generating unit (CGU) level, which is the smallest group of assets generating cash inflows independent of other CGUs that benefit from the use of the respective asset. Goodwill is allocated to those CGUs or groups of CGUs that are expected to benefit from the business combination in which the goodwill arose, identified according to operating segments and grouped at the lowest levels for which goodwill is monitored for internal management purposes.
An impairment loss is recognised whenever the carrying amount of an asset or its CGU exceeds its recoverable amount. Impairment losses are recognised in the Consolidated Statement of Profit or Loss.
Impairment losses recognised in respect of a CGU will be allocated first to reduce the carrying amount of any goodwill allocated to the CGU and then to reduce the carrying amount of other assets in the CGU on a pro-rata basis to their carrying amounts.
Reversals of impairment An impairment loss in respect of goodwill is not reversed. In respect of other assets, an impairment loss is reversed if there has been a change in the estimates used to determine the recoverable amount. An impairment loss is reversed only to the extent that the asset’s carrying amount does not exceed the carrying amount that would have been determined, net of depreciation or amortisation, if no impairment loss had been recognised.
Notes to the Consolidated Financial Statements: Assets and Liabilities
13 IMPAIRMENT OF NON-FINANCIAL ASSETS
1
2
3
4
5
PERFORM
AN
CEH
IGH
LIGH
TSBU
SINESS
REVIEW
DIRECTO
RS' REPO
RTFIN
AN
CIAL
REPORT
OTH
ER IN
FORM
ATION
WO
OLW
ORTH
S GRO
UP
AN
NU
AL REPO
RT 2016
75F
or p
erso
nal u
se o
nly
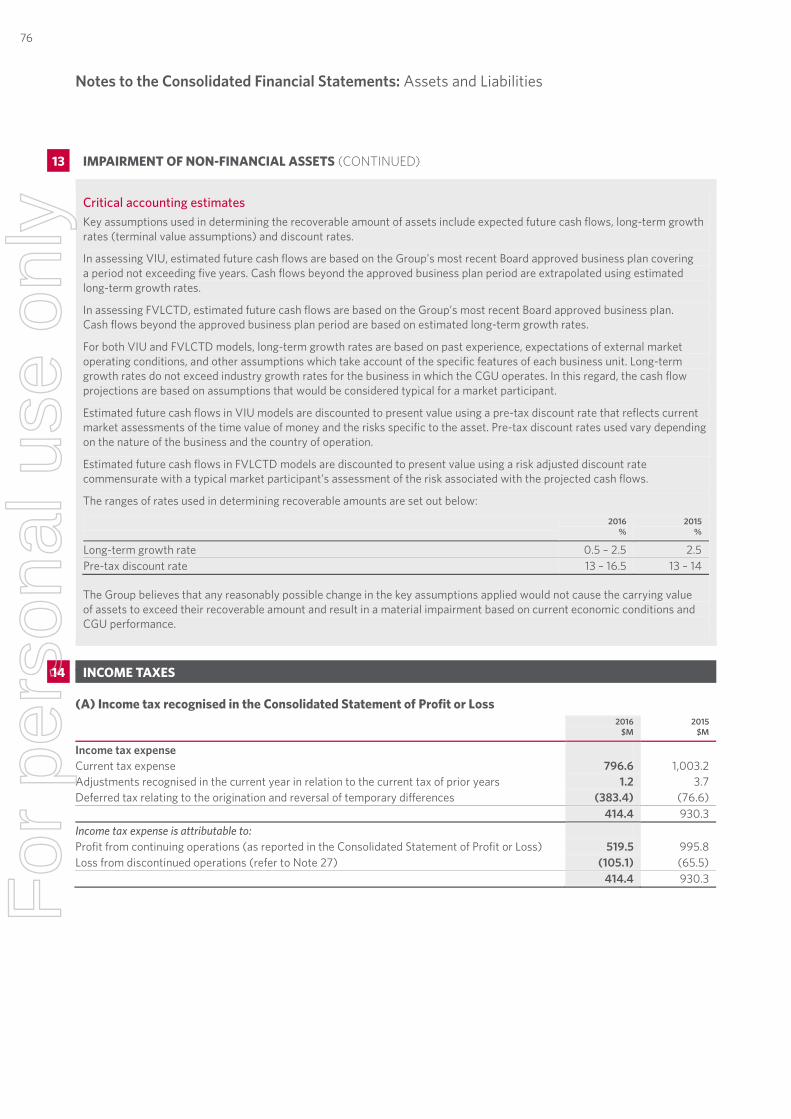
Notes to the Consolidated Financial Statements Assets and Liabilities
26 | WOOLWORTHS LIMITED | FINANCIAL REPORT 2016
Critical accounting estimates Key assumptions used in determining the recoverable amount of assets include expected future cash flows, long-term growth rates (terminal value assumptions) and discount rates.
In assessing VIU, estimated future cash flows are based on the Group’s most recent Board approved business plan covering a period not exceeding five years. Cash flows beyond the approved business plan period are extrapolated using estimated long-term growth rates.
In assessing FVLCTD, estimated future cash flows are based on the Group’s most recent Board approved business plan. Cash flows beyond the approved business plan period are based on estimated long-term growth rates.
For both VIU and FVLCTD models, long-term growth rates are based on past experience, expectations of external market operating conditions, and other assumptions which take account of the specific features of each business unit. Long-term growth rates do not exceed industry growth rates for the business in which the CGU operates. In this regard, the cash flow projections are based on assumptions that would be considered typical for a market participant.
Estimated future cash flows in VIU models are discounted to present value using a pre-tax discount rate that reflects current market assessments of the time value of money and the risks specific to the asset. Pre-tax discount rates used vary depending on the nature of the business and the country of operation.
Estimated future cash flows in FVLCTD models are discounted to present value using a risk adjusted discount rate commensurate with a typical market participant’s assessment of the risk associated with the projected cash flows.
The ranges of rates used in determining recoverable amounts are set out below:
2016 %
2015 %
Long-term growth rate 0.5 – 2.5 2.5 Pre-tax discount rate 13 – 16.5 13 – 14 The Group believes that any reasonably possible change in the key assumptions applied would not cause the carrying value of assets to exceed their recoverable amount and result in a material impairment based on current economic conditions and CGU performance.
14. INCOME TAXES
(A) Income tax recognised in the Consolidated Statement of Profit or Loss
2016
$M 2015
$M
Income tax expense Current tax expense 796.6 1,003.2 Adjustments recognised in the current year in relation to the current tax of prior years 1.2 3.7 Deferred tax relating to the origination and reversal of temporary differences (383.4) (76.6) 414.4 930.3 Income tax expense is attributable to: Profit from continuing operations (as reported in the Consolidated Statement of Profit or Loss) 519.5 995.8 Loss from discontinued operations (refer to Note 27) (105.1) (65.5) 414.4 930.3
13. IMPAIRMENT OF NON-FINANCIAL ASSETS CONTINUED
Notes to the Consolidated Financial Statements: Assets and Liabilities
13 IMPAIRMENT OF NON-FINANCIAL ASSETS (CONTINUED)
14 INCOME TAXES
76F
or p
erso
nal u
se o
nly
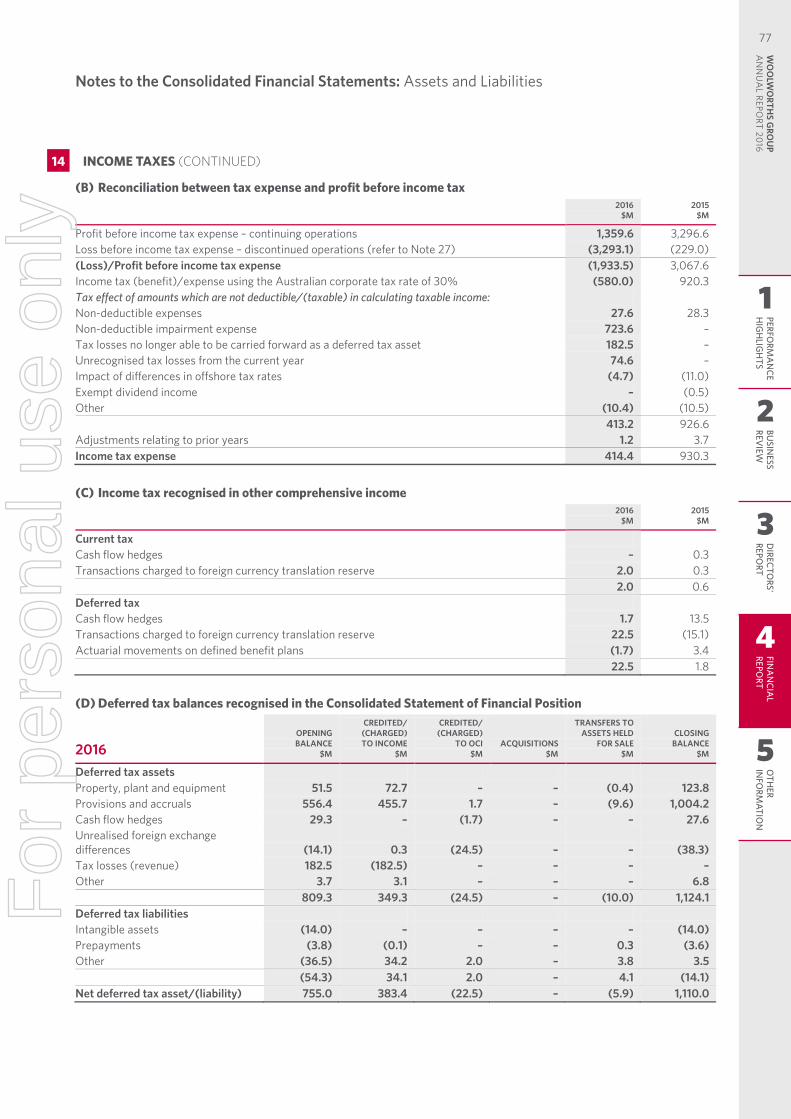
Notes to the Consolidated Financial Statements Assets and Liabilities
27 | WOOLWORTHS LIMITED | FINANCIAL REPORT 2016
(B) Reconciliation between tax expense and profit before income tax
2016
$M 2015
$M
Profit before income tax expense – continuing operations 1,359.6 3,296.6 Loss before income tax expense – discontinued operations (refer to Note 27) (3,293.1) (229.0) (Loss)/Profit before income tax expense (1,933.5) 3,067.6 Income tax (benefit)/expense using the Australian corporate tax rate of 30% (580.0) 920.3 Tax effect of amounts which are not deductible/(taxable) in calculating taxable income: Non-deductible expenses 27.6 28.3 Non-deductible impairment expense 723.6 – Tax losses no longer able to be carried forward as a deferred tax asset 182.5 – Unrecognised tax losses from the current year 74.6 – Impact of differences in offshore tax rates (4.7) (11.0) Exempt dividend income – (0.5) Other (10.4) (10.5) 413.2 926.6 Adjustments relating to prior years 1.2 3.7 Income tax expense 414.4 930.3
(C) Income tax recognised in other comprehensive income
2016
$M 2015
$M
Current tax Cash flow hedges – 0.3 Transactions charged to foreign currency translation reserve 2.0 0.3 2.0 0.6 Deferred tax Cash flow hedges 1.7 13.5 Transactions charged to foreign currency translation reserve 22.5 (15.1) Actuarial movements on defined benefit plans (1.7) 3.4 22.5 1.8
(D) Deferred tax balances recognised in the Consolidated Statement of Financial Position
2016
OPENING BALANCE
$M
CREDITED/ (CHARGED) TO INCOME
$M
CREDITED/ (CHARGED)
TO OCI $M
ACQUISITIONS $M
TRANSFERS TO ASSETS HELD
FOR SALE $M
CLOSING BALANCE
$M
Deferred tax assets Property, plant and equipment 51.5 72.7 – – (0.4) 123.8 Provisions and accruals 556.4 455.7 1.7 – (9.6) 1,004.2 Cash flow hedges 29.3 – (1.7) – – 27.6 Unrealised foreign exchange differences (14.1) 0.3 (24.5) – – (38.3) Tax losses (revenue) 182.5 (182.5) – – – – Other 3.7 3.1 – – – 6.8 809.3 349.3 (24.5) – (10.0) 1,124.1 Deferred tax liabilities Intangible assets (14.0) – – – – (14.0) Prepayments (3.8) (0.1) – – 0.3 (3.6) Other (36.5) 34.2 2.0 – 3.8 3.5 (54.3) 34.1 2.0 – 4.1 (14.1) Net deferred tax asset/(liability) 755.0 383.4 (22.5) – (5.9) 1,110.0
14. INCOME TAXES CONTINUED
Notes to the Consolidated Financial Statements: Assets and Liabilities
14 INCOME TAXES (CONTINUED)
1
2
3
4
5
PERFORM
AN
CEH
IGH
LIGH
TSBU
SINESS
REVIEW
DIRECTO
RS' REPO
RTFIN
AN
CIAL
REPORT
OTH
ER IN
FORM
ATION
WO
OLW
ORTH
S GRO
UP
AN
NU
AL REPO
RT 2016
77F
or p
erso
nal u
se o
nly
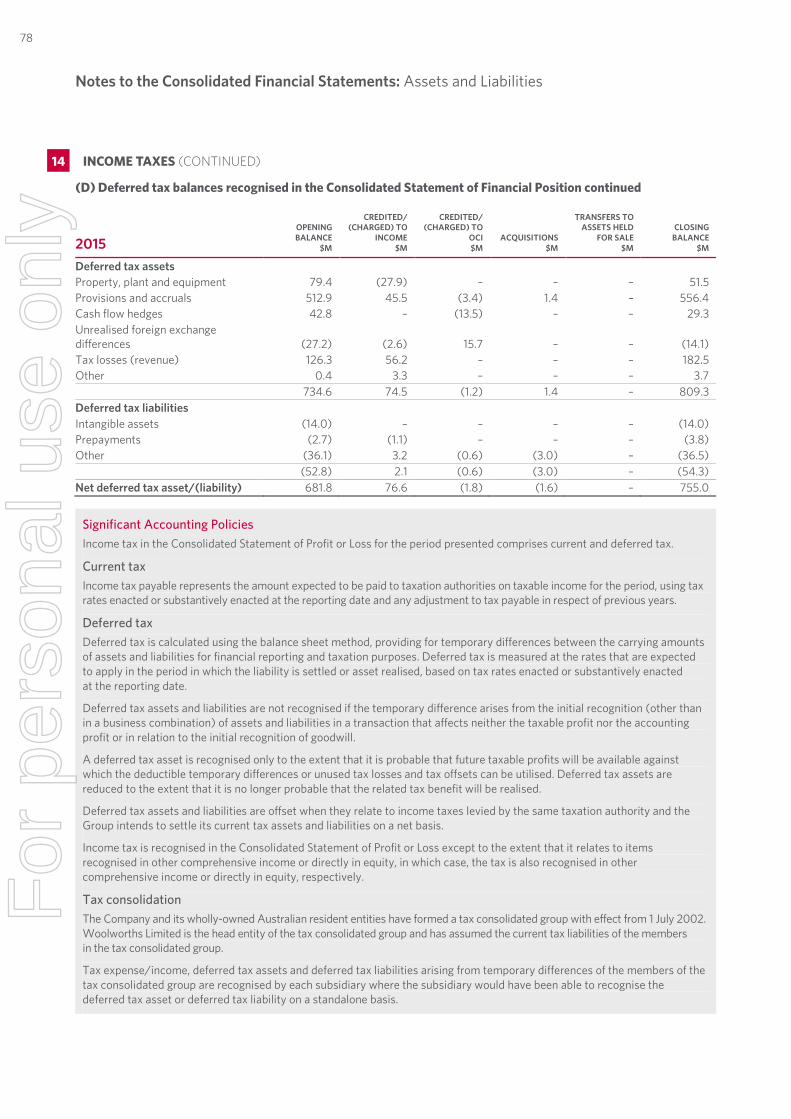
Notes to the Consolidated Financial Statements Assets and Liabilities
28 | WOOLWORTHS LIMITED | FINANCIAL REPORT 2016
(D) Deferred tax balances recognised in the Consolidated Statement of Financial Position continued
2015 OPENING BALANCE
$M
CREDITED/ (CHARGED) TO
INCOME $M
CREDITED/ (CHARGED) TO
OCI $M
ACQUISITIONS $M
TRANSFERS TO ASSETS HELD
FOR SALE $M
CLOSING BALANCE
$M
Deferred tax assets Property, plant and equipment 79.4 (27.9) – – – 51.5 Provisions and accruals 512.9 45.5 (3.4) 1.4 – 556.4 Cash flow hedges 42.8 – (13.5) – – 29.3 Unrealised foreign exchange differences (27.2) (2.6) 15.7 – – (14.1) Tax losses (revenue) 126.3 56.2 – – – 182.5 Other 0.4 3.3 – – – 3.7 734.6 74.5 (1.2) 1.4 – 809.3 Deferred tax liabilities Intangible assets (14.0) – – – – (14.0) Prepayments (2.7) (1.1) – – – (3.8) Other (36.1) 3.2 (0.6) (3.0) – (36.5) (52.8) 2.1 (0.6) (3.0) – (54.3) Net deferred tax asset/(liability) 681.8 76.6 (1.8) (1.6) – 755.0
Significant Accounting Policies Income tax in the Consolidated Statement of Profit or Loss for the period presented comprises current and deferred tax.
Current tax Income tax payable represents the amount expected to be paid to taxation authorities on taxable income for the period, using tax rates enacted or substantively enacted at the reporting date and any adjustment to tax payable in respect of previous years.
Deferred tax Deferred tax is calculated using the balance sheet method, providing for temporary differences between the carrying amounts of assets and liabilities for financial reporting and taxation purposes. Deferred tax is measured at the rates that are expected to apply in the period in which the liability is settled or asset realised, based on tax rates enacted or substantively enacted at the reporting date.
Deferred tax assets and liabilities are not recognised if the temporary difference arises from the initial recognition (other than in a business combination) of assets and liabilities in a transaction that affects neither the taxable profit nor the accounting profit or in relation to the initial recognition of goodwill.
A deferred tax asset is recognised only to the extent that it is probable that future taxable profits will be available against which the deductible temporary differences or unused tax losses and tax offsets can be utilised. Deferred tax assets are reduced to the extent that it is no longer probable that the related tax benefit will be realised.
Deferred tax assets and liabilities are offset when they relate to income taxes levied by the same taxation authority and the Group intends to settle its current tax assets and liabilities on a net basis.
Income tax is recognised in the Consolidated Statement of Profit or Loss except to the extent that it relates to items recognised in other comprehensive income or directly in equity, in which case, the tax is also recognised in other comprehensive income or directly in equity, respectively.
Tax consolidation The Company and its wholly-owned Australian resident entities have formed a tax consolidated group with effect from 1 July 2002. Woolworths Limited is the head entity of the tax consolidated group and has assumed the current tax liabilities of the members in the tax consolidated group.
Tax expense/income, deferred tax assets and deferred tax liabilities arising from temporary differences of the members of the tax consolidated group are recognised by each subsidiary where the subsidiary would have been able to recognise the deferred tax asset or deferred tax liability on a standalone basis.
14. INCOME TAXES CONTINUED
Notes to the Consolidated Financial Statements: Assets and Liabilities
14 INCOME TAXES (CONTINUED)
78F
or p
erso
nal u
se o
nly
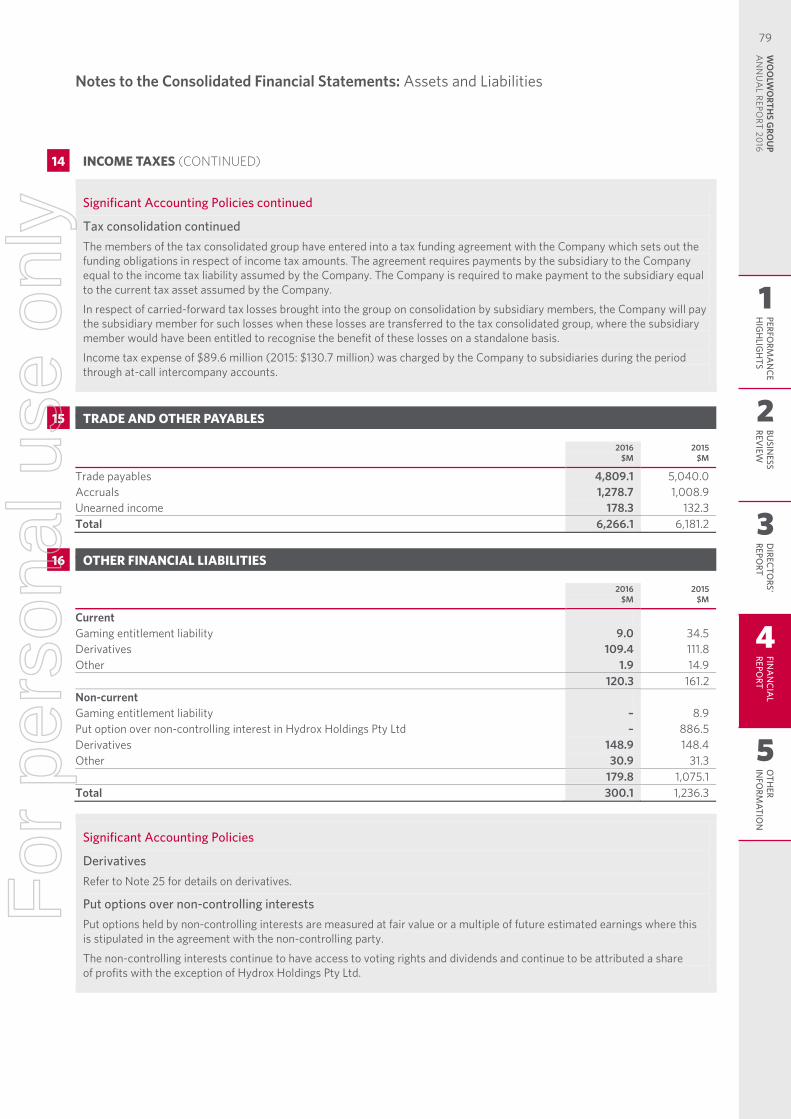
Notes to the Consolidated Financial Statements Assets and Liabilities
29 | WOOLWORTHS LIMITED | FINANCIAL REPORT 2016
Significant Accounting Policies continued
Tax consolidation continued The members of the tax consolidated group have entered into a tax funding agreement with the Company which sets out the funding obligations in respect of income tax amounts. The agreement requires payments by the subsidiary to the Company equal to the income tax liability assumed by the Company. The Company is required to make payment to the subsidiary equal to the current tax asset assumed by the Company.
In respect of carried-forward tax losses brought into the group on consolidation by subsidiary members, the Company will pay the subsidiary member for such losses when these losses are transferred to the tax consolidated group, where the subsidiary member would have been entitled to recognise the benefit of these losses on a standalone basis.
Income tax expense of $89.6 million (2015: $130.7 million) was charged by the Company to subsidiaries during the period through at-call intercompany accounts.
15. TRADE AND OTHER PAYABLES
2016
$M 2015
$M
Trade payables 4,809.1 5,040.0 Accruals 1,278.7 1,008.9 Unearned income 178.3 132.3 Total 6,266.1 6,181.2
16. OTHER FINANCIAL LIABILITIES
2016
$M 2015
$M
Current Gaming entitlement liability 9.0 34.5 Derivatives 109.4 111.8 Other 1.9 14.9 120.3 161.2 Non-current Gaming entitlement liability – 8.9 Put option over non-controlling interest in Hydrox Holdings Pty Ltd – 886.5 Derivatives 148.9 148.4 Other 30.9 31.3 179.8 1,075.1 Total 300.1 1,236.3
Significant Accounting Policies
Derivatives Refer to Note 25 for details on derivatives.
Put options over non-controlling interests Put options held by non-controlling interests are measured at fair value or a multiple of future estimated earnings where this is stipulated in the agreement with the non-controlling party.
The non-controlling interests continue to have access to voting rights and dividends and continue to be attributed a share of profits with the exception of Hydrox Holdings Pty Ltd.
14. INCOME TAXES CONTINUED
Notes to the Consolidated Financial Statements: Assets and Liabilities
14 INCOME TAXES (CONTINUED)
15 TRADE AND OTHER PAYABLES
16 OTHER FINANCIAL LIABILITIES
1
2
3
4
5
PERFORM
AN
CEH
IGH
LIGH
TSBU
SINESS
REVIEW
DIRECTO
RS' REPO
RTFIN
AN
CIAL
REPORT
OTH
ER IN
FORM
ATION
WO
OLW
ORTH
S GRO
UP
AN
NU
AL REPO
RT 2016
79F
or p
erso
nal u
se o
nly
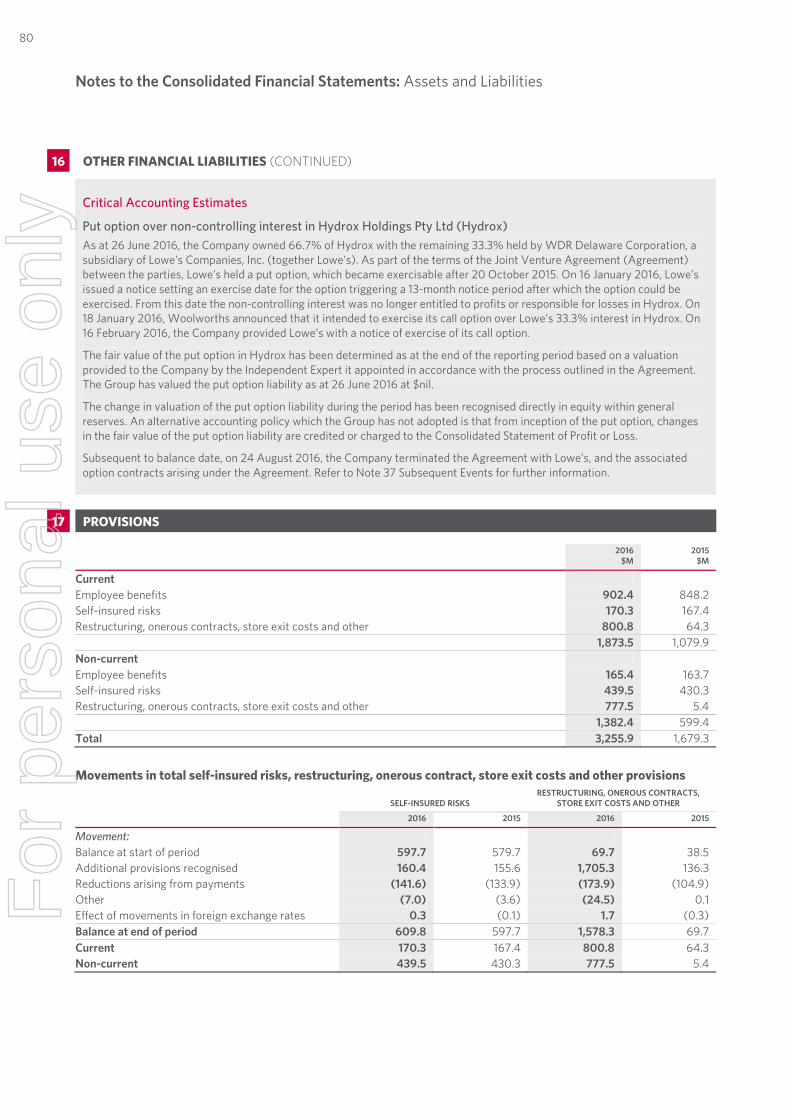
Notes to the Consolidated Financial Statements Assets and Liabilities
30 | WOOLWORTHS LIMITED | FINANCIAL REPORT 2016
Critical Accounting Estimates
Put option over non-controlling interest in Hydrox Holdings Pty Ltd (Hydrox) As at 26 June 2016, the Company owned 66.7% of Hydrox with the remaining 33.3% held by WDR Delaware Corporation, a subsidiary of Lowe's Companies, Inc. (together Lowe's). As part of the terms of the Joint Venture Agreement (Agreement) between the parties, Lowe’s held a put option, which became exercisable after 20 October 2015. On 16 January 2016, Lowe’s issued a notice setting an exercise date for the option triggering a 13-month notice period after which the option could be exercised. From this date the non-controlling interest was no longer entitled to profits or responsible for losses in Hydrox. On 18 January 2016, Woolworths announced that it intended to exercise its call option over Lowe’s 33.3% interest in Hydrox. On 16 February 2016, the Company provided Lowe’s with a notice of exercise of its call option.
The fair value of the put option in Hydrox has been determined as at the end of the reporting period based on a valuation provided to the Company by the Independent Expert it appointed in accordance with the process outlined in the Agreement. The Group has valued the put option liability as at 26 June 2016 at $nil.
The change in valuation of the put option liability during the period has been recognised directly in equity within general reserves. An alternative accounting policy which the Group has not adopted is that from inception of the put option, changes in the fair value of the put option liability are credited or charged to the Consolidated Statement of Profit or Loss.
Subsequent to balance date, on 24 August 2016, the Company terminated the Agreement with Lowe’s, and the associated option contracts arising under the Agreement. Refer to Note 37 Subsequent Events for further information.
17. PROVISIONS
2016
$M 2015
$M
Current Employee benefits 902.4 848.2 Self-insured risks 170.3 167.4 Restructuring, onerous contracts, store exit costs and other 800.8 64.3 1,873.5 1,079.9 Non-current Employee benefits 165.4 163.7 Self-insured risks 439.5 430.3 Restructuring, onerous contracts, store exit costs and other 777.5 5.4 1,382.4 599.4 Total 3,255.9 1,679.3
Movements in total self-insured risks, restructuring, onerous contract, store exit costs and other provisions
SELF-INSURED RISKS RESTRUCTURING, ONEROUS CONTRACTS,
STORE EXIT COSTS AND OTHER
2016 2015 2016 2015
Movement: Balance at start of period 597.7 579.7 69.7 38.5 Additional provisions recognised 160.4 155.6 1,705.3 136.3 Reductions arising from payments (141.6) (133.9) (173.9) (104.9) Other (7.0) (3.6) (24.5) 0.1 Effect of movements in foreign exchange rates 0.3 (0.1) 1.7 (0.3) Balance at end of period 609.8 597.7 1,578.3 69.7 Current 170.3 167.4 800.8 64.3 Non-current 439.5 430.3 777.5 5.4
16. OTHER FINANCIAL LIABILITIES CONTINUED
Notes to the Consolidated Financial Statements: Assets and Liabilities
16 OTHER FINANCIAL LIABILITIES (CONTINUED)
17 PROVISIONS
80F
or p
erso
nal u
se o
nly
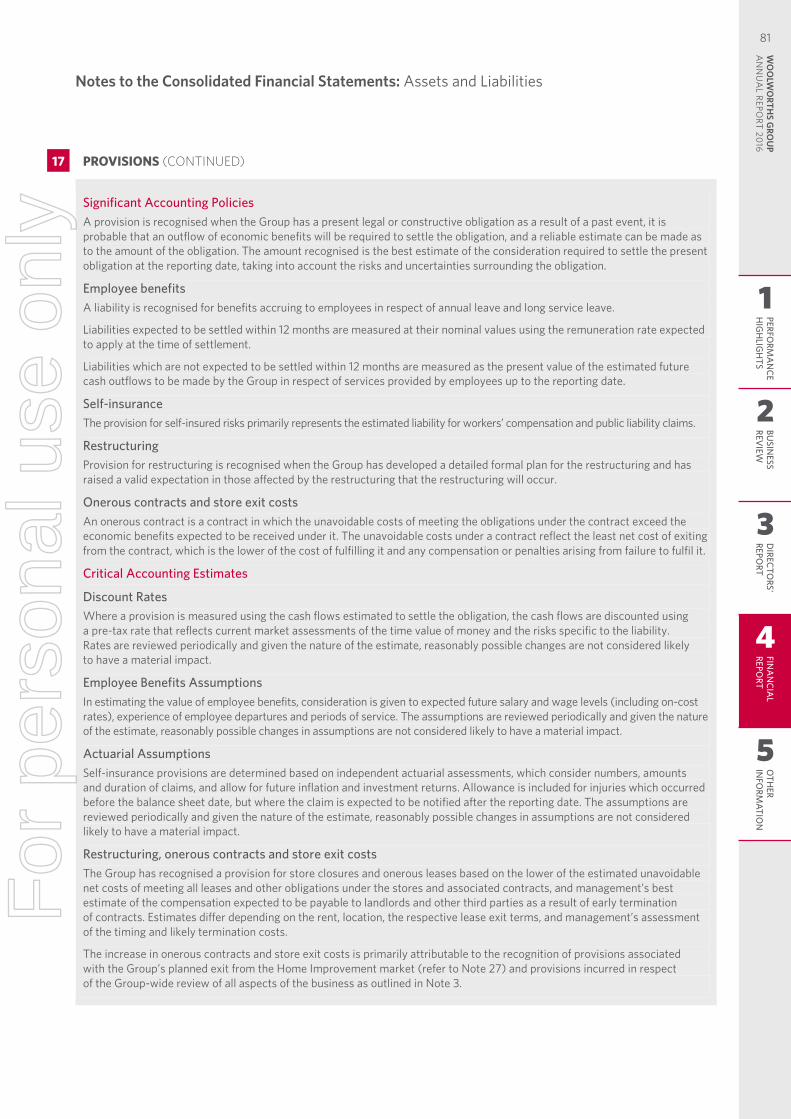
Notes to the Consolidated Financial Statements Assets and Liabilities
31 | WOOLWORTHS LIMITED | FINANCIAL REPORT 2016
Significant Accounting Policies A provision is recognised when the Group has a present legal or constructive obligation as a result of a past event, it is probable that an outflow of economic benefits will be required to settle the obligation, and a reliable estimate can be made as to the amount of the obligation. The amount recognised is the best estimate of the consideration required to settle the present obligation at the reporting date, taking into account the risks and uncertainties surrounding the obligation.
Employee benefits A liability is recognised for benefits accruing to employees in respect of annual leave and long service leave.
Liabilities expected to be settled within 12 months are measured at their nominal values using the remuneration rate expected to apply at the time of settlement.
Liabilities which are not expected to be settled within 12 months are measured as the present value of the estimated future cash outflows to be made by the Group in respect of services provided by employees up to the reporting date.
Self-insurance The provision for self-insured risks primarily represents the estimated liability for workers’ compensation and public liability claims.
Restructuring Provision for restructuring is recognised when the Group has developed a detailed formal plan for the restructuring and has raised a valid expectation in those affected by the restructuring that the restructuring will occur.
Onerous contracts and store exit costs An onerous contract is a contract in which the unavoidable costs of meeting the obligations under the contract exceed the economic benefits expected to be received under it. The unavoidable costs under a contract reflect the least net cost of exiting from the contract, which is the lower of the cost of fulfilling it and any compensation or penalties arising from failure to fulfil it.
Critical Accounting Estimates
Discount Rates Where a provision is measured using the cash flows estimated to settle the obligation, the cash flows are discounted using a pre-tax rate that reflects current market assessments of the time value of money and the risks specific to the liability. Rates are reviewed periodically and given the nature of the estimate, reasonably possible changes are not considered likely to have a material impact.
Employee Benefits Assumptions In estimating the value of employee benefits, consideration is given to expected future salary and wage levels (including on-cost rates), experience of employee departures and periods of service. The assumptions are reviewed periodically and given the nature of the estimate, reasonably possible changes in assumptions are not considered likely to have a material impact.
Actuarial Assumptions Self-insurance provisions are determined based on independent actuarial assessments, which consider numbers, amounts and duration of claims, and allow for future inflation and investment returns. Allowance is included for injuries which occurred before the balance sheet date, but where the claim is expected to be notified after the reporting date. The assumptions are reviewed periodically and given the nature of the estimate, reasonably possible changes in assumptions are not considered likely to have a material impact.
Restructuring, onerous contracts and store exit costs The Group has recognised a provision for store closures and onerous leases based on the lower of the estimated unavoidable net costs of meeting all leases and other obligations under the stores and associated contracts, and management’s best estimate of the compensation expected to be payable to landlords and other third parties as a result of early termination of contracts. Estimates differ depending on the rent, location, the respective lease exit terms, and management’s assessment of the timing and likely termination costs.
The increase in onerous contracts and store exit costs is primarily attributable to the recognition of provisions associated with the Group’s planned exit from the Home Improvement market (refer to Note 27) and provisions incurred in respect of the Group-wide review of all aspects of the business as outlined in Note 3.
17. PROVISIONS CONTINUED
Notes to the Consolidated Financial Statements: Assets and Liabilities
17 PROVISIONS (CONTINUED)
1
2
3
4
5
PERFORM
AN
CEH
IGH
LIGH
TSBU
SINESS
REVIEW
DIRECTO
RS' REPO
RTFIN
AN
CIAL
REPORT
OTH
ER IN
FORM
ATION
WO
OLW
ORTH
S GRO
UP
AN
NU
AL REPO
RT 2016
81F
or p
erso
nal u
se o
nly
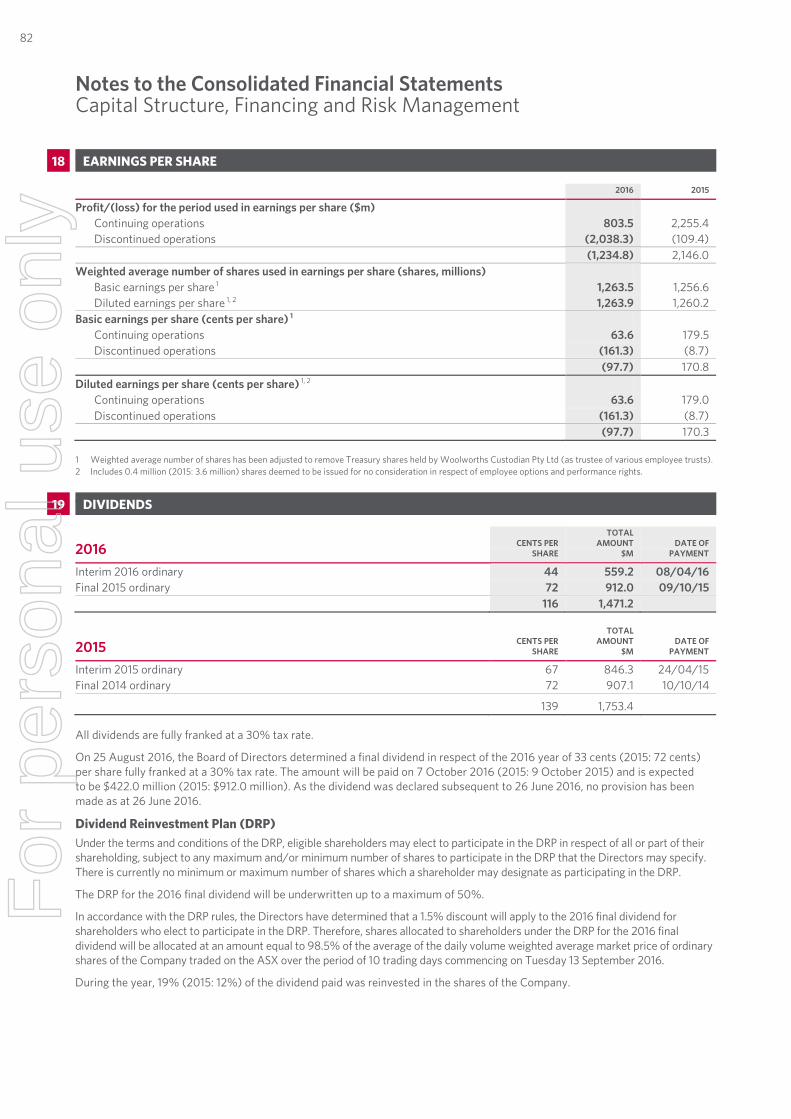
Notes to the Consolidated Financial Statements Capital Structure, Financing and Risk Management
32 | WOOLWORTHS LIMITED | FINANCIAL REPORT 2016
18. EARNINGS PER SHARE
2016 2015
Profit/(loss) for the period used in earnings per share ($m) Continuing operations 803.5 2,255.4 Discontinued operations (2,038.3) (109.4)
(1,234.8) 2,146.0 Weighted average number of shares used in earnings per share (shares, millions)
Basic earnings per share 1 1,263.5 1,256.6 Diluted earnings per share 1, 2 1,263.9 1,260.2
Basic earnings per share (cents per share) 1 Continuing operations 63.6 179.5 Discontinued operations (161.3) (8.7)
(97.7) 170.8 Diluted earnings per share (cents per share) 1, 2
Continuing operations 63.6 179.0 Discontinued operations (161.3) (8.7)
(97.7) 170.3 1 Weighted average number of shares has been adjusted to remove Treasury shares held by Woolworths Custodian Pty Ltd (as trustee of various employee trusts). 2 Includes 0.4 million (2015: 3.6 million) shares deemed to be issued for no consideration in respect of employee options and performance rights.
19. DIVIDENDS
2016 CENTS PER SHARE
TOTAL AMOUNT
$M DATE OF
PAYMENT
Interim 2016 ordinary 44 559.2 08/04/16 Final 2015 ordinary 72 912.0 09/10/15 116 1,471.2
2015 CENTS PER SHARE
TOTAL AMOUNT
$M DATE OF
PAYMENT
Interim 2015 ordinary 67 846.3 24/04/15 Final 2014 ordinary 72 907.1 10/10/14
139 1,753.4 All dividends are fully franked at a 30% tax rate.
On 25 August 2016, the Board of Directors determined a final dividend in respect of the 2016 year of 33 cents (2015: 72 cents) per share fully franked at a 30% tax rate. The amount will be paid on 7 October 2016 (2015: 9 October 2015) and is expected to be $422.0 million (2015: $912.0 million). As the dividend was declared subsequent to 26 June 2016, no provision has been made as at 26 June 2016.
Dividend Reinvestment Plan (DRP) Under the terms and conditions of the DRP, eligible shareholders may elect to participate in the DRP in respect of all or part of their shareholding, subject to any maximum and/or minimum number of shares to participate in the DRP that the Directors may specify. There is currently no minimum or maximum number of shares which a shareholder may designate as participating in the DRP.
The DRP for the 2016 final dividend will be underwritten up to a maximum of 50%.
In accordance with the DRP rules, the Directors have determined that a 1.5% discount will apply to the 2016 final dividend for shareholders who elect to participate in the DRP. Therefore, shares allocated to shareholders under the DRP for the 2016 final dividend will be allocated at an amount equal to 98.5% of the average of the daily volume weighted average market price of ordinary shares of the Company traded on the ASX over the period of 10 trading days commencing on Tuesday 13 September 2016.
During the year, 19% (2015: 12%) of the dividend paid was reinvested in the shares of the Company.
Notes to the Consolidated Financial StatementsCapital Structure, Financing and Risk Management
18 EARNINGS PER SHARE
19 DIVIDENDS
82F
or p
erso
nal u
se o
nly
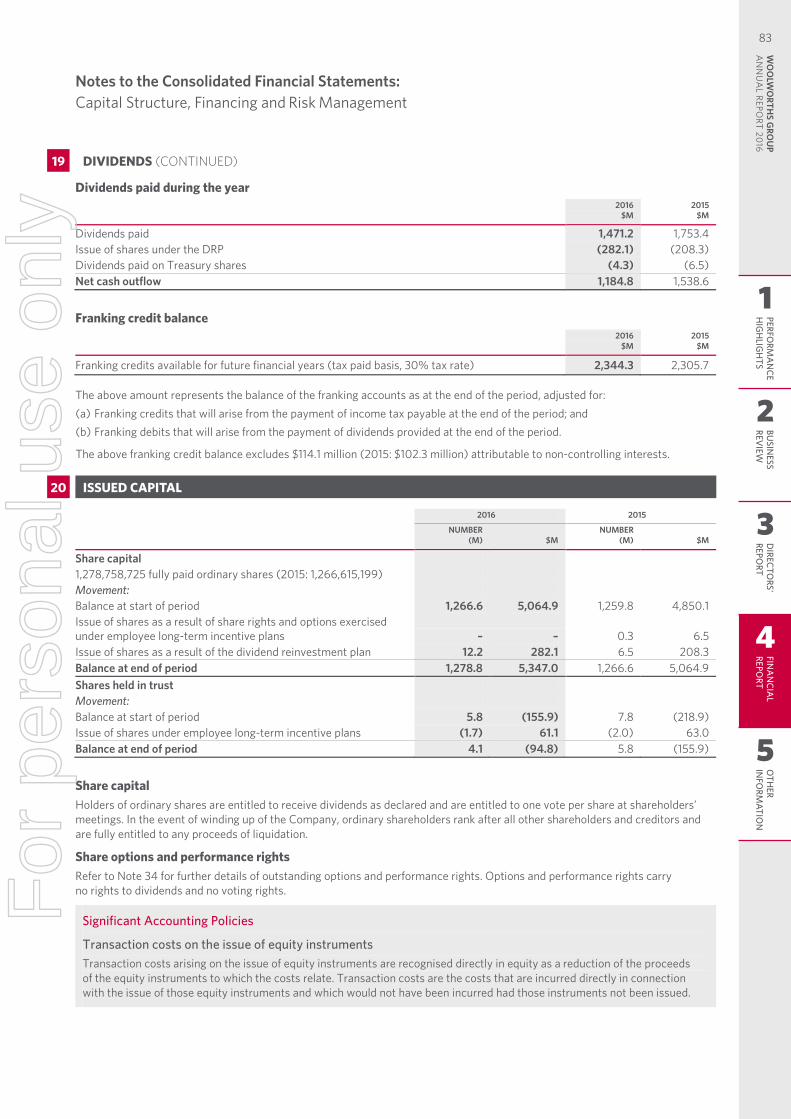
Notes to the Consolidated Financial Statements Capital Structure, Financing and Risk Management
33 | WOOLWORTHS LIMITED | FINANCIAL REPORT 2016
Dividends paid during the year
2016
$M 2015
$M
Dividends paid 1,471.2 1,753.4 Issue of shares under the DRP (282.1) (208.3) Dividends paid on Treasury shares (4.3) (6.5) Net cash outflow 1,184.8 1,538.6
Franking credit balance
2016
$M 2015
$M
Franking credits available for future financial years (tax paid basis, 30% tax rate) 2,344.3 2,305.7 The above amount represents the balance of the franking accounts as at the end of the period, adjusted for: (a) Franking credits that will arise from the payment of income tax payable at the end of the period; and (b) Franking debits that will arise from the payment of dividends provided at the end of the period.
The above franking credit balance excludes $114.1 million (2015: $102.3 million) attributable to non-controlling interests.
20. ISSUED CAPITAL
2016 2015
NUMBER
(M) $M NUMBER
(M) $M
Share capital 1,278,758,725 fully paid ordinary shares (2015: 1,266,615,199) Movement: Balance at start of period 1,266.6 5,064.9 1,259.8 4,850.1 Issue of shares as a result of share rights and options exercised under employee long-term incentive plans – – 0.3 6.5 Issue of shares as a result of the dividend reinvestment plan 12.2 282.1 6.5 208.3 Balance at end of period 1,278.8 5,347.0 1,266.6 5,064.9 Shares held in trust Movement: Balance at start of period 5.8 (155.9) 7.8 (218.9) Issue of shares under employee long-term incentive plans (1.7) 61.1 (2.0) 63.0 Balance at end of period 4.1 (94.8) 5.8 (155.9)
Share capital Holders of ordinary shares are entitled to receive dividends as declared and are entitled to one vote per share at shareholders’ meetings. In the event of winding up of the Company, ordinary shareholders rank after all other shareholders and creditors and are fully entitled to any proceeds of liquidation.
Share options and performance rights Refer to Note 34 for further details of outstanding options and performance rights. Options and performance rights carry no rights to dividends and no voting rights.
Significant Accounting Policies
Transaction costs on the issue of equity instruments Transaction costs arising on the issue of equity instruments are recognised directly in equity as a reduction of the proceeds of the equity instruments to which the costs relate. Transaction costs are the costs that are incurred directly in connection with the issue of those equity instruments and which would not have been incurred had those instruments not been issued.
19. DIVIDENDS CONTINUED
Notes to the Consolidated Financial Statements: Capital Structure, Financing and Risk Management
19 DIVIDENDS (CONTINUED)
20 ISSUED CAPITAL
1
2
3
4
5
PERFORM
AN
CEH
IGH
LIGH
TSBU
SINESS
REVIEW
DIRECTO
RS' REPO
RTFIN
AN
CIAL
REPORT
OTH
ER IN
FORM
ATION
WO
OLW
ORTH
S GRO
UP
AN
NU
AL REPO
RT 2016
83F
or p
erso
nal u
se o
nly
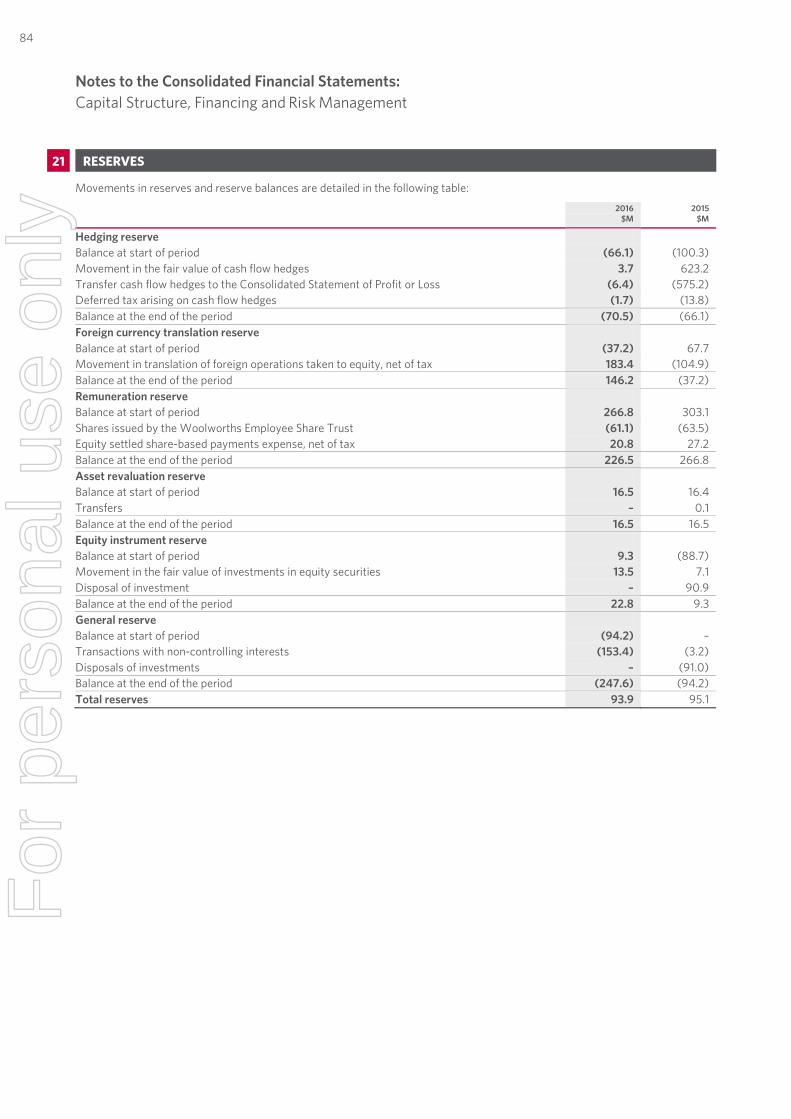
Notes to the Consolidated Financial Statements Capital Structure, Financing and Risk Management
34 | WOOLWORTHS LIMITED | FINANCIAL REPORT 2016
21. RESERVES
Movements in reserves and reserve balances are detailed in the following table:
2016
$M 2015
$M
Hedging reserve Balance at start of period (66.1) (100.3) Movement in the fair value of cash flow hedges 3.7 623.2 Transfer cash flow hedges to the Consolidated Statement of Profit or Loss (6.4) (575.2) Deferred tax arising on cash flow hedges (1.7) (13.8) Balance at the end of the period (70.5) (66.1) Foreign currency translation reserve Balance at start of period (37.2) 67.7 Movement in translation of foreign operations taken to equity, net of tax 183.4 (104.9) Balance at the end of the period 146.2 (37.2) Remuneration reserve Balance at start of period 266.8 303.1 Shares issued by the Woolworths Employee Share Trust (61.1) (63.5) Equity settled share-based payments expense, net of tax 20.8 27.2 Balance at the end of the period 226.5 266.8 Asset revaluation reserve Balance at start of period 16.5 16.4 Transfers – 0.1 Balance at the end of the period 16.5 16.5 Equity instrument reserve Balance at start of period 9.3 (88.7) Movement in the fair value of investments in equity securities 13.5 7.1 Disposal of investment – 90.9 Balance at the end of the period 22.8 9.3 General reserve Balance at start of period (94.2) – Transactions with non-controlling interests (153.4) (3.2) Disposals of investments – (91.0) Balance at the end of the period (247.6) (94.2) Total reserves 93.9 95.1
Notes to the Consolidated Financial Statements: Capital Structure, Financing and Risk Management
21 RESERVES
84F
or p
erso
nal u
se o
nly
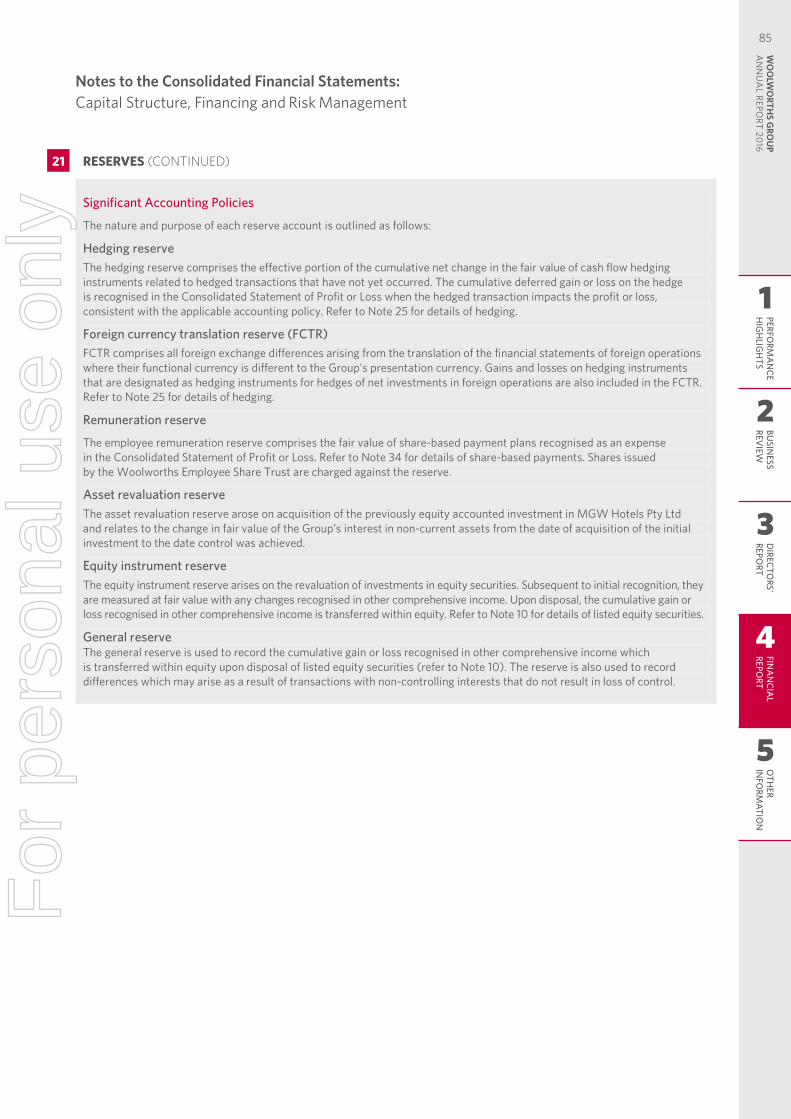
Notes to the Consolidated Financial Statements Capital Structure, Financing and Risk Management
35 | WOOLWORTHS LIMITED | FINANCIAL REPORT 2016
Significant Accounting Policies
The nature and purpose of each reserve account is outlined as follows:
Hedging reserve The hedging reserve comprises the effective portion of the cumulative net change in the fair value of cash flow hedging instruments related to hedged transactions that have not yet occurred. The cumulative deferred gain or loss on the hedge is recognised in the Consolidated Statement of Profit or Loss when the hedged transaction impacts the profit or loss, consistent with the applicable accounting policy. Refer to Note 25 for details of hedging.
Foreign currency translation reserve (FCTR) FCTR comprises all foreign exchange differences arising from the translation of the financial statements of foreign operations where their functional currency is different to the Group’s presentation currency. Gains and losses on hedging instruments that are designated as hedging instruments for hedges of net investments in foreign operations are also included in the FCTR. Refer to Note 25 for details of hedging.
Remuneration reserve
The employee remuneration reserve comprises the fair value of share-based payment plans recognised as an expense in the Consolidated Statement of Profit or Loss. Refer to Note 34 for details of share-based payments. Shares issued by the Woolworths Employee Share Trust are charged against the reserve.
Asset revaluation reserve The asset revaluation reserve arose on acquisition of the previously equity accounted investment in MGW Hotels Pty Ltd and relates to the change in fair value of the Group’s interest in non-current assets from the date of acquisition of the initial investment to the date control was achieved.
Equity instrument reserve The equity instrument reserve arises on the revaluation of investments in equity securities. Subsequent to initial recognition, they are measured at fair value with any changes recognised in other comprehensive income. Upon disposal, the cumulative gain or loss recognised in other comprehensive income is transferred within equity. Refer to Note 10 for details of listed equity securities.
General reserve The general reserve is used to record the cumulative gain or loss recognised in other comprehensive income which is transferred within equity upon disposal of listed equity securities (refer to Note 10). The reserve is also used to record differences which may arise as a result of transactions with non-controlling interests that do not result in loss of control.
21. RESERVES CONTINUED
Notes to the Consolidated Financial Statements: Capital Structure, Financing and Risk Management
21 RESERVES (CONTINUED)
1
2
3
4
5
PERFORM
AN
CEH
IGH
LIGH
TSBU
SINESS
REVIEW
DIRECTO
RS' REPO
RTFIN
AN
CIAL
REPORT
OTH
ER IN
FORM
ATION
WO
OLW
ORTH
S GRO
UP
AN
NU
AL REPO
RT 2016
85F
or p
erso
nal u
se o
nly
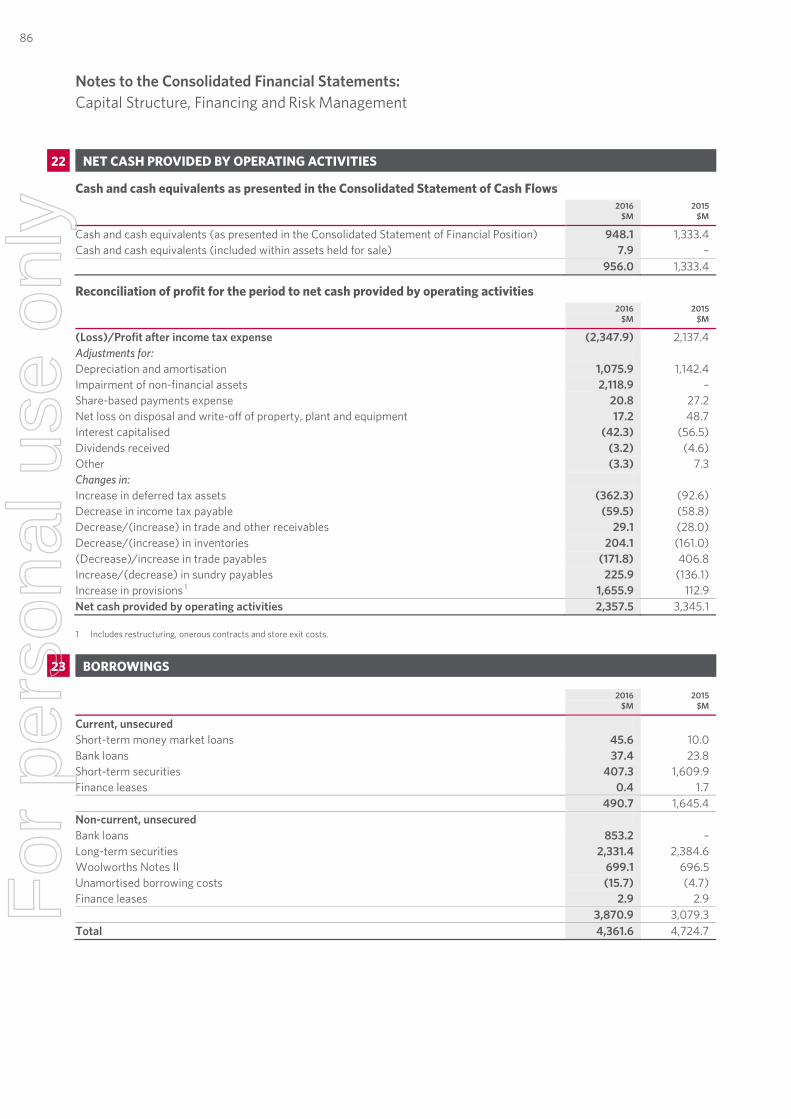
Notes to the Consolidated Financial Statements Capital Structure, Financing and Risk Management
36 | WOOLWORTHS LIMITED | FINANCIAL REPORT 2016
22. NET CASH PROVIDED BY OPERATING ACTIVITIES
Cash and cash equivalents as presented in the Consolidated Statement of Cash Flows
2016
$M 2015
$M
Cash and cash equivalents (as presented in the Consolidated Statement of Financial Position) 948.1 1,333.4 Cash and cash equivalents (included within assets held for sale) 7.9 – 956.0 1,333.4
Reconciliation of profit for the period to net cash provided by operating activities
2016
$M 2015
$M
(Loss)/Profit after income tax expense (2,347.9) 2,137.4 Adjustments for: Depreciation and amortisation 1,075.9 1,142.4 Impairment of non-financial assets 2,118.9 – Share-based payments expense 20.8 27.2 Net loss on disposal and write-off of property, plant and equipment 17.2 48.7 Interest capitalised (42.3) (56.5) Dividends received (3.2) (4.6) Other (3.3) 7.3 Changes in: Increase in deferred tax assets (362.3) (92.6) Decrease in income tax payable (59.5) (58.8) Decrease/(increase) in trade and other receivables 29.1 (28.0) Decrease/(increase) in inventories 204.1 (161.0) (Decrease)/increase in trade payables (171.8) 406.8 Increase/(decrease) in sundry payables 225.9 (136.1) Increase in provisions 1 1,655.9 112.9 Net cash provided by operating activities 2,357.5 3,345.1 1 Includes restructuring, onerous contracts and store exit costs.
23. BORROWINGS
2016
$M 2015
$M
Current, unsecured Short-term money market loans 45.6 10.0 Bank loans 37.4 23.8 Short-term securities 407.3 1,609.9 Finance leases 0.4 1.7 490.7 1,645.4 Non-current, unsecured Bank loans 853.2 – Long-term securities 2,331.4 2,384.6 Woolworths Notes II 699.1 696.5 Unamortised borrowing costs (15.7) (4.7) Finance leases 2.9 2.9 3,870.9 3,079.3 Total 4,361.6 4,724.7
Notes to the Consolidated Financial Statements: Capital Structure, Financing and Risk Management
22 NET CASH PROVIDED BY OPERATING ACTIVITIES
23 BORROWINGS
86F
or p
erso
nal u
se o
nly
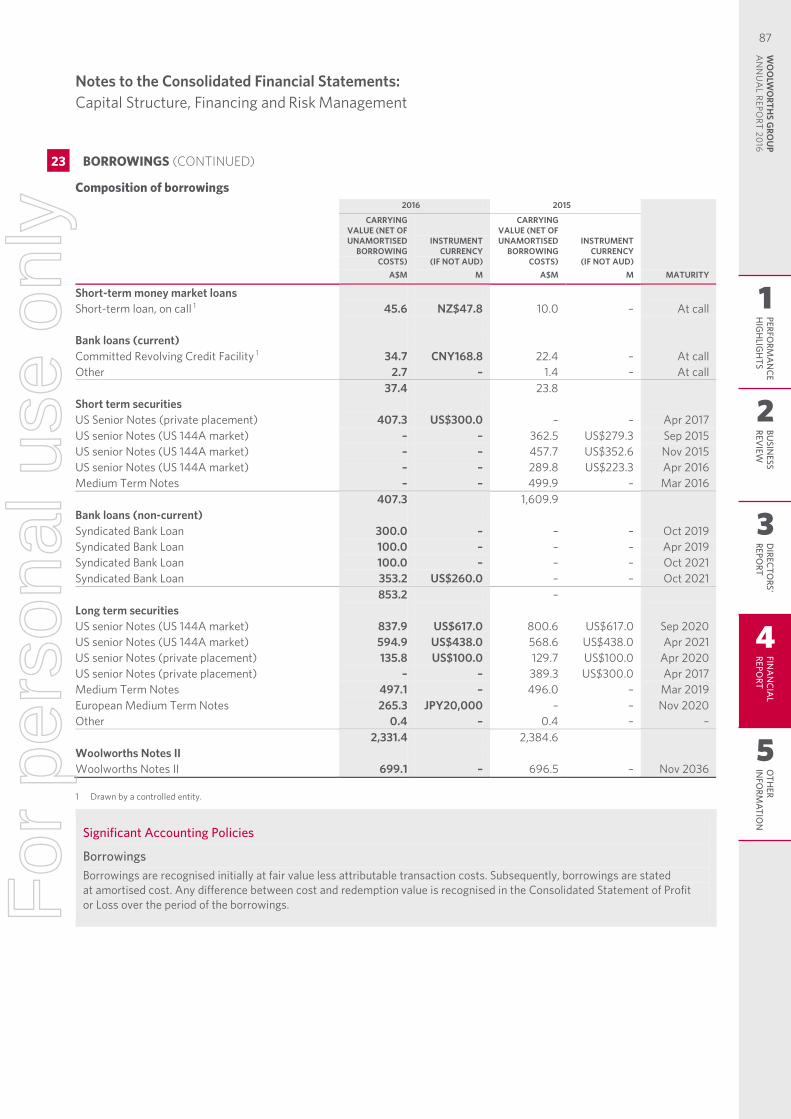
Notes to the Consolidated Financial Statements Capital Structure, Financing and Risk Management
37 | WOOLWORTHS LIMITED | FINANCIAL REPORT 2016
Composition of borrowings 2016 2015
CARRYING VALUE (NET OF UNAMORTISED
BORROWING COSTS)
A$M
INSTRUMENT CURRENCY
(IF NOT AUD) M
CARRYING VALUE (NET OF UNAMORTISED
BORROWING COSTS)
A$M
INSTRUMENT CURRENCY
(IF NOT AUD) M MATURITY
Short-term money market loans Short-term loan, on call 1 45.6 NZ$47.8 10.0 – At call Bank loans (current) Committed Revolving Credit Facility 1 34.7 CNY168.8 22.4 – At call Other 2.7 – 1.4 – At call 37.4 23.8 Short term securities US Senior Notes (private placement) 407.3 US$300.0 – – Apr 2017 US senior Notes (US 144A market) – – 362.5 US$279.3 Sep 2015 US senior Notes (US 144A market) – – 457.7 US$352.6 Nov 2015 US senior Notes (US 144A market) – – 289.8 US$223.3 Apr 2016 Medium Term Notes – – 499.9 – Mar 2016 407.3 1,609.9 Bank loans (non-current) Syndicated Bank Loan 300.0 – – – Oct 2019 Syndicated Bank Loan 100.0 – – – Apr 2019 Syndicated Bank Loan 100.0 – – – Oct 2021 Syndicated Bank Loan 353.2 US$260.0 – – Oct 2021 853.2 – Long term securities US senior Notes (US 144A market) 837.9 US$617.0 800.6 US$617.0 Sep 2020 US senior Notes (US 144A market) 594.9 US$438.0 568.6 US$438.0 Apr 2021 US senior Notes (private placement) 135.8 US$100.0 129.7 US$100.0 Apr 2020 US senior Notes (private placement) – – 389.3 US$300.0 Apr 2017 Medium Term Notes 497.1 – 496.0 – Mar 2019 European Medium Term Notes 265.3 JPY20,000 – – Nov 2020 Other 0.4 – 0.4 – – 2,331.4 2,384.6 Woolworths Notes II Woolworths Notes II 699.1 – 696.5 – Nov 2036 1 Drawn by a controlled entity.
Significant Accounting Policies
Borrowings Borrowings are recognised initially at fair value less attributable transaction costs. Subsequently, borrowings are stated at amortised cost. Any difference between cost and redemption value is recognised in the Consolidated Statement of Profit or Loss over the period of the borrowings.
23. BORROWINGS CONTINUED
Notes to the Consolidated Financial Statements: Capital Structure, Financing and Risk Management
23 BORROWINGS (CONTINUED)
1
2
3
4
5
PERFORM
AN
CEH
IGH
LIGH
TSBU
SINESS
REVIEW
DIRECTO
RS' REPO
RTFIN
AN
CIAL
REPORT
OTH
ER IN
FORM
ATION
WO
OLW
ORTH
S GRO
UP
AN
NU
AL REPO
RT 2016
87F
or p
erso
nal u
se o
nly
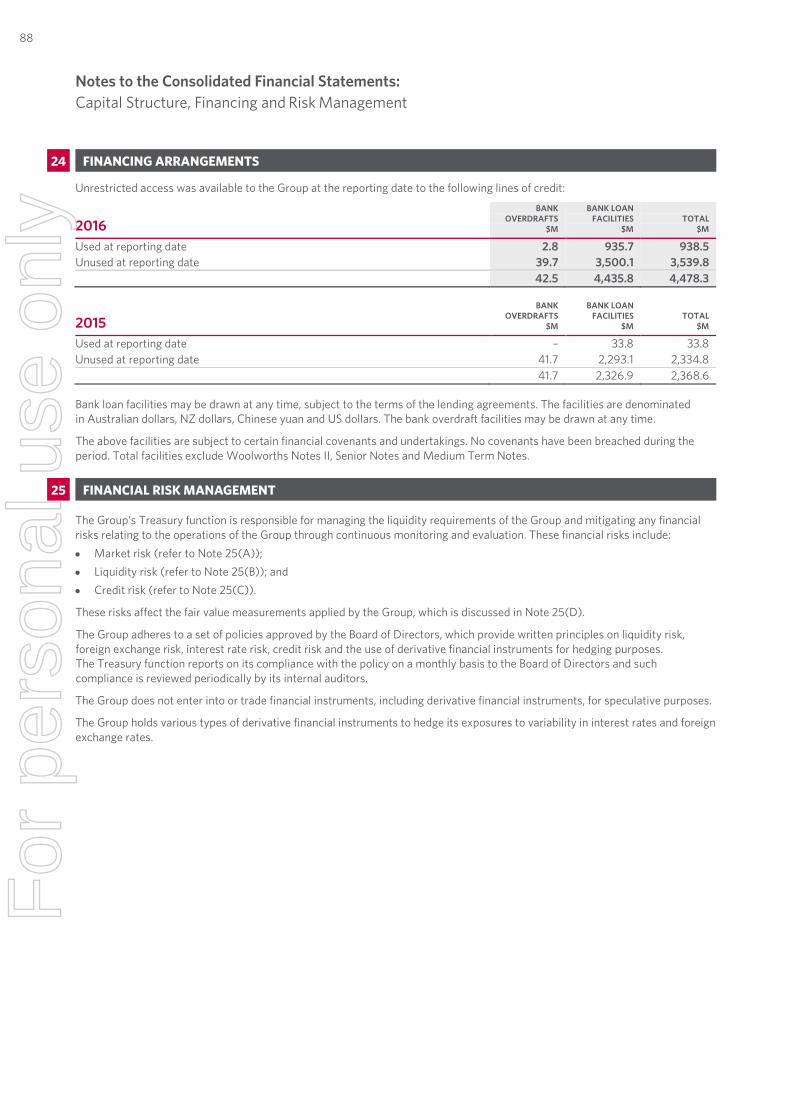
Notes to the Consolidated Financial Statements Capital Structure, Financing and Risk Management
38 | WOOLWORTHS LIMITED | FINANCIAL REPORT 2016
24. FINANCING ARRANGEMENTS
Unrestricted access was available to the Group at the reporting date to the following lines of credit:
2016
BANK OVERDRAFTS
$M
BANK LOAN FACILITIES
$M TOTAL
$M
Used at reporting date 2.8 935.7 938.5 Unused at reporting date 39.7 3,500.1 3,539.8 42.5 4,435.8 4,478.3
2015
BANK OVERDRAFTS
$M
BANK LOAN FACILITIES
$M TOTAL
$M
Used at reporting date – 33.8 33.8 Unused at reporting date 41.7 2,293.1 2,334.8 41.7 2,326.9 2,368.6 Bank loan facilities may be drawn at any time, subject to the terms of the lending agreements. The facilities are denominated in Australian dollars, NZ dollars, Chinese yuan and US dollars. The bank overdraft facilities may be drawn at any time.
The above facilities are subject to certain financial covenants and undertakings. No covenants have been breached during the period. Total facilities exclude Woolworths Notes II, Senior Notes and Medium Term Notes.
25. FINANCIAL RISK MANAGEMENT
The Group’s Treasury function is responsible for managing the liquidity requirements of the Group and mitigating any financial risks relating to the operations of the Group through continuous monitoring and evaluation. These financial risks include: • Market risk (refer to Note 25(A)); • Liquidity risk (refer to Note 25(B)); and • Credit risk (refer to Note 25(C)).
These risks affect the fair value measurements applied by the Group, which is discussed in Note 25(D).
The Group adheres to a set of policies approved by the Board of Directors, which provide written principles on liquidity risk, foreign exchange risk, interest rate risk, credit risk and the use of derivative financial instruments for hedging purposes. The Treasury function reports on its compliance with the policy on a monthly basis to the Board of Directors and such compliance is reviewed periodically by its internal auditors.
The Group does not enter into or trade financial instruments, including derivative financial instruments, for speculative purposes.
The Group holds various types of derivative financial instruments to hedge its exposures to variability in interest rates and foreign exchange rates.
Notes to the Consolidated Financial Statements: Capital Structure, Financing and Risk Management
24 FINANCING ARRANGEMENTS
25 FINANCIAL RISK MANAGEMENT
88F
or p
erso
nal u
se o
nly
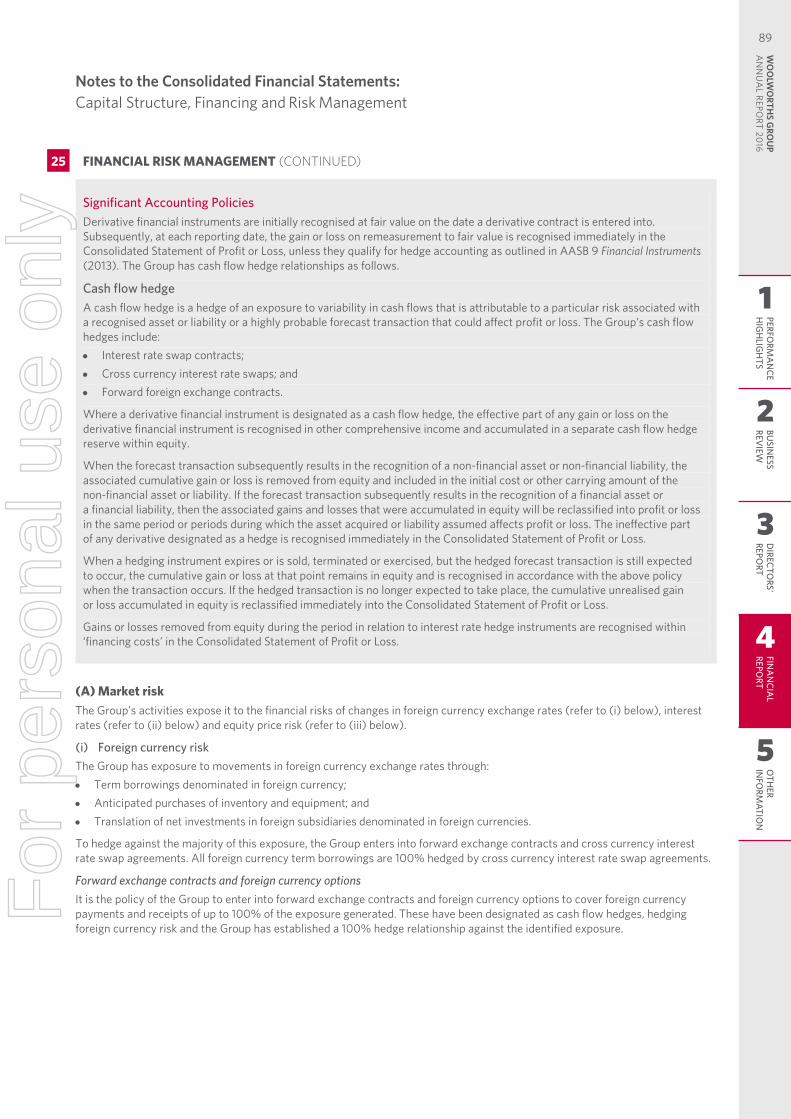
Notes to the Consolidated Financial Statements Capital Structure, Financing and Risk Management
39 | WOOLWORTHS LIMITED | FINANCIAL REPORT 2016
Significant Accounting Policies Derivative financial instruments are initially recognised at fair value on the date a derivative contract is entered into. Subsequently, at each reporting date, the gain or loss on remeasurement to fair value is recognised immediately in the Consolidated Statement of Profit or Loss, unless they qualify for hedge accounting as outlined in AASB 9 Financial Instruments (2013). The Group has cash flow hedge relationships as follows.
Cash flow hedge A cash flow hedge is a hedge of an exposure to variability in cash flows that is attributable to a particular risk associated with a recognised asset or liability or a highly probable forecast transaction that could affect profit or loss. The Group’s cash flow hedges include: • Interest rate swap contracts; • Cross currency interest rate swaps; and • Forward foreign exchange contracts.
Where a derivative financial instrument is designated as a cash flow hedge, the effective part of any gain or loss on the derivative financial instrument is recognised in other comprehensive income and accumulated in a separate cash flow hedge reserve within equity.
When the forecast transaction subsequently results in the recognition of a non-financial asset or non-financial liability, the associated cumulative gain or loss is removed from equity and included in the initial cost or other carrying amount of the non-financial asset or liability. If the forecast transaction subsequently results in the recognition of a financial asset or a financial liability, then the associated gains and losses that were accumulated in equity will be reclassified into profit or loss in the same period or periods during which the asset acquired or liability assumed affects profit or loss. The ineffective part of any derivative designated as a hedge is recognised immediately in the Consolidated Statement of Profit or Loss.
When a hedging instrument expires or is sold, terminated or exercised, but the hedged forecast transaction is still expected to occur, the cumulative gain or loss at that point remains in equity and is recognised in accordance with the above policy when the transaction occurs. If the hedged transaction is no longer expected to take place, the cumulative unrealised gain or loss accumulated in equity is reclassified immediately into the Consolidated Statement of Profit or Loss.
Gains or losses removed from equity during the period in relation to interest rate hedge instruments are recognised within ‘financing costs’ in the Consolidated Statement of Profit or Loss.
(A) Market risk The Group’s activities expose it to the financial risks of changes in foreign currency exchange rates (refer to (i) below), interest rates (refer to (ii) below) and equity price risk (refer to (iii) below).
(i) Foreign currency risk The Group has exposure to movements in foreign currency exchange rates through: • Term borrowings denominated in foreign currency; • Anticipated purchases of inventory and equipment; and • Translation of net investments in foreign subsidiaries denominated in foreign currencies.
To hedge against the majority of this exposure, the Group enters into forward exchange contracts and cross currency interest rate swap agreements. All foreign currency term borrowings are 100% hedged by cross currency interest rate swap agreements.
Forward exchange contracts and foreign currency options It is the policy of the Group to enter into forward exchange contracts and foreign currency options to cover foreign currency payments and receipts of up to 100% of the exposure generated. These have been designated as cash flow hedges, hedging foreign currency risk and the Group has established a 100% hedge relationship against the identified exposure.
25. FINANCIAL RISK MANAGEMENT CONTINUED
Notes to the Consolidated Financial Statements: Capital Structure, Financing and Risk Management
25 FINANCIAL RISK MANAGEMENT (CONTINUED)
1
2
3
4
5
PERFORM
AN
CEH
IGH
LIGH
TSBU
SINESS
REVIEW
DIRECTO
RS' REPO
RTFIN
AN
CIAL
REPORT
OTH
ER IN
FORM
ATION
WO
OLW
ORTH
S GRO
UP
AN
NU
AL REPO
RT 2016
89F
or p
erso
nal u
se o
nly
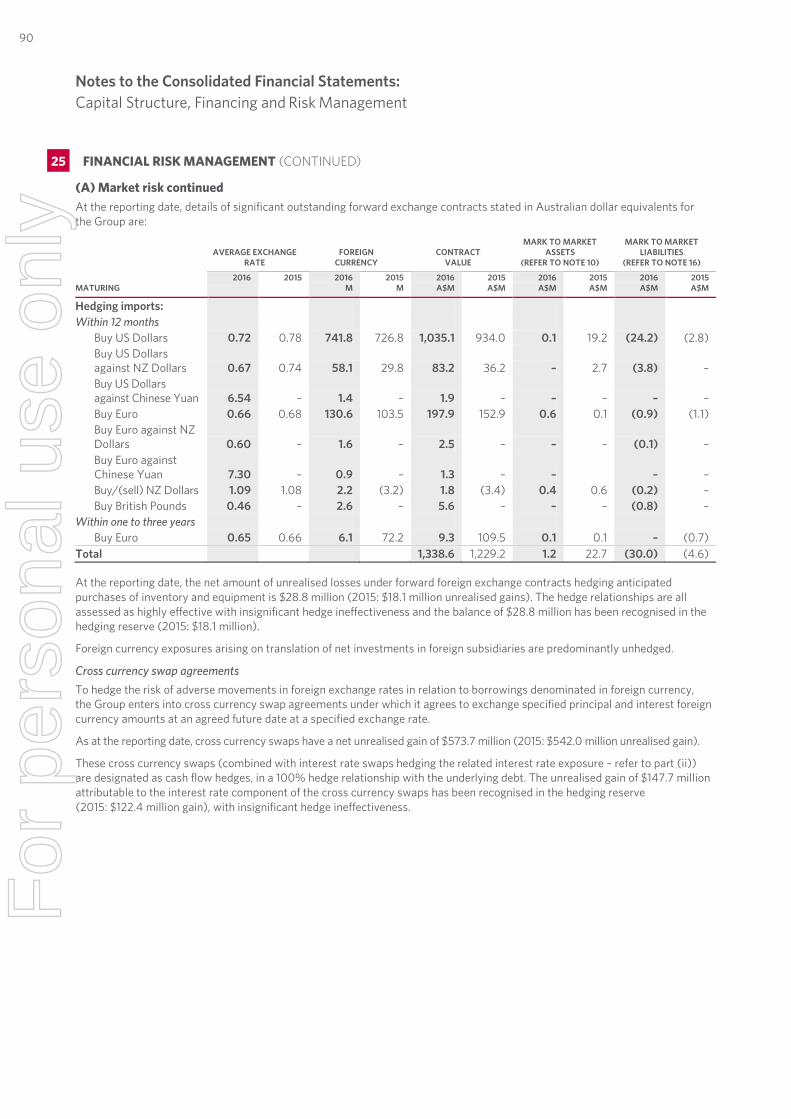
Notes to the Consolidated Financial Statements Capital Structure, Financing and Risk Management
40 | WOOLWORTHS LIMITED | FINANCIAL REPORT 2016
(A) Market risk continued At the reporting date, details of significant outstanding forward exchange contracts stated in Australian dollar equivalents for the Group are:
AVERAGE EXCHANGE
RATE FOREIGN
CURRENCY CONTRACT
VALUE
MARK TO MARKET ASSETS
(REFER TO NOTE 10)
MARK TO MARKET LIABILITIES
(REFER TO NOTE 16)
MATURING 2016 2015 2016
M 2015
M 2016 A$M
2015 A$M
2016 A$M
2015 A$M
2016 A$M
2015 A$M
Hedging imports: Within 12 months
Buy US Dollars 0.72 0.78 741.8 726.8 1,035.1 934.0 0.1 19.2 (24.2) (2.8) Buy US Dollars against NZ Dollars 0.67 0.74 58.1 29.8 83.2 36.2 – 2.7 (3.8) – Buy US Dollars against Chinese Yuan 6.54 – 1.4 – 1.9 – – – – – Buy Euro 0.66 0.68 130.6 103.5 197.9 152.9 0.6 0.1 (0.9) (1.1) Buy Euro against NZ Dollars 0.60 – 1.6 – 2.5 – – – (0.1) – Buy Euro against Chinese Yuan 7.30 – 0.9 – 1.3 – – – – Buy/(sell) NZ Dollars 1.09 1.08 2.2 (3.2) 1.8 (3.4) 0.4 0.6 (0.2) – Buy British Pounds 0.46 – 2.6 – 5.6 – – – (0.8) –
Within one to three years Buy Euro 0.65 0.66 6.1 72.2 9.3 109.5 0.1 0.1 – (0.7)
Total 1,338.6 1,229.2 1.2 22.7 (30.0) (4.6) At the reporting date, the net amount of unrealised losses under forward foreign exchange contracts hedging anticipated purchases of inventory and equipment is $28.8 million (2015: $18.1 million unrealised gains). The hedge relationships are all assessed as highly effective with insignificant hedge ineffectiveness and the balance of $28.8 million has been recognised in the hedging reserve (2015: $18.1 million).
Foreign currency exposures arising on translation of net investments in foreign subsidiaries are predominantly unhedged.
Cross currency swap agreements To hedge the risk of adverse movements in foreign exchange rates in relation to borrowings denominated in foreign currency, the Group enters into cross currency swap agreements under which it agrees to exchange specified principal and interest foreign currency amounts at an agreed future date at a specified exchange rate.
As at the reporting date, cross currency swaps have a net unrealised gain of $573.7 million (2015: $542.0 million unrealised gain).
These cross currency swaps (combined with interest rate swaps hedging the related interest rate exposure – refer to part (ii)) are designated as cash flow hedges, in a 100% hedge relationship with the underlying debt. The unrealised gain of $147.7 million attributable to the interest rate component of the cross currency swaps has been recognised in the hedging reserve (2015: $122.4 million gain), with insignificant hedge ineffectiveness.
25. FINANCIAL RISK MANAGEMENT CONTINUED
Notes to the Consolidated Financial Statements: Capital Structure, Financing and Risk Management
25 FINANCIAL RISK MANAGEMENT (CONTINUED)
90F
or p
erso
nal u
se o
nly
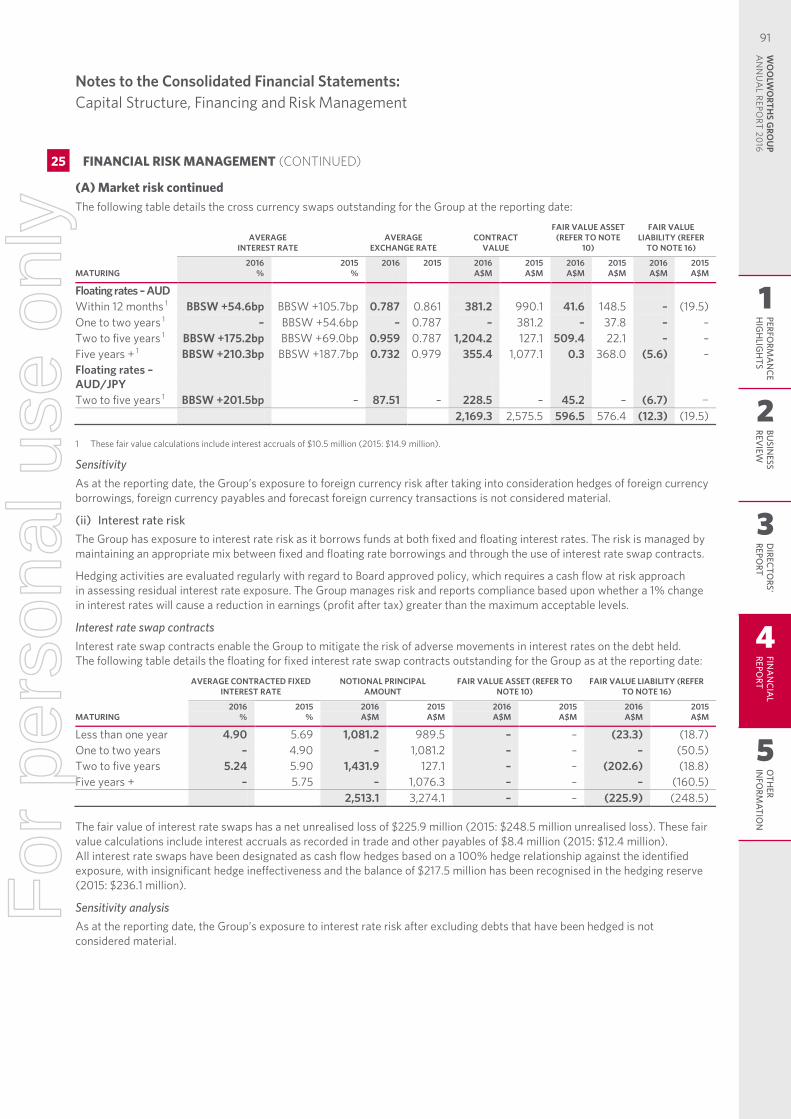
Notes to the Consolidated Financial Statements Capital Structure, Financing and Risk Management
41 | WOOLWORTHS LIMITED | FINANCIAL REPORT 2016
(A) Market risk continued The following table details the cross currency swaps outstanding for the Group at the reporting date:
AVERAGE
INTEREST RATE AVERAGE
EXCHANGE RATE CONTRACT
VALUE
FAIR VALUE ASSET (REFER TO NOTE
10)
FAIR VALUE LIABILITY (REFER
TO NOTE 16)
MATURING 2016
% 2015
% 2016
2015
2016 A$M
2015 A$M
2016 A$M
2015 A$M
2016 A$M
2015 A$M
Floating rates – AUD Within 12 months 1 BBSW +54.6bp BBSW +105.7bp 0.787 0.861 381.2 990.1 41.6 148.5 – (19.5) One to two years 1 – BBSW +54.6bp – 0.787 – 381.2 – 37.8 – – Two to five years 1 BBSW +175.2bp BBSW +69.0bp 0.959 0.787 1,204.2 127.1 509.4 22.1 – – Five years + 1 BBSW +210.3bp BBSW +187.7bp 0.732 0.979 355.4 1,077.1 0.3 368.0 (5.6) – Floating rates – AUD/JPY Two to five years 1 BBSW +201.5bp – 87.51 – 228.5 – 45.2 – (6.7) – 2,169.3 2,575.5 596.5 576.4 (12.3) (19.5) 1 These fair value calculations include interest accruals of $10.5 million (2015: $14.9 million).
Sensitivity As at the reporting date, the Group’s exposure to foreign currency risk after taking into consideration hedges of foreign currency borrowings, foreign currency payables and forecast foreign currency transactions is not considered material.
(ii) Interest rate risk The Group has exposure to interest rate risk as it borrows funds at both fixed and floating interest rates. The risk is managed by maintaining an appropriate mix between fixed and floating rate borrowings and through the use of interest rate swap contracts.
Hedging activities are evaluated regularly with regard to Board approved policy, which requires a cash flow at risk approach in assessing residual interest rate exposure. The Group manages risk and reports compliance based upon whether a 1% change in interest rates will cause a reduction in earnings (profit after tax) greater than the maximum acceptable levels.
Interest rate swap contracts Interest rate swap contracts enable the Group to mitigate the risk of adverse movements in interest rates on the debt held. The following table details the floating for fixed interest rate swap contracts outstanding for the Group as at the reporting date:
AVERAGE CONTRACTED FIXED
INTEREST RATE NOTIONAL PRINCIPAL
AMOUNT FAIR VALUE ASSET (REFER TO
NOTE 10) FAIR VALUE LIABILITY (REFER
TO NOTE 16)
MATURING 2016
% 2015
% 2016 A$M
2015 A$M
2016 A$M
2015 A$M
2016 A$M
2015 A$M
Less than one year 4.90 5.69 1,081.2 989.5 – – (23.3) (18.7) One to two years – 4.90 – 1,081.2 – – – (50.5) Two to five years 5.24 5.90 1,431.9 127.1 – – (202.6) (18.8) Five years + – 5.75 – 1,076.3 – – – (160.5) 2,513.1 3,274.1 – – (225.9) (248.5) The fair value of interest rate swaps has a net unrealised loss of $225.9 million (2015: $248.5 million unrealised loss). These fair value calculations include interest accruals as recorded in trade and other payables of $8.4 million (2015: $12.4 million). All interest rate swaps have been designated as cash flow hedges based on a 100% hedge relationship against the identified exposure, with insignificant hedge ineffectiveness and the balance of $217.5 million has been recognised in the hedging reserve (2015: $236.1 million).
Sensitivity analysis As at the reporting date, the Group’s exposure to interest rate risk after excluding debts that have been hedged is not considered material.
25. FINANCIAL RISK MANAGEMENT CONTINUED
Notes to the Consolidated Financial Statements: Capital Structure, Financing and Risk Management
25 FINANCIAL RISK MANAGEMENT (CONTINUED)
1
2
3
4
5
PERFORM
AN
CEH
IGH
LIGH
TSBU
SINESS
REVIEW
DIRECTO
RS' REPO
RTFIN
AN
CIAL
REPORT
OTH
ER IN
FORM
ATION
WO
OLW
ORTH
S GRO
UP
AN
NU
AL REPO
RT 2016
91F
or p
erso
nal u
se o
nly
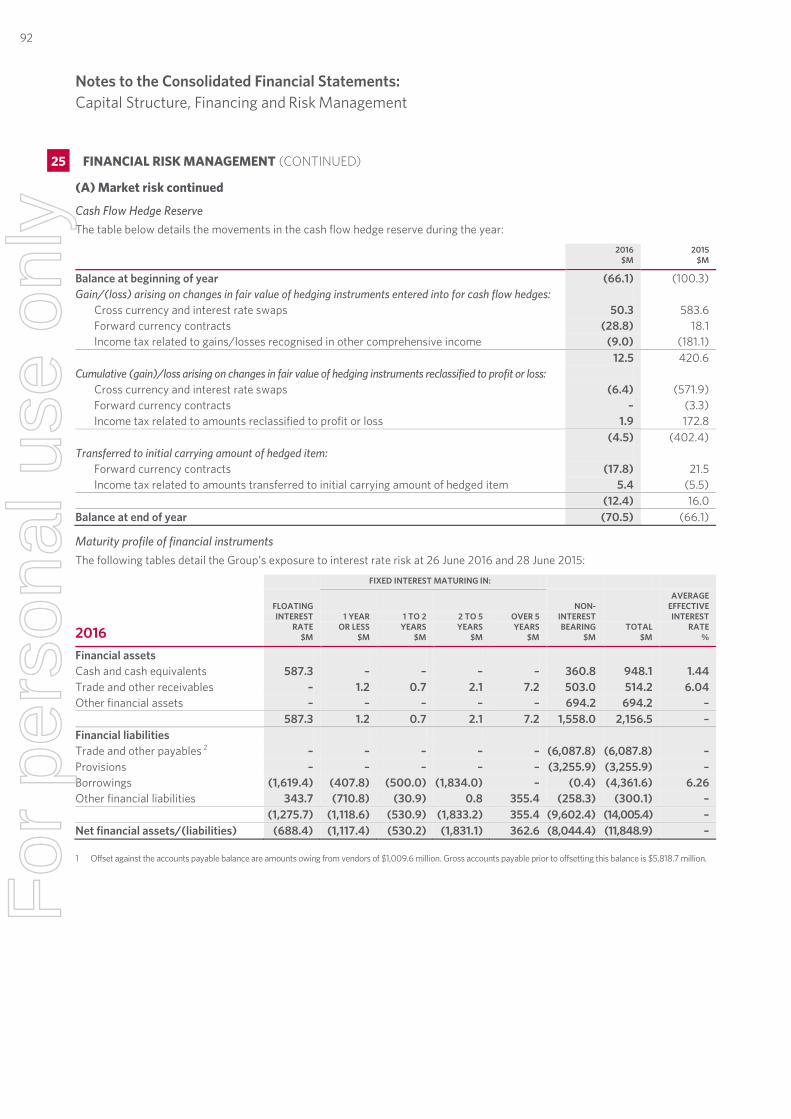
Notes to the Consolidated Financial Statements Capital Structure, Financing and Risk Management
42 | WOOLWORTHS LIMITED | FINANCIAL REPORT 2016
(A) Market risk continued
Cash Flow Hedge Reserve The table below details the movements in the cash flow hedge reserve during the year:
2016
$M 2015
$M
Balance at beginning of year (66.1) (100.3) Gain/(loss) arising on changes in fair value of hedging instruments entered into for cash flow hedges:
Cross currency and interest rate swaps 50.3 583.6 Forward currency contracts (28.8) 18.1 Income tax related to gains/losses recognised in other comprehensive income (9.0) (181.1)
12.5 420.6 Cumulative (gain)/loss arising on changes in fair value of hedging instruments reclassified to profit or loss:
Cross currency and interest rate swaps (6.4) (571.9) Forward currency contracts – (3.3) Income tax related to amounts reclassified to profit or loss 1.9 172.8
(4.5) (402.4) Transferred to initial carrying amount of hedged item:
Forward currency contracts (17.8) 21.5 Income tax related to amounts transferred to initial carrying amount of hedged item 5.4 (5.5)
(12.4) 16.0 Balance at end of year (70.5) (66.1)
Maturity profile of financial instruments The following tables detail the Group’s exposure to interest rate risk at 26 June 2016 and 28 June 2015:
FIXED INTEREST MATURING IN:
2016
FLOATING INTEREST
RATE $M
1 YEAR OR LESS
$M
1 TO 2 YEARS
$M
2 TO 5 YEARS
$M
OVER 5 YEARS
$M
NON- INTEREST BEARING
$M TOTAL
$M
AVERAGE EFFECTIVE INTEREST
RATE %
Financial assets Cash and cash equivalents 587.3 – – – – 360.8 948.1 1.44 Trade and other receivables – 1.2 0.7 2.1 7.2 503.0 514.2 6.04 Other financial assets – – – – – 694.2 694.2 – 587.3 1.2 0.7 2.1 7.2 1,558.0 2,156.5 – Financial liabilities Trade and other payables 2 – – – – – (6,087.8) (6,087.8) – Provisions – – – – – (3,255.9) (3,255.9) – Borrowings (1,619.4) (407.8) (500.0) (1,834.0) – (0.4) (4,361.6) 6.26 Other financial liabilities 343.7 (710.8) (30.9) 0.8 355.4 (258.3) (300.1) – (1,275.7) (1,118.6) (530.9) (1,833.2) 355.4 (9,602.4) (14,005.4) – Net financial assets/(liabilities) (688.4) (1,117.4) (530.2) (1,831.1) 362.6 (8,044.4) (11,848.9) – 1 Offset against the accounts payable balance are amounts owing from vendors of $1,009.6 million. Gross accounts payable prior to offsetting this balance is $5,818.7 million.
25. FINANCIAL RISK MANAGEMENT CONTINUED
Notes to the Consolidated Financial Statements: Capital Structure, Financing and Risk Management
25 FINANCIAL RISK MANAGEMENT (CONTINUED)
92F
or p
erso
nal u
se o
nly
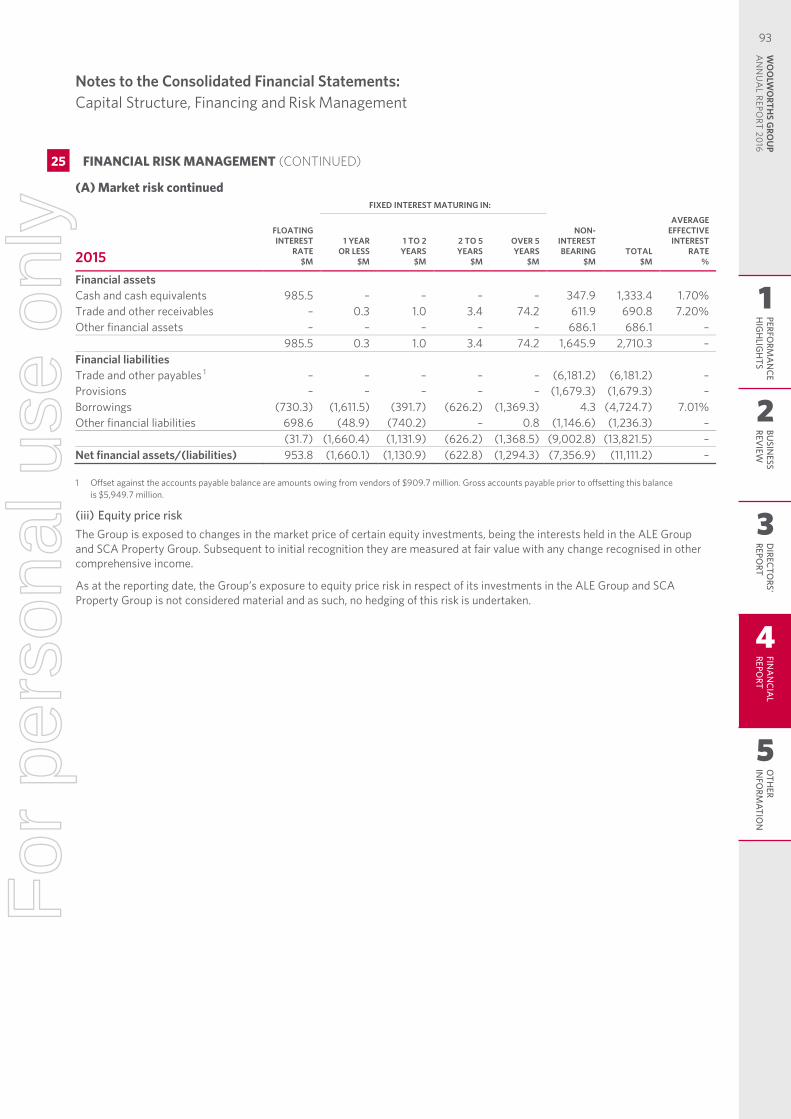
Notes to the Consolidated Financial Statements Capital Structure, Financing and Risk Management
43 | WOOLWORTHS LIMITED | FINANCIAL REPORT 2016
(A) Market risk continued FIXED INTEREST MATURING IN:
2015
FLOATING INTEREST
RATE $M
1 YEAR OR LESS
$M
1 TO 2 YEARS
$M
2 TO 5 YEARS
$M
OVER 5 YEARS
$M
NON-INTEREST BEARING
$M TOTAL
$M
AVERAGE EFFECTIVE INTEREST
RATE %
Financial assets Cash and cash equivalents 985.5 – – – – 347.9 1,333.4 1.70% Trade and other receivables – 0.3 1.0 3.4 74.2 611.9 690.8 7.20% Other financial assets – – – – – 686.1 686.1 – 985.5 0.3 1.0 3.4 74.2 1,645.9 2,710.3 – Financial liabilities Trade and other payables 1 – – – – – (6,181.2) (6,181.2) – Provisions – – – – – (1,679.3) (1,679.3) – Borrowings (730.3) (1,611.5) (391.7) (626.2) (1,369.3) 4.3 (4,724.7) 7.01% Other financial liabilities 698.6 (48.9) (740.2) – 0.8 (1,146.6) (1,236.3) – (31.7) (1,660.4) (1,131.9) (626.2) (1,368.5) (9,002.8) (13,821.5) – Net financial assets/(liabilities) 953.8 (1,660.1) (1,130.9) (622.8) (1,294.3) (7,356.9) (11,111.2) – 1 Offset against the accounts payable balance are amounts owing from vendors of $909.7 million. Gross accounts payable prior to offsetting this balance
is $5,949.7 million.
(iii) Equity price risk The Group is exposed to changes in the market price of certain equity investments, being the interests held in the ALE Group and SCA Property Group. Subsequent to initial recognition they are measured at fair value with any change recognised in other comprehensive income.
As at the reporting date, the Group’s exposure to equity price risk in respect of its investments in the ALE Group and SCA Property Group is not considered material and as such, no hedging of this risk is undertaken.
25. FINANCIAL RISK MANAGEMENT CONTINUED
Notes to the Consolidated Financial Statements: Capital Structure, Financing and Risk Management
25 FINANCIAL RISK MANAGEMENT (CONTINUED)
1
2
3
4
5
PERFORM
AN
CEH
IGH
LIGH
TSBU
SINESS
REVIEW
DIRECTO
RS' REPO
RTFIN
AN
CIAL
REPORT
OTH
ER IN
FORM
ATION
WO
OLW
ORTH
S GRO
UP
AN
NU
AL REPO
RT 2016
93F
or p
erso
nal u
se o
nly
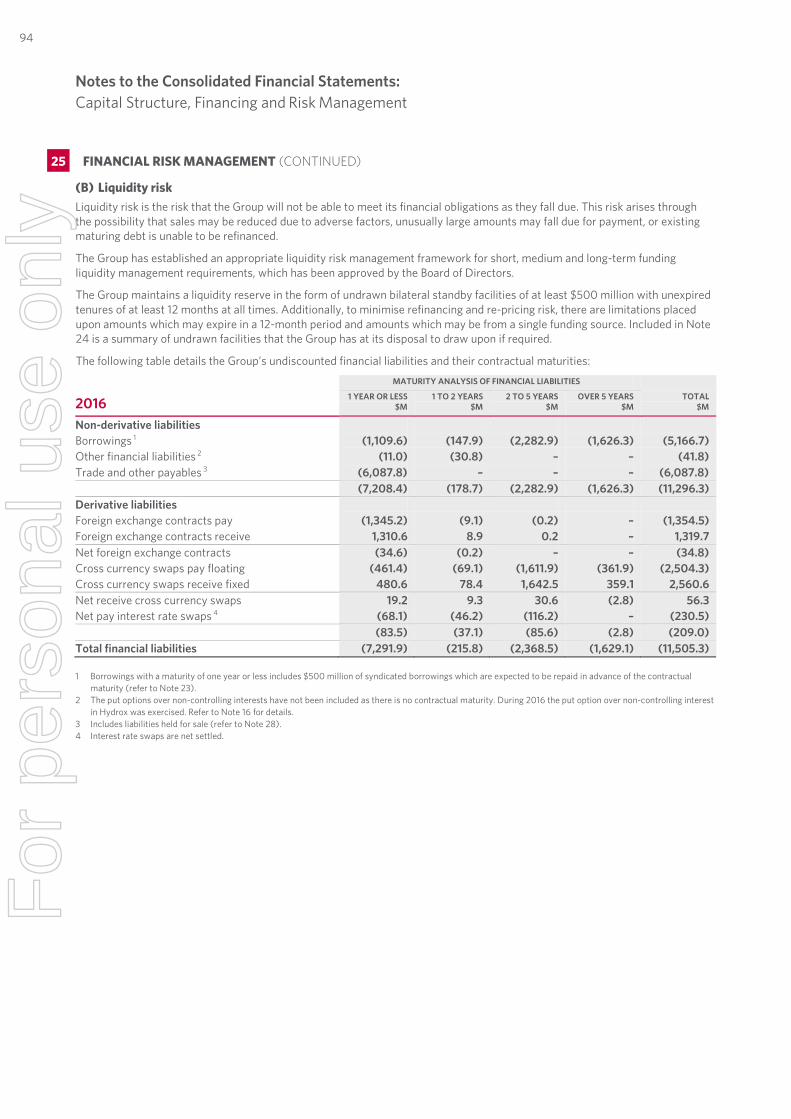
Notes to the Consolidated Financial Statements Capital Structure, Financing and Risk Management
44 | WOOLWORTHS LIMITED | FINANCIAL REPORT 2016
(B) Liquidity risk Liquidity risk is the risk that the Group will not be able to meet its financial obligations as they fall due. This risk arises through the possibility that sales may be reduced due to adverse factors, unusually large amounts may fall due for payment, or existing maturing debt is unable to be refinanced.
The Group has established an appropriate liquidity risk management framework for short, medium and long-term funding liquidity management requirements, which has been approved by the Board of Directors.
The Group maintains a liquidity reserve in the form of undrawn bilateral standby facilities of at least $500 million with unexpired tenures of at least 12 months at all times. Additionally, to minimise refinancing and re-pricing risk, there are limitations placed upon amounts which may expire in a 12-month period and amounts which may be from a single funding source. Included in Note 24 is a summary of undrawn facilities that the Group has at its disposal to draw upon if required.
The following table details the Group’s undiscounted financial liabilities and their contractual maturities:
MATURITY ANALYSIS OF FINANCIAL LIABILITIES
2016 1 YEAR OR LESS
$M 1 TO 2 YEARS
$M 2 TO 5 YEARS
$M OVER 5 YEARS
$M TOTAL
$M
Non-derivative liabilities Borrowings 1 (1,109.6) (147.9) (2,282.9) (1,626.3) (5,166.7) Other financial liabilities 2 (11.0) (30.8) – – (41.8) Trade and other payables 3 (6,087.8) – – – (6,087.8) (7,208.4) (178.7) (2,282.9) (1,626.3) (11,296.3) Derivative liabilities Foreign exchange contracts pay (1,345.2) (9.1) (0.2) – (1,354.5) Foreign exchange contracts receive 1,310.6 8.9 0.2 – 1,319.7 Net foreign exchange contracts (34.6) (0.2) – – (34.8) Cross currency swaps pay floating (461.4) (69.1) (1,611.9) (361.9) (2,504.3) Cross currency swaps receive fixed 480.6 78.4 1,642.5 359.1 2,560.6 Net receive cross currency swaps 19.2 9.3 30.6 (2.8) 56.3 Net pay interest rate swaps 4 (68.1) (46.2) (116.2) – (230.5) (83.5) (37.1) (85.6) (2.8) (209.0) Total financial liabilities (7,291.9) (215.8) (2,368.5) (1,629.1) (11,505.3) 1 Borrowings with a maturity of one year or less includes $500 million of syndicated borrowings which are expected to be repaid in advance of the contractual
maturity (refer to Note 23). 2 The put options over non-controlling interests have not been included as there is no contractual maturity. During 2016 the put option over non-controlling interest
in Hydrox was exercised. Refer to Note 16 for details. 3 Includes liabilities held for sale (refer to Note 28). 4 Interest rate swaps are net settled.
25. FINANCIAL RISK MANAGEMENT CONTINUED
Notes to the Consolidated Financial Statements: Capital Structure, Financing and Risk Management
25 FINANCIAL RISK MANAGEMENT (CONTINUED)
94F
or p
erso
nal u
se o
nly
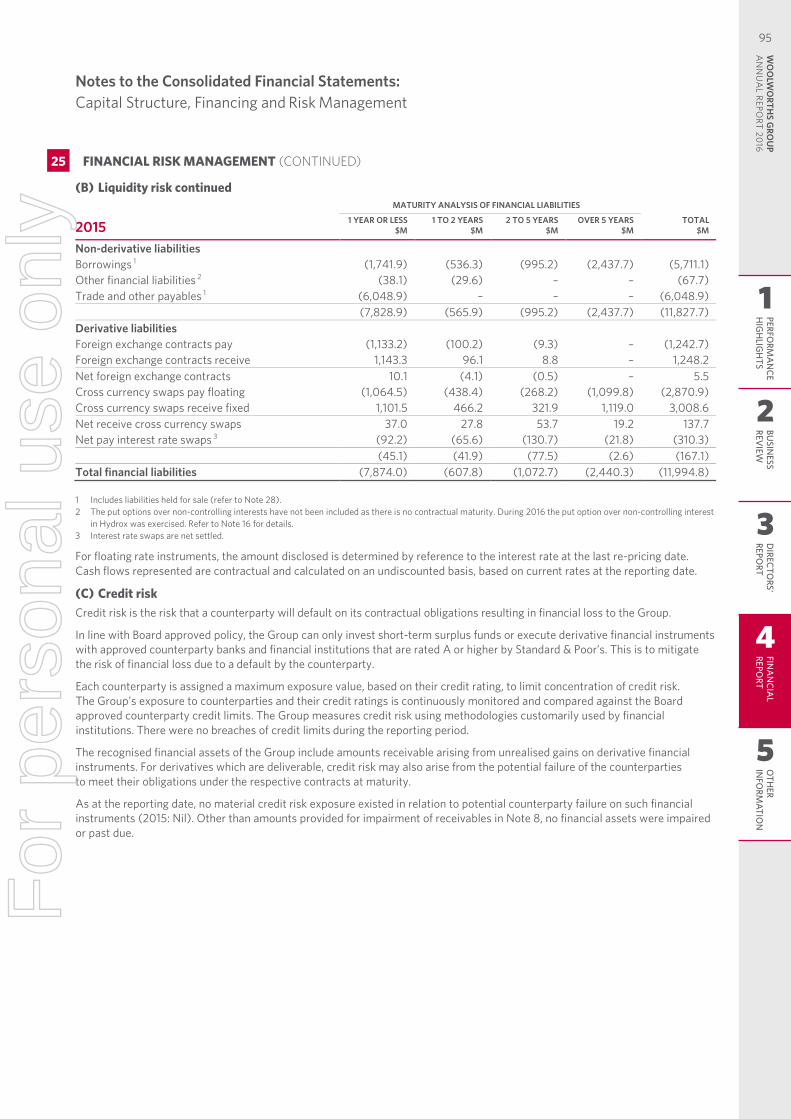
Notes to the Consolidated Financial Statements Capital Structure, Financing and Risk Management
45 | WOOLWORTHS LIMITED | FINANCIAL REPORT 2016
(B) Liquidity risk continued MATURITY ANALYSIS OF FINANCIAL LIABILITIES
2015 1 YEAR OR LESS
$M 1 TO 2 YEARS
$M 2 TO 5 YEARS
$M OVER 5 YEARS
$M TOTAL
$M
Non-derivative liabilities Borrowings 1 (1,741.9) (536.3) (995.2) (2,437.7) (5,711.1) Other financial liabilities 2 (38.1) (29.6) – – (67.7) Trade and other payables 1 (6,048.9) – – – (6,048.9) (7,828.9) (565.9) (995.2) (2,437.7) (11,827.7) Derivative liabilities Foreign exchange contracts pay (1,133.2) (100.2) (9.3) – (1,242.7) Foreign exchange contracts receive 1,143.3 96.1 8.8 – 1,248.2 Net foreign exchange contracts 10.1 (4.1) (0.5) – 5.5 Cross currency swaps pay floating (1,064.5) (438.4) (268.2) (1,099.8) (2,870.9) Cross currency swaps receive fixed 1,101.5 466.2 321.9 1,119.0 3,008.6 Net receive cross currency swaps 37.0 27.8 53.7 19.2 137.7 Net pay interest rate swaps 3 (92.2) (65.6) (130.7) (21.8) (310.3) (45.1) (41.9) (77.5) (2.6) (167.1) Total financial liabilities (7,874.0) (607.8) (1,072.7) (2,440.3) (11,994.8) 1 Includes liabilities held for sale (refer to Note 28). 2 The put options over non-controlling interests have not been included as there is no contractual maturity. During 2016 the put option over non-controlling interest
in Hydrox was exercised. Refer to Note 16 for details. 3 Interest rate swaps are net settled.
For floating rate instruments, the amount disclosed is determined by reference to the interest rate at the last re-pricing date. Cash flows represented are contractual and calculated on an undiscounted basis, based on current rates at the reporting date.
(C) Credit risk Credit risk is the risk that a counterparty will default on its contractual obligations resulting in financial loss to the Group.
In line with Board approved policy, the Group can only invest short-term surplus funds or execute derivative financial instruments with approved counterparty banks and financial institutions that are rated A or higher by Standard & Poor’s. This is to mitigate the risk of financial loss due to a default by the counterparty.
Each counterparty is assigned a maximum exposure value, based on their credit rating, to limit concentration of credit risk. The Group’s exposure to counterparties and their credit ratings is continuously monitored and compared against the Board approved counterparty credit limits. The Group measures credit risk using methodologies customarily used by financial institutions. There were no breaches of credit limits during the reporting period.
The recognised financial assets of the Group include amounts receivable arising from unrealised gains on derivative financial instruments. For derivatives which are deliverable, credit risk may also arise from the potential failure of the counterparties to meet their obligations under the respective contracts at maturity.
As at the reporting date, no material credit risk exposure existed in relation to potential counterparty failure on such financial instruments (2015: Nil). Other than amounts provided for impairment of receivables in Note 8, no financial assets were impaired or past due.
25. FINANCIAL RISK MANAGEMENT CONTINUED
Notes to the Consolidated Financial Statements: Capital Structure, Financing and Risk Management
25 FINANCIAL RISK MANAGEMENT (CONTINUED)
1
2
3
4
5
PERFORM
AN
CEH
IGH
LIGH
TSBU
SINESS
REVIEW
DIRECTO
RS' REPO
RTFIN
AN
CIAL
REPORT
OTH
ER IN
FORM
ATION
WO
OLW
ORTH
S GRO
UP
AN
NU
AL REPO
RT 2016
95F
or p
erso
nal u
se o
nly
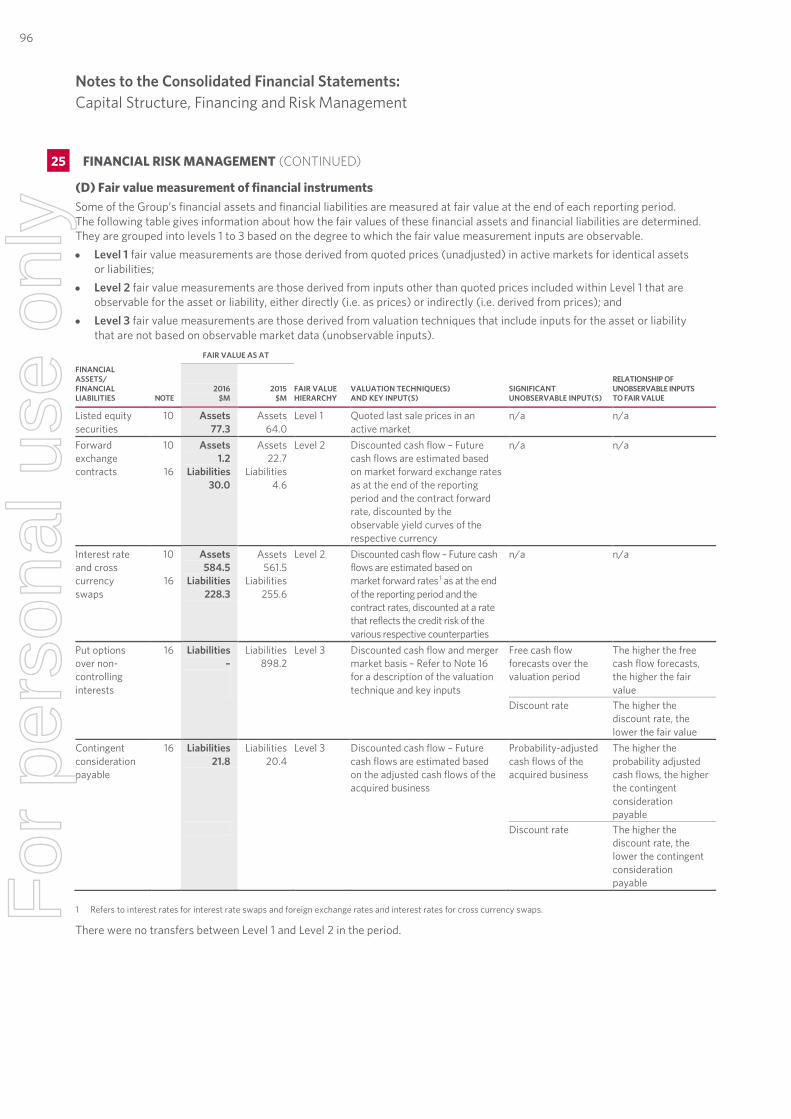
Notes to the Consolidated Financial Statements Capital Structure, Financing and Risk Management
46 | WOOLWORTHS LIMITED | FINANCIAL REPORT 2016
(D) Fair value measurement of financial instruments Some of the Group’s financial assets and financial liabilities are measured at fair value at the end of each reporting period. The following table gives information about how the fair values of these financial assets and financial liabilities are determined. They are grouped into levels 1 to 3 based on the degree to which the fair value measurement inputs are observable. • Level 1 fair value measurements are those derived from quoted prices (unadjusted) in active markets for identical assets
or liabilities; • Level 2 fair value measurements are those derived from inputs other than quoted prices included within Level 1 that are
observable for the asset or liability, either directly (i.e. as prices) or indirectly (i.e. derived from prices); and • Level 3 fair value measurements are those derived from valuation techniques that include inputs for the asset or liability
that are not based on observable market data (unobservable inputs). FAIR VALUE AS AT
FINANCIAL ASSETS/ FINANCIAL LIABILITIES NOTE
2016 $M
2015 $M
FAIR VALUE HIERARCHY
VALUATION TECHNIQUE(S) AND KEY INPUT(S)
SIGNIFICANT UNOBSERVABLE INPUT(S)
RELATIONSHIP OF UNOBSERVABLE INPUTS TO FAIR VALUE
Listed equity securities
10 Assets 77.3
Assets 64.0
Level 1 Quoted last sale prices in an active market
n/a n/a
Forward exchange contracts
10
16
Assets 1.2
Liabilities 30.0
Assets 22.7
Liabilities 4.6
Level 2 Discounted cash flow – Future cash flows are estimated based on market forward exchange rates as at the end of the reporting period and the contract forward rate, discounted by the observable yield curves of the respective currency
n/a n/a
Interest rate and cross currency swaps
10
16
Assets 584.5
Liabilities 228.3
Assets 561.5
Liabilities 255.6
Level 2 Discounted cash flow – Future cash flows are estimated based on market forward rates 1 as at the end of the reporting period and the contract rates, discounted at a rate that reflects the credit risk of the various respective counterparties
n/a n/a
Put options over non-controlling interests
16
Liabilities –
Liabilities 898.2
Level 3
Discounted cash flow and merger market basis – Refer to Note 16 for a description of the valuation technique and key inputs
Free cash flow forecasts over the valuation period
The higher the free cash flow forecasts, the higher the fair value
Discount rate The higher the discount rate, the lower the fair value
Contingent consideration payable
16 Liabilities 21.8
Liabilities 20.4
Level 3 Discounted cash flow – Future cash flows are estimated based on the adjusted cash flows of the acquired business
Probability-adjusted cash flows of the acquired business
The higher the probability adjusted cash flows, the higher the contingent consideration payable
Discount rate The higher the discount rate, the lower the contingent consideration payable
1 Refers to interest rates for interest rate swaps and foreign exchange rates and interest rates for cross currency swaps.
There were no transfers between Level 1 and Level 2 in the period.
25. FINANCIAL RISK MANAGEMENT CONTINUED
Notes to the Consolidated Financial Statements: Capital Structure, Financing and Risk Management
25 FINANCIAL RISK MANAGEMENT (CONTINUED)
96F
or p
erso
nal u
se o
nly
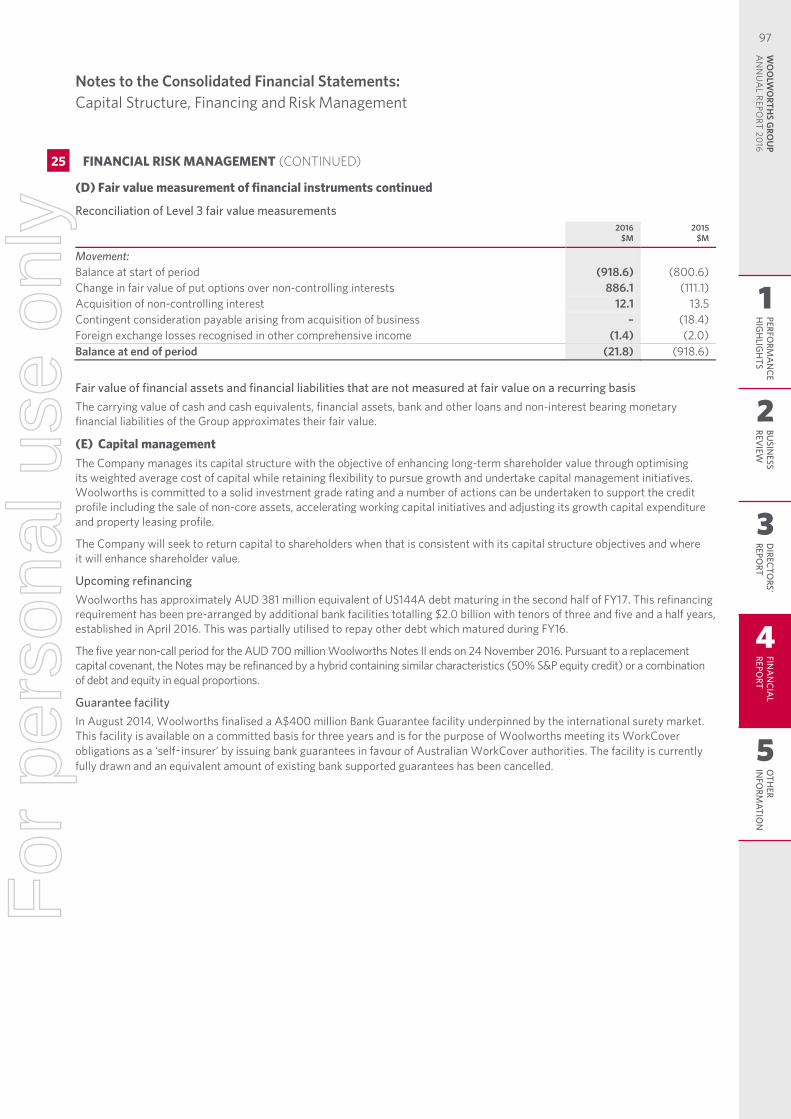
Notes to the Consolidated Financial Statements Capital Structure, Financing and Risk Management
47 | WOOLWORTHS LIMITED | FINANCIAL REPORT 2016
(D) Fair value measurement of financial instruments continued
Reconciliation of Level 3 fair value measurements
2016
$M 2015
$M
Movement: Balance at start of period (918.6) (800.6) Change in fair value of put options over non-controlling interests 886.1 (111.1) Acquisition of non-controlling interest 12.1 13.5 Contingent consideration payable arising from acquisition of business – (18.4) Foreign exchange losses recognised in other comprehensive income (1.4) (2.0) Balance at end of period (21.8) (918.6)
Fair value of financial assets and financial liabilities that are not measured at fair value on a recurring basis The carrying value of cash and cash equivalents, financial assets, bank and other loans and non-interest bearing monetary financial liabilities of the Group approximates their fair value.
(E) Capital management The Company manages its capital structure with the objective of enhancing long-term shareholder value through optimising its weighted average cost of capital while retaining flexibility to pursue growth and undertake capital management initiatives. Woolworths is committed to a solid investment grade rating and a number of actions can be undertaken to support the credit profile including the sale of non-core assets, accelerating working capital initiatives and adjusting its growth capital expenditure and property leasing profile.
The Company will seek to return capital to shareholders when that is consistent with its capital structure objectives and where it will enhance shareholder value.
Upcoming refinancing Woolworths has approximately AUD 381 million equivalent of US144A debt maturing in the second half of FY17. This refinancing requirement has been pre-arranged by additional bank facilities totalling $2.0 billion with tenors of three and five and a half years, established in April 2016. This was partially utilised to repay other debt which matured during FY16.
The five year non-call period for the AUD 700 million Woolworths Notes II ends on 24 November 2016. Pursuant to a replacement capital covenant, the Notes may be refinanced by a hybrid containing similar characteristics (50% S&P equity credit) or a combination of debt and equity in equal proportions.
Guarantee facility In August 2014, Woolworths finalised a A$400 million Bank Guarantee facility underpinned by the international surety market. This facility is available on a committed basis for three years and is for the purpose of Woolworths meeting its WorkCover obligations as a ‘self‑insurer’ by issuing bank guarantees in favour of Australian WorkCover authorities. The facility is currently fully drawn and an equivalent amount of existing bank supported guarantees has been cancelled.
25. FINANCIAL RISK MANAGEMENT CONTINUED
Notes to the Consolidated Financial Statements: Capital Structure, Financing and Risk Management
25 FINANCIAL RISK MANAGEMENT (CONTINUED)
1
2
3
4
5
PERFORM
AN
CEH
IGH
LIGH
TSBU
SINESS
REVIEW
DIRECTO
RS' REPO
RTFIN
AN
CIAL
REPORT
OTH
ER IN
FORM
ATION
WO
OLW
ORTH
S GRO
UP
AN
NU
AL REPO
RT 2016
97F
or p
erso
nal u
se o
nly
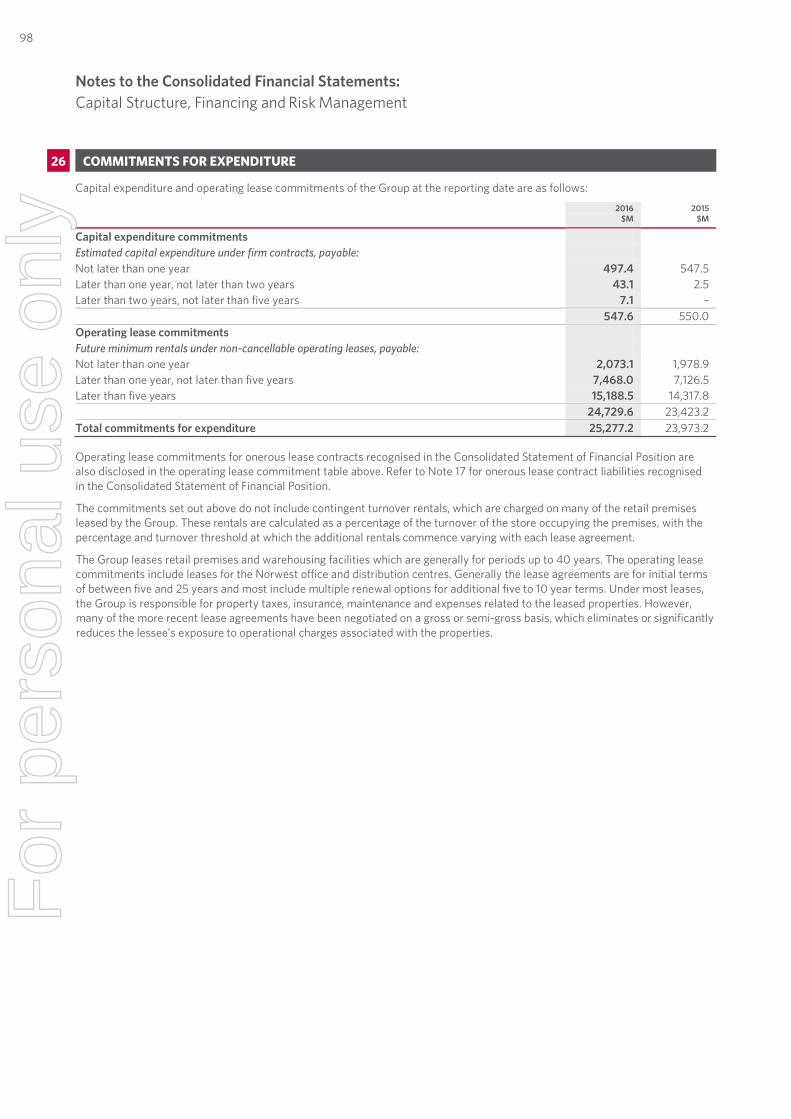
Notes to the Consolidated Financial Statements Capital Structure, Financing and Risk Management
48 | WOOLWORTHS LIMITED | FINANCIAL REPORT 2016
26. COMMITMENTS FOR EXPENDITURE
Capital expenditure and operating lease commitments of the Group at the reporting date are as follows:
2016
$M 2015
$M
Capital expenditure commitments Estimated capital expenditure under firm contracts, payable: Not later than one year 497.4 547.5 Later than one year, not later than two years 43.1 2.5 Later than two years, not later than five years 7.1 – 547.6 550.0 Operating lease commitments Future minimum rentals under non-cancellable operating leases, payable: Not later than one year 2,073.1 1,978.9 Later than one year, not later than five years 7,468.0 7,126.5 Later than five years 15,188.5 14,317.8 24,729.6 23,423.2 Total commitments for expenditure 25,277.2 23,973.2 Operating lease commitments for onerous lease contracts recognised in the Consolidated Statement of Financial Position are also disclosed in the operating lease commitment table above. Refer to Note 17 for onerous lease contract liabilities recognised in the Consolidated Statement of Financial Position.
The commitments set out above do not include contingent turnover rentals, which are charged on many of the retail premises leased by the Group. These rentals are calculated as a percentage of the turnover of the store occupying the premises, with the percentage and turnover threshold at which the additional rentals commence varying with each lease agreement.
The Group leases retail premises and warehousing facilities which are generally for periods up to 40 years. The operating lease commitments include leases for the Norwest office and distribution centres. Generally the lease agreements are for initial terms of between five and 25 years and most include multiple renewal options for additional five to 10 year terms. Under most leases, the Group is responsible for property taxes, insurance, maintenance and expenses related to the leased properties. However, many of the more recent lease agreements have been negotiated on a gross or semi-gross basis, which eliminates or significantly reduces the lessee’s exposure to operational charges associated with the properties.
Notes to the Consolidated Financial Statements: Capital Structure, Financing and Risk Management
26 COMMITMENTS FOR EXPENDITURE
98F
or p
erso
nal u
se o
nly
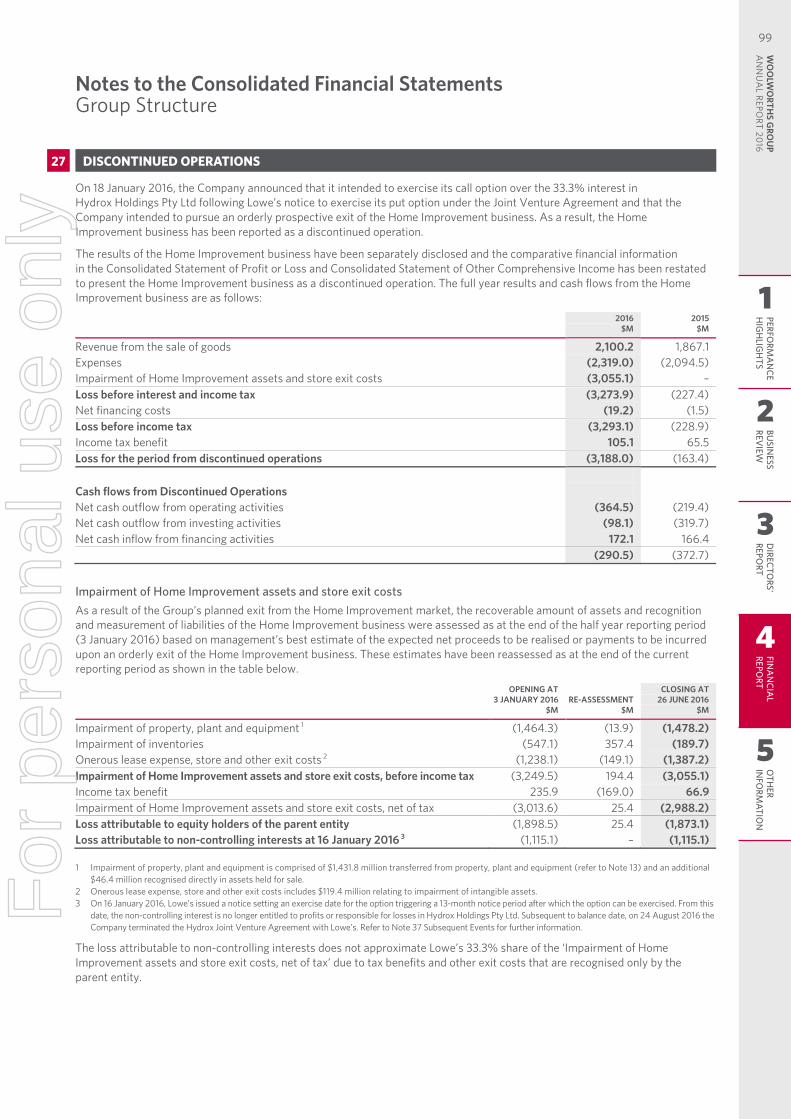
Notes to the Consolidated Financial Statements Group Structure
49 | WOOLWORTHS LIMITED | FINANCIAL REPORT 2016
27. DISCONTINUED OPERATIONS
On 18 January 2016, the Company announced that it intended to exercise its call option over the 33.3% interest in Hydrox Holdings Pty Ltd following Lowe’s notice to exercise its put option under the Joint Venture Agreement and that the Company intended to pursue an orderly prospective exit of the Home Improvement business. As a result, the Home Improvement business has been reported as a discontinued operation.
The results of the Home Improvement business have been separately disclosed and the comparative financial information in the Consolidated Statement of Profit or Loss and Consolidated Statement of Other Comprehensive Income has been restated to present the Home Improvement business as a discontinued operation. The full year results and cash flows from the Home Improvement business are as follows:
2016
$M 2015
$M
Revenue from the sale of goods 2,100.2 1,867.1 Expenses (2,319.0) (2,094.5) Impairment of Home Improvement assets and store exit costs (3,055.1) – Loss before interest and income tax (3,273.9) (227.4) Net financing costs (19.2) (1.5) Loss before income tax (3,293.1) (228.9) Income tax benefit 105.1 65.5 Loss for the period from discontinued operations (3,188.0) (163.4) Cash flows from Discontinued Operations Net cash outflow from operating activities (364.5) (219.4) Net cash outflow from investing activities (98.1) (319.7) Net cash inflow from financing activities 172.1 166.4 (290.5) (372.7)
Impairment of Home Improvement assets and store exit costs As a result of the Group’s planned exit from the Home Improvement market, the recoverable amount of assets and recognition and measurement of liabilities of the Home Improvement business were assessed as at the end of the half year reporting period (3 January 2016) based on management’s best estimate of the expected net proceeds to be realised or payments to be incurred upon an orderly exit of the Home Improvement business. These estimates have been reassessed as at the end of the current reporting period as shown in the table below.
OPENING AT 3 JANUARY 2016
$M RE-ASSESSMENT
$M
CLOSING AT 26 JUNE 2016
$M
Impairment of property, plant and equipment 1 (1,464.3) (13.9) (1,478.2) Impairment of inventories (547.1) 357.4 (189.7) Onerous lease expense, store and other exit costs 2 (1,238.1) (149.1) (1,387.2) Impairment of Home Improvement assets and store exit costs, before income tax (3,249.5) 194.4 (3,055.1) Income tax benefit 235.9 (169.0) 66.9 Impairment of Home Improvement assets and store exit costs, net of tax (3,013.6) 25.4 (2,988.2) Loss attributable to equity holders of the parent entity (1,898.5) 25.4 (1,873.1) Loss attributable to non-controlling interests at 16 January 2016 3 (1,115.1) – (1,115.1) 1 Impairment of property, plant and equipment is comprised of $1,431.8 million transferred from property, plant and equipment (refer to Note 13) and an additional
$46.4 million recognised directly in assets held for sale. 2 Onerous lease expense, store and other exit costs includes $119.4 million relating to impairment of intangible assets. 3 On 16 January 2016, Lowe’s issued a notice setting an exercise date for the option triggering a 13-month notice period after which the option can be exercised. From this
date, the non-controlling interest is no longer entitled to profits or responsible for losses in Hydrox Holdings Pty Ltd. Subsequent to balance date, on 24 August 2016 the Company terminated the Hydrox Joint Venture Agreement with Lowe’s. Refer to Note 37 Subsequent Events for further information.
The loss attributable to non-controlling interests does not approximate Lowe’s 33.3% share of the ‘Impairment of Home Improvement assets and store exit costs, net of tax’ due to tax benefits and other exit costs that are recognised only by the parent entity.
Notes to the Consolidated Financial StatementsGroup Structure
27 DISCONTINUED OPERATIONS
1
2
3
4
5
PERFORM
AN
CEH
IGH
LIGH
TSBU
SINESS
REVIEW
DIRECTO
RS' REPO
RTFIN
AN
CIAL
REPORT
OTH
ER IN
FORM
ATION
WO
OLW
ORTH
S GRO
UP
AN
NU
AL REPO
RT 2016
99F
or p
erso
nal u
se o
nly
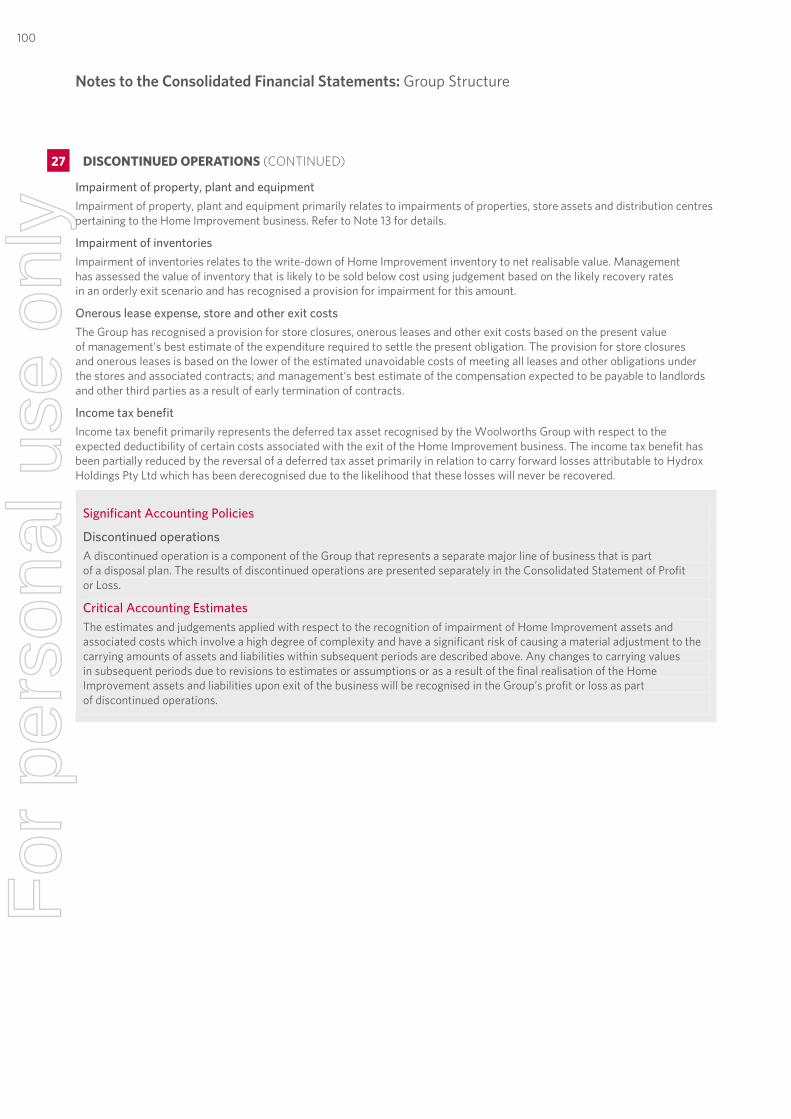
Notes to the Consolidated Financial Statements Group Structure
50 | WOOLWORTHS LIMITED | FINANCIAL REPORT 2016
Impairment of property, plant and equipment Impairment of property, plant and equipment primarily relates to impairments of properties, store assets and distribution centres pertaining to the Home Improvement business. Refer to Note 13 for details.
Impairment of inventories Impairment of inventories relates to the write-down of Home Improvement inventory to net realisable value. Management has assessed the value of inventory that is likely to be sold below cost using judgement based on the likely recovery rates in an orderly exit scenario and has recognised a provision for impairment for this amount.
Onerous lease expense, store and other exit costs The Group has recognised a provision for store closures, onerous leases and other exit costs based on the present value of management’s best estimate of the expenditure required to settle the present obligation. The provision for store closures and onerous leases is based on the lower of the estimated unavoidable costs of meeting all leases and other obligations under the stores and associated contracts; and management’s best estimate of the compensation expected to be payable to landlords and other third parties as a result of early termination of contracts.
Income tax benefit Income tax benefit primarily represents the deferred tax asset recognised by the Woolworths Group with respect to the expected deductibility of certain costs associated with the exit of the Home Improvement business. The income tax benefit has been partially reduced by the reversal of a deferred tax asset primarily in relation to carry forward losses attributable to Hydrox Holdings Pty Ltd which has been derecognised due to the likelihood that these losses will never be recovered.
Significant Accounting Policies
Discontinued operations A discontinued operation is a component of the Group that represents a separate major line of business that is part of a disposal plan. The results of discontinued operations are presented separately in the Consolidated Statement of Profit or Loss.
Critical Accounting Estimates The estimates and judgements applied with respect to the recognition of impairment of Home Improvement assets and associated costs which involve a high degree of complexity and have a significant risk of causing a material adjustment to the carrying amounts of assets and liabilities within subsequent periods are described above. Any changes to carrying values in subsequent periods due to revisions to estimates or assumptions or as a result of the final realisation of the Home Improvement assets and liabilities upon exit of the business will be recognised in the Group’s profit or loss as part of discontinued operations.
27. DISCONTINUED OPERATIONS CONTINUED
Notes to the Consolidated Financial Statements: Group Structure
27 DISCONTINUED OPERATIONS (CONTINUED)
100F
or p
erso
nal u
se o
nly
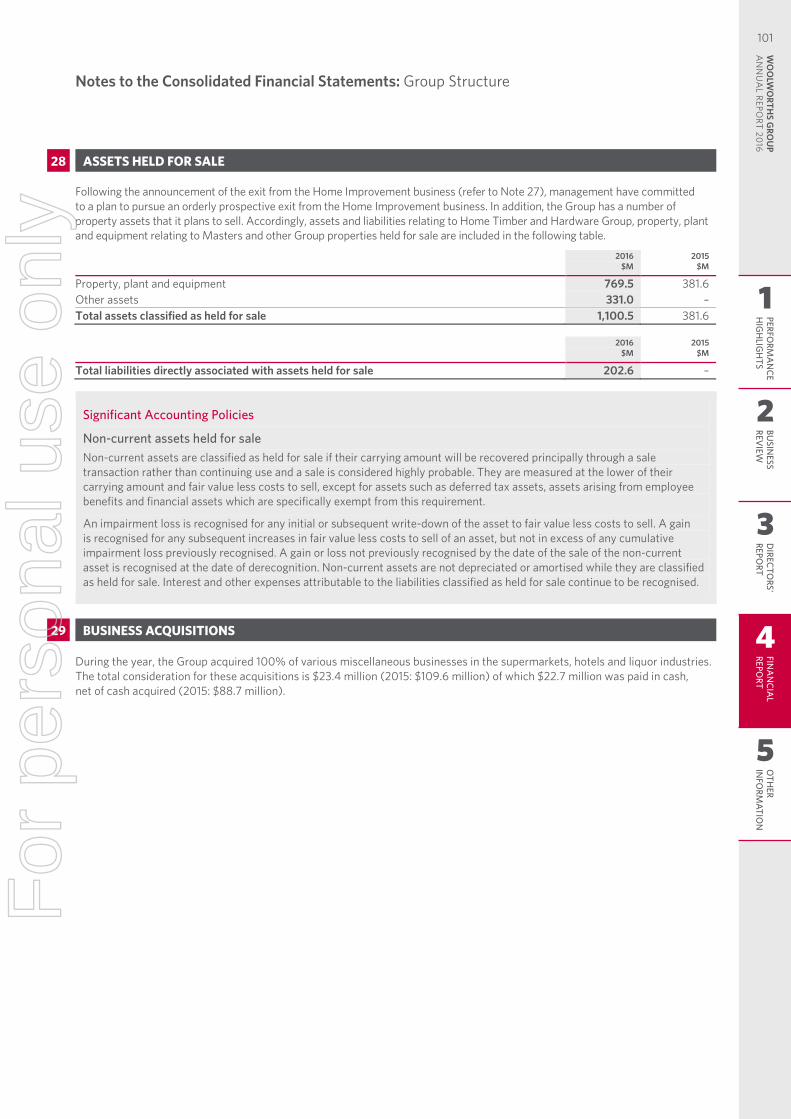
Notes to the Consolidated Financial Statements Group Structure
51 | WOOLWORTHS LIMITED | FINANCIAL REPORT 2016
28. ASSETS HELD FOR SALE
Following the announcement of the exit from the Home Improvement business (refer to Note 27), management have committed to a plan to pursue an orderly prospective exit from the Home Improvement business. In addition, the Group has a number of property assets that it plans to sell. Accordingly, assets and liabilities relating to Home Timber and Hardware Group, property, plant and equipment relating to Masters and other Group properties held for sale are included in the following table.
2016
$M 2015
$M
Property, plant and equipment 769.5 381.6 Other assets 331.0 – Total assets classified as held for sale 1,100.5 381.6
2016
$M 2015
$M
Total liabilities directly associated with assets held for sale 202.6 –
Significant Accounting Policies
Non-current assets held for sale Non-current assets are classified as held for sale if their carrying amount will be recovered principally through a sale transaction rather than continuing use and a sale is considered highly probable. They are measured at the lower of their carrying amount and fair value less costs to sell, except for assets such as deferred tax assets, assets arising from employee benefits and financial assets which are specifically exempt from this requirement.
An impairment loss is recognised for any initial or subsequent write-down of the asset to fair value less costs to sell. A gain is recognised for any subsequent increases in fair value less costs to sell of an asset, but not in excess of any cumulative impairment loss previously recognised. A gain or loss not previously recognised by the date of the sale of the non-current asset is recognised at the date of derecognition. Non-current assets are not depreciated or amortised while they are classified as held for sale. Interest and other expenses attributable to the liabilities classified as held for sale continue to be recognised.
29. BUSINESS ACQUISITIONS
During the year, the Group acquired 100% of various miscellaneous businesses in the supermarkets, hotels and liquor industries. The total consideration for these acquisitions is $23.4 million (2015: $109.6 million) of which $22.7 million was paid in cash, net of cash acquired (2015: $88.7 million).
Notes to the Consolidated Financial Statements: Group Structure
29 BUSINESS ACQUISITIONS
28 ASSETS HELD FOR SALE
1
2
3
4
5
PERFORM
AN
CEH
IGH
LIGH
TSBU
SINESS
REVIEW
DIRECTO
RS' REPO
RTFIN
AN
CIAL
REPORT
OTH
ER IN
FORM
ATION
WO
OLW
ORTH
S GRO
UP
AN
NU
AL REPO
RT 2016
101F
or p
erso
nal u
se o
nly
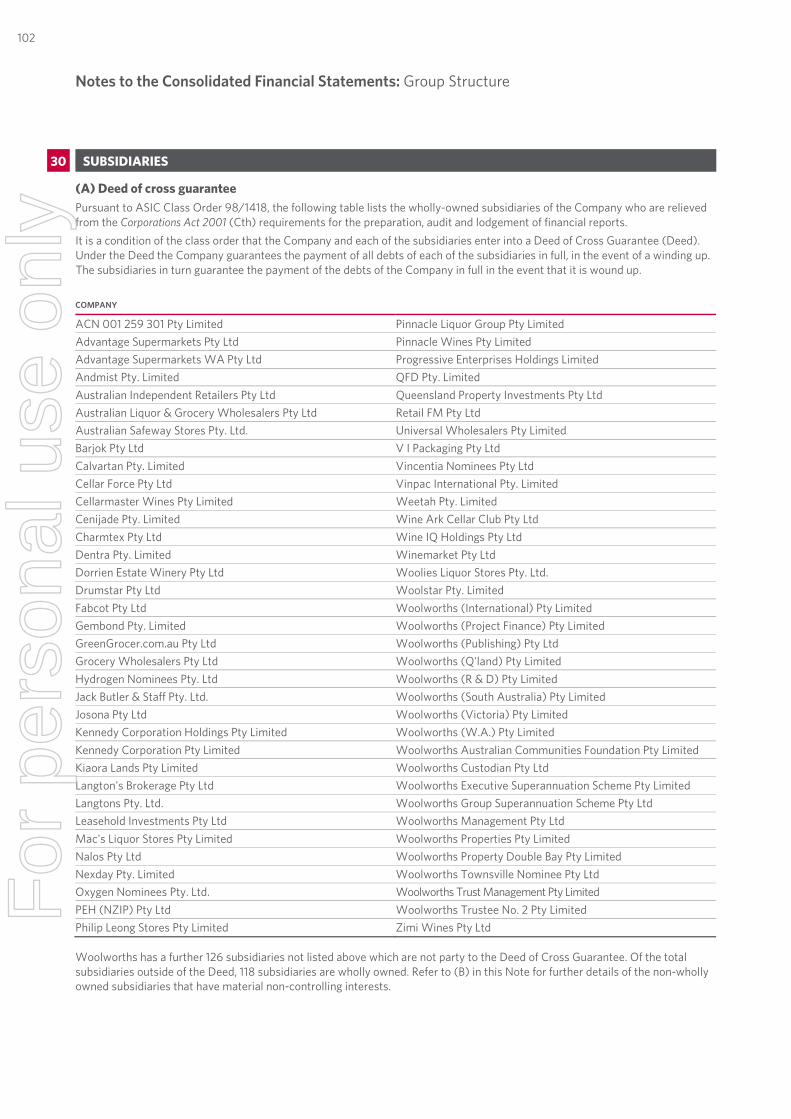
Notes to the Consolidated Financial Statements Group Structure
52 | WOOLWORTHS LIMITED | FINANCIAL REPORT 2016
30. SUBSIDIARIES
(A) Deed of cross guarantee Pursuant to ASIC Class Order 98/1418, the following table lists the wholly-owned subsidiaries of the Company who are relieved from the Corporations Act 2001 (Cth) requirements for the preparation, audit and lodgement of financial reports. It is a condition of the class order that the Company and each of the subsidiaries enter into a Deed of Cross Guarantee (Deed). Under the Deed the Company guarantees the payment of all debts of each of the subsidiaries in full, in the event of a winding up. The subsidiaries in turn guarantee the payment of the debts of the Company in full in the event that it is wound up. COMPANY
ACN 001 259 301 Pty Limited Pinnacle Liquor Group Pty Limited Advantage Supermarkets Pty Ltd Pinnacle Wines Pty Limited Advantage Supermarkets WA Pty Ltd Progressive Enterprises Holdings Limited Andmist Pty. Limited QFD Pty. Limited Australian Independent Retailers Pty Ltd Queensland Property Investments Pty Ltd Australian Liquor & Grocery Wholesalers Pty Ltd Retail FM Pty Ltd Australian Safeway Stores Pty. Ltd. Universal Wholesalers Pty Limited Barjok Pty Ltd V I Packaging Pty Ltd Calvartan Pty. Limited Vincentia Nominees Pty Ltd Cellar Force Pty Ltd Vinpac International Pty. Limited Cellarmaster Wines Pty Limited Weetah Pty. Limited Cenijade Pty. Limited Wine Ark Cellar Club Pty Ltd Charmtex Pty Ltd Wine IQ Holdings Pty Ltd Dentra Pty. Limited Winemarket Pty Ltd Dorrien Estate Winery Pty Ltd Woolies Liquor Stores Pty. Ltd. Drumstar Pty Ltd Woolstar Pty. Limited Fabcot Pty Ltd Woolworths (International) Pty Limited Gembond Pty. Limited Woolworths (Project Finance) Pty Limited GreenGrocer.com.au Pty Ltd Woolworths (Publishing) Pty Ltd Grocery Wholesalers Pty Ltd Woolworths (Q'land) Pty Limited Hydrogen Nominees Pty. Ltd Woolworths (R & D) Pty Limited Jack Butler & Staff Pty. Ltd. Woolworths (South Australia) Pty Limited Josona Pty Ltd Woolworths (Victoria) Pty Limited Kennedy Corporation Holdings Pty Limited Woolworths (W.A.) Pty Limited Kennedy Corporation Pty Limited Woolworths Australian Communities Foundation Pty Limited Kiaora Lands Pty Limited Woolworths Custodian Pty Ltd Langton's Brokerage Pty Ltd Woolworths Executive Superannuation Scheme Pty Limited Langtons Pty. Ltd. Woolworths Group Superannuation Scheme Pty Ltd Leasehold Investments Pty Ltd Woolworths Management Pty Ltd Mac's Liquor Stores Pty Limited Woolworths Properties Pty Limited Nalos Pty Ltd Woolworths Property Double Bay Pty Limited Nexday Pty. Limited Woolworths Townsville Nominee Pty Ltd Oxygen Nominees Pty. Ltd. Woolworths Trust Management Pty Limited PEH (NZIP) Pty Ltd Woolworths Trustee No. 2 Pty Limited Philip Leong Stores Pty Limited Zimi Wines Pty Ltd Woolworths has a further 126 subsidiaries not listed above which are not party to the Deed of Cross Guarantee. Of the total subsidiaries outside of the Deed, 118 subsidiaries are wholly owned. Refer to (B) in this Note for further details of the non-wholly owned subsidiaries that have material non-controlling interests.
Notes to the Consolidated Financial Statements: Group Structure
30 SUBSIDIARIES
102F
or p
erso
nal u
se o
nly
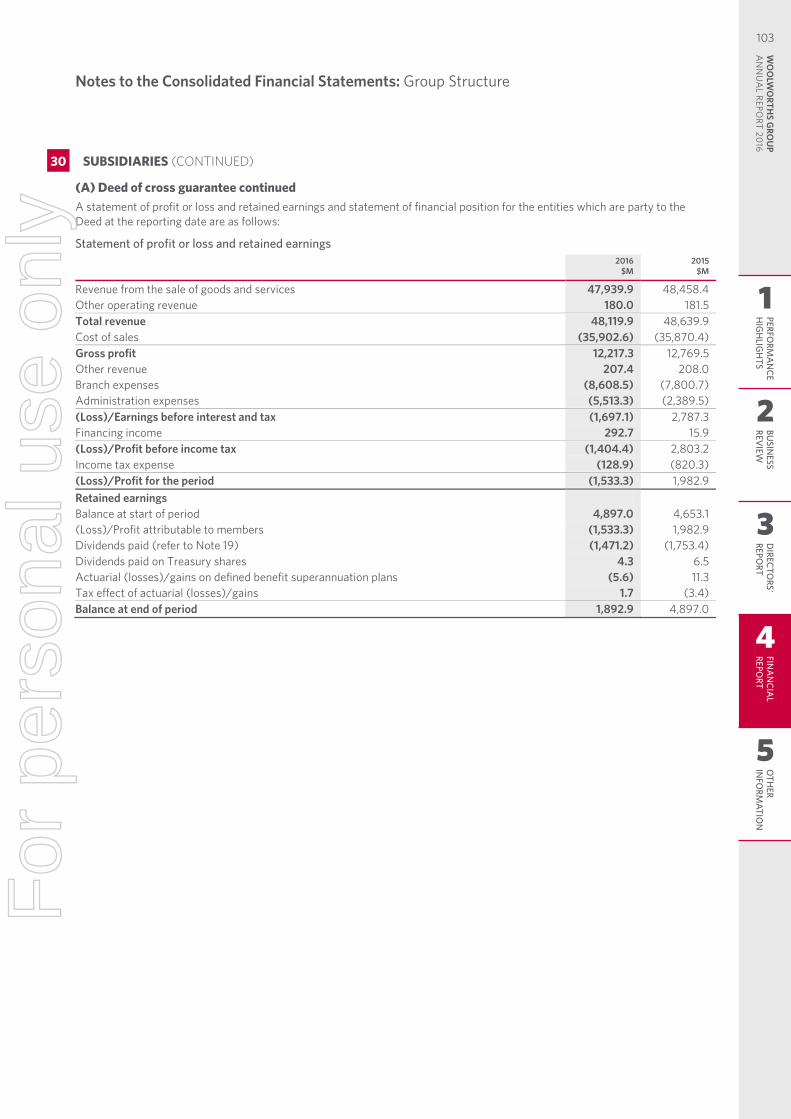
Notes to the Consolidated Financial Statements Group Structure
53 | WOOLWORTHS LIMITED | FINANCIAL REPORT 2016
(A) Deed of cross guarantee continued A statement of profit or loss and retained earnings and statement of financial position for the entities which are party to the Deed at the reporting date are as follows:
Statement of profit or loss and retained earnings
2016
$M 2015
$M
Revenue from the sale of goods and services 47,939.9 48,458.4 Other operating revenue 180.0 181.5 Total revenue 48,119.9 48,639.9 Cost of sales (35,902.6) (35,870.4) Gross profit 12,217.3 12,769.5 Other revenue 207.4 208.0 Branch expenses (8,608.5) (7,800.7) Administration expenses (5,513.3) (2,389.5) (Loss)/Earnings before interest and tax (1,697.1) 2,787.3 Financing income 292.7 15.9 (Loss)/Profit before income tax (1,404.4) 2,803.2 Income tax expense (128.9) (820.3) (Loss)/Profit for the period (1,533.3) 1,982.9 Retained earnings Balance at start of period 4,897.0 4,653.1 (Loss)/Profit attributable to members (1,533.3) 1,982.9 Dividends paid (refer to Note 19) (1,471.2) (1,753.4) Dividends paid on Treasury shares 4.3 6.5 Actuarial (losses)/gains on defined benefit superannuation plans (5.6) 11.3 Tax effect of actuarial (losses)/gains 1.7 (3.4) Balance at end of period 1,892.9 4,897.0
30. SUBSIDIARIES CONTINUED
Notes to the Consolidated Financial Statements: Group Structure
30 SUBSIDIARIES (CONTINUED)
1
2
3
4
5
PERFORM
AN
CEH
IGH
LIGH
TSBU
SINESS
REVIEW
DIRECTO
RS' REPO
RTFIN
AN
CIAL
REPORT
OTH
ER IN
FORM
ATION
WO
OLW
ORTH
S GRO
UP
AN
NU
AL REPO
RT 2016
103F
or p
erso
nal u
se o
nly
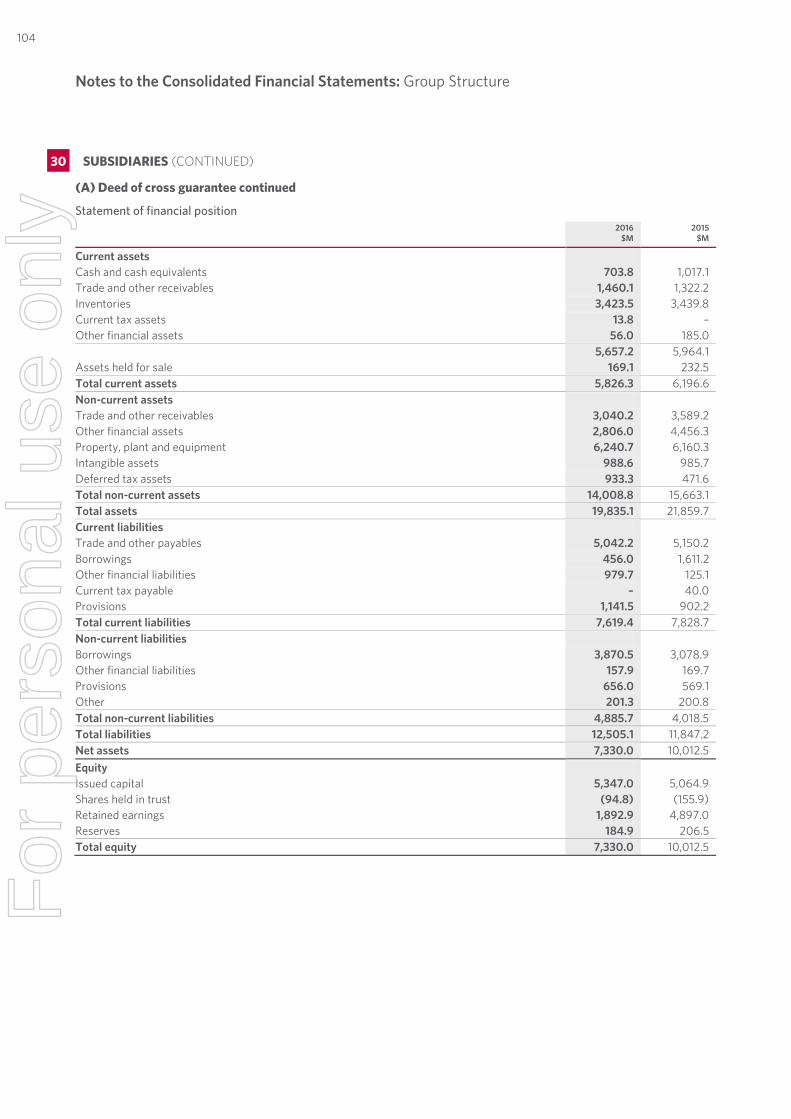
Notes to the Consolidated Financial Statements Group Structure
54 | WOOLWORTHS LIMITED | FINANCIAL REPORT 2016
(A) Deed of cross guarantee continued
Statement of financial position
2016
$M 2015
$M
Current assets Cash and cash equivalents 703.8 1,017.1 Trade and other receivables 1,460.1 1,322.2 Inventories 3,423.5 3,439.8 Current tax assets 13.8 – Other financial assets 56.0 185.0 5,657.2 5,964.1 Assets held for sale 169.1 232.5 Total current assets 5,826.3 6,196.6 Non-current assets Trade and other receivables 3,040.2 3,589.2 Other financial assets 2,806.0 4,456.3 Property, plant and equipment 6,240.7 6,160.3 Intangible assets 988.6 985.7 Deferred tax assets 933.3 471.6 Total non-current assets 14,008.8 15,663.1 Total assets 19,835.1 21,859.7 Current liabilities Trade and other payables 5,042.2 5,150.2 Borrowings 456.0 1,611.2 Other financial liabilities 979.7 125.1 Current tax payable – 40.0 Provisions 1,141.5 902.2 Total current liabilities 7,619.4 7,828.7 Non-current liabilities Borrowings 3,870.5 3,078.9 Other financial liabilities 157.9 169.7 Provisions 656.0 569.1 Other 201.3 200.8 Total non-current liabilities 4,885.7 4,018.5 Total liabilities 12,505.1 11,847.2 Net assets 7,330.0 10,012.5 Equity Issued capital 5,347.0 5,064.9 Shares held in trust (94.8) (155.9) Retained earnings 1,892.9 4,897.0 Reserves 184.9 206.5 Total equity 7,330.0 10,012.5
30. SUBSIDIARIES CONTINUED
Notes to the Consolidated Financial Statements: Group Structure
30 SUBSIDIARIES (CONTINUED)
104F
or p
erso
nal u
se o
nly
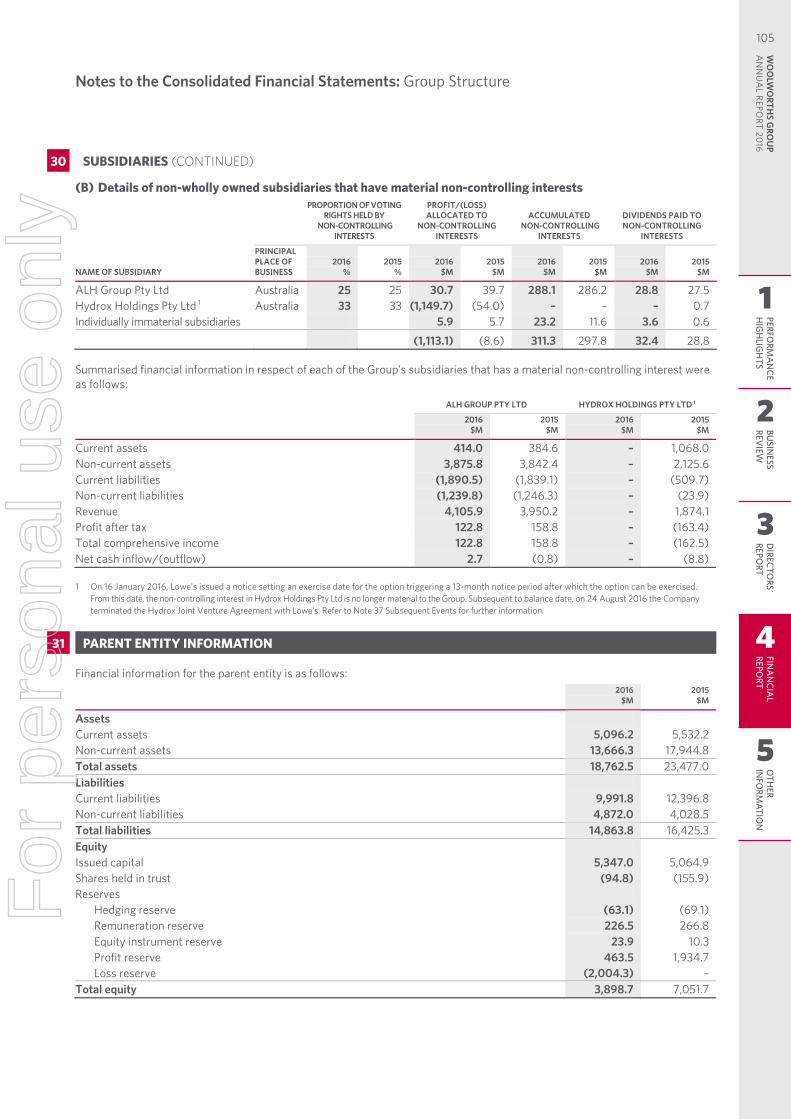
Notes to the Consolidated Financial Statements Group Structure
55 | WOOLWORTHS LIMITED | FINANCIAL REPORT 2016
(B) Details of non-wholly owned subsidiaries that have material non-controlling interests
PROPORTION OF VOTING RIGHTS HELD BY
NON-CONTROLLING INTERESTS
PROFIT/(LOSS) ALLOCATED TO
NON-CONTROLLING INTERESTS
ACCUMULATED NON-CONTROLLING
INTERESTS
DIVIDENDS PAID TO NON-CONTROLLING
INTERESTS
NAME OF SUBSIDIARY
PRINCIPAL PLACE OF BUSINESS
2016 %
2015 %
2016 $M
2015 $M
2016 $M
2015 $M
2016 $M
2015 $M
ALH Group Pty Ltd Australia 25 25 30.7 39.7 288.1 286.2 28.8 27.5 Hydrox Holdings Pty Ltd 1 Australia 33 33 (1,149.7) (54.0) – – – 0.7 Individually immaterial subsidiaries 5.9 5.7 23.2 11.6 3.6 0.6 (1,113.1) (8.6) 311.3 297.8 32.4 28.8 Summarised financial information in respect of each of the Group’s subsidiaries that has a material non-controlling interest were as follows:
ALH GROUP PTY LTD HYDROX HOLDINGS PTY LTD 1
2016
$M 2015
$M 2016
$M 2015
$M
Current assets 414.0 384.6 – 1,068.0 Non-current assets 3,875.8 3,842.4 – 2,125.6 Current liabilities (1,890.5) (1,839.1) – (509.7) Non-current liabilities (1,239.8) (1,246.3) – (23.9) Revenue 4,105.9 3,950.2 – 1,874.1 Profit after tax 122.8 158.8 – (163.4) Total comprehensive income 122.8 158.8 – (162.5) Net cash inflow/(outflow) 2.7 (0.8) – (8.8) 1 On 16 January 2016, Lowe’s issued a notice setting an exercise date for the option triggering a 13-month notice period after which the option can be exercised.
From this date, the non-controlling interest in Hydrox Holdings Pty Ltd is no longer material to the Group. Subsequent to balance date, on 24 August 2016 the Company terminated the Hydrox Joint Venture Agreement with Lowe’s. Refer to Note 37 Subsequent Events for further information.
31. PARENT ENTITY INFORMATION
Financial information for the parent entity is as follows:
2016
$M 2015
$M
Assets Current assets 5,096.2 5,532.2 Non-current assets 13,666.3 17,944.8 Total assets 18,762.5 23,477.0 Liabilities Current liabilities 9,991.8 12,396.8 Non-current liabilities 4,872.0 4,028.5 Total liabilities 14,863.8 16,425.3 Equity Issued capital 5,347.0 5,064.9 Shares held in trust (94.8) (155.9) Reserves
Hedging reserve (63.1) (69.1) Remuneration reserve 226.5 266.8 Equity instrument reserve 23.9 10.3 Profit reserve 463.5 1,934.7 Loss reserve (2,004.3) –
Total equity 3,898.7 7,051.7
30. SUBSIDIARIES CONTINUED
Notes to the Consolidated Financial Statements: Group Structure
31 PARENT ENTITY INFORMATION
30 SUBSIDIARIES (CONTINUED)
1
2
3
4
5
PERFORM
AN
CEH
IGH
LIGH
TSBU
SINESS
REVIEW
DIRECTO
RS' REPO
RTFIN
AN
CIAL
REPORT
OTH
ER IN
FORM
ATION
WO
OLW
ORTH
S GRO
UP
AN
NU
AL REPO
RT 2016
105F
or p
erso
nal u
se o
nly
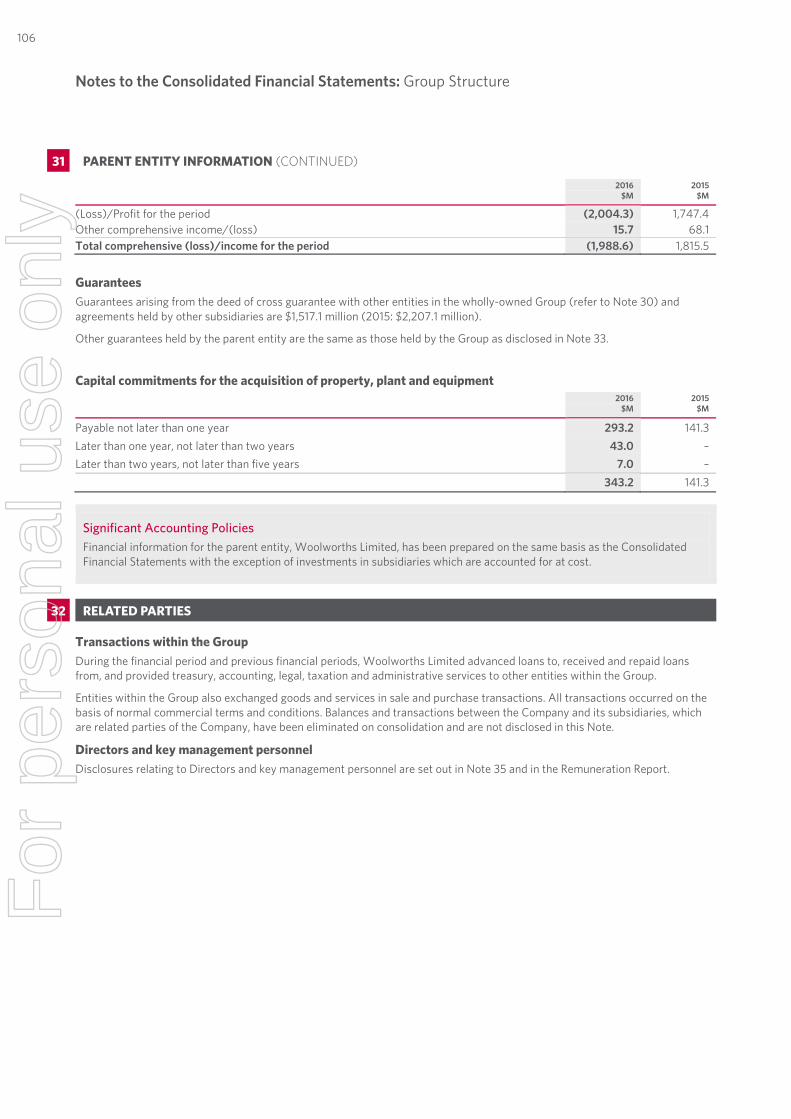
Notes to the Consolidated Financial Statements Group Structure
56 | WOOLWORTHS LIMITED | FINANCIAL REPORT 2016
2016
$M 2015
$M
(Loss)/Profit for the period (2,004.3) 1,747.4 Other comprehensive income/(loss) 15.7 68.1 Total comprehensive (loss)/income for the period (1,988.6) 1,815.5
Guarantees Guarantees arising from the deed of cross guarantee with other entities in the wholly-owned Group (refer to Note 30) and agreements held by other subsidiaries are $1,517.1 million (2015: $2,207.1 million).
Other guarantees held by the parent entity are the same as those held by the Group as disclosed in Note 33.
Capital commitments for the acquisition of property, plant and equipment
2016
$M 2015
$M
Payable not later than one year 293.2 141.3 Later than one year, not later than two years 43.0 – Later than two years, not later than five years 7.0 – 343.2 141.3
Significant Accounting Policies Financial information for the parent entity, Woolworths Limited, has been prepared on the same basis as the Consolidated Financial Statements with the exception of investments in subsidiaries which are accounted for at cost.
32. RELATED PARTIES
Transactions within the Group During the financial period and previous financial periods, Woolworths Limited advanced loans to, received and repaid loans from, and provided treasury, accounting, legal, taxation and administrative services to other entities within the Group.
Entities within the Group also exchanged goods and services in sale and purchase transactions. All transactions occurred on the basis of normal commercial terms and conditions. Balances and transactions between the Company and its subsidiaries, which are related parties of the Company, have been eliminated on consolidation and are not disclosed in this Note.
Directors and key management personnel Disclosures relating to Directors and key management personnel are set out in Note 35 and in the Remuneration Report.
31. PARENT ENTITY INFORMATION CONTINUED
Notes to the Consolidated Financial Statements: Group Structure
32 RELATED PARTIES
31 PARENT ENTITY INFORMATION (CONTINUED)
106F
or p
erso
nal u
se o
nly
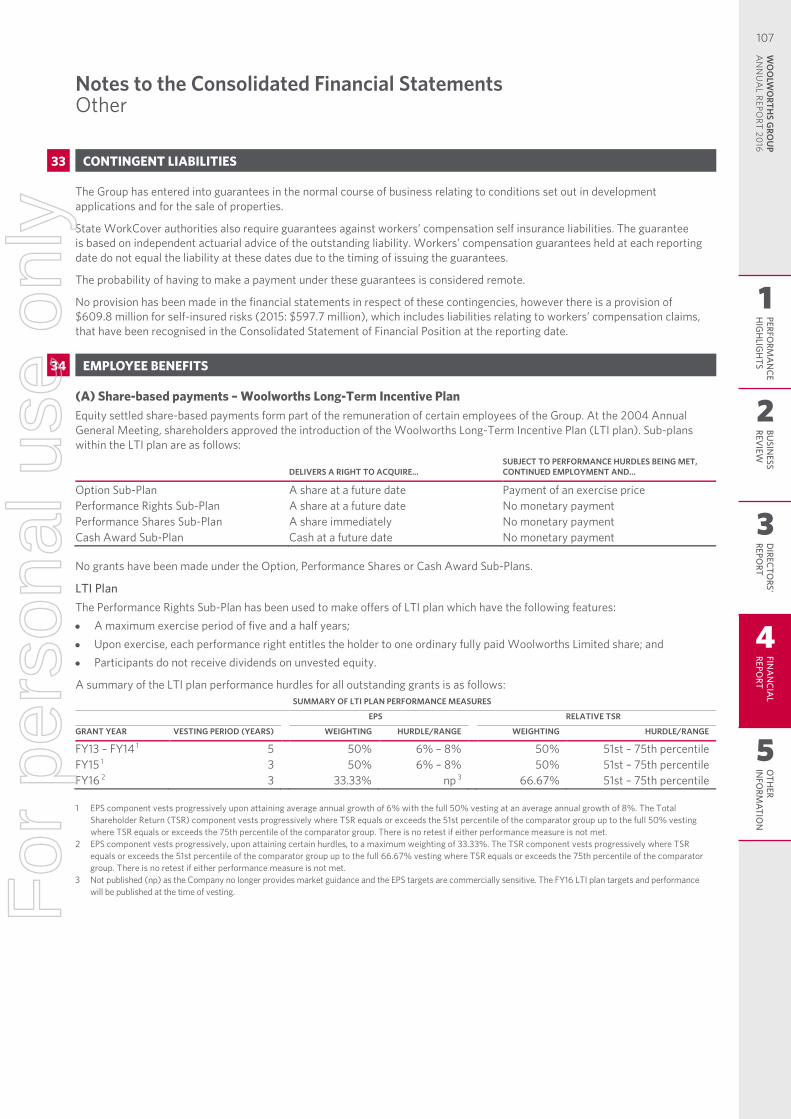
Notes to the Consolidated Financial Statements Other
57 | WOOLWORTHS LIMITED | FINANCIAL REPORT 2016
33. CONTINGENT LIABILITIES
The Group has entered into guarantees in the normal course of business relating to conditions set out in development applications and for the sale of properties.
State WorkCover authorities also require guarantees against workers’ compensation self insurance liabilities. The guarantee is based on independent actuarial advice of the outstanding liability. Workers’ compensation guarantees held at each reporting date do not equal the liability at these dates due to the timing of issuing the guarantees.
The probability of having to make a payment under these guarantees is considered remote.
No provision has been made in the financial statements in respect of these contingencies, however there is a provision of $609.8 million for self-insured risks (2015: $597.7 million), which includes liabilities relating to workers’ compensation claims, that have been recognised in the Consolidated Statement of Financial Position at the reporting date.
34. EMPLOYEE BENEFITS
(A) Share-based payments – Woolworths Long-Term Incentive Plan Equity settled share-based payments form part of the remuneration of certain employees of the Group. At the 2004 Annual General Meeting, shareholders approved the introduction of the Woolworths Long-Term Incentive Plan (LTI plan). Sub-plans within the LTI plan are as follows:
DELIVERS A RIGHT TO ACQUIRE... SUBJECT TO PERFORMANCE HURDLES BEING MET, CONTINUED EMPLOYMENT AND...
Option Sub-Plan A share at a future date Payment of an exercise price Performance Rights Sub-Plan A share at a future date No monetary payment Performance Shares Sub-Plan A share immediately No monetary payment Cash Award Sub-Plan Cash at a future date No monetary payment No grants have been made under the Option, Performance Shares or Cash Award Sub-Plans.
LTI Plan The Performance Rights Sub-Plan has been used to make offers of LTI plan which have the following features: • A maximum exercise period of five and a half years; • Upon exercise, each performance right entitles the holder to one ordinary fully paid Woolworths Limited share; and • Participants do not receive dividends on unvested equity.
A summary of the LTI plan performance hurdles for all outstanding grants is as follows: SUMMARY OF LTI PLAN PERFORMANCE MEASURES
EPS RELATIVE TSR
GRANT YEAR VESTING PERIOD (YEARS) WEIGHTING HURDLE/RANGE WEIGHTING HURDLE/RANGE
FY13 – FY14 1 5 50% 6% – 8% 50% 51st – 75th percentile FY15 1 3 50% 6% – 8% 50% 51st – 75th percentile FY16 2 3 33.33% np 3 66.67% 51st – 75th percentile 1 EPS component vests progressively upon attaining average annual growth of 6% with the full 50% vesting at an average annual growth of 8%. The Total
Shareholder Return (TSR) component vests progressively where TSR equals or exceeds the 51st percentile of the comparator group up to the full 50% vesting where TSR equals or exceeds the 75th percentile of the comparator group. There is no retest if either performance measure is not met.
2 EPS component vests progressively, upon attaining certain hurdles, to a maximum weighting of 33.33%. The TSR component vests progressively where TSR equals or exceeds the 51st percentile of the comparator group up to the full 66.67% vesting where TSR equals or exceeds the 75th percentile of the comparator group. There is no retest if either performance measure is not met.
3 Not published (np) as the Company no longer provides market guidance and the EPS targets are commercially sensitive. The FY16 LTI plan targets and performance will be published at the time of vesting.
Notes to the Consolidated Financial StatementsOther
33 CONTINGENT LIABILITIES
34 EMPLOYEE BENEFITS
1
2
3
4
5
PERFORM
AN
CEH
IGH
LIGH
TSBU
SINESS
REVIEW
DIRECTO
RS' REPO
RTFIN
AN
CIAL
REPORT
OTH
ER IN
FORM
ATION
WO
OLW
ORTH
S GRO
UP
AN
NU
AL REPO
RT 2016
107F
or p
erso
nal u
se o
nly
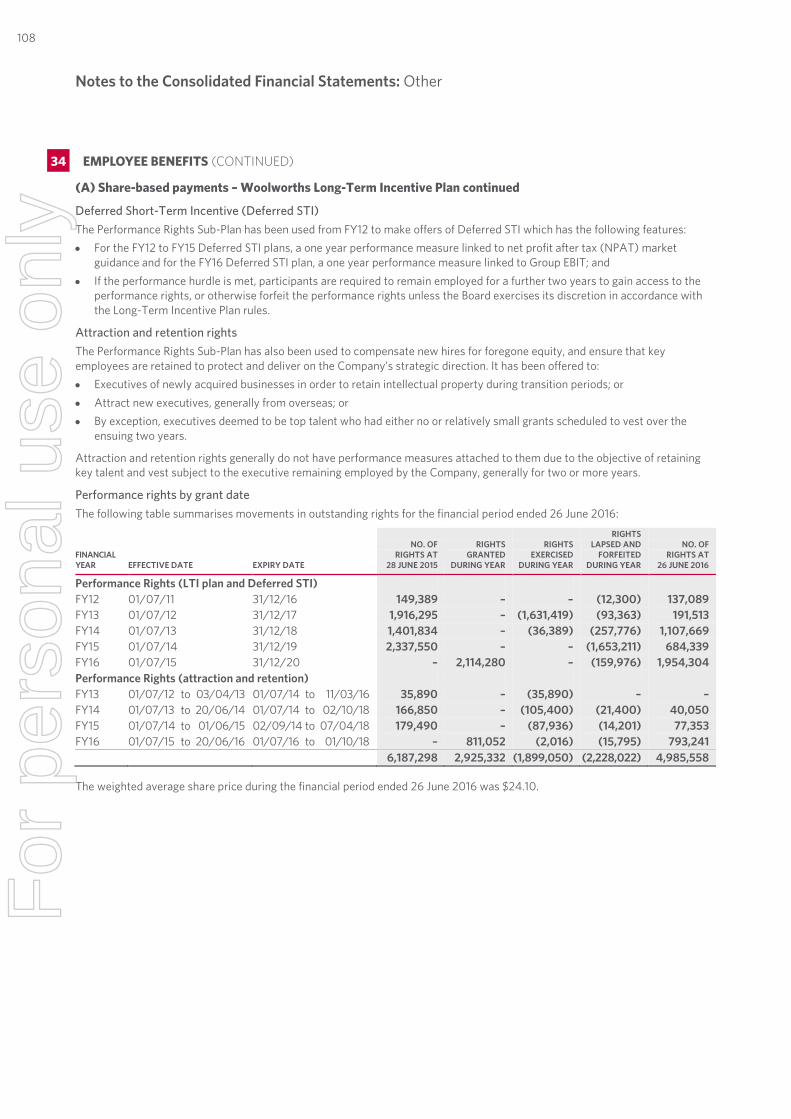
Notes to the Consolidated Financial Statements Other
58 | WOOLWORTHS LIMITED | FINANCIAL REPORT 2016
(A) Share-based payments – Woolworths Long-Term Incentive Plan continued
Deferred Short-Term Incentive (Deferred STI) The Performance Rights Sub-Plan has been used from FY12 to make offers of Deferred STI which has the following features: • For the FY12 to FY15 Deferred STI plans, a one year performance measure linked to net profit after tax (NPAT) market
guidance and for the FY16 Deferred STI plan, a one year performance measure linked to Group EBIT; and • If the performance hurdle is met, participants are required to remain employed for a further two years to gain access to the
performance rights, or otherwise forfeit the performance rights unless the Board exercises its discretion in accordance with the Long-Term Incentive Plan rules.
Attraction and retention rights The Performance Rights Sub-Plan has also been used to compensate new hires for foregone equity, and ensure that key employees are retained to protect and deliver on the Company’s strategic direction. It has been offered to: • Executives of newly acquired businesses in order to retain intellectual property during transition periods; or • Attract new executives, generally from overseas; or • By exception, executives deemed to be top talent who had either no or relatively small grants scheduled to vest over the
ensuing two years.
Attraction and retention rights generally do not have performance measures attached to them due to the objective of retaining key talent and vest subject to the executive remaining employed by the Company, generally for two or more years.
Performance rights by grant date The following table summarises movements in outstanding rights for the financial period ended 26 June 2016:
FINANCIAL YEAR EFFECTIVE DATE EXPIRY DATE
NO. OF RIGHTS AT
28 JUNE 2015
RIGHTS GRANTED
DURING YEAR
RIGHTS EXERCISED
DURING YEAR
RIGHTS LAPSED AND
FORFEITED DURING YEAR
NO. OF RIGHTS AT
26 JUNE 2016
Performance Rights (LTI plan and Deferred STI) FY12 01/07/11 31/12/16 149,389 – – (12,300) 137,089 FY13 01/07/12 31/12/17 1,916,295 – (1,631,419) (93,363) 191,513 FY14 01/07/13 31/12/18 1,401,834 – (36,389) (257,776) 1,107,669 FY15 01/07/14 31/12/19 2,337,550 – – (1,653,211) 684,339 FY16 01/07/15 31/12/20 – 2,114,280 – (159,976) 1,954,304 Performance Rights (attraction and retention) FY13 01/07/12 to 03/04/13 01/07/14 to 11/03/16 35,890 – (35,890) – – FY14 01/07/13 to 20/06/14 01/07/14 to 02/10/18 166,850 – (105,400) (21,400) 40,050 FY15 01/07/14 to 01/06/15 02/09/14 to 07/04/18 179,490 – (87,936) (14,201) 77,353 FY16 01/07/15 to 20/06/16 01/07/16 to 01/10/18 – 811,052 (2,016) (15,795) 793,241 6,187,298 2,925,332 (1,899,050) (2,228,022) 4,985,558 The weighted average share price during the financial period ended 26 June 2016 was $24.10.
34. EMPLOYEE BENEFITS CONTINUED
Notes to the Consolidated Financial Statements: Other
34 EMPLOYEE BENEFITS (CONTINUED)
108F
or p
erso
nal u
se o
nly
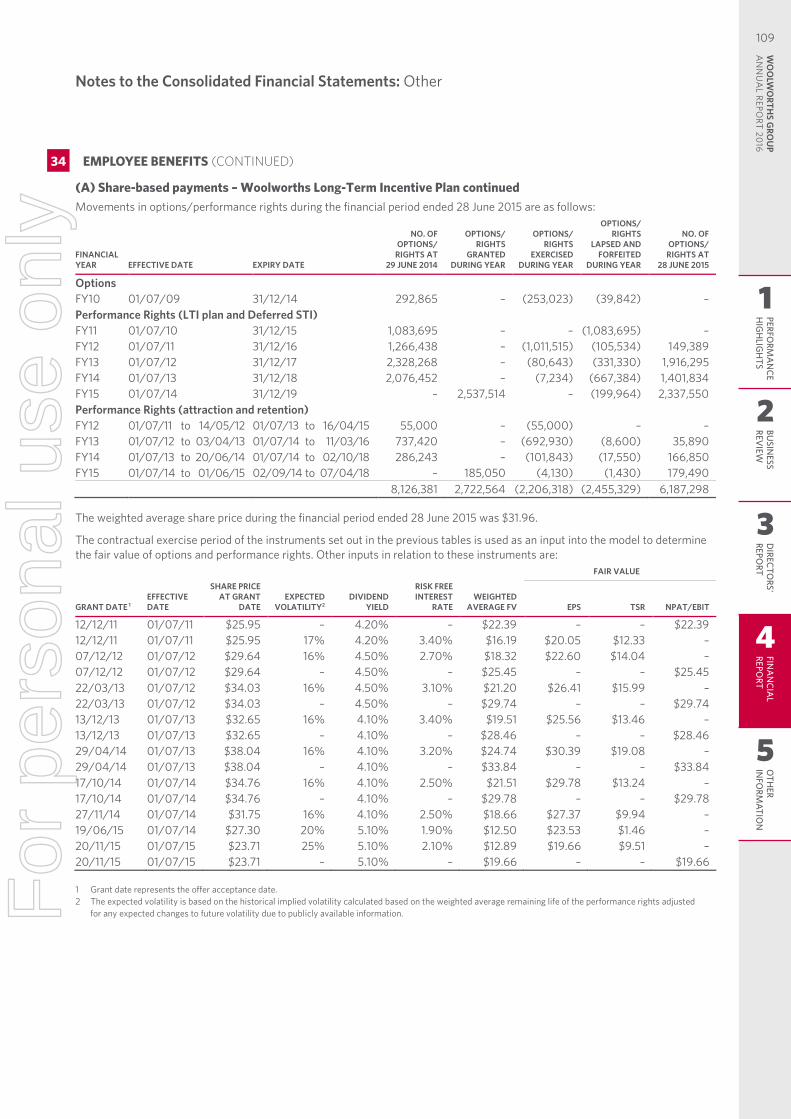
Notes to the Consolidated Financial Statements Other
59 | WOOLWORTHS LIMITED | FINANCIAL REPORT 2016
(A) Share-based payments – Woolworths Long-Term Incentive Plan continued Movements in options/performance rights during the financial period ended 28 June 2015 are as follows:
FINANCIAL YEAR EFFECTIVE DATE EXPIRY DATE
NO. OF OPTIONS/
RIGHTS AT 29 JUNE 2014
OPTIONS/ RIGHTS
GRANTED DURING YEAR
OPTIONS/ RIGHTS
EXERCISED DURING YEAR
OPTIONS/ RIGHTS
LAPSED AND FORFEITED
DURING YEAR
NO. OF OPTIONS/
RIGHTS AT 28 JUNE 2015
Options FY10 01/07/09 31/12/14 292,865 – (253,023) (39,842) – Performance Rights (LTI plan and Deferred STI) FY11 01/07/10 31/12/15 1,083,695 – – (1,083,695) – FY12 01/07/11 31/12/16 1,266,438 – (1,011,515) (105,534) 149,389 FY13 01/07/12 31/12/17 2,328,268 – (80,643) (331,330) 1,916,295 FY14 01/07/13 31/12/18 2,076,452 – (7,234) (667,384) 1,401,834 FY15 01/07/14 31/12/19 – 2,537,514 – (199,964) 2,337,550 Performance Rights (attraction and retention) FY12 01/07/11 to 14/05/12 01/07/13 to 16/04/15 55,000 – (55,000) – – FY13 01/07/12 to 03/04/13 01/07/14 to 11/03/16 737,420 – (692,930) (8,600) 35,890 FY14 01/07/13 to 20/06/14 01/07/14 to 02/10/18 286,243 – (101,843) (17,550) 166,850 FY15 01/07/14 to 01/06/15 02/09/14 to 07/04/18 – 185,050 (4,130) (1,430) 179,490 8,126,381 2,722,564 (2,206,318) (2,455,329) 6,187,298 The weighted average share price during the financial period ended 28 June 2015 was $31.96.
The contractual exercise period of the instruments set out in the previous tables is used as an input into the model to determine the fair value of options and performance rights. Other inputs in relation to these instruments are: FAIR VALUE
GRANT DATE 1 EFFECTIVE DATE
SHARE PRICE AT GRANT
DATE EXPECTED
VOLATILITY 2 DIVIDEND
YIELD
RISK FREE INTEREST
RATE WEIGHTED
AVERAGE FV EPS TSR NPAT/EBIT
12/12/11 01/07/11 $25.95 – 4.20% – $22.39 – – $22.39 12/12/11 01/07/11 $25.95 17% 4.20% 3.40% $16.19 $20.05 $12.33 – 07/12/12 01/07/12 $29.64 16% 4.50% 2.70% $18.32 $22.60 $14.04 – 07/12/12 01/07/12 $29.64 – 4.50% – $25.45 – – $25.45 22/03/13 01/07/12 $34.03 16% 4.50% 3.10% $21.20 $26.41 $15.99 – 22/03/13 01/07/12 $34.03 – 4.50% – $29.74 – – $29.74 13/12/13 01/07/13 $32.65 16% 4.10% 3.40% $19.51 $25.56 $13.46 – 13/12/13 01/07/13 $32.65 – 4.10% – $28.46 – – $28.46 29/04/14 01/07/13 $38.04 16% 4.10% 3.20% $24.74 $30.39 $19.08 – 29/04/14 01/07/13 $38.04 – 4.10% – $33.84 – – $33.84 17/10/14 01/07/14 $34.76 16% 4.10% 2.50% $21.51 $29.78 $13.24 – 17/10/14 01/07/14 $34.76 – 4.10% – $29.78 – – $29.78 27/11/14 01/07/14 $31.75 16% 4.10% 2.50% $18.66 $27.37 $9.94 – 19/06/15 01/07/14 $27.30 20% 5.10% 1.90% $12.50 $23.53 $1.46 – 20/11/15 01/07/15 $23.71 25% 5.10% 2.10% $12.89 $19.66 $9.51 – 20/11/15 01/07/15 $23.71 – 5.10% – $19.66 – – $19.66 1 Grant date represents the offer acceptance date. 2 The expected volatility is based on the historical implied volatility calculated based on the weighted average remaining life of the performance rights adjusted
for any expected changes to future volatility due to publicly available information.
34. EMPLOYEE BENEFITS CONTINUED
Notes to the Consolidated Financial Statements: Other
34 EMPLOYEE BENEFITS (CONTINUED)
1
2
3
4
5
PERFORM
AN
CEH
IGH
LIGH
TSBU
SINESS
REVIEW
DIRECTO
RS' REPO
RTFIN
AN
CIAL
REPORT
OTH
ER IN
FORM
ATION
WO
OLW
ORTH
S GRO
UP
AN
NU
AL REPO
RT 2016
109F
or p
erso
nal u
se o
nly
Notes to the Consolidated Financial Statements Other
60 | WOOLWORTHS LIMITED | FINANCIAL REPORT 2016
(A) Share-based payments – Woolworths Long-Term Incentive Plan continued
Executive Management Share Plan (EMSP) The EMSP allows executive management, including any Executive Director, to forgo some of their future pre-tax remuneration to acquire shares in the Company on-market at prevailing market prices on the Australian Securities Exchange (ASX).
During the period, 1,496 shares (2015: 1,735) were purchased under the EMSP. No additional expense is recognised in relation to these shares as they are acquired out of salary sacrificed remuneration.
Employee Share Purchase Plan (SPP) The SPP was launched in June 2008 and provides permanent full-time and part-time employees who are Australian tax residents and are aged 18 years or over, with the opportunity to purchase shares from pre-tax income via salary sacrifice. Woolworths Limited pays the associated brokerage costs. During the year, 612,919 (2015: 520,066) shares were purchased on behalf of participating employees.
The total shares purchased during the year was 614,415 (2015: 521,801) at an average price per share of $22.85 (2015: $30.28).
Significant Accounting Policies
Share-based payments The grant date fair value of equity-settled share-based payments is recognised as an expense proportionally over the vesting period, with a corresponding increase in equity.
The fair value of instruments with market-based performance conditions (e.g. TSR) is calculated at the date of grant using the Monte Carlo simulation model. The probability of achieving market-based performance conditions is incorporated into the determination of the fair value per instrument.
The fair value of instruments with non-market-based performance conditions (e.g. EPS and NPAT/EBIT) and service conditions and retention rights is calculated using the Black-Scholes option pricing model.
The amount recognised as an expense over the vesting period is adjusted to reflect the actual number of instruments that vest except where forfeiture is due to failure to achieve market-based performance conditions.
(B) Retirement plans
Defined benefit plans The Company sponsors a defined benefit plan, the Woolworths Group Superannuation Plan (WGSP or the Plan) that provides superannuation benefits for employees upon retirement. The defined benefit plan is closed to new members. The assets of the WGSP are held in a sub-plan within AMP SignatureSuper that is legally separated from the Group. The WGSP invests entirely in pooled unit trust products where prices are quoted on a daily basis.
The WGSP consists of members with defined benefit entitlements and defined contribution (accumulation) benefits. The Plan also pays allocated pensions to a small number of pensioners. The following disclosures relate only to the Company’s obligation in respect of defined benefit entitlements.
The Group contributes to the WGSP at rates as set out in the Trust Deed and Rules and the Participation Deed between the Company and AMP Superannuation Limited. Members contribute to the WGSP at rates dependent upon their membership category. The Plan provides lump sum defined benefits that are defined by salary and period of membership.
An actuarial valuation was carried out in the current year by Mr Nicholas Wilkinson, FIAA, Willis Towers Watson (2015: Mr John Burnett, FIAA, Towers Watson). The principal actuarial assumptions used for the purpose of the valuation are as follows:
2016
% 2015
%
Discount rate 3.30 4.40 Expected rate of salary increase 3.00 3.00 Rate of price inflation 2.50 2.50 The average duration of the defined benefit obligation at the end of the reporting period is 7.7 years (2015: 7.7 years) which relates wholly to active participants.
34. EMPLOYEE BENEFITS CONTINUED
Notes to the Consolidated Financial Statements: Other
34 EMPLOYEE BENEFITS (CONTINUED)
110F
or p
erso
nal u
se o
nly
Notes to the Consolidated Financial Statements Other
61 | WOOLWORTHS LIMITED | FINANCIAL REPORT 2016
(B) Retirement plans continued Total defined benefit costs are as follows:
2016
$M 2015
$M
Current service cost 11.5 13.6 Net interest/(income) on net defined benefit liability 2.6 2.3 Remeasurement effects recognised in other comprehensive income 5.6 (11.3) Total defined benefit cost 19.7 4.6 The amount included in the Consolidated Statement of Financial Position in respect of the defined benefit plan is as follows:
2016
$M 2015
$M
Defined benefit obligation (467.2) (508.8) Fair value of plan assets 405.6 440.9 Closing net liability for defined benefit obligations (61.6) (67.9) Movements in the present value of the net liability for defined benefit obligations are as follows:
2016
$M 2015
$M
Movement: Net liability for defined benefit obligations at start of period (67.9) (73.9) Current service cost (11.5) (13.6) Interest cost (21.2) (18.5) Interest income 1 18.6 16.2 Return on plan assets greater than discount rate 1 (8.8) 31.5 Actuarial loss due to experience 8.5 (19.7) Actuarial loss due to assumption changes (5.3) (0.5) Employer contributions 26.0 10.6 Net liability for defined benefit obligations at end of period (61.6) (67.9) 1 The actual return on plan assets was $9.8 million (2015: $47.7 million).
Significant actuarial assumptions for the determination of the defined benefit obligation are the discount rate and expected rate of salary increase. The sensitivity analysis below has been determined based on reasonably possible changes of the respective assumptions occurring at the end of the reporting period, while holding all other assumptions constant. • If the discount rate is 1% higher (lower), the defined benefit obligation would decrease by $4.9 million (increase by $8.0 million); and • If the rate of salary growth increases (decreases) by 1%, the defined benefit obligation would increase by $6.6 million
(decrease by $4.3 million).
Company contributions are agreed between the Plan Trustees and Company, following advice from the Plan Actuary at least every year. The expected Group and employee contributions to the WGSP in respect of the regular accrual of benefits for members with defined benefit entitlements for the 2017 financial year are $8.7 million and $3.7 million respectively.
Defined contribution plans The majority of employees in Australia and New Zealand are part of a defined contribution superannuation scheme and receive fixed contributions from the Group in accordance with the rules of the WGSP and/or any statutory obligations.
34. EMPLOYEE BENEFITS CONTINUED
Notes to the Consolidated Financial Statements: Other
34 EMPLOYEE BENEFITS (CONTINUED)
1
2
3
4
5
PERFORM
AN
CEH
IGH
LIGH
TSBU
SINESS
REVIEW
DIRECTO
RS' REPO
RTFIN
AN
CIAL
REPORT
OTH
ER IN
FORM
ATION
WO
OLW
ORTH
S GRO
UP
AN
NU
AL REPO
RT 2016
111F
or p
erso
nal u
se o
nly
Notes to the Consolidated Financial Statements Other
62 | WOOLWORTHS LIMITED | FINANCIAL REPORT 2016
(B) Retirement plans continued
Significant Accounting Policies
Defined benefit plan The net defined benefit obligation recognised in the Consolidated Statement of Financial Position represents the deficit or surplus in the Group’s defined benefit plans which is calculated by estimating the amount of future benefit that employees have earned in the current and prior periods, discounting that amount and deducting the fair value of the plan assets.
The calculation of the defined benefit obligation is performed at the end of each annual reporting period by a qualified actuary using the projected unit credit method.
Remeasurements of the net defined benefit liability, which comprise actuarial gains and losses and the return on plan assets (excluding interest) are recognised in the period in which they occur, directly in other comprehensive income and will not be reclassified to profit or loss.
The Group determines the net interest expense (income) on the net defined benefit liability for the period by applying the discount rate at the beginning of the period to the net defined benefit liability, taking into account any changes during the period as a result of contributions and benefit payments. Net interest expense (income), service cost and other expenses related to defined benefit plans are recognised in the Consolidated Statement of Profit or Loss.
Defined contribution plans Payments to defined contribution retirement benefit plans are recognised as an expense when employees have rendered service entitling them to the contributions.
34. EMPLOYEE BENEFITS CONTINUED
Notes to the Consolidated Financial Statements: Other
34 EMPLOYEE BENEFITS (CONTINUED)
112F
or p
erso
nal u
se o
nly
Notes to the Consolidated Financial Statements Other
63 | WOOLWORTHS LIMITED | FINANCIAL REPORT 2016
35. KEY MANAGEMENT PERSONNEL
The total remuneration for key management personnel of the Group is as follows:
2016
$ 2015
$
Short-term employee benefits 8,735,255 8,135,863 Post employment benefits 790,785 752,359 Other long-term benefits 271,420 135,456 Share-based payments 977,793 358,786 10,775,253 9,382,464
Equity instrument disclosures relating to key management personnel Details of equity instruments provided as compensation to key management personnel and shares issued on exercise of these instruments, together with the terms and conditions of the instruments, are disclosed in Section 5.1 of the Remuneration Report.
36. AUDITORS’ REMUNERATION
The auditors’ remuneration for the Group is as follows:
2016
$’000 2015
$’000
Auditors of the parent entity – Deloitte Touche Tohmatsu Australia Audit or review of the financial report 2,748 2,518 Regulatory and compliance related services 239 13 Other non-audit related services 1 173 687 Tax compliance services 113 85 3,273 3,303 Other auditors 2 Audit or review of the financial report 218 172 Other non-audit related services 1 44 525 Tax compliance services 160 101 422 798 Total auditors’ remuneration 3,695 4,101 1 Other non-audit related services comprise assistance on various accounting matters, assurance services in relation to debt raisings, regulatory reviews, financial
due diligence and other sundry services. 2 Other auditors are international associates of Deloitte Touche Tohmatsu Australia.
Notes to the Consolidated Financial Statements: Other
35 KEY MANAGEMENT PERSONNEL
36 AUDITORS’ REMUNERATION
1
2
3
4
5
PERFORM
AN
CEH
IGH
LIGH
TSBU
SINESS
REVIEW
DIRECTO
RS' REPO
RTFIN
AN
CIAL
REPORT
OTH
ER IN
FORM
ATION
WO
OLW
ORTH
S GRO
UP
AN
NU
AL REPO
RT 2016
113F
or p
erso
nal u
se o
nly
Notes to the Consolidated Financial Statements Other
64 | WOOLWORTHS LIMITED | FINANCIAL REPORT 2016
37. SUBSEQUENT EVENTS
Home Improvement On 24 August 2016, the Company and/or entities in the Hydrox Group entered into a series of arrangements related to the Company’s exit from the Home Improvement business: • The sale by Hydrox Brands Pty Ltd of 100% of the shares in Danks Holdings Pty Limited, the holding company for the Home Timber
and Hardware Group (HTH) to Metcash for a headline purchase price of $165 million (subject to adjustment in accordance with the sale agreement) with a requirement for the Company to also take assignment of three residual leases of HTH;
• The appointment by Masters Home Improvement Australia Pty Limited (Masters) of GA Australia Pty Ltd (GA Australia) as exclusive agent to manage the sell-down of Masters inventory. Under the terms of the appointment, GA Australia has provided a guarantee for the recovery of a guaranteed percentage of the cost value of Masters inventory, which is subject to certain adjustments and is estimated to deliver gross proceeds of approximately $500 million; and
• The Company has granted an exclusive call option over its 66.7% shareholding in Hydrox Holdings Pty Ltd (Hydrox) to Home Investment Consortium Company Pty Ltd as trustee for the Home Investment Consortium Trust (Home Consortium), whereby Home Consortium has proposed to purchase Masters properties through the acquisition of 100% of the shares in Hydrox, subject to Lowe's consent. The transaction would include 40 Masters freehold trading sites, 21 Masters freehold development sites and 21 Masters leasehold sites with Woolworths proposing to acquire three Masters freehold sites and take assignment of 12 Masters leases.
The Company also announced that Masters will cease trading at all stores on or before 11 December 2016.
In addition, on 24 August 2016, the Company terminated the Joint Venture Agreement with Lowe's Companies, Inc. and WDR Delaware Corporation (together Lowe’s), and the associated option contracts arising under the Joint Venture Agreement. This termination right arose as a result of a breach by Lowe’s of obligations under the option valuation mechanism in the Joint Venture Agreement. Lowe’s has disputed the validity of the Company’s termination in proceedings commenced in the Federal Court of Australia. Lowe’s and the Company are also party to a confidential private arbitration in relation to a range of matters arising from their joint venture including the option valuation mechanism.
As of the date of this Financial Report, Lowe's owns 33.3% and Woolworths owns 66.7% of Hydrox. Consistent with the basis of the Company's $nil valuation of the terminated Lowe's put option (as described in Note 16), no allowance or provision has been made in this Financial Report for shareholder payments that may occur following completion of the above transactions and exit from the Home Improvement business.
The carrying value of HTH's assets and liabilities, and the Masters inventory, in the Financial Report materially reflect the transacted HTH sale value and estimated valuation outcomes from the sell down of Masters inventory by GA Australia.
The financial impact of the transaction with Home Consortium has not been reflected in this Financial Report on the basis that Home Consortium has an unexercised call option to purchase the Company’s shares in Hydrox, and the transaction outcomes at the date of this Financial Report remain unconcluded.
Woolworths Notes Subsequent to balance date, Woolworths has announced its intention to replace Woolworths Notes II (the Notes). The Notes may be redeemed on or after 24 November 2016 when the five year non-call period for the Notes ends. The Notes have been classified in the Consolidated Statement of Financial Position as a non-current liability on the basis of their maturity date of 2036 (refer to Note 23).
At the date of this report, other than the matters noted above, there has not been any matter or circumstance occurring subsequent to the end of the financial year that has significantly affected, or may significantly affect, the operations of the Group, the results of those operations, or the state of affairs of the Group in future financial years.
Notes to the Consolidated Financial Statements: Other
37 SUBSEQUENT EVENTS
114F
or p
erso
nal u
se o
nly
Directors’ Declaration
65 | WOOLWORTHS LIMITED | FINANCIAL REPORT 2016
The Directors declare that: (a) in the Directors’ opinion, there are reasonable grounds to believe that the Company will be able to pay its debts as and when
they become due and payable; (b) in the Directors’ opinion, the attached financial statements are in compliance with International Financial Reporting
Standards, as stated in Note 1 to the financial statements; (c) in the Directors’ opinion, the attached financial statements and notes thereto are in accordance with the Corporations Act
2001 (Cth), including compliance with accounting standards and giving a true and fair view of the financial position and performance of the Group; and
(d) the Directors have been given the declarations required by s.295A of the Corporations Act 2001 (Cth).
At the date of this declaration, the Company is within the class of companies affected by ASIC Class Order 98/1418. The nature of the deed of cross guarantee is such that each company which is party to the deed guarantees to each creditor payment in full of any debt in accordance with the deed of cross guarantee.
In the Directors’ opinion, there are reasonable grounds to believe that the Company and the companies to which the ASIC Class Order applies, as detailed in Note 30 to the financial statements will, as a Group, be able to meet any obligations or liabilities to which they are, or may become, subject by virtue of the deed of cross guarantee.
Signed in accordance with a resolution of the Directors made pursuant to s.295(5) of the Corporations Act 2001 (Cth). On behalf of the Directors.
Gordon Cairns Brad Banducci Chairman Managing Director and Chief Executive Officer
9 September 2016
Directors’ Declaration
1
2
3
4
5
PERFORM
AN
CEH
IGH
LIGH
TSBU
SINESS
REVIEW
DIRECTO
RS' REPO
RTFIN
AN
CIAL
REPORT
OTH
ER IN
FORM
ATION
WO
OLW
ORTH
S GRO
UP
AN
NU
AL REPO
RT 2016
115F
or p
erso
nal u
se o
nly
Independent Auditor’s Report
66 | WOOLWORTHS LIMITED | FINANCIAL REPORT 2016
Independent Auditor’s Report to the Members of Woolworths Limited
Report on the Financial Report We have audited the accompanying financial report of Woolworths Limited (the ‘Company’), which comprises the consolidated statement of Financial Position as at 26 June 2016, the Consolidated Statement of Profit or Loss, the Consolidated Statement of Other Comprehensive Income, the Consolidated Statement of Cash Flows and the Consolidated Statement of Changes in Equity for the financial year ended on that date, notes comprising a summary of significant accounting policies and other explanatory information, and the Directors’ declaration of the consolidated entity comprising the company and the entities it controlled at the year’s end or from time to time during the financial year as set out on pages 56 to 115.
Directors’ Responsibility for the Financial Report The Directors of the company are responsible for the preparation of the financial report that gives a true and fair view in accordance with Australian Accounting Standards and the Corporations Act 2001 and for such internal control as the Directors determine is necessary to enable the preparation of the financial report that gives a true and fair view and is free from material misstatement, whether due to fraud or error. In the basis of preparation, the Directors also state, in accordance with Accounting Standard AASB 101 Presentation of Financial Statements, that the consolidated financial statements comply with International Financial Reporting Standards.
Auditor’s Responsibility Our responsibility is to express an opinion on the financial report based on our audit. We conducted our audit in accordance with Australian Auditing Standards. Those standards require that we comply with relevant ethical requirements relating to audit engagements and plan and perform the audit to obtain reasonable assurance whether the financial report is free from material misstatement.
An audit involves performing procedures to obtain audit evidence about the amounts and disclosures in the financial report. The procedures selected depend on the auditor’s judgement, including the assessment of the risks of material misstatement of the financial report, whether due to fraud or error. In making those risk assessments, the auditor considers internal control, relevant to the company’s preparation of the financial report that gives a true and fair view, in order to design audit procedures that are appropriate in the circumstances, but not for the purpose of expressing an opinion on the effectiveness of the company’s internal control. An audit also includes evaluating the appropriateness of accounting policies used and the reasonableness of accounting estimates made by the Directors, as well as evaluating the overall presentation of the financial report.
We believe that the audit evidence we have obtained is sufficient and appropriate to provide a basis for our audit opinion.
Auditor’s Independence Declaration In conducting our audit, we have complied with the independence requirements of the Corporations Act 2001. We confirm that the independence declaration required by the Corporations Act 2001, which has been given to the Directors of Woolworths Limited, would be in the same terms if given to the Directors as at the time of this auditor’s report.
Opinion In our opinion: (a) the financial report of Woolworths Limited is in accordance with the Corporations Act 2001, including:
(i) giving a true and fair view of the consolidated entity’s financial position as at 26 June 2016 and of its performance for the financial year ended on that date; and
(ii) complying with Australian Accounting Standards and the Corporations Regulations 2001; and (b) the consolidated financial statements also comply with International Financial Reporting Standards as disclosed in the basis
of preparation.
Deloitte Touche Tohmatsu A.C.N. 74 490 121 060Grosvenor Place 225 George Street Sydney NSW 2000 PO Box N250 Grosvenor Place Sydney NSW 1217 AustraliaDX 10307SSE Tel: +61 (0) 2 9322 7000 Fax: +61 (0) 2 9322 7001www.deloitte.com.au
Liability limited by a scheme approved under Professional Standards Legislation.Member of Deloitte Touche Tohmatsu Limited
Independent Auditor’s Report
116F
or p
erso
nal u
se o
nly
Independent Auditor’s Report
67 | WOOLWORTHS LIMITED | FINANCIAL REPORT 2016
Report on the Remuneration Report We have audited the Remuneration Report included in pages 33 to 53 of the Directors’ report for the financial year ended 26 June 2016. The Directors of the company are responsible for the preparation and presentation of the Remuneration Report in accordance with section 300A of the Corporations Act 2001. Our responsibility is to express an opinion on the Remuneration Report, based on our audit conducted in accordance with Australian Auditing Standards.
Opinion In our opinion the Remuneration Report of Woolworths Limited for the financial year ended 26 June 2016, complies with section 300A of the Corporations Act 2001.
DELOITTE TOUCHE TOHMATSU
G Couttas Partner Chartered Accountants
Sydney, 9 September 2016
Independent Auditor’s Report
117
1
2
3
4
5
PERFORM
AN
CEH
IGH
LIGH
TSBU
SINESS
REVIEW
DIRECTO
RS' REPO
RTFIN
AN
CIAL
REPORT
OTH
ER IN
FORM
ATION
WO
OLW
ORTH
S GRO
UP
AN
NU
AL REPO
RT 2016
117F
or p
erso
nal u
se o
nly
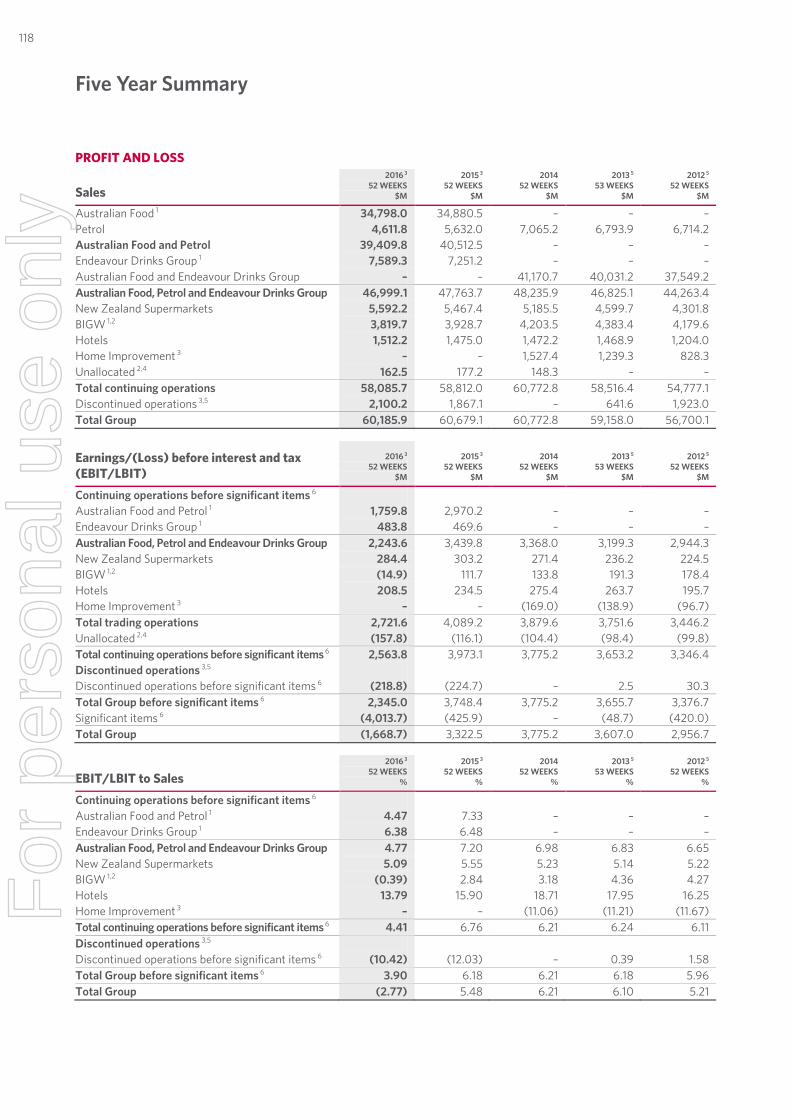
Five Year Summary
68 | WOOLWORTHS LIMITED | FINANCIAL REPORT 2016
PROFIT AND LOSS
Sales 2016 3
52 WEEKS $M
2015 3 52 WEEKS
$M
2014 52 WEEKS
$M
2013 5 53 WEEKS
$M
2012 5 52 WEEKS
$M
Australian Food 1 34,798.0 34,880.5 – – – Petrol 4,611.8 5,632.0 7,065.2 6,793.9 6,714.2 Australian Food and Petrol 39,409.8 40,512.5 – – – Endeavour Drinks Group 1 7,589.3 7,251.2 – – – Australian Food and Endeavour Drinks Group – – 41,170.7 40,031.2 37,549.2 Australian Food, Petrol and Endeavour Drinks Group 46,999.1 47,763.7 48,235.9 46,825.1 44,263.4 New Zealand Supermarkets 5,592.2 5,467.4 5,185.5 4,599.7 4,301.8 BIGW 1,2 3,819.7 3,928.7 4,203.5 4,383.4 4,179.6 Hotels 1,512.2 1,475.0 1,472.2 1,468.9 1,204.0 Home Improvement 3 – – 1,527.4 1,239.3 828.3 Unallocated 2,4 162.5 177.2 148.3 – – Total continuing operations 58,085.7 58,812.0 60,772.8 58,516.4 54,777.1 Discontinued operations 3,5 2,100.2 1,867.1 – 641.6 1,923.0 Total Group 60,185.9 60,679.1 60,772.8 59,158.0 56,700.1
Earnings/(Loss) before interest and tax (EBIT/LBIT)
2016 3 52 WEEKS
$M
2015 3 52 WEEKS
$M
2014 52 WEEKS
$M
2013 5 53 WEEKS
$M
2012 5 52 WEEKS
$M
Continuing operations before significant items 6 Australian Food and Petrol 1 1,759.8 2,970.2 – – – Endeavour Drinks Group 1 483.8 469.6 – – – Australian Food, Petrol and Endeavour Drinks Group 2,243.6 3,439.8 3,368.0 3,199.3 2,944.3 New Zealand Supermarkets 284.4 303.2 271.4 236.2 224.5 BIGW 1,2 (14.9) 111.7 133.8 191.3 178.4 Hotels 208.5 234.5 275.4 263.7 195.7 Home Improvement 3 – – (169.0) (138.9) (96.7) Total trading operations 2,721.6 4,089.2 3,879.6 3,751.6 3,446.2 Unallocated 2,4 (157.8) (116.1) (104.4) (98.4) (99.8) Total continuing operations before significant items 6 2,563.8 3,973.1 3,775.2 3,653.2 3,346.4 Discontinued operations 3,5 Discontinued operations before significant items 6 (218.8) (224.7) – 2.5 30.3 Total Group before significant items 6 2,345.0 3,748.4 3,775.2 3,655.7 3,376.7 Significant items 6 (4,013.7) (425.9) – (48.7) (420.0) Total Group (1,668.7) 3,322.5 3,775.2 3,607.0 2,956.7
EBIT/LBIT to Sales 2016 3
52 WEEKS %
2015 3 52 WEEKS
%
2014 52 WEEKS
%
2013 5 53 WEEKS
%
2012 5 52 WEEKS
%
Continuing operations before significant items 6 Australian Food and Petrol 1 4.47 7.33 – – – Endeavour Drinks Group 1 6.38 6.48 – – – Australian Food, Petrol and Endeavour Drinks Group 4.77 7.20 6.98 6.83 6.65 New Zealand Supermarkets 5.09 5.55 5.23 5.14 5.22 BIGW 1,2 (0.39) 2.84 3.18 4.36 4.27 Hotels 13.79 15.90 18.71 17.95 16.25 Home Improvement 3 – – (11.06) (11.21) (11.67) Total continuing operations before significant items 6 4.41 6.76 6.21 6.24 6.11 Discontinued operations 3,5 Discontinued operations before significant items 6 (10.42) (12.03) – 0.39 1.58 Total Group before significant items 6 3.90 6.18 6.21 6.18 5.96 Total Group (2.77) 5.48 6.21 6.10 5.21
Five Year Summary
118F
or p
erso
nal u
se o
nly
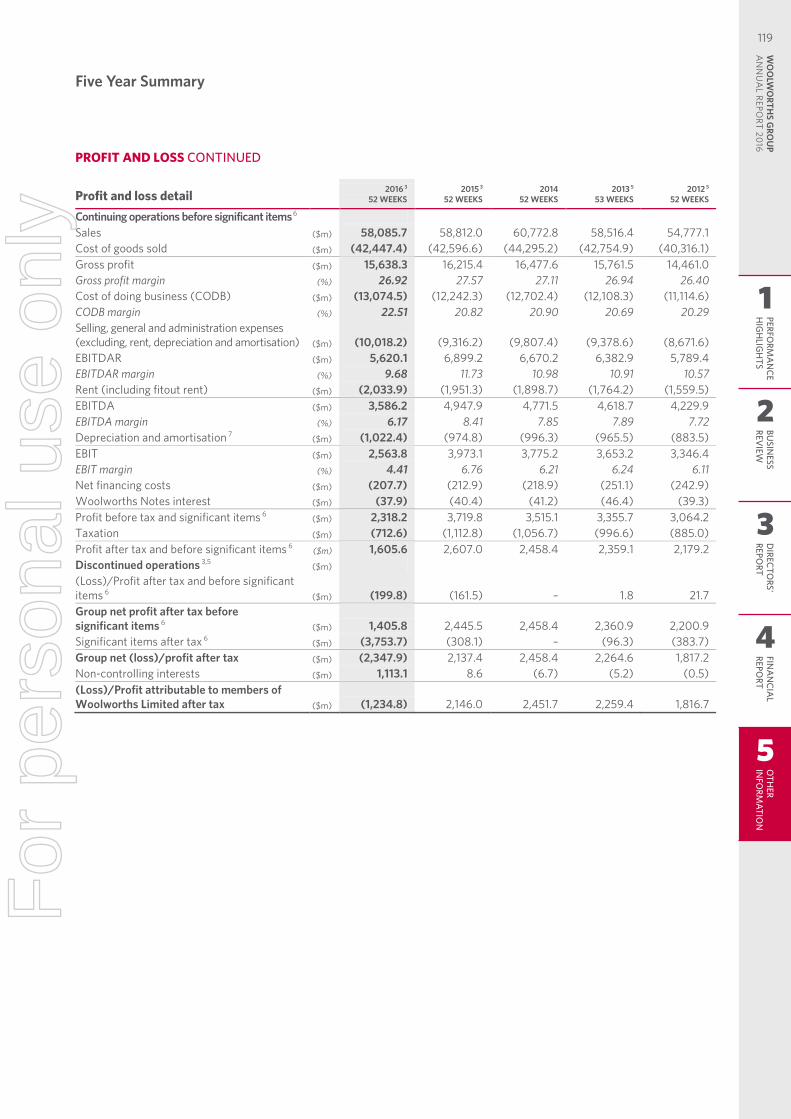
Five Year Summary
69 | WOOLWORTHS LIMITED | FINANCIAL REPORT 2016
Profit and loss detail 2016 3
52 WEEKS 2015 3
52 WEEKS 2014
52 WEEKS 2013 5
53 WEEKS 2012 5
52 WEEKS
Continuing operations before significant items 6 Sales ($m) 58,085.7 58,812.0 60,772.8 58,516.4 54,777.1 Cost of goods sold ($m) (42,447.4) (42,596.6) (44,295.2) (42,754.9) (40,316.1) Gross profit ($m) 15,638.3 16,215.4 16,477.6 15,761.5 14,461.0 Gross profit margin (%) 26.92 27.57 27.11 26.94 26.40 Cost of doing business (CODB) ($m) (13,074.5) (12,242.3) (12,702.4) (12,108.3) (11,114.6) CODB margin (%) 22.51 20.82 20.90 20.69 20.29 Selling, general and administration expenses (excluding, rent, depreciation and amortisation) ($m) (10,018.2) (9,316.2) (9,807.4) (9,378.6) (8,671.6) EBITDAR ($m) 5,620.1 6,899.2 6,670.2 6,382.9 5,789.4 EBITDAR margin (%) 9.68 11.73 10.98 10.91 10.57 Rent (including fitout rent) ($m) (2,033.9) (1,951.3) (1,898.7) (1,764.2) (1,559.5) EBITDA ($m) 3,586.2 4,947.9 4,771.5 4,618.7 4,229.9 EBITDA margin (%) 6.17 8.41 7.85 7.89 7.72 Depreciation and amortisation 7 ($m) (1,022.4) (974.8) (996.3) (965.5) (883.5) EBIT ($m) 2,563.8 3,973.1 3,775.2 3,653.2 3,346.4 EBIT margin (%) 4.41 6.76 6.21 6.24 6.11 Net financing costs ($m) (207.7) (212.9) (218.9) (251.1) (242.9) Woolworths Notes interest ($m) (37.9) (40.4) (41.2) (46.4) (39.3) Profit before tax and significant items 6 ($m) 2,318.2 3,719.8 3,515.1 3,355.7 3,064.2 Taxation ($m) (712.6) (1,112.8) (1,056.7) (996.6) (885.0) Profit after tax and before significant items 6 ($m) 1,605.6 2,607.0 2,458.4 2,359.1 2,179.2 Discontinued operations 3,5 ($m) (Loss)/Profit after tax and before significant items 6 ($m) (199.8) (161.5) – 1.8 21.7 Group net profit after tax before significant items 6 ($m) 1,405.8 2,445.5 2,458.4 2,360.9 2,200.9 Significant items after tax 6 ($m) (3,753.7) (308.1) – (96.3) (383.7) Group net (loss)/profit after tax ($m) (2,347.9) 2,137.4 2,458.4 2,264.6 1,817.2 Non-controlling interests ($m) 1,113.1 8.6 (6.7) (5.2) (0.5) (Loss)/Profit attributable to members of Woolworths Limited after tax ($m) (1,234.8) 2,146.0 2,451.7 2,259.4 1,816.7
PROFIT AND LOSS CONTINUED
Five Year Summary
119
1
2
3
4
5
PERFORM
AN
CEH
IGH
LIGH
TSBU
SINESS
REVIEW
DIRECTO
RS' REPO
RTFIN
AN
CIAL
REPORT
OTH
ER IN
FORM
ATION
WO
OLW
ORTH
S GRO
UP
AN
NU
AL REPO
RT 2016
119F
or p
erso
nal u
se o
nly
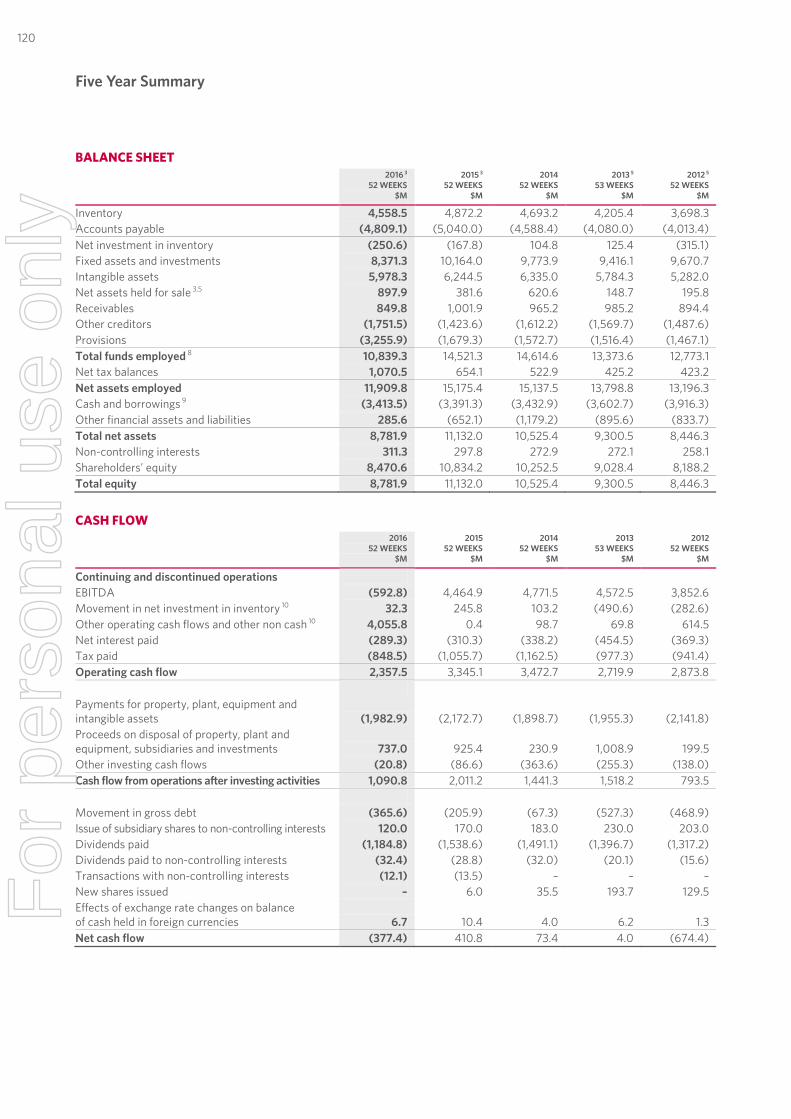
Five Year Summary
70 | WOOLWORTHS LIMITED | FINANCIAL REPORT 2016
BALANCE SHEET
2016 3 52 WEEKS
$M
2015 3 52 WEEKS
$M
2014 52 WEEKS
$M
2013 5 53 WEEKS
$M
2012 5 52 WEEKS
$M
Inventory 4,558.5 4,872.2 4,693.2 4,205.4 3,698.3 Accounts payable (4,809.1) (5,040.0) (4,588.4) (4,080.0) (4,013.4) Net investment in inventory (250.6) (167.8) 104.8 125.4 (315.1) Fixed assets and investments 8,371.3 10,164.0 9,773.9 9,416.1 9,670.7 Intangible assets 5,978.3 6,244.5 6,335.0 5,784.3 5,282.0 Net assets held for sale 3,5 897.9 381.6 620.6 148.7 195.8 Receivables 849.8 1,001.9 965.2 985.2 894.4 Other creditors (1,751.5) (1,423.6) (1,612.2) (1,569.7) (1,487.6) Provisions (3,255.9) (1,679.3) (1,572.7) (1,516.4) (1,467.1) Total funds employed 8 10,839.3 14,521.3 14,614.6 13,373.6 12,773.1 Net tax balances 1,070.5 654.1 522.9 425.2 423.2 Net assets employed 11,909.8 15,175.4 15,137.5 13,798.8 13,196.3 Cash and borrowings 9 (3,413.5) (3,391.3) (3,432.9) (3,602.7) (3,916.3) Other financial assets and liabilities 285.6 (652.1) (1,179.2) (895.6) (833.7) Total net assets 8,781.9 11,132.0 10,525.4 9,300.5 8,446.3 Non-controlling interests 311.3 297.8 272.9 272.1 258.1 Shareholders’ equity 8,470.6 10,834.2 10,252.5 9,028.4 8,188.2 Total equity 8,781.9 11,132.0 10,525.4 9,300.5 8,446.3
CASH FLOW
2016 52 WEEKS
$M
2015 52 WEEKS
$M
2014 52 WEEKS
$M
2013 53 WEEKS
$M
2012 52 WEEKS
$M
Continuing and discontinued operations EBITDA (592.8) 4,464.9 4,771.5 4,572.5 3,852.6 Movement in net investment in inventory 10 32.3 245.8 103.2 (490.6) (282.6) Other operating cash flows and other non cash 10 4,055.8 0.4 98.7 69.8 614.5 Net interest paid (289.3) (310.3) (338.2) (454.5) (369.3) Tax paid (848.5) (1,055.7) (1,162.5) (977.3) (941.4) Operating cash flow 2,357.5 3,345.1 3,472.7 2,719.9 2,873.8 Payments for property, plant, equipment and intangible assets (1,982.9) (2,172.7) (1,898.7) (1,955.3) (2,141.8) Proceeds on disposal of property, plant and equipment, subsidiaries and investments 737.0 925.4 230.9 1,008.9 199.5 Other investing cash flows (20.8) (86.6) (363.6) (255.3) (138.0) Cash flow from operations after investing activities 1,090.8 2,011.2 1,441.3 1,518.2 793.5 Movement in gross debt (365.6) (205.9) (67.3) (527.3) (468.9) Issue of subsidiary shares to non-controlling interests 120.0 170.0 183.0 230.0 203.0 Dividends paid (1,184.8) (1,538.6) (1,491.1) (1,396.7) (1,317.2) Dividends paid to non-controlling interests (32.4) (28.8) (32.0) (20.1) (15.6) Transactions with non-controlling interests (12.1) (13.5) – – – New shares issued – 6.0 35.5 193.7 129.5 Effects of exchange rate changes on balance of cash held in foreign currencies 6.7 10.4 4.0 6.2 1.3 Net cash flow (377.4) 410.8 73.4 4.0 (674.4)
Five Year Summary
120F
or p
erso
nal u
se o
nly
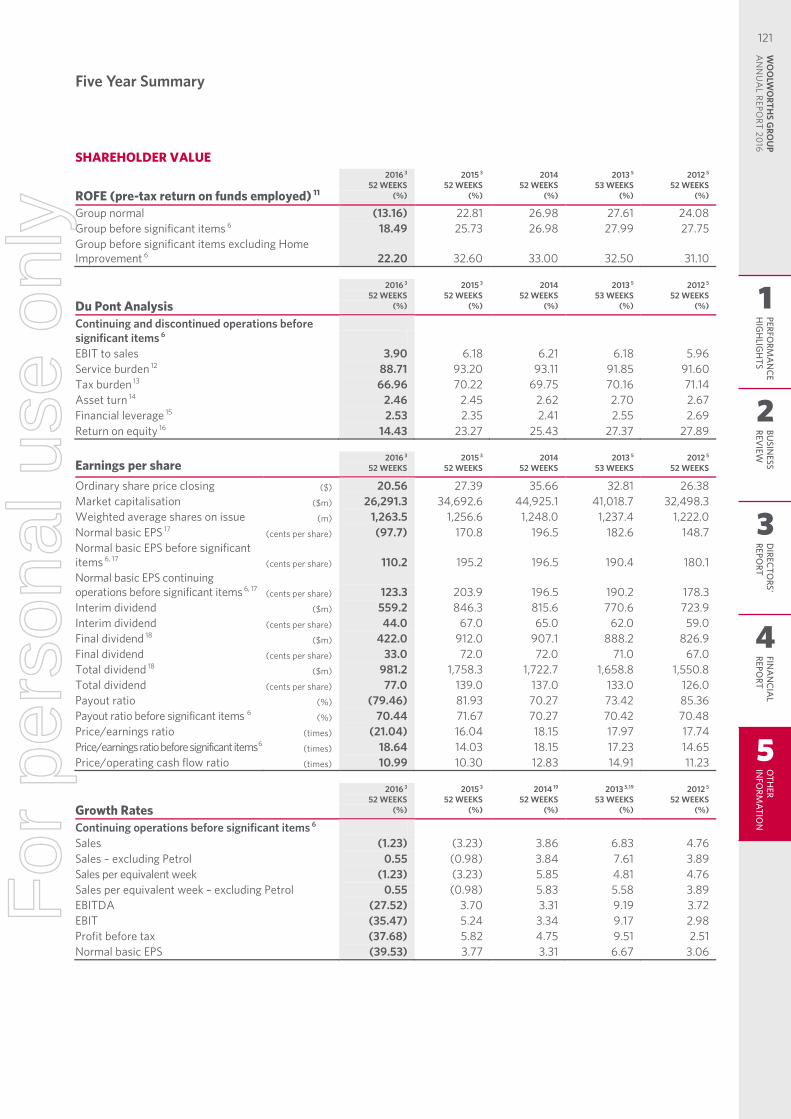
Five Year Summary
71 | WOOLWORTHS LIMITED | FINANCIAL REPORT 2016
SHAREHOLDER VALUE
ROFE (pre-tax return on funds employed) 11
2016 3 52 WEEKS
(%)
2015 3 52 WEEKS
(%)
2014 52 WEEKS
(%)
2013 5 53 WEEKS
(%)
2012 5 52 WEEKS
(%)
Group normal (13.16) 22.81 26.98 27.61 24.08 Group before significant items 6 18.49 25.73 26.98 27.99 27.75 Group before significant items excluding Home Improvement 6 22.20 32.60 33.00 32.50 31.10
Du Pont Analysis 2016 3
52 WEEKS (%)
2015 3 52 WEEKS
(%)
2014 52 WEEKS
(%)
2013 5 53 WEEKS
(%)
2012 5 52 WEEKS
(%)
Continuing and discontinued operations before significant items 6 EBIT to sales 3.90 6.18 6.21 6.18 5.96 Service burden 12 88.71 93.20 93.11 91.85 91.60 Tax burden 13 66.96 70.22 69.75 70.16 71.14 Asset turn 14 2.46 2.45 2.62 2.70 2.67 Financial leverage 15 2.53 2.35 2.41 2.55 2.69 Return on equity 16 14.43 23.27 25.43 27.37 27.89
Earnings per share 2016 3
52 WEEKS 2015 3
52 WEEKS 2014
52 WEEKS 2013 5
53 WEEKS 2012 5
52 WEEKS
Ordinary share price closing ($) 20.56 27.39 35.66 32.81 26.38 Market capitalisation ($m) 26,291.3 34,692.6 44,925.1 41,018.7 32,498.3 Weighted average shares on issue (m) 1,263.5 1,256.6 1,248.0 1,237.4 1,222.0 Normal basic EPS 17 (cents per share) (97.7) 170.8 196.5 182.6 148.7 Normal basic EPS before significant items 6, 17 (cents per share) 110.2 195.2 196.5 190.4 180.1 Normal basic EPS continuing operations before significant items 6, 17 (cents per share) 123.3 203.9 196.5 190.2 178.3 Interim dividend ($m) 559.2 846.3 815.6 770.6 723.9 Interim dividend (cents per share) 44.0 67.0 65.0 62.0 59.0 Final dividend 18 ($m) 422.0 912.0 907.1 888.2 826.9 Final dividend (cents per share) 33.0 72.0 72.0 71.0 67.0 Total dividend 18 ($m) 981.2 1,758.3 1,722.7 1,658.8 1,550.8 Total dividend (cents per share) 77.0 139.0 137.0 133.0 126.0 Payout ratio (%) (79.46) 81.93 70.27 73.42 85.36 Payout ratio before significant items 6 (%) 70.44 71.67 70.27 70.42 70.48 Price/earnings ratio (times) (21.04) 16.04 18.15 17.97 17.74 Price/earnings ratio before significant items 6 (times) 18.64 14.03 18.15 17.23 14.65 Price/operating cash flow ratio (times) 10.99 10.30 12.83 14.91 11.23
Growth Rates 2016 3
52 WEEKS (%)
2015 3 52 WEEKS
(%)
2014 19 52 WEEKS
(%)
2013 5,19 53 WEEKS
(%)
2012 5 52 WEEKS
(%)
Continuing operations before significant items 6 Sales (1.23) (3.23) 3.86 6.83 4.76 Sales – excluding Petrol 0.55 (0.98) 3.84 7.61 3.89 Sales per equivalent week (1.23) (3.23) 5.85 4.81 4.76 Sales per equivalent week – excluding Petrol 0.55 (0.98) 5.83 5.58 3.89 EBITDA (27.52) 3.70 3.31 9.19 3.72 EBIT (35.47) 5.24 3.34 9.17 2.98 Profit before tax (37.68) 5.82 4.75 9.51 2.51 Normal basic EPS (39.53) 3.77 3.31 6.67 3.06
Five Year Summary
121
1
2
3
4
5
PERFORM
AN
CEH
IGH
LIGH
TSBU
SINESS
REVIEW
DIRECTO
RS' REPO
RTFIN
AN
CIAL
REPORT
OTH
ER IN
FORM
ATION
WO
OLW
ORTH
S GRO
UP
AN
NU
AL REPO
RT 2016
121F
or p
erso
nal u
se o
nly
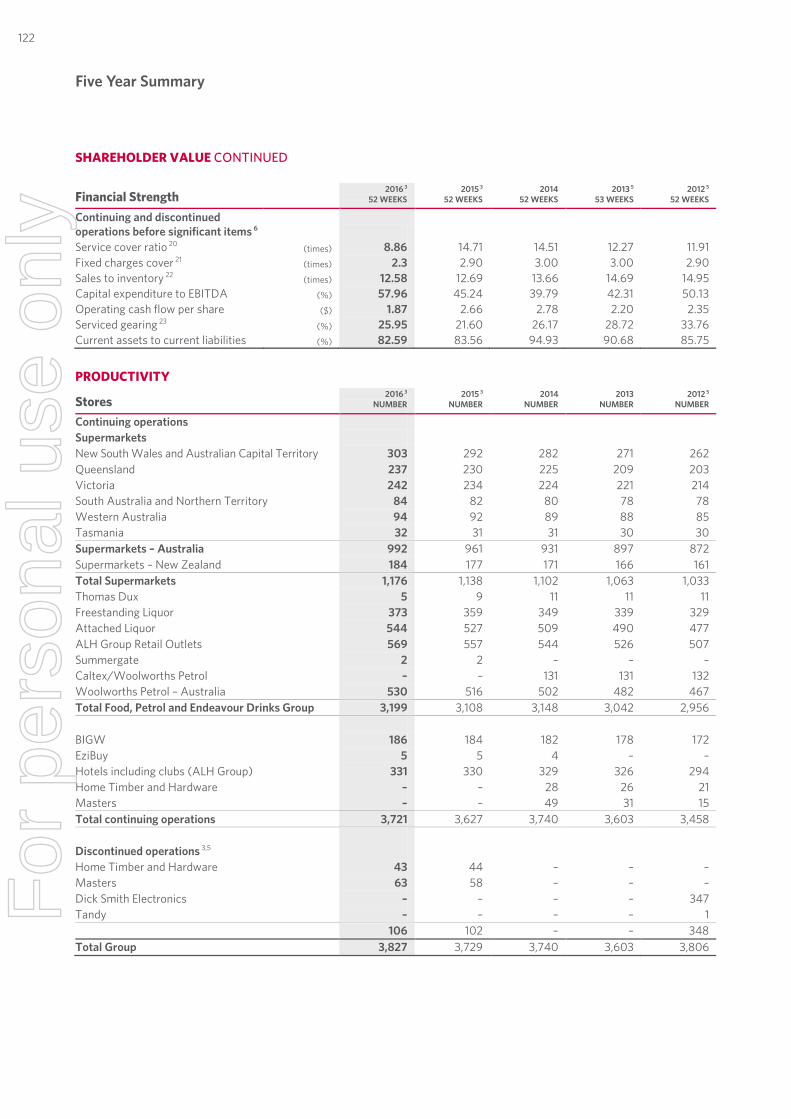
Five Year Summary
72 | WOOLWORTHS LIMITED | FINANCIAL REPORT 2016
Financial Strength 2016 3
52 WEEKS 2015 3
52 WEEKS 2014
52 WEEKS 2013 5
53 WEEKS 2012 5
52 WEEKS
Continuing and discontinued operations before significant items 6 Service cover ratio 20 (times) 8.86 14.71 14.51 12.27 11.91 Fixed charges cover 21 (times) 2.3 2.90 3.00 3.00 2.90 Sales to inventory 22 (times) 12.58 12.69 13.66 14.69 14.95 Capital expenditure to EBITDA (%) 57.96 45.24 39.79 42.31 50.13 Operating cash flow per share ($) 1.87 2.66 2.78 2.20 2.35 Serviced gearing 23 (%) 25.95 21.60 26.17 28.72 33.76 Current assets to current liabilities (%) 82.59 83.56 94.93 90.68 85.75
PRODUCTIVITY
Stores 2016 3
NUMBER 2015 3
NUMBER 2014
NUMBER 2013
NUMBER 2012 5
NUMBER
Continuing operations Supermarkets New South Wales and Australian Capital Territory 303 292 282 271 262 Queensland 237 230 225 209 203 Victoria 242 234 224 221 214 South Australia and Northern Territory 84 82 80 78 78 Western Australia 94 92 89 88 85 Tasmania 32 31 31 30 30 Supermarkets – Australia 992 961 931 897 872 Supermarkets – New Zealand 184 177 171 166 161 Total Supermarkets 1,176 1,138 1,102 1,063 1,033 Thomas Dux 5 9 11 11 11 Freestanding Liquor 373 359 349 339 329 Attached Liquor 544 527 509 490 477 ALH Group Retail Outlets 569 557 544 526 507 Summergate 2 2 – – – Caltex/Woolworths Petrol – – 131 131 132 Woolworths Petrol – Australia 530 516 502 482 467 Total Food, Petrol and Endeavour Drinks Group 3,199 3,108 3,148 3,042 2,956 BIGW 186 184 182 178 172 EziBuy 5 5 4 – – Hotels including clubs (ALH Group) 331 330 329 326 294 Home Timber and Hardware – – 28 26 21 Masters – – 49 31 15 Total continuing operations 3,721 3,627 3,740 3,603 3,458 Discontinued operations 3,5 Home Timber and Hardware 43 44 – – – Masters 63 58 – – – Dick Smith Electronics – – – – 347 Tandy – – – – 1 106 102 – – 348 Total Group 3,827 3,729 3,740 3,603 3,806
SHAREHOLDER VALUE CONTINUED
Five Year Summary
122F
or p
erso
nal u
se o
nly
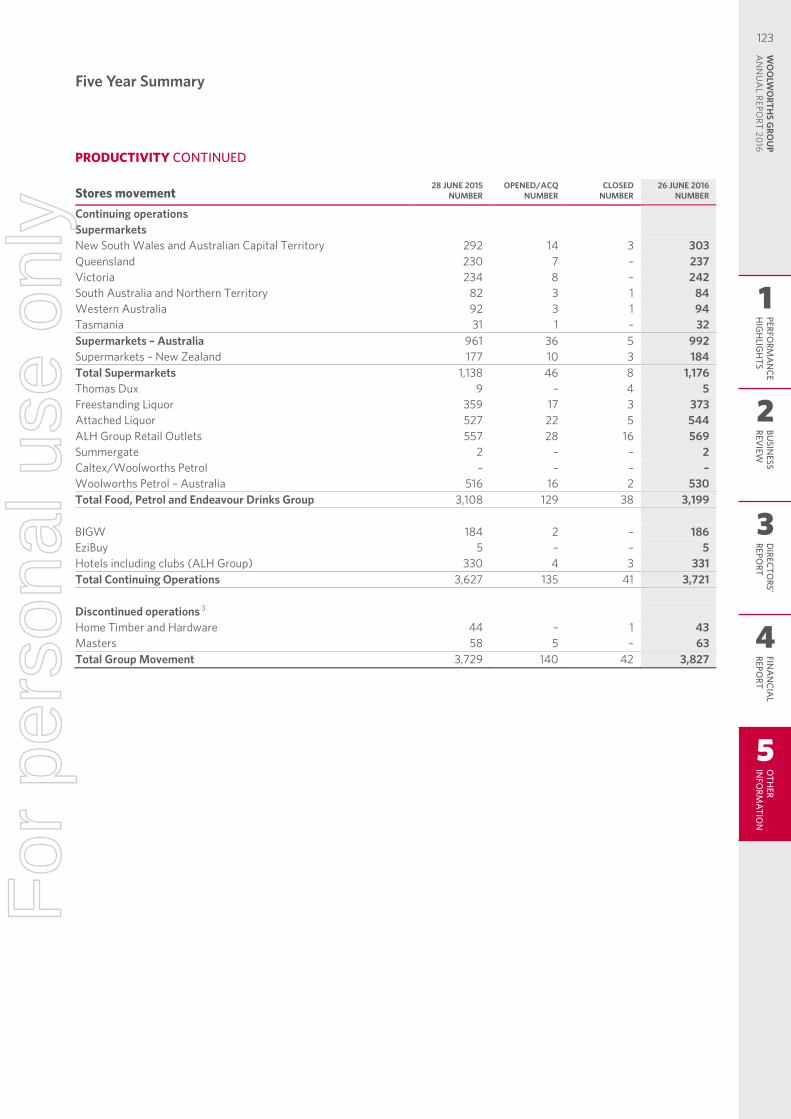
Five Year Summary
73 | WOOLWORTHS LIMITED | FINANCIAL REPORT 2016
Stores movement 28 JUNE 2015
NUMBER OPENED/ACQ
NUMBER CLOSED
NUMBER 26 JUNE 2016
NUMBER
Continuing operations Supermarkets New South Wales and Australian Capital Territory 292 14 3 303 Queensland 230 7 – 237 Victoria 234 8 – 242 South Australia and Northern Territory 82 3 1 84 Western Australia 92 3 1 94 Tasmania 31 1 – 32 Supermarkets – Australia 961 36 5 992 Supermarkets – New Zealand 177 10 3 184 Total Supermarkets 1,138 46 8 1,176 Thomas Dux 9 – 4 5 Freestanding Liquor 359 17 3 373 Attached Liquor 527 22 5 544 ALH Group Retail Outlets 557 28 16 569 Summergate 2 – – 2 Caltex/Woolworths Petrol – – – – Woolworths Petrol – Australia 516 16 2 530 Total Food, Petrol and Endeavour Drinks Group 3,108 129 38 3,199 BIGW 184 2 – 186 EziBuy 5 – – 5 Hotels including clubs (ALH Group) 330 4 3 331 Total Continuing Operations 3,627 135 41 3,721 Discontinued operations 3 Home Timber and Hardware 44 – 1 43 Masters 58 5 – 63 Total Group Movement 3,729 140 42 3,827
PRODUCTIVITY CONTINUED
Five Year Summary
123
1
2
3
4
5
PERFORM
AN
CEH
IGH
LIGH
TSBU
SINESS
REVIEW
DIRECTO
RS' REPO
RTFIN
AN
CIAL
REPORT
OTH
ER IN
FORM
ATION
WO
OLW
ORTH
S GRO
UP
AN
NU
AL REPO
RT 2016
123F
or p
erso
nal u
se o
nly
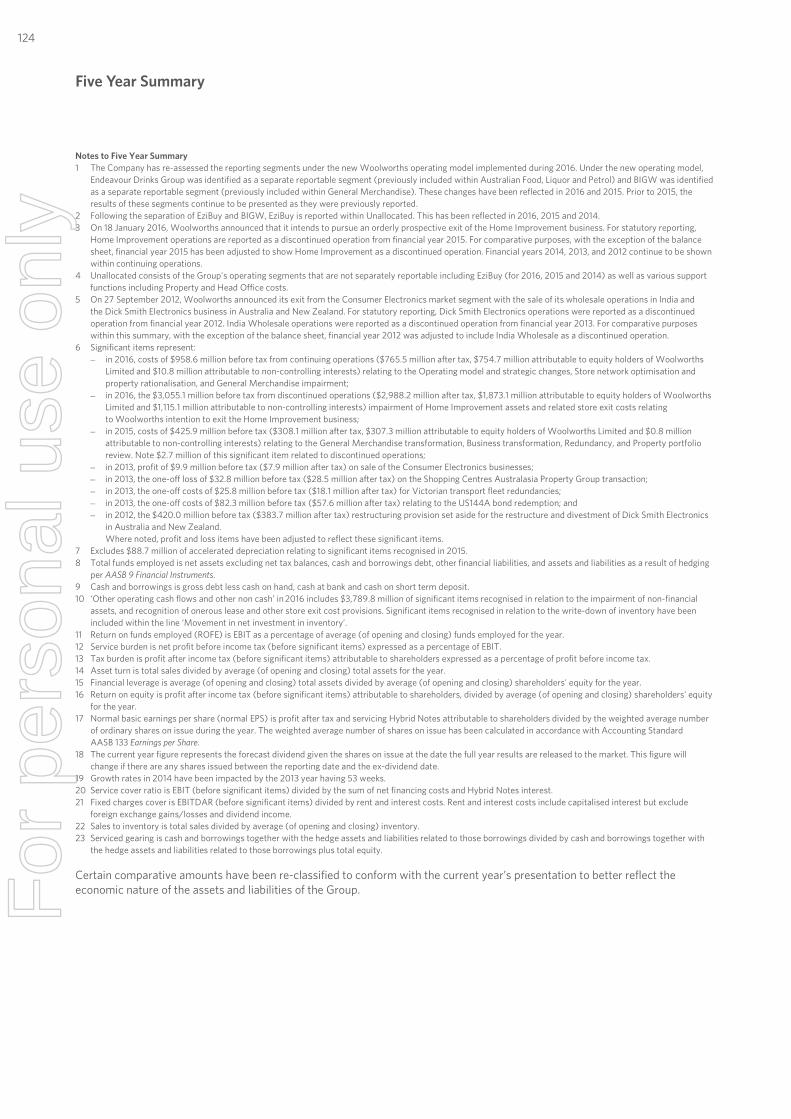
Five Year Summary
74 | WOOLWORTHS LIMITED | FINANCIAL REPORT 2016
Notes to Five Year Summary 1 The Company has re-assessed the reporting segments under the new Woolworths operating model implemented during 2016. Under the new operating model,
Endeavour Drinks Group was identified as a separate reportable segment (previously included within Australian Food, Liquor and Petrol) and BIGW was identified as a separate reportable segment (previously included within General Merchandise). These changes have been reflected in 2016 and 2015. Prior to 2015, the results of these segments continue to be presented as they were previously reported.
2 Following the separation of EziBuy and BIGW, EziBuy is reported within Unallocated. This has been reflected in 2016, 2015 and 2014. 3 On 18 January 2016, Woolworths announced that it intends to pursue an orderly prospective exit of the Home Improvement business. For statutory reporting,
Home Improvement operations are reported as a discontinued operation from financial year 2015. For comparative purposes, with the exception of the balance sheet, financial year 2015 has been adjusted to show Home Improvement as a discontinued operation. Financial years 2014, 2013, and 2012 continue to be shown within continuing operations.
4 Unallocated consists of the Group's operating segments that are not separately reportable including EziBuy (for 2016, 2015 and 2014) as well as various support functions including Property and Head Office costs.
5 On 27 September 2012, Woolworths announced its exit from the Consumer Electronics market segment with the sale of its wholesale operations in India and the Dick Smith Electronics business in Australia and New Zealand. For statutory reporting, Dick Smith Electronics operations were reported as a discontinued operation from financial year 2012. India Wholesale operations were reported as a discontinued operation from financial year 2013. For comparative purposes within this summary, with the exception of the balance sheet, financial year 2012 was adjusted to include India Wholesale as a discontinued operation.
6 Significant items represent: − in 2016, costs of $958.6 million before tax from continuing operations ($765.5 million after tax, $754.7 million attributable to equity holders of Woolworths
Limited and $10.8 million attributable to non-controlling interests) relating to the Operating model and strategic changes, Store network optimisation and property rationalisation, and General Merchandise impairment;
− in 2016, the $3,055.1 million before tax from discontinued operations ($2,988.2 million after tax, $1,873.1 million attributable to equity holders of Woolworths Limited and $1,115.1 million attributable to non-controlling interests) impairment of Home Improvement assets and related store exit costs relating to Woolworths intention to exit the Home Improvement business;
− in 2015, costs of $425.9 million before tax ($308.1 million after tax, $307.3 million attributable to equity holders of Woolworths Limited and $0.8 million attributable to non-controlling interests) relating to the General Merchandise transformation, Business transformation, Redundancy, and Property portfolio review. Note $2.7 million of this significant item related to discontinued operations;
− in 2013, profit of $9.9 million before tax ($7.9 million after tax) on sale of the Consumer Electronics businesses; − in 2013, the one-off loss of $32.8 million before tax ($28.5 million after tax) on the Shopping Centres Australasia Property Group transaction; − in 2013, the one-off costs of $25.8 million before tax ($18.1 million after tax) for Victorian transport fleet redundancies; − in 2013, the one-off costs of $82.3 million before tax ($57.6 million after tax) relating to the US144A bond redemption; and − in 2012, the $420.0 million before tax ($383.7 million after tax) restructuring provision set aside for the restructure and divestment of Dick Smith Electronics
in Australia and New Zealand. Where noted, profit and loss items have been adjusted to reflect these significant items.
7 Excludes $88.7 million of accelerated depreciation relating to significant items recognised in 2015. 8 Total funds employed is net assets excluding net tax balances, cash and borrowings debt, other financial liabilities, and assets and liabilities as a result of hedging
per AASB 9 Financial Instruments. 9 Cash and borrowings is gross debt less cash on hand, cash at bank and cash on short term deposit. 10 ‘Other operating cash flows and other non cash’ in 2016 includes $3,789.8 million of significant items recognised in relation to the impairment of non-financial
assets, and recognition of onerous lease and other store exit cost provisions. Significant items recognised in relation to the write-down of inventory have been included within the line ‘Movement in net investment in inventory’.
11 Return on funds employed (ROFE) is EBIT as a percentage of average (of opening and closing) funds employed for the year. 12 Service burden is net profit before income tax (before significant items) expressed as a percentage of EBIT. 13 Tax burden is profit after income tax (before significant items) attributable to shareholders expressed as a percentage of profit before income tax. 14 Asset turn is total sales divided by average (of opening and closing) total assets for the year. 15 Financial leverage is average (of opening and closing) total assets divided by average (of opening and closing) shareholders' equity for the year. 16 Return on equity is profit after income tax (before significant items) attributable to shareholders, divided by average (of opening and closing) shareholders' equity
for the year. 17 Normal basic earnings per share (normal EPS) is profit after tax and servicing Hybrid Notes attributable to shareholders divided by the weighted average number
of ordinary shares on issue during the year. The weighted average number of shares on issue has been calculated in accordance with Accounting Standard AASB 133 Earnings per Share.
18 The current year figure represents the forecast dividend given the shares on issue at the date the full year results are released to the market. This figure will change if there are any shares issued between the reporting date and the ex-dividend date.
19 Growth rates in 2014 have been impacted by the 2013 year having 53 weeks. 20 Service cover ratio is EBIT (before significant items) divided by the sum of net financing costs and Hybrid Notes interest. 21 Fixed charges cover is EBITDAR (before significant items) divided by rent and interest costs. Rent and interest costs include capitalised interest but exclude
foreign exchange gains/losses and dividend income. 22 Sales to inventory is total sales divided by average (of opening and closing) inventory. 23 Serviced gearing is cash and borrowings together with the hedge assets and liabilities related to those borrowings divided by cash and borrowings together with
the hedge assets and liabilities related to those borrowings plus total equity. Certain comparative amounts have been re-classified to conform with the current year’s presentation to better reflect the economic nature of the assets and liabilities of the Group.
Five Year Summary
124F
or p
erso
nal u
se o
nly
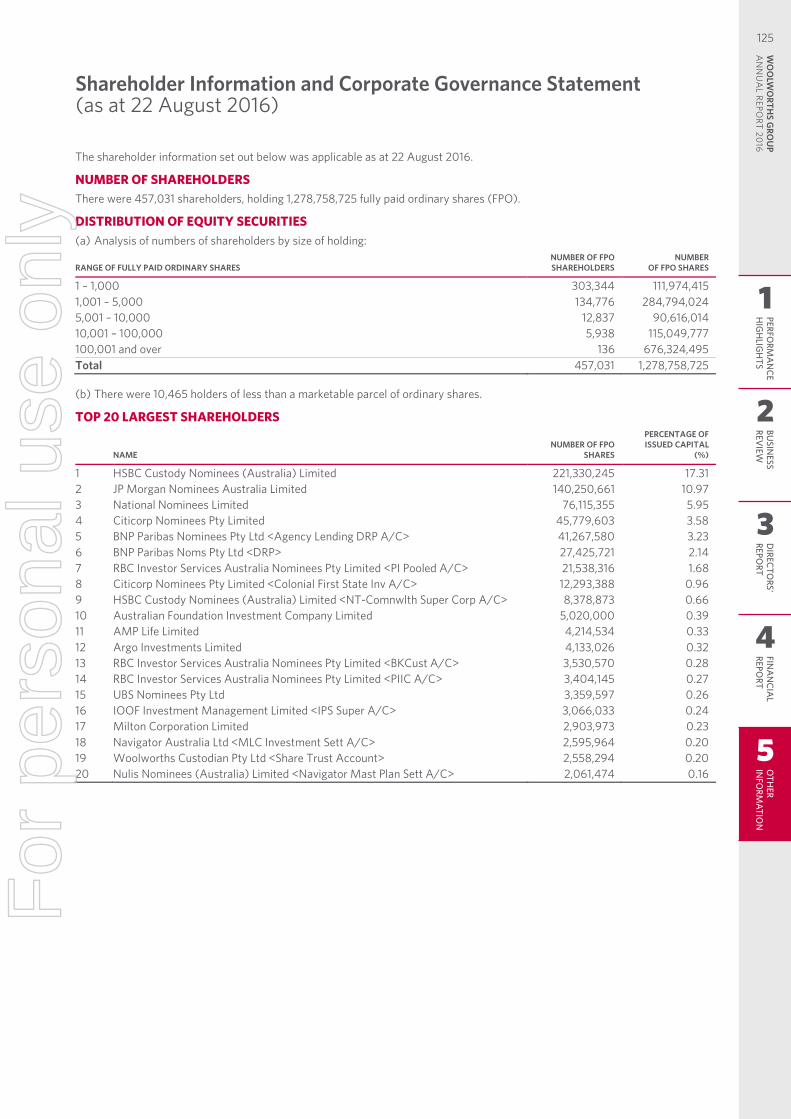
Shareholder Information and Corporate Governance Statement (as at 22 August 2016)
75 | WOOLWORTHS LIMITED | FINANCIAL REPORT 2016
The shareholder information set out below was applicable as at 22 August 2016.
NUMBER OF SHAREHOLDERS There were 457,031 shareholders, holding 1,278,758,725 fully paid ordinary shares (FPO).
DISTRIBUTION OF EQUITY SECURITIES (a) Analysis of numbers of shareholders by size of holding:
RANGE OF FULLY PAID ORDINARY SHARES NUMBER OF FPO SHAREHOLDERS
NUMBER OF FPO SHARES
1 – 1,000 303,344 111,974,415 1,001 – 5,000 134,776 284,794,024 5,001 – 10,000 12,837 90,616,014 10,001 – 100,000 5,938 115,049,777 100,001 and over 136 676,324,495 Total 457,031 1,278,758,725 (b) There were 10,465 holders of less than a marketable parcel of ordinary shares.
TOP 20 LARGEST SHAREHOLDERS
NAME NUMBER OF FPO
SHARES
PERCENTAGE OF ISSUED CAPITAL
(%)
1 HSBC Custody Nominees (Australia) Limited 221,330,245 17.31 2 JP Morgan Nominees Australia Limited 140,250,661 10.97 3 National Nominees Limited 76,115,355 5.95 4 Citicorp Nominees Pty Limited 45,779,603 3.58 5 BNP Paribas Nominees Pty Ltd <Agency Lending DRP A/C> 41,267,580 3.23 6 BNP Paribas Noms Pty Ltd <DRP> 27,425,721 2.14 7 RBC Investor Services Australia Nominees Pty Limited <PI Pooled A/C> 21,538,316 1.68 8 Citicorp Nominees Pty Limited <Colonial First State Inv A/C> 12,293,388 0.96 9 HSBC Custody Nominees (Australia) Limited <NT-Comnwlth Super Corp A/C> 8,378,873 0.66 10 Australian Foundation Investment Company Limited 5,020,000 0.39 11 AMP Life Limited 4,214,534 0.33 12 Argo Investments Limited 4,133,026 0.32 13 RBC Investor Services Australia Nominees Pty Limited <BKCust A/C> 3,530,570 0.28 14 RBC Investor Services Australia Nominees Pty Limited <PIIC A/C> 3,404,145 0.27 15 UBS Nominees Pty Ltd 3,359,597 0.26 16 IOOF Investment Management Limited <IPS Super A/C> 3,066,033 0.24 17 Milton Corporation Limited 2,903,973 0.23 18 Navigator Australia Ltd <MLC Investment Sett A/C> 2,595,964 0.20 19 Woolworths Custodian Pty Ltd <Share Trust Account> 2,558,294 0.20 20 Nulis Nominees (Australia) Limited <Navigator Mast Plan Sett A/C> 2,061,474 0.16
Shareholder Information and Corporate Governance Statement(as at 22 August 2016)
125
1
2
3
4
5
PERFORM
AN
CEH
IGH
LIGH
TSBU
SINESS
REVIEW
DIRECTO
RS' REPO
RTFIN
AN
CIAL
REPORT
OTH
ER IN
FORM
ATION
WO
OLW
ORTH
S GRO
UP
AN
NU
AL REPO
RT 2016
125F
or p
erso
nal u
se o
nly
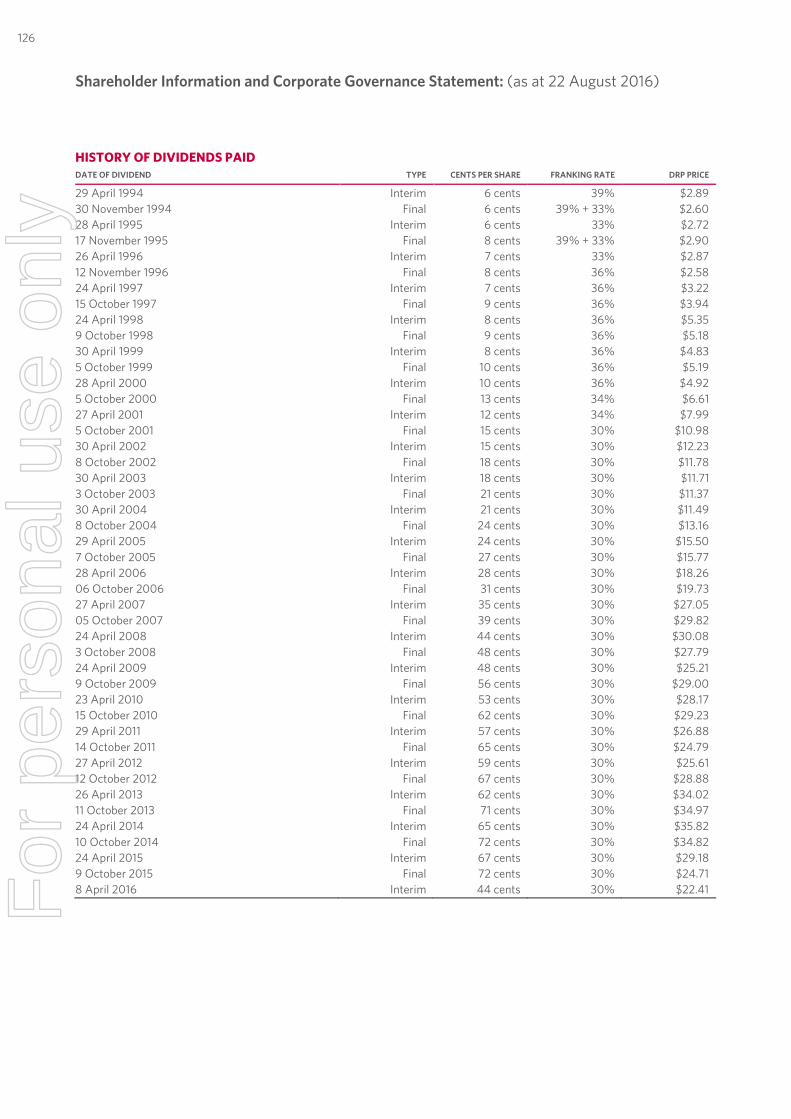
Shareholder Information and Corporate Governance Statement (as at 22 August 2016)
76 | WOOLWORTHS LIMITED | FINANCIAL REPORT 2016
HISTORY OF DIVIDENDS PAID DATE OF DIVIDEND TYPE CENTS PER SHARE FRANKING RATE DRP PRICE
29 April 1994 Interim 6 cents 39% $2.89 30 November 1994 Final 6 cents 39% + 33% $2.60 28 April 1995 Interim 6 cents 33% $2.72 17 November 1995 Final 8 cents 39% + 33% $2.90 26 April 1996 Interim 7 cents 33% $2.87 12 November 1996 Final 8 cents 36% $2.58 24 April 1997 Interim 7 cents 36% $3.22 15 October 1997 Final 9 cents 36% $3.94 24 April 1998 Interim 8 cents 36% $5.35 9 October 1998 Final 9 cents 36% $5.18 30 April 1999 Interim 8 cents 36% $4.83 5 October 1999 Final 10 cents 36% $5.19 28 April 2000 Interim 10 cents 36% $4.92 5 October 2000 Final 13 cents 34% $6.61 27 April 2001 Interim 12 cents 34% $7.99 5 October 2001 Final 15 cents 30% $10.98 30 April 2002 Interim 15 cents 30% $12.23 8 October 2002 Final 18 cents 30% $11.78 30 April 2003 Interim 18 cents 30% $11.71 3 October 2003 Final 21 cents 30% $11.37 30 April 2004 Interim 21 cents 30% $11.49 8 October 2004 Final 24 cents 30% $13.16 29 April 2005 Interim 24 cents 30% $15.50 7 October 2005 Final 27 cents 30% $15.77 28 April 2006 Interim 28 cents 30% $18.26 06 October 2006 Final 31 cents 30% $19.73 27 April 2007 Interim 35 cents 30% $27.05 05 October 2007 Final 39 cents 30% $29.82 24 April 2008 Interim 44 cents 30% $30.08 3 October 2008 Final 48 cents 30% $27.79 24 April 2009 Interim 48 cents 30% $25.21 9 October 2009 Final 56 cents 30% $29.00 23 April 2010 Interim 53 cents 30% $28.17 15 October 2010 Final 62 cents 30% $29.23 29 April 2011 Interim 57 cents 30% $26.88 14 October 2011 Final 65 cents 30% $24.79 27 April 2012 Interim 59 cents 30% $25.61 12 October 2012 Final 67 cents 30% $28.88 26 April 2013 Interim 62 cents 30% $34.02 11 October 2013 Final 71 cents 30% $34.97 24 April 2014 Interim 65 cents 30% $35.82 10 October 2014 Final 72 cents 30% $34.82 24 April 2015 Interim 67 cents 30% $29.18 9 October 2015 Final 72 cents 30% $24.71 8 April 2016 Interim 44 cents 30% $22.41
Shareholder Information and Corporate Governance Statement: (as at 22 August 2016)
126F
or p
erso
nal u
se o
nly
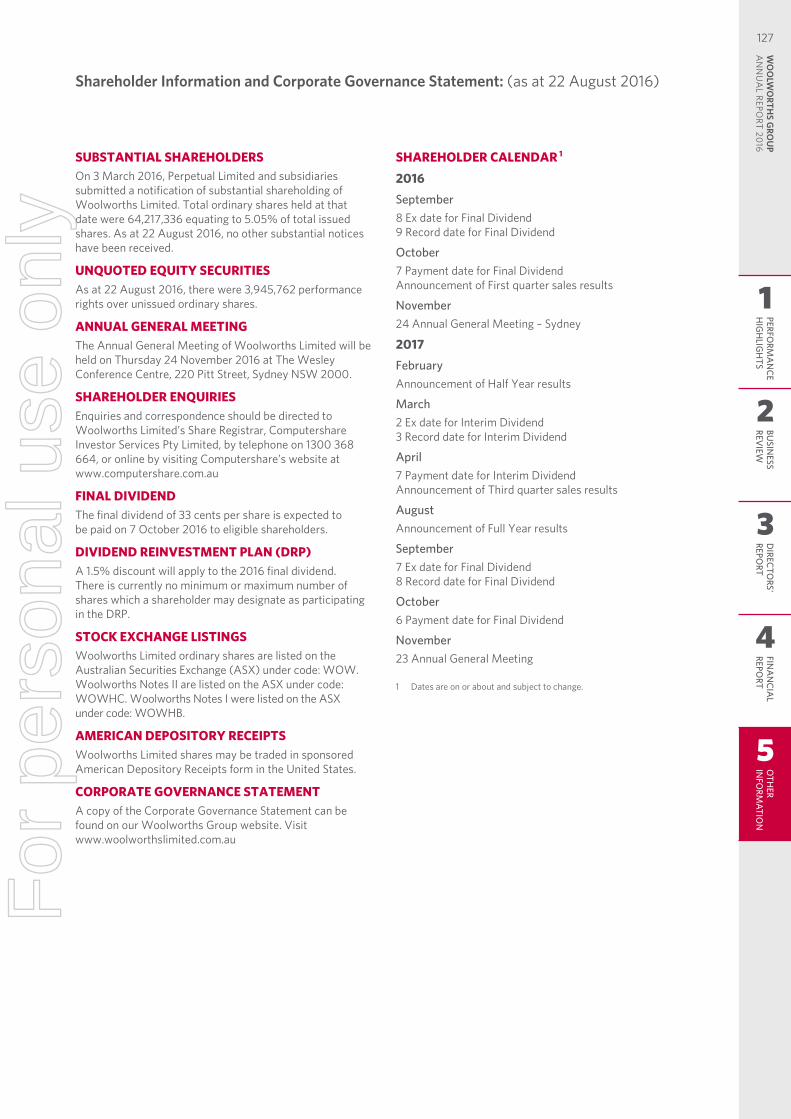
Shareholder Information and Corporate Governance Statement (as at 22 August 2016)
77 | WOOLWORTHS LIMITED | FINANCIAL REPORT 2016
SUBSTANTIAL SHAREHOLDERS On 3 March 2016, Perpetual Limited and subsidiaries submitted a notification of substantial shareholding of Woolworths Limited. Total ordinary shares held at that date were 64,217,336 equating to 5.05% of total issued shares. As at 22 August 2016, no other substantial notices have been received.
UNQUOTED EQUITY SECURITIES As at 22 August 2016, there were 3,945,762 performance rights over unissued ordinary shares.
ANNUAL GENERAL MEETING The Annual General Meeting of Woolworths Limited will be held on Thursday 24 November 2016 at The Wesley Conference Centre, 220 Pitt Street, Sydney NSW 2000.
SHAREHOLDER ENQUIRIES Enquiries and correspondence should be directed to Woolworths Limited’s Share Registrar, Computershare Investor Services Pty Limited, by telephone on 1300 368 664, or online by visiting Computershare’s website at www.computershare.com.au
FINAL DIVIDEND The final dividend of 33 cents per share is expected to be paid on 7 October 2016 to eligible shareholders.
DIVIDEND REINVESTMENT PLAN (DRP) A 1.5% discount will apply to the 2016 final dividend. There is currently no minimum or maximum number of shares which a shareholder may designate as participating in the DRP.
STOCK EXCHANGE LISTINGS Woolworths Limited ordinary shares are listed on the Australian Securities Exchange (ASX) under code: WOW. Woolworths Notes II are listed on the ASX under code: WOWHC. Woolworths Notes I were listed on the ASX under code: WOWHB.
AMERICAN DEPOSITORY RECEIPTS Woolworths Limited shares may be traded in sponsored American Depository Receipts form in the United States.
CORPORATE GOVERNANCE STATEMENT A copy of the Corporate Governance Statement can be found on our Woolworths Group website. Visit www.woolworthslimited.com.au
SHAREHOLDER CALENDAR 1 2016 September 8 Ex date for Final Dividend 9 Record date for Final Dividend
October 7 Payment date for Final Dividend Announcement of First quarter sales results
November 24 Annual General Meeting – Sydney
2017 February Announcement of Half Year results
March 2 Ex date for Interim Dividend 3 Record date for Interim Dividend
April 7 Payment date for Interim Dividend Announcement of Third quarter sales results
August Announcement of Full Year results
September 7 Ex date for Final Dividend 8 Record date for Final Dividend
October 6 Payment date for Final Dividend
November 23 Annual General Meeting 1 Dates are on or about and subject to change.
Shareholder Information and Corporate Governance Statement: (as at 22 August 2016)
127
1
2
3
4
5
PERFORM
AN
CEH
IGH
LIGH
TSBU
SINESS
REVIEW
DIRECTO
RS' REPO
RTFIN
AN
CIAL
REPORT
OTH
ER IN
FORM
ATION
WO
OLW
ORTH
S GRO
UP
AN
NU
AL REPO
RT 2016
127F
or p
erso
nal u
se o
nly
Company Directory
78 | WOOLWORTHS LIMITED | FINANCIAL REPORT 2016
REGISTERED OFFICE 1 Woolworths Way Bella Vista NSW 2153 Tel: (02) 8885 0000 Web: www.woolworthslimited.com.au
COMPANY SECRETARY Richard Dammery
AUDITOR Deloitte Touche Tohmatsu 225 George Street, Sydney NSW 2000 Tel: (02) 9322 7000 Web: www.deloitte.com.au
SHARE REGISTRAR Computershare Investor Services Pty Limited GPO Box 2975, Melbourne VIC 3001 Tel: 1300 368 664 Web: www.computershare.com.au
EMPLOYEE SHARE RIGHTS REGISTRAR Link Market Services Locked Bag A14, Sydney South NSW 1235 Tel: 1800 111 281 Web: www.linkmarketservices.com.au
Company Directory
128F
or p
erso
nal u
se o
nly

Designed and produced by ArmstrongQ armstrongq.com.au
For
per
sona
l use
onl
y
We bring a little good to everyone,
every day.
The littlethings we canall do that helpcustomers andeach other.
It’s an active thing –actions speak louderthan words.Good Food, Good Prices, Good Acts. This is what
customers expect from us.
Every day we have the
opportunity to make a
difference to our customers –
to help them live better lives.
We’re for every Australian, no matter what their budget, age or where they live.
Our people.It’s our teamthat make the
difference.
01_549314_PurposePosters_841x594.indd 2 16/08/2016 4:44 pm
For
per
sona
l use
onl
y