Embed Size (px)
Citation preview

9.
Welding Defects
9. Welding Defects 109
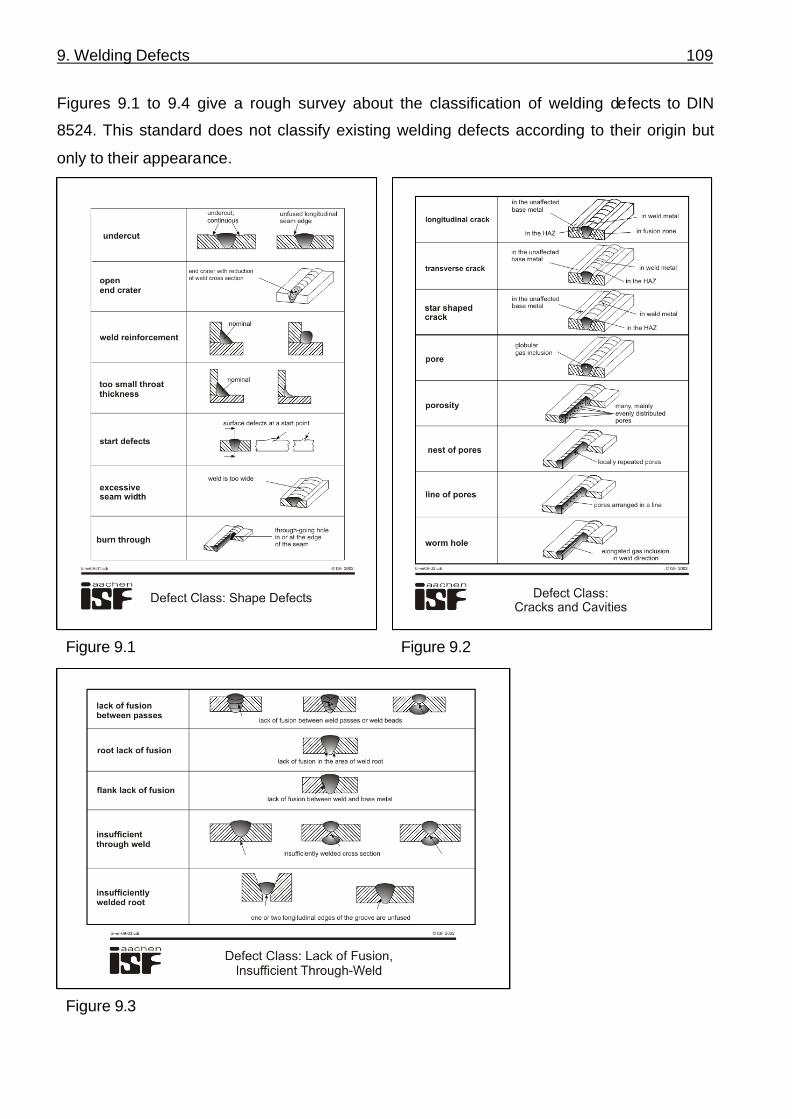
Figures 9.1 to 9.4 give a rough survey about the classification of welding defects to DIN
8524. This standard does not classify existing welding defects according to their origin but
only to their appearance.
Figure 9.1 Figure 9.2
Figure 9.3

9. Welding Defects 110
A distinction of arising defects by their origin is shown in Figure 9.5. The development of the
most important welding defects is explained in the following paragraphs.
Lack of fusion is defined
as unfused area between
weld metal and base mate-
rial or previously welded
layer. This happens when
the base metal or the pre-
vious layer are not com-
pletely or insufficiently
molten. Figure 9.6 explains
the influence of welding
parameters on the devel-
opment of lack of fusion. In
the upper part, arc charac-
teristic lines of MAG weld-
ing are shown using CO2
and mixed gas. The weld-
ing voltage depends on
welding current and is se-
lected according to the
joint type. With present
tension, the welding cur-
rent is fixed by the wire
feed speed (thus also
melting rate) as shown in
the middle part of the fig-
ure.
Melting rate (resulting from selected welding parameters) and welding speed define the heat
input. As it can be changed within certain limits, melting rate and welding speed do not limit
each other, but a working range is created (lower part of the figure). If the heat input is too
low, i.e. too high welding speed, a definite melting of flanks cannot be ensured. Due to the
Figure 9.4
Figure 9.5
9. Welding Defects 111
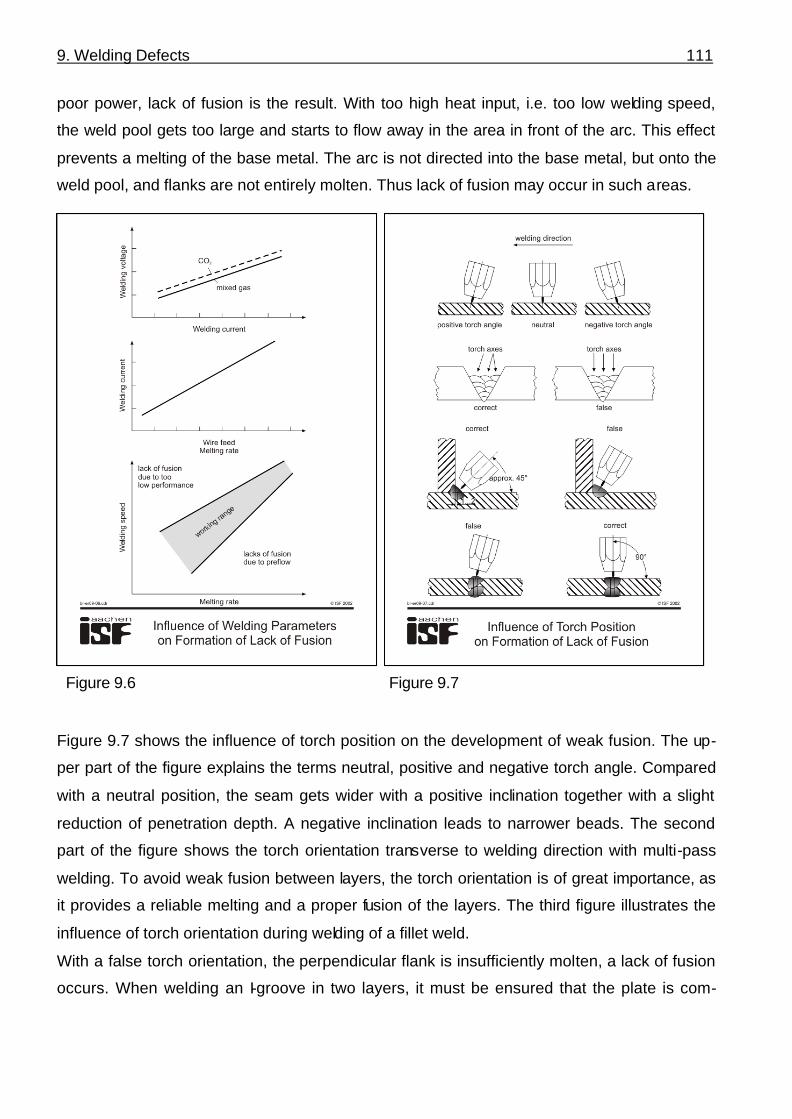
poor power, lack of fusion is the result. With too high heat input, i.e. too low welding speed,
the weld pool gets too large and starts to flow away in the area in front of the arc. This effect
prevents a melting of the base metal. The arc is not directed into the base metal, but onto the
weld pool, and flanks are not entirely molten. Thus lack of fusion may occur in such areas.
Figure 9.7 shows the influence of torch position on the development of weak fusion. The up-
per part of the figure explains the terms neutral, positive and negative torch angle. Compared
with a neutral position, the seam gets wider with a positive inclination together with a slight
reduction of penetration depth. A negative inclination leads to narrower beads. The second
part of the figure shows the torch orientation transverse to welding direction with multi-pass
welding. To avoid weak fusion between layers, the torch orientation is of great importance, as
it provides a reliable melting and a proper fusion of the layers. The third figure illustrates the
influence of torch orientation during welding of a fillet weld.
With a false torch orientation, the perpendicular flank is insufficiently molten, a lack of fusion
occurs. When welding an I-groove in two layers, it must be ensured that the plate is com-
Figure 9.6 Figure 9.7

9. Welding Defects 112
pletely fused. A false torch orientation may lead to lack of fusion between the layers, as
shown in the lower figure.
Figure 9.8 shows the influ-
ence of the torch orienta-
tion during MSG welding of
a rotating workpiece. As
an example, the upper fi-
gure shows the desired
torch orientation for usual
welding speeds. This ori-
entation depends on pa-
rameters like workpiece
diameter and thickness,
groove shape, melting
rate, and welding speed.
The lower figure illustrates
variations of torch orientation on seam formation. A torch orientation should be chosen in
such a way that a solidification of the melt pool takes place in 12 o'clock position, i.e. the weld
pool does not flow in front or behind of the arc. Both may cause lack of fusion.
In contrast to faulty fusion,
pores in the weld metal
due to their globular shape
are less critical, provided
that their size does not
exceed a certain value.
Secondly, they must occur
isolated and keep a mini-
mum distance from each
other. There are two pos-
sible mechanisms to de-
velop cavities in the weld
metal: the mechanical and the metallurgical pore formation. Figure 9.9 lists causes of a me-
chanical pore formation as well as possibilities to avoid them. To over-weld a cavity (lack of
Figure 9.8
Figure 9.9

9. Welding Defects 113
fusion, gaps, overlaps etc.) of a previous layer can be regarded as a typical case of a me-
chanical pore formation. The welding heat during welding causes a strong expansion of the
gasses contained in the cavity and consequently a development of a gas bubble in the liquid
weld metal. If the solidification is carried out so fast that this gas bubble cannot raise to the
surface of the weld pool, the pore will be caught in the weld metal.
Figure 9.10 shows a X-ray
photograph of a pore
which developed in this
way, as well as a surface
and a transverse section.
This pore formation shows
its typical pore position at
the edge of the joint and at
the fusion line of the top
layer.
Mechanical Pore Formation
a) X-ray photograph
b) Surface cross-section
c) Transverse section© ISF 2002br-er09-10.cdr
Figure 9.10 Figure 9.11
Figure 9.12
9. Welding Defects 114
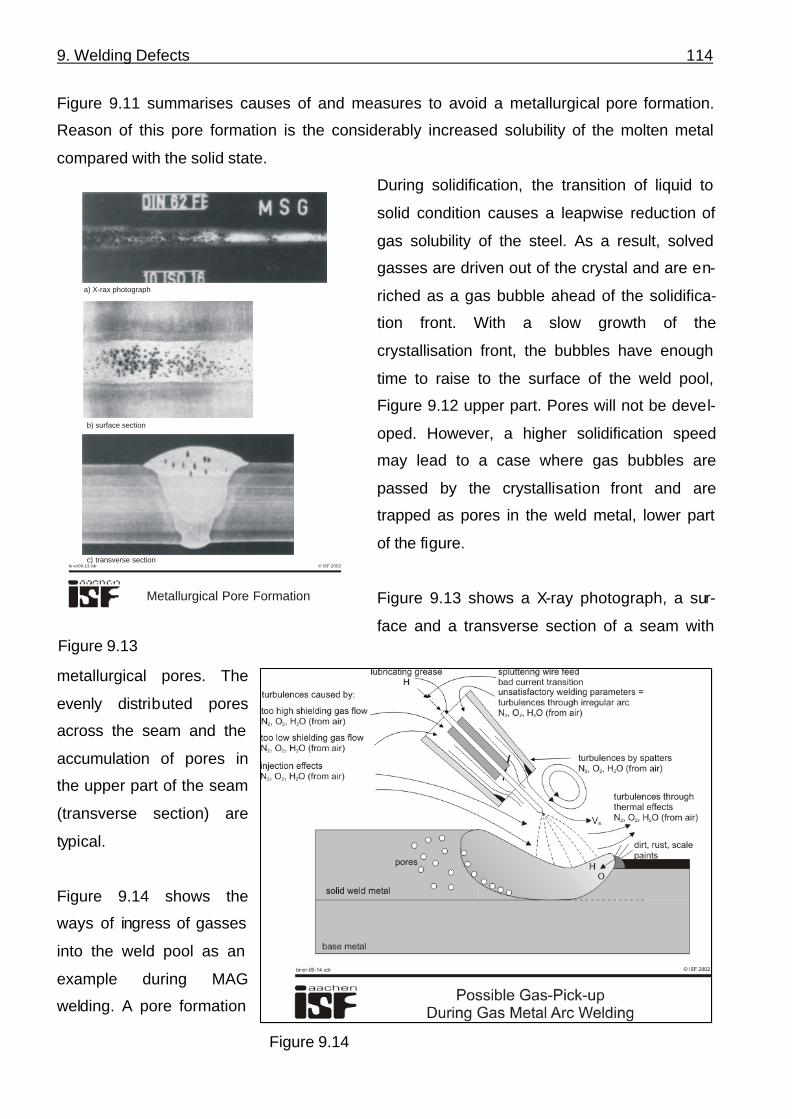
Figure 9.11 summarises causes of and measures to avoid a metallurgical pore formation.
Reason of this pore formation is the considerably increased solubility of the molten metal
compared with the solid state.
During solidification, the transition of liquid to
solid condition causes a leapwise reduction of
gas solubility of the steel. As a result, solved
gasses are driven out of the crystal and are en-
riched as a gas bubble ahead of the solidifica-
tion front. With a slow growth of the
crystallisation front, the bubbles have enough
time to raise to the surface of the weld pool,
Figure 9.12 upper part. Pores will not be devel-
oped. However, a higher solidification speed
may lead to a case where gas bubbles are
passed by the crystallisation front and are
trapped as pores in the weld metal, lower part
of the figure.
Figure 9.13 shows a X-ray photograph, a sur-
face and a transverse section of a seam with
metallurgical pores. The
evenly distributed pores
across the seam and the
accumulation of pores in
the upper part of the seam
(transverse section) are
typical.
Figure 9.14 shows the
ways of ingress of gasses
into the weld pool as an
example during MAG
welding. A pore formation
Figure 9.13
Metallurgical Pore Formation
a) X-rax photograph
b) surface section
c) transverse section© ISF 2002br-er09-13.cdr
Figure 9.14

9. Welding Defects 115
is mainly caused by hydrogen and nitrogen. Oxygen is bonded in a harmless way when using
universal electrodes which are alloyed with Si and Mn.
Classification of Cracksto DIN 8524 Part 3
© ISF 2002br-er09-15.cdr
Figure 9.15
9. Welding Defects 116
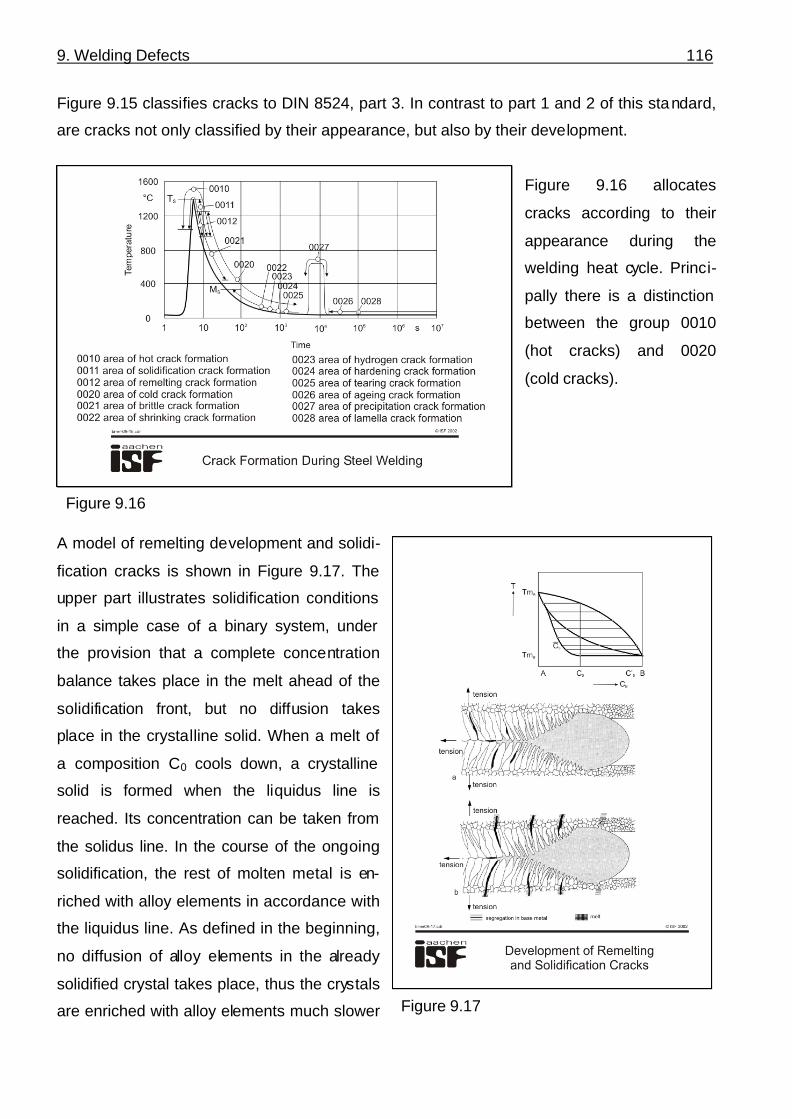
Figure 9.15 classifies cracks to DIN 8524, part 3. In contrast to part 1 and 2 of this standard,
are cracks not only classified by their appearance, but also by their development.
Figure 9.16 allocates
cracks according to their
appearance during the
welding heat cycle. Princi-
pally there is a distinction
between the group 0010
(hot cracks) and 0020
(cold cracks).
A model of remelting development and solidi-
fication cracks is shown in Figure 9.17. The
upper part illustrates solidification conditions
in a simple case of a binary system, under
the provision that a complete concentration
balance takes place in the melt ahead of the
solidification front, but no diffusion takes
place in the crystalline solid. When a melt of
a composition C0 cools down, a crystalline
solid is formed when the liquidus line is
reached. Its concentration can be taken from
the solidus line. In the course of the ongoing
solidification, the rest of molten metal is en-
riched with alloy elements in accordance with
the liquidus line. As defined in the beginning,
no diffusion of alloy elements in the already
solidified crystal takes place, thus the crystals
are enriched with alloy elements much slower
Figure 9.16
Figure 9.17

9. Welding Defects 117
than in a case of the binary system (lower line).
As a result, the concentration of the melt exceeds the maximum equilibrium concentration
(C5), forming at the end of solidification a very much enriched crystalline solid, whose melting
point is considerably lower when compared with the firstly developed crystalline solid. Such
concentration differences between first and last solidified crystals are called segregations.
This model of segregation development is very much simplified, but it is sufficient to under-
stand the mechanism of hot crack formation. The middle part of the figure shows the forma-
tion of solidification cracks. Due to the segregation effects described above, the melt between
the crystalline solids at the end of solidification has a considerably decreased solidus tem-
perature. As indicated by the black areas, rests of liquid may be trapped by dendrites. If ten-
sile stresses exist (shrinking stress of the welded joint), the liquid areas are not yet able to
transfer forces and open up.
The lower part of the figure shows the development of remelting cracks. If the base material
to be welded contains already some segregations whose melting point is lower than that of
the rest of the base metal, then these zones will melt during welding, and the rest of the ma-
terial remains solid (black areas). If the joint is exposed to tensile stress during solidification,
then these areas open up (see above) and cracks occur. A hot cracking tendency of a steel is
above all promoted by sulphur and phosphorus, because these elements form with iron very
low melting phases (eutectic point Fe-S at 988°C) and these elements segregate i ntensely. In
addition, hot crack tendency increases with increasing melt interval.
As shown in Figure 9.18,
also the geometry of the
groove is important for hot
crack tendency. With nar-
row, deep grooves a crys-
tallisation takes place of all
sides of the bead, entrap-
ping the remaining melt in
the bead centre. With the
occurrence of shrinking
stresses, hot cracks may
develop. In the case of flat
beads as shown in the Figure 9.18

9. Welding Defects 118
middle part of the figure,
the remaining melt
solidifies at the surface of
the bead. The melt cannot
be trapped, hot cracking is
not possible. The case in
figure c shows no advan-
tage, because a remelting
crack may occur in the
centre (segregation zone)
of the first layer during
welding the second layer.
The example of a hot
crack in the middle of a SA
weld is shown in Figure
9.19. This crack developed
due to the unsuitable
groove geometry.
Figure 9.20 shows an ex-
ample of a remelting crack
which started to develop in
a segregation zone of the
base metal and spread up
to the bead centre.
The section shown in Fig-
ure 9.21 is similar to case
c in Figure 9.18. One can
clearly see that an existing crack develops through the following layers during over-welding.
Figure 9.22 classifies cold cracks depending on their position in the weld metal area. Such a
classification does not provide an explanation for the origin of the cracks.
Figure 9.19
Figure 9.20

9. Welding Defects 119
Figure 9.23 shows a summary of the three main causes of cold crack formation and their
main influences. As explained in previous chapters, the resulting welding microstructure de-
pends on both, the composition of base and filler materials and of the cooling speed of the
joint. An unsatisfactory structure composition promotes very much the formation of cold
cracks (hardening by martensite).
Another cause for increased cold crack susceptibility is a higher hydrogen content. The hy-
drogen content is very much influenced by the condition of the welding filler material (humid-
ity of electrodes or flux, lubricating grease on welding wire etc.) and by humidity on the
groove edges.
The cooling speed is also important because it determines the remaining time for hydrogen
effusion out of the bead, respectively how much hydrogen remains in the weld. A measure is
t8/1 because only below 100°C a hydrogen e ffusion stops.
Figure 9.21 Figure 9.22

9. Welding Defects 120
A crack initiation is effected by stresses. Depending on material condition and the two al-
ready mentioned influencing factors, even residual stresses in the workpiece may actuate a
crack. Or a crack occurs only when superimpose of residual stresses on outer stress.
Figure 9.24 shows typical cold cracks in a workpiece. An increased hydrogen content in the
weld metal leads to an increased cold crack tendency. Mechanisms of hydrogen cracking
were not completely understood until today. However, a spontaneous occurrence is typical of
hydrogen cracking. Such cracks do not appear directly after welding but hours or even days
after cooling. The weld metal hydrogen content depends on humidity of the electrode coating
(manual metal arc welding) and of flux (submerged arc welding).
Figure 9.23 Figure 9.24

9. Welding Defects 121
Figure 9.25 shows that the moisture pick-up of
an electrode coating greatly depends on am-
bient conditions and on the type of electrode.
The upper picture shows that during storage
of an electrode type the water content of the
coating depends on air humidity. The water
content of the coating of this electrode type
advances to a maximum value with time. The
lower picture shows that this behaviour does
not apply to all electrode types. The
characteristics of 25 welding electrodes stored
under identical conditions are plotted here. It
can clearly be seen that a behaviour as
shown in the upper picture applies only to
some electrode types, but basically a very
different behaviour in connection with storage
can be noticed.
In practice, such constant
storage conditions are not
to be found, this is the
reason why electrodes are
backed before welding to
limit the water content of
the coating. Figure 9.26
shows the effects of this
measure. The upper curve
shows the water content of
the coating of electrodes
which were stored at con-
stant air humidity before
rebaking. Humidity values
after rebaking are plotted in the lower curve. It can be seen that even electrodes stored under
Figure 9.25
Figure 9.26
9. Welding Defects 122
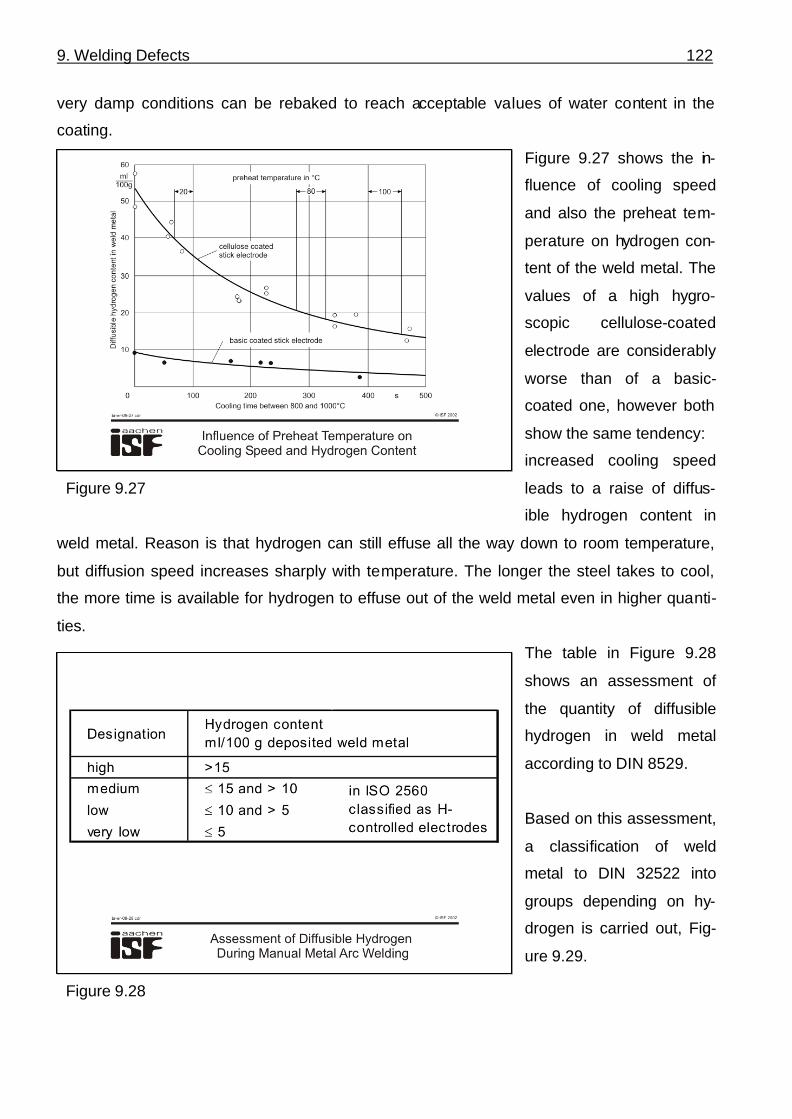
very damp conditions can be rebaked to reach acceptable values of water content in the
coating.
Figure 9.27 shows the in-
fluence of cooling speed
and also the preheat tem-
perature on hydrogen con-
tent of the weld metal. The
values of a high hygro-
scopic cellulose-coated
electrode are considerably
worse than of a basic-
coated one, however both
show the same tendency:
increased cooling speed
leads to a raise of diffus-
ible hydrogen content in
weld metal. Reason is that hydrogen can still effuse all the way down to room temperature,
but diffusion speed increases sharply with temperature. The longer the steel takes to cool,
the more time is available for hydrogen to effuse out of the weld metal even in higher quanti-
ties.
The table in Figure 9.28
shows an assessment of
the quantity of diffusible
hydrogen in weld metal
according to DIN 8529.
Based on this assessment,
a classification of weld
metal to DIN 32522 into
groups depending on hy-
drogen is carried out, Fig-
ure 9.29.
Figure 9.27
Figure 9.28
9. Welding Defects 123
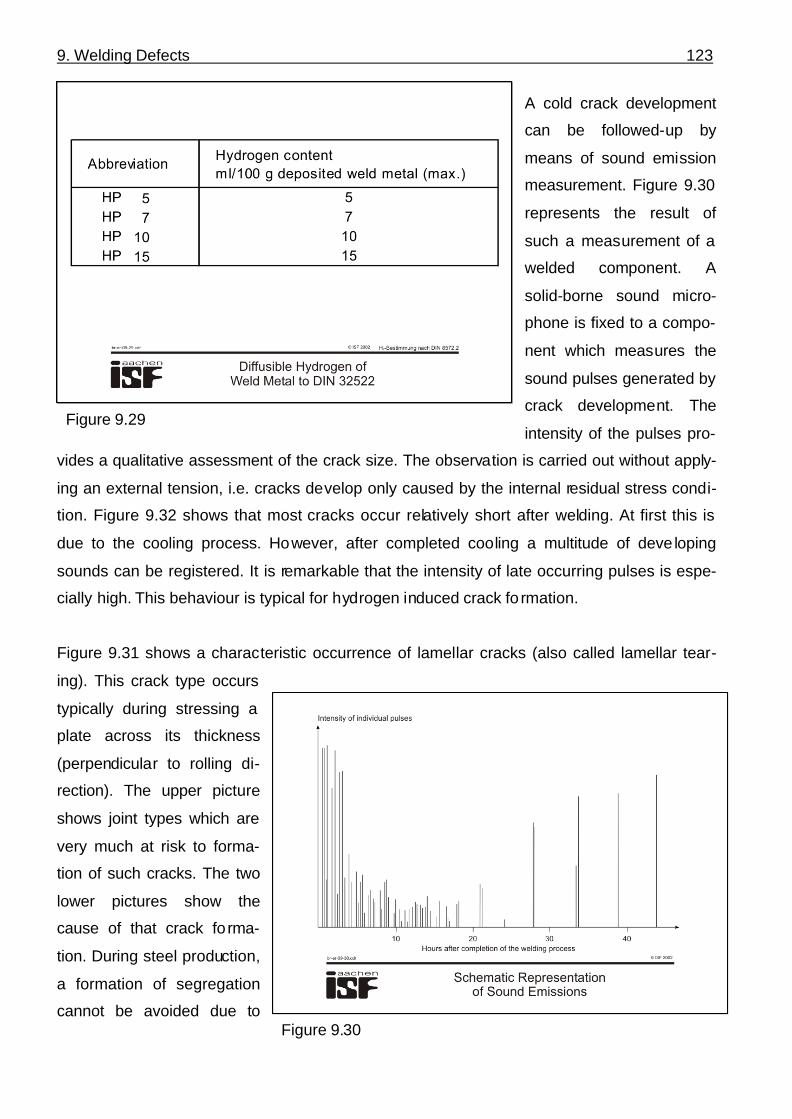
A cold crack development
can be followed-up by
means of sound emission
measurement. Figure 9.30
represents the result of
such a measurement of a
welded component. A
solid-borne sound micro-
phone is fixed to a compo-
nent which measures the
sound pulses generated by
crack development. The
intensity of the pulses pro-
vides a qualitative assessment of the crack size. The observation is carried out without apply-
ing an external tension, i.e. cracks develop only caused by the internal residual stress condi-
tion. Figure 9.32 shows that most cracks occur relatively short after welding. At first this is
due to the cooling process. However, after completed cooling a multitude of deve loping
sounds can be registered. It is remarkable that the intensity of late occurring pulses is espe-
cially high. This behaviour is typical for hydrogen induced crack fo rmation.
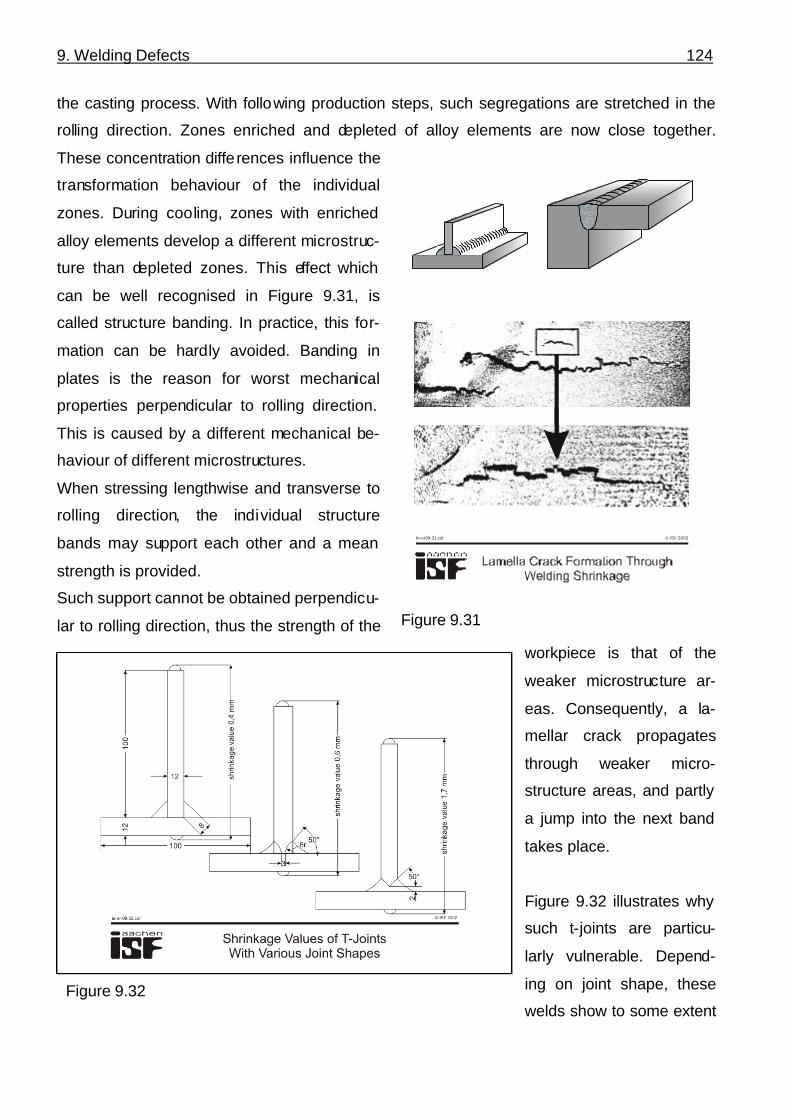
Figure 9.31 shows a characteristic occurrence of lamellar cracks (also called lamellar tear-
ing). This crack type occurs
typically during stressing a
plate across its thickness
(perpendicular to rolling di-
rection). The upper picture
shows joint types which are
very much at risk to forma-
tion of such cracks. The two
lower pictures show the
cause of that crack fo rma-
tion. During steel production,
a formation of segregation
cannot be avoided due to
Figure 9.29
Figure 9.30
9. Welding Defects 124
the casting process. With following production steps, such segregations are stretched in the
rolling direction. Zones enriched and depleted of alloy elements are now close together.
These concentration differences influence the
transformation behaviour of the individual
zones. During cooling, zones with enriched
alloy elements develop a different microstruc-
ture than depleted zones. This effect which
can be well recognised in Figure 9.31, is
called structure banding. In practice, this for-
mation can be hardly avoided. Banding in
plates is the reason for worst mechanical
properties perpendicular to rolling direction.
This is caused by a different mechanical be-
haviour of different microstructures.
When stressing lengthwise and transverse to
rolling direction, the individual structure
bands may support each other and a mean
strength is provided.
Such support cannot be obtained perpendicu-
lar to rolling direction, thus the strength of the
workpiece is that of the
weaker microstructure ar-
eas. Consequently, a la-
mellar crack propagates
through weaker micro-
structure areas, and partly
a jump into the next band
takes place.
Figure 9.32 illustrates why
such t-joints are particu-
larly vulnerable. Depend-
ing on joint shape, these
welds show to some extent
© ISF 2002br-er09-31.cdr
Figure 9.31
Figure 9.32

9. Welding Defects 125
a considerable shrinking. A welded construction which greatly impedes shrinking of this joint,
may generate stresses perpendicular to the plane of magnitude above the tensile strength.
This can cause lamellar tearing.
Precipitation cracks occur mainly during stress relief heat treatment of welded components.
They occur in the coarse grain zone close to fusion line. As this type of cracks occurs often
during post weld heat treatment of cladded materials, is it also called undercladding crack,
Figure 9.33.
Especially susceptible are steels which contain alloy elements with a precipitation hardening
effect (carbide developer like Ti, Nb, V). During welding such steels, carbides are dissolved in
an area close to the fusion line. During the following cooling, the carbide developers are not
completely re-precipitated.
If a component in such a condition is stress
relief heat treated, a re-precipitation of car-
bides takes place (see hot ageing, chapter 8).
With this re-precipitation, precipitation-free
zones may develop along grain boundaries,
which have a considerably lower deformation
stress limit compared with strengthened ar-
eas. Plastic deformations during stress reliev-
ing are carried out almost only in these areas,
causing the cracks shown in Figure 9.33.
Figure 9.33