Embed Size (px)
Citation preview

90/90/90 Best Practice Symposium: Improved VL Testing and
Suppression – Ekurhuleni District
Bulelani Kuwane - The Aurum Institute
and Sibongile Kekana – Ekurhuleni Metropolitan Municipality

Background
• Ekurhuleni has 96 facilities
• 98% of facilities signed off on Phase 6– 3 facilities were part of national TB module in TIER
pilot
• 200,016 are on ART – March 2016
• Aurum funded by PEPFAR – CDC has been supporting Ekurhuleni since 2012 with TA and HSS– Recently Roving Teams and Direct Service Delivery
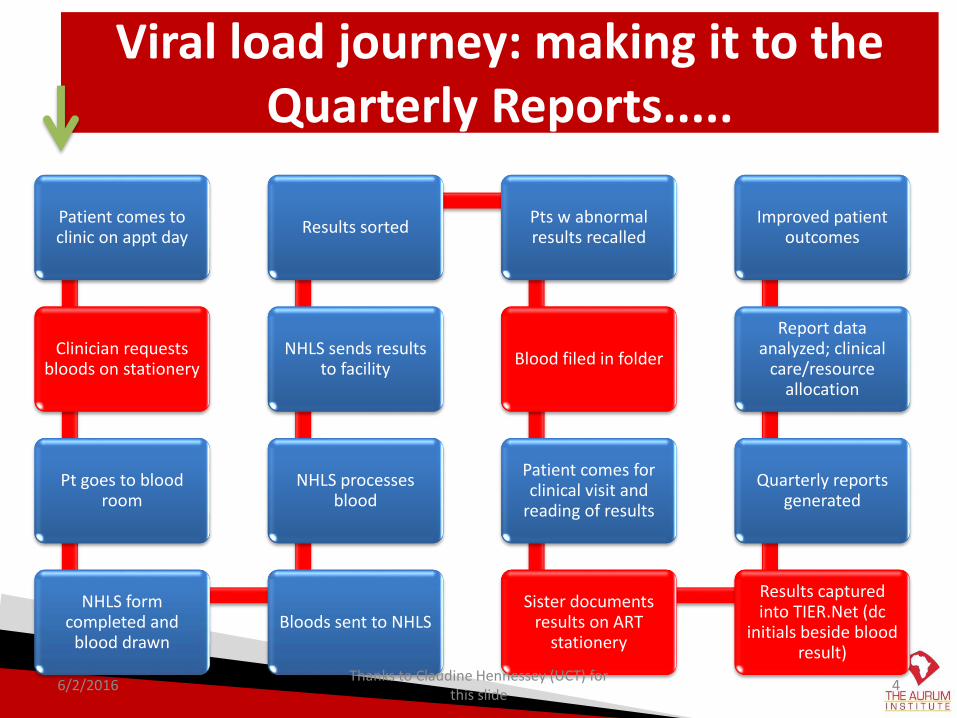
Viral load journey: making it to the Quarterly Reports.....
Patient comes to clinic on appt day
Clinician requests bloods on stationery
Pt goes to blood room
NHLS form completed and
blood drawnBloods sent to NHLS
NHLS processes blood
NHLS sends results to facility
Results sortedPts w abnormal results recalled
Blood filed in folder
Patient comes for clinical visit and
reading of results
Sister documents results on ART
stationery
Results captured into TIER.Net (dc
initials beside blood result)
Quarterly reports generated
Report data analyzed; clinical
care/resource allocation
Improved patient outcomes
6/2/2016 4Thanks to Claudine Hennessey (UCT) for
this slide
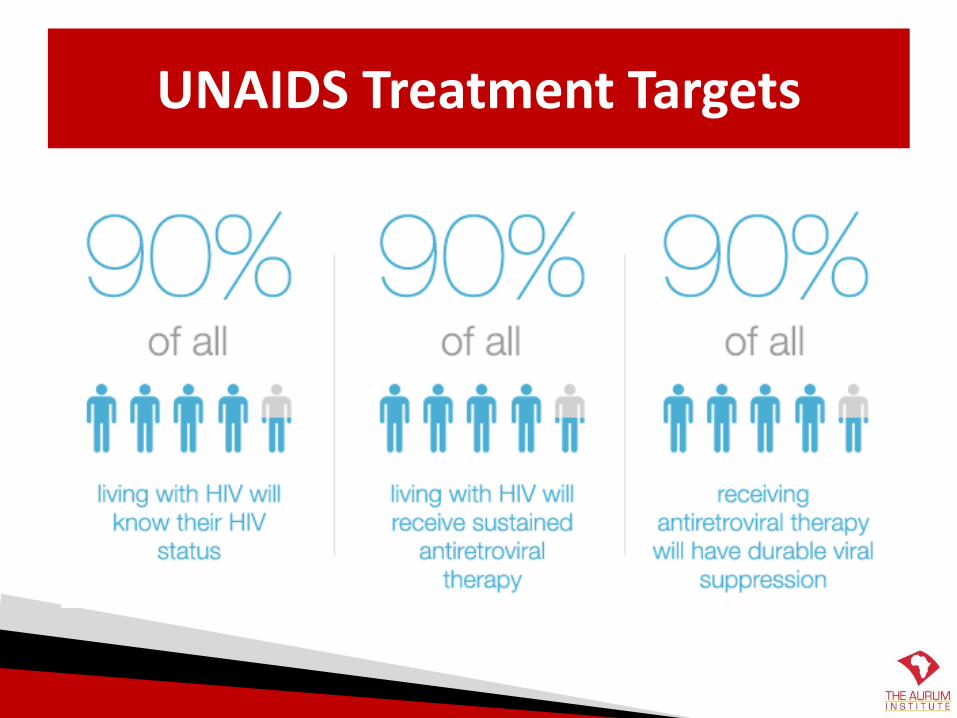
UNAIDS Treatment Targets
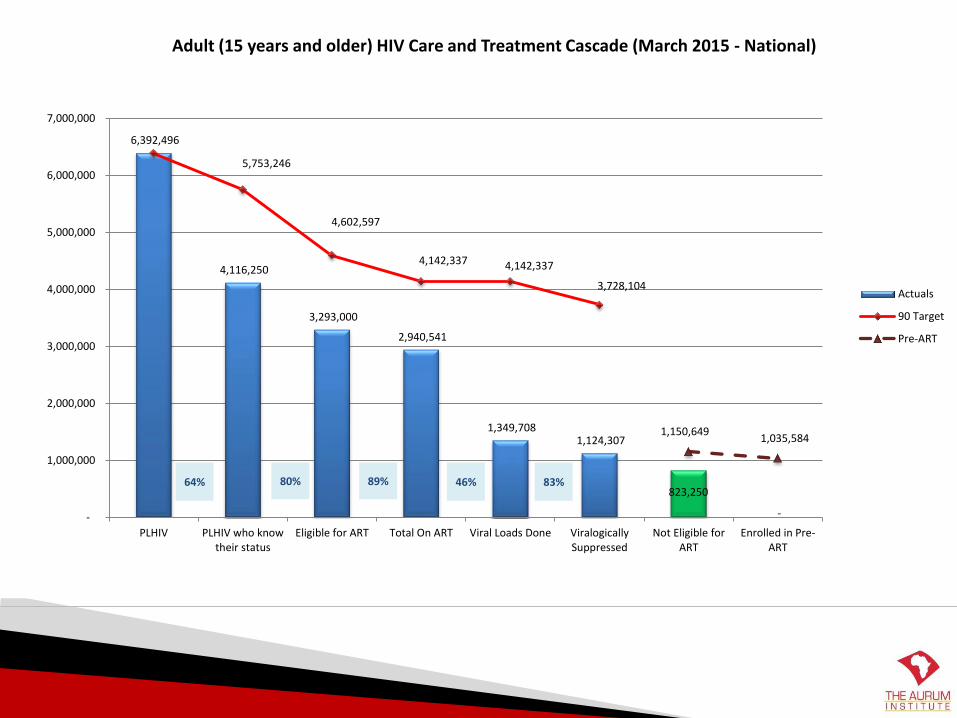
6,392,496
4,116,250
3,293,000
2,940,541
1,349,708 1,124,307
823,250
-
5,753,246
4,602,597
4,142,337 4,142,337
3,728,104
1,150,649 1,035,584
-
1,000,000
2,000,000
3,000,000
4,000,000
5,000,000
6,000,000
7,000,000
PLHIV PLHIV who knowtheir status
Eligible for ART Total On ART Viral Loads Done ViralogicallySuppressed
Not Eligible forART
Enrolled in Pre-ART
Adult (15 years and older) HIV Care and Treatment Cascade (March 2015 - National)
Actuals
90 Target
Pre-ART
64% 80% 89% 46% 83%
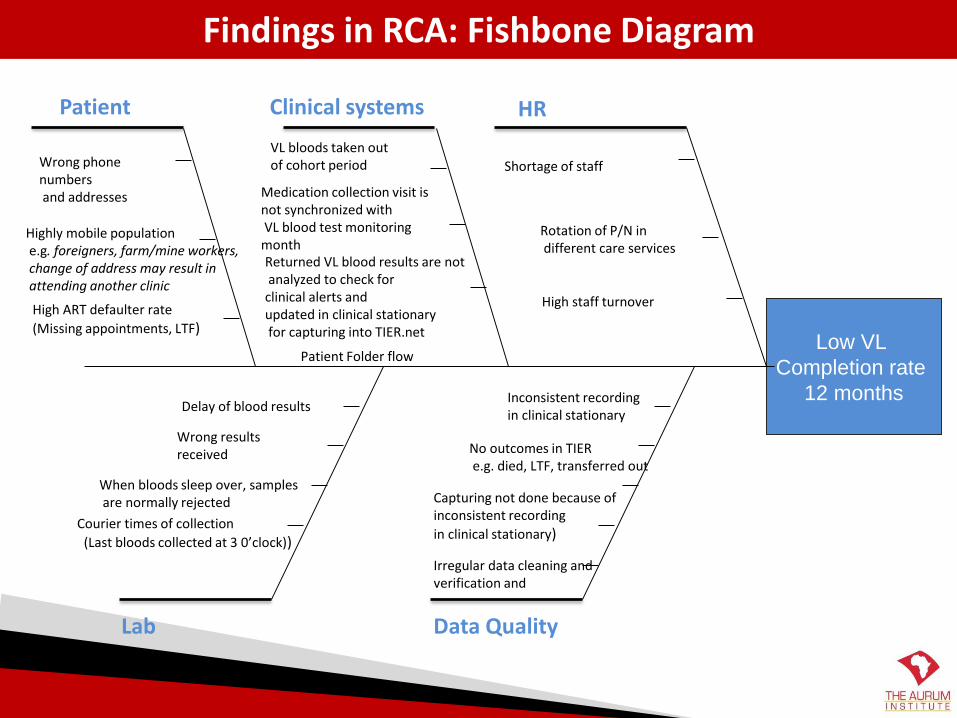
Findings in RCA: Fishbone Diagram
Low VL
Completion rate
12 months
Lab
Clinical systemsPatient
Data Quality
HR
Wrong phone numbersand addresses
Highly mobile populatione.g. foreigners, farm/mine workers,change of address may result inattending another clinic
High ART defaulter rate
(Missing appointments, LTF)
VL bloods taken out of cohort period
Medication collection visit is not synchronized withVL blood test monitoring
monthReturned VL blood results are notanalyzed to check for
clinical alerts and updated in clinical stationaryfor capturing into TIER.net
Shortage of staff
Rotation of P/N indifferent care services
Wrong results received
When bloods sleep over, samplesare normally rejected
Courier times of collection
(Last bloods collected at 3 0’clock))
Inconsistent recording in clinical stationary
No outcomes in TIERe.g. died, LTF, transferred out
Capturing not done because of inconsistent recording
in clinical stationary)
Delay of blood results
Irregular data cleaning and verification and
Patient Folder flow
High staff turnover
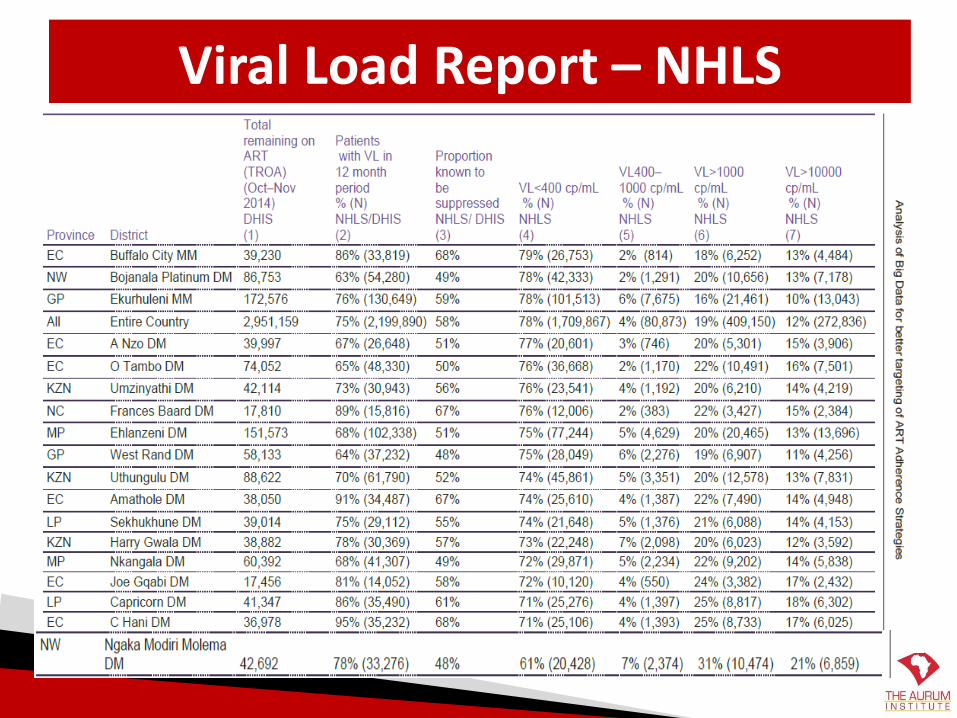
Viral Load Report – NHLS
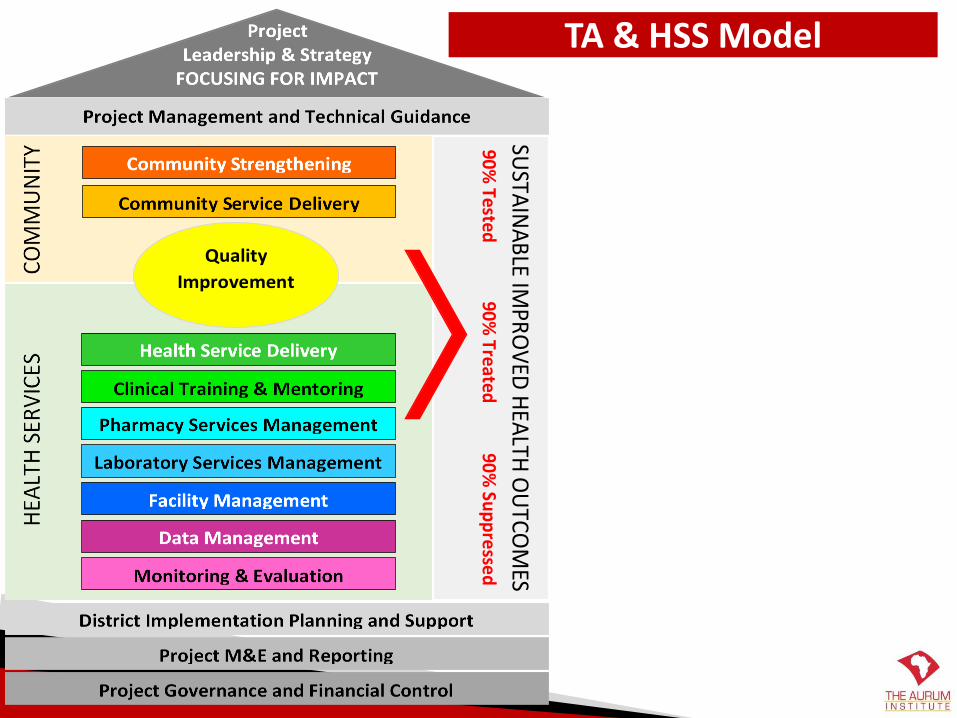
TA & HSS Model
Quality
Improvement
SUSTA
INA
BLE IM
PRO
VED
HEA
LTH O
UTCO
MES
90% Tested
90%
Treated
90% Su
pp
ressed
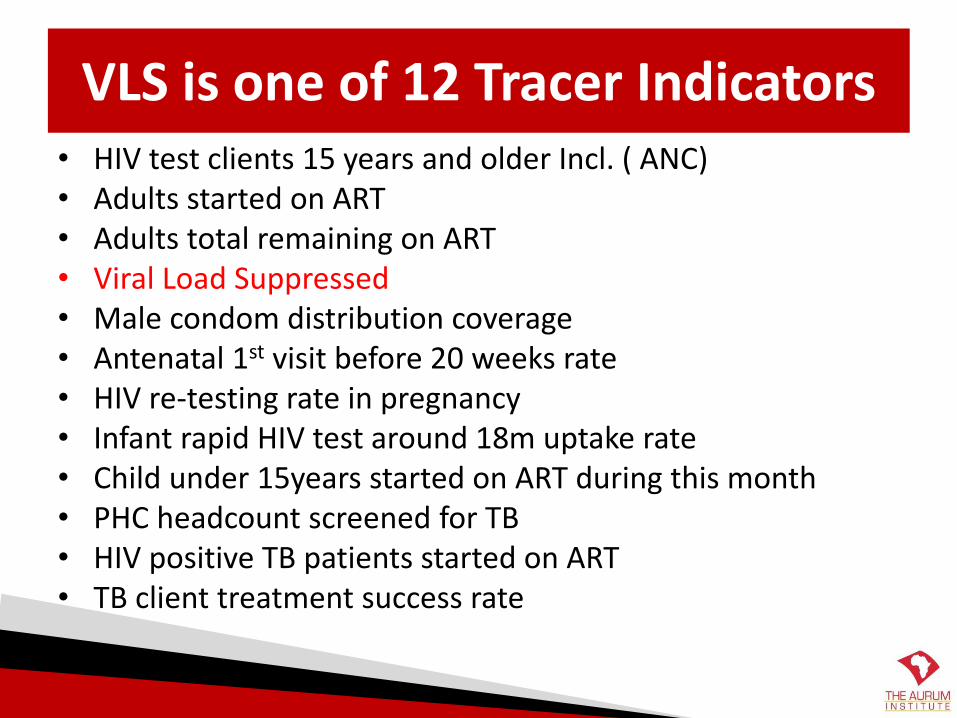
VLS is one of 12 Tracer Indicators• HIV test clients 15 years and older Incl. ( ANC)• Adults started on ART • Adults total remaining on ART• Viral Load Suppressed• Male condom distribution coverage• Antenatal 1st visit before 20 weeks rate• HIV re-testing rate in pregnancy• Infant rapid HIV test around 18m uptake rate• Child under 15years started on ART during this month • PHC headcount screened for TB • HIV positive TB patients started on ART• TB client treatment success rate
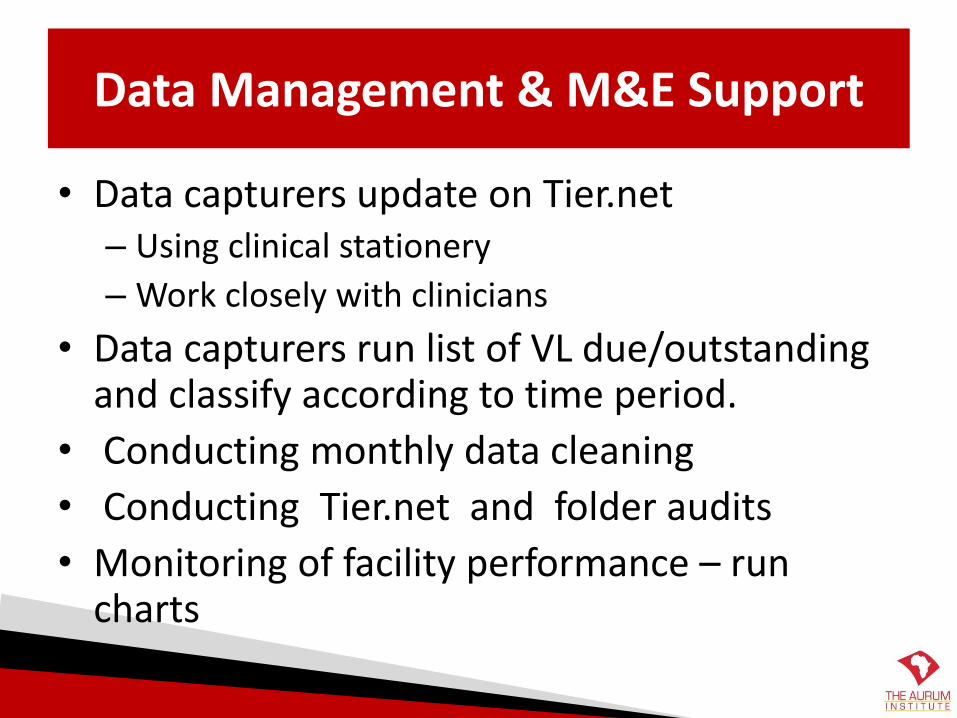
Data Management & M&E Support
• Data capturers update on Tier.net– Using clinical stationery
– Work closely with clinicians
• Data capturers run list of VL due/outstanding and classify according to time period.
• Conducting monthly data cleaning
• Conducting Tier.net and folder audits
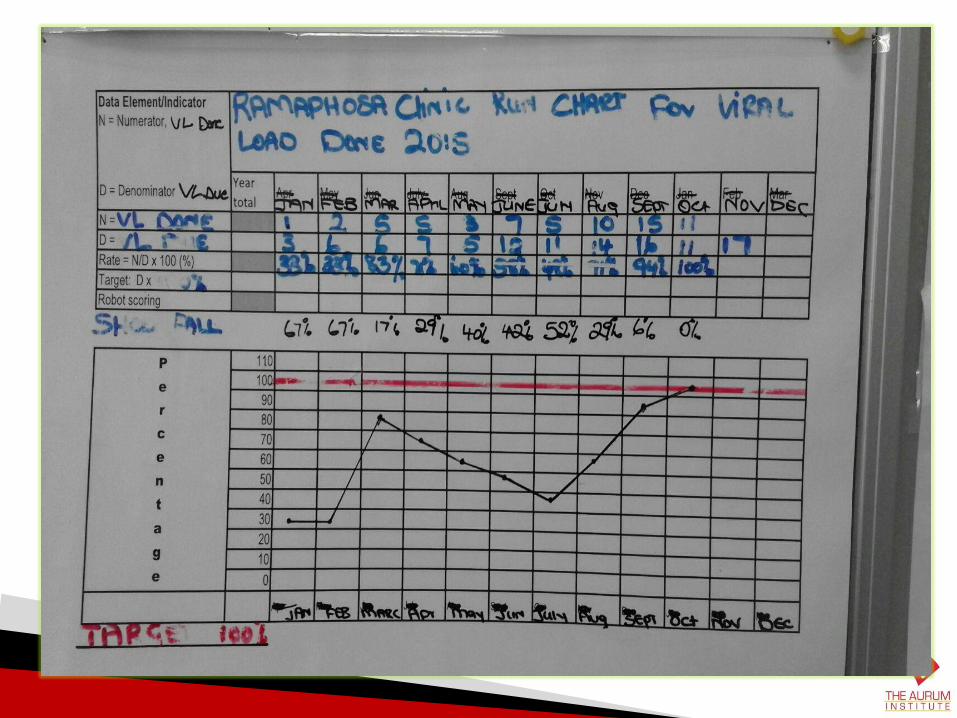
• Monitoring of facility performance – run charts
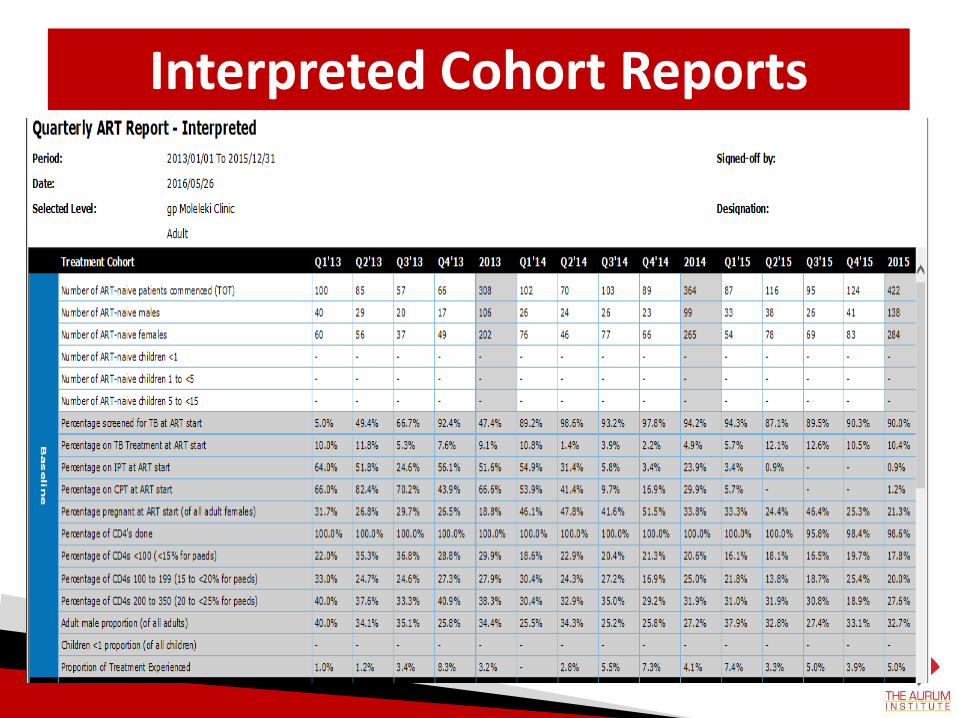
Interpreted Cohort Reports
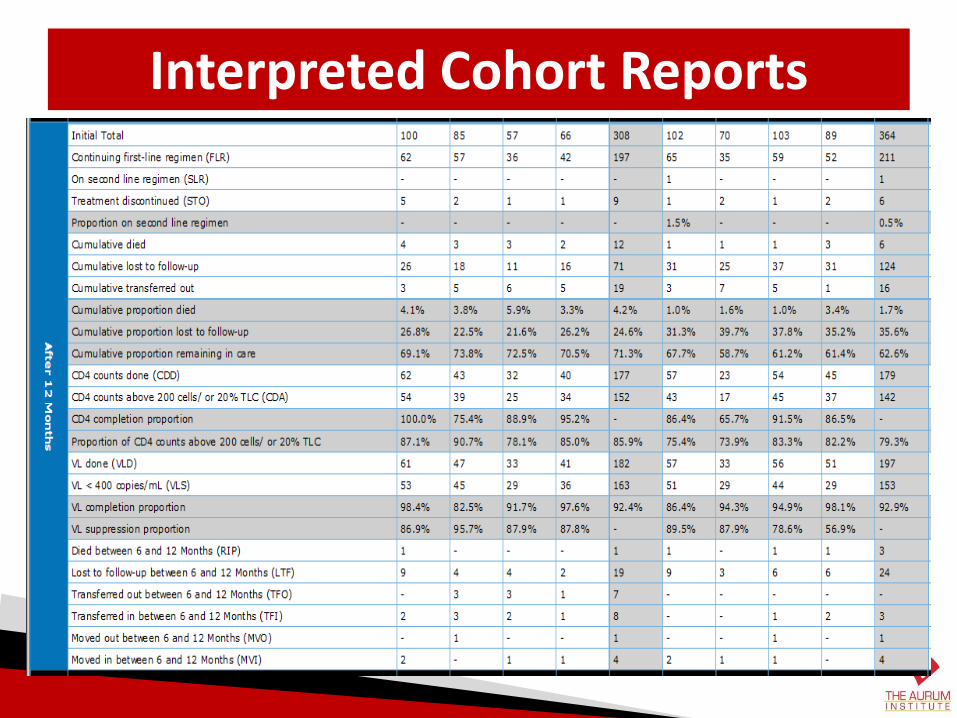
Interpreted Cohort Reports
HOW TOGuide to Quality Improvement
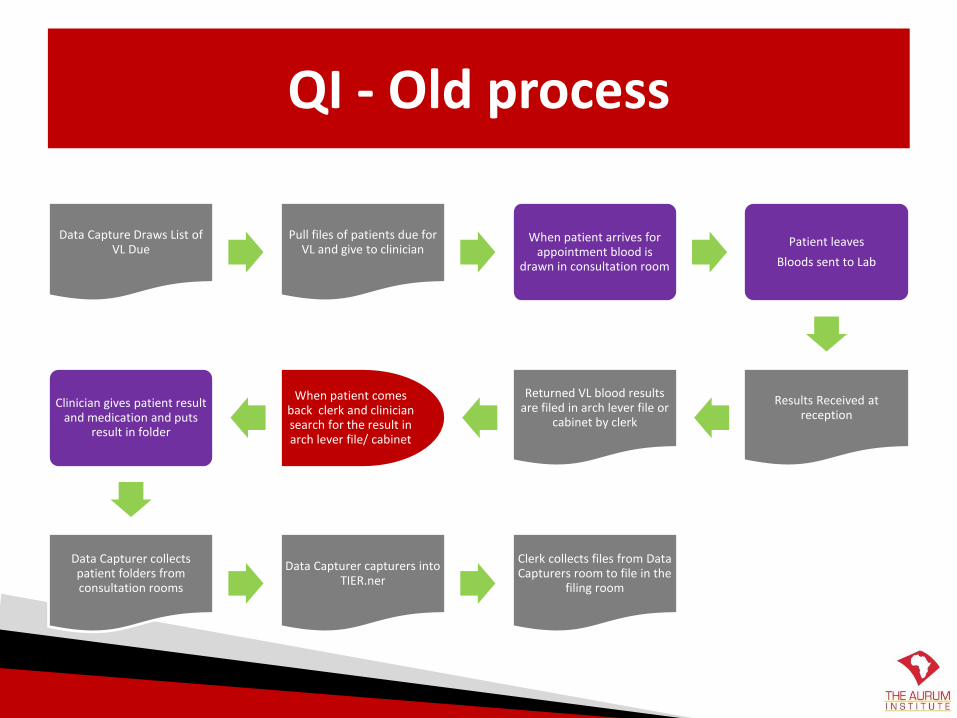
QI - Old process
Data Capture Draws List of VL Due
Pull files of patients due for VL and give to clinician
When patient arrives for appointment blood is
drawn in consultation room
Patient leaves
Bloods sent to Lab
Results Received at reception
Returned VL blood results are filed in arch lever file or
cabinet by clerk
When patient comes back clerk and clinician search for the result in arch lever file/ cabinet
Clinician gives patient result and medication and puts
result in folder
Data Capturer collects patient folders from consultation rooms
Data Capturer capturers into TIER.ner
Clerk collects files from Data Capturers room to file in the
filing room
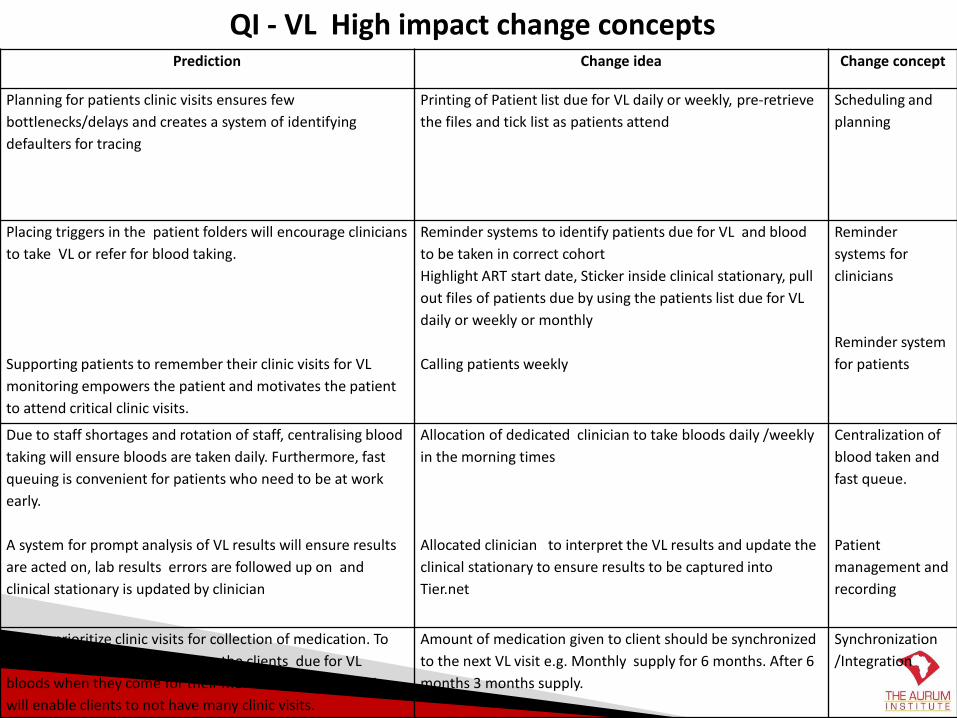
Prediction Change idea Change concept
Planning for patients clinic visits ensures few
bottlenecks/delays and creates a system of identifying
defaulters for tracing
Printing of Patient list due for VL daily or weekly, pre-retrieve
the files and tick list as patients attend
Scheduling and
planning
Placing triggers in the patient folders will encourage clinicians
to take VL or refer for blood taking.
Supporting patients to remember their clinic visits for VL
monitoring empowers the patient and motivates the patient
to attend critical clinic visits.
Reminder systems to identify patients due for VL and blood
to be taken in correct cohort
Highlight ART start date, Sticker inside clinical stationary, pull
out files of patients due by using the patients list due for VL
daily or weekly or monthly
Calling patients weekly
Reminder
systems for
clinicians
Reminder system
for patients
Due to staff shortages and rotation of staff, centralising blood
taking will ensure bloods are taken daily. Furthermore, fast
queuing is convenient for patients who need to be at work
early.
A system for prompt analysis of VL results will ensure results
are acted on, lab results errors are followed up on and
clinical stationary is updated by clinician
Allocation of dedicated clinician to take bloods daily /weekly
in the morning times
Allocated clinician to interpret the VL results and update the
clinical stationary to ensure results to be captured into
Tier.net
Centralization of
blood taken and
fast queue.
Patient
management and
recording
Clients prioritize clinic visits for collection of medication. To
ensure the system does not miss the clients due for VL
bloods when they come for their medication pick-up. This
will enable clients to not have many clinic visits.
Amount of medication given to client should be synchronized
to the next VL visit e.g. Monthly supply for 6 months. After 6
months 3 months supply.
Synchronization
/Integration
QI - VL High impact change concepts
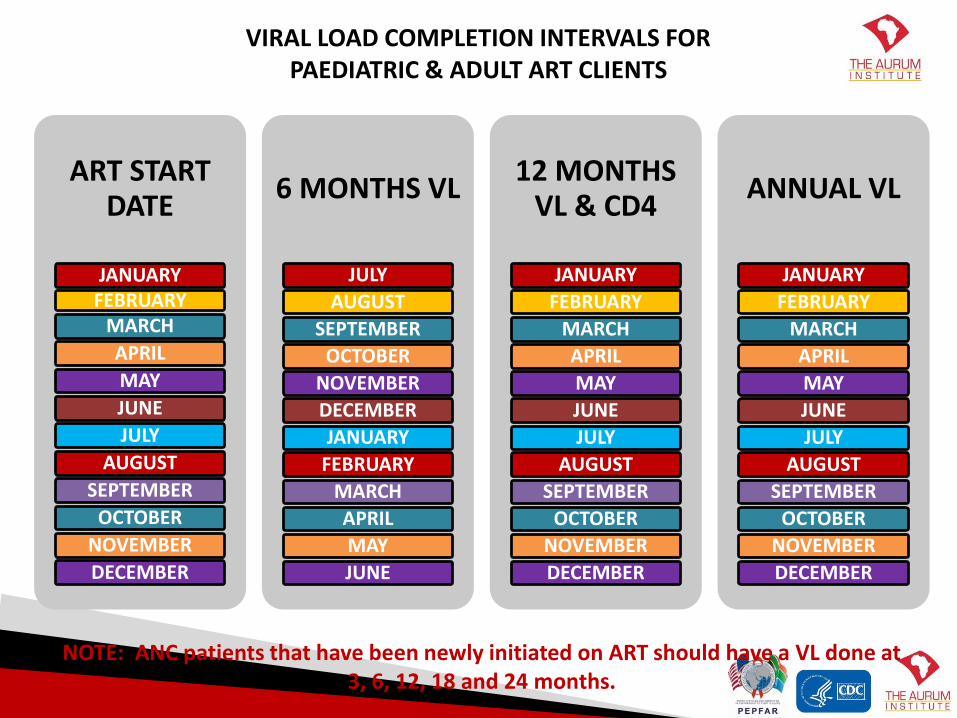
ART START DATE
JANUARYFEBRUARY
MARCH
APRIL
MAY
JUNE
JULY
AUGUST
SEPTEMBER
OCTOBER
NOVEMBER
DECEMBER
6 MONTHS VL
JULY
AUGUST
SEPTEMBER
OCTOBER
NOVEMBER
DECEMBER
JANUARY
FEBRUARY
MARCH
APRIL
MAY
JUNE
12 MONTHS VL & CD4
JANUARY
FEBRUARY
MARCH
APRIL
MAY
JUNE
JULY
AUGUST
SEPTEMBER
OCTOBER
NOVEMBER
DECEMBER
ANNUAL VL
JANUARY
FEBRUARY
MARCH
APRIL
MAY
JUNE
JULY
AUGUST
SEPTEMBER
OCTOBER
NOVEMBER
DECEMBER
VIRAL LOAD COMPLETION INTERVALS FOR PAEDIATRIC & ADULT ART CLIENTS
NOTE: ANC patients that have been newly initiated on ART should have a VL done at 3, 6, 12, 18 and 24 months.
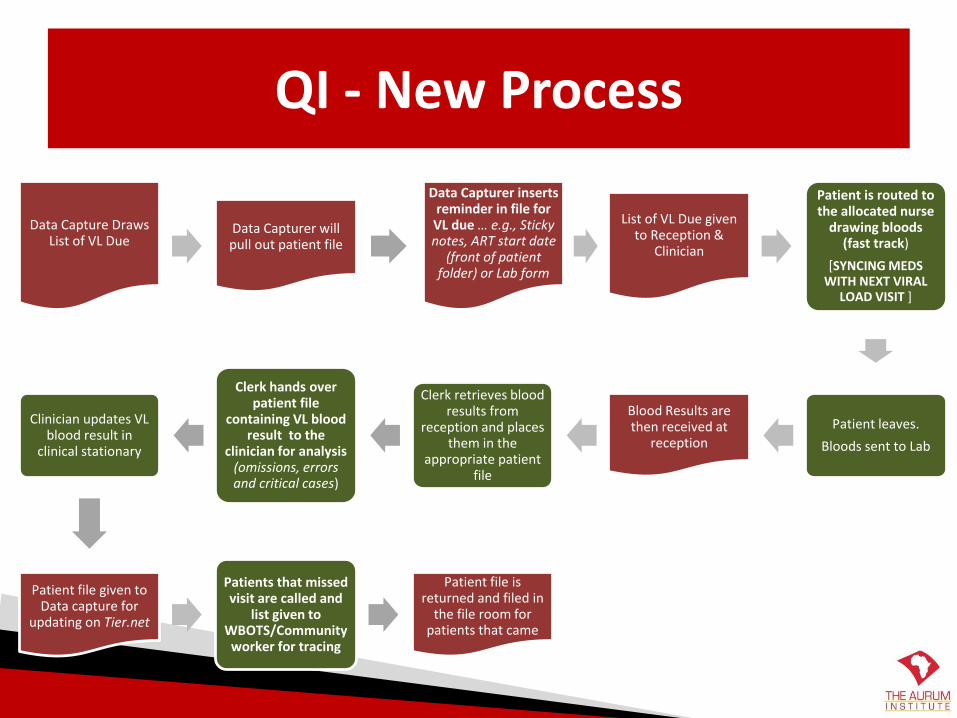
QI - New Process
Data Capture Draws List of VL Due
Data Capturer will pull out patient file
Data Capturer inserts reminder in file for VL due … e.g., Sticky notes, ART start date
(front of patient folder) or Lab form
List of VL Due given to Reception &
Clinician
Patient is routed to the allocated nurse
drawing bloods (fast track)
[SYNCING MEDS WITH NEXT VIRAL
LOAD VISIT ]
Patient leaves.
Bloods sent to Lab
Blood Results are then received at
reception
Clerk retrieves blood results from
reception and places them in the
appropriate patient file
Clerk hands over patient file
containing VL blood result to the
clinician for analysis (omissions, errors and critical cases)
Clinician updates VL blood result in
clinical stationary
Patient file given to Data capture for
updating on Tier.net
Patients that missed visit are called and
list given to WBOTS/Community worker for tracing
Patient file is returned and filed in
the file room for patients that came
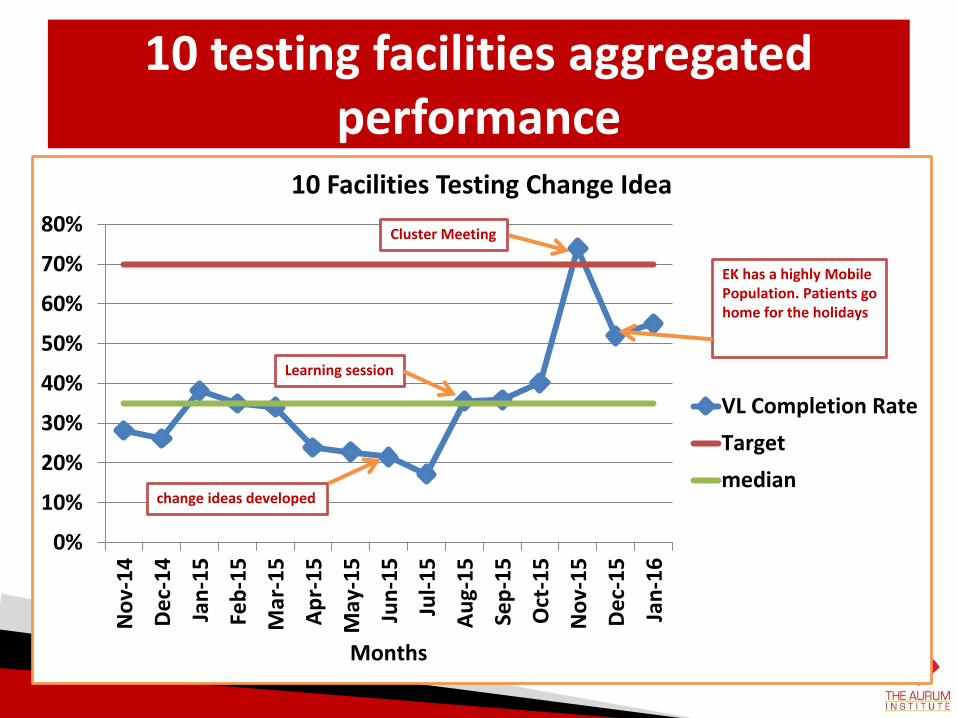
10 testing facilities aggregated performance
0%
10%
20%
30%
40%
50%
60%
70%
80%
No
v-1
4
Dec
-14
Jan
-15
Feb
-15
Mar
-15
Ap
r-1
5
May
-15
Jun
-15
Jul-
15
Au
g-1
5
Sep
-15
Oct
-15
No
v-1
5
Dec
-15
Jan
-16
Months
10 Facilities Testing Change Idea
VL Completion Rate
Target
medianchange ideas developed
Learning session
Cluster Meeting
EK has a highly MobilePopulation. Patients gohome for the holidays
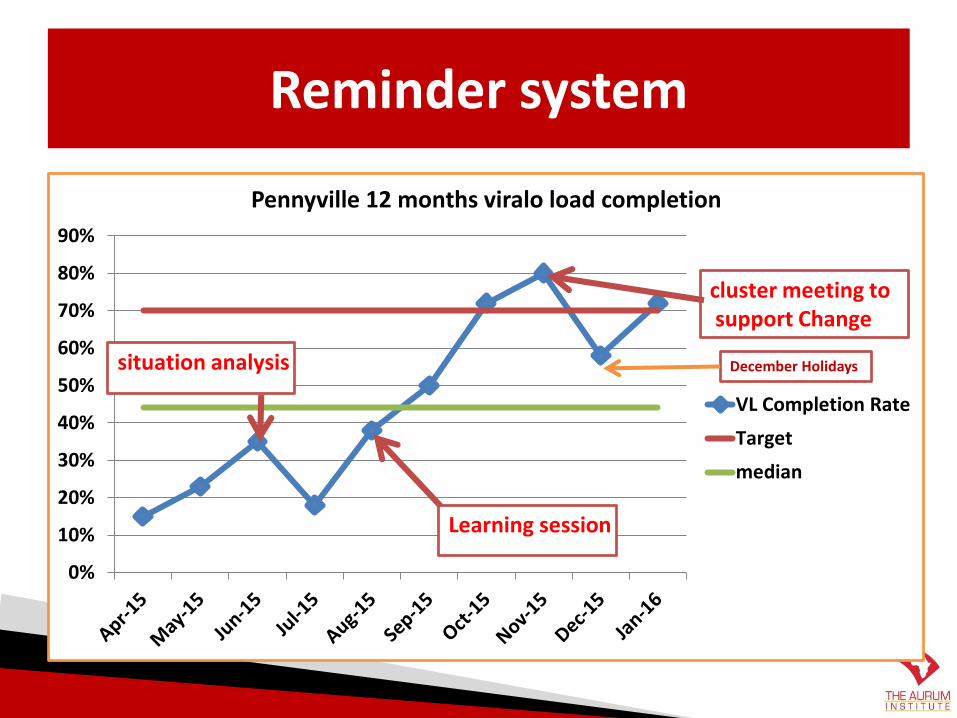
Reminder system
0%
10%
20%
30%
40%
50%
60%
70%
80%
90%
Pennyville 12 months viralo load completion
VL Completion Rate
Target
median
situation analysis
Learning session
cluster meeting tosupport Change
December Holidays
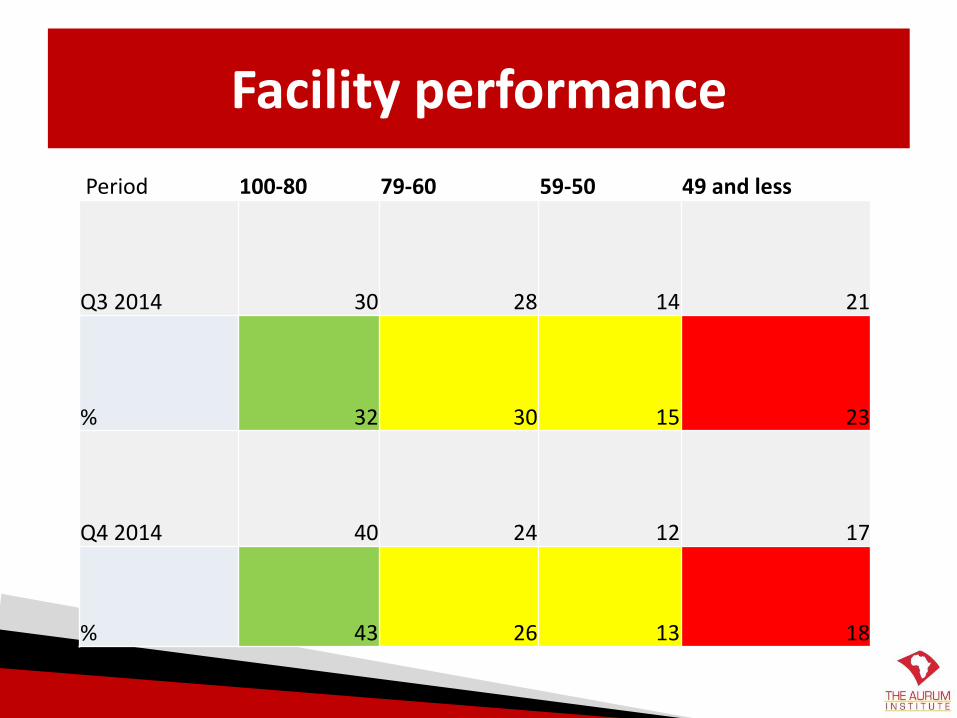
Facility performance
Period 100-80 79-60 59-50 49 and less
Q3 2014 30 28 14 21
% 32 30 15 23
Q4 2014 40 24 12 17
% 43 26 13 18
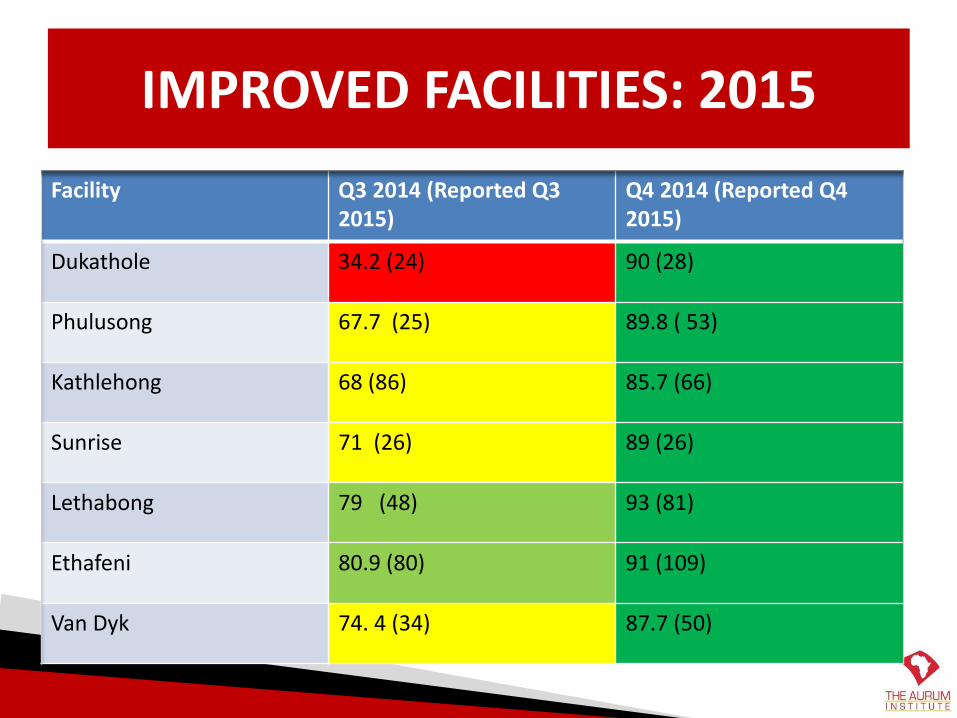
IMPROVED FACILITIES: 2015
Facility Q3 2014 (Reported Q3 2015)
Q4 2014 (Reported Q4 2015)
Dukathole 34.2 (24) 90 (28)
Phulusong 67.7 (25) 89.8 ( 53)
Kathlehong 68 (86) 85.7 (66)
Sunrise 71 (26) 89 (26)
Lethabong 79 (48) 93 (81)
Ethafeni 80.9 (80) 91 (109)
Van Dyk 74. 4 (34) 87.7 (50)
Recommendations and Conclusion
• Ekurhuleni is improving viral loads done– Increase efforts to reach over 80% VLD in all facilities and
sustain improvements
• Combination of interventions – Data Management & M&E, QI
• Use of Data– Facility level monitoring – Cohort Data Analysis
• Viral Load Road Shows– Include patients
• Updating patients contact details every visit is improtant
Key Messages
• Use of TIER reports and run charts at facility level important.
• Teamwork at facility level – Clinicians and Data Capturers – Empowering data capturers
• Cohort Data Analysis and feedback at district quarterly reviews – TA support at district and provincial level
• Empowering and education of patients – Tools and Games
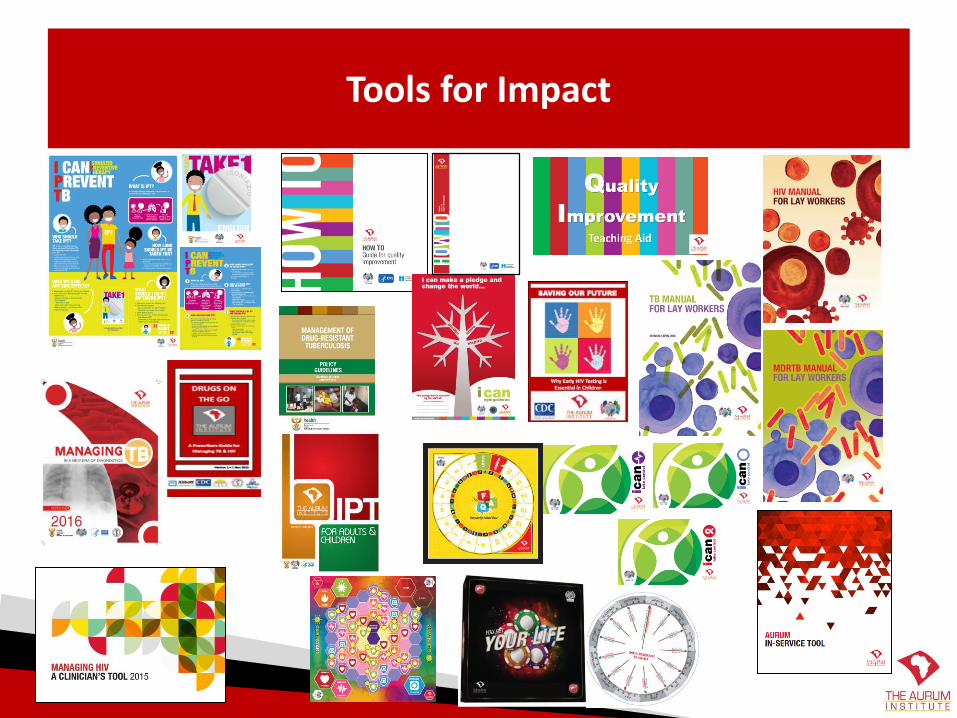
Tools for Impact
Acknowledgements
• Gauteng DOH – Ekurhuleni District
• Ekurhuleni Metro Municipality
• GDOH & EMM Facility staff
• Aurum Staff
• SEAD Staff
• Patients
• BroadReach
• PEPFAR and CDC