Embed Size (px)
Citation preview
366 Chapter 9 Tables, Graphs, and Functions
STATE STANDARDS
MA.6.A.3.6
S
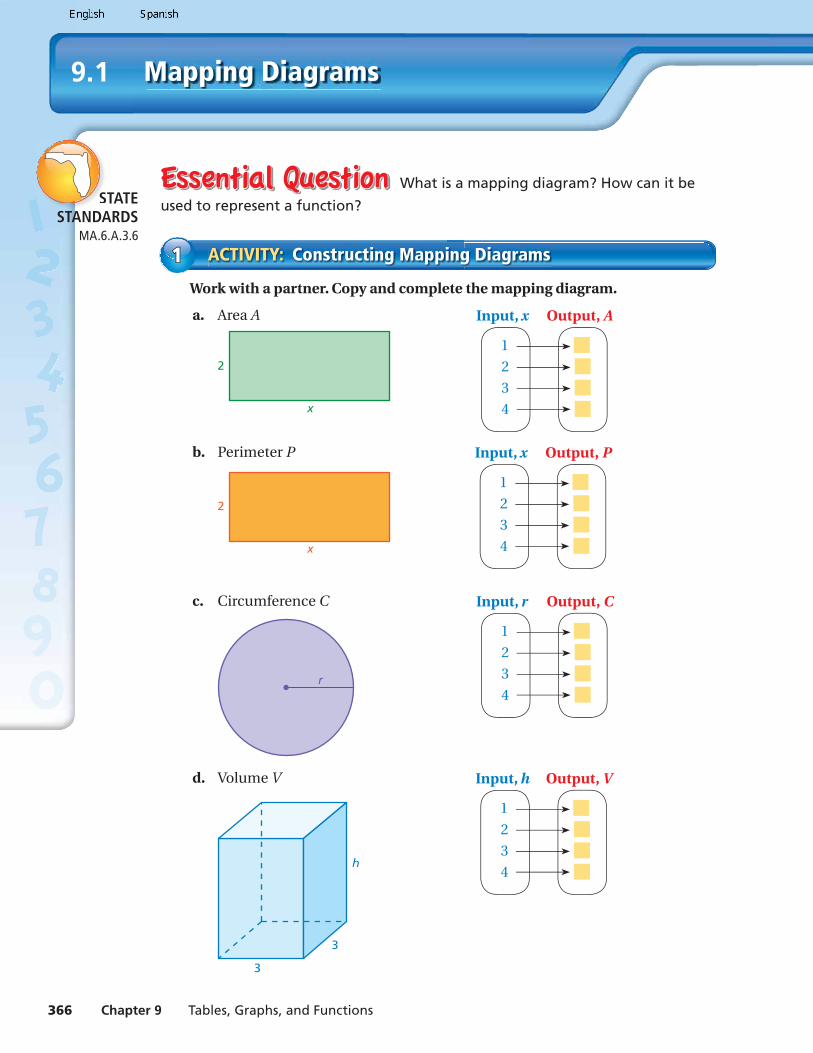
Mapping Diagrams9.1
What is a mapping diagram? How can it be
used to represent a function?
Work with a partner. Copy and complete the mapping diagram.
a. Area A
2
x
b. Perimeter P
2
x
c. Circumference C
r
d. Volume V
3
3
h
ACTIVITY: Constructing Mapping Diagrams11
1
2
3
4
Input, x Output, A
1
2
3
4
Input, x Output, P
1
2
3
4
Input, r Output, C
1
2
3
4
Input, h Output, V
Section 9.1 Mapping Diagrams 367
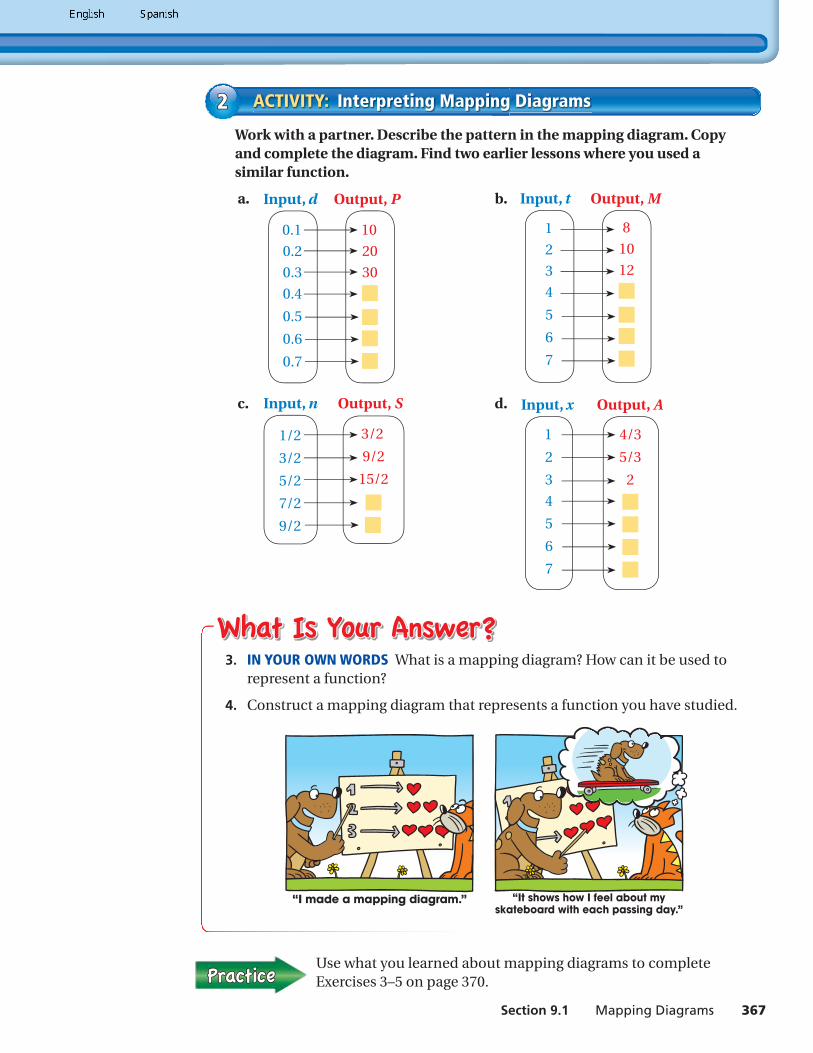
Work with a partner. Describe the pattern in the mapping diagram. Copy and complete the diagram. Find two earlier lessons where you used a similar function.
a. b.
c. d.
ACTIVITY: Interpreting Mapping Diagrams22
3. IN YOUR OWN WORDS What is a mapping diagram? How can it be used to represent a function?
4. Construct a mapping diagram that represents a function you have studied.
Use what you learned about mapping diagrams to complete Exercises 3–5 on page 370.
10
20
30
0.1
0.2
0.3
0.4
0.5
0.6
0.7
Input, d Output, P
3/2
9/2
15/2
1/2
3/2
5/2
7/2
9/2
Input, n Output, S
8
10
12
1
2
3
4
5
6
7
Input, t Output, M
4/3
5/3
2
1
2
3
4
5
6
7
Input, x Output, A
“I made a mapping diagram.” “It shows how I feel about my skateboard with each passing day.”
368 Chapter 9 Tables, Graphs, and Functions
Lesson9.1
Key Vocabularyinput, p. 368output, p. 368function, p. 368mapping diagram, p. 368
Functions and Mapping Diagrams
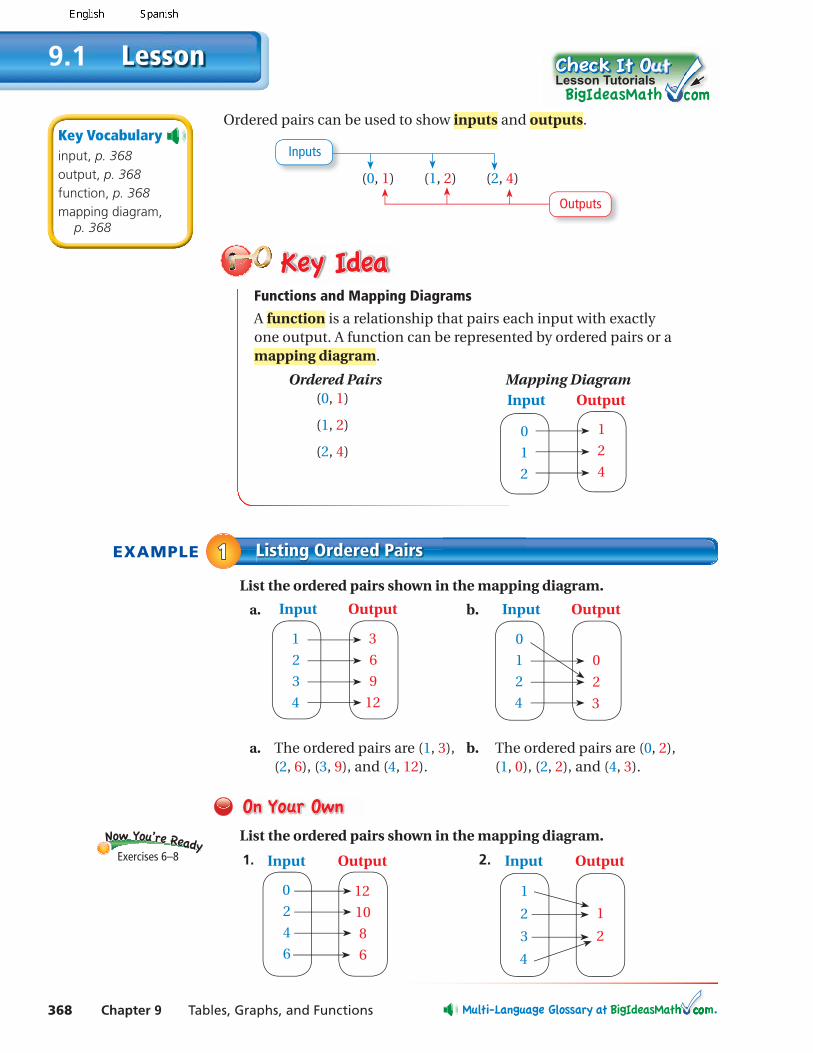
A function is a relationship that pairs each input with exactly one output. A function can be represented by ordered pairs or a mapping diagram.
Ordered Pairs Mapping Diagram (0, 1)
(1, 2)
(2, 4)
EXAMPLE Listing Ordered Pairs11List the ordered pairs shown in the mapping diagram.
a. b.
a. The ordered pairs are (1, 3), b. The ordered pairs are (0, 2), (2, 6), (3, 9), and (4, 12). (1, 0), (2, 2), and (4, 3).
List the ordered pairs shown in the mapping diagram.
1. 2.
Ordered pairs can be used to show inputs and outputs.
(0, 1) (1, 2) (2, 4)
Inputs
Outputs
Exercises 6–8
1
2
4
0
1
2
Input Output
3
6
9
12
1
2
3
4
Input Output
0
2
3
0
1
2
4
Input Output
12
10
8
6
0
2
4
6
Input Output
1
2
1
2
3
4
Input Output
Lesson Tutorials

Section 9.1 Mapping Diagrams 369
EXAMPLE Drawing a Mapping Diagram22Draw a mapping diagram of (0, 4), (2, 6), (3, 5), and (5, 9).
List the inputs and outputs in order from least to greatest.
Inputs: 0, 2, 3, 5
Outputs: 4, 5, 6, 9
Draw arrows from the inputs to their outputs.
EXAMPLE Describing a Mapping Diagram33Describe the pattern of inputs and outputs in the mapping diagram.
Look at the relationship between the inputs and outputs.
As each input increases by 1, the output increases by 15.
3. Draw a mapping diagram of (1, 2), (2, 4), (5, 3), and (8, 1).
4. Describe the pattern of inputs and outputs in the mapping diagram shown.
EXAMPLE Real-Life Application44The table shows the number of songs played by four bands at a festival and the amount of time each band played. Use the table to draw a mapping diagram.
Let the number of songs played be the inputs and the times onstage be the outputs.
Inputs: 7, 8, 10, 14
Outputs: 45, 60, 90
5. WHAT IF? In Example 4, a fi fth band plays 12 songs and is onstage for 70 minutes. Draw a mapping diagram for the fi ve bands.
Number of Songs Played
Time Onstage (minutes)
8 45
10 60
7 45
14 90
Exercises 9–17
4
5
6
9
0
2
3
5
Input Output
15
30
45
60
1
2
3
4
Input Output
12
9
6
3
2
4
6
8
Input Output
45
60
90
7
8
10
14
Input Output
15
30
45
60
1
2
3
4
Input Output
+15 +1
+1
+1
+15
+15
Exercises9.1
9+(-6)=3
3+(-3)=
4+(-9)=
9+(-1)=
370 Chapter 9 Tables, Graphs, and Functions
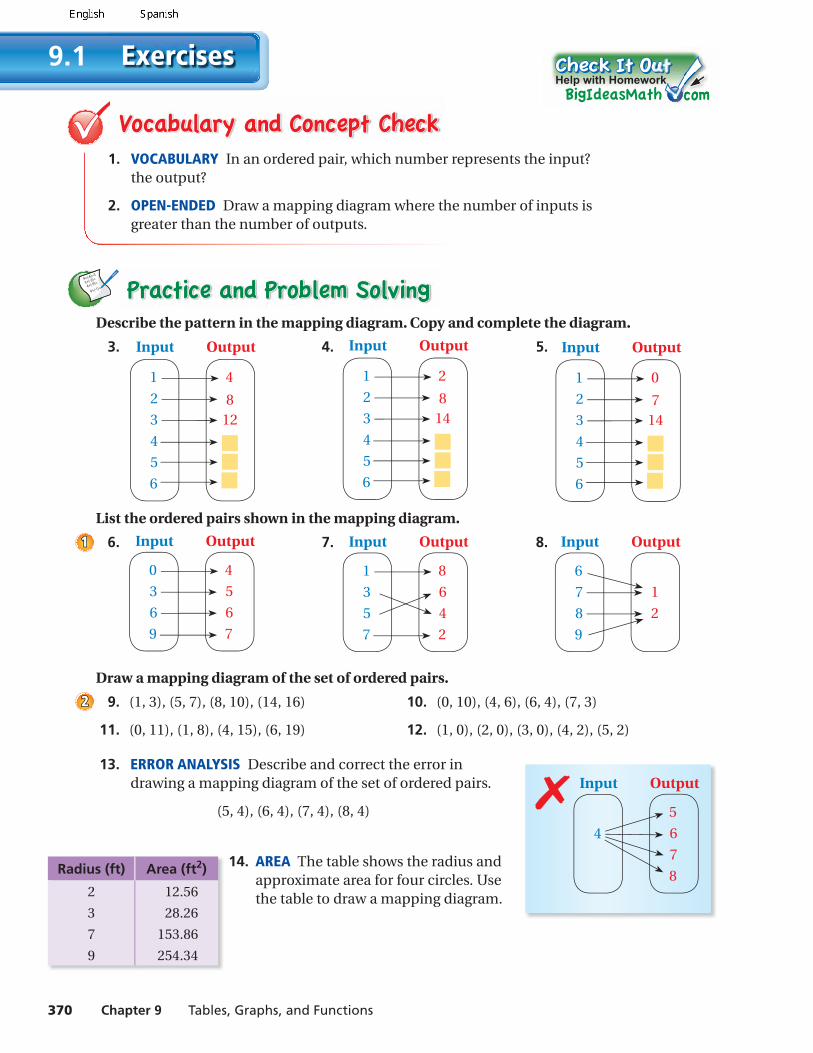
1. VOCABULARY In an ordered pair, which number represents the input? the output?
2. OPEN-ENDED Draw a mapping diagram where the number of inputs is greater than the number of outputs.
Describe the pattern in the mapping diagram. Copy and complete the diagram.
3. 4. 5.
List the ordered pairs shown in the mapping diagram.
6. 7. 8.
Draw a mapping diagram of the set of ordered pairs.
9. (1, 3), (5, 7), (8, 10), (14, 16) 10. (0, 10), (4, 6), (6, 4), (7, 3)
11. (0, 11), (1, 8), (4, 15), (6, 19) 12. (1, 0), (2, 0), (3, 0), (4, 2), (5, 2)
13. ERROR ANALYSIS Describe and correct the error in drawing a mapping diagram of the set of ordered pairs.
(5, 4), (6, 4), (7, 4), (8, 4)
14. AREA The table shows the radius and approximate area for four circles. Use the table to draw a mapping diagram.
11
22
Radius (ft) Area (ft2)
2 12.56
3 28.26
7 153.86
9 254.34
4
812
1
2
3
4
5
6
Input Output
2
814
1
2
3
4
5
6
Input Output
0
714
1
2
3
4
5
6
Input Output
4
5
6
7
0
3
6
9
Input Output
8
6
4
2
1
3
5
7
Input Output
1
2
6
7
8
9
Input Output
✗5
6
7
8
4
Input Output
Help with Homework

Section 9.1 Mapping Diagrams 371
Write the word sentence as an equation. Then solve.
21. The sum of a number x and 7 is 15. 22. 3 times a number n is 24.
23. MULTIPLE CHOICE Which inequality represents the word sentence?
“The sum of a number x and 7 is at least 25.”
○A x + 7 > 25 ○B x + 7 ≤ 25 ○C x + 7 ≥ 25 ○D x + 7 < 25
Draw a mapping diagram for the graph. Then describe the pattern of inputs and outputs.
15.
x
y
1 2 3
1
2
3
4 5 6 7
4
5
6
7
00
16.
x
y
82 10
8
2
10
4 126 14
4
12
6
14
00
17.
x
y
1 2 3
5
10
15
4 5 6 7
20
25
30
35
980
0
18. SCUBA DIVING The normal pressure at sea level is one atmosphere of pressure (1 ATM). As you dive below sea level, the pressure increases by 1 ATM for each 10 meters of depth.
a. Complete the mapping diagram.
b. List the ordered pairs. Then graph the ordered pairs in a coordinate plane.
c. Compare the mapping diagram and graph. Which do you prefer? Why?
d. RESEARCH What are common depths for people who are just learning to scuba dive? What are common depths for experienced scuba divers?
19. MOVIES A store sells previously viewed movies. The table shows the cost of buying 1, 2, 3, or 4 movies.
a. Use the table to draw a mapping diagram.
b. Describe the pattern. How does the cost per movie change as you buy more movies?
20. The table shows the outputs for several inputs.
What do you think the output would be for an input of 200? Explain.
Movies Cost
1 $10
2 $18
3 $24
4 $28
33
1 ATM
2 ATM
0 m
10 m
20 m
30 m
40 m
50 m
Input OutputDepth Pressure
Input, x 0 1 2 3 4
Output, y 25 30 35 40 45