Embed Size (px)
Citation preview
4
ENERGY
PURPOSE
The purpose of this lab is to investigate energy and how it is applied to motion.
SIMULATIONS
Energy Skate Park
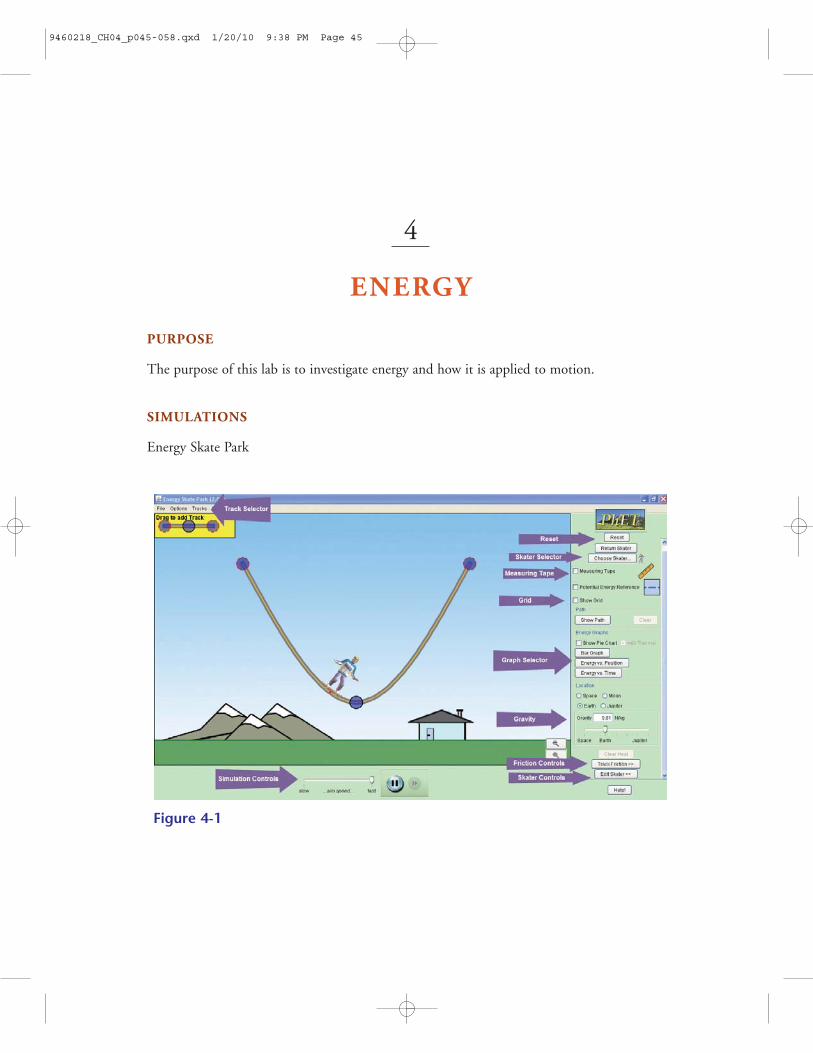
Figure 4-1
9460218_CH04_p045-058.qxd 1/20/10 9:38 PM Page 45
l a b 446
Feature Control
Figure 4-1
Track Selector Click on the Track selector and pick one of the following track types:
• Loop • Double Well• Double Well (Roller Coaster)• Friction Parabola• Jump• S-Curve• Fly Off (bug)
Reset This resets the simulation to default values and sets the track to FrictionParabola track.
Skater Selector Clicking on Choose Skater will allow you to choose a skateboarder with a different mass.
Measuring Tape Check the Measuring Tape box when you want to make measurements. A tape measure appears on the screen, which you can manipulate withinthe simulation.
Grid Check Show Grid if you want grid lines to appear on the screen. This willmake it easier for you to estimate measurements.
Graph Selector Click on the following buttons if you would like a graph that depicts rela-tionships among kinetic, potential, and thermal energy of the simulation.Click them off if you want to hide them. The only graph that you will usefor this simulation is the Energy vs. Time graph.
• Bar Graph• Energy vs. Position• Energy vs. Time
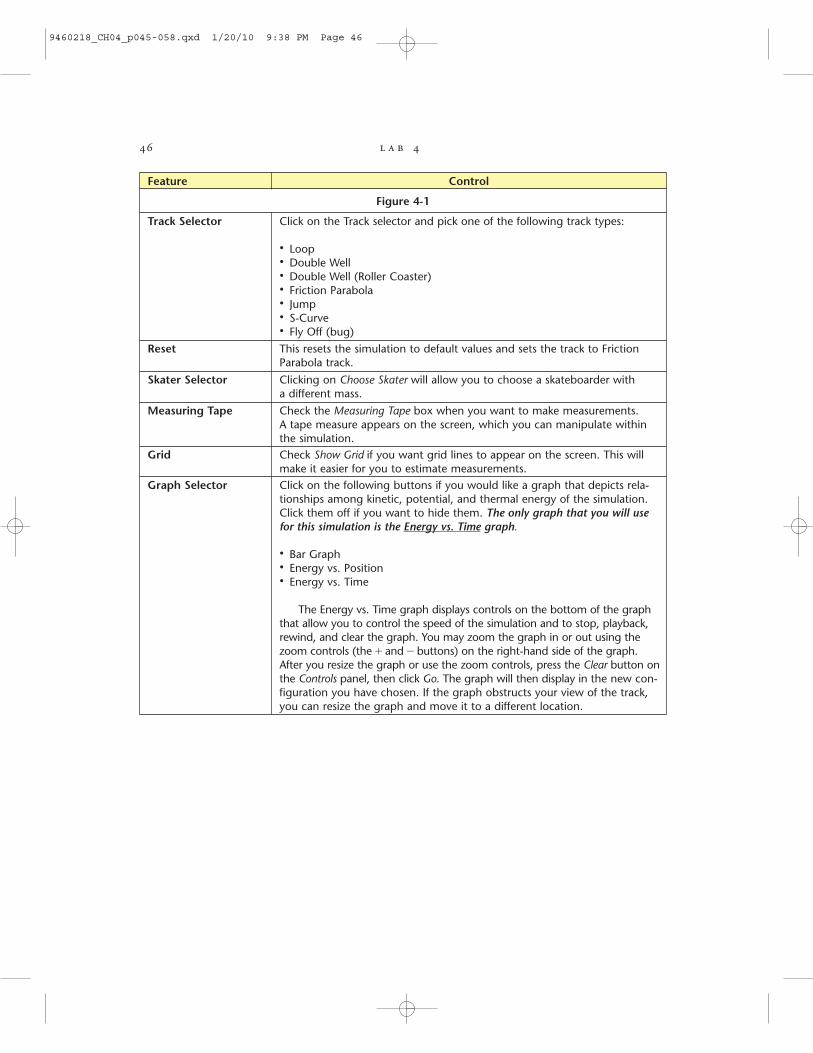
The Energy vs. Time graph displays controls on the bottom of the graphthat allow you to control the speed of the simulation and to stop, playback,rewind, and clear the graph. You may zoom the graph in or out using thezoom controls (the + and - buttons) on the right-hand side of the graph.After you resize the graph or use the zoom controls, press the Clear button onthe Controls panel, then click Go. The graph will then display in the new con-figuration you have chosen. If the graph obstructs your view of the track,you can resize the graph and move it to a different location.
9460218_CH04_p045-058.qxd 1/20/10 9:38 PM Page 46
e n e r g y 47
Feature Control
Figure 4-2Clear Heat For this lab, the coefficient of friction must be zero. If your Coefficient of
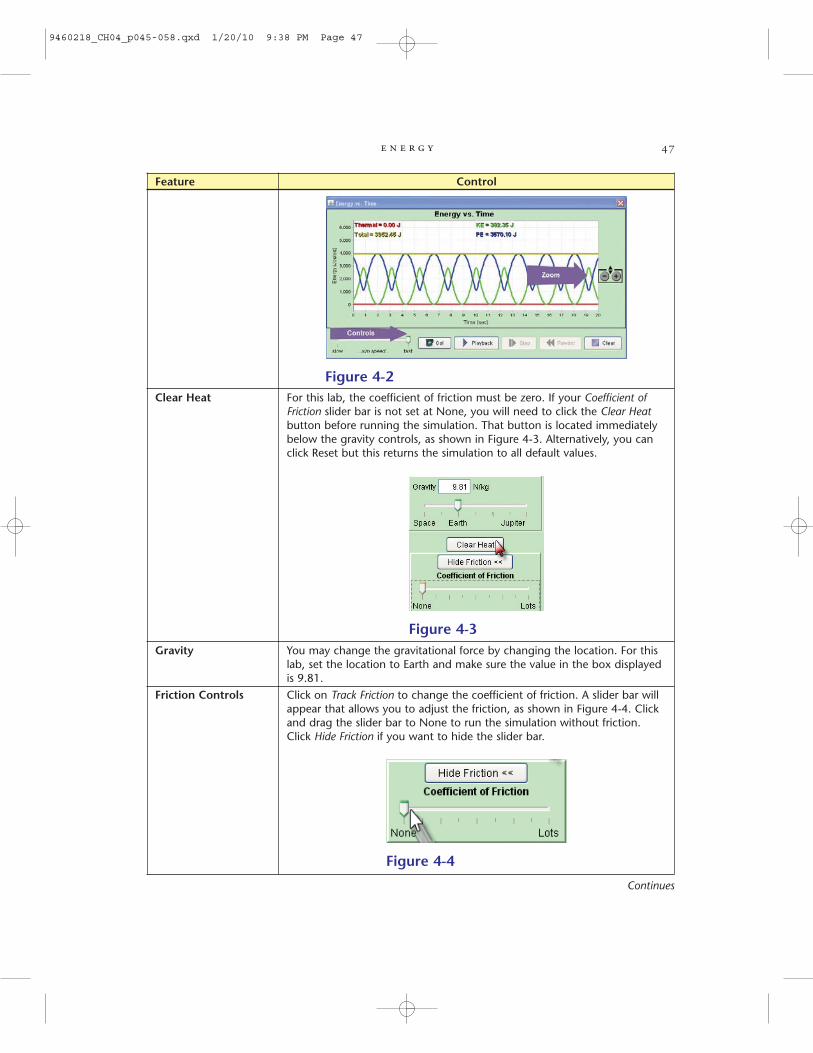
Friction slider bar is not set at None, you will need to click the Clear Heat button before running the simulation. That button is located immediatelybelow the gravity controls, as shown in Figure 4-3. Alternatively, you canclick Reset but this returns the simulation to all default values.
Figure 4-3Gravity You may change the gravitational force by changing the location. For this
lab, set the location to Earth and make sure the value in the box displayedis 9.81.
Friction Controls Click on Track Friction to change the coefficient of friction. A slider bar willappear that allows you to adjust the friction, as shown in Figure 4-4. Clickand drag the slider bar to None to run the simulation without friction.Click Hide Friction if you want to hide the slider bar.
Figure 4-4
Continues
9460218_CH04_p045-058.qxd 1/20/10 9:38 PM Page 47
l a b 448
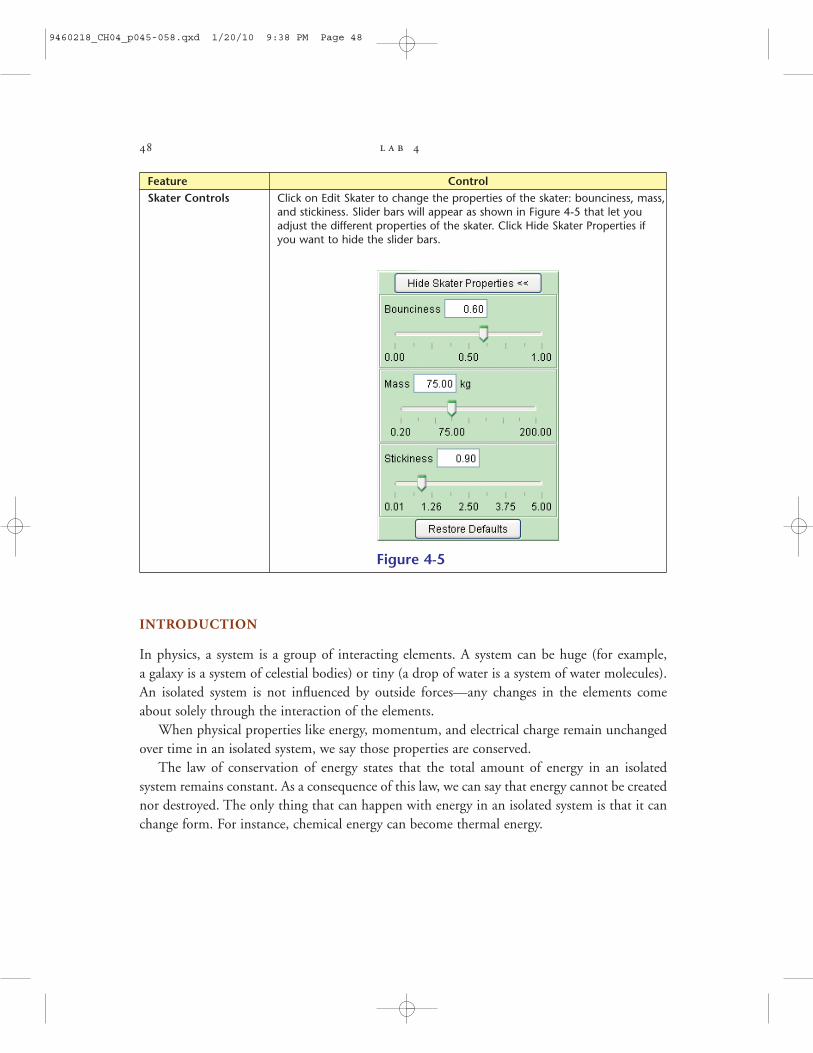
Feature ControlSkater Controls Click on Edit Skater to change the properties of the skater: bounciness, mass,
and stickiness. Slider bars will appear as shown in Figure 4-5 that let youadjust the different properties of the skater. Click Hide Skater Properties ifyou want to hide the slider bars.
Figure 4-5
INTRODUCTION
In physics, a system is a group of interacting elements. A system can be huge (for example, a galaxy is a system of celestial bodies) or tiny (a drop of water is a system of water molecules).An isolated system is not influenced by outside forces—any changes in the elements comeabout solely through the interaction of the elements.
When physical properties like energy, momentum, and electrical charge remain unchangedover time in an isolated system, we say those properties are conserved.
The law of conservation of energy states that the total amount of energy in an isolated system remains constant. As a consequence of this law, we can say that energy cannot be creatednor destroyed. The only thing that can happen with energy in an isolated system is that it canchange form. For instance, chemical energy can become thermal energy.
9460218_CH04_p045-058.qxd 1/20/10 9:38 PM Page 48
In mechanics, conservation of energy is usually stated as conservation of the total mechanical energy. Total mechanical energy is the sum of an object’s kinetic energy and itspotential energy:
where E is the total mechanical energy, K.E. is the kinetic energy, and P.E. is the potential energyWe can calculate the kinetic and potential energy of an object using these equations:
where m is mass and v is velocity
where m is mass in kilograms, g is gravitational acceleration in m/s2, and h is height in metersA conservative system is one in which no energy is dissipated. Therefore, the total mechan-
ical energy remains constant. Work (which is the transfer of energy) done by a force in a conservative system is independent of path and completely reversible. For example, the forcerequired to change the potential energy of the object by moving it does not depend on the pathtaken. The potential energy is also completely reversible—just move the object back.
Contrast a conservative system with a system involving friction—the work done to getbetween states does depend on the path taken and is not reversible. Systems that involve frictionare examples of open dissipative systems operating far from thermodynamic equilibrium in anenvironment where they exchange energy and matter.
In this lab, you will investigate these concepts by measuring the energy of objects as theymove in a gravitational field in an isolated system with both conservative and non-conservativeforces at work.
PROCEDURES
Part 1: Friction Parabola Track
1. Apply the following settings for the simulation:
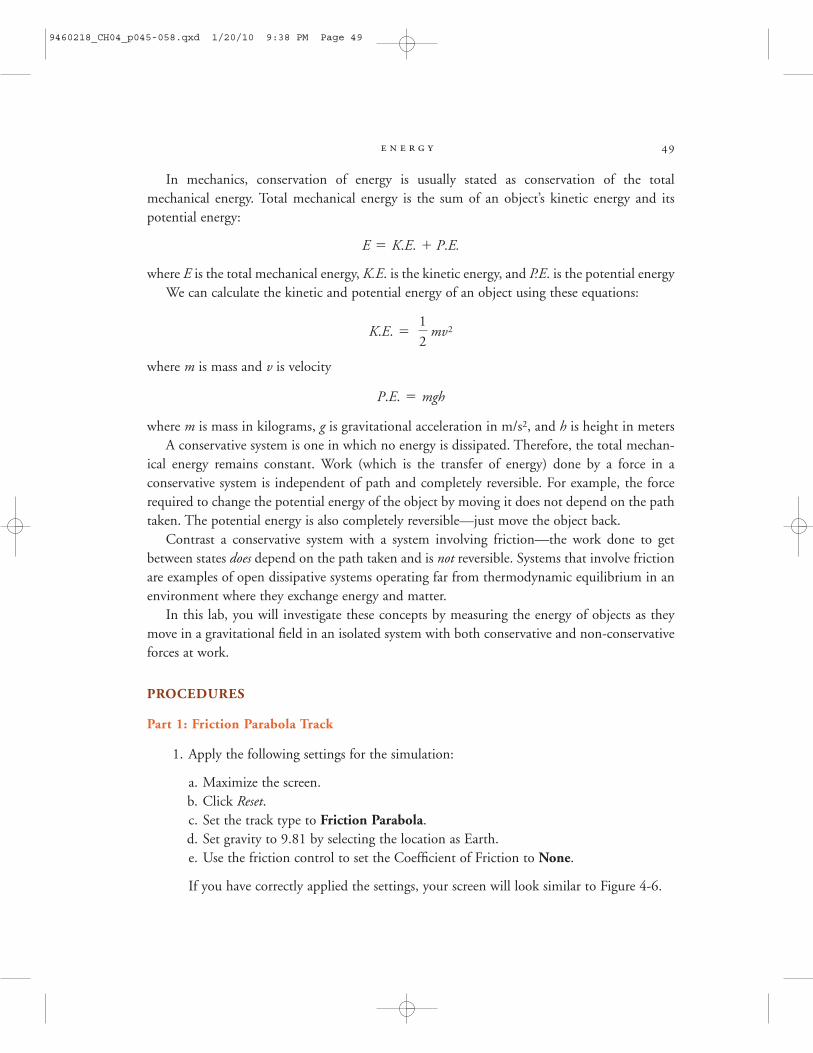
a. Maximize the screen.b. Click Reset.c. Set the track type to Friction Parabola.d. Set gravity to 9.81 by selecting the location as Earth.e. Use the friction control to set the Coefficient of Friction to None.
If you have correctly applied the settings, your screen will look similar to Figure 4-6.
P.E. = mgh
K.E. =1
2mv2
E = K.E. + P.E.
e n e r g y 49
9460218_CH04_p045-058.qxd 1/20/10 9:38 PM Page 49
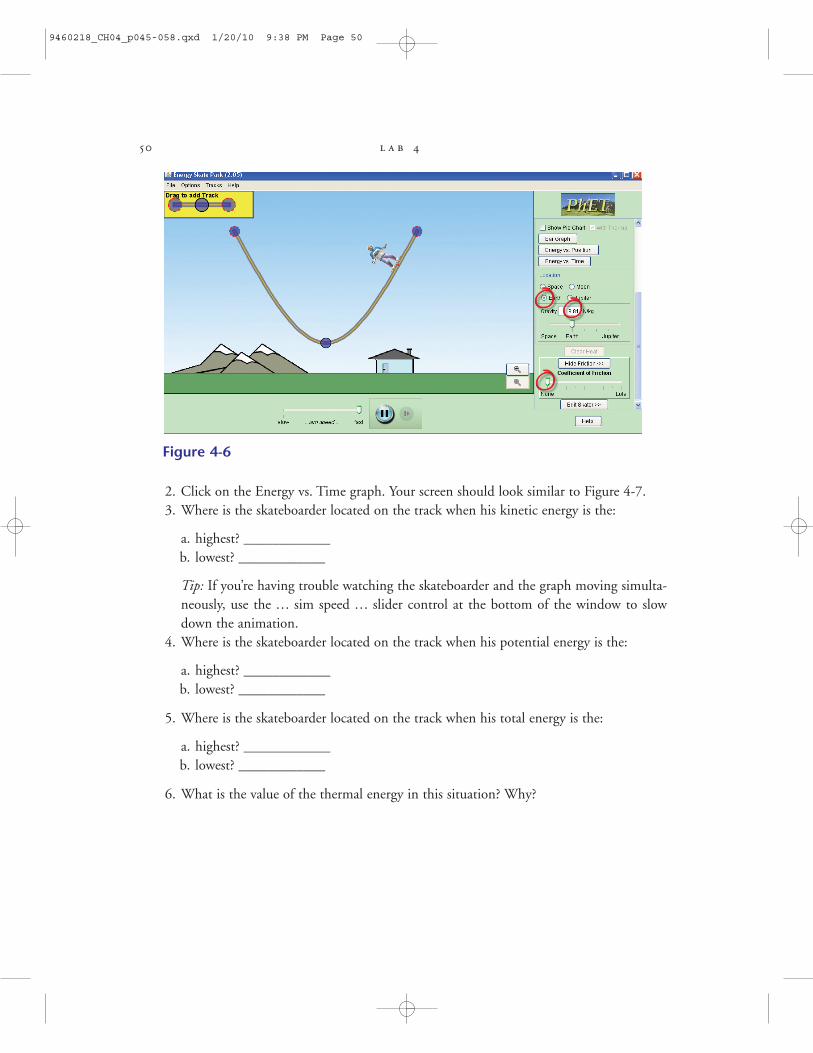
2. Click on the Energy vs. Time graph. Your screen should look similar to Figure 4-7. 3. Where is the skateboarder located on the track when his kinetic energy is the:
a. highest? ____________b. lowest? ____________
Tip: If you’re having trouble watching the skateboarder and the graph moving simulta-neously, use the ... sim speed ... slider control at the bottom of the window to slowdown the animation.
4. Where is the skateboarder located on the track when his potential energy is the:
a. highest? ____________b. lowest? ____________
5. Where is the skateboarder located on the track when his total energy is the:
a. highest? ____________b. lowest? ____________
6. What is the value of the thermal energy in this situation? Why?
l a b 450
Figure 4-6
9460218_CH04_p045-058.qxd 1/20/10 9:38 PM Page 50
Part 1: Loop Track
7. Apply the following settings for the simulation:
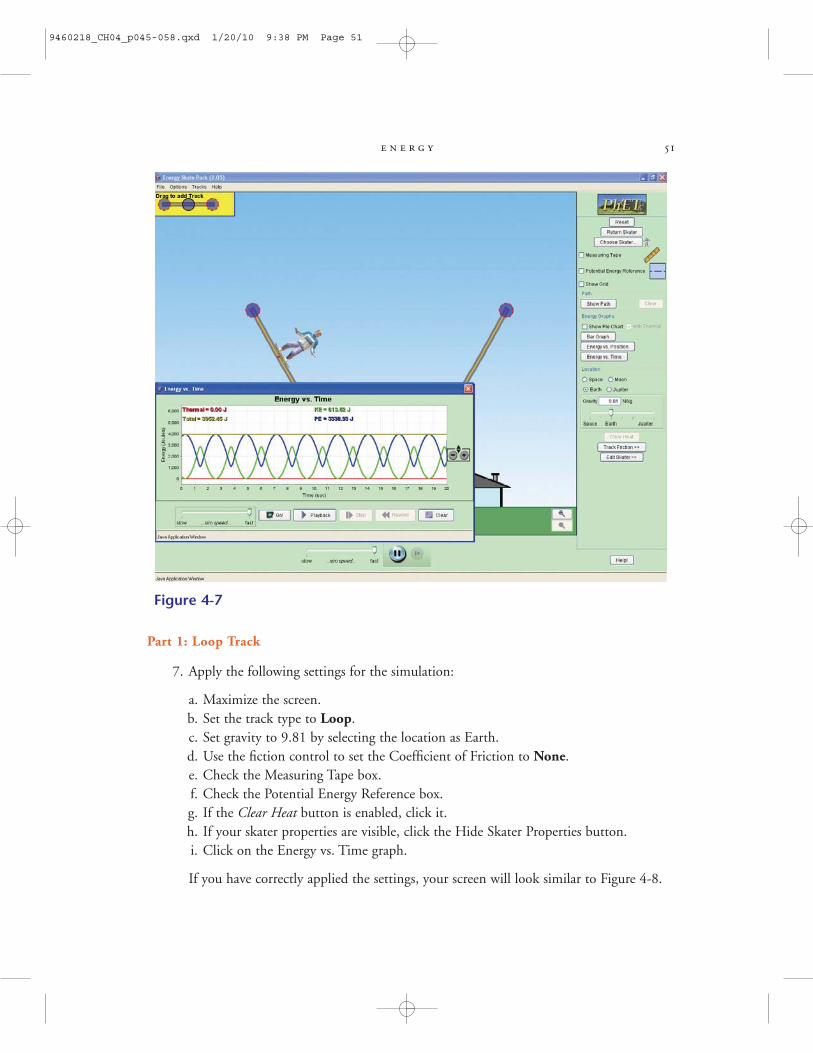
a. Maximize the screen.b. Set the track type to Loop.c. Set gravity to 9.81 by selecting the location as Earth.d. Use the fiction control to set the Coefficient of Friction to None.e. Check the Measuring Tape box.f. Check the Potential Energy Reference box.g. If the Clear Heat button is enabled, click it.h. If your skater properties are visible, click the Hide Skater Properties button.i. Click on the Energy vs. Time graph.
If you have correctly applied the settings, your screen will look similar to Figure 4-8.
e n e r g y 51
Figure 4-7
9460218_CH04_p045-058.qxd 1/20/10 9:38 PM Page 51
8. Describe what happens to the kinetic and potential energy as the skateboarder moves.Is this a conservative (closed) or non-conservative (open) system?
9. What is the maximum potential energy for this motion? Where is the skateboarderlocated on the track when he reaches that energy?
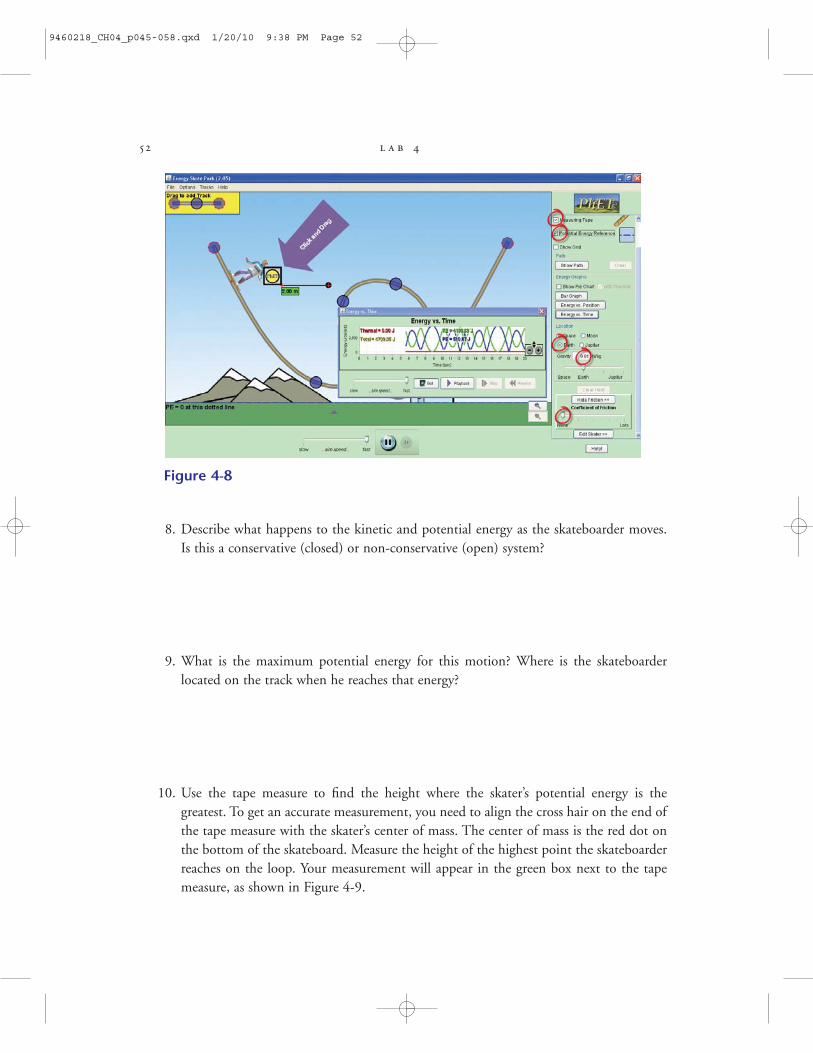
10. Use the tape measure to find the height where the skater’s potential energy is the greatest. To get an accurate measurement, you need to align the cross hair on the end ofthe tape measure with the skater’s center of mass. The center of mass is the red dot onthe bottom of the skateboard. Measure the height of the highest point the skateboarderreaches on the loop. Your measurement will appear in the green box next to the tapemeasure, as shown in Figure 4-9.
l a b 452
Figure 4-8
9460218_CH04_p045-058.qxd 1/20/10 9:38 PM Page 52
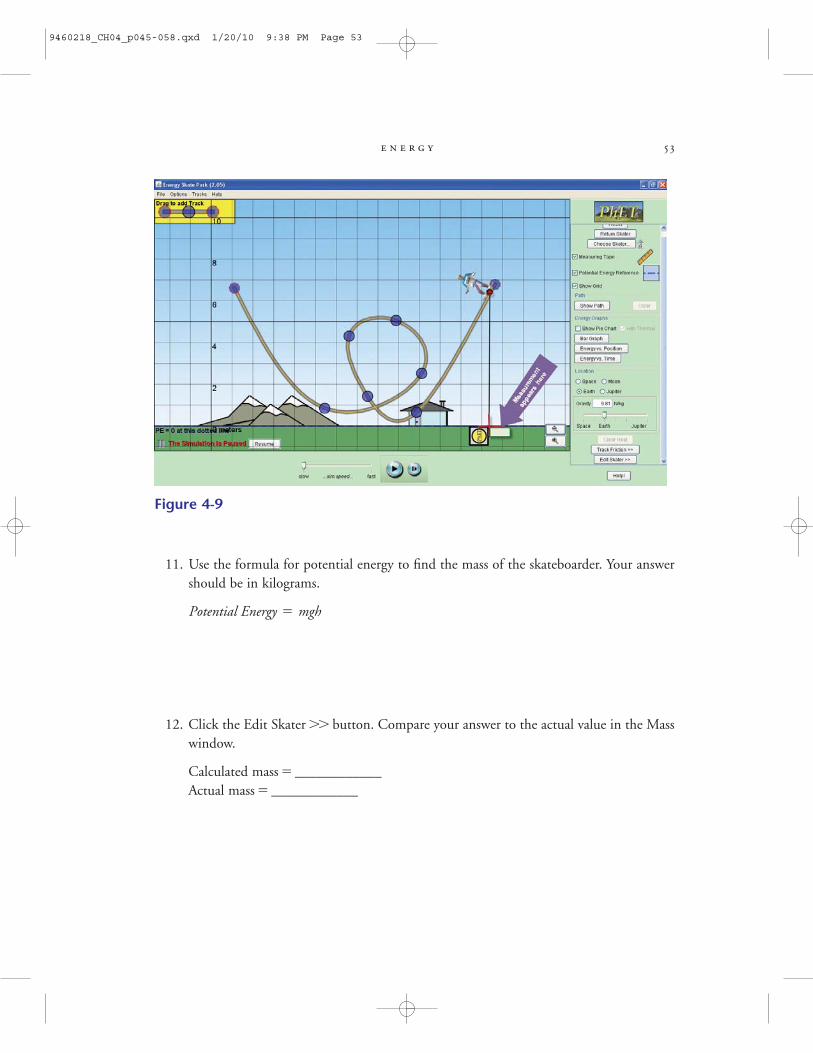
11. Use the formula for potential energy to find the mass of the skateboarder. Your answershould be in kilograms.
12. Click the Edit Skater 77 button. Compare your answer to the actual value in the Masswindow.
Calculated mass = ____________Actual mass = ____________
Potential Energy = mgh
e n e r g y 53
Figure 4-9
9460218_CH04_p045-058.qxd 1/20/10 9:38 PM Page 53

Part 1: Add Friction
13. Keeping all other settings the same, turn on the friction. Adjust the Coefficient ofFriction slider to halfway between None and Lots. Describe what happens to the twokinds of energy as the skateboarder moves. Is this an open or a closed system?
Part 2: Friction Parabola Track
1. Apply the following settings for the simulation:
a. Maximize the screen.b. Click Reset.c. Set the track type to Friction Parabola.d. Use the Select a Skater button to select a different rider than in Part 1 of this lab.e. Set gravity to 9.81 by selecting the location as Earth.f. Use the friction control to set the coefficient to None.g. Click on the Energy vs. Time graph.
2. Where is your new skateboarder located on the track when the kinetic energy is the:
a. highest?b. lowest?
3. Where is your new skateboarder located on the track when the potential energy is the:
a. highest?b. lowest?
4. Where is your new skateboarder located on the track when the total energy is the:
a. highest?b. lowest?
l a b 454
9460218_CH04_p045-058.qxd 1/20/10 9:38 PM Page 54

5. What is the value of the thermal energy in this situation? Why?
Part 2: Loop Track
6. Apply the following settings for the simulation:
a. Maximize the screen.b. Click Reset.c. Set the track type to Loop.d. Set gravity to 9.81 by selecting the location as Earth.e. Use the friction control to set the coefficient to None.f. Check the Measuring Tape box.g. Check the Potential Energy Reference box.h. Click on the Energy vs. Time graph.
7. Describe what happens to the two kinds of energy as the skateboarder moves.
8. What is the maximum potential energy for this motion? Where is the location of theskateboarder on the track for that energy?
9. Use the tape measure to measure the height of the skateboard where potential energy isthe greatest, as you did in Part 1.
e n e r g y 55
9460218_CH04_p045-058.qxd 1/20/10 9:38 PM Page 55
10. Find the mass of the skateboarder using the formula for potential energy:
11. Click the Edit Skater 77 button and compare your answer with the actual value.
Calculated mass = ____________Actual mass = ____________
12. Turn on the friction. Adjust the Coefficient of Friction so the slider bar is half waybetween None and Lots. Describe what happens to the two kinds of energy and the totalenergy as the skateboarder moves.
QUESTIONS
1. Did you see any differences in the graphs between the two different objects?
P.E. = mgh
l a b 456
9460218_CH04_p045-058.qxd 1/20/10 9:38 PM Page 56

2. How did your calculated values for the mass compare to the actual values?
3. How did kinetic energy and potential energy compare to the total energy during themotion without friction? What about when friction was turned on?
e n e r g y 57
9460218_CH04_p045-058.qxd 1/20/10 9:38 PM Page 57


![Rm9 Irm Ch00-Video.doc[1]](https://img.pdfslide.net/doc/110x75/577d1f6e1a28ab4e1e9094a2/rm9-irm-ch00-videodoc1.jpg)