Embed Size (px)
Citation preview

ANNUAL REPORTTHE BRAGANZ A GROUP 2015

BRAGANZA GROUP 2015
DIRECTORS REPORT BRAGANZA GROUP 3
THE BRAGANZA GROUP COMPANIES 10
FINANCIAL STATEMENTS
Profit and loss - Group 13Balance sheet - Group 14Cash flow - Group 16
NOTES - GROUPNote 1 About the Braganza Group 17Note 2 Accounting principles 18Note 3 Significant transactions and events 24Note 4 Acquisitions and disposals of business 24Note 5 Operating segments 25Note 6 Subsidiaries 26Note 7 Investment in associated companies 27Note 8 Long and short term investments 28Note 9 Salary and personel costs, number of employees, loans to employees and auditor’s fee 29Note 10 Pensions 30Note 11 Other operating income and expenses 31Note 12 Other financial income and expenses 32Note 13 Taxes 33Note 14 Intangible assets 34Note 15 Tangible assets 35Note 16 Leases 36Note 17 Long term receivables 36Note 18 Pre payments and accrued income 36Note 19 Cash and equivalents 37Note 20 Interest bearing debt 37Note 21 Other long term liabilities and accrued expenses and deferred income 38Note 22 Equity 38Note 23 Shareholders 39Note 24 Guarantees liabilities and pledged assets 39Note 25 Transactions with related parties 40Note 26 Events after the reporting period 40
PARENT COMPANY BRAGANZA AB Profit and loss – Parent Company 41Balance sheet – Parent Company 43Cashflow – Parent Company 45
NOTES – PARENT COMPANYNote 1 Disclosure of audit fee and cost reimbursements 46Note 2 Personell 46Note 3 Other interest income and similar items 47Note 4 Interest expense and similar items 47Note 5 Tax 47Note 6 Shares in group companies 48Note 7 Other long-term securities 49Note 8 Change in Equity 49Note 9 Untaxed reserves 50Auditor’s report 51

3
The board and the managing director of Braganza AB hereby submit the annual report and consoli-dated group accounts for the financial year 2015.
Braganza AB is a private investment company owned by Per G. Braathen and his children. Braganza has its office in Stockholm. The Group consists primarily of direct investments within the aviation in-dustry and travel related industries, managed through active ownership. A minor part of the Group assets is classified as financial investments. Braganza as a group has a long history (1938) and was an active owner of the Norwegian airline com-pany Braathens (SAFE) for more than 50 years, before SAS acquired Braathens in 2001. The current activities of Braganza began with a demerger in 2002 when the equity base was some MSEK 600 equivalent. During the following years the Group has increased the equity base to approximately 1,6 billion SEK, focusing on industrial investments in the form of wholly- or majority owned subsidiaries, developed through active and long-term ownership. Having been a Norwegian based company since 1938, Braganza became a Swedish holding company through a cross border merger in 2013.
BRAGANZ A AB
B R A G A N Z A A B │ D I R E C T O R S R E P O R T

4
By year end 2015 the Group consists of the holding com-panies Braganza AB and Braganza II AB which in turn owns the main operating holding companies Braathens Aviation AB (publ), Dyreparken Utvikling AS, Ticket Leisure Travel
AB and Braathens Travel Group AS (including Escape Travel). All Group companies are listed in note 6 to the Financial Statements.
THE GROUP
Braathens Aviation, AB (publ) (Braathens Aviation) is the holding company for the airline operation. Management and the organization have devoted significant resources during 2015 towards launch of the new brand “BRA” and migration to a new IT platform. Both the brand and a new IT system were launched 29 February 2016. BRA is short for Braathens Regional Airlines, and the airline now operates under one common brand. The new IT platform is based on well know and proven technology from Amadeus, and will simplify and improve customers’ interaction with the airline. Furthermore, the airline decided in 2015 to renew its turbo-prop fleet and replace older aircraft with nine fac-tory new ATR 72-600s. By the end of 2015 two aircraft were delivered with the remaining seven to be delivered during 2016. The publicly listed bond loan of 300 MSEK issued by Braathens Aviation was redeemed in June 2015. All shares in Braathens Leasing Ltd, the owner of the CSeries order, was sold to Bramora Ltd in August 2015. Braathens Aviation has its office in Stockholm and is today the second largest operator in the Swedish domestic mar-ket. Using Stockholm Bromma as a hub, passengers enjoy a broad domestic network, coordinated timetables allow-ing for efficient transfers and frequent flights.
Ticket includes Ticket Privatresor AB and Ticket Feriereiser AS. Ticket is the largest travel agency chain in Sweden and Norway focusing on the leisure market. The head office is in Stockholm. The company sells leisure travel services from leading tour operators, cruise com-panies, airlines and hotels. Sales are carried out through approximately 70 Ticket shops, by phone, and online through ticket.se and ticket.no. Ticket has an online pres-ence in Denmark and Finland through ticket.dk and tick-et.fi. In Germany Ticket is sold via the brand airngo.de. Airngo is also present in Sweden, Norway, Denmark and Finland as a no-frills online offer. The holding company Dyreparken Utvikling AS (Dyreparken) includes Kristiansand Dyrepark AS, Dyreparken Overnatting AS, Dyreparken Eiendom AS, Badeland Eiendom AS, Dyreparken Sørlands-overnatting AS, Scandic Dyreparken Hotel AS, and 50% of Peer Gynt AS. Dyreparken Utvikling purchased the remaining 50 % of Scandic Dyreparken Hotel AS in September 2015 and became the sole shareholder. A franchise agreement with Scandic was part of the deal and the hotel remains branded as a Scandic hotel.
B R A G A N Z A A B │ D I R E C T O R S R E P O R T
FINANCIAL OVERVIEW OF THE MAIN OPERATING COMPANIES
BRAATHENS AVIATIONTURNOVER 2,660 MSEKEBITDA 96 MSEKFTE 848
TURNOVER 5,326 MSEKEBITDA 69 MSEKFTE 326
TURNOVER 379 MSEKEBITDA 90 MSEKFTE 270
TURNOVER 481 MSEKEBITDA -4 MSEKFTE 80
TICKET
DYREPARKEN
BRAATHENS TRAVEL GROUP

5
B R A G A N Z A A B │ D I R E C T O R S R E P O R T
Dyreparken had for the first time in history more than one million visitors during one year in 2015. The tour operators in Braganza are part of Braathens Travel Group AS (BTG). BTG includes tour operations under the brand Escape Travel. Escape Travel sells packaged holi-days based on scheduled flights in Norway and Sweden. The operators are managed from Oslo and Gothenburg. The tour operator previously managed out of Denmark ceased operation in April 2015 and transferred all its activity to the Travel House Group. As of December 2015 Escape Travel Sweden AB became a subsidiary of Escape Travel AS in Norway.
At year end Braganza owned 11% of Jetscape Inc., an aircraft leasing company with its foundation in Fort Lauderdale, USA. Jetscape is a leading lessor of Embraer E-jets with a total capital base of approximately USD 800
million. Nordic Aviation Capital (NAC) acquired Jetscape late March 2016, and Braganza disposed of its entire shareholding in Jetscape as part of this transaction.
Ticket Biz, which has been part of the Braganza Group since 2010, was sold to BCD Travel in December 2015. BCD Group is a market leader in the travel industry. BCD Group employs over 12,500 people and operates in 110 countries with total sales of US$25.6 billion, including US$10 billion in partner sales. Braganza remain a 25 % mi-nority shareholder in Ticket Biz.
Braganza sold all its shares in Zoo Support Scandinavia AB, the leading franchise chain of pet shops in Sweden under the brand names Arken Zoo and Djurmagazinet on 31 March 2015 to the holding company of Nordic industry leader Musti ja Mirri. Braganza retain a minority sharehold-ing in the new group company as part of this transaction.
6
B R A G A N Z A A B │ D I R E C T O R S R E P O R T
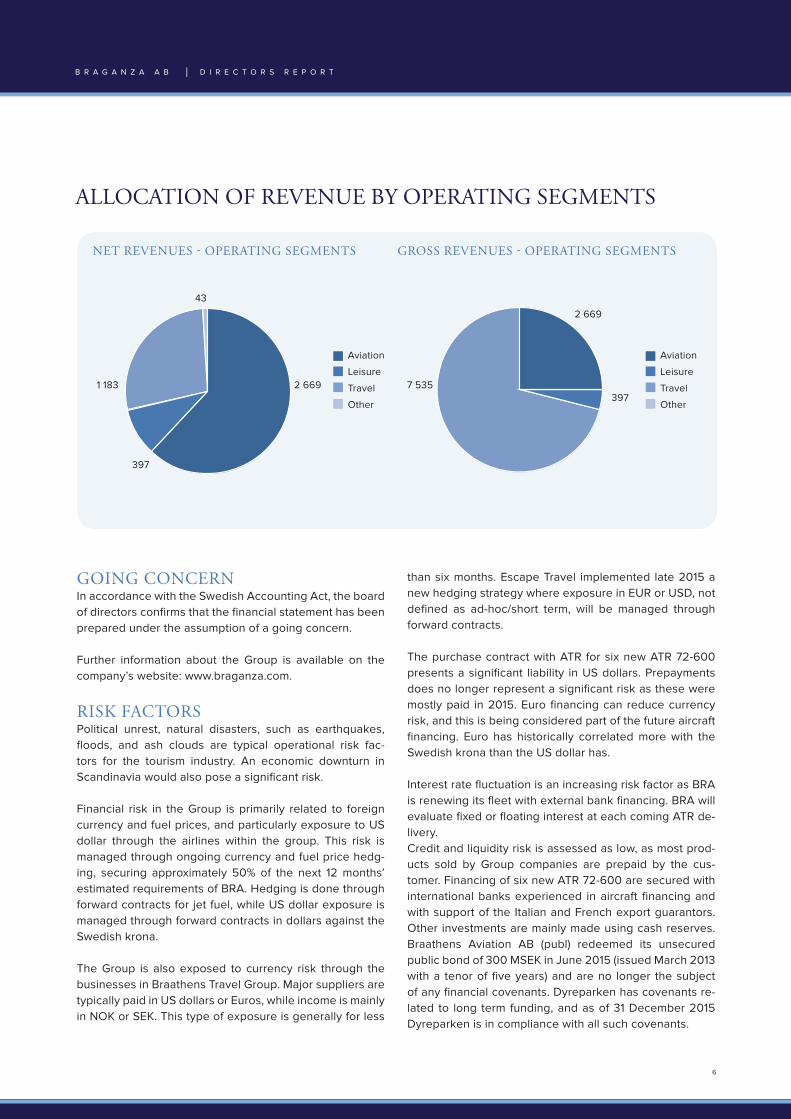
ALLOCATION OF REVENUE BY OPERATING SEGMENTS
NET REVENUES - OPERATING SEGMENTS GROSS REVENUES - OPERATING SEGMENTS
GOING CONCERN In accordance with the Swedish Accounting Act, the board of directors confirms that the financial statement has been prepared under the assumption of a going concern.
Further information about the Group is available on the company’s website: www.braganza.com.
RISK FACTORSPolitical unrest, natural disasters, such as earthquakes, floods, and ash clouds are typical operational risk fac-tors for the tourism industry. An economic downturn in Scandinavia would also pose a significant risk. Financial risk in the Group is primarily related to foreign currency and fuel prices, and particularly exposure to US dollar through the airlines within the group. This risk is managed through ongoing currency and fuel price hedg-ing, securing approximately 50% of the next 12 months’ estimated requirements of BRA. Hedging is done through forward contracts for jet fuel, while US dollar exposure is managed through forward contracts in dollars against the Swedish krona. The Group is also exposed to currency risk through the businesses in Braathens Travel Group. Major suppliers are typically paid in US dollars or Euros, while income is mainly in NOK or SEK. This type of exposure is generally for less
than six months. Escape Travel implemented late 2015 a new hedging strategy where exposure in EUR or USD, not defined as ad-hoc/short term, will be managed through forward contracts. The purchase contract with ATR for six new ATR 72-600 presents a significant liability in US dollars. Prepayments does no longer represent a significant risk as these were mostly paid in 2015. Euro financing can reduce currency risk, and this is being considered part of the future aircraft financing. Euro has historically correlated more with the Swedish krona than the US dollar has.
Interest rate fluctuation is an increasing risk factor as BRA is renewing its fleet with external bank financing. BRA will evaluate fixed or floating interest at each coming ATR de-livery. Credit and liquidity risk is assessed as low, as most prod-ucts sold by Group companies are prepaid by the cus-tomer. Financing of six new ATR 72-600 are secured with international banks experienced in aircraft financing and with support of the Italian and French export guarantors. Other investments are mainly made using cash reserves. Braathens Aviation AB (publ) redeemed its unsecured public bond of 300 MSEK in June 2015 (issued March 2013 with a tenor of five years) and are no longer the subject of any financial covenants. Dyreparken has covenants re-lated to long term funding, and as of 31 December 2015 Dyreparken is in compliance with all such covenants.
43
1 183 7 5352 669397
2 669
Aviation
Leisure
Travel
Other
Aviation
Leisure
Travel
Other
397

7
The consolidated financial statement for 2015 shows a profit before depreciation and financial items (EBITDA) of MSEK 232, compared to MSEK 206 for 2014. The parent company’s result before tax for 2015 was MSEK 138, which includes dividend received from group companies, which is eliminated in the group accounts. At 31 December 2015, the Group had an equity base of MSEK 1,646. The parent company’s equity was MSEK 1,155 as of 31 December 2015. The parent company has distrib-utable reserves of MSEK 1,108. The Board confirms that the going concern assumption is valid and that the accounts have been prepared on a going concern basis.
Except Dyreparken, none of the Group companies had any interest bearing debt at year end 2015. The Group’s cash position at 31 December 2015 was MSEK 668. The parent company’s cash position at 31 December 2015 was MSEK 143. The development in the Group’s cash position over the last five years is shown below in MSEK. During 2015 the group redeemed a bond loan issued by Braathens Aviation with a face value of 300 MSEK. Furthermore, the group had by year end provided a commercial short term bridge loan related to purchase of aircraft of 330 MSEK which has been repaid in full in February 2016.
ACCOUNTS – 2015
CASH AND CASH EQUIVALENTS – GROUP
2015 GROUP
2014 GROUP
Net revenue 4,292 MSEK
Net revenue 4,360 MSEK
Net revenue 13
Net revenue 13
EBITDA 232 MSEK
EBITDA 206 MSEK
EBITDA -19 MSEK
EBITDA -18 MSEK
Operating profit 381 MSEK
Operating profit 49 MSEK
Operating profit -19 MSEK
Operating profit -18 MSEK
Net financial -24 MSEK
Net financial 27 MSEK
Net financial 141 MSEK
Net financial 65 MSEK
EBT 356 MSEK
EBT 76 MSEK
EBT 138 MSEK
EBT 54 MSEK
2015 PARENT COMPANY
2014 PARENT COMPANY
1000
900
800
700
600
500
400
300
200
100
02011 2012 2013 2014 2015
Figures for 2011-2012 have been converted from NOK to SEK using the currency rates at the relevant balance sheet dates.
Cash and cash equivalents
B R A G A N Z A A B │ D I R E C T O R S R E P O R T
668 668695
979945

8
WORKING CONDITIONS AND ENVIRONMENTThe working environment is considered good. There have been no reported serious injuries or serious accidents in the Group in 2015. There have been no reported cases of discrimination. The Group had a total of 1,694 FTEs in 2015. Historically the companies in the Group have had a majority of female employees, and equality is sought in areas where this is deemed relevant. The parent company had five employees on a part time basis by year end. The Group has significant airline operations through Braathens Aviation AB (publ). The business contributes to greenhouse gas emissions. However, it is focused on re-ducing emissions through efficient utilization of the fleet and the use of modern technology. Renewal of the aircraft fleet is an important step in the Group’s environmental commitment.
OUTLOOK FOR 2016In the coming years, the Group will continue to develop its investment activities, focusing on industrial investments and active ownership. The Group enters 2016 with a strong bal-ance sheet and businesses that are well positioned for future growth. The intensive competitive environment in several of the businesses means that the general growth expectations for 2016 is relatively modest compared to 2015.
EVENTS AFTER BALANCE SHEET DATEOn March 14, 2016, Braganza sold its 11 % stake in Jetscape to Nordic Aviation Capital.
B R A G A N Z A A B │ D I R E C T O R S R E P O R T

9
PROPOSED APPROPRIATION OF 2015 PROFIT
The board of directors propose the following appropriation of the available profit 1 108 445 TSEKProposed dividend 30 000 TSEK
To be carried forward 1 078 445 TSEK
The board of directors proposes that the ordinary General Meeting in 2016 distribute a dividend of MSEK 30, which is deemed to be justifiable taking into account the nature and risk of the business as well as the equity and cash position.
Please refer to the income statements, balance sheets, cash flow statements and supplementary disclosures regarding the Group’s and the parent company’s profits and financial position in other respects.
B R A G A N Z A A B │ D I R E C T O R S R E P O R T
10
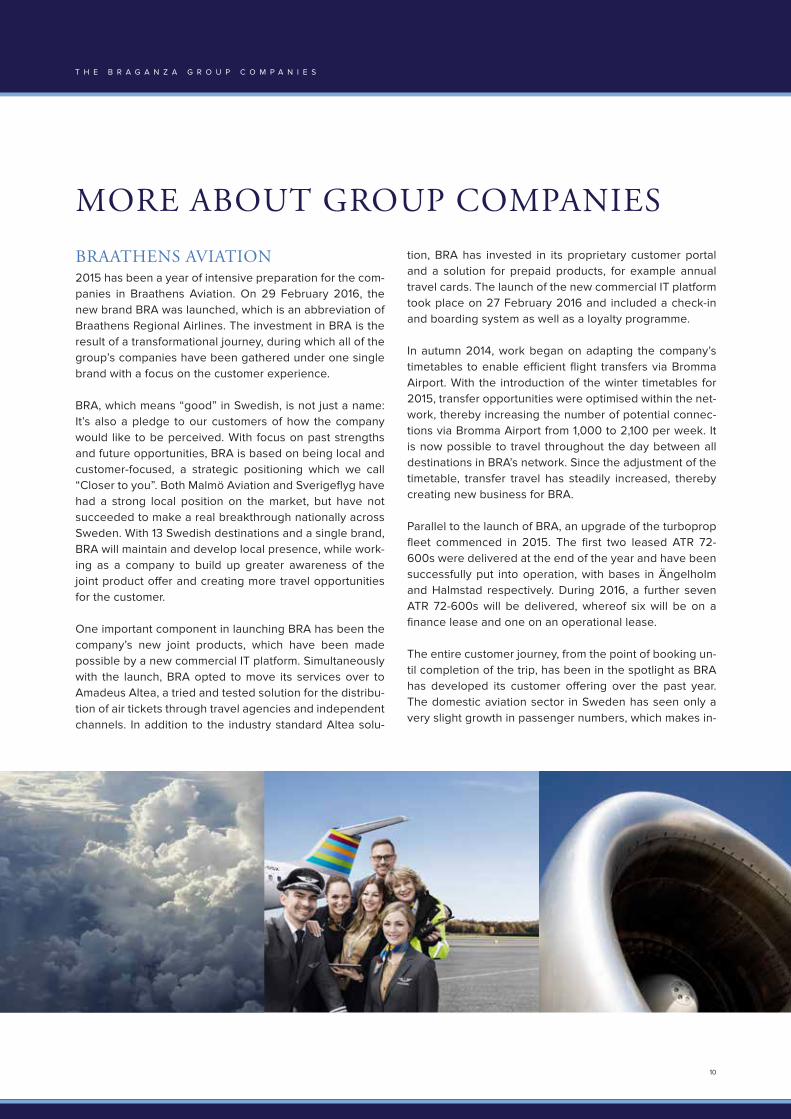
MORE ABOUT GROUP COMPANIESBRAATHENS AVIATION 2015 has been a year of intensive preparation for the com-panies in Braathens Aviation. On 29 February 2016, the new brand BRA was launched, which is an abbreviation of Braathens Regional Airlines. The investment in BRA is the result of a transformational journey, during which all of the group’s companies have been gathered under one single brand with a focus on the customer experience.
BRA, which means “good” in Swedish, is not just a name: It’s also a pledge to our customers of how the company would like to be perceived. With focus on past strengths and future opportunities, BRA is based on being local and customer-focused, a strategic positioning which we call “Closer to you”. Both Malmö Aviation and Sverigeflyg have had a strong local position on the market, but have not succeeded to make a real breakthrough nationally across Sweden. With 13 Swedish destinations and a single brand, BRA will maintain and develop local presence, while work-ing as a company to build up greater awareness of the joint product offer and creating more travel opportunities for the customer.
One important component in launching BRA has been the company’s new joint products, which have been made possible by a new commercial IT platform. Simultaneously with the launch, BRA opted to move its services over to Amadeus Altea, a tried and tested solution for the distribu-tion of air tickets through travel agencies and independent channels. In addition to the industry standard Altea solu-
tion, BRA has invested in its proprietary customer portal and a solution for prepaid products, for example annual travel cards. The launch of the new commercial IT platform took place on 27 February 2016 and included a check-in and boarding system as well as a loyalty programme.
In autumn 2014, work began on adapting the company’s timetables to enable efficient flight transfers via Bromma Airport. With the introduction of the winter timetables for 2015, transfer opportunities were optimised within the net-work, thereby increasing the number of potential connec-tions via Bromma Airport from 1,000 to 2,100 per week. It is now possible to travel throughout the day between all destinations in BRA’s network. Since the adjustment of the timetable, transfer travel has steadily increased, thereby creating new business for BRA.
Parallel to the launch of BRA, an upgrade of the turboprop fleet commenced in 2015. The first two leased ATR 72-600s were delivered at the end of the year and have been successfully put into operation, with bases in Ängelholm and Halmstad respectively. During 2016, a further seven ATR 72-600s will be delivered, whereof six will be on a finance lease and one on an operational lease.
The entire customer journey, from the point of booking un-til completion of the trip, has been in the spotlight as BRA has developed its customer offering over the past year. The domestic aviation sector in Sweden has seen only a very slight growth in passenger numbers, which makes in-
T H E B R A G A N Z A G R O U P C O M P A N I E S

11
creased customer loyalty a high priority. The new loyalty programme “BRA Vänner” gives all travellers the oppor-tunity to collect points from trips, not only with BRA but also with selected partners. In order to promote BRA’s lo-cal position, BRA Vänner has a handful of central partners and several more local partners based around BRA’s des-tinations. At the start of 2016, BRA has also introduced a collaboration with Finnair’s customer loyalty programme, Finnair PLUS. The collaboration enables BRA’s passen-gers to collect and spend points on flights with Finnair and vice versa, as Finnair’s customers can also save up points with BRA. This collaboration has great potential for further development, as the companies’ networks are linked by Bromma Airport.
BRAATHENS TRAVEL GROUPBraathens Travel Group consists of two operating compa-nies: Escape Travel AS in Norway and Escape Travel Sweden AB in Sweden. In Norway the main brand is Escape Travel with the sub-brands Carpe Diem and Sabra Fokusreiser. In Sweden Escape Travel is our only brand. Escape Travel has strengthen its position as the fourth larg-est tour operator in the Norwegian market after Ving, Star Tour and Apollo. The head office is in Oslo with branches in Trondheim, Stavanger and Kristiansand. In Sweden Escape is a mid-size tour operator with offices in Gothenburg and Stockholm. Ticket is our major partner when it comes to agency sales in both countries. In December 2015 Escape in Sweden became a subsidiary of Escape in Norway to en-hance efficiency in contracting and tour operations.Escape Travel offers quality tours and cruises throughout the world based on schedule flights. The company has a strong product range both for group and individual holidays, and 70
travel experts at our five locations in Norway and Sweden. Carpe Diem is market leader in Norway in the niche for indi-vidual holiday makers who want to travel as a group. Sabra Fokusreiser is one of two Norwegian tour operators dominat-ing travel to Israel and Palestine. With the steady increase in low-cost flights to both short haul and long haul destinations the future outlook for Escape Travel is promising.
DYREPARKEN GROUP Norway’s largest family attraction celebrates 50 years. Kristiansand Zoo and Amusement Park situated in the south of Norway has consolidated its position as the most innova-tive family attraction in Norway.
Year after year, the Park has topped all the official lists as the most visited family attraction in Norway. Kristiansand Zoo and Amusement Park has achieved a unique position in the consciousness of Norwegians as a multi-day attraction. Today, the Park has become so large in scale that visitors often spend two or three days experiencing the variety of attractions.
Thanks to continuous development and innovation, most of the visitors return to the Park over and over again. With around one million visitors every year, in a country with just over five million people, the Park appeals to people of all ages. The Kristiansand Zoo stands out as different from oth-er European zoos, some of which are characterized by bars and heavy padlocks. In the Kristiansand Zoo, the animals live in wide-open spaces, with as much freedom as possible and in a natural environment.
T H E B R A G A N Z A G R O U P C O M P A N I E S

12
The Kristiansand Zoo had its official opening June 25th 1966. Starting off with only two bears and around thirty oth-er animals, the Park quickly grew into a Zoo of international size during the 70s and 80s. The first big step towards be-coming something more than a Zoo was taken in 1983, with the introduction of amusement activities in the Park.
Several of the Park`s attractions are themed around Norway`s best-known children`s stories. The most popular shows, featuring The pirate Character Captain Sabertooth have run for twenty-six years now, and have been watched by over 1,4 million people. Two of the stories written by Norway`s most renowned author of children`s books, Thorbjørn Egner, have their own themed space in the Park: Cardamom Town and The Forest of Huckybucky. The latter opened in 2015 and was an immediate success.
The past 15 years have been characterized by a professional and steady ownership. Braganza has been the sole owner ever since 2006. During this time, the Park has maintained a strong focus on long-term strategies. An important step towards becoming a complete destination for visitors was taken in 2012, with the opening of a full scale pirate town Abra Havn themed accommodation with 171 apartments.
The Park also plays an important role for animal protection and conservancy worldwide. It works closely with WAZA (World Association of Zoos and Aquariums) and EAZA (European Association of Zoos and Aquaria), to help save animals under threat of extinction.
Major events in the history of Kristiansand Zoo:1979: The chimpanzee Julius was born. Julius became the
Park’s most popular animal attraction.1983: The Zoo expanded with a large amusement park
area.
1990: The show ”Captain Sabertooth” played for the first time.
1991: Cardamom Town opened.2002: Siberian tigers.2010: The Park expanded with the opening of the water-
park «Badelandet»2012: Abra Havn opened, a full scale, pirate themed town
and harbor with accommodation.2015: The Forest of Huckybucky opened. The live thea-
tre was an immediate success and helped the Park reach the important milestone of more than one mil-lion visitors in one calendar year.
TICKETTicket has succeeded in growing both offline and on-line sales in 2015. Ticket’s network of travel agencies in Sweden and Norway has increased their offline market share. Significant resources have been invested in devel-oping the online sales channel, in terms of functionality, user friendliness and geographical reach. The no-frills brand airngo, launched in 2014, has grown in all mar-kets: Sweden, Norway, Denmark, Finland and Germany. Since Ticket became a subsidiary of Braganza they have achieved six years of double digit growth in turnover and a steady increase in profits.
The market outlook for Ticket is considered favorable due to expectation of further growth in online sales. Ticket’s strategy, with professionalism and service close to the customer regardless of sales channel, will allow Ticket to continue gaining market share in the coming years even though the market is becoming more competitive.
T H E B R A G A N Z A G R O U P C O M P A N I E S

13
BRAGANZA ABCONSOLIDATED INCOME STATEMENT 1.1 – 31.12
Amounts in TSEK Notes 2015 2014
Gross revenue 10 636 708 10 077 494
Net Revenue 4 274 511 4 340 005 Other operating income 11 16 990 19 554 Total revenue 4 291 501 4 359 559
Cost of goods sold - 553 275 - 722 341 Employee benefits expense 9, 10 - 1 242 879 - 1 233 382 Other operating expenses 9, 11 - 2 263 263 - 2 197 422
Total operating expenses -4 059 417 -4 153 145
EBITDA 232 084 206 414
Depreciation and amortisation expenses 14, 15 - 126 983 - 289 372 Income from divestment of operations 3 275 415 131 650
Operating profit / (loss) 380 516 48 692
Income from investments in associates 7 1 815 1 669 Other interest income 14 036 13 872 Other financial income 12 51 996 64 514 Other interest expense - 20 065 - 35 011 Other financial expenses 12 - 72 094 - 18 099 Net financial income / (loss) - 24 312 26 944
Profit / (loss) before income tax 356 204 75 636
Income tax expense 13 - 30 274 - 22 293
Net profit / (loss) 325 931 53 343
Attributable to: Braganza shareholders 322 033 876 Non-controlling interests 3 898 52 467
B R A G A N Z A A B │ P R O F I T A N D L O S S G R O U P

14
BRAGANZA AB CONSOLIDATED BALANCE SHEET AS OF 31 DECEMBER
B R A G A N Z A A B │ B A L A N C E S H E E T G R O U P
Amounts in TSEK Notes 2015 2014
Brands and other intangible assets 297 207 253 509 Goodwill 47 164 66 044
Total intangible assets 14 344 371 319 553
Properties and land 439 185 489 247 Aircraft, engines and similar 134 950 180 068 Construction in progress and pre-payments 214 091 289 957 Equipment 91 435 87 005
Total tangible assets 15 879 660 1 046 278
Deferred tax asset 13 25 967 63 013 Investments in associates 7 1 753 4 788 Long term investments 8 223 695 208 618 Long term receivables 17 123 748 54 885
Total financial assets 375 163 331 304
Total non current assets 1 599 194 1 697 135
Finished goods 49 373 67 568
Accounts receivable 104 126 108 561 Other receivables 25 463 113 140 649 Prepayments and accrued income 18 177 505 201 040
Total receivables 744 745 450 250
Cash and cash equivalents 19 667 893 944 554
Total current assets 1 462 010 1 462 372
Total assets 3 061 204 3 159 507

15
Amounts in TSEK Notes 2015 2014
Issued capital 23 46 086 46 086 Other restricted equity 3 771 3 771
Total restricted equity 49 857 49 857
Free reserves 1 262 757 1 379 655 Profit for the year 322 033 876
Total accumulated profits 1 584 790 1 380 532
Non-controlling interests 11 711 9 774
Total equity 22 1 646 358 1 440 163
Pension obligations 10 3 809 6 628 Deferred tax liability 13 20 274 14 851
Total provisions 24 084 21 479
Liabilities to financial institutions 20 190 333 449 501 Other long term liabilities 21 50 132 27 016
Total other non current liabilities 240 465 476 517
Liabilities to financial institutions 20 87 953 101 110 Accounts payable 258 765 263 917 Income tax payable 13 671 4 701 Public duties payable 36 410 11 353 Other short term liabilities 28 457 87 949 Accrued expenses and deferred income 21 738 041 752 319
Total current liabilities 1 150 297 1 221 349
Total Liabilities 1 414 846 1 719 344
Total equity and liabilities 3 061 204 3 159 507
Memorandum items – Group(Amounts in TSEK) Notes 31.12.2015 31.12.2014
Pledged assets and contingent liabilities 20,24Pledged assets 606 065 619 872 Contingent liabilities 165 993 200 673
B R A G A N Z A A B │ B A L A N C E S H E E T G R O U P
BRAGANZA AB CONSOLIDATED BALANCE SHEET AS OF 31 DECEMBER

16
Amount in TSEK 2015 2014
Cash flow from operating activitiesProfit / (loss) before income taxes 356 204 75 636 Income tax payable -4 708 -13 768 Gain / (loss) from disposal of non current assets -4 657 -4 962 Gain / (loss) from disposal of operations -275 415 -131 650 Depreciation and amortisation expenses 125 820 195 979 Impairment of non current assets 4 782 86 233 Changes in finished goods -486 -5 702 Changes in accounts receivable -17 940 -99 601 Changes in accounts payable 12 774 -3 794 Difference between recognised income from investments in associates and actual payments
-711 -92
Difference between recognized pension cost and actual payments -2 818 -486 Changes in other accruals -332 135 38 500 Currency adjustments operating activities 4 975 -3 020
Net cash flow from operating activities -134 317 133 273
Cash flow from investing activitiesProceeds from disposal of tangible non current assets 15 439 14 033 Proceeds from disposal of operations 609 602 85 241 Purchase of tangible non current assets -329 431 -63 657 Purchase of intangible assets -66 871 -31 895 Proceeds from disposal of intangible assets 2 218 1 331 Net proceeds from disposal of shares 41 060 21 540 Aquisition of subsidiary, net of cash aquired -17 598 -8 295 Change in long term receivables -68 468 -10 957 Currency adjustments investing activities -643 -74
Net cash flow from investing activities 185 309 7 267
Cash flow from financing activitiesProceeds from recent borrowings/down payments -259 158 -88 226 Changes in bank overdraft -22 369 20 079 Equity proceeds - -9 953 Dividends -76 048 -98 704 Currency adjustments financing activities 29 922 1 970
Net cash flow from financing activities -327 653 -174 834
Net change in cash and cash equivalents -276 661 -34 294 Cash and cash equivalents at 01.01 944 554 978 848
Cash and cash equivalents at 31.12 667 895 944 554
B R A G A N Z A A B │ C A S H F L O W G R O U P
BRAGANZA AB CONSOLIDATED CASH FLOW STATEMENT 1.1 – 31.12

17
NOTE 1. ABOUT THE BRAGANZA GROUP
Braganza is a privately held investment company based in Stockholm. Braganza is owned by Per G. Braathen and his immediate family. For many years, Braganza owned the airline Braathens (SAFE). Investments in the airline industry, tourism, leisure and distribution of tourism prod-ucts account for the majority of the investment portfolio. Braathens Aviation, Kristiansand Dyrepark, Ticket, and Braathens Travel Group are the company’s largest single investments. A greater proportion of the industrial busi-ness is located in Sweden. Braganza’s wholly owned aviation business in Sweden is organised through Braathens Aviation Group AB (publ). The airline is rebranded to BRA, short for Braathens Regional Airlines and consists of the previous brands Malmö Aviation and Sverigeflyg (including various sub-brands).
BRA is a regional airline that operates from Stockholm’s city-airport, Bromma. The airline operates both jet aircraft and turbo-props. BRA transports some two million passen-gers annually and has been named Sweden’s best domes-tic airline for several successive years.
Kristiansand Dyrepark (Zoo and Amusement Park) was established 50 years ago, and has evolved into the larg-est and foremost leisure park in Norway, including a wa-ter park and accomodation. Dyreparken is a full service holiday resort including the pirate themed accommodation Abra Havn, which have a capacity of accomodating 1000 guests.
Ticket is among the largest leisure travel agencies in the Nordic region, with some 70 stores. The company sells leisure travel from all leading tour operators, in addition to cruises, airline tickets and hotel accommodation. Ticket assists and advise the customer through easy access to a wide range of travel products.
Braathens Travel Group is a tour operator focusing on the Nordic region, with Escape Travel as common brand. In Norway Escape Travel is the fourth largest tour operator after a successfully merger with Sabra Tours, which was aquired in 2013.
B R A G A N Z A A B │ N O T E S G R O U P

18
NOTE 2 ACCOUNTING PRINCIPLES The financial statements have been prepared in accord-ance with the Swedish Accounting Act (1995:1554) and generally accepted accounting principles in Sweden by the Accounting Committee BFNAR 2012:1 (“K3”).
PRESENTATION
The income statement is presented by nature. The group distinguishes between gross and net revenue in the in-come statement. Gross revenue in the travel segment represents the gross purchase value (paid by the ultimate customer) of travels arranged on behalf of customers. Net revenue represents the fee expected to be received from customers based on the arrangements made. There are no significant differences between gross and net revenue in other segments of the Group.
The cash-flow statement is based on the indirect method. Cash includes cash in hand and bank-deposits.
BASIS FOR CONSOLIDATION
The Group’s consolidated financial statements comprise Braganza AB and companies in which Braganza AB has a controlling interest. A controlling interest is normally obtained when the Group owns more than 20-50% of the shares in the company and can exercise control over the company. Non-controlling interest are included in the Group’s equity. Transactions between group companies have been eliminated in the consolidated financial state-ment. Identical accounting principles have been applied for both parent and subsidiaries.
The purchase method is applied when accounting for busi-ness combinations. Companies which have been bought or sold during the year are included in the consolidated fi-nancial statements from the date when control is achieved and until the date when control ceases.
An associate is an entity in which the Group has a signifi-cant influence but does not exercise control of the man-agement of its finances and operations, normally when the Group owns 20%-50% of the company. The consolidated financial statements include the Group’s share of the prof-its/losses from associates, accounted for using the equi-ty method, from the date when a significant influence is achieved and until the date when such influence ceases.
When the Group’s share of a loss exceeds the Group’s in-vestment in an associate, the amount carried in the Group’s balance sheet is reduced to zero and further losses are not recognized unless the Group has an obligation to cover any such loss.
USE OF ESTIMATES Management has used estimates and assumptions that have affected assets, liabilities, income, expenses and in-formation on potential liabilities in accordance with gener-ally accepted accounting principles in Sweden. The most critical judgments and sources of potential uncertainty re-lated to the preparation of the consolidated financial state-ments are detailed below.
Provisions for estimated costs of periodic overhaul and maintenance of aircraft are recognized except for less extensive/ongoing maintenance performed at least each year which is expensed as incurred. To some extent, the calculation of future maintenance costs is based on as-sumptions and estimates. No provision will be recognized for new aircraft and scheduled maintenance will be capi-talized at the time for such maintenance and depreciated up until next scheduled maintenance.
The group recognizes deferred tax assets to the extent it is probable that taxable profit will be generated. Judgement by management is required to determine which deferred tax assets can be recognized, based on the expected tim-ing, level of future taxable profits and future tax planning strategies.
At each reporting date, the group considers if there are indications of reduced values of tangible and intangible assets. A value is considered reduced when the recov-erable amount is less than book value. The recoverable amounts of cash generating units are determined based on value-in-use calculations. These calculations require use of estimates.
A customer loyalty program has been established. Bonus points can be used as payment for future ticket purchases etc. A current liability is recognized at the time of sale of tickets. The previous year’s utilization of bonus points has been used to calculate the liability of the customer loy-alty program and is in the balance sheet recognized at fair value.
FOREIGN CURRENCY TRANSLATION
Presentation of subsidiaries in foreign currencyThe Group’s reporting currency is SEK. This is also the parent company’s functional currency. The balance sheet figures of subsidiaries with a different functional currency are translated at the exchange rate prevailing at the end of the reporting period while the income statement figures are translated at the transaction exchange rate. The yearly average exchange rates are used as an approximation of the transaction exchange rate. Exchange differences are recognized in equity. When investments in foreign sub-
B R A G A N Z A A B │ N O T E S G R O U P

19
sidiaries are sold, the accumulated translation differences relating to the subsidiary are recognized in the income statement.
Translation of foreign currency transactions and balancesTransactions in foreign currency are translated at the rate applicable on the transaction date.
Presentation in the income statementProfit and loss effects arising from translation of balance sheet items related to operating activities, such as ac-counts receivables and accounts payable, are presented as operating activities. Translation of balance sheet items related to the financing of the group, such as long term loan and bank accounts, are presented as finance cost/income. Gains and losses from financial instruments, in-cluding hedge accounting, are recognized in the income statement when due. Until the due date, these instruments are kept off balance sheet. Financial instruments used for hedging purposes, but not regarded as a hedge account-ing relationship, are presented at fair value. All changes in fair value of financial instruments, except those kept off balance sheet, are recognized as financial cost/income in the income statement. The use of financial instruments is explained in more detail in the notes to the consolidated financial statements.
SEGMENT REPORTING
For management and reporting purposes, the Group has identified four reporting segments. These segments con-sist of Aviation, Travel, Leisure and Other and comprise the basis for the primary segment reporting. Segment figures are presented in accordance with Swedish GAAP. Please see separate note.
REVENUE RECOGNITION
Revenues from the sale of goods are recognized in the in-come statement once delivery has taken place and most of the risk and return has been transferred. Revenues from the sale of services are recognized when the service has been provided and the group has obtained a right to receive the payment.
AVIATION
Passenger revenuePassenger revenue is recognized as revenue when the transport has been carried out. The value of valid tick-ets sold but not used at the reporting date is reported as short-term liability in the balance sheet. This liability is re-duced either when transportation is carried out or when the passenger requests a refund.
Other revenueOther revenue comprises sales of ticket-related products and services, such as baggage fees and freight revenues. Some of these products and services are considered earned when the transport is carried out and accordingly recognized in the same manner as passenger revenue. Other products and services are immediately recognized upon a sale in the income statement.
Customer loyalty programA customer loyalty program has been established. Within the program the passengers acquire bonus points based on their bought flights. Bonus points can be used as pay-ments for future travels. A short term liability is recognized when a sale is made. The liability is based on all passen-gers and an average market price for tickets sold is de-rived. Last year’s use of loyalty points is then used as the basis for calculating a liability related to the customer loy-alty program.
TRAVEL
Income from distributed saleRevenues from mediated sales are recognized in the in-come statement at the time the work attributable to the transaction has been performed. Revenues are recog-nized at the fair value of the consideration received or expected to be received, less any discounts. Ticket sales are partly distributed by the Group acting as a sales agent where the Group performs a reservation service for the customer, and partly sales in the Group’s own name act-ing as an organizer of the actual journey being sold, also known as “package tours”.
Revenues from services for group and conference busi-ness are recognized in the income statement when the outcome of the services provided can be measured reli-ably. This is normally the day of departure. If there is signif-icant uncertainty regarding the payment, associated costs or the acceptance of the service provided no revenue is recognized. Revenues are recognized at the fair value of the consideration received or expected to be received, less any discounts.
HEDGE ACCOUNTING
The Group seeks to reduce the risk related to fluctuations in fuel prices and currency rates. The Group uses financial instruments such as foreign exchange forward contracts. Financial instruments used as a part of a hedge accounting are kept off balance sheet until the due date of the instru-ment. The due date of the instrument is set to match the secured transaction.
B R A G A N Z A A B │ N O T E S G R O U P

20
INCOME TAX
The tax expense consists of the tax payable and changes to deferred tax. Deferred tax/tax assets are calculated on all differences between the book value and tax value of assets and liabilities, with the exception of:- temporary differences related to goodwill that are not tax deductible- temporary differences related to investments in subsidi-aries, associates or joint ventures that the Group controls when the temporary differences are to be reversed and this is not expected to take place in the foreseeable future.
Deferred tax assets are recognized when it is probable that the company will have a sufficient profit for tax purposes in subsequent periods to utilise the tax asset. The companies recognise previously unrecognized deferred tax assets to the extent it has become probable that the company can utilise the deferred tax asset. Similarly, the company will re-duce a deferred tax asset to the extent that the company no longer regards it as probable that it can utilise the deferred tax asset.
Deferred tax and deferred tax assets are measured on the basis of the expected future tax rates applicable to the companies in the Group where temporary differences have arisen.
Deferred tax and deferred tax assets are recognized at their nominal value and classified as non-current asset invest-ments (long-term liabilities) in the balance sheet.
Current and deferred taxes are recognized directly in equity to the extent that they relate to equity transactions.
BALANCE SHEET CLASSIFICATIONCurrent assets and short term liabilities consist of receiva-bles and payables due within one year, and items related to the inventory cycle. Other balance sheet items are clas-sified as fixed assets / long term liabilities.
Current assets are valued at the lower of cost and fair val-ue. Short term liabilities are recognized at nominal value.
Fixed assets are valued at cost, less depreciation and im-pairment losses. Long term liabilities are recognized at nominal value.
PROPERTY, PLANT AND EQUIPMENT
Property, plant and equipment are capitalized and depre-ciated linearly over the estimated useful life. Assets rec-ognized in the balance sheet based on a financial lease agreement are depreciated over the expected leasing pe-riod. All significant assets are disaggregated to the extent necessary to ensure correct depreciation costs.
Depreciation is calculated using the straight-line method over the estimated useful life, as further specified in the notes to the consolidated financial statements.The depreciation period and method are assessed each year. A residual value is estimated at each year-end, and changes to the estimated residual value are recognized as a change in an estimate.
The cost of current maintenance, except for extensive aircraft maintenance described below, are expensed as incurred, whereas costs for improving and upgrading property, plant and equipment are added to the acquisi-tion cost and depreciated with the related asset. If carry-ing value of a non current asset exceeds the estimated recoverable amount, the asset is impaired to the recover-able amount. The recoverable amount is the greater of the net realisable value and value in use. In assessing value in use, the discounted estimated future cash flows from the asset are used.
Provisions are made for estimated costs of scheduled overhaul and maintenance of aircraft except for less exten-sive/ongoing maintenance performed at least each year which is expensed as incurred. The provision for overhaul and maintenance is based on cost estimates and historical data. The cost is allocated between the periods covered by the maintenance on a straight line basis. Differences between the provision and actual costs when the mainte-nance/overhaul is performed are recognized in the income statement. The provision is presented as “Other long term liabilities” in the balance sheet. No provision will be recog-nized for new aircraft and scheduled maintenance will be capitalized at the time for such maintenance and depreci-ated up until next scheduled maintenance.
The Group capitalizes prepayments on purchase of air-craft. The prepayments are classified as tangible assets in the balance sheet. When the aircraft are delivered, pre-payments are included in acquisition cost of the aircraft and reclassified as aircraft in the balance sheet.
LEASING
Finance leasesFinance leases are leases under which the Group as-sumes most of the risk and return associated with the own-ership of the asset. At the inception of the lease, finance leases are recognized at the lower of their fair value and the present value of the minimum lease payments, minus accumulated depreciation and impairment losses. When calculating the lease’s present value, the implicit interest rate in the lease is used if it is possible to calculate this. If this cannot be calculated, the company’s marginal bor-rowing rate is used. Direct costs linked to establishing the lease are included in the asset’s cost price.
B R A G A N Z A A B │ N O T E S G R O U P

21
The depreciation period will normally follow the underly-ing contract. If it is not reasonably certain that the com-pany will assume ownership when the term of the lease expires, the asset is depreciated over the term of the lease or the asset’s economic life, whichever is the shorter.
Operating leasesLeases for which most of the risk and return associated with the ownership of the asset have not been transferred to the Group are classified as operating leases. Lease pay-ments are classified as operating costs and recognized in the income statement in a straight line during the contract period.
Deposits made at the inception of operating leases are carried at amortized cost. The difference between the nominal value of a deposit paid, carried at less than market interest and its fair value, is considered as additional rent, payable to the lessor and is expensed on a straight-line basis over the lease term.
INTANGIBLE ASSETS
Intangible assets that have been acquired separately are carried at cost. The costs of intangible assets acquired through a business combination are recognized at their fair value. Capitalized intangible assets are recognized at cost less any amortisation and impairment losses.
Intangible assets, which have a defined economic life, are amortised over their economic life and tested for impair-ment if there are any indications of reduced value. The am-ortisation method and period are assessed at least once a year. Changes to the amortisation method and/or period are accounted for as a change in estimate. Intangible as-sets without any defined economic life are not depreci-ated, but are instead tested for impairment at least once a year.
Development costsDevelopment costs related to IT/software are capitalized providing that a future economic benefit associated with development of the intangible asset can be established and costs can be measured reliably. Otherwise, the costs are expensed as incurred. Capitalized development costs are amortized over its useful life.
GoodwillThe difference between the cost of an acquisition and the fair value of net identifiable assets on the acquisition date is recognized as goodwill. For investment in associates, good-will is included in the investment’s carrying amount.
Goodwill is recognized at cost in the balance sheet, mi-nus any accumulated impairment losses, and amortised.
Goodwill is amortised over five years unless otherwise specified.
Assets and liabilities acquired in a business combination are carried at their fair value in the Group’s balance sheet. The non-controlling interest is calculated on the basis of the minority’s share of these assets and liabilities.
The allocation of costs in a business combination is changed if new information on the fair value becomes available and is applicable on the date when control is assumed. The al-location may be altered until the annual accounts are pre-sented or prior to the expiry of a 12-month period.
If the fair value of the equity exceeds the acquisition cost in a business combination, the difference (“negative good-will”) is recognized as income immediately on the acquisi-tion date.
At each reporting date, the group considers if there are indications of reduced value of the goodwill. Goodwill is evaluated as a part of a cash generating unit. A value is considered reduced if the recoverable amount of the assets of the cash generating unit is less than book value. The re-coverable amounts of cash generating units are determined based on value-in-use calculations.
Patents and licencesAmounts paid for patents and licences are capitalized and amortised on a straight line basis over the expected useful life.
SoftwareExpenses related to the purchase of new software are cap-italized as an intangible asset provided these expenses do not form part of the hardware acquisition costs. Software is normally depreciated over the expected useful life. Costs incurred as a result of maintaining or upholding the future utility of software is expensed unless the changes in the software increase the future economical benefits from the software.
BrandsBrands are either capitalized as part of an acquisition, or separate purchases of brands. Brands are not depreci-ated. The value of brands which are capitalized as part of an acquisition is determined by comparing renting cost for brands for similar businesses, using international data-bases as a basis. A discount for maintaining the brand is applied, and a DCF analysis gives the value of the brand, less any impairment losses. Purchased brands are capital-ized at cost, less any impairment losses.
At each reporting date, the group considers if there are indications of reduced values of the brands. Brands are
B R A G A N Z A A B │ N O T E S G R O U P

22
evaluated as a part of a cash generating unit. A value is considered reduced if the recoverable amount of the as-sets of the cash generating unit is less than book value. The recoverable amounts of cash generating units are de-termined based on value-in-use calculations.
SUBSIDIARIES AND INVESTMENT IN ASSOCIATES
Subsidiaries and investments in associates are valued at cost in the company accounts. The investment is valued at cost, less any impairment losses. Impairment loss is recognized if the impairment is not considered temporary, in accordance with generally accepted accounting princi-ples. Impairment losses are reversed if the reason for the impairment loss disappears in a later period.
Dividends, group contributions and other distributions from subsidiaries are recognized in the same year as they are recognized in the financial statement of the provider. If dividends / group contribution exceed withheld profits after the acquisition date, the excess amount represents repayment of invested capital, and the distribution will be deducted from the recorded value of the acquisition in the balance sheet for the parent company.
INVENTORIES Inventories are recognized at the lowest of cost and net selling price. The net selling price is the estimated sell-ing price in the case of ordinary operations minus the es-timated completion, marketing and distribution costs. The cost is calculated by using the FIFO method and includes the costs incurred in acquiring the goods and the costs of bringing the goods to their current state and location.
ACCOUNTS RECEIVABLE AND OTHER RECEIVABLES
Accounts receivable and other current receivables are recognized in the balance sheet at nominal value less pro-visions for doubtful accounts. Provisions for doubtful ac-counts are based on an individual assessment of the differ-ent receivables. For the remaining receivables, a general provision is estimated based on expected loss.
SHORT TERM INVESTMENTS
Short term investments (securities traded at an open mar-ket) are valued at market value. Dividends and other distri-butions are recognized as other financial income.
EMPLOYEE BENEFITS
Employee benefits in the form of salaries, bonuses, paid holiday, paid sick leave etc. and pensions are recognized
as they are vested. Pensions and other post-employment benefits are classified as defined contribution or defined benefit plans.
Defined contribution plansFor defined contribution plans, the Group pays set con-tributions to a separate independent legal entity and does not have any obligation to pay further contributions. Expenses are charged against group earnings as the ben-efits are vested, which normally coincides with the time when premiums are paid.Defined benefit plansThe Group’s net obligation concerning defined benefit plans is calculated by estimating the future benefit the employees have earned through their employment in both current and previous periods; this benefit is discounted to a present value and the fair value of any assets under man-agement is deducted. Changes in the pension obligations due to changes in pension plans are recognized over the estimated average remaining service period.
GOVERNMENT GRANTS
Grant income is recognized when there is 1) entitlement to the grant, 2) virtual certainty that it will be received and 3) sufficient measurability of the amount. Government grants are recognized as income over the periods necessary to match them with the related costs which they are intended to compensate. Government grants relating to purchases of non-current assets are deducted from the cost of the respective asset. The amount of depreciation and amorti-zation is based on the cost of purchase after deduction of such grants.
CONTINGENT LIABILITIES AND ASSETS
Contingent liabilities are recognized in the annual accounts if the probability that the cost will be incurred is more than 50 % and the liability can be estimated reliably. The liability is recognized based on the best estimate of the future set-tlement. If the probability is regarded less than 50 % infor-mation about the contingent liability is disclosed.
Contingent assets are not recognized in the annual ac-counts but are disclosed if there is a certain probability that a benefit will be added to the Group.
EVENTS AFTER THE REPORTING PERIOD
New information on the company’s financial position at the end of the reporting period which becomes known after the reporting period is recorded in the annual accounts. Events after the reporting period that do not affect the company’s financial position at the end of the reporting
B R A G A N Z A A B │ N O T E S G R O U P
23
period but which will affect the company’s financial posi-tion in the future are disclosed if material.
PARENT COMPANY – ACCOUNTING PRINCIPLES
The differences between the group’s and the parent com-pany’s accounting principles are explained below.The differences between the group’s and the parent com-pany’s accounting principles are explained below.
SubsidiariesInterests in subsidiaries are recognized at cost. Dividends from subsidiaries are recognized as income when the right
to receive dividend is deemed to be certain and can be calculated in a reliable manner.
Group contributionGroup contributions received and paid are recognized as appropriations in the income statement.
TaxesUntaxed reserves, including deferred tax liability, are rec-ognized in the parent company. In the consolidated finan-cial statements, on the other hand, untaxed reserves are divided into deferred tax liability and shareholders’ equity.
B R A G A N Z A A B │ N O T E S G R O U P

24
NOTE 3. SIGNIFICANT TRANSACTIONS AND EVENTS(Amounts in SEK 1000)
Zoo Support with its brands Arken Zoo and Djurmagazinet, Swedens largest pet-shop chain, was 30 March 2015 sold to Musti ja Mirri, ulitmately owned by EQT. Braganza re-main a minority shareholder in the combined company Musti ja Mirri, which after the acuisition is the leading op-erator within pet-shops in the Nordic.
75% of Ticket Biz was 30 November 2015 sold to BCD Travel. BCD Travel has a call option for the remaining 25%.
Through the acquisition, Ticket Biz will benefit from being part of a global organisation with presence in more than 110 countries and 11.000 employees. Braathens Leasing Ltd, was sold from Braathens Aviation to Bramora Ltd in August 2015. Bramora Ltd is ultimately owned by Per G. Braathen and his immediate family.
B R A G A N Z A A B │ N O T E S G R O U P
NOTE 4. ACQUISITIONS AND DISPOSALS OF BUSINESSES(Amounts in SEK 1000)
Disposal of businessZoo Support with its brands Arken Zoo and Djurmagazinet, Swedens largest pet-shop chain, was 30 March 2015 sold to Musti ja Mirri, ulitmately owned by EQT. 75% of Ticket Biz was 30 November 2015 sold to BCD Travel. BCD Travel
has a call option for the remaining 25%. Dyreparken ac-quired remaining 50% of the operating company of Scandic Dyreparken Hotel, and is now the sole shareholder.
Acquisitions Divestments
2015 2014 2015 2014
Other intangible assests 15 554 - 40 680 3 472Tangible assets 9 109 - 289 826 31 473Financial assets - - 1 776 2 912
Current assets 4 683 - 76 090 209 828
Total assets 29 346 - 408 373 247 685
Non-current liabilities 2 396 - - 799Current liabilities 4 512 - 108 307 221 495Total liabilities 6 907 - 108 307 222 294

25
NOTE 5. OPERATING SEGMENTS(Amounts in SEK 1000)
The group has four reportable segments which are the strategic business units of the group. All transactions between the segments are, according to the groups transfer pricing guidelines, based on the arm length principle.
Allocation between segments in 2015 Aviation Travel Leisure Other Total
External gross revenue 2 663 437 7 535 473 396 980 40 819 10 636 708
Net revenue 2 663 436 1 173 276 396 980 40 819 4 274 511 Other operating income 5 918 10 064 136 872 16 990 Total external revenues 2 669 354 1 183 340 397 116 41 691 4 291 501 Internal revenues - - - 955 955
Total revenues 2 669 354 1 183 340 397 116 42 646 4 292 456
Cost of goods sold - (490 381) (51 553) (12 296) (554 230)Employee benefits expense (710 681) (345 867) (144 718) (41 613) (1 242 879)Other operating expenses (1 861 286) (274 798) (104 632) (22 547) (2 263 263)
EBITDA 97 388 72 294 96 212 (33 810) 232 084
Geografical areas Norway Sweden Other Total Gross revenue 2 616 234 8 003 012 17 463 10 636 708
Net revenue 1 052 416 3 207 123 14 973 4 274 512 Other operating income 1 947 11 797 3 246 16 990 Total external revenues 1 054 362 3 218 920 18 220 4 291 502 Internal revenues 955 - - 955
Total revenues 1 055 317 3 218 920 18 220 4 292 456
Allocation between segments in 2014 Aviation Travel Leisure Other TotalExternal gross revenue 2 545 121 7 160 363 355 268 16 743 10 077 494
Net revenue 2 462 928 1 440 320 355 268 81 489 4 340 005 Other operating income 12 887 3 811 397 2 459 19 554
Total external revenues 2 475 815 1 444 131 355 664 83 949 4 359 559
Internal revenues 82 192 - - 39 467 121 659
Total revenues 2 558 007 1 444 131 355 664 123 415 4 481 218
Cost of goods sold - (760 806) (44 698) (38 428) (843 932)Employee benefits expense (692 114) (348 457) (134 788) (58 024) (1 233 382)Other operating expenses (1 745 544) (294 866) (101 525) (55 554) (2 197 489)
EBITDA 120 350 40 001 74 654 (28 590) 206 414
Geografical areas Norway Sweden Other Total Gross revenue 2 253 294 7 523 865 300 335 10 077 494
Net revenue 895 016 3 105 835 339 154 4 340 005 Other operating income 1 374 18 066 69 19 509
Total external revenues 896 390 3 123 901 339 223 4 359 514 Internal revenues 104 311 - 17 348 121 659
Total revenues 1 000 701 3 123 901 356 571 4 481 173
B R A G A N Z A A B │ N O T E S G R O U P

26
NOTE 6. SUBSIDIARIES
Company
Acquisition/incorporation
date Company no. Location Country
Share ownership
2015
Share ownership
2014
Braganza AS 2013 912 414 353 Oslo Norway 100% 100%
Braathens Travel Group AB 2010 556445-4170 Stockholm Sweden 100% 100%
Ticket Leisure Travel AB 2010 556428-9592 Stockholm Sweden 100% 100%
Ticket Business Travel AB 2010 556411-9252 Stockholm Sweden 25% 100%
Dyreparken Utvikling AS 2001 990 903 700 Kristiansand Norway 95% 95%
Wayday Travel AS 2007 991 353 305 Oslo Norway 91% 100%
Braganza II AB 1999 556575-4438 Stockholm Sweden 100% 100%
Arken Zoo Holding AB 2006 556747-5651 Stockholm Sweden 0% 96%
Escape Travel Sweden II AB 2005 556747-4860 Stockholm Sweden 0% 100%
Braathens Group AB 2007 556727-6224 Stockholm Sweden 100% 100%
Braathens Aviation AS 1989 955 309 847 Oslo Norway 100% 100%
Formentera AS 1997 978 666 259 Oslo Norway 100% 100%
Bramora AS 2005 988 030 635 Oslo Norway 100% 100%
Breibukt Holding AS 2006 989 332 619 Oslo Norway 100% 100%
Braathens Aviation AB 2007 556747-6592 Malmö Sweden 100% 100%
Braathens IT AS 2002 884 729 432 Lysaker Norway 100% 100%
LG Braathens Rederi AS 2004 887 434 972 Oslo Norway 51% 51%
Braconda AS 2003 986 007 423 Oslo Norway 100% 100%
Braathens Travel Group AS 2002 984 686 625 Oslo Norway 95% 95%
Scenorama AS 2008 992 958 650 Oslo Norway 91% 100%
Råsport AS 2008 993 044 997 Oslo Norway 0% 100%
Escape Travel AS 2004 987 239 557 Oslo Norway 100% 100%
Stay AS 2008 986 572 155 Oslo Norway 78% 78%
JK Safaris Scandinavia AB 2011 556706 7821 Stockholm Sweden 100% 100%
Escape Travel A/S 2011 15742100-33 Copenhagen Denmark 100% 100%
Ticket Commercial Ltd 2012 7110286 London United Kingdom 100% 100%
Braathens Domains Ltd 2012 7110139 London United Kingdom 100% 100%
Escape Travel Sweden AB 2012 556739 8382 Göteborg Sweden 75% 75%
Braganza Group 2 AB 2013 556938-7524 Stockholm Sweden 100% 100%
Bramora AB 2013 556938-7367 Stockholm Sweden 100% 100%
Bralanta AB 2013 556938-7375 Stockholm Sweden 100% 100%
Braconda AB 2013 556938-7516 Stockholm Sweden 100% 100%
Ludv. G. Braathens Rederi AB 2013 556938-7508 Stockholm Sweden 100% 100%
Bradana AS 2014 945 736 755 Oslo Norway 100% 100%
BraDana Danmark A/S 2014 15706295 Rønde Denmark 100% 100%
Braathens IT Solutions AB 2007 556747-6477 Stockholm Sweden 100% 100%
B R A G A N Z A A B │ N O T E S G R O U P
27
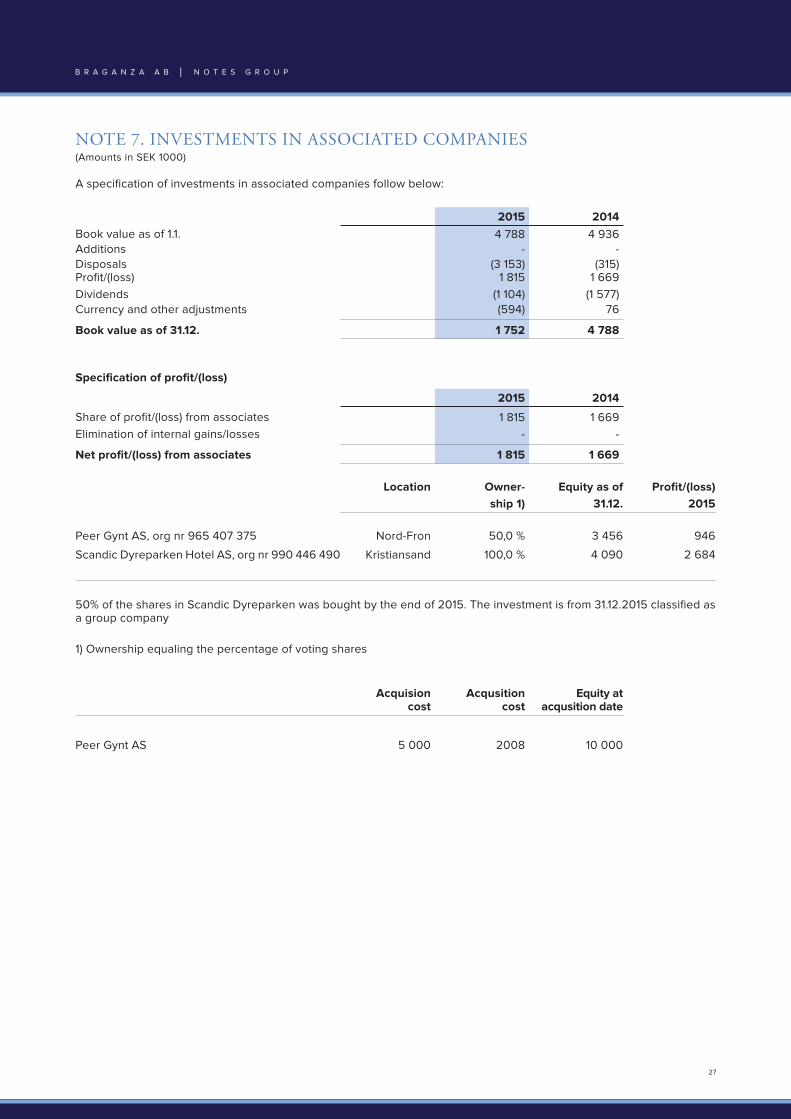
NOTE 7. INVESTMENTS IN ASSOCIATED COMPANIES (Amounts in SEK 1000)
2015 2014Book value as of 1.1. 4 788 4 936 Additions - - Disposals (3 153) (315)Profit/(loss) 1 815 1 669 Dividends (1 104) (1 577)Currency and other adjustments (594) 76
Book value as of 31.12. 1 752 4 788
Specification of profit/(loss)
2015 2014
Share of profit/(loss) from associates 1 815 1 669 Elimination of internal gains/losses - -
Net profit/(loss) from associates 1 815 1 669
Location Owner- Equity as of Profit/(loss)ship 1) 31.12. 2015
Peer Gynt AS, org nr 965 407 375 Nord-Fron 50,0 % 3 456 946
Scandic Dyreparken Hotel AS, org nr 990 446 490 Kristiansand 100,0 % 4 090 2 684
50% of the shares in Scandic Dyreparken was bought by the end of 2015. The investment is from 31.12.2015 classified as a group company
1) Ownership equaling the percentage of voting shares
Acquision cost
Acqusition cost
Equity at acqusition date
Peer Gynt AS 5 000 2008 10 000
B R A G A N Z A A B │ N O T E S G R O U P
A specification of investments in associated companies follow below:

28
NOTE 8. LONG TERM INVESTMENTS (Amounts in SEK 1000)
Long term investments
Company Book value Share
Jetscape Aviation Group 118 408 11%Musti ja Mirri Group 55 256 5,5%Neqst 1 AB - 12%Neqst 2 AB 26 000 20%Domain Ventures Partners 19 490 10%Vickers Private Equity Fund 2 937 48%Other 1 604 -
Total 223 695
Individual valuation is made for each investment. All investments market value exceeds book value.
B R A G A N Z A A B │ N O T E S G R O U P

29
NOTE 9. SALARY AND PERSONNEL COSTS, NUMBER OF EMPLOYEES, LOANS TO EMPLOYEES AND AUDITOR’S FEE
Total for all employees
Salary and personnel costs: 2015 2014Salaries 848 301 839 805 Payroll tax 247 173 221 968 Pension costs 92 890 88 337 Other benefits 55 509 86 133 Capitalized wage expenses (994) (2 861)
Total 1 242 879 1 233 382
Average number of employees by gender and country
2015 2015 2015 2014 2014 2014
Female Male Total Female Male TotalSweden 736 487 1 223 732 504 1 236Norway 306 164 470 285 148 433Spain - - - 26 8 34Denmark - 1 1 - 1 1Liechtenstein - - - 1 1 2Total 1 042 652 1 694 1 044 662 1 706
62% 38% 61 % 39 %
Management and board remuneration2015 2014
Salary and bonus 12 800 13 843 Other benefits 212 169 Total 13 012 14 012 There is no severance pay agreement
Distribution senior management 2015 2014 Women:Members of board - -Other senior management incl MD 1 1Men:Members of board 7 7Other senior management incl MD 4 4
Total 12 12
AuditorSpecification of auditor’s fee 2015 (ex VAT)
Statutoryaudit fee
Other assurance
services
Tax advisory
fee
Other non-audit
servicesTotal 2015Group
Deloitte - 2 920 - 299 - 274 - 294 - 3 787Other auditors - - - - -Total - 2 920 - 299 - 274 - 294 - 3 787
Specification of auditor’s fee 2014 (ex VAT)
Statutoryaudit fee
Other assurance
services
Tax advisory
fee
Other non-audit
servicesTotal 2014Group
Deloitte - 2 766 - 127 - 60 - 1 195 - 4 147Other auditors - 424 - 70 - - 12 - 506
Total (3 190) (197) (60) (1 207) (4 653)
B R A G A N Z A A B │ N O T E S G R O U P
30
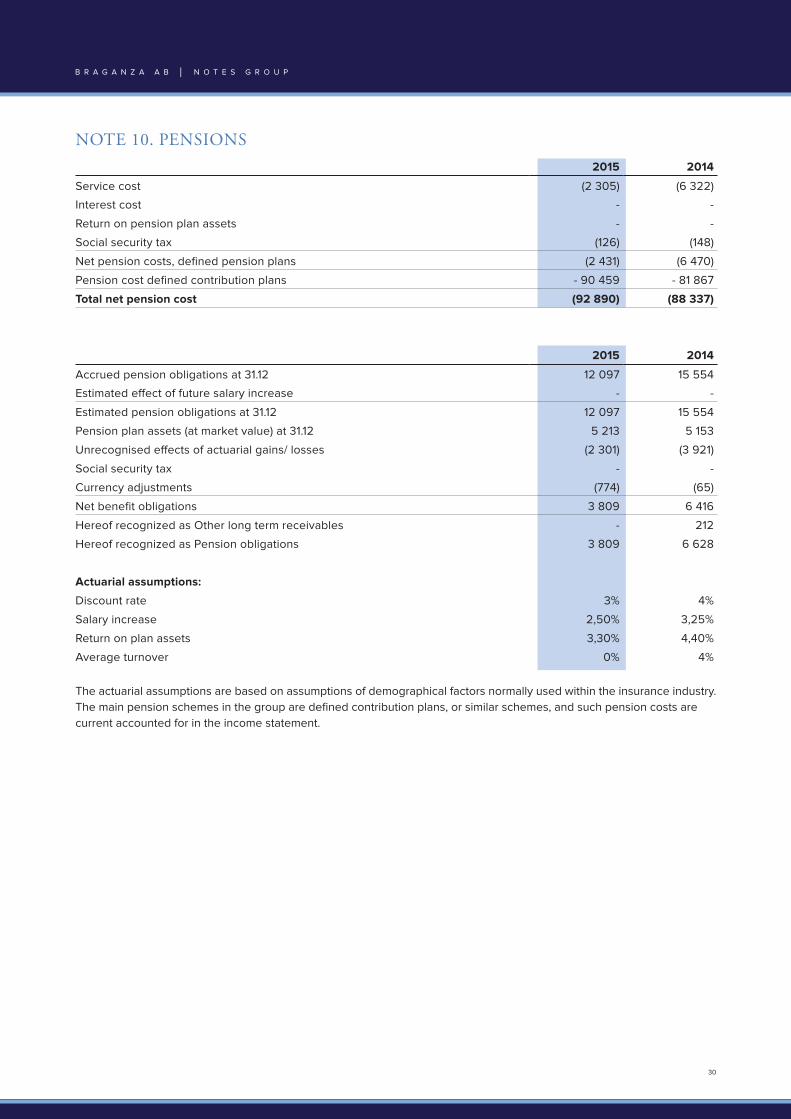
NOTE 10. PENSIONS
The actuarial assumptions are based on assumptions of demographical factors normally used within the insurance industry.The main pension schemes in the group are defined contribution plans, or similar schemes, and such pension costs are current accounted for in the income statement.
2015 2014
Service cost (2 305) (6 322)
Interest cost - -
Return on pension plan assets - -
Social security tax (126) (148)
Net pension costs, defined pension plans (2 431) (6 470)
Pension cost defined contribution plans - 90 459 - 81 867
Total net pension cost (92 890) (88 337)
2015 2014
Accrued pension obligations at 31.12 12 097 15 554
Estimated effect of future salary increase - -
Estimated pension obligations at 31.12 12 097 15 554
Pension plan assets (at market value) at 31.12 5 213 5 153
Unrecognised effects of actuarial gains/ losses (2 301) (3 921)
Social security tax - -
Currency adjustments (774) (65)
Net benefit obligations 3 809 6 416
Hereof recognized as Other long term receivables - 212
Hereof recognized as Pension obligations 3 809 6 628
Actuarial assumptions:
Discount rate 3% 4%
Salary increase 2,50% 3,25%
Return on plan assets 3,30% 4,40%
Average turnover 0% 4%
B R A G A N Z A A B │ N O T E S G R O U P

31
NOTE 11. OTHER OPERATING INCOME AND EXPENSES (Amounts in SEK 1000)
Other operating income consists of:
2015 2014
Gain on sale of fixed assets 4 862 1 211
Currency translation gain on operational receivables and payables 8 751 15 487
Other (described below) 3 377 2 856
Total 16 990 19 554
Other income consists of market contribution and release of liability for tickets, bonus points, agent commission and other accruals.
Other operating expenses consists of:
2015 2014
Aviation related costs (1 460 237) (1 268 617)
Cost of leases (165 812) (150 039)
Marketing costs (132 988) (157 825)
IT costs (94 196) (180 061)
External consultants, advisors etc. (48 766) (55 037)
Cost of travel (47 988) (43 324)
Hotel accomodation (15 103) (11 366)
Other (298 172) (331 153)
Total (2 263 263) (2 197 422)
B R A G A N Z A A B │ N O T E S G R O U P

32
NOTE 12. OTHER FINANCIAL INCOME AND EXPENSES (Amounts in SEK 1000)
Other financial income
2015 2014
Gain from sale of shares 2 555 5 119
Changes in value of equity investments 0 2 629
Gain on foreign exchange 31 382 44 455
Other financial income 18 058 12 311
Total other finance income 51 996 64 514
Other financial expenses
2015 2014
Loss /changes in value of equity investments (5 148) (5 584)
Loss on foreign exchange (47 155) (10 962)
Other financial expenses (19 791) (1 553)
Total other finance expenses (72 094) (18 099)
B R A G A N Z A A B │ N O T E S G R O U P

33
NOTE 13. TAXES (Amounts in SEK 1000)
2015 2014
Income tax expenseTax payable 671 4 701 Changes in deferred tax 29 596 17 582 Tax effect of group contribution 0 - Adjustments for prior years 7 10 Other changes - - Total income tax expense (+) / tax income (-) 30 274 22 293
Changes in deferred tax Changes recognized in profit and loss 29 596 17 582 Changes recognized against equity - 0 Changes due to business combinations 13 786 - Other (8 424) (213)Currency adjustments (481) (53)Total changes in deferred tax 34 477 17 316
Profit before tax (356 204) (75 636)
Tax rate 22% 78 365 16 640 Effect of unrecognized timing differences and tax loss 1 616 3 271 Revaluation of unrecognized timing differences and tax loss prior years 950 (1 146)Adjustments for prior years - (83)Permanent differences (53 647) (1 483)Share of net profit from associates (490) (451)Effect of change in tax rate 1 285 - Effect of different tax rates 2 803 6 114 Other (608) (569)Income tax expense (+) / tax income (-) 30 274 22 293
Temporary differencesDeferred tax assetsPensions 45 424 Inventory 294 167 Intangible assets 211 433 Tangible assets 5 798 9 446 Accounts receivables and other receivables 73 23 Provisions and short term debt 4 115 Gains and losses 159 (1 172)Tax loss carried forward 35 439 69 059 Deferred tax assets 42 024 78 496
Deferred tax liabilitiesIntangible assets 14 797 - Tangible assets 10 046 12 765 Accounts receivables 118 - Construction contracts - - Gains and losses 947 12 Untaxed reserves 1 063 1 063 Other differences (6 052) - Deferred tax liabilities 20 920 13 841
Net deferred tax assets (-liability) 21 104 64 656 Hereof not recognized in the balance sheet 15 411 16 494 Net deferred tax assets (-liability) 5 693 48 162 Hereof recognized as deferred tax asset 25 967 63 013 Hereof recognized as deferred tax liability 20 274 14 851
B R A G A N Z A A B │ N O T E S G R O U P

34
NOTE 14. INTANGIBLE ASSETS (Amounts in SEK 1000)
Brands and other intangible
assetsGoodwill Total
1 January – 31 December 2015
Balance as of 1 January 2015 253 509 66 044 319 554 Additions 66 871 - 66 871 Additions from purchase of companies - 15 554 15 554 Disposals (2 218) - (2 218)Disposals from sale of companies (7 678) (16 683) (24 361)Amortisation (11 672) (15 665) (27 337)Impairment loss (1 164) - (1 164)Currency translation differences (441) (2 086) (2 528)Balance as of 31 december 2015 297 207 47 164 344 371
As of 31 December 2015Cost of acquisition 365 188 327 492 692 680 Accumulated amortisation and imparment losses (67 981) (280 327) (348 309)
Balance as of 31 December 2015 297 207 47 164 344 371
Brands and other intangible
assetsGoodwill Total
1 January – 31 December 2014
Balance as of 1 January 2014 323 257 121 736 444 993 Additions 31 895 - 31 895 Additions from purchase of companies - 560 560 Disposals (269) (1 062) (1 331)Disposals from sale of companies (3 472) - (3 472)Amortisation (9 851) (52 118) (61 970)Impairment loss (89 822) (3 159) (92 981)Currency translation differences 1 772 87 1 859 Balance as of 31 december 2014 253 509 66 044 319 554
As of 31 December 2014Cost of acquisition 404 496 379 753 784 249 Accumulated amortisation and imparment losses (150 986) (313 709) (464 695)
Balance as of 31 December 2014 253 509 66 044 319 554
Goodwill for each acquisition Carrying amount 31 December Useful economic lifeSverigeFlyg 11 096 5 years Dyreparken/Kaptein Sabeltann 15 250 20 years Dyreparken Hotell AS 11 658 5 years Sabra Tours 6 552 5 years Two Travel AS 2 608 5 years
Total 47 164
Goodwill for Kaptein Sabeltann is related to the concept for a limited number of years.
Depreciation of intangible assets:Brands are tested for impairment on a yearly basis. Other intangible assets are depreciated according to their estimated economic useful life.
B R A G A N Z A A B │ N O T E S G R O U P

35
NOTE 15. TANGIBLE ASSETS (Amounts in SEK 1000)
Properties and land
Aircraft, engines and
similarPre-
payments Equipment Total
1 January – 31 December 2015
Balance as of 1 January 2015 489 247 180 068 289 957 87 005 1 046 277 Additions 17 943 11 452 214 091 29 431 272 918 Additions from purchase of companies 3 364 - - 5 745 9 109 Disposals (1 506) (12 536) - 705 (13 337)Disposals from sale of companies - - (289 957) (3 471) (293 428)Amortisation (29 920) (42 822) - (25 740) (98 482)Impairment loss - - - - - Currency translation differences (39 944) (1 211) - (2 241) (43 397)
Balance as of 31 december 2015 439 185 134 950 214 091 91 434 879 660
As of 31 December 2015Cost of acquisition 743 984 388 398 214 091 241 433 1 587 905 Accumulated amortisation and imparment losses (304 799) (253 448) - (149 998) (708 245)
Balance as of 31 December 2015 439 185 134 950 214 091 91 434 879 660
Properties and land
Aircraft, engines and
similarPre-
payments Equipment Total
1 January – 31 December 2014
Balance as of 1 January 2014 486 427 249 538 241 581 97 763 1 075 309 Additions 34 243 14 555 - 14 859 63 657 Additions from purchase of companies 36 227 - - 2 364 38 591 Disposals (7 121) (4 710) - (2 788) (14 619)Disposals from sale of companies (30 420) - - (624) (31 044)Amortisation (30 252) (79 296) - (24 461) (134 009)Impairment loss - - - (412) (412)Currency translation differences 143 (19) 48 376 305 48 805
Balance as of 31 december 2014 489 247 180 068 289 957 87 005 1 046 277
As of 31 December 2014Cost of acquisition 791 509 409 174 289 957 253 686 1 744 326 Accumulated amortisation and imparment losses (302 262) (229 106) - (166 681) (698 049)
Balance as of 31 December 2014 489 247 180 068 289 957 87 005 1 046 277
Depreciation of tangible assets:
Properties and land
Aircraft, engines and
similarPre-
payments EquipmentDepreciation method Straight line Straight line NA Straight lineExpected useful economic life 25 – 40 5 – 15 years NA 3 – 10 years
B R A G A N Z A A B │ N O T E S G R O U P
36
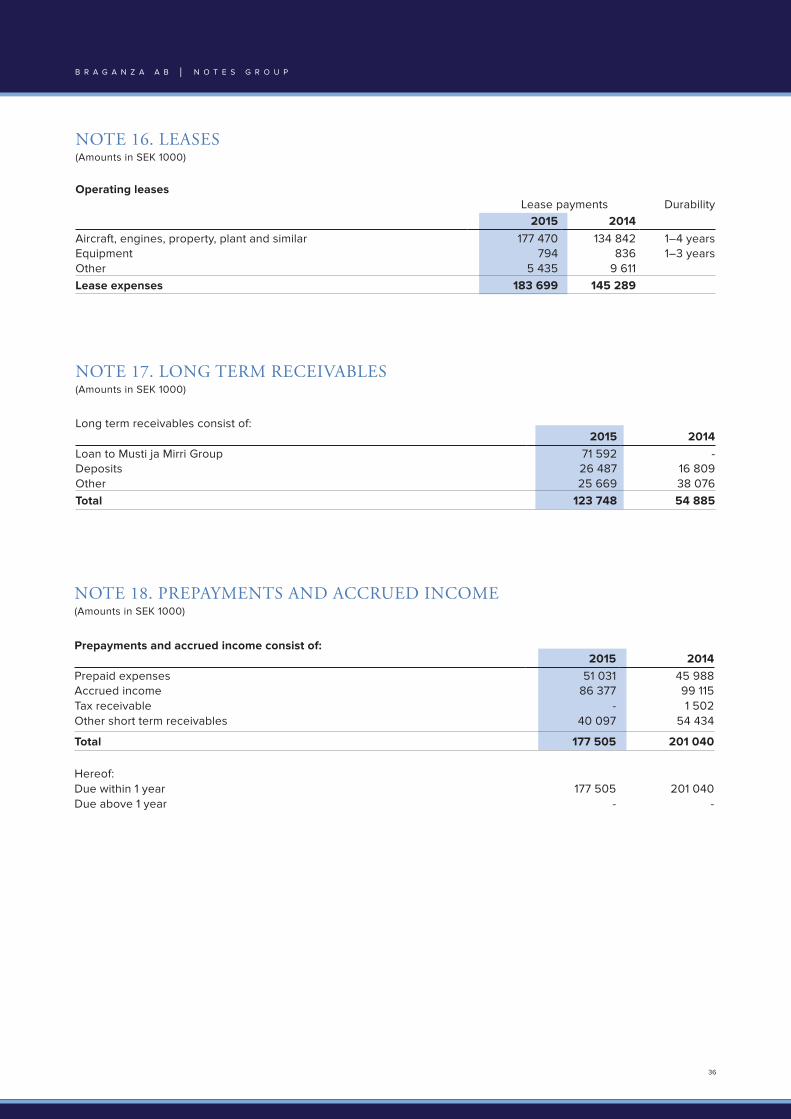
NOTE 16. LEASES (Amounts in SEK 1000)
Operating leases Lease payments Durability
2015 2014Aircraft, engines, property, plant and similar 177 470 134 842 1–4 yearsEquipment 794 836 1–3 yearsOther 5 435 9 611 Lease expenses 183 699 145 289
B R A G A N Z A A B │ N O T E S G R O U P
NOTE 17. LONG TERM RECEIVABLES (Amounts in SEK 1000)
Long term receivables consist of:2015 2014
Loan to Musti ja Mirri Group 71 592 - Deposits 26 487 16 809 Other 25 669 38 076 Total 123 748 54 885
NOTE 18. PREPAYMENTS AND ACCRUED INCOME (Amounts in SEK 1000)
Prepayments and accrued income consist of:2015 2014
Prepaid expenses 51 031 45 988 Accrued income 86 377 99 115 Tax receivable - 1 502 Other short term receivables 40 097 54 434
Total 177 505 201 040
Hereof:Due within 1 year 177 505 201 040 Due above 1 year - -

37
NOTE 19. CASH AND CASH EQUIVALENTS (Amounts in SEK 1000)
Cash and cash equivalents consists of:2015 2014
Bank deposits 667 893 944 554
Total 667 893 944 554 Whereof restricted 74 251 44 151
B R A G A N Z A A B │ N O T E S G R O U P
NOTE 20. INTEREST BEARING DEBT (Amounts in SEK 1000)
The Group’s interest bearing debt have the following characteristics:
Short term Long term2015 2014 2015 2014
Interest bearing debt by type Loan from financial institutions 87 953 101 110 190 333 226 970 Bond - - - 222 531 Total 87 953 101 110 190 333 449 501
Time to maturityDue between year 1 and 5 190 333 449 501 Due after year 5 - - Total 190 333 449 501
Secured debtDebt secured by collateral 278 252 327 924
Type of securityAircraft, engines and similar - - Property and plant 418 370 465 428 Inventory 14 507 18 323 Other - - Total book value of security 432 877 483 751
There are financial covenants linked to the long term debt in which are in compliance with all such covenants by year end.
The fleet renewal program is assumed financed by export development banks, and long term capital lease debt is ex-pected to increase significantly in the coming years. A revised delivery schedule is agreed, the Cseries is expected to be delivered in 2018 and 2019. Braathens Aviation is expected to take delivery of six ATR 72-600 during 2016, asumed financed by export developement banks.

38
NOTE 22. EQUITY (Amounts in SEK 1000)
NOTE 21. OTHER LONG TERM LIABILITIES AND ACCRUED EXPENSES AND DEFERRED INCOME (Amounts in SEK 1000)
Other long term liabilities consist of:2015 2014
Loan from Shareholders 43 710 14 946 Deposition 4 570 8 474 Other 1 852 3 596
Total other long term liabilities 50 132 27 016
Time to maturityDue between year 1 and 5 47 481 24 248 Due after year 5 2 651 2 768
Total 50 132 27 016
Accrued expenses and deferred income consist of:2015 2014
Tickets sold not used 240 480 256 550 Liabilities arising from customer loyalty programs - - Salaries and other employee benefits 174 482 157 397 Other prepayments from customers 217 693 193 366 Other 105 386 145 006
Total accrued expenses and deferred income 738 041 752 319
B R A G A N Z A A B │ N O T E S G R O U P
Issued capital
Other restricted
equity
Other equity
Non-controlling
interestsTotal
Equity as of 1 January 46 086 3 771 1 380 532 9 774 1 440 163 Capital increase - - - Divestment - Purchase from(-)/Saltes to (+) non-controlling interests - 83 83
Dividends (75 230) (818) (76 048)Other - - Foreign currency translation differences (42 545) (1 226) (43 770)Net profit for the year - 322 033 3 898 325 931
Equity 31 December 46 086 3 771 1 584 790 11 711 1 646 358

39
B R A G A N Z A A B │ N O T E S G R O U P
NOTE 23. SHAREHOLDERS (Amounts in SEK 1000)
Shareholders as of 31 December Number of shares In percent
Per G. Braathen 314 52 %Eline B. Braathen 96 16 %Ida P. Braathen 96 16 %Peer G. Braathen 96 16 %
Total 602 100 %
NOTE 24. GUARANTEE LIABILITIES AND PLEDGED ASSETS (Amounts in SEK 1000)
The pledged assets for the group consist of:2015 2014
Property mortgages - 750 Chattel mortgages 72 350 73 850 Deposits 28 658 18 887 Blocked accounts 70 180 40 634 Travel Guarantees 2 000 2 000 Property and plant 418 370 465 428 Inventory 14 507 18 323
Total 606 065 619 872
Other pledged assets, see note 20.
Commonly used represenations and warranties applies with regards to the disposal of Arken Zoo Holding and Ticket Biz in 2015. No contractual claims have been made by the purchasers.
Braathens Aviation AB (publ) became in February 2016 a guarantor of the operating leases between Braathens Regional Airways (lessee) and subsidiaries of Bramora Ltd (lessor) regarding three ATR 72-600.
In the ordinary course of business the Group has given the following guarantees:2015 2014
Travel insurance 146 867 164 471 Rental guarantees 13 513 6 480 Kammarkollegiet Sweden - 11 600 Guarantee commitments - 9 413 Bank Guarantees 5 613 5 906 RGF Norway - 2 103 Guarantee commitment PRI - 700
Total 165 993 200 673

40
NOTE 25. TRANSACTIONS WITH RELATED PARTIESLoans from shareholders are disclosed in note 21. Bramora Ltd’s purchases of Braathens Leasing Ltd. of 45 MUSD, which resulted in a profit of 74 MSEK, is a transaction be-tween the same beneficial owners.
By year end Braganza had provided Bramora Ltd with a short term bridge loan of 330 MSEK, which is considered to be in the best commercial interest of the Braganza group
as these short term loans made it possible to start renewal process of the turbo-prop fleet in Braathens Aviation. The loans were repaid in full in February 2016.
Two ATR 72-600 is on an opearting lease from the Bramora group to Braathens Aviation, with an additional aircraft de-livered in February 2016. Terms and conditions related to the leases is considered to be on arm-length distance.
B R A G A N Z A A B │ N O T E S G R O U P
NOTE 26. EVENTS AFTER THE REPORTING PERIODSubsequent to 31 December 2015 no events have occured that would have affected the financial statements in a sig-nificant way.
Braganza AB successfully sold all its shares in Jetscape Inc 30 March 2016 to Nordic Aviation Capital (NAC). Jetscape is a leading lessor of Embraer E-jets and Braganza has been a
shareholder in Jetscape since 2008. Braganza will book a profit in 2016 in relation to this transaction.
In accordance with the Sale and Purchase Agreement, the group is entitled to an earn-out of 1, 9 MEUR regarding the sale of Ticket Biz which will be booked in the 2016 accounts.
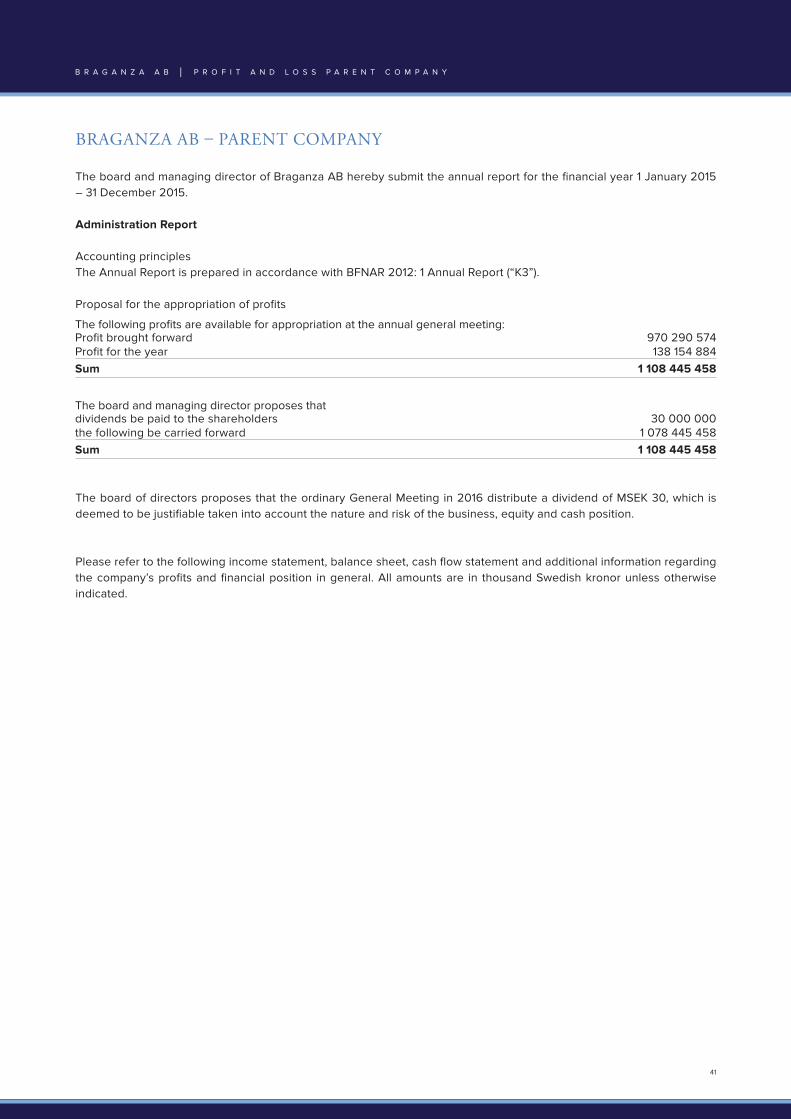
41
BRAGANZA AB – PARENT COMPANY
The board and managing director of Braganza AB hereby submit the annual report for the financial year 1 January 2015 – 31 December 2015.
Administration Report
Accounting principles The Annual Report is prepared in accordance with BFNAR 2012: 1 Annual Report (“K3”).
Proposal for the appropriation of profits
The board of directors proposes that the ordinary General Meeting in 2016 distribute a dividend of MSEK 30, which is deemed to be justifiable taken into account the nature and risk of the business, equity and cash position.
Please refer to the following income statement, balance sheet, cash flow statement and additional information regarding the company’s profits and financial position in general. All amounts are in thousand Swedish kronor unless otherwise indicated.
B R A G A N Z A A B │ P R O F I T A N D L O S S P A R E N T C O M P A N Y
The following profits are available for appropriation at the annual general meeting:Profit brought forward 970 290 574 Profit for the year 138 154 884Sum 1 108 445 458
The board and managing director proposes thatdividends be paid to the shareholders 30 000 000the following be carried forward 1 078 445 458Sum 1 108 445 458

42
B R A G A N Z A A B │ P R O F I T A N D L O S S P A R E N T C O M P A N Y
BRAGANZA AB – PARENT COMPANY (Amount in TSEK)
INCOME STATEMENT Note 2015 2014
Net sales 12 698 13 422
Revenue 12 698 13 422
Other external costs 1 - 28 032 - 27 298Personnel costs 2 - 3 962 - 3 877
Operating expenses - 31 994 - 31 175
Operating profit - 19 296 - 17 753
Result from financial investments
Result from participations in group companies 6 145 427 46 623
Other interest income and similar items 3 36 607 33 682Interest expense and similar items 4 -41 326 - 15 659
Financial items 140 708 64 646
Profit/ after financial items 121 412 46 893
Received group contribution 24 373 6 760
Submitted group contribution - 7 600 -
Tax on profit for the year 5 - - 138
NET PROFIT FOR THE YEAR 138 155 53 515

43
BALANCE SHEET (Amount in TSEK)
ASSETS Note 2015 2014
Fixed assets
Financial assets
Shares in group companies 6 812 820 890 253
Receivables from group companies 144 091 354 228
Other long-term securities 7 51 264 -Other long-term receivables 65 881 -
Total financial assets 1 074 056 1 244 481
Total fixed assets 1 074 056 1 244 481
Current assets
Current receivables
Receivables from group companies 35 887 18 833
Other receivables 331 596 138
Total current receivables 367 453 18 971
Other short-term investments - 73 813Cash and bank balances 143 453 138 555
Total current assets 510 936 231 339
TOTAL ASSETS 1 584 992 1 475 820
B R A G A N Z A A B │ B A L A N C E S H E E T P A R E N T C O M P A N Y
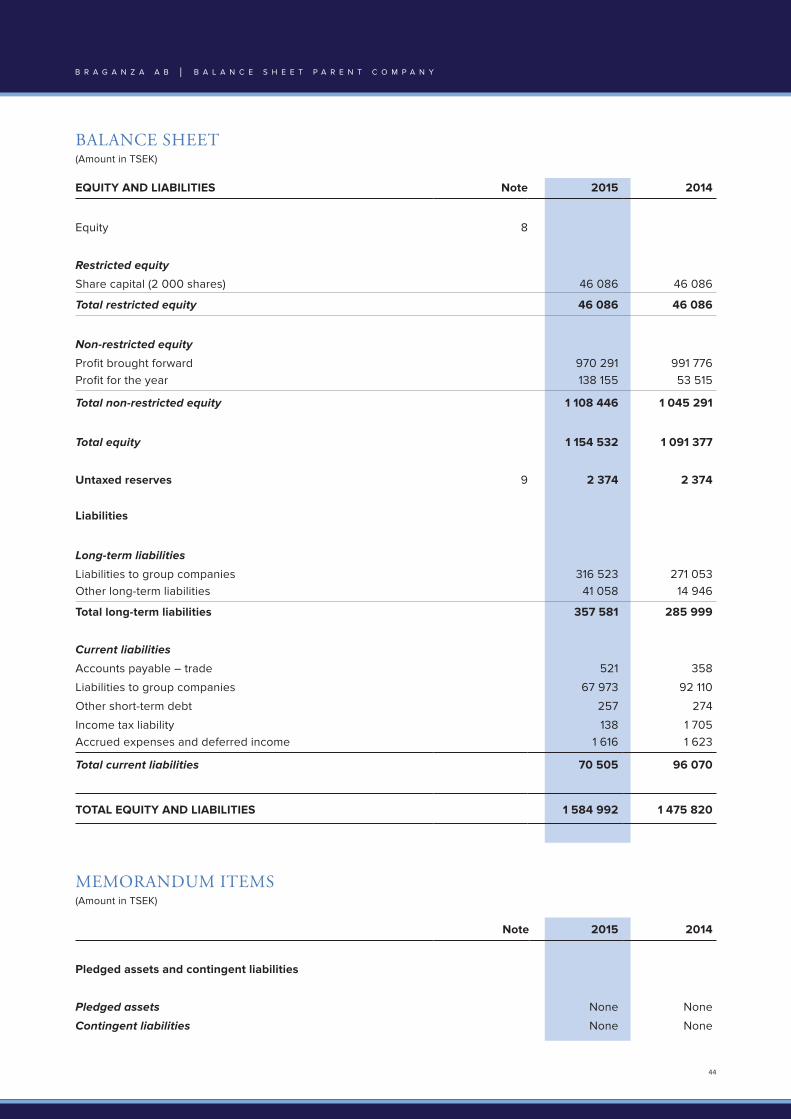
44
BALANCE SHEET (Amount in TSEK)
EQUITY AND LIABILITIES Note 2015 2014
Equity 8
Restricted equity
Share capital (2 000 shares) 46 086 46 086
Total restricted equity 46 086 46 086
Non-restricted equity
Profit brought forward 970 291 991 776Profit for the year 138 155 53 515
Total non-restricted equity 1 108 446 1 045 291
Total equity 1 154 532 1 091 377
Untaxed reserves 9 2 374 2 374
Liabilities
Long-term liabilities
Liabilities to group companies 316 523 271 053Other long-term liabilities 41 058 14 946
Total long-term liabilities 357 581 285 999
Current liabilities
Accounts payable – trade 521 358
Liabilities to group companies 67 973 92 110
Other short-term debt 257 274
Income tax liability 138 1 705Accrued expenses and deferred income 1 616 1 623
Total current liabilities 70 505 96 070
TOTAL EQUITY AND LIABILITIES 1 584 992 1 475 820
MEMORANDUM ITEMS(Amount in TSEK)
Note 2015 2014
Pledged assets and contingent liabilities
Pledged assets None None
Contingent liabilities None None
B R A G A N Z A A B │ B A L A N C E S H E E T P A R E N T C O M P A N Y

45
CASH FLOW STATEMENT 1.1 – 31.12 (Amount in TSEK)
2015 2014
Cash flows from operating activities
Profit/loss after financial items 121 412 46 893
Capital gain/loss assignable to the investing activities - 94 310 - 5 119
Adjustment for non-cash items - 73
Income tax paid - 1 567 -
Cash flows from operating activities before changes in working capital 25 535 41 847
Changes in working capital
Changes in current receivables - 348 512 - 7 126Changes in current liabilities - 23 998 82 729
Cash flows from operating activities - 346 975 117 450
Cash flows from investing activities
Disposal of subsidiaries 177 048 -
Payment for reduction of reserve fund 71 449
Acquisition of subsidiaries -44 483 - 36 277
Disposal of other short-term investments - 5 119
Acquisition of other long-term securities -51 264 330
Cash flow after investing activities 152 390 - 30 828
Cash flows from financing activities
Group contribution received / paid 16 743 6 760
Paid dividend - 75 000 - 90 000
Received shareholders’ contribution - 32 000 -
Liquidity effect related to last year’s merger - - 2 709
Changes in non-current receivables 144 345 7 507
Changes in non-current liabilities 71 582 62 960
Cash flow from financing activities 125 670 - 15 482
Cash flow of the year - 68 915 71 140
Revaluation other short-term investments - - 73
Cash & cash equivalents at beginning of period 212 368 141 301
CASH & CASH EQUIVALENTS AT END OF YEAR 143 453 212 368
B R A G A N Z A A B │ C A S H F L O W P A R E N T C O M P A N Y

46
NOTES(Amount in TSEK)
NOTE 1. DISCLOSURE OF AUDIT FEE AND COST REIMBURSEMENTS
2015 2014
Deloitte AB
Statutory audit fee 255 250
Other assurance services - -
Tax advisory fee - -Other non-audit services
Total 255 250
NOTE 2. PERSONELL
Average number of employees, distribution between men and woman 2015 2014
Women - -Men 1 1
Total 1 1
Distribution senior management 2015 2014
Women:
- The board of directors - -
- Senior management and managing director 1 1
Men:
- The board of directors 7 7
- Senior management and managing director 4 4
Total 12 12
Salaries and remunerations 2015 2014
The board and managing director 755 642
Other employees 2 482 2 498
Total salaries and remunerations 3 237 3 140
Social security charges according to law and union contract 624 486
Pension costs -
Total salaries, remunerations, social security charges and pension costs 3 861 3 626
B R A G A N Z A A B │ N O T E S P A R E N T C O M P A N Y

47
NOTE 3. OTHER INTEREST INCOME AND SIMILAR ITEMS
2015 2014
Interest income 16 113 14 645
Dividends 370 1 489
Capital gains from sales 4 500 5 119Exchange differences 15 624 12 429
Total 36 607 33 682
NOTE 4. INTEREST EXPENSE AND SIMILAR ITEMS
2015 2014
Interest expense - 9 247 - 8 917
Capital losses from sales - - 170Exchange differences - 32 079 - 6 572
Total - 41 326 - 15 659
NOTE 5. TAX
2015 2014
Components of tax on profit for the year :Current tax - - 138
Total - - 138
Profit before tax 138 155 53 653
Tax rate 22 % - 30 394 - 11 804
Tax effect of:
Permanent differences - 9 - 176
Permanent differences 30 403 11 842
Total - - 138
B R A G A N Z A A B │ N O T E S P A R E N T C O M P A N Y

48
B R A G A N Z A A B │ N O T E S P A R E N T C O M P A N Y
Directly controlledCorporate
identity number LocationNumber of
sharesShare
ownership Book value
Braganza AS 912414353 Oslo 99 510 100 % 15 183
Braathens Aviation AS 955308847 Oslo 1 312 400 100 % 29 564
Wayday Travel AS 991353305 Oslo 9 100 91 % 6 279
Braganza II AB 556575-4438 Stockholm 2 000 100 % 357 626
Bramora AS 988030635 Oslo 10 000 100 % 28 191
Breibukt Holding AS 989332619 Oslo 937 800 100 % 11 422
Braathens Travel Group AB 556445-4170 Stockholm 35 725 596 100 % 208 978
Dyreparken Utvikling AS 990903700 Kristiansand 940 000 94 % 89 793
Formentera AS 978668259 Oslo 6 000 100 % 20 943Bradana AS 945736755 Oslo 4 600 100 % 44 842
Sum 812 820
NOTE 6. SHARES IN GROUP COMPANIES
2015 2014
Acquisition value brought forward 890 253 853 976
Disposals -82 826 -
Payment for reduction of reserve fund -71 449 -
Increase of share capital through debt conversion 44 842 -
Submitted shareholders’ contributionNew share issue 32 000 36 277
Residual value carried forward 812 820 890 253
Result from participations in group companies
Dividend Braathens Travel Group AB 5 617
Profit on sale of shares in Arken Zoo AB 94 310
Capital gains on liability Bradana AS 7 600
Anticipatory dividend Braganza II AB 16 900Anticipatory dividend Braathens Travel Group AB 21 000
Total 145 427

49
NOTE 8. CHANGE IN EQUITY
Share capital
Non-Restricted
equity Total
Amount brought forward 46 086 1 045 291 1 091 377Dividend - 75 000 - 75 000
Net profit for the year 138 155 138 155
Amount carried forward 46 086 1 108 446 1 154 532
B R A G A N Z A A B │ N O T E S P A R E N T C O M P A N Y
NOTE 7. OTHER LONG-TERM SECURITIES
2015 2014
Book value brought forward - 330
Shares in Musto ja Mirri Group 51 264 - Dividend - - 330
Total 51 264 -

50
Stockholm May 2016
Per G. Braathen Nils Björn Allan FrölingManaging Director
Gunnar Grosvold Geir Stormorken
Gudleik Njå Jon Anders Risfelt
Vagn O. Sørensen
Our audit report was submitted on May 24.05.2016
Deloitte AB
Torbjörn SvenssonAuthorized public accountant
B R A G A N Z A A B │ N O T E S P A R E N T C O M P A N Y
NOTE 9. UNTAXED RESERVES
2015 2014
Tax allocation reserve 2013 2 374 2 374
Total 2 374 2 374

51
AUDITOR’S REPORT
B R A G A N Z A A B │ A U D I T O R ’ S R E P O R T
AUDITOR’S REPORT To the annual meeting of the shareholders of Braganza AB Corporate identity number 556930-1541 Report on the annual accounts and consolidated accounts We have audited the annual accounts and consolidated accounts of Braganza AB for the financial year 2015-01-01 - 2015-12-31. Responsibilities of the Board of Directors and the Managing Director for the annual accounts and consolidated accounts The Board of Directors and the Managing Director are responsible for the preparation and fair presentation of these annual accounts and consolidated accounts in accordance with the Annual Accounts Act and for such internal control as the Board of Directors and the Managing Director determine is necessary to enable the preparation of annual accounts and consolidated accounts that are free from material misstatement, whether due to fraud or error. Auditor’s responsibility Our responsibility is to express an opinion on these annual accounts and consolidated accounts based on our audit. We conducted our audit in accordance with International Standards on Auditing and generally accepted auditing standards in Sweden. Those standards require that we comply with ethical requirements and plan and perform the audit to obtain reasonable assurance about whether the annual accounts and consolidated accounts are free from material misstatement. An audit involves performing procedures to obtain audit evidence about the amounts and disclosures in the annual accounts and consolidated accounts. The procedures selected depend on the auditor’s judgement, including the assessment of the risks of material misstatement of the annual accounts and consolidated accounts, whether due to fraud or error. In making those risk assessments, the auditor considers internal control relevant to the company’s preparation and fair presentation of the annual accounts and consolidated accounts in order to design audit procedures that are appropriate in the circumstances, but not for the purpose of expressing an opinion on the effectiveness of the company’s internal control. An audit also includes evaluating the appropriateness of accounting policies used and the reasonableness of accounting estimates made by the Board of Directors and the Managing Director, as well as evaluating the overall presentation of the annual accounts and consolidated accounts. We believe that the audit evidence we have obtained is sufficient and appropriate to provide a basis for our audit opinions. Opinions In our opinion, the annual accounts and consolidated accounts have been prepared in accordance with the Annual Accounts Act and present fairly, in all material respects, the financial position of the parent company and the group as of 31 December 2015 and of their financial performance and its cash flows for the year then ended in accordance with the Annual Accounts Act. The statutory administration report is consistent with the other parts of the annual accounts and consolidated accounts. We therefore recommend that the annual meeting of shareholders adopt the income statement and balance sheet for the parent company and the group.
Report on other legal and regulatory requirements In addition to our audit of the annual accounts and consolidated accounts, we have also audited the proposed appropriations of the company’s profit or loss and the administration of the Board of Directors and the Managing Director of Braganza AB for the financial year 2015-01-01 - 2015-12-31. Responsibilities of the Board of Directors and the Managing Director The Board of Directors is responsible for the proposal for appropriations of the company’s profit or loss, and the Board of Directors and the Managing Director are responsible for administration under the Companies Act. Auditor’s responsibility Our responsibility is to express an opinion with reasonable assurance on the proposed appropriations of the company’s profit or loss and on the administration based on our audit. We conducted the audit in accordance with generally accepted auditing standards in Sweden. As a basis for our opinion on the Board of Directors’ proposed appropriations of the company’s profit or loss, we examined the Board of Directors’ reasoned statement and a selection of supporting evidence in order to be able to assess whether the proposal is in accordance with the Companies Act. As a basis for our opinion concerning discharge from liability, in addition to our audit of the annual accounts and consolidated accounts, we examined significant decisions, actions taken and circumstances of the company in order to determine whether any member of the Board of Directors or the Managing Director is liable to the company. We also examined whether any member of the Board of Directors or the Managing Director has, in any other way, acted in contravention of the Companies Act, the Annual Accounts Act or the Articles of Association. We believe that the audit evidence we have obtained is sufficient and appropriate to provide a basis for our opinions. Opinions We recommend to the annual meeting of shareholders that the profit be appropriated in accordance with the proposal in the statutory administration report and that the members of the Board of Directors and the Managing Director be discharged from liability for the financial year.
Malmö 24.05.2016
Deloitte AB
Signature on Swedish original
Torbjörn Svensson Authorized public accountant

BRAGANZA AB
P.O. BOX 61
GÅRDSFOGDEVÄGEN 16
KSE-16126 BROMMA
BRAGANZA AS
P.O. BOX 700, SKØYEN
KARENSLYST ALLÉ 2
N-0214 OSLO