Embed Size (px)
Citation preview

1 Control of the qualityof analytical methods
Introduction 1
Control of errors in analysis 2
Accuracy and precision 5
Validation of analyticalprocedures 7
The analytical procedure 7
Levels of precision 7
Repeatability 8
Intermediate precision 10
Reproducibility 10
Accuracy 10
Standard operating procedure(SOP) for the assay ofparacetamol tablets 10
Compound random errors 11
Reporting of results 13
Other terms used in thecontrol of analyticalprocedures 14
System suitability 14
Analytical blank 14
Calibration 14
Limit of detection 14
Limit of quantification 16
Linearity 16
Range 17
Robustness 18
Selectivity 18
Sensitivity 18
Weighing by difference 19
Basic calculations inpharmaceutical analysis 19
Percentage volume/volume(%v/v) 20
Percentage weight involume (%w/v) 20
Dilutions 20
Preparation of standardstock solutions 21
Percentage weight/weight(%w/w) 22
Parts per million (ppm)calculations 23
Working between weightsand molarity 23
Additional problems 24
IntroductionPharmaceutical analysis procedures may be used to answer any of the questions outlined
inBox1.1.Thequalityof aproductmaydeviate fromthe standard requiredbut incarrying
out an analysis one also has to be certain that the quality of the analysis itself is of the
standard required. Quality control is integral to all modern industrial processes and the
pharmaceutical industry is no exception. Testing a pharmaceutical product involves
chemical, physical and sometimes microbiological analyses. It has been estimated that
£10 billion is spent each year on analyses in the UK alone and such analytical processes
can be found in industries as diverse as those producing food, beverages, cosmetics,
detergents, metals, paints, water, agrochemicals, biotechnological products and
pharmaceuticals. With such large amounts of money being spent on analytical quality
control, great importance must be placed on providing accurate and precise analyses
(Box1.2).Thus it is appropriate tobegin abookon the topic of pharmaceutical analysisby
considering, at a basic level, the criteriawhich are used to judge the quality of an analysis.
The terms used in defining analytical quality form a rather elegant vocabulary that can be
used to describe quality inmany fields, and inwriting this book the authorwould hope to
describe each topic under consideration with accuracy, precision and, most importantly,
reproducibility, so that the information included in it can be readily assimilated and

reproducedwhere required by the reader. The following sections provide an introduction
to the control of analytical quality. More detailed treatment of the topic is given in the
reference cited at the end of the chapter.1
Control of errors in analysisA quantitative analysis is not a great deal of use unless there is some estimation of
how prone to error the analytical procedure is. Simply accepting the analytical result
could lead to rejection or acceptance of a product on the basis of a faulty analysis. For
this reason it is usual to make several repeat measurements of the same sample in order
to determine the degree of agreement between them. There are three types of errors
which may occur in the course of an analysis: gross, systematic and random. Gross
errors are easily recognised since they involve a major breakdown in the analytical
process such as samples being spilt, wrong dilutions being prepared or instruments
breaking down or being used in the wrong way. If a gross error occurs the results are
rejected and the analysis is repeated from the beginning. Random and systematic errors
can be distinguished in the following example:
Box 1.2 International Conference on Harmonisation (ICH) guidelines
The requirements for control of the quality of methods of analysis (validation) have been
addressed by the International Conference on Harmonisation of Technical Requirements
For Registration of Pharmaceuticals for Human Use, or, more briefly, the ICH (www.ich.
org). The ICH was initiated in Brussels in 1990 and brought together representatives of
regulatory agencies and industry associations of Europe, Japan and the USA. The
purpose of the organisation was to standardise the requirements for medicines regulation
throughout the world. The standardisation of the validation of analytical procedures is
one area that the ICH has addressed. The ICH indicated that the most important
analytical procedures that require validation are:
• Identification tests• Quantitative tests for impurities• Limit tests for the control of impurities• Quantitative tests of the active moiety in samples of drug substance or drug product or
other selected component(s) in the drug product.
Box 1.1 Questions pharmaceutical analysis methods are used to answer
• Is the identity of the drug in the formulated product correct?• What is the percentage of the stated content of a drug present in a formulation?• Does this formulation contain solely the active ingredient or are additional impurities
present?• What is the stability of a drug in the formulation and hence the shelf-life of the product?• Atwhat rate is thedrug releasedfrom its formulation so that it canbeabsorbedby thebody?• Do the identity and purity of a pure drug substance to be used in the preparation of a
formulation meet specification?• Do the identity and purity of excipients to be used in the preparation of a formulation
meet specification?• What are the concentrations of specified impurities in the pure drug substance?• What is the concentration of the drug in a sample of tissue or biological fluid?• What are the pKa value(s), partition coefficients, solubilities and stability of a drug
substance under development?
2 Pharmaceutical analysis

A batch of paracetamol tablets are stated to contain 500 mg of paracetamol per
tablet; for the purpose of this example it is presumed that 100% of the stated content is
the correct answer. Four students carry out a spectrophotometric analysis of an extract
from the tablets and obtain the following percentages of stated content for the repeat
analysis of paracetamol in the tablets:
Student 1: 99.5%, 99.9%, 100.2%, 99.4%, 100.5%Student 2: 95.6%, 96.1%, 95.2%, 95.1%, 96.1%Student 3: 93.5%, 98.3%, 92.5%, 102.5%, 97.6%Student 4: 94.4%, 100.2%, 104.5%, 97.4%, 102.1%
The means of these results can be simply calculated according to the formula:
�x ¼Xi
xin
[Equation 1]
where �x is the arithmetic mean, xi is the individual value and n is the number of
measurements.
These results can be seen diagrammatically in Figure 1.1.
Student 1 has obtained a set of results which are all clustered close to 100% of the
stated content and with a mean for the five measurements very close to the correct
answer. In this case the measurements made were both precise and accurate, and
obviously the steps in the assay have been controlled very carefully.
Student2hasobtainedasetof resultswhicharecloselyclustered,butgiveameanwhich
is lower than the correct answer. Thus, although this assay is precise, it is not completely
accurate. Such a set of results indicates that the analyst has not produced random
errors, which would produce a large scatter in the results, but has produced an analysis
containing a systematic error. Such errors might include repeated inaccuracy in the
measurement of a volumeor failure to zero the spectrophotometer correctlyprior to taking
the set of readings. The analysis has been mainly well controlled except for probably
one step, which has caused the inaccuracy and thus the assay is precisely inaccurate.
90 95 100 105
Paracetamol % of stated content
mean
mean
mean
mean
Student 1: Precise and accurate
Student 2: Precise and inaccurate
Student 3: Impreciseand inaccurate
Student 4: Imprecise and accurate
Fig. 1.1
Diagrammatic
representation of
accuracy and precision for
analysis of paracetamol in
tablet form.
3Control of the quality of analytical methods

Student 3 has obtained a set of results which are widely scattered and hence
imprecise, and which give a mean which is lower than the correct answer. Thus the
analysis contains random errors or, possibly, looking at the spread of the results, three
defined errors which have been produced randomly. The analysis was thus poorly
controlled and it would require more work than that required in the case of student 2 to
eliminate the errors. In such a simple analysis the random results might simply be
produced by, for instance, a poor pipetting technique, where volumes both higher and
lower than that required were measured.
Student 4 has obtained a set of results which are widely scattered yet a mean which
is close to the correct answer. It is probably only chance that separates the results
of student 4 from those of student 3 and, although the answer obtained is accurate,
it would not be wise to trust it to always be so.
The best assay was carried out by student 1, and student 2 produced an assay that
might be improved with a little work.
In practice it might be rather difficult to tell whether student 1 or student 2 had
carried out the best analysis, since it is rare, unless the sample is a pure analytical
standard, that the exact content of a sample is known. In order to determine whether
student 1 or 2 had carried out the best assay it might be necessary to get other analysts
to obtain similar sets of precise results in order to be absolutely sure of the correct
answer. The factors leading to imprecision and inaccuracy in assay results are outlined
in Box 1.3.
Self-test 1.1
Suggest how the following might give rise to errors in an analytical procedure:
(i) Analysis of a sucrose-based elixir using a pipette to measure aliquots of the elixir for
analysis.
(ii) Weighing out 2 mg of an analytical standard on a four-place analytical balance which
weighs a minimum of 0.1 mg.
(iii) Use of an analytical standard that absorbs moisture from the atmosphere.
(iv) Incomplete powdering of coated tablets prior to extraction.
(v) Extraction of an ointment with a solvent in which it is poorly soluble.
(vi) Use of a burette that has not been rinsed free of traces of grease.
Answers:(i)Viscosityleadstoincompletedrainageofthepipette;(ii)Inanyweighing
thereisanuncertaintyof�0.05mg,whichinrelationto2mgis�2.5%;(iii)Thedegree
ofmoistureabsorptionisuncertain;(iv)Poorrecoveryoftheanalyte;(v)Poorrecovery
oftheanalyte;(vi)Distortionofmeniscusmakingreadingoftheburetteinaccurate.
Box 1.3 Some factors giving rise to imprecision and inaccuracy inan assay
• Incorrect weighing and transfer of analytes and standards• Inefficient extraction of the analyte from a matrix, e.g. tablets• Incorrect use of pipettes, burettes or volumetric flasks for volume measurement• Measurement carried out using improperly calibrated instrumentation• Failure to use an analytical blank• Selection of assay conditions that cause degradation of the analyte• Failure to allow for or to remove interference by excipients in the measurement of an
analyte
4 Pharmaceutical analysis

Accuracy and precisionThe most fundamental requirements of an analysis are that it should be accurate and
precise. It is presumed, although it cannot be proven, that a series of measurements (y)
of the same sample will be normally distributed about a mean (m), i.e. they fall into a
Gaussian pattern as shown in Figure 1.2.
The distance s shown in Figure 1.2 appears to be nearly 0.5 of the width of
distribution; however, because the function of the curve is exponential it tends to zero
and does not actually meet the x axis until infinity, where there is an infinitesimal
probability that there may be a value for x. For practical purposes approximately 68%
of a series of measurements should fall within the distance s either side of the mean
and 95% of the measurements should lie with 2s of the mean. The aim in an analysis is
to make s as small a percentage of the value of m as possible. The value of s can be
estimated using Equation 2:
s ¼ffiffiffiffiffiffiffiffiffiffiffiffiffiffiffiffiffiffiffiffiffiffiffiPðxi � �xÞ2ðn� 1Þ
s[Equation 2]
where:
s ¼ standard deviationn ¼ number of samplesxi ¼ values obtained for each measurement�x ¼ mean of the measurements
Sometimes n rather than n – 1 is used in the equation but, particularly for small samples,
it tends to produce an underestimate ofs. For a small number of values it is simple towork
out s using a calculator and the above equation. Most calculators have a function which
enablescalculationof sdirectlyands estimatedusing theaboveequation isusually labelled
as sn – 1. For instance, if the example of results obtained by student 1, where the mean
is calculated to be 99.9%, are substituted into equation 2, the following calculation results:
s ¼ffiffiffiffiffiffiffiffiffiffiffiffiffiffiffiffiffiffiffiffiffiffiffiffiffiffiffiffiffiffiffiffiffiffiffiffiffiffiffiffiffiffiffiffiffiffiffiffiffiffiffiffiffiffiffiffiffiffiffiffiffiffiffiffiffiffiffiffiffiffiffiffiffiffiffiffiffiffiffiffiffiffiffiffiffiffiffiffiffiffiffiffiffiffiffiffiffiffiffiffiffiffiffiffiffiffiffiffiffiffiffiffiffiffiffiffiffiffiffiffiffiffiffiffiffiffiffiffiffiffiffiffiffiffiffiffiffiffiffiffiffiffiffiffiffiffiffiffiffiffiffiffiffiffiffiffiffiffiffiffiffiffiffiffiffiffiffiffiffiffiffið99:5� 99:9Þ2 þ ð99:9� 99:9Þ2 þ ð100:2� 99:9Þ2 þ ð99:4� 99:9Þ2 þ ð100:5� 99:9Þ2
ð5� 1Þ
vuut
¼ffiffiffiffiffiffiffiffiffiffiffiffiffiffiffiffiffiffiffiffiffiffiffiffiffiffiffiffiffiffiffiffiffiffiffiffiffiffiffiffiffiffiffiffiffiffiffiffiffiffiffiffiffiffiffiffiffiffiffiffiffiffiffiffiffiffiffiffiffiffiffiffiffiffiffiffiffiffiffiffiffiffiffiffiffiffið�0:4Þ2 þ ð0Þ2 þ ð0:3Þ2 þ ð�0:5Þ2 þ ð0:6Þ2
4
vuut¼
ffiffiffiffiffiffiffiffiffiffiffiffiffiffiffiffiffiffiffiffiffiffiffiffiffiffiffiffiffiffiffiffiffiffiffiffiffiffiffiffiffiffiffiffiffiffiffiffiffiffiffiffiffiffiffiffiffiffiffiffi0:16þ 0þ 0:09þ 0:25þ 0:36
4
s¼
ffiffiffiffiffiffiffiffiffi0:864
s¼ ffiffiffiffiffiffiffiffiffiffiffi
0:215p ¼ 0:46
s ¼ 0.46% of stated content
μμ – σμ – 2σ μ + σ μ + 2σ
68%
y
x
Fig. 1.2
The Gaussian distribution.
5Control of the quality of analytical methods

The calculated value for s provides a formal expression of the scatter in the
results from the analysis rather than the visual judgement used in Figure 1.1. From
the figure obtained for the standard deviation (SD), we can say that 68% of the
results of the analysis will lie within the range 99.9� 0.46% (� s) or within the range99.44–100.36%. If we re-examine the figures obtained by student 1, it can be seen
that 60% of the results fall within this range, with two outside the range, including one
only very slightly below the range. The range based on � s defines the 68%
confidence limits; for 95% confidence � 2s must be used, i.e. 95% of the results
of student 1 lie within 99.9 � 0.92% or 98.98–100.82%. It can be seen that this range
includes all the results obtained by student 1.
The precision of an analysis is often expressed as the� relative standard deviation
(� RSD) (Equation 3).
RSD ¼ s
�x� 100% [Equation 3]
The confidence limits in this case are often not quoted but, since it is the SD
that is an estimate of s which is being used, they are usually 68%. The advantage
of expressing precision in this way is that it eliminates any units and expresses the
precision as a percentage of the mean. The results obtained from the assay of
paracetamol tablets are shown in Table 1.1.
Self-test 1.2
Four analysts obtain the following data for a spectrophotometric analysis of an injection
containing the local anaesthetic bupivacaine. The stated content of the injection is 0.25%
weight in volume (w/v).
Analyst 1: 0.245% w/v, 0.234% w/v, 0.263% w/v, 0.261% w/v, 0.233% w/v.
Analyst 2: 0.236% w/v, 0.268% w/v, 0.247% w/v, 0.275% w/v, 0.285% w/v.
Analyst 3: 0.248% w/v, 0.247% w/v, 0.248% w/v, 0.249% w/v, 0.253% w/v.
Analyst 4: 0.230% w/v, 0.233% w/v, 0.227% w/v, 0.230% w/v, 0.229% w/v.
Calculate the mean percentage of stated content and RSD for each set of results at the 68%
confidence level. Assuming the content really is as stated on the label, comment on the
accuracy and precision of each set of results. Calculate the precision of each assay with regard
to 95% confidence limits.
Answers:Analyst1:98.9%�5.8%:accuratebutimprecise.At95%confidenceRSD¼�11.6%;Analyst2:104.9�7.7%:inaccurateandimprecise.At95%confidenceRSD¼�15.4%;Analyst3:99.6%�0.9%:accurateandprecise.At95%confidenceRSD¼�1.8%;
Analyst4:91.9%�0.9%:inaccurateandprecise.At95%confidenceRSD¼�1.8.
Table 1.1 Results obtained for the analysis of paracetamol tablets by four analysts
StudentMean (% of statedcontent)
S (% of statedcontent) � RSD (68% confidence)
1 99.9 0.5 � 0.5%
2 95.6 0.5 � 0.5%
3 96.9 4.0 � 4.4%
4 99.7 4.0 � 4.0%
6 Pharmaceutical analysis

Validation of analytical proceduresThe International Conference on Harmonisation (ICH) has adopted the following
terms for defining how the quality of an assay is controlled.
The analytical procedureThe analytical procedure provides an exact description of how the analysis is carried
out. It should describe in detail the steps necessary to perform each analytical test. The
full method should describe:
(i) the quality and source of the reference standard for the compound being analysed(ii) the procedures used for preparing solutions of the reference standard(iii) the quality of any reagents or solvents used in the assay and their method of
preparation(iv) the procedures and settings used for the operation of any equipment required in
the assay(v) the methodology used for calibration of the assay and methodology used for the
processing of the sample prior to analysis.
In fact it is difficult to be comprehensive in this short account, since the description
of a fully validated method is a lengthy document.
Levels of precisionThe ICH guidelines define precision as follows:
“the precision of an analytical procedure expresses the closeness of agreement
(degree of scatter) between a series of measurements obtained from multiple
sampling of the same homogeneous sample under the prescribed conditions. . .
The precision of an analytical procedure is usually expressed as the variance,
standard deviation or coefficient of variation of a series of measurements.”
This is broadlywhatwas described inmore detail above for the assay of paracetamol
tablets. There is no absolute guideline for how good precision should be for the active
ingredient in a formulation but, in general, a precision of < � 1.0% is desirable. The
precision achievable depends on the nature of the sample being analysed. The RSDs
achievable in the analysis of trace impurities in a bulk drug or drugs in biological fluids
may be considerably greater than� 1.0% because of the increased likelihood of losses
when very low concentrations of analyte are being extracted and analysed. The
precisionof theassayofaparticular sample, in the first instance, is generallyobtainedby
repeating the assay procedure a minimum of five times starting from five separate
aliquots of sample (e.g. five weights of tablet powder or five volumes of elixir) giving a
total of 25 measurements. Repetition of the sample extraction gives a measure of any
variation in recovery during extraction from the formulation matrix.
One difficulty in defining the precision of an assay is in indicating which steps in the
assay should be examined. Initially an assaywill be characterised in detail but thereafter,
in re-determining precision (e.g. in order to establish repeatability and intermediate
precision), certain elements in the assaymay be taken for granted. For example, the same
standard calibration solutionmay be used for several days provided its stability to storage
hasbeenestablished.Similarly thereneeds tobea limitednumberof samplesextracted for
assay, provided it has been established that the recovery of the sample upon extraction
does not vary greatly. According to the ICH guidelines, precision may be considered at
three levels: repeatability, intermediate precision and reproducibility.
7Control of the quality of analytical methods

RepeatabilityRepeatability expresses the precision obtained under the same operating conditions
over a short interval of time. Repeatability can also be termed intra-assay precision. It
is likely that the assay would be repeated by the same person using a single instrument.
Within repeatability it is convenient to separate the sample preparation method from
the instrument performance. Figure 1.3 shows the levels of precision including some
of the parameters which govern the system precision of a high-pressure liquid
chromatography (HPLC) instrument. It would be expected that the system precision of
a well-maintained instrument would be better than the overall repeatibility where
sample extraction and dilution steps are prone to greater variation than the
instrumental analysis step.
An excellent detailed summary of levels of precision is provided by Ermer. For
example Figure 1.4 shows the results obtained from five repeat injections of a mixture
of the steroids prednisone (P) and hydrocortisone (H) into a HPLC using amanual loop
injector. The mixture was prepared by pipetting 5 ml of a 1 mg/ml stock solution of
each steroid into a 100 ml volumetric flask and making up to volume with water.
The precision obtained for the areas of the hydrocortisone peak is � 0.3%; the
injection process in HPLC is generally very precise and one might expect even better
precision from an automated injection system, thus this aspect of system precision is
working well. The precision obtained for the prednisone peak is � 0.6%; not quite as
good, but this is not to do with the injector but is due to a small impurity peak (I) which
Operators Time
Weighing Solution preparation Dilution
Glassware pH adjustment
Instrument columns Chemicals Reference standards
0.321
240 nm
Mobile phasecomposition
Columnperformance
Detectorstability
Integration settingsInjection precision
Flow rate
System precision
Repeatability
Intermediate precision
Between laboratory transfer Round robin trials Long term performance
Reproducibility
Sample extraction method
Fig. 1.3
Parameters involved
in three levels of
precision.
8 Pharmaceutical analysis
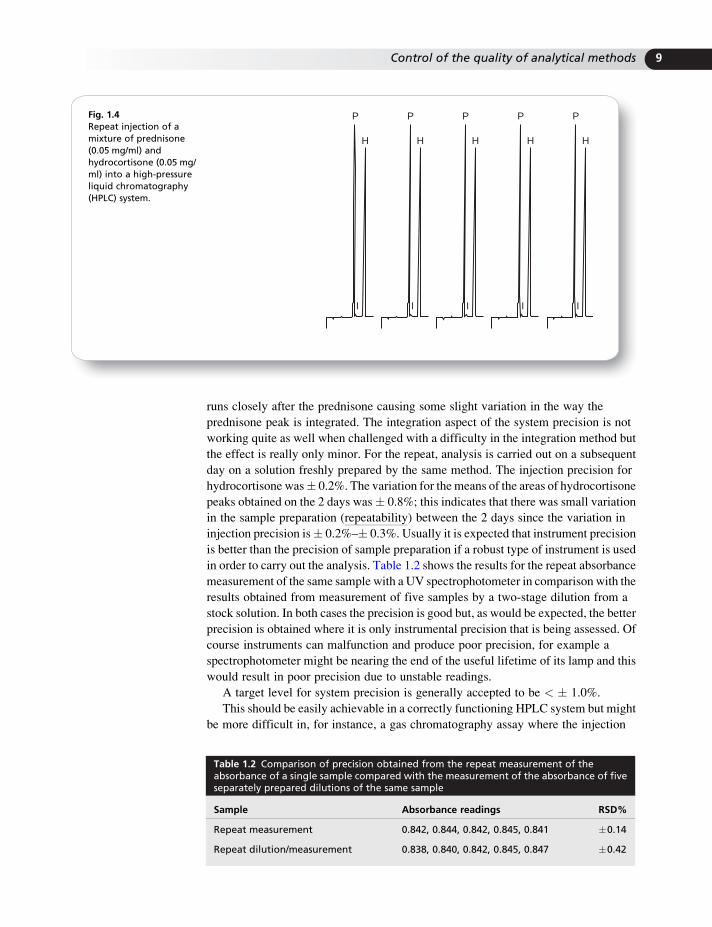
runs closely after the prednisone causing some slight variation in the way the
prednisone peak is integrated. The integration aspect of the system precision is not
working quite as well when challenged with a difficulty in the integration method but
the effect is really only minor. For the repeat, analysis is carried out on a subsequent
day on a solution freshly prepared by the same method. The injection precision for
hydrocortisone was� 0.2%. The variation for the means of the areas of hydrocortisone
peaks obtained on the 2 days was� 0.8%; this indicates that there was small variation
in the sample preparation (repeatability) between the 2 days since the variation in
injection precision is� 0.2%–� 0.3%. Usually it is expected that instrument precision
is better than the precision of sample preparation if a robust type of instrument is used
in order to carry out the analysis. Table 1.2 shows the results for the repeat absorbance
measurement of the same sample with a UV spectrophotometer in comparison with the
results obtained from measurement of five samples by a two-stage dilution from a
stock solution. In both cases the precision is good but, as would be expected, the better
precision is obtained where it is only instrumental precision that is being assessed. Of
course instruments can malfunction and produce poor precision, for example a
spectrophotometer might be nearing the end of the useful lifetime of its lamp and this
would result in poor precision due to unstable readings.
A target level for system precision is generally accepted to be < � 1.0%.
This should be easily achievable in a correctly functioning HPLC system but might
be more difficult in, for instance, a gas chromatography assay where the injection
P
H
I
P
H
I
P
H
I
P
H
I
P
H
I
Fig. 1.4
Repeat injection of a
mixture of prednisone
(0.05 mg/ml) and
hydrocortisone (0.05 mg/
ml) into a high-pressure
liquid chromatography
(HPLC) system.
Table 1.2 Comparison of precision obtained from the repeat measurement of theabsorbance of a single sample compared with the measurement of the absorbance of fiveseparately prepared dilutions of the same sample
Sample Absorbance readings RSD%
Repeat measurement 0.842, 0.844, 0.842, 0.845, 0.841 �0.14
Repeat dilution/measurement 0.838, 0.840, 0.842, 0.845, 0.847 �0.42
9Control of the quality of analytical methods

process is less well controlled. The tolerance levels may be set at much higher RSD in
trace analyses where instruments are operated at higher levels of sensitivity and
achieving 100% recovery of the analyte may be difficult.
Intermediate precisionIntermediate precision expresses within-laboratory variation of precision when the
analysis is carried out by different analysts, on different days and with different
equipment. Obviously a laboratory will want to cut down the possibility for such
variations being large and thus it will standardise on particular items of equipment,
particular methods of data handling, and make sure that all their analysts are trained to
the same standard.
ReproducibilityReproducibility expresses the precision between laboratories. Such a trial would be
carried out when a method was being transferred from one part of a company to
another. The data obtained during such method transfer does not usually form part of
the marketing dossier submitted in order to obtain a product licence. For new
methodologies a popular method for surveying the performance of a method is to carry
out a round robin trial, where many laboratories are asked to carry out qualitative and
quantitative analysis of a sample where the composition is only known to those
organising the trial.
AccuracyAs described above, methods may be precise without being accurate. The
determination of accuracy in the assay of an unformulated drug substance is relatively
straightforward. The simplest method is to compare the substance being analysed
with a reference standard analysed by the same procedure. The reference standard
is a highly characterised form of the drug which has been subjected to extensive
analysis including a test for elemental composition. The methods for determining the
accuracy of an assay of a formulated drug are less straightforward. The analytical
procedure may be applied to: a drug formulation prepared on a small scale so that
the amount of drug in the formulation is more precisely controlled than in a bulk
process; a placebo formulation spiked with a known amount of drug or the formulated
drug spiked with a known amount of drug. The accuracy of the method may also
be assessed by comparison of the method with a previously established reference
method such as a pharmacopoeial method.
Accuracy should be reported as percent recovery in relation to the known amount
of analyte added to the sample or as the difference between the known amount and
the amount determined by analysis. In general, at least five determinations, at 80,
100 and 120% of the label claim for drug in the formulated product, should be carried
out in order to determine accuracy.
Standard operating procedure (SOP) for the assayof paracetamol tabletsThe terms defined above are perhaps best illustrated by using the example of the
simple assay that we mentioned before. The assay in Box 1.4 is laid out in the style of a
standard operating procedure (SOP). This particular section of the operating procedure
10 Pharmaceutical analysis

describes the assay itself, but there would also be other sections in the procedure
dealing with safety issues, the preparation and storage of the solutions used for
extraction and dilution, the glassware required and a specification of the
instrumentation to be used.
The assay described in Box 1.4 assesses the precision of some of the operations
within the assay. If a single analyst were to assess the repeatability of the assay,
instructions might be issued to the effect that the assay as described was to be
repeated five times in sequence, i.e. completing one assay before commencing
another. If between-day repeatability were to be assessed, the process used for
determining the repeatability would be repeated on two separate days. If the within-
laboratory reproducibility were to be assessed two or more analysts would be
assigned to carry out the repeatability procedure. In arriving at an SOP such as
the one described in Box 1.4, there should be some justification in leaving out
certain steps in the complete assay. For instance, weighing is often the most precise
step in the process and thus repeat weighings of samples of tablet powder would
not be necessary to guarantee precision; the precision of the extraction might be
more open to question.
Each of the sections within an assay would have other SOPs associated with
them, governing, for instance, the correct use and care of balances, as listed in
Box 1.5.
Compound random errorsSystematic errors in analysis can usually be eliminated, but true random errors are due
to operations in an assay which are not completely controlled. A common type of
random error arises from the acceptance of manufacturers’ tolerances for glassware.
Table 1.3 gives the RSD values specified for certain items of grades A and B
glassware.
An estimate of compound random errors is obtained from the square root of the sum
of the squares of the RSDs attributed to each component or operation in the analysis.
If the analysis of paracetamol described in Box 1.4 is considered, then, assuming
the items of glassware are used correctly, the errors involved in the dilution steps can
be simply estimated from the tolerances given for the pipette and volumetric flasks.
Box 1.4 Extract from a standard operating procedure for the analysisof paracetamol tablets
8. Assay procedure:
8.1 Use a calibrated balance
8.2 Weigh 20 tablets
8.3 Powder the 20 paracetamol tablets and weigh accurately by difference a quantity oftablet powder equivalent to 125 � 10 mg of paracetamol
8.4 Shake the tablet powder sample with ca 150 ml of acetic acid (0.05 M) for 10 min in
a 500 ml volumetric flask and then adjust the volume to 500 ml with more acetic acid
(0.05 M).
8.5 Filter ca 100 ml of the solution into a conical flask and then transfer five separate
5 ml aliquots of the filtrate to 100 ml volumetric flasks and adjust the volumes to 100 ml
with acetic acid (0.05 M)
8.6 Take two readings of each dilution using a UV spectrophotometer and using the
procedure specified in Section 9
11Control of the quality of analytical methods

The British Standards Institution (BS) tolerances for the grade A glassware used in the
assay are as follows:
500ml volumetric flask 500 ml � 0:05%100ml volumetric flask 100 ml � 0:08%5ml one mark pipette 5 ml � 0:3%
Standard deviation of error from glassware ¼ffiffiffiffiffiffiffiffiffiffiffiffiffiffiffiffiffiffiffiffiffiffiffiffiffiffiffiffiffiffiffiffiffiffiffiffiffiffiffiffiffi0:052 þ 0:082 þ 0:32
p¼ ffiffiffiffiffiffiffiffiffiffiffiffiffiffi
0:0989p ¼ 0:31%
Box 1.5 Procedure for the use of a calibrated balance SOP/001A/01
This balance is a high-grade analytical balance. The balance is sited in a vibration-free area
and disturbance by draughts should be avoided. It carries out internal calibration but as a
double check it is checked with certified check weights. Any deviation of the check weight
values from those expected indicates need for servicing of the balance. Check weight
calibration should be carried out once aweek according to the instructions in SOP/001C/01.
Caution: The logbook (form SOP/001 AR/01) must be filled in. Any spillages on the
balance must be cleaned up immediately and recorded in the log. This balance is to
be used only for analytical grade weighings.
Operation
1. When carrying out weighing of amounts < 50 mg use tweezers to handle the
weighing vessel.
2. Make sure the door of the balance is shut. Switch on the balance and allow it to
undergo its internal calibration procedure. When it is ready the digital read-out will be
0.0000. Wait 30 s to ensure that the reading has stabilised.
3. Introduce the weighing vessel onto the balance pan. Close the door. Wait 30 s to
ensure that the reading has stabilised and then send the reading to the printer.
4. If the tare is used in the weighing procedure, press the tare button and wait until the
balance reads 0.0000. Wait 30 s to ensure that the reading has stabilised. If it drifts,
which under normal circumstances it should not, press the tare button again and wait
for a stable reading.
5. Remove the weighing vessel from the balance, introduce the sample into the vessel
and put it back onto the balance pan. Close the door and note the reading.
6. Remove the sample and adjust the sample size to bring it closer to the required amount.
Re-introduce the sample onto the balance pan. Close the door and note the reading.
7. Repeat step 5 until the target weight is reached. When the required weight is reached
wait 30 s to ensure that the reading has stabilised. Send the reading to the printer.
N.B. An unstable reading may indicate that moisture is being lost or gained and that the
sample must be weighed in a capped vessel.
Date of issue: 6/10/95 Signature:
Table 1.3 Manufacturers’ tolerances on some items of glassware
Item of glassware Grade A Grade B
1 ml bulb pipette � 0.7% � 1.5%
5 ml bulb pipette � 0.3% � 0.6%
100 ml volumetric flask � 0.08% � 0.15%
500 ml volumetric flask � 0.05% � 0.1%
full 25 ml burette � 0.2% � 0.4%
12 Pharmaceutical analysis

Thus it can be seen that the compound error from the glassware differs little from the
largest error in theprocess.Ofcourse theglasswareerrorscanbeeliminatedbycalibration
of the glassware prior to use, but, in general, analysts will accept manufacturers’
tolerances. The tolerated random error fromglassware could be readily eliminated; other
randomerrors, such as variation in the extraction efficiency, aremore difficult to control.
Self-test 1.3
Estimate the compound random error in the following assay with respect to the dilution steps
described and calculate the error as SD of the w/v percentage of the injection, assuming it is
exactly 2% w/v.
A 2%w/v injection was diluted twice using grade A 5 ml bulb pipettes and grade A 100 ml
volumetric flasks as follows:
Dilution 1: 5 to 100 ml
Dilution 2: 5 to 100 ml
The uncertainty in the spectrophotometric reading was � 0.2%.
Answer:�0.48%and�0.01%w/v
Reporting of resultsIn calculating an answer from the data obtained in an analysis it is important to not
indicate a higher level of precision than was actually possible in the assay. As
mentioned in the previous section, when considering the accuracy of glassware used
with the assumption that it complied with the BS grade A standard, it was obvious that
there was some uncertainty in any figure< 1%. It might be possible to improve on this
degree of precision by calibrating glassware; however, any improvement in precision
in the real world would take time and hence have cost implications. Thus for the
purposes of most analyses, and for the purposes of the calculations in this book, it
would seem sensible to report four significant figures, i.e. to 0.1%. In the process of
carrying out calculations, five figures can be retained and rounded up to four figures at
the end of the calculation. Since in pharmaceutical analyses the percentage of the
stated content of a drug in a formulation may be reported as being between 90 and
99.9%, if the first significant figure is 9, then at the end of the calculation a more
realistic estimate of precision is given by rounding the answer up to three significant
figures. The SD or RSD reported with the answer should reflect the number of
significant figures given; since there is usually uncertainty in figures < 1% of the
answer, the RSD should not be reported below 0.1%. Taking this into consideration the
correct and incorrect ways of reporting some answers are given in Table 1.4.
Table 1.4 Significant figures in the reporting of analytical results
Answer � S Incorrect RSD Answer � S Correct RSD
% of stated content ¼ 99.2 � 0.22 0.22 % of stated content ¼ 99.2 � 0.2 0.2
% of stated content ¼ 101.15 � 0.35 0.35 % of stated content ¼ 101.2 � 0.4 0.4
0.2534 � 0.00443%w/v 1.75 0.2534 � 0.0044%w/v 1.7
1.0051 � 0.0063%w/w 0.63 1.005 � 0.006%w/w 0.6
1.784 � 0.1242 mg/ml 6.962 1.784 � 0.124 mg/ml 7.0
13Control of the quality of analytical methods

Other terms used in the control ofanalytical procedures
System suitabilitySystem suitability should not be confused with method validation. System suitability
tests aremost often applied to analytical instrumentation. They are designed to evaluate
the components of the analytical system in order to show that the performance of the
system meets the standards required by the method. Method validation is performed
once at the end of method development, whereas system suitability tests are performed
on a system periodically to determine whether or not it is still working properly and is
capable of carrying out the analysis. System suitability relates to the performance of the
equipment. In selecting equipment, the four Qs rule can be applied:2
(i) Design qualification (fit for purpose). What is the equipment required to do?(ii) Installation qualification. Does the equipment work in the way that the
manufacturer claims?(iii) Operational qualification. Does the equipment work for the analyst’s particular
application?(iv) Performance qualification. Does the instrument continue to perform to the
standard required?
In routine use it is point 4 that is checked, and, for a given procedure, an analyst will
use several tests routinely, in order to monitor instrument performance, e.g. the
resolution test during chromatography. The system suitability tests that would
routinely be carried out on a HPLC are described in Chapter 10.
Analytical blankThis consists of all the reagents or solvents used in an analysiswithout anyof the analyte
being present. A true analytical blank should reflect all the operations to which the
analyte in a real sample is subjected. It is used, for example, in checking that reagents or
indicators do not contribute to the volume of titrant required for a titration, including
zeroing spectrophotometers or in checking for chromatographic interference.
CalibrationThe calibration of a method involves comparison of the value or values of a particular
parameter measured by the system under strictly defined conditions with pre-set
standardvalues.Examples include: calibrationof thewavelength andabsorbance scales
of a UV/visible spectrophotometer (Ch. 4), calibration of the wavelength scale of an IR
spectrometer (Ch. 5) and construction of chromatographic calibration curves (Ch. 12).
Limit of detectionThis is the smallest amount of an analyte which can be detected by a particular method.
It is formally defined as follows:
x� xB ¼ 3sB
where x is the signal from the sample, xB is the signal from the analytical blank and sBis the SD of the reading for the analytical blank. In other words, the criterion for a
reading reflecting the presence of an analyte in a sample is that the difference between
14 Pharmaceutical analysis

the reading taken and the reading for the blank should be three times the SD of the
blank reading. The SD of the signal from the sample can be disregarded since the
sample and the blank should have been prepared in the same manner so that it and the
sample produce a similar SD in their readings. A true limit of detection should reflect
all the processes to which the analyte in a real assay is subjected and not be a simple
dilution of a pure standard for the analyte until it can no longer be detected. The
definition of limit of detection (LOD) above applies mostly to spectrophotometric
readings.
In the case of chromatographic separations there is usually a constant background
reading called the baseline. According to the EP the limit of detection is where the
height of a chromatographic peak is three times the height of the fluctuation of the
baseline noise over a distance equal to 20 times width of the peak at half height.
Chromatographic software will generally calculate this for the operator; however,
manual estimation can be carried out as shown in Figure 1.5 where the LOD is reached
where 2H/h is < 3.
0
10
20
30
40
50
60
70
80
90
100
Rel
ativ
e ab
unda
nce
1 2 3 4 5 6 7 8 9 10
Time (min)
H=5
LOQ
H=1
0
10
20
30
40
50
60
70
80
90
100
Rel
ativ
e ab
unda
nce
1 2 3 4 5 6 7 8 9 10
Time (min)
H=1
H=1.5
LOD
Fig. 1.5
Estimation of limit
of detection (LOD)
and limit of
quantification
(LOQ) for a
chromatographic
system.
15Control of the quality of analytical methods

Limit of quantificationThe limit of quantification is defined as the smallest amount of analyte which can be
quantified reliably, i.e. with an RSD for repeat measurement of<� 20%. The limit of
quantification is defined as: x – xB¼ 10sB. In this case the analyte should give a peak at
more than ten times the standard deviation of the chromatographic baseline during
chromatographic analysis. As shown in Figure 1.5 where the limit of quantification
(LOQ) is reached where 2H/h is <10.
Self-test 1.4
In which of the following cases has the limit of detection been reached?
Signal from sample Sample SD Signal from analytical blank Analytical blank SD
1. Abs 0.0063 0.0003 0.0045 0.0003
2. Abs 0.0075 0.0017 0.0046 0.0018
3. 0.335 ng/ml 0.045 ng/ml 0.045 ng/ml 0.037 ng/ml
Answer:2
LinearityMost analytical methods are based on processes where themethod produces a response
that is linear and which increases or decreases linearly with analyte concentration. The
equation of a straight line takes the form:
y ¼ aþ bx
where a is the intercept of the straight line with the y axis and b is the slope of the line.
Taking a simple example, a three-point calibration curve is constructed through
readings of absorbance against procaine concentration (Table 1.5).
The best fit of a straight line through these values can be determined by determining
a and b from the following equations:
b ¼
Xi
ðxi � �xÞðyi � �yÞXi
ðxi � �xÞ2
a ¼ �y� b�x
where xi is the individual value for x, �x is the mean value of xi, yi is the individual value
for y and �y is the mean of yi.
Table 1.5 Data used for the construction of a calibration curve for thespectrophotometric determination of procaine
Procaine concentration mg/100 ml Absorbance reading
0.8 0.604
1.0 0.763
1.2 0.931
16 Pharmaceutical analysis

From the data in Table 1.4:
�x ¼ 0:8þ 1:0þ 1:2
3¼ 1:0
�y ¼ 0:604þ 0:763þ 0:931
3¼ 0:766
b ¼ ð0:8� 1:0Þð0:604� 0:766Þ þ ð1:0� 1:0Þð0:763� 0:766Þ þ ð1:2� 1:0Þð0:931� 0:766Þð0:8� 1:0Þ2 þ ð1:0� 1:0Þ2 þ ð1:2� 1:0Þ2
¼ 0:0324þ 0þ 0:033
0:04þ 0:04¼ 0:818
a ¼ 0:766� 0:818� 1:0 ¼ �0:052
Thus the equation for the best fit is:
y ¼ 0:818x� 0:052
The statistical measure of the quality of fit of the line through the data is the
correlation coefficient r. A correlation coefficient of > 0.99 is regarded as
indicating linearity. The correlation coefficient is determined from the following
equation:
r ¼
Xi
fðxi � �xÞðyi � �yÞgffiffiffiffiffiffiffiffiffiffiffiffiffiffiffiffiffiffiffiffiffiffiffiffiffiffiffiffiffiffiffiffiffiffiffiffiffiffiffiffiffiffiffiffiffiffiffiffiffiffiffiffiffiffiXi
½ðxi � �xÞ2�Xi
½ðyi � �yÞ2�r
Substituting the values from Table 1.4:
r ¼ð0:8� 1:0Þð0:604� 0:766Þ þ ð1:0� 1:0Þð0:763� 0:766Þ þ ð1:2� 1:0Þð0:931� 0:766Þffiffiffiffiffiffiffiffiffiffiffiffiffiffiffiffiffiffiffiffiffiffiffiffiffiffiffiffiffiffiffiffiffiffiffiffiffiffiffiffiffiffiffiffiffiffiffiffiffiffiffiffiffiffiffiffiffiffiffiffiffiffiffiffiffiffiffiffiffiffiffiffiffiffiffiffiffiffiffiffiffiffiffiffiffiffiffiffiffiffiffiffiffiffiffiffiffiffiffiffiffiffiffiffiffiffiffiffiffiffiffiffiffiffiffiffiffiffiffiffiffiffiffiffiffiffiffiffiffiffiffiffiffiffiffiffiffiffiffiffiffiffiffiffiffiffiffiffiffiffiffiffiffiffiffiffiffiffiffiffiffiffiffiffiffiffiffiffiffiffiffiffiffiffiffiffiffiffiffiffiffiffiffiffiffiffiffiffiffiffiffiffiffiffiffiffiffiffiffiffi
½ð0:8� 1:0Þ2 þ ð1:0� 1:0Þ2 þ ð1:2� 1:0Þ2�½ð0:604� 0:766Þ2 þ ð0:763� 0:766Þ2 þ ð0:931� 0:766Þ2�q
r ¼ 0:0324þ 0þ 0:033ffiffiffiffiffiffiffiffiffiffiffiffiffiffiffiffiffiffiffiffiffiffiffiffiffiffiffiffi0:08� 0:0534
p ¼ 1:00
Thus, to three significant figures, the straight line fit through the values in Table 1.4
is perfect. For a fuller treatment of the mathematical determination and significance of
a correlation coefficient see Miller and Miller.1 The equation for the correlation
coefficient is very useful in that it can be applied to correlations between curves of any
shape and thus it can be used for spectral comparisons, such as those carried out
between diode array spectra obtained during HPLC (Ch. 12).
RangeThe term range can be applied to instrument performance (dynamic range) but, when
applied to the performance of an assay, it refers to the interval between the upper and
lower concentration of an analyte for which an acceptable level of precision and
accuracy has been established. Typical ranges are: 80–120% of the stated amount for a
finished product; 70–130% of the expected concentration, e.g. for content of single
tablets (the range may be even wider for some products, such as doses delivered by a
metered dose inhaler) and 0–110% for dissolution tests where the drug is released from
the dosage form over a time period.
17Control of the quality of analytical methods

RobustnessRobustness is evaluated in order to determine how resistant the precision and accuracy
of an assay is to small variations in the method. The types of parameters which
are assessed in order to determine the robustness of a method include: the stability
of analytical solutions; the length of the extraction time; the effect of variations in
the pH of a HPLC mobile phase; the effect of small variations in mobile phase
composition; the effect of changing chromatographic columns; the effect of
temperature and flow rate during chromatography.
SelectivityThe selectivity of a method is a measure of how capable it is of measuring the
analyte alone in the presence of other compounds contained in the sample. The most
selective analytical methods involve a chromatographic separation. Detection
methods can be ranked according to their selectivity. A simple comparison is
between fluorescence spectrophotometry and UV spectrophotometry. There are
many more compounds which exhibit UV absorption than there are those which
exhibit strong fluorescence; thus fluorescence spectrophotometry is a more selective
method. Because selective methods are based on more complex principles than
non-selective methods, they may be less robust, e.g. fluorescence spectrophotometry
is more affected by changes in the analytical method than UV spectrophotometry.
SensitivityThe sensitivity of method indicates how responsive it is to a small change in the
concentration of an analyte. It can be viewed as the slope of a response curve and may
be a function of the method itself or of the way in which the instrumentation has been
calibrated. In Figure 1.6 the method having a linear response y ¼ 2.5x is five times
more sensitive than the method exhibiting a linear response y ¼ 0.5x. Sensitivity and
the limit of detection of a method are often confused. The limit of detection is due to a
combination of range and sensitivity.
0
10
20
30
40
50
60
Res
pons
e
0 5 10 15 20 25
Concentration
y = 0.500x
y = 2.500x
Response
Response
Fig. 1.6
Sensitivity as a function of
the slope of a response
curve.
18 Pharmaceutical analysis

Weighing by differenceWeighing by difference is used to minimise weighing errors in an analytical
procedure. The sample is weighed in a suitable vessel, e.g. a glass weighing boat with a
spout, and then transferred immediately to the vessel in which it is going to be analysed
or dissolved. The weighing vessel is then reweighed and the difference between the
weights before and after transfer gives the weight of the sample. This method of
weighing minimises errors due to, for example, the absorption of moisture onto the
surface of the vessel. It also means that there is not a requirement for complete transfer
of the sample that is to be analysed.
The points listed in Boxes 1.6 and 1.7 indicate how pharmaceutical preparations
may come to be out of specification.
Basic calculations in pharmaceutical analysisThe data from an analysis can be obtained using computer-based methods. However,
in order to have some idea of the accuracy of an answer, it is necessary to be able
to carry out calculations in the traditional manner. There are various units used to
Box 1.6 Sources of impurities in pharmaceutical manufacture
• During the course of the manufacture of a pure drug substance, impurities may arise as
follows:
(i) Present in the synthetic starting materials
(ii) Result from residual amounts of chemical intermediates used in the synthetic
process and from unintended side reactions
(iii) Result from reagents, solvents and catalysts used in manufacture.• The process used to produce the formulated drug substance may introduce impurities
as follows:
(i) Particulate matter from the atmosphere, machines and devices used in the
manufacturing process and from containers
(ii) Impurities that are present in the excipients used in the formulation
(iii) Cross contamination may occur from other processes carried out using the same
equipment, e.g. from mixers
(iv) Microbial contamination may occur
(v) The drug may react with the excipients used in the formulation
(vi) Impurities may be introduced from packaging, e.g. polymeric monomers.
Box 1.7 Processes leading to the deviation of the actual content fromthe stated content of a drug in a formulation
• Incomplete mixing of drug with formulation excipients prior to compression into
tablets or filling into capsules• Physical instability of the dosage form: tablets that disintegrate too readily; creams or
suspensions that separate and over- or undercompression of tablets, leading to
deviation from the required weight• Chemical breakdown of the drug resulting from its reaction with air, water, light,
excipients in a formulation or with packaging materials• Partitioning of the drug into packaging materials.
19Control of the quality of analytical methods

express amounts and concentrations in pharmaceutical analysis and examples of these
units will be considered below.
Percentage volume/volume (%v/v)Percentage volume/volume (%v/v) is most often encountered in relation to the
composition of mobile phases used in HPLC. Thus, when 30 ml of methanol is mixed
with 70 ml of water, a 30:70 v/v mixture is formed. Since some shrinking in volume
occurs when two liquids are mixed, %v/v may only be approximate. Some
chromatographers prefer to prepare mixtures of solvents by weighing them rather than
by volume measurement and in this case the solvent mixture can be expressed as %
weight in weight (%w/w).
Percentage weight in volume (%w/v)Percentage weight in volume (%w/v) is normally used to express the content of active
ingredient in liquid formulations such as injections, infusions and eyedrops. The
density of the solvent in this case is irrelevant; thus, a 1 g/100 ml solution of a drug
is 1%w/v whether it is dissolved in ethanol or water.
Self-test 1.5
Convert the following concentrations to % w/v:
(i) 0.1 g/100 ml
(ii) 1 mg/ml
(iii) 0.1 g/ml
(iv) 100 mg/ml
Answers:(i)0.1%w/v
(ii)0.1%w/v
(iii)10%w/v
(iv)0.01%w/v
DilutionsIn order for an extract from a formulation or a solution of a pure drug substance to be
measured it must be diluted so that it falls within the working range of the instrument
used to make the measurement. Thus an understanding of dilution factors is
fundamental to calculations based on analytical data.
Calculation example 1.1
An infusion stated to contain 0.95% w/v NaCl was diluted so that its Na content could be determined by flame
photometry. The following dilutions were carried out:
(i) 10 ml of the sample was diluted to 250 ml with water.
(ii) 10 ml of the diluted sample was diluted to 200 ml with water.
The sample was found to contain 0.74 mg/100 ml of Na.
Atomic weights: Na ¼ 23 Cl ¼ 35.5(Continued)
20 Pharmaceutical analysis
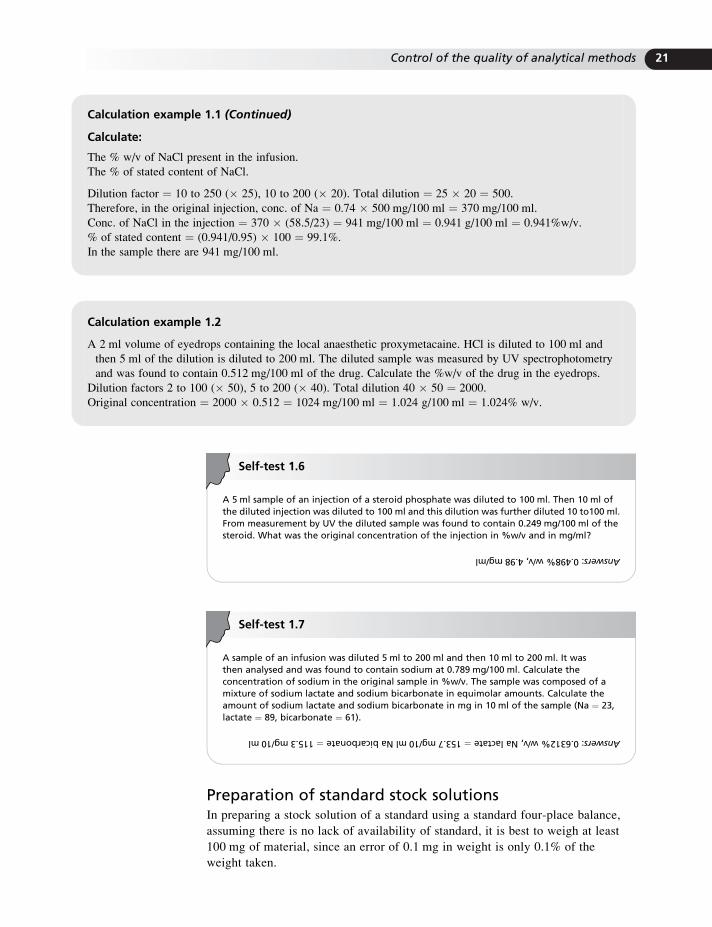
Self-test 1.6
A 5 ml sample of an injection of a steroid phosphate was diluted to 100 ml. Then 10 ml of
the diluted injection was diluted to 100 ml and this dilution was further diluted 10 to100 ml.
From measurement by UV the diluted sample was found to contain 0.249 mg/100 ml of the
steroid. What was the original concentration of the injection in %w/v and in mg/ml?
Answers:0.498%w/v,4.98mg/ml
Self-test 1.7
A sample of an infusion was diluted 5 ml to 200 ml and then 10 ml to 200 ml. It was
then analysed and was found to contain sodium at 0.789 mg/100 ml. Calculate the
concentration of sodium in the original sample in %w/v. The sample was composed of a
mixture of sodium lactate and sodium bicarbonate in equimolar amounts. Calculate the
amount of sodium lactate and sodium bicarbonate in mg in 10 ml of the sample (Na ¼ 23,
lactate ¼ 89, bicarbonate ¼ 61).
Answers:0.6312%w/v,Nalactate¼153.7mg/10mlNabicarbonate¼115.3mg/10ml
Preparation of standard stock solutionsIn preparing a stock solution of a standard using a standard four-place balance,
assuming there is no lack of availability of standard, it is best to weigh at least
100 mg of material, since an error of 0.1 mg in weight is only 0.1% of the
weight taken.
Calculation example 1.1 (Continued)
Calculate:
The % w/v of NaCl present in the infusion.
The % of stated content of NaCl.
Dilution factor ¼ 10 to 250 (� 25), 10 to 200 (� 20). Total dilution ¼ 25 � 20 ¼ 500.
Therefore, in the original injection, conc. of Na ¼ 0.74 � 500 mg/100 ml ¼ 370 mg/100 ml.
Conc. of NaCl in the injection ¼ 370 � (58.5/23) ¼ 941 mg/100 ml ¼ 0.941 g/100 ml ¼ 0.941%w/v.
% of stated content ¼ (0.941/0.95) � 100 ¼ 99.1%.
In the sample there are 941 mg/100 ml.
Calculation example 1.2
A 2 ml volume of eyedrops containing the local anaesthetic proxymetacaine. HCl is diluted to 100 ml and
then 5 ml of the dilution is diluted to 200 ml. The diluted sample was measured by UV spectrophotometry
and was found to contain 0.512 mg/100 ml of the drug. Calculate the %w/v of the drug in the eyedrops.
Dilution factors 2 to 100 (� 50), 5 to 200 (� 40). Total dilution 40 � 50 ¼ 2000.
Original concentration ¼ 2000 � 0.512 ¼ 1024 mg/100 ml ¼ 1.024 g/100 ml ¼ 1.024% w/v.
21Control of the quality of analytical methods

Calculation example 1.3
Assuming that you wish to avoid pipetting less than a 5 ml volume, starting from a 102.1 mg/100 ml stock
solution, how would you prepare the following concentrations for a calibration series?
0.2042 mg/100 ml, 0.4084 mg/100 ml, 0.6126 mg/100 ml, 0.8168 mg/100 ml, 1.021 mg/ml
When a large dilution (>10) is required it is best to carry it out in two stages.
In this case an initial dilution of 20 ml to 100 ml is carried out, producing a 10.21 mg/100 ml solution.
Then 250 ml volumetric flasks can be used to carry out the following dilutions.
5 to 250 (� 50), 10 to 250 (� 25), 15 to 250 (� 16.67), 20 to 250 (� 12.5), and 25 to 250 (� 10),
giving the dilution series above.
N.B. Once the volume required for the lowest concentration (5 ml) has been determined, then it can be
multiplied � 2, � 3, � 4 and � 5 to give the series.
Self-test 1.8
A stock solution containing 125.6 mg of standard in 250 ml is prepared. Suggest how the
following dilution series could be prepared (pipettes 5 ml or greater must be used).
0.1005 mg/100 ml, 0.2010 mg/100 ml, 0.3015 mg/100 ml, 0.4020 mg/100 ml,
0.5025 mg/100 ml
Answer:Numberofpossibleanswers,e.g.dilution1,10mlto250ml.Then,fromdilution
1,5,10,15,20and25mlpipettesusedtotransferinto100mlvolumetricflasks.
Percentage weight/weight (%w/w)Percentage weight/weight (%w/w) is a common measure used to express the
concentration of active ingredient in a formulation such as a cream or to
express the content of a minor impurity in a drug substance. Thus, a cream
containing 10 mg (0.01 g) of drug per gram is a: (0.01/1) � 100 ¼ 1% w/w
formulation. Equally, if a drug contains 0.5 mg (0.0005 g) per gram of an
impurity, the impurity is at a concentration of (0.0005/1) � 100 ¼ 0.05% w/w.
It is generally accepted that, for a drug, all impurities above 0.05% w/w should
be characterised, i.e. their structures should be known and their toxicities
should be assessed.
In determining impurities in a drug, 1 g of the drug might be dissolved in 100 ml
of solvent. If an analysis was carried out and the drug solution was found to contain
3 mg/100 ml of an impurity, then the %w/w referring back to the original weight
of drug substance would be:
(0.003/1) � 100 ¼ 0.3% w/w
22 Pharmaceutical analysis

Self-test 1.9
(i) 0.1521 g of a corticosteroid drug was dissolved in 100 ml of methanol/water (1:1 v/v).
The sample was analysed by HPLC and was found to contain a known impurity in a
concentration of 0.354 mg/100 ml. What is the %w/w of the impurity in the drug?
(ii) 0.5321 g of a b-adrenergic blocking drug is dissolved in 50 ml of methanol/0.1% w/v
acetic acid (20:80 v/v) and the sample is then diluted by taking 10 ml of the solution and
diluting it to 50 ml. The diluted sample was analysed by HPLC and was found to
contain 0.153 mg/100 ml of an impurity. What is the %w/w of the impurity in the drug?
Answers:(i)0.233%w/w
(ii)0.0719%w/w
Parts per million (ppm) calculationsParts per million (ppm) on a w/w basis is 1 mg/g (1 mg/kg). It is a common measure
used for impurities in drug substances, particularly heavy metals and solvents. 1 ppm
is also 0.0001%w/w.
Calculation example 1.4
The potassium content of an intravenous infusion containing sodium chloride was determined. The infusion was
found to contain 0.9092%w/v NaCl. The undiluted infusion was measured for potassium content in comparison
with a potassium chloride standard. The potassium content of the undiluted infusion was found to be 0.141 mg/
100 ml. Calculate the potassium content in the sodium chloride in ppm:
0.9092%w/v ¼ 0.9092 g/100 ml
Potassium content ¼ 0.141 mg/100 ml ¼ 141 mg/100 ml.
Relative to the sodium chloride, there are 141 mg/0.9092 g ¼ 141/0.9092 ppm ¼ 155 ppm.
Self-test 1.10
125.1 mg of streptomycin sulphate are dissolved in 10 ml of water. A GC headspace analysis is
carried out in order to determine the methanol content of the drug. A peak for methanol is
produced which has 73.2% of the area of a peak for a methanol standard containing
0.532 mg/100 ml of methanol in water analysed under exactly the same conditions. What is
the methanol content of the streptomycin sulphate in ppm and %w/w?
Answer:311.3ppm,0.03113%w/w.
Working between weights and molarityWeights are much easier to appreciate than molar concentrations but sometimes,
particularly in bioanalytical methods, molar concentrations are used.
DefinitionsMolar: molecular weight in g/l (mg/ml)mMolar: molecular weight in mg/l (mg/ml)mMolar: molecular weight in mg/l (ng/ml)nMolar: molecular weight in ng/l (pg/ml).
23Control of the quality of analytical methods

Calculation example 1.5
The metabolism of paracetamol (molecular weight 151.2 amu) by liver microsomes was studied by preparing a
100 mM solution of paracetamol in 1 ml of incubation mixture. A 30.12 mg/100 ml solution of paracetamol in
buffer was prepared. What volume of paracetamol solution had to be added to incubation mixture prior to
making up the volume to 1 ml:
100 mM ¼ 100 � 151.2 ¼ 15120 mg/l ¼ 15.12 mg/ml.
30.12 mg/100 ml ¼ 30120 mg/100 ml ¼ 301.2 mg/ml ¼ 0.3012 mg/ml.
Volume of paracetamol solution required ¼ 15.12/0.3012 ¼ 50.2 ml.
Self-test 1.11
(i) Calculate the concentrations in mg/ml and mg/ml of a 10 mM solution of kanamycin
(molecular weight 484.5).
(ii) A solution containing diclofenac sodium (molecular weight 318.1) at a concentration of
79.5 mg/100 ml in buffer was prepared. What volume of this solution was required in
order to carry out a microsomal incubation containing a 25 mM concentration of the drug
in 1 ml?
Answers:(i)0.004845mg/ml,0.004845mg/ml(ii)10ml
Additional problems
All answers to be given to four significant figures. e.g. 1% w/v to four significant
figures is 1.000 % w/v.
1. Convert the following concentrations to %w/v.
(i) 10 mg/ml
(ii) 100 mg/l
(iii) 0.025 g/ml
(iv) 250 mg/ml
(v) 20 mg/ml.
Answers:(i)1.000%w/v
(ii)0.01000%w/v
(iii)2.500%w/v
(iv)0.02500%w/v
(v)2.000%w/v
2. An infusion which was stated to contain 0.5000% w/v KCl was diluted so that its K content
could be determined by flame photometry. The following dilutions were carried out:
(i) 10 ml of the sample was diluted to 200 ml with water.
(ii) 10 ml of the diluted sample was diluted to 200 ml with water.
The sample was found to contain 0.6670 mg/100 ml of K.
(Atomic weights: K ¼ 39.1 Cl ¼ 35).
Calculate:
(i) The % w/v of KCl present in the infusion
(ii) The % of stated content of KCl.
Answers:(i)0.5090%w/v
(ii)101.8%
(Continued)
24 Pharmaceutical analysis

Additional problems (Continued)
3. Oral rehydration salts are stated to contain the following components:
Sodium Chloride 3.5 g
Potassium Chloride 1.5 g
Sodium Citrate 2.9 g
Anhydrous Glucose 20.0 g
8.342 g of oral rehydration salts are dissolved in 500 ml of water. 5 ml of the solution is diluted
to 100 ml and then 5 ml is taken from the diluted sample and is diluted to 100 ml.
The sodium content of the sample is then determined by flame photometry. The sodium salts
used to prepare the mixture were:
Trisodium citrate hydrate (C6H5Na3O7,2H2O) molecular weight 294.1 and sodium chloride
(NaCl) molecular weight 58.5
Atomic weight of Na ¼ 23
The content of Na in the diluted sample was determined to be 0.3210 mg/100 ml
Determine the % of stated content of Na in the sample.
Answer:104.5%
4. A 5 ml volume of eyedrops containing the mydriatic drug cyclopentolate. HCl is diluted to
100 ml and then 20 ml of the dilution is diluted to 100 ml. The diluted sample was
measured by UV spectrophotometry and was found to contain 20.20 mg/100 ml of the
drug. Calculate the % w/v of the drug in the eyedrops.
Answer:2.020%w/v
5. 0.5% w/v of an injection is to be used as an anaesthetic for a 2-week-old baby weighing
3.4 kg. The recommended dose for a bolus injection is 0.5 mg/kg.
The injection must be given in 1 ml. Calculate the amount of water for injection that must
be drawn into the syringe with the appropriate volume of injection.
Answer:0.6600ml
6. 0.0641 g of a semi-synthetic alkaloid was dissolved in 25 ml of 1% w/v acetic acid and was
analysed directly by HPLC. The solution was found to contain 0.142 mg/100 ml of an
impurity. What is the level of impurity in % w/w and ppm.
Answers:0.05538%w/w,553.8ppm.
7. The level of ethyl acetate is determined in colchicine by headspace gas chromatography.
A solution containing 4.361 g/100 ml of colchicine in water was prepared. An aqueous
standard containing 0.5912 mg/100 ml of ethyl acetate was also prepared. Headspace
analysis of 2 ml volumes of the two solutions produced GC peaks for ethyl acetate with the
following areas:
Colchicine solution: Peak area 13457
Ethyl acetate solution: Peak area 14689
Calculate the ethyl acetate content in the colchicine sample in ppm.
Answer:124.2ppm
References1. Miller JC, Miller JN. Statistics and Chemometrics for Analytical Chemistry. 6th ed. Chichester:
Ellis Horwood; 2010.
2. Burgess C. Good spectroscopic practice: science and compliance. Spectroscopy Europe1994;6:10–3.
Further readingErmer J, Miller JHM, editors.MethodValidation in Pharmaceutical Analysis.Weinheim:Wiley-VCH;
2005.
Jones D. Pharmaceutical Statistics. London: Pharmaceutical Press; 2002.
25Control of the quality of analytical methods


