Embed Size (px)
Citation preview
04/19/23 ERLDC: POSOCO 1
Renewable Energy
G ChakrabortyDGM(MO), ERLDC
Renewable Energy
G ChakrabortyDGM(MO), ERLDC

04/19/23 ERLDC: POSOCO 2
Contents
• Indian Power Sector – At Present
- Factors compel us to worry• Drivers for alternative Energy Source
– Legal provision– Emerging Renewable Scenario– International Position– Wind and Solar potential in India
• Need for REC Mechanism• Integration of Renewables • Implementation of RRF• Future Scenario

Region wise Installed Generating Capacity
Captive generating capacity as on 31st March 2011 = 34,445 MW
Source: CEA website

NPTI, Bangalore

Electricity Demand Projections
Year Total Electricity Required ( Billion kWhr)
Installed Capacity (MW)
GDP Growth Rate
7% 8% 7% 8%2011-12 1031 1097 206757 219992
2016-17 1377 1524 276143 305623
2021-22 1838 2118 368592 424744
2026-27 2397 2866 480694 574748
2031-32 3127 3880 627088 778095
Source: Energy Policy Report, Planning Commission, India


India’s Oil Balance

Limited Fuels:at present consumption levels
Crude oil will last only for 18 years.
Gas will last for 26 years.
Coal will be finished in nearly 200 years.
Ever thought of a world without gas and oil???

Factors which compel us to worry

C l i m a t e h a s c h a n g e d a n d c o n t i n u e s t o c h a n g e . .
– G l o b a l m e a n t e m p e r a t u r e h a s i n c r e a s e d 0 . 5 - 1 o F
– G l o b a l s e a l e v e l h a s r i s e n 4 - 1 0 i n c h e s – G l o b a l p r e c i p i t a t i o n o v e r l a n d h a s
i n c r e a s e d 1 %
– P r o j e c t e d t e m p e r a t u r e i n c r e a s e o f 3 . 6 o F b y 2 1 0 0 ( 1 . 8 - 6 . 3 o F )
– P r o j e c t e d s e a l e v e l r i s e o f 2 0 i n c h e s b y 2 1 0 0 ( 6 - 3 8 i n c h e s )
– L i k e l y i n c r e a s e i n p r e c i p i t a t i o n i n t e n s i t y


0.75 0.760.86
1.83
0.65
3.24
0.21
1.08
CO
2 RELEA
SE,
GIG
A T
ON
S
OECD
USA
CHINA
INDIA
Ref : World Energy Council Report, 1994
1990 2050
GLOBAL CARBON DI-OXIDE EMISSION

Potential Impacts

Climate Impacts in South Asia
AFG BLD BHU IND PAK NEP MAL
Sea Level Rise - Very High
- Modest Low - Very High
Glacier
Melt
High High High High High High --
Temp Increase Very High
High Very High
High High Very High Modest
Flooding
Worsens
? Very
High
Likely High High High High (SLR)
Drought
More Frequent
? High some areas
? High Very High
? Possible --


Drivers for Alternate energy sources
Oil crisis in 1970s. Limited natural Resources (Oil, Coal). Energy Security. International mandate for development of CDM technologies and to
reduce Carbon/Sulpher/Green House Gas emissions, phase out fossil fuel generation and develop alternate Energy sources. IPCC(Inter-governmental Panel for Climate Change) under
UNEP(1998) UNFCCC Rio De Janeiro 1992 Kyoto protocol 1997 Copenhagen Summit 2009
Indian initiatives NAPCC (National Action Plan for Climate Change) JNNSM (Jawaharlal Nehru National Solar Mission)

HYDRO RESOURCES
COAL BELT
MUMBAI
DELHI
CHENNAIBANGALORE
KOLKATA
RESOURCES ARE FAR AWAY FROM LOAD CENTERS.
NECESSITATES LONG TRANSMISSION LINKS FOR EVACUATION
SOURCES OF RESOURCES
HIGH POWER CORRIDOR AT 765 KV
WIND ZONES
GAS RESOURCES

The Ex-President’s Message: Independence
Cut down energy losses Utilize technologies to
provide a diverse supply of environmentally friendly energy
“We must achieve Energy Independence by 2030”, including a cut down in ALL sectors
Increase the power generated through renewable energy sources from 5% to 25%
This is the nation’s “first and highest priority”
Ex-President A.P.J. Abdul Kalam
(Rocket Scientist)

The Electricity Act, 2003 : Enabling provisions
Section 86(1)(e) : Specify Renewable Purchase Obligation (RPO), grid connectivity
Section 61(h) : Tariff regulations to be guided by promotion of renewable energy sources
Section 3 : National Electricity Policy, Tariff Policy and Plan
Section 4 : National Policy permitting stand alone
systems including renewable sources of energy for rural areas

The Electricity Act, 2003: Section 86(1) (e)
The State Commission shall discharge the following functions, namely:
“promote cogeneration and generation of electricity from
renewable sources of energy by providing suitable measures
for connectivity with the grid and sale of electricity to any
person, and also specify, for purchase of electricity from such
sources, a percentage of the total consumption of electricity
in the area of a distribution licensee;”

The Electricity Act, 2003: Section 61(h)
The Appropriate Commission shall subject to the provisions of this Act, specify the terms and conditions for the determination of tariff, and in doing so, shall be guided by the following, namely:
(h) the promotion of co-generation and generation of electricity from renewable sources of energy
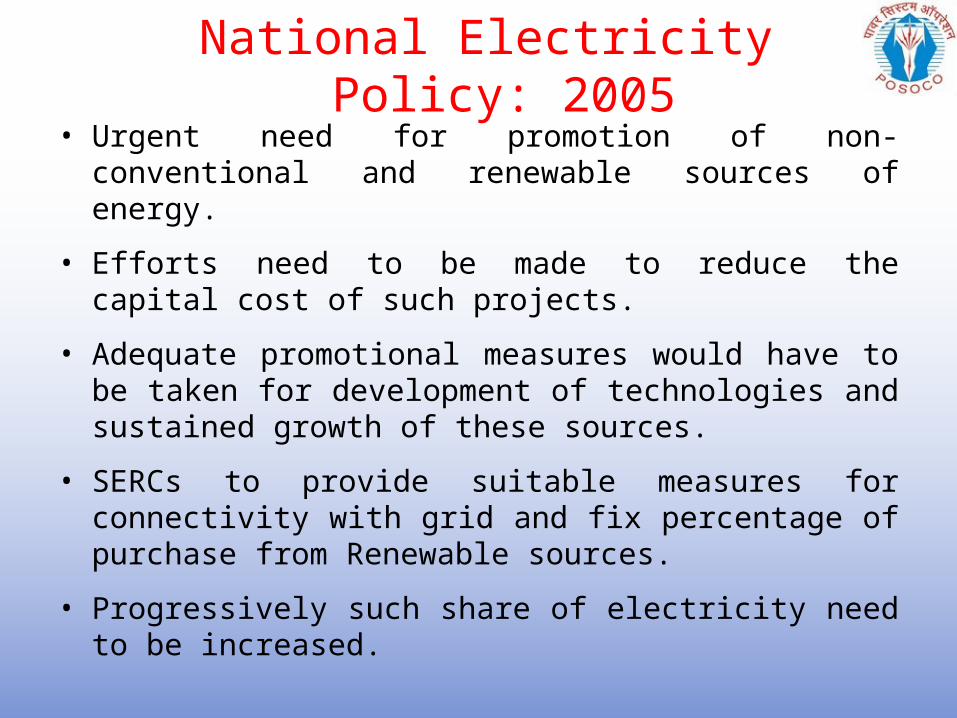
National Electricity Policy: 2005• Urgent need for promotion of non-conventional and
renewable sources of energy.
• Efforts need to be made to reduce the capital cost of such projects.
• Adequate promotional measures would have to be taken for development of technologies and sustained growth of these sources.
• SERCs to provide suitable measures for connectivity with grid and fix percentage of purchase from Renewable sources.
• Progressively such share of electricity need to be increased.

Tariff Policy:2006• Appropriate Commission shall fix RPO and
SERCs shall fix tariff.
• In future Discoms to procure Renewable Energy through competitive bidding within suppliers offering same type of RE.
• In long-term, RE technologies need to compete with all other sources in terms of full costs.

National Action Plan on Climate Change (NAPCC), 2008
National level target for RE Purchase
5% of total grid purchase in 2010, to be increased by 1% each year for 10 years: 15% by 2020.
SERCs may set higher target. Appropriate authorities may issue certificates that procure RE in excess of the national standard.
Such certificates may be tradable, to enable utilities falling short to meet their RPO.
RE generation capacity needed: From 25000 to 45000 MW by 2015.

National Solar Mission, 2009
Mission aims to achieve grid tariff parity by 2022 through Bundling of solar
power with un-allocated quota of central stations by NVVNL for resale to utilities
To deploy 20 million solar lighting systems for rural areas by 2022
Large scale utilization R&D, Local manufacturing In addition,100 MW capacity distributed
small grid connected power plants during Phase - 1.
MW

RE Development in India
Policy and regulatory intervention is essential to promote renewable energy

Various types of Renewable Energy• Wind
– On shore– Off shore
• Solar– Solar PV (Photo Voltaic, Concentrated PhotoVoltaic)– Solar Thermal (Solar Concentrated, Parabolic trough/dish, Fresnel
collector, Heliostat & Solar Tower receiver, Solar updraft receiver) • Small Hydel (upto 25 MW)• Biomass
– Bagasse (the dry fibrous waste that is left after sugarcane has been processed)
– rice husk, cotton stalk, mustard stalk, groundnut shell, coconut fronds, waste cotton stalks, roots of trees, cane trash, poultry litter etc.)
• Co - generation• Municipal Solid waste• Geo -Thermal• Hydro kinetics
– Tidal power – Wave technology

Wind MapWind MapSolar MapSolar MapBoth Solar and wind Both Solar and wind concentration are concentration are geographically samegeographically same

Potential Capacity of RE Sources StatewisePotential Capacity of RE Sources Statewise
State Wind SHP BiomassAndhra Pradesh 8968 552 830Arunchal Pradesh 1333 Chattisgarh 830Gujarat 10645 916Haryana 110 Himachal Pradesh 2268 Jammu & Kashmir 1411 Karnataka 11531 643 859Kerala 1171 Maharashtra 4584 762 1711Madhra Pradesh 1019 400 1059Nagaland 28.67 Punjab 390 Rajasthan 4858 63 1289Tamilnadu 5530 1186Uttaranchal 1609 West Bengal 450
Total 48756 9569.67 8680

Renewable Energy sources (RES)Renewable Energy Installed
CapacityPotential
Wind Power 16179.00 48561
Small Hydro Power 3300.13 14292
Biomass Power 1142.60 8680
Bagasse Cogeneration
1952.53 5000
Waste to Power 73.66 7000
Solar Power (SPV) 481.48 200000
Total 23129.40 283533
Capacities in MW as on31.01.12
Source: MNRE

Wind Power Potential Wind Power Potential
Sl.No. Sources Potential in MW1 Andhra Pradesh 89682 Gujarat 106453 Karnataka 115314 Madhya Pradesh 10195 Maharashtra 45846 Rajasthan 48587 Tamil Nadu 55308 Kerala 11719 Orissa 255
48561Total
State Wise -Wind potential in India
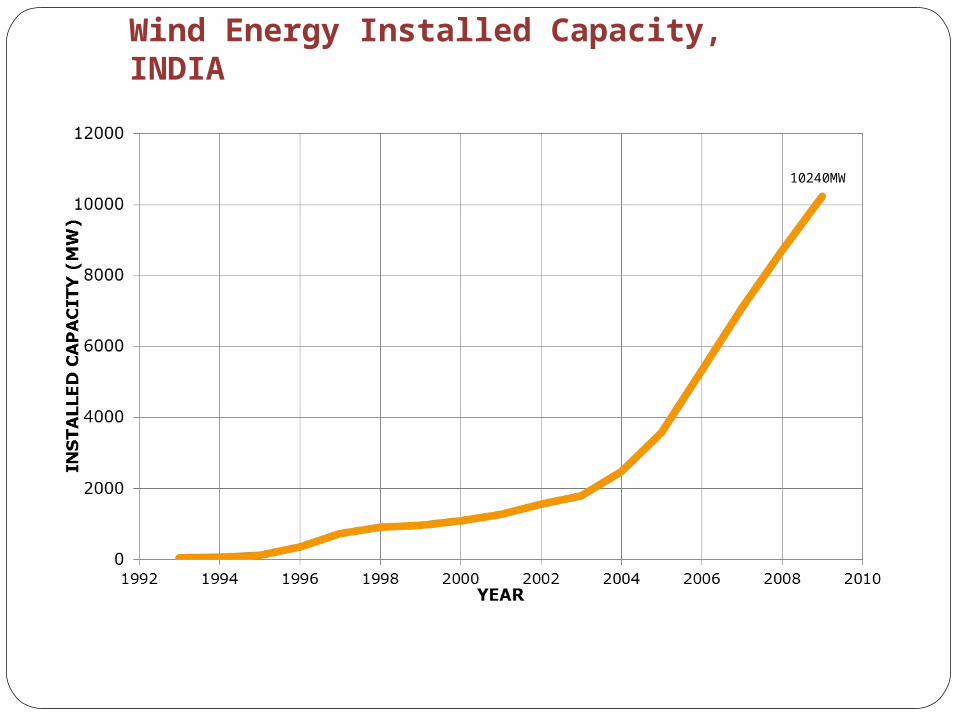
Wind Energy Installed Capacity, INDIA
10240MW

Growth of Wind Capacity(By end 2012)
2,599
5,912
12,210
25,104
44,733
62,733
75,564
11,603
16,819
25,170
35,159
40,200
46,919
60,007
20,62222,247
23,90325,777
27,21429,060
31,332
11,630
15,14516,740
19,14920,676 21,674 22,796
6,2707,850
9,58710,925
13,064
16,08418,421
0
10,000
20,000
30,000
40,000
50,000
60,000
70,000
80,000
2006 2007 2008 2009 2010 2011 2012
IC in
MW
China United States Germany Spain India

Criteria for Site Selection
2.5 D
SITE SELECTION – PLAIN TERRAINS
SITE SELECTION – HILLY TERRAINS High annual average Wind Speed ( > 7 m/sec.)
Altitude of the proposed site. Nature of Ground (soil for proper
foundation / civil work ). Favorable environmental condition to
prevent corrosion & not prone to cyclone.
Availability of electrical infrastructure for evacuation of electricity generated .

Solar in India : Potential & Prospects
1. India receives the highest global solar radiation on a horizontal surface. According to solar energy experts, India has considerable scope for solar energy production. India is bestowed with solar irradiation ranging from 4-7 kWh/ sq. m/ day across the country.
2. The desert areas in India have the solar radiation required for CSP(concentrating solar power technology) production. A 60 km x 60 km area can produce 1,00,000 MW of power. India has a desert area of 2,08,110 Sq Kms in Rajasthan and Gujarat. Even if India uses only 15,000 Sq. Kms of the desert, it can produce 3,00,000 MW of power.
3. Government of India is currently envisaging large-scale expansion of solar power capacity by 2022.
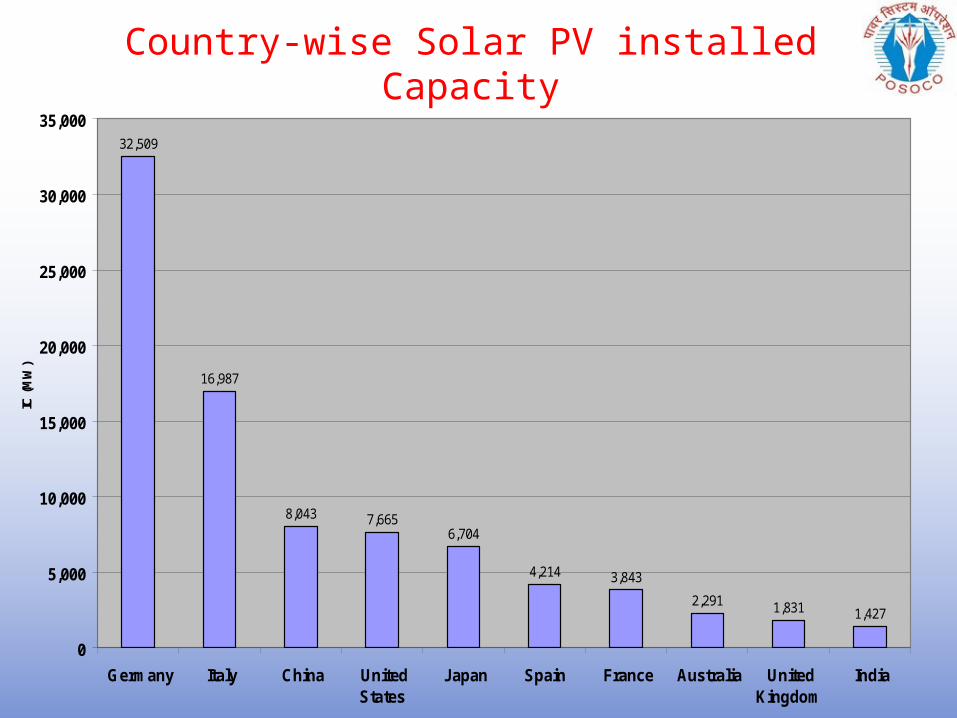
Country-wise Solar PV installed Capacity
32,509
16,987
8,043 7,6656,704
4,214 3,843
2,291 1,831 1,427
0
5,000
10,000
15,000
20,000
25,000
30,000
35,000
Germany Italy China UnitedStates
Japan Spain France Australia UnitedKingdom
India
IC (M
W)

Tidal energy & India
Long coastline offers huge potential.Identified tidal power potential: 9000 MW Need to be utilized with hydel power plants.
India predominantly agricultural country.Annual production of agro-forest and processing residues: 350 million tons.Power generation potential > 22,000 MWAdvantages:Decentralized generation: close to rural load centers.Technology reasonably well developedEnvironment friendly: No net CO2 No net CO2 emissions
Biomass
Feedstock Examples Potential Installed
Agro-forest residues
Wood chips, mulberry, coconut shells
17,000 MW 50 MW
Processing residues
Rice husk, sugarcane bagasse
5,000 MW 1000 MW
Geothermal energy & India
Yet to be tapped .
Potential capacity over 10000 MW .
Puga valley in Ladakh has an
experimental 1 KW generator in
geothermal field .
North-western Himalayas & Western
coast are considered Geothermal areas.
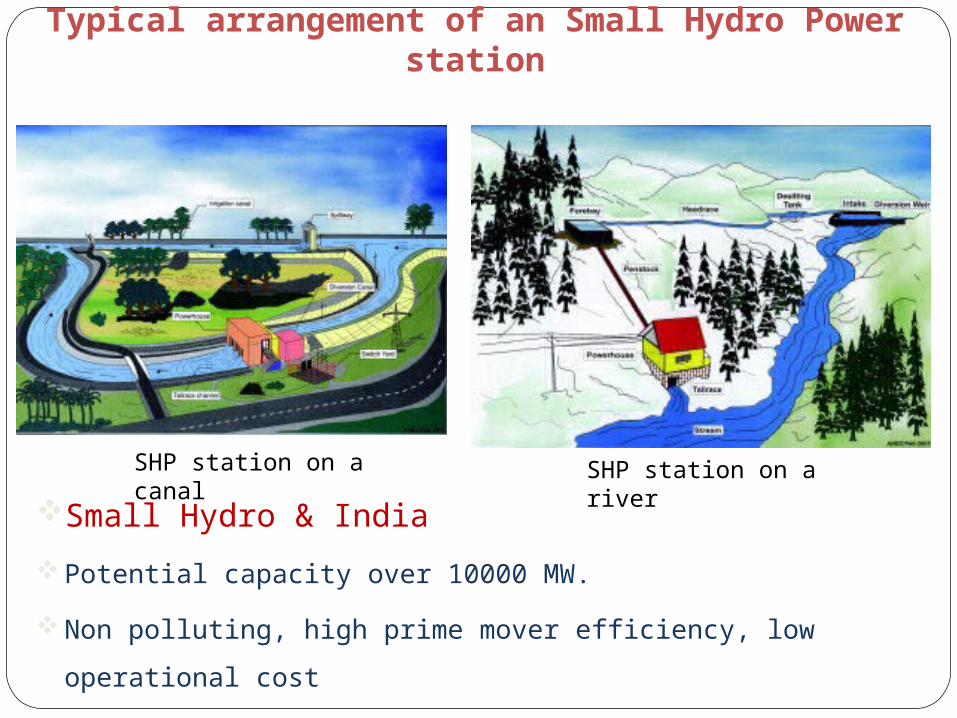
Typical arrangement of an Small Hydro Power station
SHP station on a canal
SHP station on a riverSmall Hydro & India
Potential capacity over 10000 MW.
Non polluting, high prime mover efficiency, low operational cost
Availabilty - seasonal and intermittent

Integration issues of WindIntegration issues of Wind
• Planning criterion for RE
• Variability and Intermittency
• Forecasting and Scheduling
• SCADA / telemetry
• Network related Problems and Congestion
• Protection
• Commercial mechanism implementation

Planning Transmission system for RE
At lower penetration RE treated as an energy rather than capacity addition.
As the penetration of the RE increases, RE treated in terms of MW capacity.
Network development and O&M up to the pooling station by the wind developer. beyond the pooling station by the Distribution
licensee.

TN WIND GENERATION
TAMILNADU WIND GENERATION ON MAXIMUM GENERATION DAY 59.61 MU on 16-07-2010
2000
2500
3000
0:00
1:00
2:00
3:00
4:00
5:00
6:00
7:00
8:00
9:00
10:0
0
11:0
0
12:0
0
13:0
0
14:0
0
15:0
0
16:0
0
17:0
0
18:0
0
19:0
0
20:0
0
21:0
0
22:0
0
23:0
0
0:00
TIME ?Data taken from SCADA TIME →
(28% of Energy)
SR Maximum Wind -17.08.10 AT 18:59 HRS
% of Wind in SR I/C – 17% % of Wind Gen in SR Demand Met – 14.9 %
% of Wind in TN I/C – 39.4 % % of Wind Gen in TN Demand - 31.3 %
Intermittancy: not continuously availableVariability : variable in magnitudeUncertainity : Variations may not be as Expected

MAX WIND DAY:KARNATAKA 13/07/2011 MAX WIND DAY:KARNATAKA 13/07/2011 – 22.31 MU GENERATED, – 22.31 MU GENERATED,
15.7% OF TOTAL STATE CONSUMPTION15.7% OF TOTAL STATE CONSUMPTION
WIND GENERATION IN MW
FREQUENCY
MAX: 1400 MW, MIN 1050 MW

Need for Accurate Forecasting
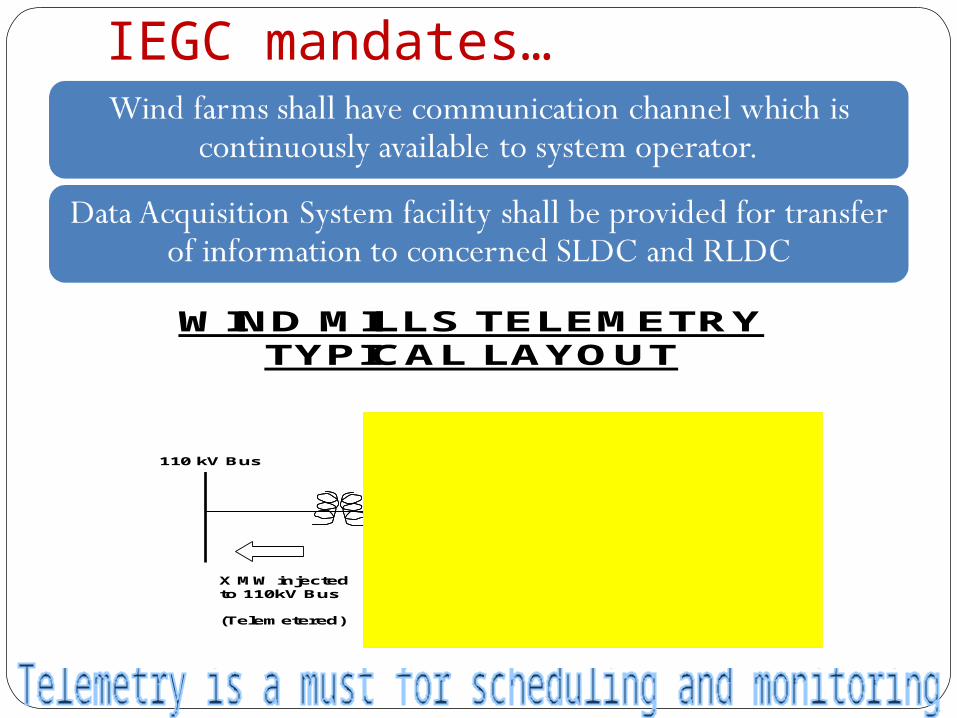
IEGC mandates…
WIND MILLS TELEMETRY TYPICAL LAYOUT
110 kV Bus
33kV or 11 kV Bus
LOADS
Untelemetered
X MW injectedto 110kV Bus
(Telemetered)
WIND MILLS

SCADA and telemetry

Protection requirements for RE
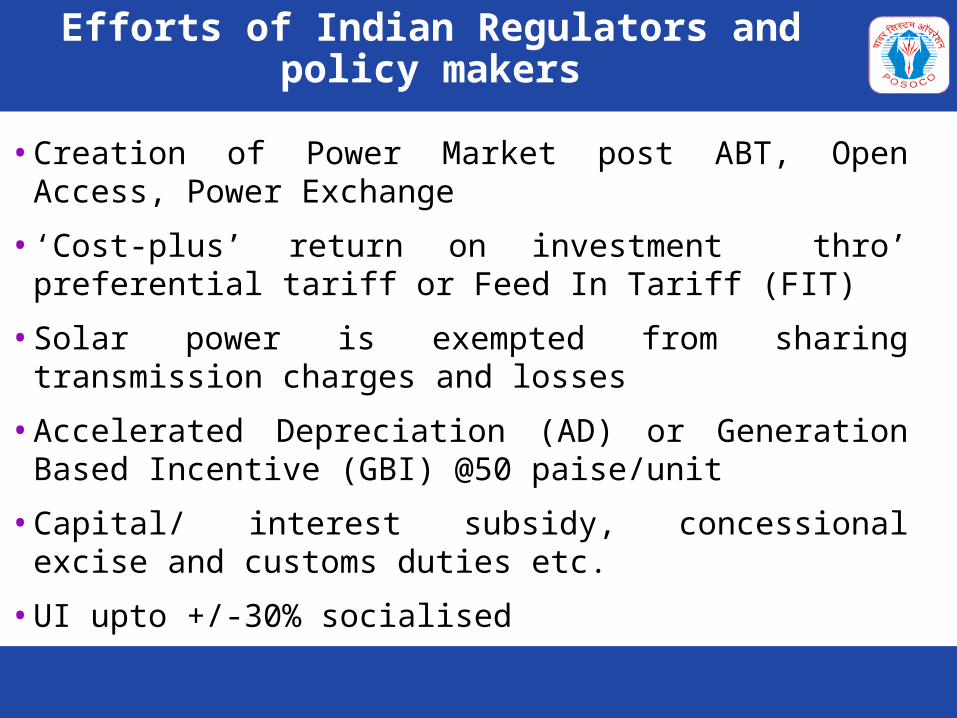
Efforts of Indian Regulators and policy makers
• Creation of Power Market post ABT, Open Access, Power Exchange
• ‘Cost-plus’ return on investment thro’ preferential tariff or Feed In Tariff (FIT)
• Solar power is exempted from sharing transmission charges and losses
• Accelerated Depreciation (AD) or Generation Based Incentive (GBI) @50 paise/unit
• Capital/ interest subsidy, concessional excise and customs duties etc.
• UI upto +/-30% socialised

• RE Sources Not evenly distributed across India• Inhibits the SERCs of potential deficit states from high
RPO• Potential rich states
• Already set higher RPO, still avenues left for new plants
• Very high cost of generation from RE sources (discourages local DISCOM to purchase beyond RPO)
• REC to address the mismatch between availability of RE sources and the requirement of RPO

Government Initiative: National Action Plan Government Initiative: National Action Plan on Climate Change (NAPCC), 2008on Climate Change (NAPCC), 2008
04/19/23
National level target for RE Purchase
5%of total grid purchase in 2010, to be increased by 1% each year
for 10 years: 15% by 2020
SERCs may set higher target
Appropriate authorities may issue certificates that procure RE in excess of
the national standard
Such certificates may be tradable, to enable utilities falling short to
meet their RPO
RE generation capacity needed: From 18000 to 45500 MW by FY2015

Eligibility of Wind Farms/Solar Generators for RECEligibility of Wind Farms/Solar Generators for REC
Wind farms – 10 MW and above and Solar plants - 5MW and above, connected at 33 KV and above :
• Connectivity details to concerned SLDC/RLDC
• Declaration about agreement if any
• Provide details of Contracts and Contracted path to the concerned SLDC RLDCRPC
• Generation forecast with periodic updates to SLDC/RLDC
• To provide Data Acquisition System (DAS) facility to SLDC/RLDC

Energy
Generation
GREEN ATTRIBUTE
GREEN ATTRIBUTE
ELECTRICITYELECTRICITY
RENEWABLE ENERGY
CERTIFICATE
SOLAR CERTIFICATE
NON-SOLAR CERTIFICATE

Options for DISCOMs to fulfill RPOOptions for DISCOMs to fulfill RPO
RPO
Buy Power @ Preferential Tariff
Buy REC
What is RPO ?
Obligation to purchase Renewable Energy directly through power purchase
or indirectly through purchase of Renewable energy Certificate
Renewable Purchase Obligation specified by SERC. It will :
Incentivise the RE generator
Reduce the Geographical imbalances in RE spread

NLDC 55
Electricity Component
* Self consumption by CPPs based upon renewable generation are eligible for RECs
RE Generation*
Sale at Preferential
TariffREC Component
Obligated Entities / Voluntary Buyers
Distribution Company/ Third Party Sale/ Power Exchange
Obligated Entities

ACCREDITATION
REGISTRATION
ISSUANCE
TRADE & REDEMPTION

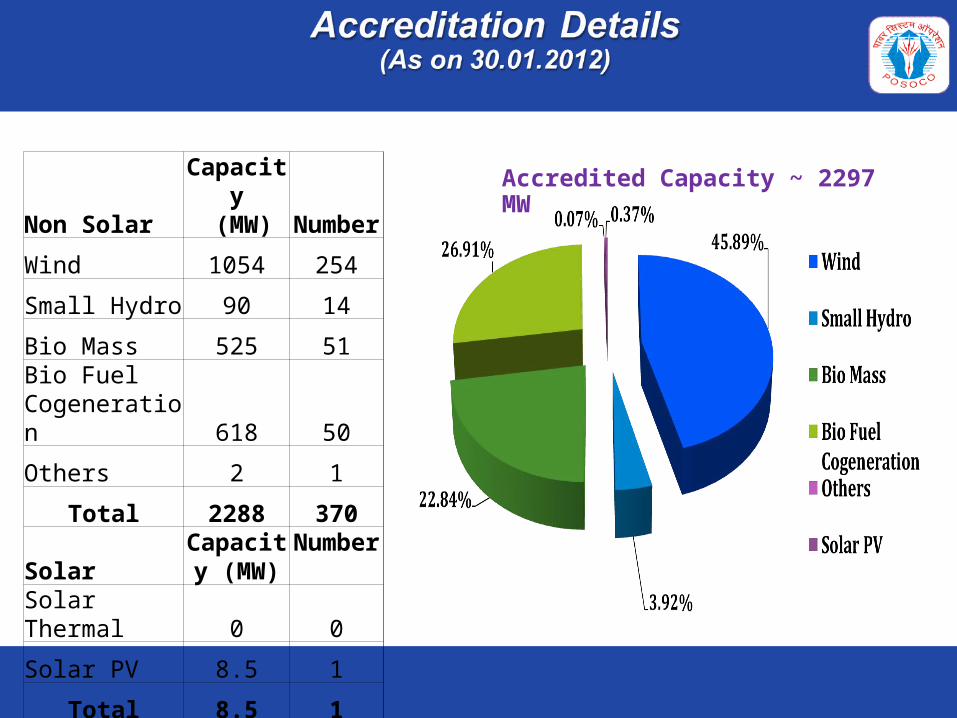
Non SolarCapacity (MW) Number
Wind 1054 254
Small Hydro 90 14
Bio Mass 525 51Bio Fuel Cogeneration 618 50
Others 2 1
Total 2288 370
SolarCapacity
(MW) Number
Solar Thermal 0 0
Solar PV 8.5 1
Total 8.5 1
Accredited Capacity ~ 2297 MW

Non SolarCapacity
(MW) NumberWind 900 204Small Hydro 88 13Bio Mass 446 38Bio Fuel Cogeneration 606 49Urban & Municipal Waste 0 0
Total 2039 304
SolarCapacity
(MW) Number Solar Thermal 0 0Solar PV 0 0
Total 0 0
Registered Capacity Surpassed CERC estimate of most optimistic scenario in REC Fees and Charges Order
Registered Capacity ~ 2039 MW


Measures under implementation stage :Measures under implementation stage :
• Forecasting and Scheduling of Grid connected wind and Solar
generators
• Eligible generators would be required to forecast their generation
with a minimum accuracy of + 30%.
• Any deviation upto + 30% will not have any cost implication to the
Renewable Energy generator.
• The RE generator can enter in to contract to supply power to any
entity located any where in the country under Short Term Open
Access at a price negotiated bilaterally.

Approach thro’ Renewable Regulatory Fund:Approach thro’ Renewable Regulatory Fund:
• Achieve better generation prediction using weather forecasting tools
• Immune wind generators from paying deviation in UI charges up to a certain level of variation
• No UI charges payable/receivable by Solar Generator
• Socialise the deviation charges arrived due to variations amongst different state utilities
• Develop a self sustaining mechanism towards better acceptance of intermittent generation

Conclusion
•With Larger Grid interconnection …
The variability can be better handled.•With Forecasting…
Operational planning can be better executed•With Scheduling ….
Accountability is induced•With REC mechanism and trading across seams…
RE will be an attractive business

Thank You