Embed Size (px)
Citation preview

C4
50p10/66p2 50p10/66p2
C1
’99The Industrial Bank of Japan, LimitedAnnual Report 1999Year ended March 31, 1999
AN
NU
AL
RE
PO
RT
1999T
HE
IND
US
TR
IAL
BA
NK
OF JA
PA
N, L
IMIT
ED
Printed in Japan

50p10/66p2 50p10/66p2
C2 C3
Introduction
IBJ was originally founded as a public-sector bank under the Industrial Bankof Japan Act of 1902. At that time, Japanwas in the throes of its industrial revolu-tion, and there was a strong demand forlong-term investment capital. IBJ raisedfunds by issuing bank debentures.
The Bank also acted as the trustee incorporate debenture issues—notably, themajor Japanese railway company issueof 1906 in London, amounting to thethen-enormous sum of £1 million. Theseactivities contributed to the building ofthe domestic securities market and to thegenerating of a higher profile for Japan-ese borrowers in the international market.
This early experience of a sophisticatedmix of corporate and investment bank-ing with exposure to trust work is uniqueto the Bank among Japanese banks. Inthe original Act, there was the wording,“trust business related to local govern-ment bonds, corporate bonds, and equi-ties”. This was the first time for the term“trust”, or “shintaku”, to appear in theJapanese statute book.
The 1918 amendment to the IBJ Actpermitted the underwriting and offeringof equities. At that point, the Bank hadthe full capabilities for what is nowtermed investment banking. However,that was at what proved to be the peakof the demand created for Japaneseproducts by the First World War and theconsequent economic boom.
Thereafter, the next 30 years of Japan-ese history encompassed many adversi-ties for society in general and for financialinstitutions in particular: the Great KantoEarthquake, the Showa Financial Panic,and, finally, the Second World War andthe postwar recovery.
The Bank became a private-sector bankin 1950 and took on its current legal formunder the Long-Term Bank Act of 1952.However, the Act was framed within theterms of the U.S.-led Occupation policyof compartmentalizing financial services.IBJ was forced to retreat from much of itsformer investment banking activities andreturn principally to long-term lendingfunded by issuing bank debentures.
During the high-growth period of theJapanese economy in the 1960s, the Bankwas particularly active in financing steelproduction, shipping, shipbuilding, andvehicle manufacturing. Following thefirst oil crisis, Japan moved to a pattern oflower growth as a mature economy, andthe Bank expanded its customer base athome and started the process of expan-sion overseas.
Domestically, the wholesaling of bankdebentures to major financial institutionsand the regional banks led to a networkof strong relationships. This was all sup-ported by the fact that, originally a pub-lic-sector bank, the Bank had no keiretsuaffiliations: the Bank has always been in-dependent of the large corporate group-ings characteristic of Japan. Internationally,the Bank was free to pursue its invest-ment banking ambitions.
The current round of liberalization,Japan’s Big Bang, is enabling the Bankto return to its domestic investmentbanking roots and more fully explorethe benefits of its independence andrelationship networks.
Financial Highlights 1
Message from the President2
Management Rationale and Strategy at IBJFrequently Asked Questions
Rationale6
Steps to “First Call Bank” Status7
Corporate Governance8
Transparency in the Management Strategy9
IBJ’s Future-Oriented Business Strategy10
Differentiation with Other Leading Domestic Banks
11
Competition with Leading Foreign Banks11
Specialist Subsidiaries and Affiliates12
Funding Reliance on Bank Debentures13
Non-Performing Loans14
Emerging Market Exposure15
Year 2000 Problem16
Restructuring and Re-orientation Preparing for Heightened Competition
in the Post-Big Bang Era
Revenue Plan17
Rationalization18
Personnel Policy20
Strategic Alliances22
Risk Control and Compliance Issues Controlling Risk and Ensuring Compliance
Risk24
Credit Risk25
Market Risk27
Liquidity Risk31
Operational Risk32
Systems Risk32
Legal Risk32
Internal Control33
Compliance33
Operations in OutlineBalancing the Center and the Periphery
35
Financial Section49
Corporate Data103
Contents

1
Finan
cial Hig
hlig
hts
(in thousands of (in millions of yen) U.S. dollars)**
1999 1998 1999
For the Years Ended March 31Total Income ¥ 3,386,760 ¥ 3,321,902 $ 28,094,239Total Expense 3,642,993 3,635,020 30,219,769Loss before Income Taxes and Others (256,232) (313,118) (2,125,530)Net Loss (181,276) (202,660) (1,503,748)
At March 31Total Assets 46,166,409 49,229,785 382,964,825Loans and Bills Discounted 23,327,907 24,001,429 193,512,295Investment Securities 8,942,151 8,847,249 74,177,945Debentures 20,461,865 20,840,941 169,737,583Deposits 8,116,321 10,053,551 67,327,432Total Shareholders’ Equity 1,561,350 1,320,019 12,951,888
(in yen) (in U.S. dollars)**
1999 1998 1999
For the Years Ended March 31Per Common Stock
Net Loss ¥ (70.64) ¥ (79.80) $ (0.586)Cash Dividends 7.00 8.50 0.058
Return on Equity (14.3%) (14.2%)
At March 31BIS Capital Adequacy Ratio 11.30% 10.26%
* All figures are on a consolidated basis, unless stated otherwise.** U.S. dollar amounts are converted, for convenience only, at ¥120.55 per dollar (interbank rate in Tokyo at March 31, 1999).
Financial Highlights
(250)
(200)
(50)
0
50
(Years ended March 31)
9998979695940
10,000
20,000
30,000
40,000
50,000
9998979695940
500
1,000
1,500
2,000
999897969594
U Net Income (Loss)(¥ billion)
U Total Assets(¥ billion)
U Total Shareholders’ Equity(¥ billion)
0
3
6
9
12
999897969594
U BIS Capital Adequacy Ratio(%)

2
Iwould like to thank all our friends for their interest and support
during the past year. We are at a crucial stage in implementing our
strategy of focusing our resources in commercial banking, investment
banking, treasury operations, and securities and asset management, while
selectively strengthening international banking operations and substantially
enhancing our capabilities for the development of sophisticated financial
technologies. We are also taking steps to increase our competitiveness by
rationalizing our cost structure and strengthening our capital base. Achieving
these aims will ideally position us to take the maximum advantage of
opportunities presented by Japan’s Big Bang and to be a player in the
fast-changing global market.
Operating Environment
Fiscal 1998, ended March 31, 1999, was marked by a number of important
developments. Japan’s financial Big Bang was formally launched, with a
series of new laws and administrative measures. These included the enact-
ment in April 1998 of a revised foreign exchange law and the authorization
in December of investment trust sales at bank offices. The year also saw
decisions on the timing of other important Big Bang measures to be intro-
duced over the next few years. For example, the government decided to
allow bank-related securities companies to begin handling equities from
October 1999.
Another important legal development of the year was the enactment
of a series of laws and other measures to provide a safety net as well as to
reform and strengthen the Japanese banking system. In October, the Diet
approved a proposal for public funds to be used to strengthen the capital
base of banks. This resulted in ¥7.5 trillion in public funds being invested
in preferred shares and subordinated liabilities of the 15 largest Japanese
banks before the end of March 1999. IBJ was the first among these banks to
announce its willingness to cooperate with the government’s restructuring
program.
In response to these developments, not only banks but also other finan-
cial institutions, including securities companies and life insurance compa-
nies in Japan and overseas, embarked on a series of business tie-ups and
mergers to maintain and strengthen their competitiveness as well as pro-
vide the services required in the new financial environment. IBJ remains
one of the most active players in this area and has concluded alliances with
the Nomura Securities Co., Ltd., and the Dai-ichi Mutual Life Insurance
Company.
Message from the President
Mes
sag
e fr
om
th
e Pr
esid
ent

3
Business Results for Fiscal 1998
Anticipating these developments, in April 1998, we identified five principal
tasks to substantially reform the management of our operations in the year
ended March 31, 1999, and the year ending March 31, 2000. These were to
•conduct a thorough review of our business and financial positions,
•take decisive steps to dispose of non-performing loans,
•proceed with the restructuring of our operations,
•strengthen our position in core businesses, and
•respond effectively to the Big Bang and the reorganization of Japan’s
financial sector.
As part of our efforts to fulfill these tasks, we adopted aggressive mea-
sures to make our final write-off of non-performing loans and provided
conservatively for the reserve for possible loan losses. We accordingly
reported the highest level of credit costs in IBJ’s history, ¥924.3 billion.
As a result of this and other factors, we reported a net loss for the second
consecutive year, of ¥195.7 billion, on a non-consolidated basis.
With a view to maintaining our BIS capital adequacy ratio at a level ap-
propriate for a leading international bank, we made a third-party capital
allocation of ¥67.0 billion to Dai-ichi Mutual Life Insurance and issued
¥176.0 billion in preferred shares through overseas subsidiaries and ¥64.0
billion in subordinated bonds, for a total of ¥307.0 billion in new capital
raised through our own efforts. In addition, we received ¥600.0 billion
in public funds through the issuance of convertible bond-type preferred
stocks and perpetual subordinated bonds. As a consequence of these mea-
sures, we were able to raise our BIS capital adequacy ratio on a consolidat-
ed basis from 9.22% before introducing public funds to 11.30% at March 31,
1999, comfortably above the 10% level.
Organizational Changes Responding to the Big Bang
One of the principal results of the Big Bang will be to allow financial insti-
tutions to offer a wider range of services to customers instead of being con-
fined to specific financial service sectors. The IBJ Group began to make
preparations for deregulation more than 10 years ago. As deregulation
accelerates, to establish IBJ as a “First Call Bank” capable of providing a
broad range of the highest-quality services, we have made a number of
internal organizational changes and established new subsidiaries and joint
ventures. Some of the most important changes were as follows:
•We organized our customer-related business into four sectors: the
Corporate Banking Unit, the Investment Banking Unit, the Treasury
Unit, and the Securities and Asset Management Unit, with a view to
having these develop into autonomous profit centers.
Message from the President
Messag
e from
the Presid
ent
Masao NishimuraPresident and Chief Executive Officer

•We raised the division in charge of planning for the IBJ Group to
departmental status—the Business Planning Department (IBJ Group)—
to coordinate the development of an expanded range of financial ser-
vices offered by the Group.
•We established the Risk Management Department to oversee credit,
market, and liquidity risk comprehensively.
In addition to these organizational changes, we are adopting measures to
reform our operations. These include reviewing our operations and office
network to increase efficiency and creating personnel management systems
that make it possible to fully utilize the services of more specialized and
efficient personnel.
In May 1998, to expand the scope of services in response to Japan’s Big
Bang, we announced the formation of several joint ventures with Nomura
Securities. These companies will engage in promising growth areas, includ-
ing derivatives, asset management and administration business, especially
record-keeping for Japanese-style 401(k) defined contribution pension
schemes, and asset management advisory services. In parallel with these
activities, we reached an agreement with Dai-ichi Mutual Life Insurance in
October 1998 on the formation of an across-the-board alliance. Thus far,
we have cooperated in lending and other financing activities, the joint
development of real estate securitization programs, the cross-selling of
investment trusts, and the development of financial technologies and
instruments through the establishment of a joint venture for this purpose.
Moreover, we have decided to merge our asset management companies
and operate the merged company as a joint venture in October 1999.
Management Strategy and Directions
For almost two decades, IBJ has recognized that it must move beyond its role
as a long-term credit bank primarily engaged in financing the development
of Japanese industry. To that end, we have prepared a series of management
plans, the first of which started in 1988. Our Fourth Medium-Term Manage-
ment Plan, which began in April this year and will extend through the year
ending March 31, 2002, sets a number of concrete goals, namely,
•focusing on the needs of our customers and providing high-value-
added services that win customer satisfaction and trust,
•developing and applying the most advanced financial technologies,
•training of personnel and encouraging them to realize their full
potential, and
•contributing to society and encouraging an awareness of social
responsibility.
Message from the President
Mes
sag
e fr
om
th
e Pr
esid
ent
4

Based on these goals, we plan to continue developing our industrial
finance activities, centering around commercial and investment banking,
and offering our customers a diverse range of high-value-added financial
services that meet their needs promptly and accurately. It is our aim to be-
come Japan’s leading “First Call Bank.”
To this end, we have made three additional major reforms in our manage-
ment framework. The first is the introduction of the Executive Director
System that clarifies authority and responsibility in various operating units.
The second is the appointment of an Advisory Board made up of prominent
individuals from various fields to provide frank advice to IBJ management.
The third is the establishment of the business unit system that we envision
will lead eventually to the management of core businesses as profit centers.
In addition to these reforms, we are planning to establish a financial holding
company in the autumn of 2000, which is expected to enable IBJ Group com-
panies to pursue greater specialization and allow us to realize the full poten-
tial of our management resources in providing a broad range of services for
our customers.
The introduction of a fully consolidated Group structure, for financial
and management accounting purposes, should raise the levels of responsi-
bility and transparency to global standards.
And, further, on August 20, 1999, IBJ agreed to consolidate its operations
with those of the Dai-Ichi Kangyo Bank, Limited, and the Fuji Bank, Limited,
on an equal basis under a holding company to be established, subject to
regulatory and shareholders’ approval (Please refer to the appendix for
your inquiries.). In this way, we plan to fulfill our responsibility for building
a strong earnings base and achieving an early recovery in performance.
Realizing all of our aims in the coming years will be a major challenge,
but we are sure that, with your support, we can continue to make progress
in building a new IBJ for the 21st century.
August 1999
Masao Nishimura
President and Chief Executive Officer
Message from the President
Messag
e from
the Presid
ent
5

IBJ is aiming to become theleading “First Call Bank”—
the first bank to be contacted—forthe wholesale financial requirementsof Japanese corporations, bothfinancial and non-financial.
That means being able to offerJapanese corporations, both financialand non-financial, the right productat the right time. In the globalizedfinancial markets of today, thatmeans providing competitivelypriced value-added service as andwhen the demand arises. As a non-keiretsu bank with a long tradition ofindependence, the Bank is surpris-ingly well placed to achieve its aim.
In specific terms, being a “FirstCall Bank” means not only providing
the standard commercial bankingproducts of deposits, lending, andforex, but also the investment bank-ing products of the securitization ofassets and receivables, the syndicationof issues, M&A advisory services,balance sheet restructurings, andother similarly highly specializedprofessional services, such as securi-ties and asset management relatedservices, which require financialengineering expertise and IT-relateddatabase know-how. The long histo-ry of the Bank and its large customerbase mean that if such services andproducts are provided competitivelyand in a timely fashion, the Bankshould indeed become the “First CallBank” of much of non-financial cor-porate Japan.
Because of its peculiar historyamong the major Japanese financialinstitutions, the Bank maintains aunique independence from anykeiretsu grouping. Also, the Bank’slong use of bank debentures as ameans of funding has created anextensive network of relationshipswith many financial institutions,principally regional banks and invest-ing institutions. The wholesale orien-tation should enable IBJ to make the“First Call Bank” concept also applyto financial corporate Japan. In par-ticular, the network should proveuseful in the retailing of asset man-agement related products wholesaledby the Bank.
Frequently Asked Questions
6
Management Rationale and Strategy at IBJ
Man
agem
ent
Rat
ion
ale
and
Str
ateg
y at
IBJ
What type of bank is IBJ attempting to become?[ ]<Rationale
=

Man
agem
ent R
ation
ale an
d Strateg
y at IBJ
7
Management Rationale and Strategy at IBJ
The current medium-termmanagement plan running
from the year ending March 31, 2000to 2003, is now being acted on.
The three key points of this plan are:1. Efficiency: an improved return onequity and an improved balancesheet position, 2. Accountability:restructured corporate governance,and 3. Transparency: clearly enunci-ated management strategies. The aimis to become a bank that is clear inits thinking, speedy in its execution,and creative in its product and servicedevelopment. Only in these wayswill IBJ achieve the vital “First CallBank” status.
Efficiency, an improved returnon equity and an improved balancesheet position require that there hasto be an increase in profitability, arestructured balance sheet, and con-siderable rationalization of opera-tions. Profitability means being ableto provide value-added services effi-ciently and being able to market theseaggressively. Balance sheet restruc-turing depends on being able towrite off non-performing loans andprovide adequately for doubtfulloans as well as on being able to liq-uidate the capital locked up in IBJ’slarge portfolio of equities held forpurely relationship reasons. Thepainful process of rationalizationrequires the Bank to consolidate its
branch network at home and over-seas, to reduce the size of the Board,and to improve performance.
Senior management is emphasiz-ing the detailed management of riskand return to minimize volatility inrevenues. Senior management is alsopositioning the IBJ Group to takeadvantage, as soon as practicable, ofthe new financial holding company(FHC) structure in the quest for greaterefficiency, accountability, and trans-parency. The IBJ Group is workingto increase ROE on a core businessprofit basis from the forecast resultof 11.8% for the year ending March31, 2000, to 14.8% for 2003: the peri-od of the current medium-termmanagement plan.
To achieve “First Call Bank” status, what fundamental steps are being taken?[ ]<Steps to “First CallBank” status
=
IBJ FHC Structure
•IBJ NW Asset Management•IBJ InvestmentTrust Management and Dai-ichi LifeAsset Management [Three companies areto be merged into DLIBJ Asset Management onOctober 1, 1999]
•IBJ •IBJSecurities,etc.
Securities-relatedservices
Assetadministration
services
•Other
ServingIndustrial corporations Individuals Financial institutions
� The New IBJ Group in Summary
Corporatebanking
Asset management services Investment banking
•IBJ Trustand Banking,etc.
8
Despite the various conven-tional and legal constraints in
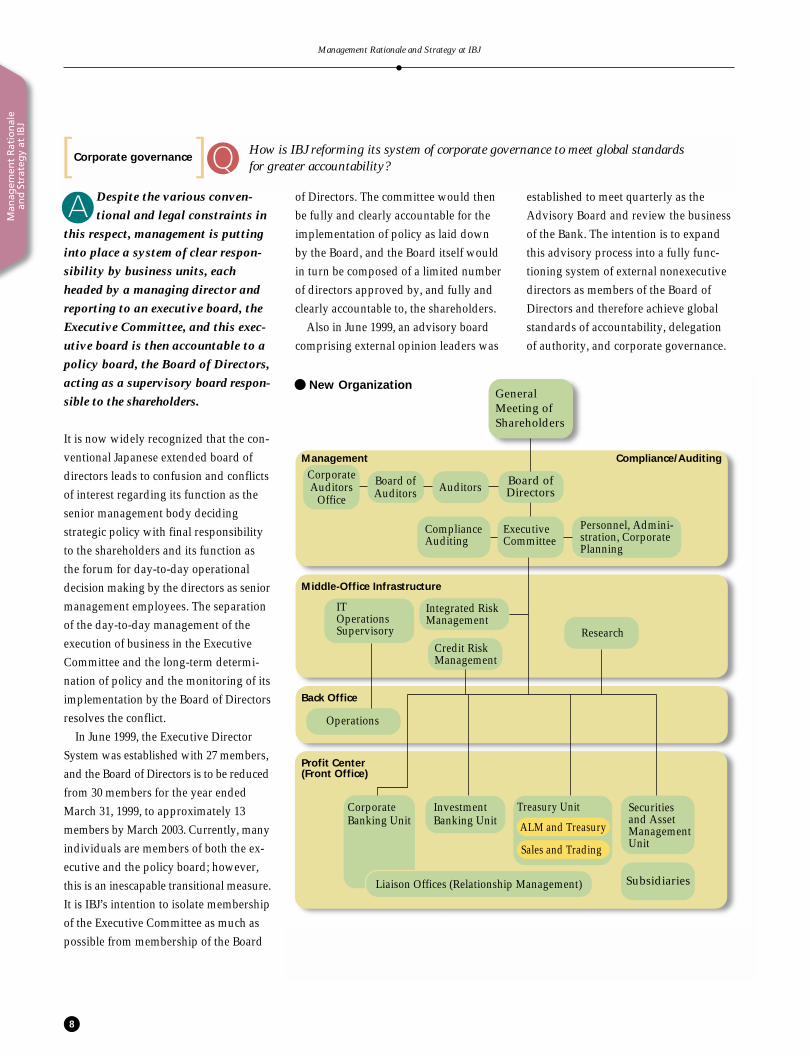
this respect, management is puttinginto place a system of clear respon-sibility by business units, eachheaded by a managing director andreporting to an executive board, theExecutive Committee, and this exec-utive board is then accountable to apolicy board, the Board of Directors,acting as a supervisory board respon-sible to the shareholders.
It is now widely recognized that the con-ventional Japanese extended board ofdirectors leads to confusion and conflictsof interest regarding its function as thesenior management body decidingstrategic policy with final responsibilityto the shareholders and its function asthe forum for day-to-day operationaldecision making by the directors as seniormanagement employees. The separationof the day-to-day management of theexecution of business in the ExecutiveCommittee and the long-term determi-nation of policy and the monitoring of itsimplementation by the Board of Directorsresolves the conflict.
In June 1999, the Executive DirectorSystem was established with 27 members,and the Board of Directors is to be reducedfrom 30 members for the year endedMarch 31, 1999, to approximately 13members by March 2003. Currently, manyindividuals are members of both the ex-ecutive and the policy board; however,this is an inescapable transitional measure.It is IBJ’s intention to isolate membershipof the Executive Committee as much aspossible from membership of the Board
of Directors. The committee would thenbe fully and clearly accountable for theimplementation of policy as laid downby the Board, and the Board itself wouldin turn be composed of a limited numberof directors approved by, and fully andclearly accountable to, the shareholders.
Also in June 1999, an advisory boardcomprising external opinion leaders was
Man
agem
ent
Rat
ion
ale
and
Str
ateg
y at
IBJ
Management Rationale and Strategy at IBJ
=established to meet quarterly as theAdvisory Board and review the businessof the Bank. The intention is to expandthis advisory process into a fully func-tioning system of external nonexecutivedirectors as members of the Board ofDirectors and therefore achieve globalstandards of accountability, delegationof authority, and corporate governance.
How is IBJ reforming its system of corporate governance to meet global standards for greater accountability?[ ]<Corporate governance
� New Organization
Management Compliance/Auditing
Board ofDirectors
ExecutiveCommittee
ComplianceAuditing
Personnel, Admini-stration, CorporatePlanning
Middle-Office Infrastructure
IT OperationsSupervisory
Integrated RiskManagement
Credit RiskManagement
Research
Back Office
Operations
Profit Center(Front Office)
Corporate Banking Unit
Investment Banking Unit
Securitiesand AssetManagement Unit
Liaison Offices (Relationship Management) Subsidiaries
AuditorsBoard ofAuditors
CorporateAuditors
Office
Treasury Unit
ALM and Treasury
Sales and Trading
General Meeting of Shareholders

9
Management Rationale and Strategy at IBJ
Man
agem
ent R
ation
ale an
d Strateg
y at IBJ
To raise ROE and to enhanceshareholder value, senior man-
agement has to adopt a clear andlogical evaluation of business oper-ations: the IBJ Group can no longerafford to try to do everything.
The core businesses of the IBJGroup have been determined as1. Commercial banking, 2. Investmentbanking, 3. Treasury operations, and4. Securities and asset management.To support these four core business-es, it is necessary to build strength in
the two related areas of internationaloperations and financial engineering.However, IBJ is withdrawing fromall other areas that are non-core, suchas retail banking for individual cus-tomers and international operationsoutside the four core businesses.
The “New IBJ” structure is set outconceptually below: the four corebusinesses supported by international
operations plus financial technolo-gies. The current financial productretailing will be withdrawn from,and emphasis will be placed onproduct wholesaling via cooperat-ing financial institutions. Internationalactivity superfluous to the core busi-nesses will also be abandoned.
What is meant by “transparency” in the management strategy?[ ]<Transparency in themanagement strategy
=
IBJ Group
� Core Businesses and Areas for Strategic Focus
Securities and Asset Management
Treasury Operations
Investment Banking
Commercial Banking
Retail Banking
Non-Core International Operations
Financial Technologies
International Operations
� Businesses IBJ Will Abandon
While these changes appear complexand involved, they form the onlypracticable route possible from Japanesestandards to global standards within therestrictions of current conventions andlegislation. It is the intention of the IBJGroup to take advantage of the newlypermitted financial holding company(FHC) structure as soon as possible. TheIBJ Group should move to an FHC struc-ture in the autumn of 2000, with itsstrategic specialist subsidiaries fully
included for maximum efficiency. The fourcore business units—corporate banking,investment banking, treasury, and secu-rities and asset management—nowreport independently for the purposes ofmanagement accounts. They could thentake advantage of legislative develop-ments in company law, anticipated to beenacted shortly, and incorporate them-selves as fully stand-alone subsidiariesand therefore will completely separaterisk, personnel, and budget management.
In the continuing consolidation of theJapanese financial services industry, it islikely that attractive and complementaryfinancial players will become availablefrom time to time. The FHC structurewould obviously make the opportunisticincorporation of such players into theGroup eminently practicable. TheIBJ Group would then be increasinglybetter able to offer products and servicesin its key competencies.

10
Management Rationale and Strategy at IBJ
Man
agem
ent
Rat
ion
ale
and
Str
ateg
y at
IBJ
Taking full advantage of thewave of liberalization in
Japan, IBJ is building a broadlybased but targeted financial servicesprovider capability.
The liberalization of the Japanesefinancial services industry startedwith the impetus of the U.S.-Japanbilateral agreement of 1984. Oneconsequence was the legislation thatmade it possible, through so-calledcross-over subsidiaries, for banksand other institutions to enter intothe securities and trust banking busi-nesses, while the securities compa-nies could enter the new fields ofbanking and trust banking.
Foreseeing the long-term impactof these various liberalization mea-sures, the Bank expanded the Indus-trial Bank of Japan (Germany) andIBJ International plc presences insecurities operations, acquired theU.S. banking operation of SchrodersUS Holdings Inc. and the U.S. prima-ry dealer, Aubrey G. Lanston, andestablished The Bridgeford Groupas a specialist M&A boutique sub-sidiary in the United States. In the
domestic market, the Bank estab-lished these important strategic sub-sidiaries: IBJ Securities Co., Ltd.; IBJNW Asset Management Co., Ltd.; IBJInvestment Trust Management Co.,Ltd.; IBJ Trust and Banking Co., Ltd.;and IBJ-DL Financial TechnologyCo., Ltd.
Further, New Japan Securities Co.,Ltd., and Wako Securities Co., Ltd.,are to be merged, and the IBJ Group’sinterest in the new company, ShinkoSecurities Co., Ltd., will be raisedto 25%, and the share capital of IBJSecurities has already been increased.In this fashion, the IBJ Group willtake a significant position in bothwholesale and retail securities.
Further in line with developmentsamong other world-leading financialinstitutions, a product-oriented matrixorganization, rather than the previ-ous region/corporate entity orientedmanagement organization, has beenconstructed, within which these spe-cialist subsidiaries fit naturally.
What strategy is the management of IBJ adopting for the future?[ ]<IBJ’s future-orientedbusiness strategy
=
11
Management Rationale and Strategy at IBJ
Man
agem
ent R
ation
ale an
d Strateg
y at IBJIBJ has quite different origins
from other leading Japanesebanks. It is clear and logical to usea fundamentally different strategy.
In the current environment of liber-alization associated with Japan’s BigBang, each bank is attempting torefocus its strategy on its inherentstrengths. The other leading banks
are being forced to go back to pro-viding retail banking services to indi-viduals and smaller businesses. Theregional banks are being forced tore-emphasize their local connections.In all this, the Bank is positioned witha uniquely corporate orientation andhas comparatively strong overseascapabilities. Specialization in thewholesale business rather than in theretail business makes perfect sense.
Being wholesale means that itis possible to distribute productsthrough the retail network of otherbanks: the independence of the Bankmakes that practicable. It is the long-term aim of the Bank to exploit thenetworks of those banks specializingin retail both in Japan and overseas.
Other leading Japanese banks are emphasizing retail operations, and, in a disintermediatingfinancial economy, retail business is generally thought to be more profitable than wholesalebusiness. Is the right decision being made?[ ]<Differentiation with
other leadingdomestic banks
=
IBJ has already started theprocess of emphasizing its
core businesses, and, as a matterof fact, this is already improvingprofitability.
Investment banking and securitiesand asset management have beenreceiving the preferential investmentof funds and personnel, and this pro-cess is leading to overall improvedprofitability. IBJ is fully capable infinancial engineering products, suchas structured finance, and that type
of specialist knowledge is absolutelyimperative in the provision of value-added services to its corporate cus-tomer base.
As a consequence of the Big Bangliberalization measures, the old com-partmentalized separations of finan-cial services providers are disappearing,and the four core businesses andtheir various support operationsshould eventually be reorganizedas IBJ Group subsidiaries under afinancial holding company (FHC)consolidated structure.
These Big Bang processes meanthat the previously existing institu-tional brakes on the competitivenessof Japanese institutions are beingremoved. Their competitivenessshould rise over the longer term, andthe first-tier Japanese banks shouldeventually be fully on a par with theleading European and U.S. banks.The IBJ Group, which has the aimof serving its corporate customerswith such sophisticated productsas a “Problem Solution Provider,”should be at the forefront of thesedevelopments.
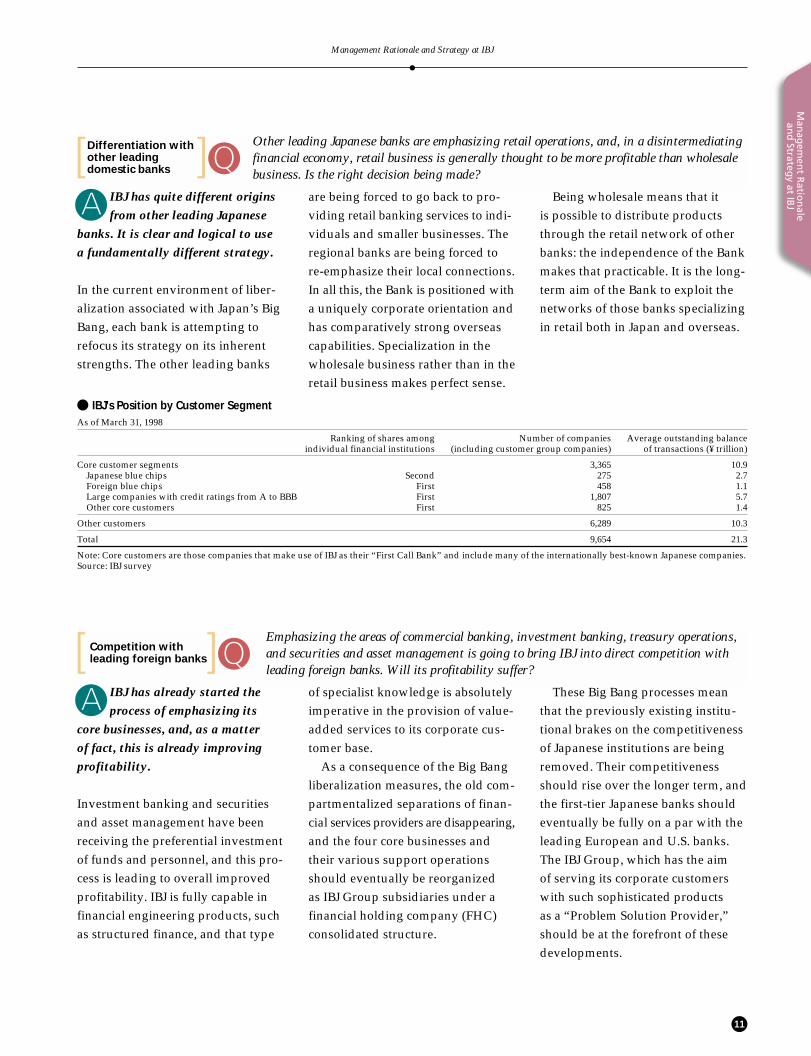
� IBJ’s Position by Customer SegmentAs of March 31, 1998
Ranking of shares among Number of companies Average outstanding balanceindividual financial institutions (including customer group companies) of transactions (¥ trillion)
Core customer segments 3,365 10.9Japanese blue chips Second 275 2.7Foreign blue chips First 458 1.1Large companies with credit ratings from A to BBB First 1,807 5.7Other core customers First 825 1.4
Other customers 6,289 10.3
Total 9,654 21.3
Note: Core customers are those companies that make use of IBJ as their “First Call Bank” and include many of the internationally best-known Japanese companies. Source: IBJ survey
Emphasizing the areas of commercial banking, investment banking, treasury operations,and securities and asset management is going to bring IBJ into direct competition withleading foreign banks. Will its profitability suffer?[ ]<Competition with
leading foreign banks
=

Private Sectorand
Public Sector
Retail Banksand
Institutional Investors
StrengtheningFinancial Service Capabilities
of the IBJ Group •Securities: IBJ Securities•Asset Management: IBJ NW Asset Management, IBJ Investment Trust Management, and Dai-ichi Life Asset
Management [Three companies are to be merged into DLIBJ Asset Management on October 1, 1999]•Asset Administration: IBJ Trust and Banking•Financial Technologies: IBJ-DL Financial Technology
Core BusinessCommercial Banking
Investment Banking
Treasury Operations
Securities and Asset Management
Industrial Corporations Financial Institutions
12
Management Rationale and Strategy at IBJ
Man
agem
ent
Rat
ion
ale
and
Str
ateg
y at
IBJ
The strategy is to build the IBJGroup into a financial services
institution that is the “First CallBank” in its key competencies.
Customer requirements are becom-ing more demanding and varied, andit is necessary to set up a number ofspecialized subsidiaries and affiliatesin such areas as securities, asset man-agement, defined contribution pensionrelated record-keeping, and otherareas. The wholly owned subsidiaryIBJ Securities Co., Ltd., was incorpo-rated in 1993 and has been successfulin carving out a large market share incorporate straight bonds. In the second-ary markets, it has also taken marketshare in sales and trading. Up untilnow, IBJ Securities had one arm tiedbehind its back: it was largely restrict-ed to public and corporate entitystraight bonds. In the autumn of thisyear, the restriction on entering equi-ties is scheduled to be lifted. Aheadof that deregulation, the capital andstaffing of IBJ Securities have beenincreased.
IBJ Securities is active in the interna-tional markets and becoming fully ableto satisfy the requirements of cus-tomers at home and overseas. Thisprocess will be accelerated with thescheduled merger of two securitiesaffiliates, Wako Securities Co., Ltd.,and New Japan Securities Co., Ltd.,into Shinko Securities Co., Ltd. The IBJGroup should further establish a majorpresence in the securities business.
In asset management, in 1985, IBJNW Asset Management Co., Ltd., wasincorporated, and in 1994 and 1995,IBJ Investment Trust ManagementCo., Ltd., and IBJ Trust and BankingCo., Ltd., were incorporated, respec-tively. The Japanese asset manage-ment industry is facing substantialliberalization and deregulation, andthese companies are playing a signif-icant role in the process. In particu-lar, the introduction of Japanese-style401(k) defined contribution pensionschemes is likely to have a majorimpact on the market.
IBJ has entered into an allianceagreement with Dai-ichi MutualLife Insurance Company, and both
companies’ asset management sub-sidiaries are to be merged into DLIBJAsset Management Co., Ltd., onOctober 1, 1999. The considerable mer-its of scale of the merger should posi-tion the IBJ/Dai-ichi alliance well.
Also, the introduction of definedcontribution pension schemes is like-ly to lead to an immense demand forthe back-office services associatedwith such schemes. IBJ and NomuraSecurities Co., Ltd., have formed ajoint venture, Nomura-IBJ Invest-ment Services Co., Ltd. (NIIS), andthis company is to play an importantrole in the system that is being cur-rently put into place: the so-calledJapanese-style 401(k) defined contri-bution pension schemes.
Behind these specialist subsidiarieslies the basic rationale of moving theIBJ Group toward value-addedwholesale products and services: asan independent group of financialinstitutions that has targeted andfully restructured its chosen businessareas of competence and can trulyaspire to be the “First Call Bank”of choice.
Recently, a number of specialist subsidiaries have been formed. What is the strategy?[ ]<Specialist subsidiariesand affiliates
=

13
Management Rationale and Strategy at IBJ
Man
agem
ent R
ation
ale an
d Strateg
y at IBJThe impact on IBJ funding of
apparently competing andsubstitute bonds has been minimalto date. With different terms, thereis no real substitution effect.
The bank debenture market has beenlimited to the long-term credit banksand a limited number of other special-purpose financial institutions.
The market is worth around ¥60.0trillion and is second only to the JGBmarket itself. The IBJ issue accountsfor some ¥20.0 trillion of the total ¥60.0trillion, and there has been steadydemand from a variety of customers,such as financial institutions andinstitutional investors. This has beenon account of the liquidity and sizeof the market with its wide varietyof maturity dates available in thesecondary market. If the special fac-tors of the currently abnormally lowinterest rates and the reaction to theenormous success of the high couponproduct, “Wide,” in 1990 maturingin 1995 are ignored, the basic trendhas been for the IBJ issue balance torise. In the previous year, the balanceof bank debentures outstanding fellby ¥373.0 billion on account of theMinistry of Finance (MOF)’s TrustFund Bureau (TFB) reducing its ex-posure. However, the Bank has hada history of nearly 100 years of issu-ing bank debentures and has verystrong distribution channels. Thus,despite the adverse environmentduring the previous fiscal year, IBJ’sbalance of five-year bank debenturesrose by ¥590.0 billion, and the num-ber of active customer accountsincreased.
The ordinarily licensed bankshave exploited their large branchnetworks to gather deposits andused this deposit base for fundingtheir operations. The Bank and otherspecial-purpose banks have a limitednetwork of branches, and, hence, theprivilege of issuing bank debenturesis an important source of funds.However, for those banks not accus-tomed to the process of issuingbonds, there should be little enthusi-asm for straight bond issues onaccount of the various entry barriersto such a novel funding route. Bondissues are therefore likely to be onlya supplementary form of funding.The issue amounts are likely to belimited and the issue timetable irreg-ular. Given the structural weaknessof the domestic straight bond mar-ket, there is unlikely to be muchinvestor enthusiasm for the product.The impact on the Bank’s issue pro-gram is therefore expected to beextremely limited.
With regard to five-year JGBs, thereis as yet no clear outline available, asthe matter is still under discussionand debate within the governmentand in the Diet. However, there arealready four- and six-year JGBs outin the market, and these have nothad any appreciable impact on theIBJ bank debenture market. The five-year JGB is again likely to attract avery different type of investor onaccount of its different terms.Accordingly, if the Bank continuesto issue bank debentures with dueconcern for market conditions, thereshould be little negative impact onfunding.
It is thought probable that ordinarily licensed banks will be permitted to issue straight bondsand that five-year Japanese governmental bonds (“JGBs”) will also be issued. What is going tobe the impact on the Bank and its reliance on funding by the issue of five-year bank debentures?[ ]<Funding reliance on
bank debentures
=� Trends in IBJ’s Five-YearDebenture Issues(¥ billion)
0
2,000
4,000
6,000
8,000
10,000
12,000
3/999/983/989/973/979/963/96
Sold to TFB of MOF
Sold to others
� Number of Regular InstitutionalInvestor Purchasers of the Bank’s Five-Year Debentures(Number of purchasers)
3/96 3/97 3/98 3/990
100
200
300
400
500
600
700

14
As of March 31, 1999, on anIBJ-only basis, Loans under
Special Risk Review amounted to¥1,844.1 billion—namely, Bank-ruptcy Loans were ¥45.2 billion,Nonaccrual Loans were ¥1,236.0 bil-lion, Accruing Loans Past Due 3Months or More were ¥8.4 billion,and Restructured Loans were ¥554.4billion. As of March 31, 1999, on anIBJ-only basis, Claims Subject to theFinancial Reconstruction Law (FRL)Disclosure Requirements were ¥1,872.3billion—namely, Claims underBankruptcy or Virtual Bankruptcywere ¥111.6 billion, Claims underHigh Risk were ¥1,197.7 billion, andClaims under Close Observationwere ¥562.9 billion. The main reasonfor the increase in Nonaccrual Loansis the change in the nonaccrual stan-dard. Accruing Loans Past Due 3Months or More, Restructured Loans,and Claims under Close Observationare not necessarily irrecoverable.Therefore, the two totals, Loansunder Special Risk Review andClaims Subject to FRL DisclosureRequirements, should not be viewedas measures of the non-performingloan position. (See pages 52~57.)
In fiscal 1998, IBJ took decisive measuresto substantially improve the soundnessof its asset portfolio, adopting measuresto deal with ¥857.8 billion in non-per-forming loans (¥924.3 billion, if additionsto the General Reserve for Possible LoanLosses are included), the highest level ofcredit losses in the Bank’s history.
As of March 31, 1999, the CoverageRatios* for Claims Subject to FRL Disclo-sure Requirements were 100% for Claimsunder Bankruptcy or Virtual Bankruptcy,83.8% for Claims under High Risk, and52.7% for Claims under Close Observation.Management believes that these levelsof write-offs and provisioning are fullyadequate. The possibility of a furtherincrease in the level of credit lossesshould be quite limited, as the Bank
has also introduced stricter credit riskcontrol procedures.
* Coverage Ratio = (Collateral + Third Parties’Guarantees + Reserves for Possible LoanLosses)/Claims
The loan forgiveness made by a bankto a customer is, in principle, impermissi-ble. However, there may be some excep-tions where the social consequences ofrigidly applying the principle may resultin excessive disruption and damage tothe overall economy.
For example, there may be exceptionalcases where a company’s technology,production capacity, or marketing net-work are recognized as a general socialgood. Other cases are where the bank-ruptcy of a company could lead to aseries of bankruptcies of subcontractors,
Management Rationale and Strategy at IBJ
Man
agem
ent
Rat
ion
ale
and
Str
ateg
y at
IBJ
What is IBJ’s exposure to non-performing loans? In what case does IBJ make loan forgiveness to a customer?[ ]<Non-performing loans
=
� Loan Losses(¥ billion)
For the years ended March 31 1996 1997 1998 1999 Total
Write-offs, Specific Provisioning and Bulk Sale, etc. (net) 856.0 261.2 633.8 857.8 2,608.9General Provisioning (net) 0.4 21.1 14.0 66.5 102.1
Total 856.4 282.3 647.8 924.3 2,711.1
� Loans under Special Risk Review(¥ billion)
At March 31 1998 1999 Change
Bankruptcy Loans 64.2 45.2 (19.0)Nonaccrual Loans 209.5 1,236.0 1,026.4Accruing Loans Past Due 3 Months or More 14.5 8.4 (6.0)Restructured Loans 820.6 554.4 (266.2)
Total 1,109.0 1,844.1 735.1
Notes: 1. Bankruptcy Loans and Nonaccrual Loans are net of uncollectable portion.2. The deducted amounts of Bankruptcy Loans at March 31, 1999 and 1998, were ¥100.9 billion and
¥235.4 billion, respectively.3. The deducted amounts of Nonaccrual Loans at March 31, 1999 and 1998, were ¥146.2 billion and
¥225.0 billion, respectively.
� Claims Subject to FRL Disclosure Requirements(¥ billion)
At March 31 1999 Coverage Ratio Reserve Ratio
Claims under Bankruptcy or Virtual Bankruptcy 111.6 100.0% 100.0%Claims under High Risk 1,197.7 83.8% 77.1%Claims under Close Observation 562.9 52.7% 15.0%
Total 1,872.3 75.4% 60.7%
Notes: 1. Claims under Bankruptcy or Virtual Bankruptcy are net of uncollectable portion.2. The deducted amounts at March 31, 1999, are ¥272.4 billion.

15
Management Rationale and Strategy at IBJ
Man
agem
ent R
ation
ale an
d Strateg
y at IBJ
IBJ’s exposure on a consolidatedbasis at the end of March 1999
was ¥778.3 billion to Asia, ¥102.4billion to Latin America, and ¥8.7billion to Russia and EasternEurope.
On a Financial ReconstructionLaw Disclosure Requirements basis,disclosed problem loans to Asiaamounted to ¥83.1 billion. Suchloans to Latin America were only¥0.1 billion, and those to Russia andEastern Europe were ¥3.2 billion.
The outlook of the markets remainsuncertain, and the Bank will contin-ue to review the situation carefully.With continuing cooperation withinternational financial institutionsand with the expectation of a promptreturn to a vital economy as soon aspossible, the Bank intends to playa responsible role.
Please explain IBJ’s lending exposure to emerging markets.[ ]<Emerging marketexposure
=
� Balance of Exposure to Emerging Markets (Consolidated basis as of March 31, 1999)(¥ billion)
TheThailand China Hong Kong Korea Indonesia Singapore Malaysia Philippines Sub-total Taiwan India Others Total
Japanese Borrowers 56.7 45.3 39.0 0.0 18.9 44.4 7.7 0.0 212.2 0.0 0.0 0.0 212.2(IBJ only) (47.3) (34.5) (35.5) (0.0) (16.1) (35.8) (6.1) (0.0) (175.6) (0.0) (0.0) (0.0) (175.6)
Non-JapaneseBorrowers 109.2 93.4 91.8 94.3 63.1 21.8 36.4 4.5 514.8 25.1 24.3 1.6 566.1
(IBJ only) (97.6) (85.3) (88.7) (94.2) (37.8) (19.0) (32.7) (4.5) (460.2) (21.9) (23.6) (1.6) (507.5)
Total 165.9 138.7 130.9 94.3 82.0 66.3 44.1 4.5 727.1 25.1 24.3 1.6 778.3(IBJ only) (145.0) (119.9) (124.2) (94.2) (54.0) (54.8) (38.9) (4.5) (635.9) (21.9) (23.6) (1.6) (683.1)
Chile Colombia Mexico Brazil Other Total Russia Others Total
Japanese Borrowers 0.0 0.0 0.0 0.0 0.3 0.3 0.0 0.0 0.0(IBJ only) (0.0) (0.0) (0.0) (0.0) (0.3) (0.3) (0.0) (0.0) (0.0)Non-Japanese Borrowers 29.2 24.9 22.4 7.2 18.2 102.1 1.3 7.4 8.7(IBJ only) (28.2) (23.7) (21.2) (7.2) (15.4) (95.8) (1.3) (3.4) (4.8)
Total 29.2 24.9 22.4 7.2 18.5 102.4 1.3 7.4 8.7(IBJ only) (28.2) (23.7) (21.2) (7.2) (15.7) (96.1) (1.3) (3.4) (4.8)
Notes: 1. Exposure includes loans as well as acceptances and guarantees. Conversions to yen were made at the rate of ¥120.55 per U.S. dollar (interbank rate inTokyo at March 31, 1999).
2. Japanese borrowers are companies in Asia that are 50% or more owned by Japanese companies (excluding companies for which the Bank has obtainedguarantees from the parent company).
an increase in unemployment, and severeeconomic impact for a particular region-al economy.
If such a company develops a restruc-turing plan and the senior managementtakes responsibility, then it may be rea-sonable for banks to assist the companythrough the restructuring process.
In such cases, for the banks to insiston the repayment of the loan may beunreasonable, as it would only force anotherwise sound business into unneces-sary bankruptcy and it would be to noone’s advantage. Forgiveness may evenbe a means for reducing the bad loanexposure of the Bank in the long run.
The senior management of IBJ consid-ers the situation carefully and agrees toforgiveness if it is more appropriate andresults in greater overall benefits for IBJ.

16
Management Rationale and Strategy at IBJ
Man
agem
ent
Rat
ion
ale
and
Str
ateg
y at
IBJ
IBJ regards the Year 2000 (Y2K)Problem as a very serious
management issue and a top priorityfor the Group. The managing direc-tor responsible for the InformationTechnology Department and themanaging director responsible forthe Corporate Planning Departmenthead up the Year 2000 Committeethat includes the heads of all 14affected departments. The committeeis in charge of dealing with the prob-lem and reporting the progress madein resolving the various issues to theBoard.
The possibility of failure of IT sys-tems has been thoroughly investigat-ed, with programs checked andrewritten and tested on a compre-hensive basis. There is also a backupcrisis control plan in the unlikelyevent of IT failure.
By March 1999, most core systemsrelated to business operations wereY2K compliant, and, by the end ofJune 1999, all systems, facilities, andenvironmental equipment were com-pliant. For external systems connect-ed to the IBJ Group’s IT systems, there
has been a series of financial indus-trywide tests involving the Bank ofJapan network and the Zengin (theJapan Bankers’ Federation) system.
As systems are certified Y2K com-pliant, their configurations are tight-ly managed, and further alterationsare restricted in the interest of main-taining compliance until March 2000.
In the area of customer Y2K readi-ness, the Bank is tracking its counter-party risk by considering a numberof factors: the commitment of thesenior management to the problem,the extent of the response to theproblem, the progress made inensuring compliance, and theprogress made in preparing a crisismanagement program.
The Bank had prepared a crisismanagement program, the Contin-gency Plan, by the end of June 1999to deal with the possibility that thesocial infrastructure necessary forthe Bank’s operations may fail, forexample, electricity, gas, telecom-munications, water supply, trans-portation systems, and financialsettlement infrastructure, and thatthere may be associated credit risk,
liquidity risk, legal risk, reputationrisk, and other types of risk. Measuresto reduce risk in advance, measuresto ensure the normal functioning ofthe Bank despite possible systemfailures, and a command centerstrategy have been determined, anda staff training program has beenput in place, which commencedin July.
The total cost of dealing with theY2K Problem has been estimated at¥12.1 billion, including all ancillarycharges and costs.
The Y2K Problem is under theconstant surveillance of the internalaudit team, which receives updatesof the implicit legal risk from thelegal section.
For all account holders withthe Bank, pamphlets have beenprepared to answer concernsand questions, and these havebeen distributed to all branchesfor availability.
For those readers of this annualreport interested in the details con-cerning this problem, the IBJ Website at www.ibjbank.co.jp should bevisited for the latest information.
What measures are being taken to deal with the Year 2000 Problem?[ ]<Year 2000 problem
=

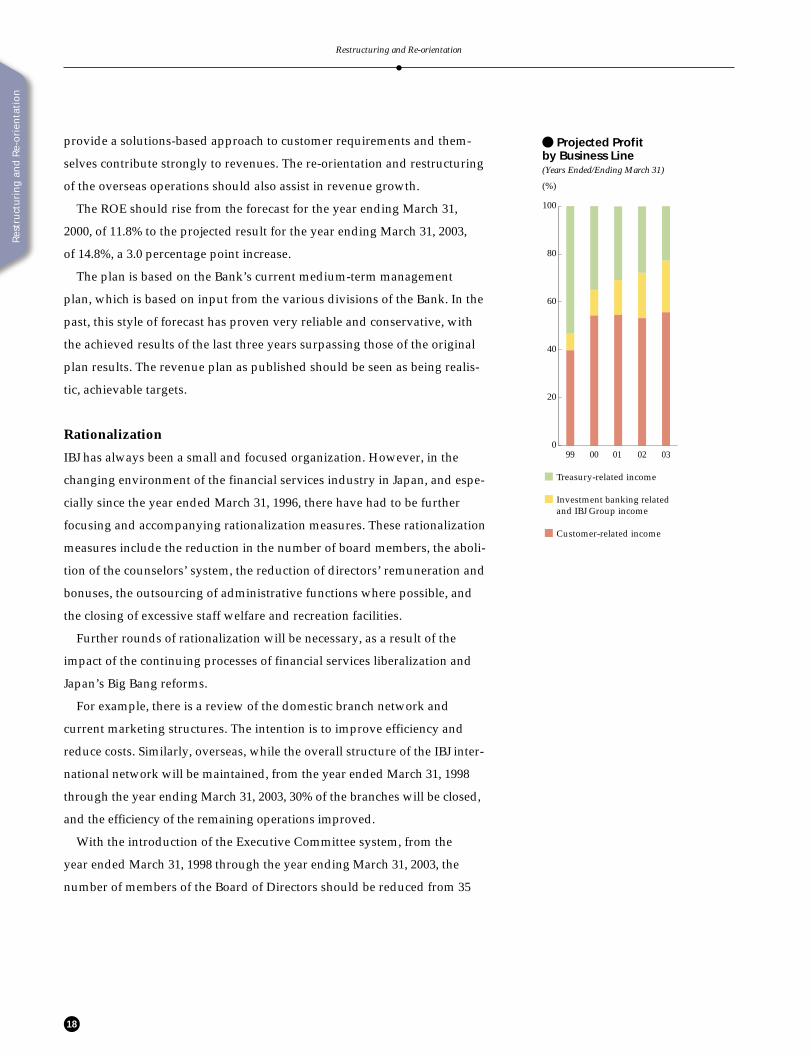
� Profit by Business Line(¥ billion)
For the years ended March 31, 1997 March 31, 1998 March 31, 1999 March 31, 2000 March 31, 2001 March 31, 2002 March 31, 2003(Actual) (Actual) (Actual) (Projected) (Projected) (Projected) (Projected)
Domestic Business 222.4 239.5 250.6 182.2 195.8 210.0 215.8
Customer-related 122.1 155.0 140.8 126.3 140.9 151.8 161.1
Treasury-related 100.3 84.5 109.8 55.9 54.9 58.2 54.7
International Business 22.8 26.7 65.6 31.0 34.2 36.8 33.1
Customer-related 8.8 4.3 (5.6) 3.4 6.1 10.2 15.4
Treasury-related 14.0 22.4 71.2 27.6 28.1 26.6 17.7
Investment Banking Related Business (Note 1) — 2.5 2.2 5.8 8.3 14.5 21.6
Capital Cost of Group Companies (Note 2) (7.3) (8.5) (6.3) (9.0) (8.2) (8.6) (6.9)
Headquarters (Note 3) (29.4) (38.2) (43.7) (46.9) (45.4) (45.8) (45.2)
Virtual Core Business Profit (Note 4) 225.8 244.7 278.6 162.8 184.4 206.8 215.5
IBJ Group Companies 13.5 1.1 21.2 19.7 30.8 43.2 46.5
Including IBJ Securities 2.9 3.2 9.8 5.1 8.7 11.7 14.3
Group Income 239.3 245.8 299.8 182.5 215.2 250.0 262.0
Group ROE 18.3% 19.6% 22.3% 11.8% 13.4% 14.9% 14.8%
Notes: 1. Non-interest income from investment banking business (structured finance, M&A, and project finance)2. Amount of the parent bank’s capital cost in securities-related subsidiaries and other companies3. Overhead costs of the general administration headquarters, expenses related to seconding personnel, welfare, and other expenses4. The difference between the total profit and loss by business line is the other adjustment item.
17
Preparing for Heightened Competition in the Post-Big Bang Era
RESTRUCTURING AND RE-ORIENTATION
Restru
cturin
g an
d R
e-orien
tation
Revenue Plan
In March 1999, the Bank published the Plan to Revitalize Management in
connection with the application for the injection of public funds. This plan
has core business profit rising from the forecast result of ¥162.8 billion for
the year ending March 31, 2000, on a non-consolidated basis to ¥215.5 bil-
lion for the year ending March 31, 2003, with the new subsidiaries’ contri-
bution at that point being approximately ¥45.0 billion, making the total in
excess of ¥260.0 billion.
The basis of these revenue projections is the strength of the commercial
banking, investment banking, and securities and asset management busi-
nesses as well as the new and growing emphasis on asset-liability manage-
ment (ALM) in the area of exposure to market risks at the parent company
in treasury plus the growing strength of subsidiary operations.
Within commercial banking, it is imperative to assess risk correctly and
ensure that the loan book quality is raised. Investment banking and securi-
ties and asset management businesses are important strategic areas of
emphasis for management and should see higher revenues as increased
resources are applied. Market risk control using ALM techniques should
lead to greater stability in revenues from treasury operations. Strategic sub-
sidiaries, such as IBJ-DL Financial Technology Co., Ltd. (IBJ-DL FT), and IBJ
Nomura Financial Products Co., Ltd. (INFP), are active in financial engi-
neering development, and their new and sophisticated techniques should
18
provide a solutions-based approach to customer requirements and them-
selves contribute strongly to revenues. The re-orientation and restructuring
of the overseas operations should also assist in revenue growth.
The ROE should rise from the forecast for the year ending March 31,
2000, of 11.8% to the projected result for the year ending March 31, 2003,
of 14.8%, a 3.0 percentage point increase.
The plan is based on the Bank’s current medium-term management
plan, which is based on input from the various divisions of the Bank. In the
past, this style of forecast has proven very reliable and conservative, with
the achieved results of the last three years surpassing those of the original
plan results. The revenue plan as published should be seen as being realis-
tic, achievable targets.
Rationalization
IBJ has always been a small and focused organization. However, in the
changing environment of the financial services industry in Japan, and espe-
cially since the year ended March 31, 1996, there have had to be further
focusing and accompanying rationalization measures. These rationalization
measures include the reduction in the number of board members, the aboli-
tion of the counselors’ system, the reduction of directors’ remuneration and
bonuses, the outsourcing of administrative functions where possible, and
the closing of excessive staff welfare and recreation facilities.
Further rounds of rationalization will be necessary, as a result of the
impact of the continuing processes of financial services liberalization and
Japan’s Big Bang reforms.
For example, there is a review of the domestic branch network and
current marketing structures. The intention is to improve efficiency and
reduce costs. Similarly, overseas, while the overall structure of the IBJ inter-
national network will be maintained, from the year ended March 31, 1998
through the year ending March 31, 2003, 30% of the branches will be closed,
and the efficiency of the remaining operations improved.
With the introduction of the Executive Committee system, from the
year ended March 31, 1998 through the year ending March 31, 2003, the
number of members of the Board of Directors should be reduced from 35
Restructuring and Re-orientation
Res
tru
ctu
rin
g a
nd
Re-
ori
enta
tio
n
0
20
40
60
80
100
0302010099
Treasury-related income
Investment banking related and IBJ Group income
Customer-related income
� Projected Profitby Business Line (Years Ended/Ending March 31)
(%)
19
Restructuring and Re-orientation
Restru
cturin
g an
d R
e-orien
tation
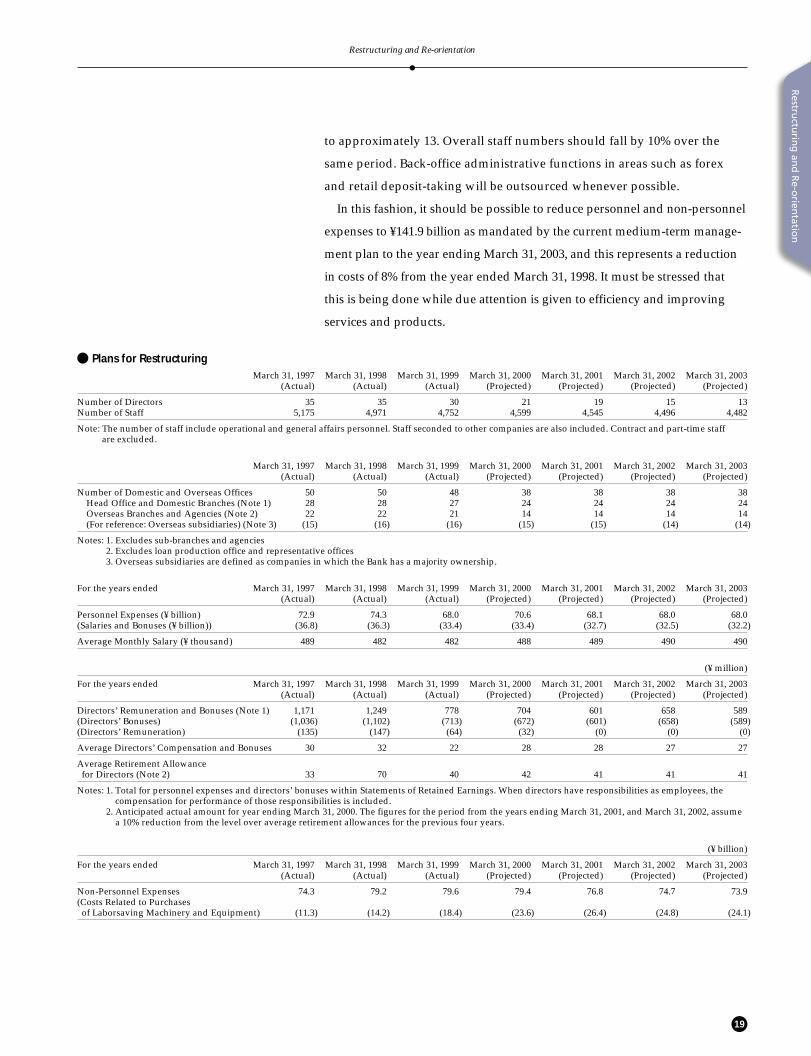
to approximately 13. Overall staff numbers should fall by 10% over the
same period. Back-office administrative functions in areas such as forex
and retail deposit-taking will be outsourced whenever possible.
In this fashion, it should be possible to reduce personnel and non-personnel
expenses to ¥141.9 billion as mandated by the current medium-term manage-
ment plan to the year ending March 31, 2003, and this represents a reduction
in costs of 8% from the year ended March 31, 1998. It must be stressed that
this is being done while due attention is given to efficiency and improving
services and products.
� Plans for RestructuringMarch 31, 1997 March 31, 1998 March 31, 1999 March 31, 2000 March 31, 2001 March 31, 2002 March 31, 2003
(Actual) (Actual) (Actual) (Projected) (Projected) (Projected) (Projected)
Number of Directors 35 35 30 21 19 15 13Number of Staff 5,175 4,971 4,752 4,599 4,545 4,496 4,482
Note: The number of staff include operational and general affairs personnel. Staff seconded to other companies are also included. Contract and part-time staffare excluded.
March 31, 1997 March 31, 1998 March 31, 1999 March 31, 2000 March 31, 2001 March 31, 2002 March 31, 2003(Actual) (Actual) (Actual) (Projected) (Projected) (Projected) (Projected)
Number of Domestic and Overseas Offices 50 50 48 38 38 38 38Head Office and Domestic Branches (Note 1) 28 28 27 24 24 24 24Overseas Branches and Agencies (Note 2) 22 22 21 14 14 14 14(For reference: Overseas subsidiaries) (Note 3) (15) (16) (16) (15) (15) (14) (14)
Notes: 1. Excludes sub-branches and agencies2. Excludes loan production office and representative offices3. Overseas subsidiaries are defined as companies in which the Bank has a majority ownership.
For the years ended March 31, 1997 March 31, 1998 March 31, 1999 March 31, 2000 March 31, 2001 March 31, 2002 March 31, 2003(Actual) (Actual) (Actual) (Projected) (Projected) (Projected) (Projected)
Personnel Expenses (¥ billion) 72.9 74.3 68.0 70.6 68.1 68.0 68.0(Salaries and Bonuses (¥ billion)) (36.8) (36.3) (33.4) (33.4) (32.7) (32.5) (32.2)
Average Monthly Salary (¥ thousand) 489 482 482 488 489 490 490
(¥ million)
For the years ended March 31, 1997 March 31, 1998 March 31, 1999 March 31, 2000 March 31, 2001 March 31, 2002 March 31, 2003(Actual) (Actual) (Actual) (Projected) (Projected) (Projected) (Projected)
Directors’ Remuneration and Bonuses (Note 1) 1,171 1,249 778 704 601 658 589(Directors’ Bonuses) (1,036) (1,102) (713) (672) (601) (658) (589)(Directors’ Remuneration) (135) (147) (64) (32) (0) (0) (0)
Average Directors’ Compensation and Bonuses 30 32 22 28 28 27 27
Average Retirement Allowancefor Directors (Note 2) 33 70 40 42 41 41 41
Notes: 1. Total for personnel expenses and directors’ bonuses within Statements of Retained Earnings. When directors have responsibilities as employees, thecompensation for performance of those responsibilities is included.
2. Anticipated actual amount for year ending March 31, 2000. The figures for the period from the years ending March 31, 2001, and March 31, 2002, assumea 10% reduction from the level over average retirement allowances for the previous four years.
(¥ billion)
For the years ended March 31, 1997 March 31, 1998 March 31, 1999 March 31, 2000 March 31, 2001 March 31, 2002 March 31, 2003(Actual) (Actual) (Actual) (Projected) (Projected) (Projected) (Projected)
Non-Personnel Expenses 74.3 79.2 79.6 79.4 76.8 74.7 73.9(Costs Related to Purchasesof Laborsaving Machinery and Equipment) (11.3) (14.2) (18.4) (23.6) (26.4) (24.8) (24.1)
20
Personnel policy
To prepare for the impact of Japan’s financial liberalization, Japan’s Big
Bang, and for the increased competition between financial institutions, both
domestic and foreign, and to attain the objectives of long-term manage-
ment, IBJ has made major changes in personnel policy since the second half
of 1997. First, IBJ is placing greater emphasis on the suitability of the indi-
vidual for a job; second, the Bank is securing a wider variety of personnel
and educating and training them more systematically; and, third, the per-
sonnel system has been designed to draw the best from each staff member.
Changes in the personnel system have been made in many areas, and
important examples are given below. For example, the prior emphasis on
an undifferentiated style of internal training for professional entry staff in
their early years in the Bank and on-the-job rotation has been changed. The
rapid advance in the specialization in financial techniques and the increas-
ing sophistication of the financial services industry have meant that
changes have to be made in the overall pattern of early training.
Professional-entry staff are given one year in the corporate banking sec-
tions in the Head Office and domestic branches to orient themselves to the
environment of general corporate finance, and then they spend the next
five years in two departments, one market-related and one special-skills-
related, such as investment banking, securities, or research. The previous
system of initial training, which was spread over three years, has been
reduced to a concentrated one year. This is to ensure that the necessary
know-how is assimilated at the earliest possible opportunity. Then, in the
seventh year of employment, the staff member is assigned an appropriate
responsibility that is of a more-extended duration than previously.
To facilitate the growth of greater specialization, two new career paths
have been made available since July 1998. The first new path is the
“Professional Staff S Course,” a specialist course for full-time contract
employees, which has been set up for those professional staff who wish
to pursue a career on the basis of specialization and performance-based
bonuses. The second new path is the “Specialist Course,” a specialist
course for short-term contract employees that has been set up for those
professionals in the market who wish to join the Bank on a strictly market-
based salary or for those existing full-time contract employees who wish
to move over to a strictly market value remuneration system as short-term
contract employees.
Restructuring and Re-orientation
Res
tru
ctu
rin
g a
nd
Re-
ori
enta
tio
n
21
Restructuring and Re-orientation
Restru
cturin
g an
d R
e-orien
tation
These are practicable steps in providing flexibility to the previous remu-
neration system based on the number of years of service as part of the
Japanese “lifetime employment” system and in moving toward individual
career paths as well as placing greater emphasis on performance-related
remuneration. However, to restrain overall personnel costs, at the same
time, the old system of salary increases determined by the number of years
of service has been largely replaced in favor of higher emphasis placed on
capability and responsibility. The system of salary based on the responsibil-
ity of the position assigned was introduced for managers and above. The
general managers of departments and branches now have authority to deter-
mine the performance element of bonuses paid to their subordinates. Those
staff members on both the Professional Staff S Course and the Specialist
Course are subject to a system of internal evaluation from those staff mem-
bers that they serve, irrespective of departmental location. This is to ensure
that there is also continuing teamwork within the shift to specialization.
Individual career paths are being made possible by a system of internal
consultation and guidance by one-on-one interviews with Personnel
Department staff at the stages of 6 years, 12 years, and 20 years of employ-
ment at the Bank. These changes in the personnel practices of the Bank are
in line with the intentions of the current medium-term management plan
to achieve maximum capabilities within an overall personnel budget. Also,
it is particularly important to ensure that there is adequate synergy between
the various strategic subsidiaries and the other member companies of the
IBJ Group.

22
Strategic alliances
Given the foreseen demands of the post-Big Bang environment, it is neces-
sary for the IBJ Group not just to rely on its own in-house capabilities, but
also to bring in capabilities from outside. In connection with this, the
alliances with Nomura Securities Co., Ltd. (Nomura) and Dai-ichi Mutual
Life Insurance Company (Dai-ichi) are described in some detail as follows.
In May 1998, IBJ and Nomura agreed to set up several joint venture com-
panies in promising growth areas, including derivatives and asset manage-
ment related business. These are areas where competition is particularly
intense and involve not only domestic but also foreign institutions. It was
judged most appropriate to combine the strengths of the two partners in
these several joint ventures in the interests of providing customers with
the optimum services.
First, in derivatives, IBJ Nomura Financial Products plc (INFP) has been
incorporated, and it has already started to provide customers with novel
financial products. Second, in asset management related business, three
new companies have been formed: Nomura-IBJ Investment Services Co.,
Ltd. (NIIS), Japan Investor Solutions & Technologies Co., Ltd. (JIS&T), and
Nomura IBJ Global Investment Advisors, Inc. (NI-GIA).
NIIS offers consulting advice and its affiliate JIS&T offers record-keeping
services for Japanese-style 401(k) defined contribution pension schemes
that will shortly be introduced. A successful campaign is under way to
invite other foreign and domestic financial institutions to equity participa-
tion in JIS&T to enjoy further economies of scale. NI-GIA engages in funds
evaluation to structure funds of funds and to offer asset management
advisory services.
In regard to the alliance with Dai-ichi, an agreement was made in
October 1998 to cooperate on a comprehensive basis. The nature of this
agreement reflects the complementarity of the two organizations: IBJ,
strong in the wholesaling of financial products and services to corporate
customers, and Dai-ichi, strong in the retailing of insurance and pension
products to individuals. This complementarity means that both companies’
management resources and capabilities will be efficiently exploited, and
customers will receive a value-added integrated service. There are many
examples of immediate application of the complementarity: IBJ will be
Restructuring and Re-orientation
Res
tru
ctu
rin
g a
nd
Re-
ori
enta
tio
n
Joint press conference with the Dai-ichiMutual Life Insurance Company (Right, Tomijiro Morita, President,The Dai-ichi Mutual Life InsuranceCompany; Left, Masao Nishimura,President & CEO, IBJ)
Joint press conference with the NomuraSecurities Co., Ltd.(Right, Junichi Ujiie, President & CEO,The Nomura Securities Co., Ltd.; Left,Masao Nishimura, President & CEO, IBJ)

23
Restructuring and Re-orientation
� R&D Organization of IBJ-DLFinancial TechnologyName of department
Area of responsibility
Financial Technology Department No. 1Financial technologies related to cred-it, market risk management, and cred-it derivatives
Financial Technology Department No. 2Technologies for interest rate deriva-tives and related analysis, computa-tion, and systems technologydevelopment
Financial Technology Department No. 3Technologies for currency, commodi-ty, equity, and climate and earthquakerisks derivatives
Investment Technology DepartmentInvestment technologies for stocksand bonds
Financial and Actuarial R&D DepartmentTechnologies related to pensions andinsurance as well as investment man-agement
Emerging Financial Technology DepartmentTechnologies related to structuredfinance and information
President’s OfficeGlobal-warming issues (includingemission rights transactions), educa-tional software for financial technolo-gy, and other matters
Restru
cturin
g an
d R
e-orien
tation
able to apply its securitization know-how to the Dai-ichi portfolio of office
buildings, and the two alliance partners have experience in the cross-selling
of each other’s investment trust products, quite apart from the existing history
of the two companies having already cooperated in syndicated loans work.
Another important agreement with Dai-ichi covers IBJ’s originally 100%-
owned strategic subsidiary IBJ Financial Technology Co., Ltd., incorporated
in April 1998. In April 1999, the subsidiary became a joint venture with
Dai-ichi, and the name was changed to IBJ-DL Financial Technology Co.,
Ltd. The joint venture acts as the core of the whole Group R&D of applied
technology in the fields of derivatives, risk management, and investment
technology.
In October 1999, it is planned to merge the asset management operations
of IBJ NW Asset Management, IBJ Investment Trust Management, and Dai-
ichi Life Asset Management into DLIBJ Asset Management Co., Ltd.
IBJ intends to pursue a similar course with other leading financial
institutions, both at home and abroad, to build a leading financial
products group.
IBJ GroupNomura Securities
Global financial products
Asset management and advisory
Asset administration
Supplementing each other’s products and services
Co-financing operations
Development of real estate securitization products
Integration of asset management companies
Development of new products and technologies in the finance, insurance, andfund management fields
Areas of Cooperation
Areas of Cooperation
Dai-ichi Mutual Life
Insurance
� Strategic Alliances

24
Risk
IBJ faces a variety of risks in its business: credit risk, market risk, liquidity
risk, operational risk, systems risk, legal risk, and other risks, and with the
growth of financial engineering techniques, the importance of risk control
and compliance systems is growing rapidly.
To have integrated control of risk, the various forms of risk have to be
reduced to one single measure. In June 1999, the Risk Management De-
partment was established to cover credit, market, and liquidity risk com-
prehensively as well as plans to employ a quantitative methodology for
determining credit and market risk.
� Integrated Risk Management Structure
ExecutiveCommittee
Board of Directors
Risk management policiesRisk-taking capability
Evaluation of risk and return
Establishmentof risk limits
Financial ControlCommittee
Credit Committee
Credit RiskManagementDepartment
RiskManagementDepartment
Creditrisk
Marketrisk
ALM Committee
Business Units
Preparation ofbusiness plans
RISK CONTROL AND COMPLIANCE ISSUES
Controlling Risk and Ensuring Compliance
Ris
k C
on
tro
l an
d C
om
plia
nce
Issu
es

Credit risk
Credit risk is the risk that the credit extended will not be recovered and
that the Bank will sustain a loss. It is necessary to control the extent and the
size of the exposure to credit risk; otherwise, the assets of the Bank cannot
be secured, an adequate return on the assets cannot be achieved, and the
fiduciary duty to the shareholders cannot be performed.
The credit evaluation process of the Bank involves not only an analysis
of the financial standing of the borrower but also a full understanding of
the underlying business and of the industry prospects. Such an impartial
evaluation process gives the Bank a clear view of the situation of the pro-
spective borrower. It is therefore possible to make informed credit decisions
and to assist the customer with appropriate advice.
In concrete terms, the Credit Risk Management Department has been
established independent of the Corporate Banking Unit and is responsible
for credit risk control of the Bank on a fully integrated basis. The responsi-
bility is the investigation and evaluation of specific risks and research into
improved systems of credit control. Whether originating in Japan or over-
seas, all proposals, borrowers, internal credit rating procedures, internal
loan audit functions, credit approval guidelines and policy, and loan port-
folio management are supervised by the department.
In particular, the internal credit rating system gives a clear indication of
the creditworthiness of the borrower on an objective quantitative basis as
well as qualitative basis using a 10-point scale. This is used not only to
decide the initial level of the credit risk acceptable but also to continuously
monitor the credit risk, particularly during the self-assessment process, and
to measure the quantitative level of the credit risk.
Risk C
on
trol an
d C
om
plian
ce Issues
25
Risk Control and Compliance Issues

In the process of marketing corporate banking services, loan applications
are received and the first-stage credit evaluation is made. The proposed
terms are agreed to at the working level, and this is part of the application
for approval from the Credit Risk Management Department. The depart-
ment reviews the application, conducts the second-stage credit evaluation,
and gives or withholds approval for the loan to be made. There is then a
process of regular review of the loan portfolio at the working level and at
the Credit Risk Management Department level. The Credit Examination
Department is responsible for monitoring the process in a third-stage check
function.
In addition to the above process, the Risk Management Department
quantifies and monitors the level of credit risk borne by the Bank as a
whole periodically to check the aggregated level of risk and the effect of
concentration of the portfolio.
Concerning credit risk quantification methodology, IBJ-DL Financial
Technology Co., Ltd., has provided a sophisticated methodology as pack-
aged software, Credit Scope, jointly developed with NTT DATA CORPO-
RATION. To date, over 60 banks have already adopted the software.
Ris
k C
on
tro
l an
d C
om
plia
nce
Issu
es
26
Risk Control and Compliance Issues
� Credit Risk Management Structure
CreditExaminationDepartment
Internal auditingof self-assessment
of asset quality
Risk ManagementDepartment
Quantificationof credit risk
Head Office and BranchesSelf-assessment of asset
quality (primary)
Board of Directors
ExecutiveCommittee
Credit RiskManagement Department
Analysis of loan applicationsAnalysis of companiesAssigning of internal credit ratingsSelf-assessment of asset quality (secondary)Credit portfolio supervision

Market risk
Market risk arises when fluctuations in interest rates, stock prices, foreign
exchange rates, and other market variables result in changes in the value
of financial assets and liabilities, including derivatives.
At all of the Bank’s offices that are engaged in
market transactions, in addition to the units
engaged in actual transactions (the front offices), independent units (the
middle offices) have been established to be in charge of measuring net
income and risk. In addition, the Risk Management Department in the
Bank’s Head Office is responsible for measuring the maximum expected
loss, or Value at Risk (VaR) for the Bank as a whole. This department is in
Market Risk
Management System
Risk C
on
trol an
d C
om
plian
ce Issues
27
Risk Control and Compliance Issues
� Market Risk Management Structure (As of June 1999) Board of Directors
Executive Committee
ALM Committee
Risk Management Department
Responsible for measurement of market risk of all the Bank’s offices, using an integrated stan-dard and analysis of risks as well as mak-ing suggestions to management. Also engaged in R&D re-lated to risk manage-ment techniques
TreasuryDepartmentALM for yenassets andliabilities
Derivatives andFixed IncomeDepartmentSales andtrading ofderivativesand tradingaccountsecurities
SecuritiesBusinessDepartmentInvestmentsin stocks
InternationalTreasuryDepartmentTokyo
LondonNew YorkSingapore
Sales andtrading inforeigncurrencies
OverseasBranches andSubsidiaries
Supervision and controlthrough monitoring of income and risk conditions
Risk Management DepartmentActs as middle office for the Treasury Department, Deriv-atives and Fixed Income Department, Securities Business Department, and International Treasury Department
Middle office for theabove offices
Supervision and controlthrough checks on individualtransactions
Market Business Operations Department, International Treasury Operations DepartmentBack office for overseas branches and subsidiaries

charge of analyzing risks borne by the Bank from a multiplicity of perspec-
tives and reporting the results to management. Besides monthly reports
presented at meetings of the Board of Directors, the Executive Committee,
and the ALM Committee, the department also prepares daily reports. At
the meetings of the Board of Directors, the Executive Committee, and the
ALM Committee, participants discuss the Bank’s risk positions and set
policies for risk-taking activities.
The Bank uses VaR as the unified measure
of risk for all its operations. In addition to
computing VaR, the Bank establishes limits on the extent of the impact of
market fluctuations as outlined in Table A and, through tests, monitors
and controls the level of risk.
The Bank’s risk management activities are based on an understanding of
the most advanced financial theories, and staff well versed in this area have
been assigned to risk management and are engaged in R&D related to risk
management techniques.
The principal methods for risk monitoring and control are shown in
Table A, but, in addition to these approaches, other methods are employed
that are suited to the nature of individual types of risk.
Value at Risk The market risk
exposure of the Bank’s trading
activities at its Head Office, branches, and consolidated subsidiaries (here-
after referred to as all trading offices) is measured by the VaR approach
utilizing the Bank’s internal model. VaR is defined as the maximum po-
tential loss of a portfolio with a given probability over a given period of
time. It is calculated based on parameters (volatility and correlation coeffi-
cients) that estimate the future movements in interest rates, foreign curren-
cy rates, and other risk factors based on the analysis of past data on market
fluctuations.
IBJ’s model employs simultaneously the variance-covariance method and
the Monte Carlo Simulation Method, and the model incorporates about 200
market data series, such as yen interest rates and yen-dollar exchange rates,
representing various risk factors.
Risk Measurement Methodology
and the Bank’s Risk Position
Methods for Managing
Market Risk
Ris
k C
on
tro
l an
d C
om
plia
nce
Issu
es
28
Risk Control and Compliance Issues
Table A� Methods Currently Used toMonitor Market Risk and SpecificContentVaR
Calculation of maximum losseswithin a specified probability limit (IBJuses 99%) due to future fluctuationsin interest rates, currency rates, andother indicators is made based onstatistical analysis of past data.
Stress TestsTo prepare for times when marketrates diverge substantially from statis-tical fluctuations assumed by VaRanalysis, computations of losses aremade assuming extreme market fluc-tuations (stress scenarios).
Interest Rate Sensitivity (Delta)Delta shows the amount that theBank’s portfolio would change invalue if interest rates should move bya certain percentage (usually one basispoint, or 0.01 percentage point). Upper position limits for each interest-related position are usually set fordetailed management.
GammaGamma is the change in delta for onlya one basis point change in interest rates. Upper limits are set when managingoption positions.
VegaVega indicates the change in value ofassets and liabilities when volatilitybrings a one percentage point change.Upper limits are set when managingoption positions. (Note: Volatility is the expected rate ofchange in market rates during a specifiedfuture period.)
Position Limits by Financial InstrumentAs there are differences in the volumeof financial instruments of specifiedtypes that can be purchased in themarket at one time, when necessary,limits are placed on positions in indi-vidual financial instruments.
Loss LimitsFor each position limit, the Bank setsupper limits on accumulated lossesthat can be sustained over a specifiedinterval.

When parameters are estimated based on past data on market move-
ments, greater weight is given to more recent data, and less emphasis is
placed on historical data to ensure that the parameters better reflect recent
market trends. (See graphs 1 and 2.)
Trends in VaR for all trading offices for the year ended March 31, 1999,
are shown in Graph 3 and Table B. (These estimates assume a holding
period of one day and a confidence level of 99%. When VaR at all trading
offices is computed, positions held by various offices are netted out.) Graph
4 shows the impact of individual risk factors on VaR as of March 31, 1999.
29
Risk Control and Compliance Issues
Risk C
on
trol an
d C
om
plian
ce Issues
102
104
106
108
110
112
114
116
118
120
122
0
0.5
1.0
1.5
2.0
2.5
3.0
U.S. dollar/yen exchange rate Volatility
� Graph 2: Image Simulation of Market Trends Accompanying Volatility
(¥) (%)
Fore
ign
exch
ange
rat
e
Vola
tility
0 5 5010 15 20 25 30 35 40 45
Days transpiring after delta
� Graph 1: Weight
Table B� Actual VaR for theYear Ended March 31, 1999
(¥ billion)
Daily average 3.20
Maximum on daily basis 6.10
Minimum on daily basis 1.45
Year-end 2.83
� Graph 3: Trends in VaR for All Trading Officesfor the Year Ended March 31, 1999(¥ billion)
0
1
2
3
4
5
6
7
4/98 5/98 6/98 7/98 8/98 9/98 10/98 11/98 12/98 1/99 2/99 3/99
� Graph 4: Composition of Risk Factors to VaR as of March 31, 1999
Equity-related1%
Foreigncurrency
related30%
Interestrate related69%
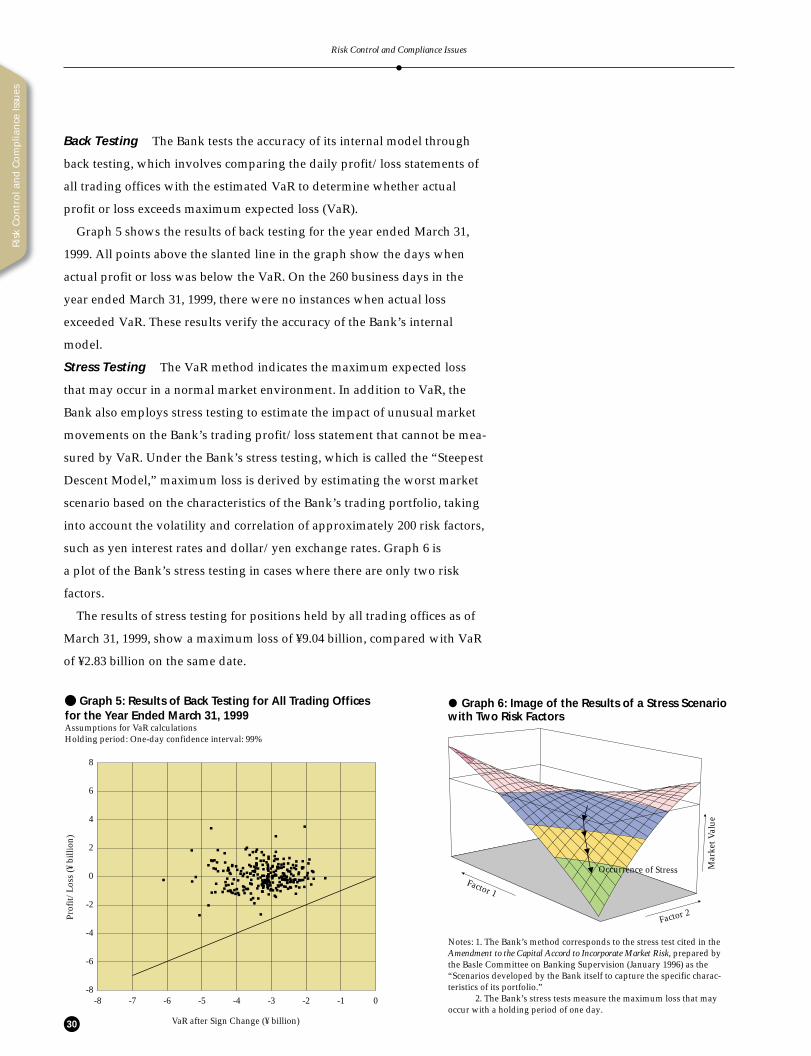
Back Testing The Bank tests the accuracy of its internal model through
back testing, which involves comparing the daily profit/loss statements of
all trading offices with the estimated VaR to determine whether actual
profit or loss exceeds maximum expected loss (VaR).
Graph 5 shows the results of back testing for the year ended March 31,
1999. All points above the slanted line in the graph show the days when
actual profit or loss was below the VaR. On the 260 business days in the
year ended March 31, 1999, there were no instances when actual loss
exceeded VaR. These results verify the accuracy of the Bank’s internal
model.
Stress Testing The VaR method indicates the maximum expected loss
that may occur in a normal market environment. In addition to VaR, the
Bank also employs stress testing to estimate the impact of unusual market
movements on the Bank’s trading profit/loss statement that cannot be mea-
sured by VaR. Under the Bank’s stress testing, which is called the “Steepest
Descent Model,” maximum loss is derived by estimating the worst market
scenario based on the characteristics of the Bank’s trading portfolio, taking
into account the volatility and correlation of approximately 200 risk factors,
such as yen interest rates and dollar/yen exchange rates. Graph 6 is
a plot of the Bank’s stress testing in cases where there are only two risk
factors.
The results of stress testing for positions held by all trading offices as of
March 31, 1999, show a maximum loss of ¥9.04 billion, compared with VaR
of ¥2.83 billion on the same date.
Risk Control and Compliance Issues
Ris
k C
on
tro
l an
d C
om
plia
nce
Issu
es
30
-8 -7 -6 -5 -4 -3 -2 0-1-8
-6
-4
-2
0
2
4
6
8
VaR after Sign Change (¥ billion)
� Graph 5: Results of Back Testing for All Trading Officesfor the Year Ended March 31, 1999Assumptions for VaR calculationsHolding period: One-day confidence interval: 99%
Prof
it/Lo
ss (¥
bill
ion)
� Graph 6: Image of the Results of a Stress Scenariowith Two Risk Factors
Notes: 1. The Bank’s method corresponds to the stress test cited in the Amendment to the Capital Accord to Incorporate Market Risk, prepared by the Basle Committee on Banking Supervision (January 1996) as the “Scenarios developed by the Bank itself to capture the specific charac-teristics of its portfolio.”
2. The Bank’s stress tests measure the maximum loss that may occur with a holding period of one day.
Factor 2
Factor 1
Mar
ket V
alue
Occurrence of Stress

31
Liquidity risk
Liquidity risk management is an important aspect of ALM that ensures that
sufficient cash flow is available at any time to meet the various financial
needs of IBJ’s customers. The Bank’s primary source of funding is coupon
and discount debentures, which are issued every month. The Bank’s strong
distribution network, based on close contact with various institutional
investors, provides the Bank with a competitive edge in managing its liq-
uidity. In addition, the Bank has wide access to various funding instru-
ments, investors, and money markets around the world. This ensures that
the Bank has alternative funding sources to maintain sufficient liquidity,
even if a liquidity crisis occurs in a specific market. The Bank continuously
attempts to maintain and expand the investor network for its debentures
and works to enhance its presence in the short-term money markets around
the world.
In managing liquidity, the Bank places limits on the amount of its
overnight money position (the necessary amount of overnight funding for
balance sheet equilibrium) as well as on the amount of positions in certain
financial instruments. The overnight money position is measured on a
daily basis by projecting the cash flow of current assets and liabilities and
that of anticipated future transactions. This limit is monitored on a global
basis by aggregating the cash position of both the Bank’s foreign offices
and subsidiaries, thus allowing the centralized assessment and control of
the Bank’s liquidity profile. Also, the Bank holds a certain amount of highly
marketable assets, such as government bonds that can be easily liquidated
when necessary. In addition to this conservative process as adopted in
normal market situations, various contingency plans exist to cope with
severe liquidity problems.
Risk Control and Compliance Issues
Risk C
on
trol an
d C
om
plian
ce Issues

Operational risk
Operational risk means the risk of loss caused by mistakes in the conduct
of businesses or by the occurrence of irregularities or similar incidents.
The Operations Supervisory Department is responsible for ensuring that
operating standards contained in the ‘Procedures Manual’ are properly estab-
lished and, consequently, operational risk is minimized. The Auditing
Department conducts an independent check approximately once a year
to ensure that the Procedures Manual is being correctly followed in all
operational areas.
In line with the increasing variety and complexity of banking transac-
tions, the Operations Supervisory Department is conducting the continual
revision and provision of the Procedures Manual and other related documents.
To foster improvement in the operational quality of the Bank, the Operations
Supervisory Department is also managing the proper observance of the
Procedures Manual, and promotes training and gives guidance to the staff.
Systems risk
Systems risk means the risk that damage and loss may be incurred by
the Bank due to a total failure of IT systems, by IT systems operating incor-
rectly, or by IT systems being accessed illegally and manipulated. The
Information Technology Department is responsible for systems risk. For
example, there is the danger of earthquake disruption of IT systems. Under
these circumstances, backup systems are relied upon and are located in
Osaka, some 500 kilometers from Tokyo. As for unauthorized access to the
system, there are a variety of control barriers in place to prevent such access.
Legal risk
Legal risk is either the risk of direct financial loss or indirect financial
loss, through disputed transactions with customers, outright illegalities by
the Bank, or the conclusion of inappropriate contractual agreements by the
Bank in the course of operational transactions or management decisions.
It is the responsibility of the Legal Department to control legal risk.
Both at home and overseas, this involves close cooperation with leading law
offices and legal specialists to ensure that, on a global basis, the legal posi-
tion of the Bank is not prejudiced. There is always a danger that operations
staff may regard legal affairs purely as the responsibility of the department.
To avoid this, all responsible staff are required to attend courses on legal
affairs so that, at all times, there is an acute awareness of the legal dimen-
sion of all operations involving the Bank.
Ris
k C
on
tro
l an
d C
om
plia
nce
Issu
es
32
Risk Control and Compliance Issues

33
The Legal Department controls legal risk by using its full understanding
of the various laws and regulations applicable to the Bank and by consider-
ing all possible legal risk that may develop in the management and opera-
tion of the Bank. In the globalization and increasing complexity of the Bank’s
business, it is also necessary to have the capability of avoiding court actions
and, if reluctantly entered into, the capability of dealing with the action
expeditiously and favorably in the Bank’s interests.
In all this, it is essential for the department to maintain a very close
working relationship with the operating departments and be able to
understand the essential legal issues involved in each case.
Internal control
To ensure compliance with internal accounting and procedural require-
ments and thereby prevent irregularities, the Bank’s Auditing Department
is responsible for the auditing of the Head Office and all the branches. With
the increasing scope and sophistication of the Bank’s operations, all operat-
ing units are subject to surprise audits approximately once a year. In partic-
ular, with the growing importance of IT systems, audits on IT operations
and IT system programs are conducted by a special IT team.
Recent revisions to the Banking Law have introduced the provisions for
“Prompt Corrective Action” when a bank is judged to have insufficient
capital adequacy, and the Credit Examination Department is responsible
for auditing and monitoring the loan portfolio.
In U.S. operations, the Americas Division works independently to ensure
that internal auditing standards are maintained, the loan portfolio is ade-
quately monitored, and local U.S. legal requirements are fully observed.
Compliance
Compliance issues are of great importance to senior management. Compli-
ance not only represents compliance with financial regulatory laws and
other laws but also compliance with generally accepted social values. The
management believes that this broader view of compliance is important,
given the Bank’s unique position as a leader of the Japanese financial
community.
From this perspective, it is necessary not only to accommodate the rapid-
ly changing regulatory framework surrounding banking in Japan but also
to accommodate the rapid change in social attitudes. To prevent breaches
of compliance, it is necessary for all staff to understand the importance of
Risk Control and Compliance Issues
Risk C
on
trol an
d C
om
plian
ce Issues

the compliance function and to have a detailed understanding of the regu-
latory situation. If compliance is ever breached, then it is necessary to be
able to detect the breach, immediately deal with the consequences, and
prevent any further occurrence.
To achieve these various goals, the Compliance Division was set up in
February 1998. A compliance manual was prepared and has been used
extensively in internal education and training programs, and a compliance
audit process has been launched.
Not only is the environment in which the Bank operates changing rapid-
ly and the regulatory environment similarly changing with the implemen-
tation of Japan’s Big Bang, but there is also the impact of new strategic
subsidiaries entering entirely new areas of financial activity. In line with
the overall reorganization conducted in June 1999, the Compliance Division
was raised to departmental status, and it was further expanded and made
fully independent to guarantee its compliance function. The Legal Depart-
ment, the Credit Examination Department, and the Auditing Department
have been placed together under the Compliance Department as an inde-
pendent group to oversee compliance.
The Compliance Department is responsible in this position for planning
and promoting the objective and verifiable level of compliance throughout
the Bank. This means that the Compliance Department must draw up the
program for compliance supervision and ensure its execution.
To ensure the thoroughgoing institution of a compliance culture in the
Bank, each business unit has been
taking an overall compliance respon-
sibility in its area, and in each section
of the Bank and in each of its branch-
es, one staff member has been made
responsible for enforcing compliance.
There is a reporting and monitoring
system in place to ensure that the
Compliance Department can imme-
diately give advice and warnings
as needed.
Ris
k C
on
tro
l an
d C
om
plia
nce
Issu
es
34
Risk Control and Compliance Issues
� Compliance Structure
AuditorsBoard of
Auditors OfficeCorporate
Auditors Office
General Meetingof Shareholders
ExecutiveCommittee
Board ofDirectors
Credit Examination Department
Auditing Department
Legal Department
Compliance Department

OPERATIONS IN OUTLINEBalancing the Center and the Periphery
Contents
The IBJ Group at a Glance36
Corporate Banking Unit38
Investment Banking Unit40
Treasury Unit42
Securities and Asset Management Unit44
International46
Research47
Systems48
35

VentureCapital & MBO
Investment Banking
Treasury
FinancialTechnology
I B
Major Subsidiary& Affiliate in Japan
Kogin Investment, Ltd.
3i-Kogin Buyouts Ltd.
Japan
Asia & Oceania
Americas
Europe
Major Overseas Affiliate
IBJ–BA Consulting Investitionsberatung GmbH
CO
R
E
Major Overseas Subsidiaries
Major Overseas AffiliateMajor Strategic Subsidiaries & Affiliates
Major Subsidiary & Affiliate in Japan
Op
erat
ion
s in
Ou
tlin
e
36
The IBJ Group at a Glance

CorporateBanking
CapitalMarkets
Securities and Asset
Management Asset
Management and Admini-
stration Business
Futures &Brokerage
J
Major Overseas Subsidiaries
PT. Bank IBJ Indonesia
IBJ International plc
Banque IBJ (France) S.A.
The Industrial Bank of Japan Trust Company
IBJ Whitehall Bank & Trust Company
The Industrial Bank of Japan (Canada)
The Bridgeford Group
IBJ Australia Bank Limited
The Industrial Bank of Japan (Germany)
The Industrial Bank of Japan (Luxembourg) S.A.
The Industrial Bank of Japan - NJ(Switzerland) Limited
IBJ Asia Securities Limited
IBJ Asset Management International Ltd.
Aubrey G. Lanston & Co. Inc.
IBJ Lanston Futures Pte. Ltd.
Major Strategic Subsidiaries &Affiliates
IBJ Securities Co., Ltd.
Shinko Securities Co., Ltd. (Note 1)
IBJ NW Asset Management Co., Ltd.(Note 2)
IBJ Investment Trust Management Co., Ltd. (Note 2)
IBJ Trust and Banking Co., Ltd.
IBJ Nomura Financial Products plc (INFP)
Nomura IBJ Global Investment Advisors, Inc. (NI-GIA)
Nomura-IBJ Investment Services Co., Ltd. (NIIS)
IBJ-DL Financial Technology Co., Ltd.
BU
S
IN
ES
S
37
Op
eration
s in O
utlin
e
Notes: 1. New Japan Securities Co., Ltd. and Wako Securities Co., Ltd. are due to be merged intoShinko Securities Co., Ltd., in April 2000, and IBJ Group companies’ interest is set to beincreased to 25% in the amalgamated entity, Shinko Securities.
2. IBJ NW Asset Management Co., Ltd. and IBJ Investment Trust Management Co., Ltd.,and Dai-ichi Life Asset Management Co., Ltd., are due to be merged into DLIBJ AssetManagement Co., Ltd., on October 1, 1999.

38
Op
erat
ion
s in
Ou
tlin
e
This unit provides a full range of corporate banking services to the corporate customer
base of IBJ: corporate banking, including corporate deposit-taking and lending, forex, and
other commercial banking services. These are provided to foreign and domestic blue chip
majors, medium and small-sized growth businesses, other financial institutions, institu-
tional investors, and public-sector entities.
From the very early days of the Bank, it has been involved in the financing of indus-
trial capital investment as its very name implies. Management has always taken an ag-
gressive approach to the funding of the legitimate capital investment requirements of
first-rate companies. This has meant the provision of long-term credit at fixed rates of
interest for the funding of plant investment and the provision of shorter-term funds to
finance working capital requirements. Exceptionally for a commercial bank, IBJ has al-
ways been active in the underwriting of public-sector entity bonds for historical reasons.
For private-sector bonds, the Bank has always been active in the trustee and adminis-
trative work of corporate bond issues as the “commissioned bank,” with the Bank act-
ing as the trustee of bondholders and protecting their interests.
On account of this long experience in dealing with bonds, both public-entity and
corporate bonds, the Bank has underwritten many government-guaranteed bonds
and local government bonds, including those of the Tokyo metropolitan government.
The range of funding methods for customers is now so much more than simple bank
borrowing, and many more customers are employing straight bonds and commercial
paper. At the Bank, there is a long history of experience in the bond market and the
process from issue to redemption can be carried out smoothly and efficiently, thus pro-
tecting both the interests of the investing customer and the borrower.
This long history and the pivotal role of the operation within the Bank historically
means that the account executive for each customer is based in the unit as it has now
become. These account executives are responsible for keeping abreast of customer
Corporate Banking Unit
� Loans Outstanding for Plant and Equipment Investment by Industry (¥ billion)
Total for the manufacturing sector¥13,067.9 billion¥1,362.8 billion (10.4%)
All industries¥175,833.6 billion¥8,153.0 billion (4.6%)
Outstanding loans for capital investment from domestic banks (excluding loans from trust accounts)Outstanding loans for capital investment from IBJ
Electric power
Transportation and telecommunications
Chemicals
Transportation machinery and equipment
Electric machinery
Petroleum refining
Iron and steel
Ceramics
Paper and pulp
Nonferrous metals
(47.8%)
(15.5%)
(16.7%)
(12.3%)
(9.5%)
(22.9%)
(22.7%)
(9.8%)
(16.1%)
(31.1%)
2,745.3
8,092.7
1,383.1
1,168.3
1,098.1
821.3
720.7
553.0
516.1
365.8
(As of March 31, 1999)Note: Figures in parentheses are the Bank’s share of the total.

39
requirements and ensuring that the IBJ Group responds to these requirements in a time-
ly and appropriate fashion.
In March 1998, legislation providing for the opening of commitment lines has meant
that another item has been added to the IBJ menu of financial services the Bank pro-
vides to its corporate customer base. Also, the syndicated loan product, which enables a
variety of financial institutions and institutional investors to participate in the financing
of a single customer, is now attracting much attention and offers new avenues of cus-
tomer financing for the unit.
Liberalization is having a large number of follow-on effects. For example, the recent
amendment to the Foreign Exchange Act and the International Accounting Standards
guidelines on consolidation are causing much interest in Cash Management Services
(CMS) among major Japanese companies. The senior management is now concerned
about the global management of cash resources in the consolidated balance sheet on a
worldwide basis in a variety of currencies.
The globalization of business continues apace and the trend toward the liberaliza-
tion of capital flows is making greater demands on companies’ treasury operations.
To respond to such customer needs, the IBJ Global CMS product was launched in
November 1998 and is the first such CMS product to be Internet based. The customer
can keep track of balances, remittances, and netting of debtor and creditor balances by
currency. This system has a number of highly sophisticated technical features, includ-
ing the use of a “virtual private network” function to ensure the integrity of information
despite its transmission over the Internet.
One further impact of globalization is the growing emphasis on open market evalua-
tions of companies, such as published credit ratings and stock prices. There is there-
fore growing work in advising companies on achieving higher levels of shareholder
value. As the unit having the account executive responsible for overall contact with the
customer, it is active in promoting IBJ as the “Problem Solution Provider” through such
activities as the unlocking of balance sheet assets, the restructuring of Japanese multi-
nationals, the provision of M&A advisory services, as well as methods to solve the
problem of underfunded corporate pension schemes.
Corporate Banking Unit
Op
eration
s in O
utlin
e
0 1,000 2,000 3,000 4,000 5,000
� Commissioned Bank/Fiscal Agent Activities of IBJ (¥ billion)
Public-Sector Bonds
Electric Power Utility Bonds
Other Corporate Bonds (Note 2)
Samurai Bonds (Note 2)
(66.3%)
(50.7%)
(12.3%)
(9.3%)
2,270.0
8,561.4
4,363.9
392.9
Amount for which IBJ acted as Lead Commissioned Bank (Note 1)Notes: 1. Includes acting as registrar and fiduciary agent
2. Includes asset-backed securities3. Figures in parentheses are the Bank’s share of the total.
Lead Commissioned Bank (Note 1)
Lead Commissioned Bank (Note 1)/Fiscal Agent

With the changing legal and accounting environment in Japan, the Bank’s
customers require ever more sophisticated balance sheet advisory services.
This type of advisory work then extends into such issues as the concentra-
tion of management resources on certain selected strategic core businesses
and the downsizing and disposal of non-core businesses. There is much
advisory work now being done in the general area of corporate restructur-
ing and M&A.
Much attention is now being given to the Private Finance Initiative type
of funding vehicle that involves the basic principles of project finance. To
provide solutions to customers’ requirements requires a wide-ranging,
sophisticated, and integrated set of capabilities within the unit. The unit
is managed on a global basis, around the three competencies of structured
finance, M&A, and project finance. These competencies are supported by
the other capabilities within the IBJ Group, such as derivatives, research, and
distribution, and the unit is clearly positioned as the “Problem Solution
Provider” for the customers of the Bank. In this way, the unit is assisting
the Bank in achieving its “First Call Bank” status.
The Bank has developed itself to structuring new financing schemes that
meet the needs of individual customers and to creating new products and
services that are tailor-made for particular customers. Using such schemes
as the securitization of financial assets and real estate, and lease financing,
for example, IBJ provides customers with a greater variety of fund-raising
options while also helping them to improve their financial ratios and pro-
viding financial techniques that meet their financing requirements.
One unusual structuring was the pension trust scheme provided to Sony
Corporation, which faced the problem of an actuarially underfunded cor-
porate defined-benefit scheme for its employees. Relationship holdings of
equities held by Sony were settled in a trust for the benefit of the pension
fund, and this made a major contribution to resolving the problem of
underfunding.
Op
erat
ion
s in
Ou
tlin
e
40
Investment Banking Unit
� M&A Advisory MandatesNewly Won
93 94 95 96 97 98
Indexes basedon calendar or
fiscal 1993 = 100
M&A advisory mandates won by IBJ (fiscal-year basis ended March 31)
Japanese M&A deals disclosed(calendar-year basis ended December 31)
Source: IBJ survey
50
100
150
200
250
300
350
400
April 25, 1999

41
The U.S.-based M&A boutique, The Bridgeford Group, is an IBJ sub-
sidiary and contributes to the IBJ global network of M&A information
flows. IBJ offers a customer-centered, long-term view in its advisory ser-
vices to the large customer base of companies that has been built up over
the years. In particular, in April 1999, IBJ and the leading U.K. venture cap-
ital company, 3i Group plc, formed a joint venture, 3i-Kogin Buyouts Ltd.,
to concentrate on opportunities in the Japanese management buyout (MBO)
market, and the first fund of ¥20 billion is being set up.
The graph on page 40 shows the index trend of advisory mandates won
by the Bank and the number of disclosed M&A transactions year by year
set at 100. Clearly, the Japanese M&A market is growing, albeit slowly,
while the leading indicator of advisory mandates won by the leading bank,
IBJ, is growing more rapidly.
A specific example of an M&A transaction the Bank conducted is the
high-profile case of the unusual troika equity agreement between AT&T
Corp., British Telecommunications plc, and Japan Telecom Co., Ltd., where
the Bank advised Japan Telecom. Attention was drawn to the Bank’s suc-
cess in resolving the different corporate management philosophies in the
United Kingdom, the United States, and Japan in a single deal.
Project finance—the financing of large-scale projects in such industries
as energy, basic materials, and infrastructure construction/development—
requires the maintenance of a broad intelligence network to successfully
assist customers from the early stages of project discussions. It also requires
being able to propose innovative financial solutions to often exceptionally
complicated situations. In the case of the AES Barry Power Plant project,
attention was drawn to IBJ’s solution to the risk inherent in supplying elec-
tricity to a competitive market and the price volatility associated with such
an environment. In the case of the Shandong Zhonghua Power Plant proj-
ect, the Bank was lauded for its capability in carrying the financing struc-
turing through the turmoil of the recent Asian currency crisis.
Op
eration
s in O
utlin
e
Investment Banking Unit
� Project Finance: Recent Examplesof Large-Scale Projects with MajorIBJ InvolvementResources & Energy
Premier Transco Gas Pipeline (U.K.)Minera Los Pelambres CopperMining (Chile)
Oleoducto Central S.A. Pipeline (Colombia)Ras Laffan LNG (Qatar): 1996 Middle East Deal of the Year award from ProjectFinance International magazine
Petrochemicals & Manufactured ProductsEastern Petrochemical (“Sharq”)
(Saudi Arabia)Al-Jubail Petrochemical (“Kemya”)(Saudi Arabia)
Ibn Rushd Petrochemical (Saudi Arabia)SUS Cold Mill (Thailand)
Power GenerationShandong Zhonghua Power Plant (China): 1998 Power Deal of the Year award from Project Finance magazine
AES Barry Power Plant (U.K.):1997 Power Deal of the Year award from Project Finance magazine
KEGCO Power Plant (Thailand)
Other Infrastructure ProjectsAutolink (M6) (U.K.)Autolink (A19) (U.K.)Hong Kong Air Cargo Terminal (Hong Kong)
Shandong ZhonghuaPower Plant

Op
erat
ion
s in
Ou
tlin
e
42
This unit encompasses the Bank’s ALM operations, investment portfolio
management, and trading activities. The unit has operations in major
international markets and handles a variety of products, including
foreign exchange, swaps, options, and futures.
The ALM operations are responsible for optimizing the interest rate risk
associated with the Bank’s lending and funding activities. The Bank continu-
ally issues five-year debentures as the main funding source and attributes
such funds to long-term fixed loans to meet our customers’ financing needs.
Due to the long-term nature of the Bank’s assets and liabilities, we have de-
veloped, over the long run, an ALM methodology specifically tailored to
control the sensitivity risk associated with the fluctuation of long-term in-
terest rates. The important concepts of our ALM methodology include
• the elaborate matching operations of our customer-related assets with
liabilities to ensure a sufficient net spread is maintained in the future,
• the dynamic control of the sensitivity gap utilizing flexible instruments,
such as swaps and government bonds aimed at enhancing the long-term
economic value of our balance sheet, and
• the enhancement of profitability of the net fair value of total assets and
liabilities.
To facilitate the ALM methodology described above, we have created an
ALM system which measures various risk parameters, such as PVBP (basis-
point value), gamma, and VaR (Value at Risk).
PVBP represents the marginal change in the fair value of all assets and lia-
bilities as a result of a one basis point change in the interest rate. Total PVBP
is distributed to the respective time band based on the remaining contractu-
al maturity or repricing period of assets and liabilities, which allows us to
Treasury Unit
Table A� PVBP as of March 31, 1998 and 1999
(¥ million)
Over 1 year andTotal Within 1 year within 5 years Over 5 years
March 31, 1998 (1,500) 0 (500) (1,000)Lending and Debenture Block (600) 100 0 (700)Risk Management Block (900) (100) (500) (300)
March 31, 1999 (2,900) 0 (1,300) (1,600)Lending and Debenture Block (400) 200 100 (700)Risk Management Block (2,400) (100) (1,400) (900)
Table B� VaR as of March 31, 1998 and 1999
(¥ billion)
March 31, 1998 March 31, 1999
VaR 61.6 162.4
*Holding period one month, 99% confidence level*Both delta and VaR exclude real estate, equipment, and equity holdings, which are funded by capital.
� Quarterly VaR and 10-YearGovernment Bonds(%) (¥ billion)
0
100
200
300
400
Yen interest rate(yield on 10-year Japanesegovernment bonds)
U.S. dollar interest rate(yield on 10-year U.S. Treasury bonds)
VaR
0
1
2
3
4
5
6
7
4~6/98 7~9/98 10~12/98 1~3/99

43
analyze the yield curve risk. Table A shows the PVBP of our ALM book at
March 31, 1998 and 1999. A negative amount reflects a potential decrease in
fair value when the interest rate increases by one basis point. On the other
hand, a positive amount reflects a potential increase in fair value when the
interest rate increases by one basis point. VaR is a statistical approach to
capture the maximum potential loss from adverse market movements.
Table B shows the VaR of our ALM book at March 31, 1998 and 1999.
During fiscal 1998, “flight to quality” triggered by global deflation and
the Russian crisis led to a downtrend in yen long-term interest rates in the
first half. Also, the cut in the overnight target rate by the BOJ reinforced
this move. However, in December, long-term interest rates rose immediate-
ly as fear of large issues of Japanese Government Bonds (JGBs) appeared on
the horizon. Thereafter, starting from February 1999, they resumed the down-
trend after the easing of the overnight target rate by the BOJ and decreases
in new JGB issues.
In the U.S. financial market, the Russian crisis caused money to flow into
U.S. treasuries from all over the world, leading to historically low yields.
In autumn, the outbreak of the hedge-fund crisis provoked a global credit
crunch and high volatility in financial markets. To stabilize the crisis, the
FRB eased its targeted federal fund rate three consecutive times. The U.S.
stock market recovered, and the turmoil in financial markets subsided.
Under these market conditions, IBJ has increased its VaR gradually during
the second quarter, expecting a decline in interest rates. In the fourth quar-
ter, the Bank operated moderately and decreased its VaR. As a result, a
high level of profitability was realized for the fiscal year, and the net fair
value of total assets and liabilities amounted to ¥190.0 billion as of March
31, 1999 (this amount excludes the present value of real estate and equity
holdings funded by capital, the evaluation of credit risk premiums, and
various fee revenues).
The other important function of the Treasury Unit is trading. Trading
activities involve customer-related and proprietary activities. The unit
develops and provides various kinds of customized products at competitive
prices to help customers manage risk. In proprietary activities, the unit em-
phasizes a relative-value approach, trying to capture arbitrage opportunities
in related markets as well as distortions between the theoretical and actual
market prices of certain instruments. For the fiscal year under review, rev-
enue from our trading activities resulted in a profit of ¥71.0 billion, which
included profit of ¥17.1 billion from foreign-exchange activities on a consol-
idated basis. With respect to the risk profile of the trading operations, please
refer to pages 27~30.
Treasury Unit
Op
eration
s in O
utlin
e
Board ofDirectors
ExecutiveCommittee
ALMCommittee
Front OfficesBanking/Trading
BackOffice
� Risk Management Flow
RiskManagementDepartment

This unit encompasses many of the new strategic subsidiaries, and for the benefit of
the reader, the chart below sets out the overall structure.
In the field of wholesale securities, IBJ Securities Co., Ltd., was established as a
fully owned subsidiary in July 1993 and has been active in those areas permitted for
bank cross-over subsidiaries, principally corporate finance, bond sales and trading,
and certain equity-related businesses. Following the liberalization scheduled for
October 1999, this subsidiary will be able to enter the equity business without restric-
tion. Ahead of this, the capital of the subsidiary was increased by ¥35 billion, to
¥70 billion, in March.
IBJ Securities has a record of underwriting domestically issued corporate straight
bonds that now already rivals that of the major and long-established securities
houses. Working in close cooperation with IBJ Securities, the two long-established
European subsidiaries, IBJ International plc in London and The Industrial Bank
of Japan-NJ (Switzerland) Limited in Zurich, provide a wide range of securities
services in the overseas primary and
secondary markets.
In November 1998, a joint venture
was established in the United Kingdom
between IBJ and Nomura Securities
Co., Ltd., and IBJ Nomura Financial
Products Holding plc, and this ven-
ture has a securities subsidiary (INFP)
that opened a Tokyo branch in
January 1999. After approval by the
regulatory authorities in Japan and
the United Kingdom, the branch
opened for business in April. It is
intended that this branch will offer
derivatives and structured products
to customers in Japan.
In retail securities, the two IBJ affili-
ates, New Japan Securities Co., Ltd.,
and Wako Securities Co., Ltd., are due
to be merged in April 2000, and the
IBJ Group companies’ interest is set to
be increased to 25% into the merged
entity, Shinko Securities Co., Ltd.
Op
erat
ion
s in
Ou
tlin
e
44
� Lead Manager League Tablefor Straight Bond Issues in Japanfor the year ended March 31, 1999(¥ billion, %)
Value of Number issues as
Ranking Underwriter of issues lead manager Share
1 Nomura Securities 139 2,758 25.4
2 Daiwa Securities 85 1,488 13.7
3 Nikko Salomon Smith Barney 93 1,325 12.2
4 IBJ Securities 54 1,055 9.7
5 DKB Securities 45 641 5.9
6 Sakura Securities 34 603 5.5
7 Tokyo-MitsubishiSecurities 60 586 5.4
8 Fuji Securities 38 556 5.1
9 Sumitomo CapitalSecurities 35 361 3.3
10 Sanwa Securities 38 332 3.0
Source: THOMSON DealWatch League Tables
Securities and Asset Management Unit
Securities Asset Management/Asset Administration
IBJ Securities
Joint Projects with Nomura Securities•IBJ Nomura Financial Products (INFP)
Overseas Subsidiaries•IBJ International•The Industrial Bank of Japan-NJ (Switzerland)•Aubrey G. Lanston•IBJ Asia Securities
New Japan Securities/Wako Securities[Two companies are to be merged into Shinko Securities.](25% holding by the IBJ Group)
Other Related Activities
•Kogin Investment•Kyodo Computer Service
•IBJ-DL Financial Technology•3i-Kogin Buyouts
•IBJ Nikko Information System
•Business Planning Department (IBJ Group)•Investment Research Department
•Securities Services Department•Financial Engineering Department
IBJ NW Asset ManagementIBJ Investment Trust Managementand Dai-ichi Life Asset Management [These three companies are to be merged into DLIBJ Asset Management on October 1, 1999.]
IBJ Trust and Banking
Joint Projects with Nomura Securities•Nomura-IBJ Investment Services (NIIS)•Nomura IBJ Global Investment Advisors (NI-GIA)
Overseas Subsidiaries•IBJ Asset Management International•IBJ International•The Industrial Bank of Japan (Luxembourg)
IBJ
� Securities and Asset Management Unit
45
IBJ NW Asset Management Co., Ltd., incorporated in 1985, is an investment man-
agement company with a full discretionary license and is active in the management
of portfolio assets of a large number of institutional investors, including leading
Japanese pension funds. Currently, there is over ¥2 trillion under management,
and it is one of Japan’s leading investment management companies.
In July 1994, IBJ Investment Trust Management Co., Ltd., was set up to manage
securities investment trust products for both the retail and the wholesale markets.
Major products being marketed are “IBJ ITM Japan Selection,” “Global Bond
Portfolio,” and “Prime One” to cater to a variety of risk/return profile preferences.
In October 1995, IBJ Trust and Banking Co., Ltd., was established as a wholly
owned subsidiary in response to growing interest among customers in financial
products utilizing trust structures. In addition to the acceptance and administration
of the usual monetary claims, IBJ Trust and Banking provides administrative ser-
vices related to securitization, including services in connection with the issuance
of asset-backed securities, asset-backed CP, and other securities.
On account of a number of factors, such as the selling of investment trusts by banks
from December 1998, the underwriting of investment trusts by private issues from
the same month, the likely introduction of defined contribution pension schemes,
and the rapid maturation of Japanese demographics, there is considerable interest
in the asset management market as it is set to grow very strongly over the long
term. In fact, IBJ and The Dai-ichi Mutual Life Insurance Company have agreed to
merge the two IBJ asset management companies, IBJ NWAsset Management
and IBJ Investment Trust Management, with Dai-ichi Life Asset Management Co.,
Ltd., into DLIBJ Asset Management Co., Ltd. The intention, as part of the strategic
alliance between the Bank and Dai-ichi, is to form the leading asset management
company in Japan based on the two parent companies’ long experience and know-
how in the field.
Also of note is joint venture Nomura-IBJ Investment Services Co., Ltd. (NIIS),
formed between Nomura and IBJ in the area of pension consulting services and
Japan Investor Solutions & Technologies Co., Ltd. (JIS&T), formed among many
major financial institutions, including IBJ, in record-keeping services. It is anticipat-
ed that a Japanese-style 401(k) defined contribution type of pension scheme will be
introduced into Japan by autumn 2000.
Securities and Asset Management Unit
Op
eration
s in O
utlin
e
� Financial Results of IBJ Securities(¥ million)
For the years ended March 31 1998 1999
Operating Revenue 20,202 22,805Income beforeIncome Taxes 1,723 10,175
Net Income 204 5,310
At March 31 1998 1999
Shareholders’Equity 25,000 50,000
Total Assets 3,308,249 3,274,479
� Financial Results of IBJ NW AssetManagement
(¥ million, except as indicated)
For the years ended March 31 1998 1999
Operating Revenue 2,900 3,000Income beforeIncome Taxes 441 150
Net Income 231 72
At March 31 1998 1999
Shareholders’Equity (¥ billion) 0.4 0.4
Assets underManagement(¥ billion) 2,084.7 2,250.9
� Results of IBJ Investment TrustManagement
(¥ million, except as indicated)
For the years ended March 31 1998 1999
Operating Revenue 1,958 1,658Income (Loss) beforeIncome Taxes 1 (249)
Net Loss (5) (250)
At March 31 1998 1999
Shareholders’Equity (¥ billion) 1.5 1.5
Total Assets (¥ billion) 274.1 244.0
� Results of IBJ Trust and Banking(¥ million, except as indicated)
For the years ended March 31 1998 1999
Operating Revenue 1,643 2,514Income beforeIncome Taxes 269 1,097
Net Income 265 505
At March 31 1998 1999
Shareholders’Equity (¥ billion) 15.0 15.0
Trust Assets (¥ billion) 4,148.6 4,165.5

While IBJ expanded its overseas network vigorously during the last 20
years, there is now a requirement to retrench and to achieve greater effi-
ciency in overseas operations. In the three regions of the Americas, Europe,
and Asia/Oceania, the Bank is re-concentrating on the major offices and on
more sophisticated products, such as project and structured finance. IBJ
senior management is convinced that maintaining a fully competitive inter-
national presence is a sine qua non to be a major global player in financial
markets.
In the Americas, IBJ offers both Japanese and non-Japanese corporations
commercial and investment banking services. Substantial investments have
been made in improving the IT system based on the New York office and
the other five offices in the competitive U.S. market—the system went on-
line in May 1999. IBJ continues to work to offer its many customers in the
United States the first-rate service that they deserve.
In Europe, the introduction of the single currency among the 11 Euroland
member states has created an economic entity the size of the U.S. and is
clearly propelling EU industry toward greater consolidation via M&A.
Exploiting the investment banking strengths of the London Branch and the
wide spread of the continental European branch network, IBJ is offering
value-added financial services throughout Europe. The EU market is of
great importance.
In Asia/Oceania, which continues to be strategically important for IBJ,
the countries in the region are recovering from the recent currency crisis
and endeavoring to regain strong economic growth. In early 1999, IBJ
placed a project finance team in Hong Kong and a treasury team in
Singapore. From these two new specialist centers, IBJ is offering value-
added services throughout the region via its strong branch network. IBJ has
close links with China and has a wide network of cooperation and training
agreements. With over 20 years’ experience in this country, the Bank can
carefully weigh business opportunities and risks in what is both a challeng-
ing and promising market.
Op
erat
ion
s in
Ou
tlin
e
46
International

47
One of the most important tasks of a full-line financial institution is its
research efforts. Only with relevant and up-to-date information can senior
management decisions be made.
Employing the global network of the IBJ Group, macro- and microeco-
nomic information is gathered and analyzed related to economies, fiscal
and financial issues, capital markets, financial institutions, and industries.
This data is used internally and is provided to customers in policy propos-
als and for other purposes. In certain cases, the data is published as promo-
tional material for use in marketing. For example, the semi-annual survey
of capital expenditure plans has the widest coverage of any private-sector
research organization and is generally regarded as important primary data
for economic forecasting.
The Industrial Research Department specializes in research on Japan’s
major industries. Results of this research are used in the Bank’s various
customer-oriented proposals. In the area of infrastructure projects, the
department is going to be of increasing importance because of the growing
interest in such new structures as PFI (Private Finance Initiative) and real
estate securitization.
Op
eration
s in O
utlin
e
Research
U IBJ Major Publications
Name of Publication Frequency Description of Content
In English
IBJ Monthly Report Monthly IBJ’s monthly report on the economy and industries
Outlook for the Japanese Economy Quarterly IBJ’s forecast for the Japanese economy for approx-imately the next one-year period
IBJ Industry Research Annually IBJ’s special report on trends and outlook inJapanese major industries
In Japanese
Kogin Chosa Occasionally IBJ’s industrial report. Each issue focuses on aspecific industry.

The information technology departments of the Bank are responsible for vital
support for business improvement, analysis of profit and risk information
for senior management, and dissemination of this information speedily and
accurately.
In June 1997, IBJ divided the IT function in each business division to deal
efficiently with business action and instituted the post of Chief Information
Officer (CIO), a managing director, to integrate the IT function. Then, IBJ
established the Information Technology Department to support the CIO
and to be responsible for ensuring that the department efficiently coordi-
nates the IT function across the various business divisions. In this fashion,
the IT requirements can be integrated over the entire IBJ Group to obtain
maximum coordination and thereby achieve economies of scale by the
avoidance of unnecessary IT duplications.
In light of the rapid changes characterizing the Bank’s business environ-
ment, the information technology departments will be called on to perform
systems development with a tighter focus on strategically emphasized proj-
ects and with even greater timeliness. One of the fields that IBJ recognizes
is new business projects, such as the introduction of Japanese-style 401(k)
pension schemes. The Bank is giving high priority to promote the sound
development of such new businesses by building systems for the more-
detailed management of risks and profits.
To realize such investment programs, IBJ will proceed further with
moves to reduce fixed costs and free up funds for investment through the
scrapping of existing systems and to increase the efficiency of systems
development through the upgrading of development technologies.
Op
erat
ion
s in
Ou
tlin
e
48
Systems

49
FINANCIAL SECTION
Contents
Six-Year Summary50
Management’s Discussion and Analysis51
Consolidated Balance Sheets64
Consolidated Statements of Income65
Consolidated Statements of Shareholders’ Equity66
Consolidated Statements of Cash Flows67
Notes to Consolidated Financial Statements68
Report of Independent Certified Public Accountants97
Non-Consolidated Balance Sheets98
Non-Consolidated Statements of Income99
Non-Consolidated Statements of Shareholders’ Equity100
Notes to Non-Consolidated Financial Statements101
Report of Independent Certified Public Accountants102

Statements of Income (in millions of yen)
(for the years ended March 31) 1999 1998 1997 1996 1995 1994
Total Income ¥3,386,760 ¥3,321,902 ¥3,403,347 ¥3,731,847 ¥3,087,404 ¥3,063,399Total Expense 3,642,993 3,635,020 3,358,870 3,838,173 3,032,577 3,017,877Income (Loss) before Income Taxesand Others (256,232) (313,118) 44,477 (106,325) 54,826 45,521
Net Income (Loss) (181,276) (202,660) 12,740 (63,551) 29,685 21,897
Per Common Stock (in yen)
(for the years ended March 31) 1999 1998 1997 1996 1995 1994
Net Income (Loss) ¥(70.64) ¥(79.80) ¥5.24 ¥(27.02) ¥12.62 ¥9.31
(in millions of yen)
Balance Sheets (at March 31) 1999 1998 1997 1996 1995 1994
Total Assets ¥46,166,409 ¥49,229,785 ¥46,966,968 ¥40,737,733 ¥40,858,245 ¥42,488,374Cash and Due from Banks 806,910 553,203 2,318,157 2,987,739 3,951,856 4,549,916Trading Assets 3,729,005 3,466,255 — — — —Trading Account Securities — — 943,457 537,932 726,995 977,715Investment Securities 8,942,151 8,847,249 6,808,045 6,686,872 6,351,897 6,382,275Loans and Bills Discounted 23,327,907 24,001,429 25,518,440 24,267,385 23,808,552 24,023,625
Total Liabilities 44,308,984 47,909,766 45,422,988 39,412,622 39,449,385 41,089,687Debentures 20,461,865 20,840,941 22,137,519 21,470,815 21,658,109 22,790,004Deposits 8,116,321 10,053,551 10,871,309 8,960,767 9,273,126 9,421,241Trading Liabilities 2,854,950 2,286,959 — — — —Reserves 1,167,976 993,292 649,985 556,791 383,999 328,339Acceptances and Guarantees 1,516,602 2,024,337 2,382,608 2,331,153 2,144,478 2,578,011
Total Shareholders’ Equity 1,561,350 1,320,019 1,543,979 1,325,110 1,408,860 1,398,686
Capital Adequacy Ratio (at March 31) 1999 1998 1997 1996 1995 1994
BIS Capital Adequacy Ratio 11.30% 10.26% 9.04% 8.59% 8.82% 9.10%
All figures are on a consolidated basis.
Fin
anci
al S
ecti
on
50
Six-Year Summary

Finan
cial Section
51
SummaryIn the year ended March 31, 1999 (“fiscal 1998”), IBJ and its subsidiaries (“IBJ Group”) reported a net loss of
¥181.2 billion, or ¥70.64 per common stock, compared with a net loss of ¥202.6 billion, or ¥79.80 per common
stock in the year ended March 31, 1998. This was the second consecutive net loss for the IBJ Group even though
some subsidiaries reported increased profits. This net loss is principally due to the disposal of and provisions for
conservative reserves for non-performing loans by IBJ.
For IBJ only, Core Business Profit before Transfer to General Reserve amounted to ¥278.6 billion. This was an
increase of ¥33.9 billion from the previous year and was the highest figure in IBJ’s history. However, to improve
the quality of assets, IBJ disposed of and conservatively provided reserves for non-performing loans, which in
total amounted to ¥857.8 billion. Together with Transfer to General Reserve for Possible Loan Losses, the total
for loan losses amounted to ¥924.3 billion.
As a result, IBJ recorded a non-consolidated Loss before Income Taxes of ¥345.4 billion. Net Loss for the year
reached ¥195.7 billion.
In compiling fiscal 1998 business results, IBJ introduced important accounting changes as listed below.
IBJ adopted the effective-control standard, replacing the percentage-of-ownership standard in the classifica-
tion and identification of its subsidiaries and affiliates. The effective-control standard takes into account man-
agement relationships as well as the extent of IBJ’s shareholdings in companies. For example, if IBJ sends staff to
help manage a company, it may be classified as a subsidiary or an affiliate regardless of IBJ’s ownership percent-
age. Because of this new standard and establishment of new companies, the number of consolidated subsidiaries
increased by 25, to 67. The number of affiliates being accounted for under the equity method increased to 14.
No affiliates were accounted for under the equity method in the previous year.
� Number of Consolidated Subsidiaries and Affiliates being accounted for under the Equity MethodMarch 31, 1999 (a) March 31, 1998 (b) March 31, 1997 (a)–(b)
Consolidated Subsidiaries 67 42 36 25Affiliates being accounted for under the Equity Method 14 0 0 14
Total 81 42 36 39
Effective as of March 31, 1999, Investment Securities of IBJ are stated at cost. As of and prior to March 31, 1998,
corporate bonds, stocks and shares, and other securities listed on stock exchanges were stated at the lower of
cost or market, and Japanese national and local government bonds were stated at cost. As a result of this change,
Other Expense and Loss before Income Taxes and Others decreased by ¥190.4 billion for fiscal 1998.
In fiscal 1998, IBJ adopted the balance sheet method of accounting for income taxes. This method recognizes
Deferred Tax Assets and Liabilities for temporary differences in recognition of gains and losses between reporting
purposes and income tax purposes. This method has already been adopted for consolidated financial statements.
Income Analysis
IBJ GroupThe following is an analysis of income by principal components. Net Interest Income rose by ¥11.7 billion
from the previous year’s level, to ¥301.8 billion. This reflected better performances by both the parent company
and by subsidiaries. Net Fees and Commissions, on the other hand, declined by ¥19.8 billion, to ¥83.2 billion.
Subsidiaries reported higher net fees and commissions. On the other hand, IBJ recorded decreased net fees
and commissions as a result of lower loan related charges. Other Business Profit increased by ¥17.7 billion,
to ¥59.2 billion, mainly due to the increased gains on sales of bonds by IBJ.
Efforts were made throughout the Group to cut costs, but the increase in the number of consolidated sub-
sidiaries, due to the adoption of the effective-control standard, caused General and Administrative Expenses
to rise by ¥5.3 billion, to ¥222.7 billion. In addition, disposing of and providing for conservative reserves for
non-performing loans resulted in Other Operating Losses of ¥531.6 billion. As a result, Loss before Income
Taxes and Others amounted to ¥256.2 billion. Net Loss amounted to ¥181.2 billion.
Management’s Discussion and Analysis
� Summary of Consolidated Statements of Income (in billions of yen)
Fiscal 1998 (a) Fiscal 1997 (b) Fiscal 1996 (a)–(b)
Net Interest Income ¥ 301.8 ¥ 290.0 ¥323.3 ¥11.7Net Fees and Commissions 83.2 103.1 57.2 (19.8)Trading Profit 53.9 1.0 — 52.9Other Business Profit 59.2 41.5 24.3 17.7General and Administrative Expenses 222.7 217.4 202.8 5.3Others (531.6) (531.3) (157.6) (0.4)
Income (Loss) before Income Taxes and Others (256.2) (313.1) 44.4 56.8Income Taxes Expense (Benefit) (83.2) (110.7) 30.6 27.4Minority Interests in Net Income 8.3 0.1 1.1 8.1Amortization of Consolidation Difference — 0.1 0 (0.1)
Net Income (Loss) ¥(181.2) ¥(202.6) ¥ 12.7 ¥21.3
� Loan Losses (in billions of yen)
Fiscal 1999
Written-off Claims ¥140.6
Transfer to Specific Reserve for Possible Loan Losses 543.2
Transfer to Reserve for Loans to Restructuring Countries 8.6
Transfer to Reserve for Contingent Losses relating to Loans Sold to CCPC 44.0
Losses on Sales of Loans to CCPC 2.1
Other Losses on Sales of Loans 62.4
Subtotal 801.2
Transfer to General Reserve for Possible Loan Losses 70.4
Total ¥871.7
IBJ OnlyCore Business Profit declined by ¥18.6 billion, to ¥212.0 billion, because of a conservative provision to General
Reserve for Possible Loan Losses. However, as stated previously, IBJ recorded ¥278.6 billion in Core Business
Profit before Transfer to General Reserve, the highest level in IBJ’s history. This result reflects good perfor-
mances from trading divisions and a reduction in expenses in a number of areas.
A breakdown of profits by business activity is as follows: Net Interest Income from domestic operations
declined by ¥3.9 billion, to ¥236.7 billion. This is attributed to a reduction in the average loan balance, despite
overall increases in loan spreads. On the other hand, net interest income from international operations increased
by ¥4.4 billion, to ¥61.5 billion. Taken together, the total net interest income amounted to ¥298.2 billion for fiscal
1998, a small increase from fiscal 1997.
Net Profit related to Bonds increased by ¥21.6 billion, to ¥55.9 billion. This was the result of an increase in
gains on sales of bonds. Net Fees and Commissions declined by ¥26.4 billion, to ¥50.5 billion, mainly because of
a decrease in loan-related charges. Trading Profit amounted to ¥22.1 billion, an increase of ¥28.3 billion from the
previous year. This was a result of a timely response to market movements.
General and Administrative Expenses fell by ¥9.6 billion, to ¥156.8 billion, for fiscal 1998. This reduction was
achieved despite an increase in systems-related costs from Japan’s financial Big Bang, Y2K compliance measures,
and re-orientation. Savings were obtained by reducing directors’ salaries, lowering staff bonuses, and cutting
special allowances and entertainment costs. Transfer to General Reserve for Possible Loan Losses increased by
¥52.5 billion, to ¥66.5 billion, since a more conservative standard for estimating possible losses was established
in accordance with guidelines laid down by the Financial Supervisory Agency and the Financial Reconstruction
Commission.
Fin
anci
al S
ecti
on
52
Management’s Discussion and Analysis

Finan
cial Section
53
Despite Core Business Profit of ¥212.0 billion, IBJ recorded a Loss before Income Taxes of ¥345.4 billion, the
second consecutive year of Net Loss. The loss resulted from the large-scale loan losses based on the adoption of
conservative standards. In dealing with non-performing loans, IBJ conformed to Standards for Self-Assessments
of Assets and Standards for Write-offs and Provisions, which were internally established in conformity with the
Accounting Standards for Banks. In accordance with these standards, IBJ charged to income for non-performing
loans totaling ¥857.8 billion (¥924.3 billion, when combined with Transfer to General Reserve for Possible Loan
Losses).
The ¥857.8 billion charges include Transfer to Reserve for Possible Loan Losses of ¥656.2 billion, consisting of
¥603.6 billion for the transfer to the specific reserve for possible loan losses based on overall solvency analysis,
¥44.0 billion for the reserve for possible losses on claims sold to the Cooperative Credit Purchasing Company,
Limited (“CCPC”), and ¥8.6 billion for the specific reserve for loans to borrowers in restructuring countries.
Losses related to the disposal of unrecoverable loans totaled ¥201.5 billion, consisting of ¥138.9 billion in
forgiveness of claims, ¥2.1 billion in losses on sales of claims to the CCPC, and ¥60.4 billion in losses from bulk
sales of loans.
Net Profit related to Stocks in fiscal 1998 rose ¥250.2 billion from fiscal 1997, to ¥318.1 billion. This is due to a
decrease in the devaluation of stocks caused by the change in accounting policy for listed securities from the lower
of cost or market method to the cost method. Net Profit related to Stocks consists of the net of gains on sales of
stocks, losses on sales of stocks, and losses on devaluation of stocks. In addition, IBJ recorded ¥7.4 billion from
Gains on Sales of Premises and Equipment.
IBJ incurred a Net Loss of ¥195.7 billion, the second consecutive annual Net Loss. The adoption of the balance-
sheet method of accounting for income taxes resulted in an Income Taxes Benefit of ¥149.6 billion.
� Summary of Non-Consolidated Statements of Income(in billions of yen)
Fiscal 1998 (a) Fiscal 1997 (b) Fiscal 1996 (a)–(b)
Net Interest Income:Domestic Operations ¥ 236.7 ¥ 240.6 ¥248.8 ¥ (3.9)International Operations 61.5 57.1 87.6 4.4
Net Profit (Loss) related to Bonds 55.9 34.3 (5.2) 21.6Net Fees and Commissions 50.5 76.9 36.9 (26.4)Trading Profit (Loss) 22.1 (6.2) — 28.3Gains on Foreign Exchange Transactions 16.6 11.7 16.2 4.9Other Core Business Profit (Loss) (3.1) 3.7 9.2 (6.8)
Gross Core Business Profit 440.3 418.2 393.7 22.1General and Administrative Expenses:
Personnel Expenses 68.0 74.3 72.9 6.3 Others 87.7 91.1 84.3 3.4
Debenture Cost 5.9 8.0 10.6 2.1
Core Business Profit before Transfer to General Reserve 278.6 244.7 225.8 33.9Transfer to General Reserve for Possible Loan Losses 66.5 14.0 21.1 52.5
Core Business Profit 212.0 230.6 204.6 (18.6)Funding Cost of Money Trusts 13.5 20.5 32.9 (7.0)Loan Losses 857.8 633.8 261.2 224.0Net Profit related to Stocks 318.1 67.9 103.1 250.2Others (4.2) 14.1 27.6 (18.2)
Income (Loss) before Income Taxes (345.4) (341.7) 41.2 (3.6)Income Taxes Expense (Benefit) (149.6) 0.1 0.1 (149.8)
Net Income (Loss) ¥(195.7) ¥(341.9) ¥ 41.1 ¥146.2
Management’s Discussion and Analysis

Fin
anci
al S
ecti
on
54
� Loan Losses (in billions of yen)
Fiscal 1998 (a) Fiscal 1997 (b) (a)–(b)
Written-off Claims ¥138.9 ¥ 61.1 ¥ 77.8Transfer to Specific Reserve for Possible Loan Losses 603.6 530.3 73.3Transfer to Reserve for Loans to Restructuring Countries 8.6 — 8.6Transfer to Reserve for Contingent Losses relating to Loans Sold to CCPC 44.0 15.8 28.2Losses on Sales of Loans to CCPC 2.1 17.3 (15.2)Other Losses on Sales of Loans 60.4 9.1 51.3
Subtotal 857.8 633.8 224.0Transfer to General Reserve for Possible Loan Losses 66.5 14.0 52.5
Total ¥924.3 ¥647.8 ¥276.5
Balance Sheet Analysis
IBJ GroupTotal assets at March 31, 1999, amounted to ¥46,166.4 billion. This was a ¥3,063.3 billion decrease from March 31,
1998. The decrease was caused in part by a depreciation in the value of foreign currency assets resulting from a
stronger yen exchange rate. Assets related to repo transactions by IBJ also decreased. Repo transactions repre-
sent lending and the borrowing of bonds against the cash collateral.
Loans and Bills Discounted declined to ¥23,327.9 billion. Trading Assets rose by ¥262.7 billion, to ¥3,729.0 bil-
lion. This was the result of an increase in IBJ’s trading assets and the introduction of the mark-to-market valua-
tion at a domestic securities subsidiary. Deferred Tax Assets rose by ¥114.2 billion, to ¥400.1 billion. This was the
result of charges relating to non-performing loans by IBJ which gave rise to deductible temporary differences.
Other Assets totaled ¥3,923.2 billion, down ¥1,610.2 billion from the previous year’s level. The main reason for
this was a decrease in assets related to IBJ’s repo transactions, as explained above.
Liabilities totaled ¥44,308.9 billion, down by ¥3,600.7 billion from the previous year-end. The decline was
mainly caused by decreases in borrowed securities related to repo transactions, debentures, and deposits by IBJ.
This decline is related to IBJ’s asset-liability management. Minority Interests in Consolidated Subsidiaries, which
was previously included in Liabilities, now appears as a separate item after Liabilities and before Shareholders’
Equity in the balance sheets.
Shareholders’ Equity totaled ¥1,561.3 billion. This was an increase of ¥241.3 billion from the previous year’s
level. The main reasons for the increase were the issuances of Preferred Stock and Common Stock.
Management’s Discussion and Analysis

Finan
cial Section
55
� Summary of Consolidated Balance Sheets (in billions of yen)
March 31, 1999 (a) March 31, 1998 (b) March 31, 1997 (a)–(b)
Total Assets ¥46,166.4 ¥49,229.7 ¥46,966.9 ¥(3,063.3)Trading Assets 3,729.0 3,466.2 — 262.7Investment Securities 8,942.1 8,847.2 6,808.0 94.9Loans and Bills Discounted 23,327.9 24,001.4 25,518.4 (673.5)Deferred Tax Assets 400.1 285.9 126.8 114.2
Total Liabilities 44,308.9 47,909.7 45,422.9 (3,600.7)Debentures 20,461.8 20,840.9 22,137.5 (379.0)Deposits 8,116.3 10,053.5 10,871.3 (1,937.2)Trading Liabilities 2,854.9 2,286.9 — 567.9Minority Interests in Consolidated Subsidiaries — 135.2 3.2 (135.2)
Minority Interests in Consolidated Subsidiaries 296.0 296.0Shareholders’ Equity 1,561.3 1,320.0 1,543.9 241.3
Total Liabilities, Minority Interests in ConsolidatedSubsidiaries and Shareholders’ Equity ¥46,166.4 ¥49,229.7 ¥46,966.9 ¥(3,063.3)
IBJ OnlyTotal assets fell by ¥3,051.5 billion, to ¥42,089.3 billion. The decrease was caused partly by a sharp increase in the
value of the yen from the fiscal 1997 level. A second major factor was a decrease of ¥2,296.2 billion in Other
Assets, including collateral related to repo transactions, which decreased by ¥1,111.4 billion. Repo transactions
represent lending and borrowing of bonds against cash collateral. The decrease in repo transactions will reduce
the balances for “Cash Placed as Collateral on Securities Borrowed” and “Securities in Custody”, both of which
are in Other Assets.
Loans and Bills Discounted totaled ¥22,872.0 billion, a decrease of ¥369.5 billion from the previous year’s level.
The decline was caused partly by the impact of yen appreciation on foreign currency loans and the securitiza-
tion of certain loan assets. Also, to improve the quality of assets, IBJ sold or otherwise disposed of non-perform-
ing loans. However, IBJ remains committed to meeting the need for funds from financially sound customers.
On the basis of the Bank of Japan (BOJ)’s industrial-sector definitions, loans to the finance and insurance
industry totaled ¥3,990.3 billion, or 19.6% of all loans issued by IBJ’s domestic offices. This rather high ratio
includes loans to finance companies of IBJ’s customers in such industries as electrical machinery, steel, automo-
biles, and trading. These companies are classified by the BOJ as part of the financial sector.
IBJ’s Investment Securities portfolio was ¥9,024.5 billion, up by ¥324.9 billion from the previous year’s level.
This includes unrealized gains on listed securities of ¥12.3 billion. Assets related to trading transactions totaled
¥2,197.0 billion, an increase of ¥77.4 billion from the previous year-end. It includes positions in derivative finan-
cial instruments, such as interest rate swaps designed to meet customers’ needs as well as to seek short-term
gains. IBJ applies the mark-to-market valuation for these positions.
As explained previously, IBJ adopted the balance-sheet method of accounting for income taxes in fiscal 1998.
This resulted in the recognition of Deferred Tax Assets amounting to ¥406.2 billion.
Liabilities fell by ¥3,608.6 billion, to ¥40,465.3 billion. Debentures fell by ¥372.9 billion, to ¥19,866.8 billion,
as a result of a decline in the issuance of debentures. The balances for outstanding coupon debentures and dis-
count debentures were ¥14,067.8 billion and ¥5,799.0 billion, respectively. Deposits totaled ¥8,175.0 billion. This
figure includes certificates of deposit, which totaled ¥2,482.6 billion. Trading Liabilities totaled ¥1,465.1 billion.
Securities borrowed included in Other Liabilities decreased by ¥1,099.3 billion. This resulted from the decline
in repo transactions as mentioned above.
Presentation of land revaluation was changed in accordance with the revision of the Land Revaluation Law.
At March 31, 1998, Surplus from Land Revaluation was included in Liabilities. At March 31, 1999, the income
tax liability portion of the surplus of ¥72.5 billion is presented as Deferred Tax Liabilities related to Land
Revaluation and is included in Liabilities. The remaining balance of ¥98.9 billion is presented as Surplus from
Land Revaluation and is included in Shareholders’ Equity.
Management’s Discussion and Analysis

Fin
anci
al S
ecti
on
56
Shareholders’ Equity increased by ¥557.0 billion, to ¥1,623.9 billion, in fiscal 1998. This increase is attributed
to the following: the issuance of preferred stock to the Resolution and Collection Bank for ¥350.0 billion; the
issuance of common stock to Dai-Ichi Mutual Life Insurance Company for ¥67.0 billion; the adoption of the
balance sheet method of accounting for income taxes with the cumulative effect of a change in accounting of
¥256.4 billion; the reclassification from liabilities of Surplus from Land Revaluation of ¥98.9 billion; and Net
Loss of ¥195.7 billion, due, in large part, to the charges of non-performing loans for ¥857.8 billion.
� Summary of Non-Consolidated Balance Sheets(in billions of yen)
March 31, 1999 (a) March 31, 1998 (b) March 31, 1997 (a)–(b)
Total Assets ¥42,089.3 ¥41,140.8 ¥43,450.0 ¥(3,051.5)Trading Assets 2,197.0 2,119.6 — 77.4 Investment Securities 9,024.5 8,699.6 6,827.6 324.9Loans and Bills Discounted 22,872.0 23,241.5 24,713.5 (369.5)
Total Liabilities 40,465.3 44,073.9 42,019.5 (3,608.6)Debentures 19,866.8 20,239.7 21,559.6 (372.9)Deposits 8,175.0 10,139.9 10,716.2 (1,964.8)Trading Liabilities 1,465.1 1,738.7 — (273.6)
Shareholders’ Equity 1,623.9 1,066.9 1,430.5 557.0
Total Liabilities and Shareholders’ Equity ¥42,089.3 ¥45,140.8 ¥43,450.0 ¥(3,051.5)
Loans under Special Risk Review
IBJ GroupThe total balance of Loans under Special Risk Review reached ¥1,771.4 billion. This figure consists of the follow-
ing four categories.
(1) Bankruptcy Loans
Nonaccrual loans to borrowers who are legally bankrupt as defined in Articles 96-1-3 and 4 of the Japanese
Tax Law Enforcement Regulation (Article 97 of 1965 Cabinet Order)
(2) Nonaccrual Loans
Nonaccrual loans other than (i) Bankruptcy Loans and (ii) loans for which payments of interest are deferred in
order to assist or facilitate the restructuring of borrowers in financial difficulties
(3) Accruing Loans Past Due 3 Months or More
Accruing Loans for which payments of principal or interests are past due for more than 3 months. Bankruptcy
Loans and Nonaccrual Loans, both of which are non-accruing, are not included in this category.
(4) Restructured Loans
Loans on which contracts were amended in favor of borrowers (e.g., the reduction of or exemption from
stated interest, the deferral of interest payments, the extension of maturity dates, the renunciation of claims)
in order to assist or facilitate the restructuring of borrowers in financial difficulties
� Loans under Special Risk Review(in billions of yen)
March 31, 1999
Bankruptcy Loans ¥ 46.8
Nonaccrual Loans 1,160.9
Accruing Loans Past Due 3 Months or More 8.9
Restructured Loans 554.6
Total ¥1,771.4
Note: Bankruptcy Loans and Nonaccrual Loans are net of uncollectable portion. The deducted amounts from Bankruptcy Loans andNonaccrual Loans at March 31, 1999, were ¥100.9 billion and ¥146.2 billion, respectively.
Management’s Discussion and Analysis

This disclosure includes loans that require a certain degree of special risk review but do not raise concern as to
recovery of the principal. Accordingly, not all of the loans in these categories are non-performing.
Reserves at March 31, 1999, for all claims are shown in the following table:
� Reserve for Possible Loan Losses (in billions of yen)
March 31, 1999
General Reserve for Possible Loan Losses ¥ 189.1
Specific Reserve for Possible Loan Losses 870.0
Reserve for Loans to Restructuring Countries 7.5
Total ¥1,066.7
IBJ Only
� Loans under Special Risk Review(in billions of yen)
March 31, 1999 (a) March 31, 1998 (b) (a)–(b)
Bankruptcy Loans ¥ 45.2 ¥ 64.2 ¥ (19.0)Nonaccrual Loans 1,236.0 209.5 1,026.4Accruing Loans Past Due 3 Months or More 8.4 14.5 (6.0)Restructured Loans 554.4 820.6 (266.2)
Total ¥1,844.1 ¥1,109.0 ¥ 735.1
Note: Bankruptcy Loans and Nonaccrual Loans are net of uncollectable portion.The deducted amounts from Bankruptcy Loans at March 31, 1999 and 1998 were ¥100.9 billion and ¥235.4 billion, respectively.The deducted amounts from Nonaccrual Loans at March 31, 1999 and 1998 were ¥146.2 billion and ¥225.0 billion, respectively.
In previous years, IBJ accrued interest income on loans until principal payments became overdue beyond final
maturity or interest payments became more than six months past due regardless of the borrower’s financial con-
dition. Starting in fiscal 1998, loans are classified as nonaccrual if the borrowers are determined to be Insolvent,
Unrecoverable or To Be Insolvent based on the result of self-assessment, regardless of whether the loan is
overdue or not.
� Ratio of Loans and Bills Discounted(in billions of yen)
March 31, 1999 (a) March 31, 1998 (b) (a)–(b)
Balance of Loans and Bills Discounted ¥22,624.8 ¥22,781.1 ¥ (156.2)Average Balance of Loans and Bills Discounted 23,026.7 25,012.5 (1,985.8)
Ratio to Balance of Loans and Bills Discounted 8.2% 4.9% 3.3%Ratio to Average Balance of Loans and Bills Discounted 8.0% 4.4% 3.6%
Note: Figures are net of uncollectable portion.
� Reserve Ratio(in billions of yen)
March 31, 1999 (a) March 31, 1998 (b) (a)–(b)
Reserve Ratio (before net of uncollectable portion) 53.4% 57.3% (3.9%)Reserve Ratio (after net of uncollectable portion) 45.8% 39.6% 6.2%
Reserve for Possible Loan Losses(after net of uncollectable portion) ¥843.8 ¥439.4 ¥404.3
Note: Reserve Ratio=Reserve for Possible Loan Losses/Loans under Special Risk Review
Finan
cial Section
57
Management’s Discussion and Analysis
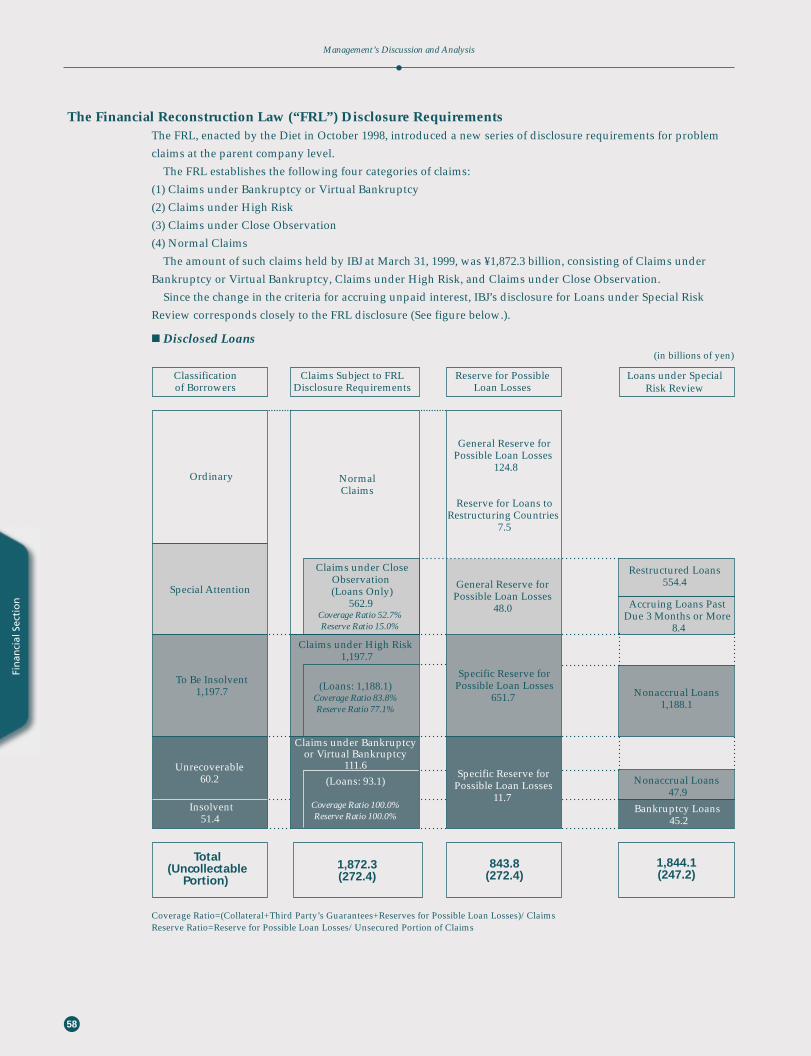
The Financial Reconstruction Law (“FRL”) Disclosure RequirementsThe FRL, enacted by the Diet in October 1998, introduced a new series of disclosure requirements for problem
claims at the parent company level.
The FRL establishes the following four categories of claims:
(1) Claims under Bankruptcy or Virtual Bankruptcy
(2) Claims under High Risk
(3) Claims under Close Observation
(4) Normal Claims
The amount of such claims held by IBJ at March 31, 1999, was ¥1,872.3 billion, consisting of Claims under
Bankruptcy or Virtual Bankruptcy, Claims under High Risk, and Claims under Close Observation.
Since the change in the criteria for accruing unpaid interest, IBJ’s disclosure for Loans under Special Risk
Review corresponds closely to the FRL disclosure (See figure below.).
� Disclosed Loans(in billions of yen)
Coverage Ratio=(Collateral+Third Party’s Guarantees+Reserves for Possible Loan Losses)/ClaimsReserve Ratio=Reserve for Possible Loan Losses/Unsecured Portion of Claims
Fin
anci
al S
ecti
on
58
Management’s Discussion and Analysis
Classificationof Borrowers
Claims Subject to FRL Disclosure Requirements
Reserve for PossibleLoan Losses
Loans under SpecialRisk Review
Ordinary
Special Attention
NormalClaims
General Reserve forPossible Loan Losses
124.8
Reserve for Loans toRestructuring Countries
7.5
Claims under CloseObservation
(Loans Only)562.9
General Reserve forPossible Loan Losses
48.0
Restructured Loans554.4
Accruing Loans PastDue 3 Months or More
8.4
To Be Insolvent1,197.7
Claims under High Risk 1,197.7
Claims under Bankruptcyor Virtual Bankruptcy
111.6
(Loans: 1,188.1)Coverage Ratio 83.8%Reserve Ratio 77.1%
(Loans: 93.1)
Coverage Ratio 100.0%Reserve Ratio 100.0%
Specific Reserve forPossible Loan Losses
651.7 Nonaccrual Loans1,188.1
Nonaccrual Loans 47.9
Specific Reserve forPossible Loan Losses
11.7
Unrecoverable 60.2
Bankruptcy Loans 45.2
Insolvent51.4
Total (Uncollectable
Portion) 1,872.3 (272.4)
843.8(272.4)
1,844.1(247.2)
Coverage Ratio 52.7%Reserve Ratio 15.0%
Finan
cial Section
59
Claims under Bankruptcy or Virtual Bankruptcy by FRL classification corresponds to the sum of Bankruptcy
Loans and Nonaccrual Loans to borrowers who are classified as Unrecoverable. Claims under High Risk by FRL
classification corresponds to Nonaccrual Loans to borrowers who are in To Be Insolvent. Claims under Close
Observation by the FRL classification corresponds to the sum of Accruing Loans Past Due 3 Months or More
and Restructured Loans.
Not all claims subject to the FRL disclosure requirements raise immediate concern as to recoverability of the
principal amounts.
IBJ significantly increased Transfer to Reserve for Possible Loan Losses in fiscal 1998. As a result, the ratios
of the reserve to the unsecured portion under the FRL classification are as follows: 100% for Claims under
Bankruptcy or Virtual Bankruptcy, 77.1% for Claims under High Risk, and 15.0% for Claims under Close
Observation. These reserve levels satisfy guidelines established by the Financial Reconstruction Commission.
In addition to providing conservative reserves for the unsecured portion of the claims, IBJ sought to increase
the secured portion. As a result, 100% of Claims under Bankruptcy or Virtual Bankruptcy, 83.8% of Claims
under High Risk, and 52.7% of Claims under Close Observation were either secured or reserved. IBJ believes
that these levels are fully adequate. Having tightened its credit risk management, IBJ believes that the losses
related to non-performing loans will decrease significantly in the future.
� Claims Subject to FRL Disclosure Requirements(in billions of yen)
March 31, 1999
Claims under Bankruptcy or Virtual Bankruptcy ¥ 111.6
Claims under High Risk 1,197.7
Claims under Close Observation 562.9
Subtotal 1,872.3
Normal Claims 25,437.5
Total ¥27,309.8
Note: Claims under Bankruptcy or Virtual Bankruptcy is net of uncollectable portion.The deducted amounts at March 31, 1999, were ¥272.4 billion.
� Reserve Ratio(in billions of yen)
March 31, 1999
Reserve Ratio (before net of uncollectable portion) 52.0%
Reserve Ratio (after net of uncollectable portion) 45.1
Reserve for Possible Loan Losses (after net of uncollectable portion) ¥843.8
Note: Reserve Ratio=Reserve for Possible Loan Losses/(Claims under Bankruptcy or Virtual Bankruptcy + Claims under High Risk + Claimsunder Close Observation)
� Coverage RatioMarch 31, 1999
Claims under Bankruptcy or Virtual Bankruptcy 100.0%
Claims under High Risk 83.8
Claims under Close Observation 52.7
Total 75.4
Note: Figures are net of uncollectable portion.Coverage Ratio=(Collateral + Third Party’s Guarantees + Reserves for Possible Loan Losses)/Claims
Management’s Discussion and Analysis

� Reserve Ratio to Unsecured PortionMarch 31, 1999
Claims under Bankruptcy or Virtual Bankruptcy 100.0%
Claims under High Risk 77.1
Claims under Close Observation 15.0
Total 60.7
Note: Figures are net of uncollectable portion.Reserve Ratio to Unsecured Portion=Reserve for Possible Loan Losses/Unsecured Portion of Claims
� Reserve Ratio to Normal ClaimsMarch 31, 1999
Claims to Special Attention Borrowers not Classified as Claims under Close Observation 3.98%
Claims to Ordinary Borrowers 0.08
Note: Reserve Ratio to Normal Claims=General Reserve for Possible Loan Losses/Claims
� Breakdown of Claims Subject to FRL Disclosure Requirements by Industries of Borrowers (in billions of yen)
March 31, 1999
Manufacturing ¥ 57.0
Construction 129.8
Finance and Insurance 153.2
Real Estate 740.1
Other Industries 712.4
Domestic Offices 1,792.7
Overseas Offices 79.6
Total ¥1,872.3
Note: Figures are net of uncollectable portion.
� Breakdown of Claims Subject to FRL Disclosure Requirements by Nationality of Borrowers(in billions of yen)
March 31, 1999
Asia ¥ 83.1
Europe* 28.5
North America 32.8
Central & South America 0.1
Overseas 144.6
Japan 1,727.7
Total ¥1,872.3
Note: Figures are net of uncollectable portion.* It includes the amount for Russia/East Europe of ¥3.2 billion.
Fin
anci
al S
ecti
on
60
Management’s Discussion and Analysis

Finan
cial Section
61
Reserves at March 31, 1999, for all claims are shown in the following table:
� Reserve for Possible Loan Losses(in billions of yen)
March 31, 1999 (a) March 31, 1998 (b) (a)–(b)
General Reserve for Possible Loan Losses ¥ 172.8 ¥106.2 ¥ 66.5 Specific Reserve for Possible Loan Losses 935.8 793.3 142.4 Reserve for Loans to Restructuring Countries 7.5 0.2 7.3
Total ¥1,116.2 ¥899.8 ¥216.3
Capital Adequacy Ratio
IBJ GroupTo ensure the stability of the world’s financial system, the BIS maintains a set of standards which require banks
to maintain capital ratios in relation to assets at a certain level. The current system includes off-balance-sheet
transaction items in the category of risk assets and is applied on a consolidated basis.
These standards incorporate risk asset ratios, the inclusion of off-balance-sheet transactions in risk assets, and
an overall evaluation on a consolidated basis. Japanese banks involved in international business have been
required to maintain a capital asset ratio of at least 8% since March 1993. The BIS standard originally identified
only credit risks. However, market risks have also been taken into consideration following the introduction of
new regulations in March 1998. Market risk includes possible losses resulting from price changes in both on-
balance-sheet and off-balance-sheet transactions.
At March 31, 1999, the IBJ Group’s capital adequacy ratio was 11.30%, compared with 10.26% at March 31,
1998. The Tier I capital adequacy ratio was 6.03%, and the Tier II capital adequacy ratio was 5.26%. Efforts were
made to strengthen capital as follows: a third-party capital allocation of ¥67.0 billion; the issuance of preferred
shares through overseas subsidiaries of ¥176.0 billion; and the issuance of subordinated bonds of ¥64.0 billion.
In addition, IBJ received ¥600.0 billion in public funds. This consisted of ¥350.0 billion of preferred stock and
¥250.0 billion of subordinated bonds. As a result, IBJ Group’s capital increased by ¥429.3 billion, to ¥3,273.4 bil-
lion, at the year-end. Within this total, Tier I capital amounted to ¥1,749.2 billion. Tier II capital totaled ¥1,524.2
billion.
Risk assets totaled ¥28,963.5 billion, an increase of ¥1,246.6 billion during the year. The increase breaks down
into the following elements: on-balance-sheet exposure increased by ¥1,435.4 billion, while off-balance-sheet
exposure decreased by ¥361.3 billion. Market risk related exposure increased by ¥172.5 billion.
Management’s Discussion and Analysis

� BIS Capital Adequacy Ratios (Uniform International Standards) (in billions of yen)
March 31, 1999 March 31, 1998 March 31, 1997
Preferred Stock ¥ 175.0
Common Stock 498.6
Capital Surplus 570.1
Retained Earnings 209.4
Minority Interests:Preferred Stocks Issued by SPCs 291.7
Others 4.3
Total Tier I Capital (A) 1,749.2 ¥ 1,444.4 ¥ 1,536.3
45% Unrealized Gains on Securities — 183.4 384.4 45% Unrealized Gains on Land Used in Business 77.1 81.2General Reserve for Possible Loan Losses 189.1 116.4 104.2 Subordinated Debt 1,257.9 1,074.6 853.6 Sub-total 1,524.2 1,455.8 1,342.2
Total Tier II Capital (B) 1,524.2 1,399.7 1,342.2 Total Tier III Capital (C) — — —
Capital (D) = (A) + (B) + (C) 3,273.4 2,844.1 2,878.6
On-Balance-Sheet Exposure 25,556.6 24,121.1 28,107.1Off-Balance-Sheet Exposure 3,023.9 3,385.3 3,723.5
Credit Risk Asset (E) 28,580.6 27,506.5 31,830.6Market Risk Related Exposure (F) 382.8 210.2
Total (G) = (E) + (F) ¥28,963.5 ¥27,716.8 ¥31,830.6
BIS Capital Adequacy Ratios (Uniform International Standards) = (D)/(G) x100 11.30% 10.26% 9.04%
Note: The components of Tier I were disclosed starting from March 31, 1999.
Fin
anci
al S
ecti
on
62
Management’s Discussion and Analysis

� Financial Derivatives and Forward Foreign Exchange(in billions of yen)
March 31, 1999 March 31, 1998 March 31, 1997
Notional Credit Notional Credit Notional Creditprincipal equivalent principal equivalent principal equivalent
amount amount amount amount amount amount
Interest Rate Swaps ¥ 89,495.7 ¥2,222.7 ¥ 77,978.2 ¥1,763.1 ¥ 67,955.4 ¥1,269.2Currency Swaps 4,633.9 454.8 6,177.5 736.7 6,140.8 647.8Forward Foreign Exchange 17,943.9 702.7 31,712.6 1,777.7 40,375.3 1,887.1Interest Rate Options (Purchased) 4,666.3 44.5 4,904.0 46.7 4,298.5 33.6Currency Options (Purchased) 3,118.9 101.2 717.5 30.1 1,620.1 90.1Other Derivative Instruments 5,680.2 49.5 5,392.3 39.1 2,515.7 4.9Impact of Master Netting Instruments — (1,242.8) — (948.1) — —
Total ¥125,593.2 ¥2,332.8 ¥126,882.3 ¥3,445.4 ¥122,906.1 ¥3,932.8
Notes: 1. Figures listed above are on a consolidated basis and are calculated in accordance with the BIS guidelines.2. In computing the credit equivalent amount, the current exposure method was used (From March 31, 1997, the original exposure
method was used in some cases.).3. The impact of netting agreements was taken into account from March 31, 1997, and was separately disclosed from March 31, 1998.4. The amounts of transactions that are excluded for capital adequacy guidelines are public exchange transactions and foreign
exchange related transactions for which the original contract has a duration of 14 days or less as shown below.
(in billions of yen)
March 31, 1999 March 31, 1998 March 31, 1997
Notional principal Notional principal Notional principalamount amount amount
Forward Foreign Exchange ¥ 3,677.1 ¥ 5,560.2 ¥ 2,342.9Interest Rate Options (Written) 18,628.0 9,898.0 14,233.9Interest Rate Options (Purchased) 10,725.7 5,647.1 8,765.2Currency Options (Written) 58.4 887.0 1,107.1Currency Options (Purchased) 57.8 1.6 16.3Other Derivative Instruments 86,959.5 83,388.6 73,956.3
Total ¥120,106.9 ¥105,382.8 ¥100,421.9
IBJ OnlyChanges in the Bank Law, which took effect on December 1, 1998, require banks involved in international trans-
actions to meet the BIS standards at the parent company and the consolidated level effective on and after March
31, 1999.
IBJ’s capital adequacy ratio at the parent company level at March 31, 1999, was 11.53%. Capital amounted to
¥3,316.0 billion, consisting of Tier I capital of ¥1,807.4 billion and Tier II capital of ¥1,508.5 billion. Risk assets
totaled ¥28,737.9 billion, consisting of credit risk assets of ¥28,516.6 billion and market risk equivalents of
¥221.2 billion.
Core capital of ¥1,807.4 billion includes Preferred Stock of ¥175.0 billion, Common Stock of ¥498.6 billion,
Capital Surplus of ¥570.1 billion, Legal Reserve of ¥82.2 billion, and Retained Earnings of ¥189.8 billion, and
preferred shares issued by overseas special-purpose companies (SPCs) totaled ¥291.7 billion.
Finan
cial Section
63
Management’s Discussion and Analysis

Fin
anci
al S
ecti
on
64
(in thousands of(in millions of yen) U.S. dollars)
March 31, 1999 March 31, 1998 March 31, 1999
AssetsCash and Due from Banks (Note 2) ¥ 806,910 ¥ 553,203 $ 6,693,579Call Loans and Bills Purchased 2,712,690 3,646,837 22,502,621Commercial Paper and Other Debt Purchased 133,008 14,491 1,103,345Trading Assets (Notes 1 (d) and 3) 3,729,005 3,466,255 30,933,268Money Held in Trust (Note 33) 54,331 171,157 450,694Investment Securities (Notes 1 (e), 4 and 32) 8,942,151 8,847,249 74,177,945Loans and Bills Discounted (Note 5) 23,327,907 24,001,429 193,512,295Foreign Exchanges (Note 6) 290,585 373,592 2,410,502Other Assets (Note 7) 3,923,235 5,533,487 32,544,465Premises and Equipment (Notes 1 (g) and 8) 313,726 295,762 2,602,460Deferred Debenture Charges (Note 9) 16,055 15,994 133,185Deferred Tax Assets (Note 10) 400,198 285,987 3,319,774Customers’ Liabilities for Acceptances and Guarantees (Note 18) 1,516,602 2,024,337 12,580,692
Total Assets ¥46,166,409 ¥49,229,785 $382,964,825
(in thousands of(in millions of yen) U.S. dollars)
March 31, 1999 March 31, 1998 March 31, 1999
Liabilities, Minority Interestsin Consolidated Subsidiaries and Shareholders’ Equity
LiabilitiesDebentures (Note 11) ¥20,461,865 ¥20,840,941 $169,737,583Deposits (Note 12) 8,116,321 10,053,551 67,327,432Call Money and Bills Sold 4,857,493 4,251,988 40,294,431Commercial Paper 30,000 — 248,859Borrowed Money (Note 13) 1,390,208 1,804,335 11,532,213Trading Liabilities (Notes 1 (d) and 3) 2,854,950 2,286,959 23,682,709Foreign Exchanges (Note 6) 23,399 12,953 194,102Other Liabilities (Note 14) 3,810,402 5,325,539 31,608,486Reserve for Possible Loan Losses (Note 15) 1,066,714 922,235 8,848,732Reserve for Retirement Allowances 53,088 50,802 440,385Reserve for Contingent Losses relating to Loans Sold 48,144 19,776 399,371Other Reserves (Note 16) 29 478 244Deferred Tax Liabilities (Note 10) 7,245 — 60,101Deferred Tax Liabilities related to Land Revaluation (Note 8) 72,518 — 601,564Minority Interests in Consolidated Subsidiaries (Notes 1 (n) and 17) — 135,218 —Acceptances and Guarantees (Note 18) 1,516,602 2,024,337 12,580,692Surplus from Land Revaluation (Note 1 (g)) — 180,648 —
Total Liabilities 44,308,984 47,909,766 367,556,904
Minority Interests in Consolidated Subsidiaries (Notes 1 (n) and 17) 296,074 — 2,456,033
Shareholders’ EquityPreferred Stock (Note 19) 175,000 — 1,451,680Common Stock (Note 20) 498,605 465,105 4,136,087Capital Surplus 570,132 361,632 4,729,424Surplus from Land Revaluation (Note 8) 98,920 — 820,574Retained Earnings (Note 21) 218,694 493,287 1,814,142Treasury Stock (2) (5) (19)
Total Shareholders’ Equity 1,561,350 1,320,019 12,951,888
Total Liabilities, Minority Interests in Consolidated Subsidiaries and Shareholders’ Equity ¥46,166,409 ¥49,229,785 $382,964,825
See accompanying “Notes to Consolidated Financial Statements" which are an integral part of these statements.
Consolidated Balance Sheets

(in thousands of(in millions of yen) U.S. dollars)
Fiscal 1998* Fiscal 1997* Fiscal 1996* Fiscal 1998*
IncomeInterest Income (Note 22) ¥1,974,674 ¥2,305,998 ¥2,518,077 $16,380,545Fees and Commissions 97,505 122,849 75,276 808,836Trading Income (Note 23) 53,936 9,467 — 447,420Other Operating Income (Note 24) 854,050 473,434 563,997 7,084,614Other Income (Note 25) 406,143 397,938 245,997 3,369,088Transfer from Other Reserves 450 12,213 0 3,735
Total Income 3,386,760 3,321,902 3,403,347 28,094,239
ExpenseInterest Expense (Note 22) 1,645,753 1,981,009 2,142,314 13,652,042Amortization of Debenture Discounts 27,117 34,952 52,401 224,948Fees and Commissions 14,264 19,738 18,068 118,330Trading Expense (Note 23) — 8,452 — —Other Operating Expense (Note 26) 794,768 431,913 539,661 6,592,850General and Administrative Expenses 222,792 217,453 202,847 1,848,132Other Expense (Note 27) 938,295 941,497 402,544 7,783,459Transfer to Other Reserves 0 3 1,031 8
Total Expense 3,642,993 3,635,020 3,358,870 30,219,769
Income (Loss) before Income Taxes and Others (256,232) (313,118) 44,477 (2,125,530)Income Taxes Expense (Benefit) (Note 28):
Current 10,816 3,935 5,628 89,727Deferred (94,093) (114,695) 25,049 (780,537)
Minority Interests in Net Income 8,321 169 1,137 69,028Amortization of Consolidation Difference (Note 1 (n)) — 131 (76) —
Net Income (Loss) ¥ (181,276) ¥ (202,660) ¥ 12,740 $ (1,503,748)
Per Common Stock (Note 29) (in yen) (in U.S. dollars)
Net Income (Loss) ¥ (70.64) ¥ (79.80) ¥ 5.24 $ (0.586)Cash Dividends 7.00 8.50 8.50 0.058
See accompanying “Notes to Consolidated Financial Statements" which are an integral part of these statements.* Fiscal 1998, 1997 and 1996 represent the fiscal years ended March 31, 1999, 1998 and 1997, respectively.
Finan
cial Section
65
Consolidated Statements of Income
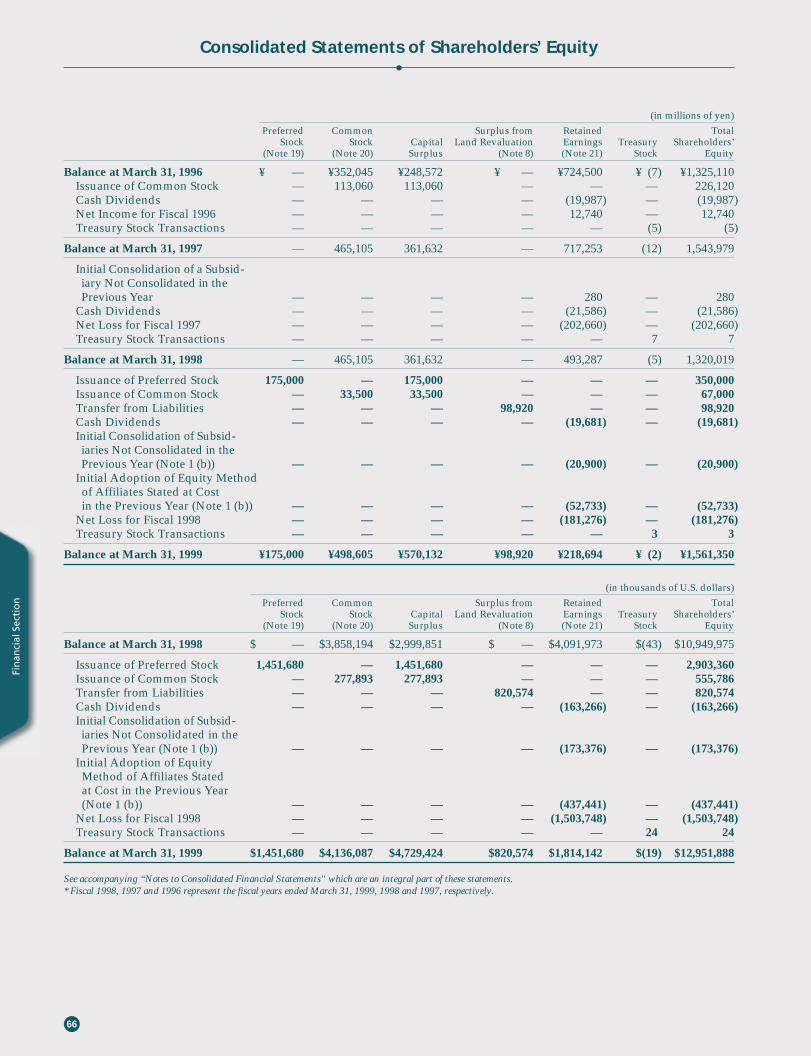
Fin
anci
al S
ecti
on
66
(in millions of yen)
Preferred Common Surplus from Retained TotalStock Stock Capital Land Revaluation Earnings Treasury Shareholders’
(Note 19) (Note 20) Surplus (Note 8) (Note 21) Stock Equity
Balance at March 31, 1996 ¥ — ¥352,045 ¥248,572 ¥ — ¥724,500 ¥ (7) ¥1,325,110Issuance of Common Stock — 113,060 113,060 — — — 226,120Cash Dividends — — — — (19,987) — (19,987)Net Income for Fiscal 1996 — — — — 12,740 — 12,740Treasury Stock Transactions — — — — — (5) (5)
Balance at March 31, 1997 — 465,105 361,632 — 717,253 (12) 1,543,979
Initial Consolidation of a Subsid-iary Not Consolidated in thePrevious Year — — — — 280 — 280
Cash Dividends — — — — (21,586) — (21,586)Net Loss for Fiscal 1997 — — — — (202,660) — (202,660)Treasury Stock Transactions — — — — — 7 7
Balance at March 31, 1998 — 465,105 361,632 — 493,287 (5) 1,320,019
Issuance of Preferred Stock 175,000 — 175,000 — — — 350,000Issuance of Common Stock — 33,500 33,500 — — — 67,000Transfer from Liabilities — — — 98,920 — — 98,920Cash Dividends — — — — (19,681) — (19,681)Initial Consolidation of Subsid-iaries Not Consolidated in thePrevious Year (Note 1 (b)) — — — — (20,900) — (20,900)
Initial Adoption of Equity Methodof Affiliates Stated at Costin the Previous Year (Note 1 (b)) — — — — (52,733) — (52,733)
Net Loss for Fiscal 1998 — — — — (181,276) — (181,276)Treasury Stock Transactions — — — — — 3 3
Balance at March 31, 1999 ¥175,000 ¥498,605 ¥570,132 ¥98,920 ¥218,694 ¥ (2) ¥1,561,350
(in thousands of U.S. dollars)
Preferred Common Surplus from Retained TotalStock Stock Capital Land Revaluation Earnings Treasury Shareholders’
(Note 19) (Note 20) Surplus (Note 8) (Note 21) Stock Equity
Balance at March 31, 1998 $ — $3,858,194 $2,999,851 $ — $4,091,973 $(43) $10,949,975
Issuance of Preferred Stock 1,451,680 — 1,451,680 — — — 2,903,360Issuance of Common Stock — 277,893 277,893 — — — 555,786Transfer from Liabilities — — — 820,574 — — 820,574Cash Dividends — — — — (163,266) — (163,266)Initial Consolidation of Subsid-iaries Not Consolidated in thePrevious Year (Note 1 (b)) — — — — (173,376) — (173,376)
Initial Adoption of EquityMethod of Affiliates Stated at Cost in the Previous Year(Note 1 (b)) — — — — (437,441) — (437,441)
Net Loss for Fiscal 1998 — — — — (1,503,748) — (1,503,748)Treasury Stock Transactions — — — — — 24 24
Balance at March 31, 1999 $1,451,680 $4,136,087 $4,729,424 $820,574 $1,814,142 $(19) $12,951,888
See accompanying “Notes to Consolidated Financial Statements" which are an integral part of these statements.* Fiscal 1998, 1997 and 1996 represent the fiscal years ended March 31, 1999, 1998 and 1997, respectively.
Consolidated Statements of Shareholders’ Equity
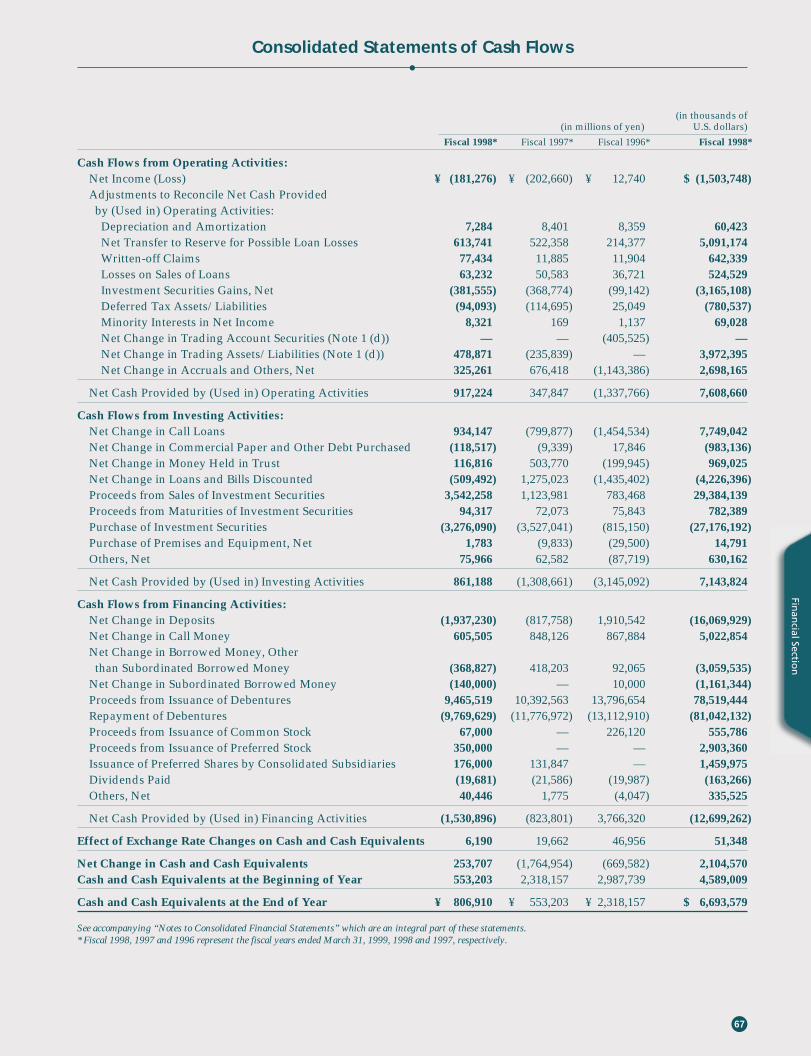
Finan
cial Section
67
(in thousands of(in millions of yen) U.S. dollars)
Fiscal 1998* Fiscal 1997* Fiscal 1996* Fiscal 1998*
Cash Flows from Operating Activities:Net Income (Loss) ¥ (181,276) ¥ (202,660) ¥ 12,740 $ (1,503,748)Adjustments to Reconcile Net Cash Provided by (Used in) Operating Activities: Depreciation and Amortization 7,284 8,401 8,359 60,423Net Transfer to Reserve for Possible Loan Losses 613,741 522,358 214,377 5,091,174Written-off Claims 77,434 11,885 11,904 642,339Losses on Sales of Loans 63,232 50,583 36,721 524,529Investment Securities Gains, Net (381,555) (368,774) (99,142) (3,165,108)Deferred Tax Assets/Liabilities (94,093) (114,695) 25,049 (780,537)Minority Interests in Net Income 8,321 169 1,137 69,028Net Change in Trading Account Securities (Note 1 (d)) — — (405,525) —Net Change in Trading Assets/Liabilities (Note 1 (d)) 478,871 (235,839) — 3,972,395Net Change in Accruals and Others, Net 325,261 676,418 (1,143,386) 2,698,165
Net Cash Provided by (Used in) Operating Activities 917,224 347,847 (1,337,766) 7,608,660
Cash Flows from Investing Activities:Net Change in Call Loans 934,147 (799,877) (1,454,534) 7,749,042Net Change in Commercial Paper and Other Debt Purchased (118,517) (9,339) 17,846 (983,136)Net Change in Money Held in Trust 116,816 503,770 (199,945) 969,025Net Change in Loans and Bills Discounted (509,492) 1,275,023 (1,435,402) (4,226,396)Proceeds from Sales of Investment Securities 3,542,258 1,123,981 783,468 29,384,139Proceeds from Maturities of Investment Securities 94,317 72,073 75,843 782,389Purchase of Investment Securities (3,276,090) (3,527,041) (815,150) (27,176,192)Purchase of Premises and Equipment, Net 1,783 (9,833) (29,500) 14,791Others, Net 75,966 62,582 (87,719) 630,162
Net Cash Provided by (Used in) Investing Activities 861,188 (1,308,661) (3,145,092) 7,143,824
Cash Flows from Financing Activities:Net Change in Deposits (1,937,230) (817,758) 1,910,542 (16,069,929)Net Change in Call Money 605,505 848,126 867,884 5,022,854Net Change in Borrowed Money, Other than Subordinated Borrowed Money (368,827) 418,203 92,065 (3,059,535)
Net Change in Subordinated Borrowed Money (140,000) — 10,000 (1,161,344)Proceeds from Issuance of Debentures 9,465,519 10,392,563 13,796,654 78,519,444Repayment of Debentures (9,769,629) (11,776,972) (13,112,910) (81,042,132)Proceeds from Issuance of Common Stock 67,000 — 226,120 555,786Proceeds from Issuance of Preferred Stock 350,000 — — 2,903,360Issuance of Preferred Shares by Consolidated Subsidiaries 176,000 131,847 — 1,459,975Dividends Paid (19,681) (21,586) (19,987) (163,266)Others, Net 40,446 1,775 (4,047) 335,525
Net Cash Provided by (Used in) Financing Activities (1,530,896) (823,801) 3,766,320 (12,699,262)
Effect of Exchange Rate Changes on Cash and Cash Equivalents 6,190 19,662 46,956 51,348
Net Change in Cash and Cash Equivalents 253,707 (1,764,954) (669,582) 2,104,570Cash and Cash Equivalents at the Beginning of Year 553,203 2,318,157 2,987,739 4,589,009
Cash and Cash Equivalents at the End of Year ¥ 806,910 ¥ 553,203 ¥ 2,318,157 $ 6,693,579
See accompanying “Notes to Consolidated Financial Statements” which are an integral part of these statements.* Fiscal 1998, 1997 and 1996 represent the fiscal years ended March 31, 1999, 1998 and 1997, respectively.
Consolidated Statements of Cash Flows

Fin
anci
al S
ecti
on
68
1. Basis of Presentation and Summary of Significant Accounting PoliciesThe Industrial Bank of Japan, Limited (“IBJ”) is a long-term credit bank under the Long-Term Credit Bank Law
in Japan, providing global financial services together with its subsidiaries (“IBJ Group”) . The subsidiaries of IBJ
includes IBJ Securities Co., Ltd. (a domestic corporation) , IBJ Trust and Banking Co., Ltd. (a domestic corpora-
tion), The Industrial Bank of Japan Trust Company (a U.S. corporation), IBJ Whitehall Bank & Trust Company (a
U.S. corporation, formerly IBJ Schroder Bank & Trust Company), Aubrey G. Lanston & Co. Inc. and IBJ
International plc (a U.K. corporation).
(a) Basis of Presentation: The accompanying consolidated financial statements have been prepared from the
accounts maintained by IBJ and its consolidated subsidiaries in accordance with the provisions set forth in the
Japanese Commercial Code (the “Code”) and in conformity with accounting principles and practices generally
accepted in Japan, such as the Accounting Standards for Banks as prescribed by the Japanese Bankers Association
(the “Accounting Standards for Banks”), which are different in certain respects as to application and disclosure
requirements of International Accounting Standards.
Certain items presented in the consolidated financial statements filed with the Ministry of Finance (the
“MOF”) in Japan are reclassified for the convenience of readers outside Japan. In addition, the Consolidated
Statements of Shareholders’ Equity and the Consolidated Statements of Cash Flows are prepared and included
in consolidated financial statements, though they are not required to be filed with the MOF. In place of the Con-
solidated Statements of Shareholders’ Equity, the Consolidated Statements of Retained Earnings are filed with
the MOF, the information of which are all included in the Consolidated Statements of Shareholders’ Equity.
The amounts indicated in millions of yen are rounded down by truncating the figures below one million.
Totals may not add up exactly because of such truncation.
The consolidated financial statements are not intended to present the consolidated financial position, results
of operations and cash flows in accordance with accounting principles and practices generally accepted in coun-
tries and jurisdictions other than Japan.
Amounts in U.S. dollars are included solely for the convenience of readers outside Japan. The rate of ¥120.55 =
US$1.00, the rate of exchange on March 31, 1999, has been used in translation. The inclusion of such amounts
is not intended to imply that Japanese yen has been or could be readily converted, realized or settled into U.S.
dollars at that rate or any other rate.
(b) Principles of Consolidation: The consolidated financial statements include the accounts of IBJ and its
subsidiaries. The number of the consolidated subsidiaries for fiscal 1998, 1997 and 1996 was 67, 42 and
36, respectively.
Investments in affiliates, except for those immaterial to the consolidated financial statements which are car-
ried at cost, are accounted for under the equity method. The number of the affiliates being accounted for under
the equity method was 14 for fiscal 1998. No affiliate was accounted for under the equity method for fiscal 1997
and 1996. These investments are included in Investment Securities, and the net loss from these investments is
included in Other Expense.
In fiscal 1998, in determining subsidiaries and affiliates, IBJ has adopted “Implementation Guideline on
Revised Definition of Subsidiaries and Affiliates under Reporting System of Consolidated Financial Statements”
issued by the Business Accounting Deliberation Council in Japan in October 30, 1998 . Under this new guideline,
companies controlled by IBJ are accounted for as subsidiaries regardless of the ownership percentage by IBJ,
and companies influenced by IBJ in material degree on their financial and operating or business policies through
investment, personnel, finance, technology, trading or other relationship, are accounted for as affiliates regard-
less of the ownership percentage by IBJ. Before fiscal 1997, IBJ determined subsidiaries and affiliates only
by ownership.
Notes to Consolidated Financial Statements

Finan
cial Section
69
Any difference between the cost of an investment in a subsidiary and the amount of underlying equity in net
assets of the subsidiary is allocated to the applicable accounts, where identifiable, and the remaining portion is
charged or credited to income, as the case may be, in the year in which it occurs.
All material intercompany transactions, account balances and unrealized profits have been eliminated in
consolidation.
The majority of domestic subsidiaries are consolidated based on the fiscal years ended March 31, and the
majority of foreign subsidiaries are consolidated based on the fiscal years ended December 31.
(c) Cash Flows: For the purpose of the Consolidated Statements of Cash Flows, Cash and Cash Equivalents consists
of Cash and Due from Banks on the Consolidated Balance Sheets.
(d) Trading Assets and Liabilities: From fiscal 1997, trading transactions intended to take advantage of short-term
fluctuations and arbitrage in interest rates, currency exchange rates, market prices of securities and related
indices are recognized on the transaction date basis and recorded in Trading Assets or Trading Liabilities on the
Consolidated Balance Sheets.
Securities and other short-term credit instruments held for trading purposes are stated at fair value at the
balance sheet date. Derivative financial products such as swaps, forward contracts and option transactions are
stated at their hypothetical termination values, assuming that such transactions were terminated and settled
at the balance sheet date.
Trading Income and Trading Expense are recorded as interest income or expense actually paid or received plus:
Marketable securities and commercial paper
The difference in valuation gains or losses between the beginning balance and the ending balance; or
Derivative financial products
The difference in hypothetical settlement gains or losses between the beginning balance and the ending
balance
In fiscal 1997, IBJ modified the format for its consolidated financial statements in accordance with the revision
of the Enforcement Regulation of the Long-Term Credit Bank Law.
The format for the Consolidated Statements of Income for fiscal 1998 and 1997 was modified as follows:
(1) “Trading Income” and “Trading Expense” included the following income or expense from Trading
Securities:
(i) Gains or losses on sales and losses on devaluation of Trading Securities, previously included in “Other
Operating Income” or “Other Operating Expense”
(ii) Interest and dividends received from Trading Securities, previously included in “Interest and
Dividends on Securities”
(iii) Interest expense on Trading Securities, previously included in “Interest Expense on Others”
(iv) Exchange taxes on transacting Trading Securities, previously included in “General and Administrative
Expenses”
(v) Commission income from underwriting agreements, previously included in “Fees and Commissions”
Notes to Consolidated Financial Statements

Fin
anci
al S
ecti
on
70
(2) “Trading Income” and “Trading Expense” included the following income or expense from Securities held
to hedge Trading Transactions:
(i) Gains or losses on sales, redemption or devaluation of bonds held to hedge trading transactions, previ-
ously included in “Other Operating Income” or “Other Operating Expense”
(ii) Interest and dividends received from bonds held to hedge trading transactions, previously included
in “Other Operating Income” or “Other Operating Expense”
(iii) Exchange taxes on transacting Securities Held to Hedge trading transactions, previously included in
“General and Administrative Expenses”
(3) “Trading Income” and “Trading Expense” included the following income or expense from derivative
financial products for trading transactions:
(i) Interest income, interest expense or valuation gains or losses from derivative financial products for
trading transactions, previously included in “Interest Income on Others” and “Interest Expense on
Others”
(ii) Exchange taxes on transacting derivative financial products for trading transactions, previously
included in “General and Administrative Expenses”
(4) “Trading Income” and “Trading Expense” included the following income or expense from other trading
transactions:
(i) Interest income, interest expense or valuation gains or losses on certificates of deposit and commercial
paper held for trading transactions, previously included in “Interest Income on Others” or “Interest
Expense on Others”.
Establishing trading accounts in accordance with the Bank Law, Article 17-2, referred by the Long-Term
Credit Bank Law, Article 17, had the following effect on the Consolidated Statements of Income for fiscal 1997:
Net decrease in Total Income: ¥97,372 million
Decrease in Interest Income ¥121,926 million
Increase in Trading Income ¥ 24,553 million
Net decrease in Total Expense: ¥115,525 million
Decrease in Interest Expense ¥117,194 million
Increase in Trading Expense ¥ 1,669 million
Decrease in Loss before Income Taxes and Others ¥18,152 million
Some elements in Trading Income and Trading Expense were offset in the presentation of the Consolidated
Statements of Income.
The consolidated subsidiaries record trading transactions and other similar transactions in the same manner
as IBJ.
Notes to Consolidated Financial Statements

Finan
cial Section
71
(e) Investment Securities: Effective March 31, 1999, Investment Securities are stated at cost, cost being determined by
the moving-average method. As of and prior to March 31, 1998, corporate bonds, stocks and shares and other
securities listed on stock exchanges were stated at the lower of cost or market, and Japanese national and local
government bonds were stated at cost, cost being determined by the moving-average method. As a result of this
change, Other Expense and Loss before Income Taxes and Others decreased by ¥190,464 million for fiscal 1998.
Corporate bonds, stocks and shares and other listed securities in Money Held in Trust for short-term invest-
ments in designated securities are stated at the lower of cost or market: cost being determined by the moving-
average method. Non-listed securities in Money Held in Trust are stated at cost, cost being determined by the
moving-average method.
Investment Securities held by the consolidated subsidiaries are principally valued at cost as determined by
the specific identification method.
(f) Translation of Foreign Currencies: (1) Assets and liabilities denominated in foreign currencies as well as assets
and liabilities of foreign branches are translated into yen primarily using the exchange rates in effect at the bal-
ance sheet date. Certain assets and liabilities denominated in foreign currencies, including certain investments
in foreign companies, are valued at historical exchange rates prevailing at the transaction dates if funded in
Japanese yen.
Forward foreign contracts except for those relating to funding transactions are valued at the forward rates
prevailing at the balance sheet date for the remaining maturity of the contract. Gains and losses on these for-
ward foreign exchange contracts are recognized in Other Operating Income in the Consolidated Statements of
Income. Premiums or discounts on spot and forward exchange swaps related to funding transactions are recog-
nized as part of interest income or expense over the life of the contract.
(2) Foreign currency accounts of the consolidated overseas subsidiaries are translated into their home curren-
cies at the respective exchange rates in effect at the balance sheet date.
The financial statements of the consolidated overseas subsidiaries are translated into yen at the exchange rates
in effect at the balance sheet date, except for accounts in shareholders’ equity which are translated at the histori-
cal rates. Translation differences resulting from the changes in the exchange rates from year to year are accumu-
lated in Other Assets in the Consolidated Balance Sheets.
(g) Premises and Equipment: Premises and Equipment is stated at cost less accumulated depreciation. In accordance
with the Accounting Standards for Banks, depreciation of IBJ is computed as follows:
Buildings: Depreciation of buildings, excluding building equipment and structures, acquired on or after
April 1, 1998, is computed using the straight-line method in accordance with the Japanese Tax Law and
the Japanese Tax Law Enforcement Regulation Article 48-1 as amended. For other buildings, the declining-
balance method is used at rates prescribed under the Japanese Tax Law. This change of method in accor-
dance with the Japanese Tax Law Enforcement Regulation as amended resulted in a decrease in Loss before
Income Taxes and Others by ¥6 million for fiscal 1998. The Japanese Tax Law was also amended in fiscal
1998 to shorten depreciation periods for buildings. This change in line with the amendment resulted in an
increase in Loss before Income Taxes and Others by ¥202 million for fiscal 1998.
Equipment: Depreciation of equipment is computed using the declining-balance method, based on rates
prescribed under the Japanese Tax Law.
Notes to Consolidated Financial Statements

Fin
anci
al S
ecti
on
72
Other premises and equipment: Depreciation of other premises and equipment is computed in accordance
with methods prescribed under the Japanese Tax Law.
Until fiscal 1996, depreciation expenses for buildings was calculated under the declining-balance method at
160% of rates under the Japanese Tax Law. IBJ changed the depreciation rates for buildings in fiscal 1997 reflect-
ing the revision in the Accounting Standards for Banks. This change resulted in a decrease in Loss before Income
Taxes and Others by ¥2,306 million.
Premises and Equipment of the consolidated subsidiaries are depreciated principally by the straight-line
method over the estimated useful lives.
(h) Deferred Debenture Charges: Deferred Debenture Charges represents discounts and issuance costs of debentures
which have been deferred and amortized over the term of the debenture using the straight-line method. The costs
of issuing new stocks are expensed as incurred.
(i) Reserve for Possible Loan Losses: Reserve for Possible Loan Losses of IBJ at March 31, 1999 and 1998 is main-
tained in accordance with the Standards for Write-offs and Provisions which were internally established in con-
formity with the Accounting Standards for Banks.
—For credits extended to borrowers who are in legal or de facto bankruptcy, reserves are maintained for 100%
of the said credits less amounts recoverable from collateral and guarantees.
—For credits extended to borrowers who are likely to become legally insolvent, reserves are maintained for
the amount deemed necessary based on overall solvency analyses less amounts recoverable from collateral and
guarantees.
—For credits extended to other borrowers, reserves are maintained at rates formulated from historical credit
loss experiences.
—Reserves for credits extended to specific foreign borrowers are maintained in order to cover possible losses
based on analyses of political and economic climates of the countries.
All credits are assessed by each credit origination department, and a result of the assessments is verified and
audited by an independent examination department. Reserve for Possible Loan Losses is provided on the basis
of such audited assessments.
Reserve for Possible Loan Losses of IBJ at March 31, 1997 consisted of: (i) a general provision calculated by
multiplying the outstanding amount of loans by a rate (current 0.3%) specified in the Accounting Standard for
Banks; (ii) a further provision based on the consideration of the possibility of specific loan losses; and (iii) a pro-
vision to cover potential losses from loans to certain restructuring countries in accordance with the Accounting
Standard for Banks.
Reserve for Possible Loan Losses of the consolidated subsidiaries is provided at the amount considered neces-
sary based on the management’s risk assessment of the loan portfolio.
(j) Reserve for Contingent Losses relating to Loans Sold: Reserve for Contingent Losses relating to Loans Sold is
maintained to cover contingent losses on loans sold to the Cooperative Credit Purchasing Company, Limited,
taking into account the value of collateral pledged. This reserve is provided in accordance with Article 287-2 of
the Code.
(k) Reserve for Retirement Allowances and Pension Plan: In accordance with the Accounting Standards for
Banks, Reserve for Retirement Allowances of IBJ is provided for payments to employees based on the amount
that would have been required assuming the voluntary retirement of all employees on the date of the balance
sheet. In addition, IBJ has a non-contributory funded pension plan for eligible employees. IBJ’s policy for the
plan is to fund and charge to income normal costs as accrued on the basis of an actuarial method accepted in
Japan.
The consolidated subsidiaries principally have funded pension plans for their employees.
(l) Income Taxes: Accounting for allocation of income taxes, which is corporate income tax, inhabitant tax and
enterprise tax, is adopted. The asset and liability method is applied to provide income taxes on all transactions
recorded in the consolidated financial statements. Deferred Tax Assets and Deferred Tax Liabilities are deter-
mined based on the difference between the financial statement and tax bases of assets and liabilities, using
enacted tax rates which will be in effect when the differences are expected to reverse. The aggregate tax rates
were approximately 42.3% for fiscal 1998, 47.9% for fiscal 1997 and 51.6% for fiscal 1996.
Notes to Consolidated Financial Statements

Finan
cial Section
73
(m) Lease Transactions: Accounting principles applicable to operating leases are applied for finance leases of IBJ and
its domestic subsidiaries that do not involve transferring of ownership to the lessees at the end of lease terms.
(n) Changes in Presentation: Due to the change of the Rules for the Consolidated Financial Statements, effective
March 31, 1999, IBJ has changed the format of consolidated financial statements as follows:
(1) Legal Reserve is included in Retained Earnings in the Consolidated Balance Sheets and the Consolidated
Statements of Shareholders’ Equity. The amounts at March 31, 1998 and prior have been reclassified to conform
to the presentation at March 31, 1999.
(2) Minority Interests in Consolidated Subsidiaries is presented after Liabilities and before Shareholders’
Equity in the Consolidated Balance Sheets. It was included in Liabilities at March 31, 1998.
(3) Enterprise Taxes is included in Income Taxes Expense (Benefit). It was previously included in Other
Expense in the Consolidated Statements of Income for fiscal 1997 and 1996.
(4) Amortization of Consolidation Difference is included in General and Administration Expenses. It was pre-
sented as the item of increase/decrease of Income (Loss) before Income Taxes and Others in the Consolidated
Statements of Income for fiscal 1997 and 1996.
2. Cash and Due from Banks Cash and Due from Banks included certificates of deposit outstanding.
3. Trading Assets and LiabilitiesTrading Assets and Liabilities at March 31, 1999 and 1998 consisted of the following:
(in thousands of(in millions of yen) U.S. dollars)
March 31, 1999 March 31, 1998 March 31, 1999
Trading Assets:Trading Securities ¥1,635,269 ¥1,620,929 $13,565,074
Derivatives for Trading Securities 112,762 34 935,400
Securities Held to Hedge Trading Transactions 23,193 40,213 192,395
Derivatives for Securities Held to Hedge Trading Transactions 143 64 1,192
Derivatives for Trading Transactions 1,443,051 1,637,121 11,970,563
Other Trading Assets 514,585 167,892 4,268,644
Total ¥3,729,005 ¥3,466,255 $30,933,268
Trading Liabilities:Trading Securities Oversold ¥ 746,636 ¥ 786,972 $ 6,193,583
Derivatives for Trading Securities 689,469 17 5,719,365
Securities Oversold to Hedge Trading Transactions 24,375 3,567 202,205
Derivatives for Securities Held to Hedge Trading Transactions 108 127 898
Derivatives for Trading Transactions 1,394,360 1,496,275 11,566,658
Total ¥2,854,950 ¥2,286,959 $23,682,709
4. Investment SecuritiesInvestment Securities at March 31, 1999 and 1998 consisted of the following:
(in thousands of(in millions of yen) U.S. dollars)
March 31, 1999 March 31, 1998 March 31, 1999
Japanese National Government Bonds ¥3,321,912 ¥3,513,430 $27,556,306
Japanese Local Government Bonds 167,675 131,430 1,390,920
Corporate Bonds 362,710 348,382 3,008,799
Stocks and Shares (1) 2,661,519 2,428,820 22,078,137
Others (2) 2,428,333 2,425,185 20,143,783
Total ¥8,942,151 ¥8,847,249 $74,177,945
Notes to Consolidated Financial Statements
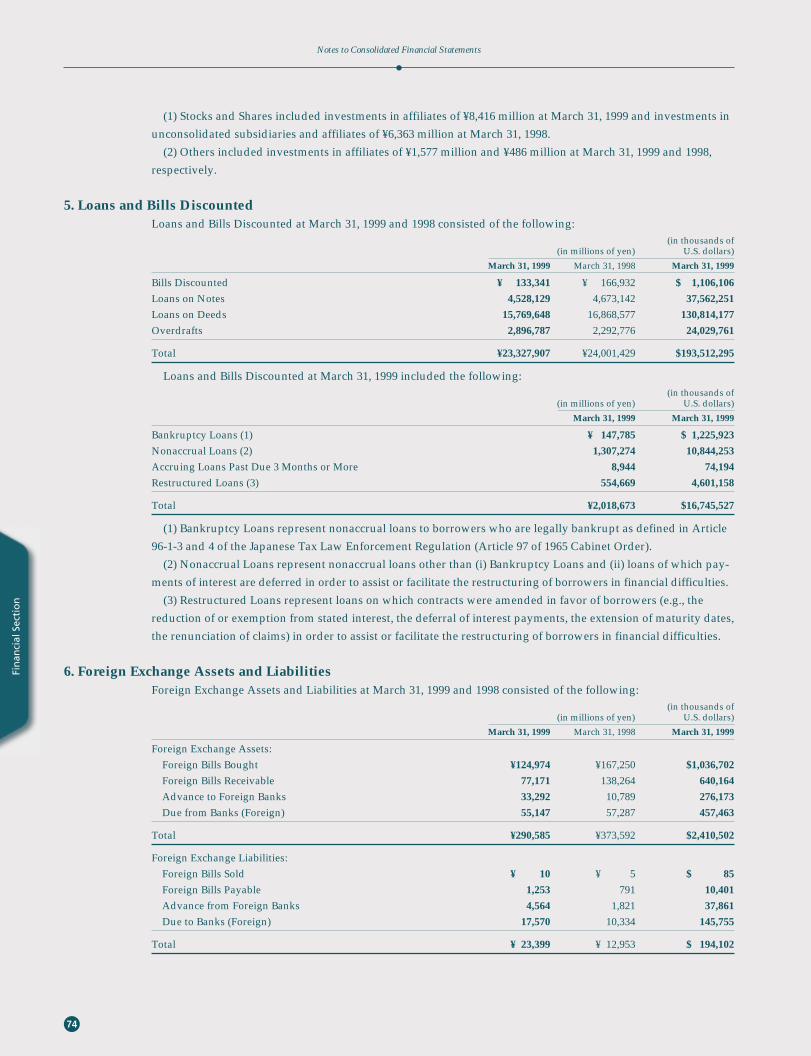
Fin
anci
al S
ecti
on
74
(1) Stocks and Shares included investments in affiliates of ¥8,416 million at March 31, 1999 and investments in
unconsolidated subsidiaries and affiliates of ¥6,363 million at March 31, 1998.
(2) Others included investments in affiliates of ¥1,577 million and ¥486 million at March 31, 1999 and 1998,
respectively.
5. Loans and Bills DiscountedLoans and Bills Discounted at March 31, 1999 and 1998 consisted of the following:
(in thousands of(in millions of yen) U.S. dollars)
March 31, 1999 March 31, 1998 March 31, 1999
Bills Discounted ¥ 133,341 ¥ 166,932 $ 1,106,106
Loans on Notes 4,528,129 4,673,142 37,562,251
Loans on Deeds 15,769,648 16,868,577 130,814,177
Overdrafts 2,896,787 2,292,776 24,029,761
Total ¥23,327,907 ¥24,001,429 $193,512,295
Loans and Bills Discounted at March 31, 1999 included the following:(in thousands of
(in millions of yen) U.S. dollars)
March 31, 1999 March 31, 1999
Bankruptcy Loans (1) ¥ 147,785 $ 1,225,923
Nonaccrual Loans (2) 1,307,274 10,844,253
Accruing Loans Past Due 3 Months or More 8,944 74,194
Restructured Loans (3) 554,669 4,601,158
Total ¥2,018,673 $16,745,527
(1) Bankruptcy Loans represent nonaccrual loans to borrowers who are legally bankrupt as defined in Article
96-1-3 and 4 of the Japanese Tax Law Enforcement Regulation (Article 97 of 1965 Cabinet Order).
(2) Nonaccrual Loans represent nonaccrual loans other than (i) Bankruptcy Loans and (ii) loans of which pay-
ments of interest are deferred in order to assist or facilitate the restructuring of borrowers in financial difficulties.
(3) Restructured Loans represent loans on which contracts were amended in favor of borrowers (e.g., the
reduction of or exemption from stated interest, the deferral of interest payments, the extension of maturity dates,
the renunciation of claims) in order to assist or facilitate the restructuring of borrowers in financial difficulties.
6. Foreign Exchange Assets and LiabilitiesForeign Exchange Assets and Liabilities at March 31, 1999 and 1998 consisted of the following:
(in thousands of(in millions of yen) U.S. dollars)
March 31, 1999 March 31, 1998 March 31, 1999
Foreign Exchange Assets:Foreign Bills Bought ¥124,974 ¥167,250 $1,036,702
Foreign Bills Receivable 77,171 138,264 640,164
Advance to Foreign Banks 33,292 10,789 276,173
Due from Banks (Foreign) 55,147 57,287 457,463
Total ¥290,585 ¥373,592 $2,410,502
Foreign Exchange Liabilities:Foreign Bills Sold ¥ 10 ¥ 5 $ 85
Foreign Bills Payable 1,253 791 10,401
Advance from Foreign Banks 4,564 1,821 37,861
Due to Banks (Foreign) 17,570 10,334 145,755
Total ¥ 23,399 ¥ 12,953 $ 194,102
Notes to Consolidated Financial Statements
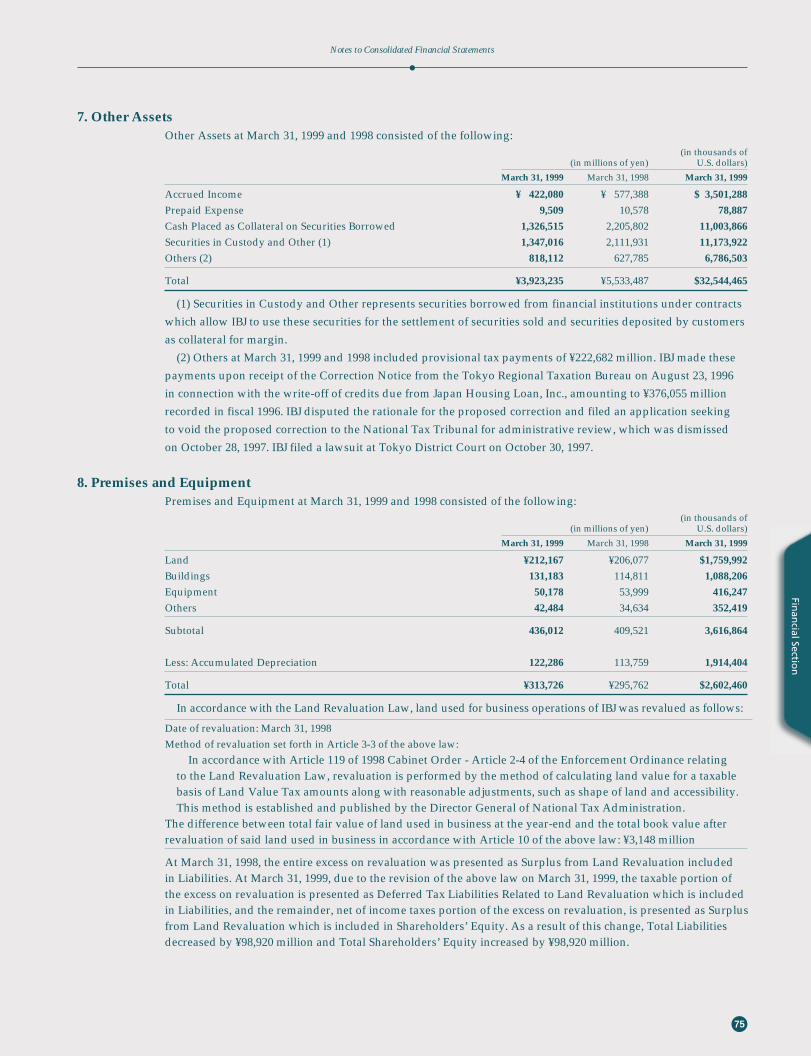
Finan
cial Section
75
7. Other AssetsOther Assets at March 31, 1999 and 1998 consisted of the following:
(in thousands of(in millions of yen) U.S. dollars)
March 31, 1999 March 31, 1998 March 31, 1999
Accrued Income ¥ 422,080 ¥ 577,388 $ 3,501,288
Prepaid Expense 9,509 10,578 78,887
Cash Placed as Collateral on Securities Borrowed 1,326,515 2,205,802 11,003,866
Securities in Custody and Other (1) 1,347,016 2,111,931 11,173,922
Others (2) 818,112 627,785 6,786,503
Total ¥3,923,235 ¥5,533,487 $32,544,465
(1) Securities in Custody and Other represents securities borrowed from financial institutions under contracts
which allow IBJ to use these securities for the settlement of securities sold and securities deposited by customers
as collateral for margin.
(2) Others at March 31, 1999 and 1998 included provisional tax payments of ¥222,682 million. IBJ made these
payments upon receipt of the Correction Notice from the Tokyo Regional Taxation Bureau on August 23, 1996
in connection with the write-off of credits due from Japan Housing Loan, Inc., amounting to ¥376,055 million
recorded in fiscal 1996. IBJ disputed the rationale for the proposed correction and filed an application seeking
to void the proposed correction to the National Tax Tribunal for administrative review, which was dismissed
on October 28, 1997. IBJ filed a lawsuit at Tokyo District Court on October 30, 1997.
8. Premises and EquipmentPremises and Equipment at March 31, 1999 and 1998 consisted of the following:
(in thousands of(in millions of yen) U.S. dollars)
March 31, 1999 March 31, 1998 March 31, 1999
Land ¥212,167 ¥206,077 $1,759,992
Buildings 131,183 114,811 1,088,206
Equipment 50,178 53,999 416,247
Others 42,484 34,634 352,419
Subtotal 436,012 409,521 3,616,864
Less: Accumulated Depreciation 122,286 113,759 1,914,404
Total ¥313,726 ¥295,762 $2,602,460
In accordance with the Land Revaluation Law, land used for business operations of IBJ was revalued as follows:
Date of revaluation: March 31, 1998Method of revaluation set forth in Article 3-3 of the above law:
In accordance with Article 119 of 1998 Cabinet Order - Article 2-4 of the Enforcement Ordinance relatingto the Land Revaluation Law, revaluation is performed by the method of calculating land value for a taxablebasis of Land Value Tax amounts along with reasonable adjustments, such as shape of land and accessibility.This method is established and published by the Director General of National Tax Administration.
The difference between total fair value of land used in business at the year-end and the total book value afterrevaluation of said land used in business in accordance with Article 10 of the above law: ¥3,148 million
At March 31, 1998, the entire excess on revaluation was presented as Surplus from Land Revaluation includedin Liabilities. At March 31, 1999, due to the revision of the above law on March 31, 1999, the taxable portion ofthe excess on revaluation is presented as Deferred Tax Liabilities Related to Land Revaluation which is includedin Liabilities, and the remainder, net of income taxes portion of the excess on revaluation, is presented as Surplusfrom Land Revaluation which is included in Shareholders’ Equity. As a result of this change, Total Liabilitiesdecreased by ¥98,920 million and Total Shareholders’ Equity increased by ¥98,920 million.
Notes to Consolidated Financial Statements

Fin
anci
al S
ecti
on
76
9. Deferred Debenture ChargesDeferred Debenture Charges at March 31, 1999 and 1998 consisted of the following:
(in thousands of(in millions of yen) U.S. dollars)
March 31, 1999 March 31, 1998 March 31, 1999
Deferred Discounts of Debentures ¥13,191 ¥13,920 $109,431
Deferred Debenture Issuance Costs 2,863 2,074 23,754
Total ¥16,055 ¥15,994 $133,185
10. Deferred Tax Assets and LiabilitiesThe components of Deferred Tax Assets and Liabilities at March 31, 1999 were as follows:
(in thousands of(in millions of yen) U.S. dollars
March 31, 1999 March 31, 1999
Deferred Tax Assets:Reserve for Possible Loan Losses ¥246,077 $2,041,288
Net Loss Carryforwards 55,506 460,441
Investments in Subsidiaries and Affiliates 31,221 258,991
Reserve for Losses on Sales of Loans relating to Loans Sold 20,365 168,934
Reserve for Retirement Allowances 15,531 128,838
Investments in Stocks and Others 11,308 93,804
Others 20,189 167,478
Total ¥400,198 $3,319,774
Deferred Tax Liabilities:Depreciation and Others ¥ 7,245 $ 60,101
The disclosure of the above components was not required at March 31, 1998.
11. DebenturesDebentures at March 31, 1999 and 1998 consisted of the following:
(in thousands of(in millions of yen) U.S. dollars)
March 31, 1999 March 31, 1998 March 31, 1999
One-Year Discount Debentures (1) ¥ 5,799,005 ¥ 6,467,524 $ 48,104,567
Long-Term Coupon Debentures (1) 13,684,919 13,617,861 113,520,689
Others (Principally Overseas) (2) 977,940 755,555 8,112,327
Total ¥20,461,865 ¥20,840,941 $169,737,583
(1) One-Year Discount Debentures and Long-Term Coupon Debentures are principally yen-denominated and
issued in Japan by IBJ on a regular and continuing basis.
(2) Others included subordinated debentures of ¥692,973 million and ¥383,598 million at March 31, 1999 and
1998, respectively.
Notes to Consolidated Financial Statements
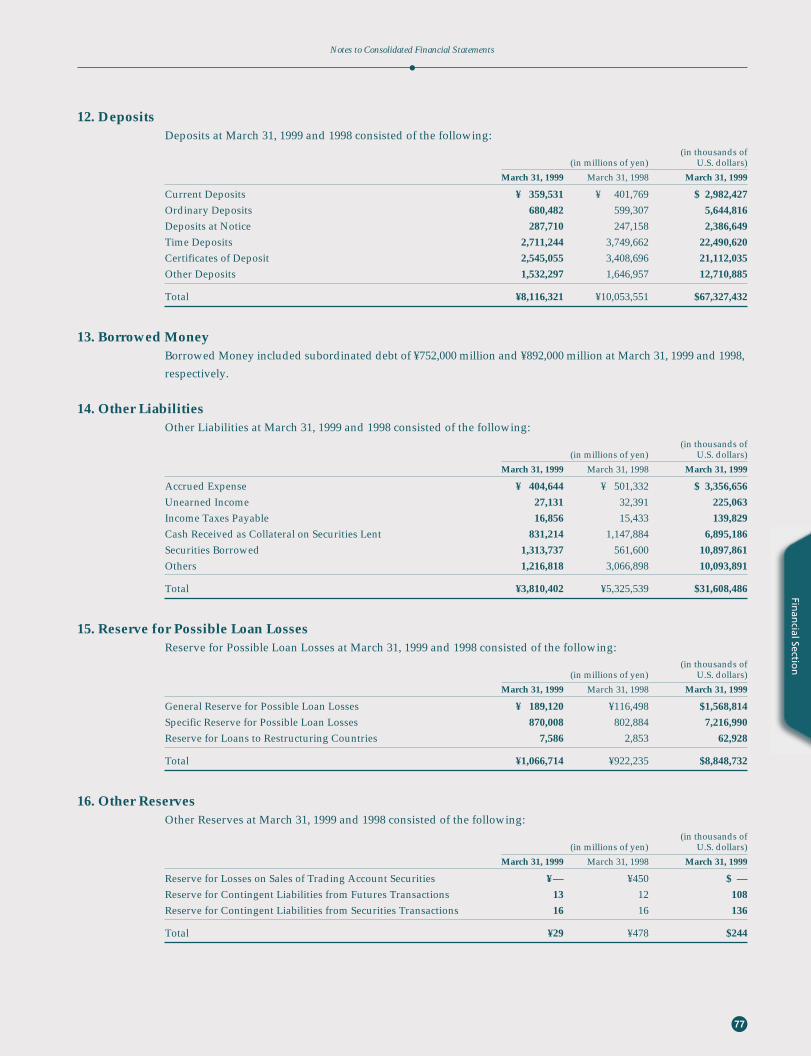
Finan
cial Section
77
12. DepositsDeposits at March 31, 1999 and 1998 consisted of the following:
(in thousands of(in millions of yen) U.S. dollars)
March 31, 1999 March 31, 1998 March 31, 1999
Current Deposits ¥ 359,531 ¥ 401,769 $ 2,982,427
Ordinary Deposits 680,482 599,307 5,644,816
Deposits at Notice 287,710 247,158 2,386,649
Time Deposits 2,711,244 3,749,662 22,490,620
Certificates of Deposit 2,545,055 3,408,696 21,112,035
Other Deposits 1,532,297 1,646,957 12,710,885
Total ¥8,116,321 ¥10,053,551 $67,327,432
13. Borrowed MoneyBorrowed Money included subordinated debt of ¥752,000 million and ¥892,000 million at March 31, 1999 and 1998,
respectively.
14. Other LiabilitiesOther Liabilities at March 31, 1999 and 1998 consisted of the following:
(in thousands of(in millions of yen) U.S. dollars)
March 31, 1999 March 31, 1998 March 31, 1999
Accrued Expense ¥ 404,644 ¥ 501,332 $ 3,356,656
Unearned Income 27,131 32,391 225,063
Income Taxes Payable 16,856 15,433 139,829
Cash Received as Collateral on Securities Lent 831,214 1,147,884 6,895,186
Securities Borrowed 1,313,737 561,600 10,897,861
Others 1,216,818 3,066,898 10,093,891
Total ¥3,810,402 ¥5,325,539 $31,608,486
15. Reserve for Possible Loan LossesReserve for Possible Loan Losses at March 31, 1999 and 1998 consisted of the following:
(in thousands of(in millions of yen) U.S. dollars)
March 31, 1999 March 31, 1998 March 31, 1999
General Reserve for Possible Loan Losses ¥ 189,120 ¥116,498 $1,568,814
Specific Reserve for Possible Loan Losses 870,008 802,884 7,216,990
Reserve for Loans to Restructuring Countries 7,586 2,853 62,928
Total ¥1,066,714 ¥922,235 $8,848,732
16. Other ReservesOther Reserves at March 31, 1999 and 1998 consisted of the following:
(in thousands of(in millions of yen) U.S. dollars)
March 31, 1999 March 31, 1998 March 31, 1999
Reserve for Losses on Sales of Trading Account Securities ¥— ¥450 $ —
Reserve for Contingent Liabilities from Futures Transactions 13 12 108
Reserve for Contingent Liabilities from Securities Transactions 16 16 136
Total ¥29 ¥478 $244
Notes to Consolidated Financial Statements

Fin
anci
al S
ecti
on
78
17. Minority Interests in Consolidated SubsidiariesMinority Interests in Consolidated Subsidiaries included preferred stocks issued by the IBJ subsidiaries
of ¥291,700 million and ¥132,100 million at March 31, 1999 and 1998, respectively. These stocks are preferred
as to distribution at liquidation of the issuing subsidiaries.
18. Acceptances and GuaranteesAll commitments and contingent liabilities of a material nature resulting from guarantees or otherwise are
included in the contra-accounts “Acceptances and Guarantees” and “Customers’ Liabilities for Acceptances
and Guarantees”.
Outstanding commitments and contingent liabilities at March 31, 1999 and 1998 consisted of the following:(in thousands of
(in millions of yen) U.S. dollars)
March 31, 1999 March 31, 1998 March 31, 1999
Acceptances ¥ 3,670 ¥ 11,859 $ 30,446
Letters of Credit 75,205 161,901 623,857
Guarantees 1,437,726 1,850,577 11,926,389
Total ¥1,516,602 ¥2,024,337 $12,580,692
19. Preferred Stock In connection with the Financial Function Early Strengthening Law, IBJ issued 140,000,000 shares of Series II (1)
Preferred Stock and 140,000,000 shares of Series II (2) Preferred Stock to the Resolution and Collection Bank
at March 31, 1999.
The Series II (1) Preferred Stock has no par value, is entitled to a non-cumulative annual dividend of ¥17.50,
has a liquidation preference of ¥1,250, and is convertible to common stock from September 1, 2003 to August 31,
2009, at which time all remaining shares will be converted to common stock.
The Series II (2) Preferred Stock has no par value, is entitled to a non-cumulative annual dividend of ¥5.80, has
a liquidation preference of ¥1,250, and is convertible to common stock from July 1, 2003 to August 31, 2009, at
which time all remaining shares will be converted to common stock.
The number of authorized, issued and outstanding shares of Preferred Stock at March 31, 1999 was as follows: (shares)
March 31, 1999
Authorized Shares:Preferred Stock, Series I 200,000,000
Preferred Stock, Series II 400,000,000
Issued and Outstanding Shares: Preferred Stock, Series I —
Preferred Stock, Series II 280,000,000
(1) Cash dividend per Series II (1) Preferred Stock for Fiscal 1998 was ¥0.05.
(2) Cash dividend per Series II (2) Preferred Stock for Fiscal 1998 was ¥0.02.
Notes to Consolidated Financial Statements
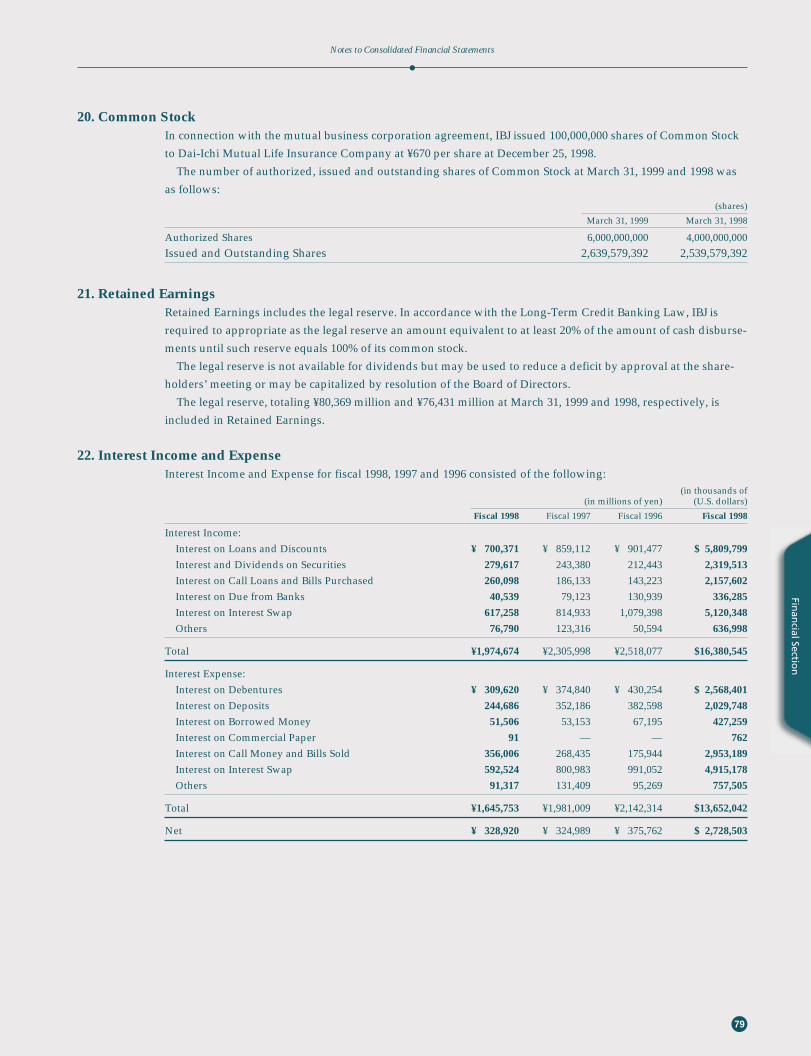
Finan
cial Section
79
20. Common Stock In connection with the mutual business corporation agreement, IBJ issued 100,000,000 shares of Common Stock
to Dai-Ichi Mutual Life Insurance Company at ¥670 per share at December 25, 1998.
The number of authorized, issued and outstanding shares of Common Stock at March 31, 1999 and 1998 was
as follows:(shares)
March 31, 1999 March 31, 1998
Authorized Shares 6,000,000,000 4,000,000,000 Issued and Outstanding Shares 2,639,579,392 2,539,579,392
21. Retained EarningsRetained Earnings includes the legal reserve. In accordance with the Long-Term Credit Banking Law, IBJ is
required to appropriate as the legal reserve an amount equivalent to at least 20% of the amount of cash disburse-
ments until such reserve equals 100% of its common stock.
The legal reserve is not available for dividends but may be used to reduce a deficit by approval at the share-
holders’ meeting or may be capitalized by resolution of the Board of Directors.
The legal reserve, totaling ¥80,369 million and ¥76,431 million at March 31, 1999 and 1998, respectively, is
included in Retained Earnings.
22. Interest Income and Expense Interest Income and Expense for fiscal 1998, 1997 and 1996 consisted of the following:
(in thousands of(in millions of yen) (U.S. dollars)
Fiscal 1998 Fiscal 1997 Fiscal 1996 Fiscal 1998
Interest Income: Interest on Loans and Discounts ¥ 700,371 ¥ 859,112 ¥ 901,477 $ 5,809,799
Interest and Dividends on Securities 279,617 243,380 212,443 2,319,513
Interest on Call Loans and Bills Purchased 260,098 186,133 143,223 2,157,602
Interest on Due from Banks 40,539 79,123 130,939 336,285
Interest on Interest Swap 617,258 814,933 1,079,398 5,120,348
Others 76,790 123,316 50,594 636,998
Total ¥1,974,674 ¥2,305,998 ¥2,518,077 $16,380,545
Interest Expense: Interest on Debentures ¥ 309,620 ¥ 374,840 ¥ 430,254 $ 2,568,401
Interest on Deposits 244,686 352,186 382,598 2,029,748
Interest on Borrowed Money 51,506 53,153 67,195 427,259
Interest on Commercial Paper 91 — — 762
Interest on Call Money and Bills Sold 356,006 268,435 175,944 2,953,189
Interest on Interest Swap 592,524 800,983 991,052 4,915,178
Others 91,317 131,409 95,269 757,505
Total ¥1,645,753 ¥1,981,009 ¥2,142,314 $13,652,042
Net ¥ 328,920 ¥ 324,989 ¥ 375,762 $ 2,728,503
Notes to Consolidated Financial Statements
Fin
anci
al S
ecti
on
80
23. Trading Income and ExpenseTrading Income and Expense for fiscal 1998 and 1997 consisted of the following:
(in thousands of(in millions of yen) U.S. dollars)
Fiscal 1998 Fiscal 1997 Fiscal 1998
Trading Income:Net Gains on Trading Securities and Derivatives ¥22,995 ¥8,630 $190,753
Net Gains on Securities Held to Hedge Trading Transactions 5,280 — 43,800
Net Gains on Derivatives for Trading Transactions 21,669 — 179,757
Other Trading Income 3,991 837 33,100
Total ¥53,936 ¥9,467 $447,420
Trading Expense:Net Losses on Securities Held to Hedge Trading Transactions ¥ — ¥ 401 $ —
Other Trading Expense — 8,051 —
Total ¥ — ¥8,452 $ —
Net ¥53,936 ¥1,014 $477,420
24. Other Operating IncomeOther Operating Income for fiscal 1998, 1997 and 1996 consisted of the following:
(in thousands of(in millions of yen) U.S. dollars)
Fiscal 1998 Fiscal 1997 Fiscal 1996 Fiscal 1998
Gains on Foreign Exchange Transactions ¥ 17,127 ¥ 12,066 ¥ 16,731 $ 142,076
Gains on Trading Account Securities Transactions — — 19,918 —
Gains on Sales of Bonds 817,294 444,595 503,017 6,779,715
Gains on Redemption of Bonds 10,635 11,372 6,317 88,221
Others 8,993 5,400 18,013 74,602
Total ¥854,050 ¥473,434 ¥563,997 $7,084,614
25. Other IncomeOther Income for fiscal 1998, 1997 and 1996 consisted of the following:
(in thousands of(in millions of yen) U.S. dollars)
Fiscal 1998 Fiscal 1997 Fiscal 1996 Fiscal 1998
Gains on Sales of Stocks and Other Securities ¥383,365 ¥373,162 ¥212,482 $3,180,137
Gains on Money Held in Trust 201 8,751 17,089 1,673
Gains on Sales of Premises and Equipment 7,506 5,418 508 62,272
Others 15,069 10,606 15,916 125,006
Total ¥406,143 ¥397,938 ¥245,997 $3,369,088
Notes to Consolidated Financial Statements

Finan
cial Section
81
Notes to Consolidated Financial Statements
26. Other Operating ExpenseOther Operating Expense for fiscal 1998, 1997 and 1996 consisted of the following:
(in thousands of(in millions of yen) U.S. dollars)
Fiscal 1998 Fiscal 1997 Fiscal 1996 Fiscal 1998
Amortization of Debenture Issuance Costs ¥ 5,132 ¥ 6,849 ¥ 9,450 $ 42,572
Losses on Sales of Bonds 768,513 418,194 508,168 6,375,060
Losses on Redemption of Bonds 9,144 2,234 2,664 75,853
Losses on Devaluation of Bonds 69 2,058 2,563 580
Others 11,908 2,577 16,814 98,785
Total ¥794,768 ¥431,913 ¥539,661 $6,592,850
27. Other ExpenseOther Expense for fiscal 1998, 1997 and 1996 consisted of the following:
(in thousands of(in millions of yen) U.S. dollars)
Fiscal 1998 Fiscal 1997 Fiscal 1996 Fiscal 1998
Transfer to Reserve for Possible Loan Losses ¥613,741 ¥522,358 ¥214,379 $5,091,182
Written-off Claims 140,667 62,468 11,904 1,166,881
Losses on Sales of Stocks and Other Securities 35,356 35,297 5,158 293,291
Losses on Devaluation of Stocks and Other Securities 12,416 267,247 104,118 103,002
Losses on Money Held in Trust 300 1,187 1,167 2,492
Enterprise Taxes (1) — (34,416) 7,018 —
Losses on Disposal of Premises and Equipment 1,016 1,585 2,004 8,431
Others (2) 134,796 85,768 56,793 1,118,180
Total ¥938,295 ¥941,497 ¥402,544 $7,783,459
(1) Enterprise Taxes for fiscal 1998 were included in Income Taxes Expense (Benefit) in the Consolidated State-
ments of Income. Enterprise Taxes for fiscal 1997 had credit balances due to recognition of deferred income taxes.
(2) Others included the following IBJ losses:(in thousands of
(in millions of yen) U.S. dollars)
Fiscal 1998 Fiscal 1997 Fiscal 1996 Fiscal 1998
Losses on Sales of Loans to CCPC ¥ 2,158 ¥21,701 ¥10,190 $ 17,909
Transfer to Reserve for ContingentLosses relating to Loans Sold 44,026 15,805 11,115 365,216
Other Losses on Sales of Loans 60,471 28,882 26,216 501,634
28. Income Taxes Expense (Benefit)From fiscal 1998, the reconciliation of the difference between the statutory tax rate and effective tax rate was
prepared under the new disclosure requirement as follows:Fiscal 1998
Statutory Tax Rate 47.9%Influence of the Change of Tax Rate (1) (16.3%)Others 0.9%
Effective Tax Rate 32.5%
(1) Adjustments due to the change of tax rate resulted in the decrease of Deferred Tax Assets of ¥27,652 mil-
lion at March 31, 1999.
Fin
anci
al S
ecti
on
82
29. Net Income (Loss) and Cash Dividends per Common Stock Net Income (Loss) per common stock is computed by dividing net income (loss) applicable to common stock by
weighted average number of common stock outstanding during each year. Cash dividends per common stock
shown for each year in the Consolidated Statements of Income represent dividends declared as applicable to the
respective periods.
Net Income (Loss) per Common Stock for fiscal 1998, 1997 and 1996 were computed as follows:(in thousands of
(in millions of yen U.S. dollars except per share, except per share,
thousands of shares) thousands of shares)
Fiscal 1998 Fiscal 1997 Fiscal 1996 Fiscal 1998
Net Income (Loss) ¥ (181,276) ¥ (202,660) ¥ 12,740 $(1,503,748)
Less: Preferred Stock Dividends 9 — — 82
Net Income (Loss) Applicable to Common Stock ¥ (181,286) ¥ (202,660) ¥ 12,740 $(1,503,830)
Weighted Average Number of Common Stock Outstanding 2,566,154 2,539,572 2,431,309 —
Net Income (Loss) per Common Stock ¥ (70.64) ¥ (79.80) ¥ 5.24 $ (0.586)
30. Subsequent Events The following appropriation of Retained Earnings of IBJ was approved at the shareholders’ meeting held on
June 26, 1999:(in thousands of
(in millions of yen) U.S. dollars)
Cash Dividends:Series II (1) Preferred Stock ¥ 7 $ 58Series II (2) Preferred Stock 2 23Common Stock 9,238 76,636
31. Segment Information
(a) Segment Information by Type of Business: The IBJ Group is engaged in securities, trust, leasing and other
activities. Such segment information, however, has not been presented, as the percentages of those activities
are insignificant.
(b) Segment Information by Geographic Area: Geographic analyses of the IBJ Group’s operations for fiscal 1998
and 1997 are presented based on geographic contiguity, similarities in economic activities, and relation of busi-
ness operations. For fiscal 1996, overseas operations of the IBJ Group were presented in “Overseas”.
Notes to Consolidated Financial Statements
Finan
cial Section
83
Figures relating to the overseas branches of IBJ were included in “Overseas” for fiscal 1996, and were classi-
fied by the geographic areas for fiscal 1998 and 1997. The financial data presented are Operating Income and
Operating Expense in lieu of sales, cost of sales and operating expense as is the case for a nonfinancial services
company.(in millions of yen)
Fiscal 1998 March 31, 1999
Operating Income from Inter-segment Operating Operating OperatingGeographic Area Outside Customers Operating Income Income Expense Profit (Loss) Assets
Japan ¥2,455,776 ¥22,670 ¥2,478,446 ¥2,690,213 ¥(211,766) ¥35,802,233
Americas 528,673 3,519 532,192 508,626 23,566 6,575,174
Europe 270,990 20,451 291,442 297,542 (6,099) 3,665,924
Asia/Oceaniaexcluding Japan 123,154 585 123,739 190,032 (66,292) 2,387,531
Total 3,378,594 47,226 3,425,821 3,686,414 (260,592) 48,430,862
Elimination and GeneralCorporate Assets — (47,226) (47,226) (44,438) (2,788) (2,264,453)
Consolidated Results ¥3,378,594 ¥ — ¥3,378,594 ¥3,641,975 ¥(263,381) ¥46,166,409
(in millions of yen)
Fiscal 1997 March 31, 1998
Operating Income from Inter-segment Operating Operating OperatingGeographic Area Outside Customers Operating Income Income Expense Profit (Loss) Assets
Japan ¥2,150,983 ¥37,772 ¥2,188,755 ¥2,488,417 ¥(299,661) ¥36,334,490Americas 512,243 20,278 532,522 514,477 18,045 7,064,997Europe 337,136 30,609 367,745 403,542 (35,797) 5,367,504Asia/Oceania
excluding Japan 303,890 617 304,507 312,820 (8,313) 2,856,405
Total 3,304,253 89,277 3,393,530 3,719,258 (325,727) 51,623,398Elimination and GeneralCorporate Assets — (89,277) (89,277) (85,826) (3,450) (2,393,612)
Consolidated Results ¥3,304,253 ¥ — ¥3,304,253 ¥3,633,431 ¥ (329,178) ¥49,229,785
(in millions of yen)
Fiscal 1996 March 31, 1997
Operating Income from Inter-segment Operating Operating OperatingGeographic Area Outside Customers Operating Income Income Expense Profit Assets
Japan ¥ 2,104,761 ¥60,446 ¥2,165,208 ¥2,138,553 ¥26,654 ¥37,115,320Overseas 1,297,773 17,829 1,315,602 1,293,269 22,333 11,929,435
Total 3,402,534 78,276 3,480,810 3,431,823 48,987 49,044,755Elimination and GeneralCorporate Assets — (78,276) (78,276) (75,989) (2,287) (2,077,787)
Consolidated Results ¥3,402,534 ¥ — ¥3,402,534 ¥3,355,833 ¥46,700 ¥46,966,968
(in thousands of U.S. dollars)
Fiscal 1998 March 31, 1999
Operating Income from Inter-segment Operating Operating OperatingGeographic Area Outside Customers Operating Income Income Expense Profit (Loss) Assets
Japan $20,371,433 $188,058 $20,559,491 $22,316,162 $(1,756,671) $296,990,735
Americas 4,385,514 29,191 4,414,705 4,219,214 195,491 54,543,131
Europe 2,247,950 169,654 2,417,604 2,468,204 (50,600) 30,409,989
Asia/Oceaniaexcluding Japan 1,021,601 4,859 1,026,460 1,576,380 (549,920) 19,805,319
Total 28,026,498 391,762 28,418,260 30,579,960 (2,161,700) 401,749,174
Elimination and GeneralCorporate Assets — (391,762) (391,762) (368,629) (23,133) (18,784,349)
Consolidated Results $28,026,498 $ — $28,026,498 $30,211,331 $(2,184,833) $382,964,825
Notes to Consolidated Financial Statements
Fin
anci
al S
ecti
on
84
(1) Operating Income represents Total Income less certain special income. Operating Expense represents Total
Expense less certain special expense.
(2) Operating Profit represents Operating Income less Operating Expense.
(3) Americas includes the United States of America and Canada, etc., Europe includes the United Kingdom
and Republic of France, etc., and Asia/Oceania excluding Japan includes the People’s Republic of China (includ-
ing Hong Kong) and the Republic of Singapore, etc.
(4) Effects of changes in accounting policies on the segment information are as follows:
(i) The change in valuation method of Investment Securities resulted in a decrease in Operating Expense of
¥189,666 million, ¥54 million, and ¥742 million for “Japan”, “Europe” and “Asia/Oceania”, respectively.
(ii) The change in depreciation methods and depreciable life for property and equipment resulted in an
increase in Operating Expense of ¥189 million, ¥1 million, ¥2 million, and ¥2 million for “Japan”, “Americas”,
“Europe” and “Asia/Oceania”, respectively.
(c) Operating Income from International Operations: Operating Income of the IBJ Group from International
Operations was analyzed as follows:(in thousands of
(in millions of yen) U.S. dollars)
Fiscal 1998 Fiscal 1997 Fiscal 1996 Fiscal 1998
Operating Income from International Operations (1) ¥1,429,157 ¥1,555,875 ¥1,752,396 $11,855,308
Total Operating Income 3,378,594 3,304,253 3,402,534 28,026,498
International Operations’ Ratio (2) 42.3% 47.0% 51.5%
(1) Operating Income from International Operations (Net of inter-company transactions) consists of that of
IBJ, consolidated domestic subsidiaries and overseas consolidated subsidiaries.
(2) International Operations’ Ratio=Operating Income from International Operations/Total Operating
Income.
32. Market Value of Investment SecuritiesThe market value of Investment Securities held by IBJ at March 31, 1999 and 1998 was as follows:
(in millions of yen)
March 31, 1999 March 31, 1998
Book Value Market Value Net Unrealized Gain Book Value Market Value Net Unrealized Gain
Listed Unrealized Unrealized Unrealized UnrealizedSecurities: Gain Loss Gain Loss
Bonds ¥1,585,383 ¥1,582,444 ¥(2,939) ¥ 12,586 ¥ 15,525 ¥1,452,837 ¥1,525,716 ¥ 72,878 ¥ 73,324 ¥ 446Stocks 2,802,767 2,822,305 19,538 201,529 181,991 2,548,056 2,935,618 387,561 387,974 412Others 991,381 987,167 (4,214) 5,032 9,246 581,060 598,205 17,145 17,375 230
Total ¥5,379,531 ¥5,391,916 ¥12,385 ¥219,147 ¥206,762 ¥4,581,955 ¥5,059,540 ¥477,584 ¥478,674 ¥1,089
(in thousands of U.S. dollars)
March 31, 1999
Book Value Market Value Net Unrealized Gain
Listed Unrealized UnrealizedSecurities: Gain Loss
Bonds $13,151,252 $13,126,870 $ (24,382) $ 104,406 $ 128,788
Stocks 23,249,830 23,411,901 162,071 1,671,744 1,509,673
Others 8,223,816 8,188,862 (34,954) 41,744 76,698
Total $44,624,898 $44,727,633 $102,735 $1,817,894 $1,715,159
(1) Trading Securities and Securities Held to Hedge Trading Transactions were included in Trading Assets
and excluded from the following tables as they were marked to market and the valuation gains or losses were
recognized in the Consolidated Statements of Income.
Notes to Consolidated Financial Statements
Finan
cial Section
85
(2) Bonds included Japanese National Government Bonds, Japanese Local Government Bonds and Corporate
Bonds.
(3) The market value of listed securities is based on the closing prices on the Tokyo Stock Exchange.
(4) Others consisted mainly of foreign securities.
(5) The estimated market value of non-listed securities held by IBJ for which it is practicable to evaluate
market value was as follows:(in millions of yen)
March 31, 1999 March 31, 1998
Book Value Market Value Net Unrealized Gain Book Value Market Value Net Unrealized Gain
Non-listed Unrealized Unrealized Unrealized UnrealizedSecurities: Gain Loss Gain (Loss)
Bonds ¥156,927 ¥160,251 ¥160,251 ¥ 3,514 ¥ 190 ¥141,253 ¥144,722 ¥3,468 ¥ 3,553 ¥ 85Stocks 26,693 34,528 34,528 10,715 2,881 33,393 33,368 (25) 8,978 9,004Others 99,031 99,264 99,264 255 23 77,652 75,978 (1,673) 378 2,051
Total ¥282,651 ¥294,042 ¥294,042 ¥14,484 ¥3,094 ¥252,299 ¥254,069 ¥1,769 ¥12,911 ¥11,141
(in thousands of U.S. dollars)
March 31, 1999
Book Value Market Value Net Unrealized Gain
Non-listed Unrealized Unrealized Securities: Gain Loss
Bonds $1,301,759 $1,329,329 $27,570 $ 29,146 $ 1,576
Stocks 221,427 286,417 64,990 88,888 23,898
Others 821,494 823,423 1,929 2,117 188
Total $2,344,680 $2,439,169 $94,489 $120,151 $25,662
(6) The market value of non-listed securities held by IBJ is based on the following:
(i) Over-the-counter securities
Trading price table published by the Japan Securities Dealers Association.
(ii) Publicly offered non-listed securities
Securities bid-offer table published by the Japan Securities Dealers Association
(iii) Beneficiary certificates of securities investments trusts
Market prices announced by authorized fund management companies
(7) Securities excluded from above tables mainly consisted of the following:(in thousands of
(in millions of yen) U.S. dollars)
March 31, 1999 March 31, 1998 March 31, 1999
Publicly offered non-listed bonds with maturities within 1 year or less ¥1,613,828 ¥1,951,401 $13,387,209
Domestic non-listed bonds, excluding publicly offered bonds 331,061 288,907 2,746,251
Non-listed bonds, excluding domestic bonds 895,783 1,085,118 7,430,803
Non-listed stocks of subsidiaries and affiliates 364,280 336,044 3,021,820
Notes to Consolidated Financial Statements
Fin
anci
al S
ecti
on
86
33. Market Value of Money Held in TrustThe market value of Money Held in Trust held by IBJ at March 31, 1999 and 1998 was as follows:
(in millions of yen)
March 31, 1999 March 31, 1998
Book Value Market Value Net Unrealized Gain Book Value Market Value Net Unrealized Gain
Unrealized Unrealized Unrealized UnrealizedGain Loss Gain Loss
Money Heldin Trust ¥59,807 ¥60,167 ¥361 ¥418 ¥58 ¥172,502 ¥171,334 ¥(1,167) ¥637 ¥1,805
(in thousands of U.S. dollars)
March 31, 1999
Book Value Market Value Net Unrealized Gain
Unrealized Unrealized Gain Loss
Money Heldin Trust $496,115 $499,107 $2,992 $3,472 $480
(1) The market value is calculated by the trustee of the money held in trust as following:
(i) The market value of listed securities is based on the closing prices on the Tokyo Stock Exchange.
(ii) The market value of over-the-counter securities is based on the Trading Price Table published by the
Japan Securities Dealers Association.
34. Market Value of DerivativesThe market value of derivatives held by IBJ at March 31, 1999 and 1998 was as follows:
In the following tables:
(i) Contract value represents notional amounts for swap transactions and contract amounts for other transac-
tions.
(ii) Amounts shown in italic characters represent book value of option premium assets/liabilities on the
Balance Sheets.
(iii) Market value of standardized contracts is based on the closing prices of the Tokyo Stock Exchange
and the Tokyo International Financial Futures Exchange and others. Market values of over-the-counter
contracts are based on the discounted value of future cash flows or option pricing models.
Notes to Consolidated Financial Statements

Finan
cial Section
87
(a) Interest Rate Related Transactions(in millions of yen)
March 31, 1999 March 31, 1998
Contract Value Market Value Unrealized Contract Value Market Value Unrealized
Over 1 Year Gain (Loss) Over 1 Year Gain (Loss)
Standardized ContractsFutures
Sold ¥27,452,532 ¥5,085,615 ¥27,486,596 ¥ (34,063) ¥26,817,323 ¥6,787,093 ¥26,882,415 ¥ (65,091)
Bought 26,919,702 5,646,773 26,919,702 12,060 26,043,650 7,130,200 26,088,726 45,075
OptionsSold Call 10,023,237 — 5,158,515 —
2,8662,866 1,554 1,311 2,4462,446 2,027 419
Put 7,373,561 — 4,286,676 —
2,7272,727 2,192 534 2,3852,385 1,492 893
Bought Call 6,356,811 — 3,214,257 —
3,5103,510 2,021 (1,489) 2,3962,396 2,463 66
Put 3,833,906 — 2,255,226 —
1,9291,929 1,500 (428) 1,9851,985 1,369 (615)
Over-the-Counter ContractsFRAs
Sold 859,765 — 770 770 1,567,823 11,053 635 635
Bought 831,940 — (831) (831) 1,623,624 35,818 (1,011) (1,011)
Swaps Rec: FixPay: Flt
23,461,497 17,664,012 831,895 616,321 28,408,864 16,151,446 899,974 617,912
Rec: FltPay: Fix
15,573,272 11,738,458 (787,639) (669,271) 20,841,319 12,189,007 (783,963) (641,304)
Rec: FltPay: Flt
3,110,943 3,028,940 (1,060) (1,853) 469,838 302,424 (789) (899)
Rec: FixPay: Fix
101,973 92,547 2,562 1,426 185,931 140,629 3,501 1,559
SwaptionsSold Call 96,296 13,000 42,604 18,044
921 2,068 (1,147) 915 577 337
Put 18,451 10,000 33,389 13,389
250 836 (586) 709 2,304 (1,595)
Bought Call 13,451 — 10,389 8,389
95 877 794 115 735 656
Put 58,943 26,772 92,496 60,936
1,513 169 (1,343) 1,987 218 (1,769)
CapsSold 321,592 136,147 490,406 329,231
1,736 (521) 1,464 3,513 (1,394) 3,144
Bought 148,340 70,716 196,939 154,209
1,141 66 (1,007) 1,876 (57) (1,775)
FloorsSold 22,592 3,193 41,769 24,769
29 169 (117) 120 264 (170)
Bought 88,710 5,607 153,620 97,390
91 490 270 467 872 341
Total ¥(77,186) ¥ (43,189)
Notes to Consolidated Financial Statements

Fin
anci
al S
ecti
on
88
(in thousands of U.S. dollars)
March 31, 1999
Contract Value Market Value Unrealized
Over 1 Year Gain (Loss)
Standardized ContractsFutures
Sold $227,727,358 $ 42,186,776 $228,009,922 $ (282,564)
Bought 223,207,319 46,841,754 223,307,363 100,044
OptionsSold Call 83,145,893 —
23,776 12,898 10,878
Put 61,166,005 —
22,623 18,188 4,435
Bought Call 52,731,739 —
29,122 16,769 (12,353)
Put 31,803,458 —
16,008 12,450 (3,558)
Over-the-Counter ContractsFRAs
Sold 7,132,027 — 6,393 6,393
Bought 6,901,204 — (6,896) (6,896)
Swaps Rec: FixPay: Flt
194,620,466 146,528,518 6,900,836 5,112,579
Rec: FltPay: Fix
129,185,171 97,374,190 (6,533,716) (5,551,818)
Rec: FltPay: Flt
25,806,251 25,126,013 (8,795) (15,378)
Rec: FixPay: Fix
845,905 767,709 21,254 11,833
SwaptionsSold Call 798,810 107,839
7,642 17,158 (9,516)
Put 153,063 82,953
2,074 6,943 (4,869)
Bought Call 111,586 —
790 7,279 6,587
Put 488,958 222,085
12,554 1,406 (11,148)
CapsSold 2,667,715 1,129,385
14,407 (4,323) 12,151
Bought 1,230,533 586,613
9,467 553 (8,354)
FloorsSold 187,414 26,487
241 1,410 (977)
Bought 735,881 46,512
758 4,072 2,248
Total $ (640,283)
Notes to Consolidated Financial Statements

Finan
cial Section
89
(1) Derivatives held by IBJ included in Trading Transactions at March 31, 1999 and 1998 are excluded from the
previously mentioned tables, as they are marked to market and the valuation gains or losses are recognized in
the Consolidated Statements of Income. The contract value and market value of derivatives held by IBJ included
in Trading Transactions at March 31, 1999 and 1998 were as follows:(in millions of yen) (in thousands of U.S. dollars)
March 31, 1999 March 31, 1998 March 31, 1999
Contract Value Market Value Contract Value Market Value Contract Value Market Value
Standardized ContractsFutures
Sold ¥7,130,758 ¥7,161,734 ¥ 9,098,772 ¥9,147,044 $59,151,875 $59,408,834
Bought 7,373,902 7,408,791 8,747,833 8,799,915 61,168,828 61,458,245
OptionsSold Call 819,388 10,000 6,797,084
783 534 2 2 6,500 4,434
Put 411,829 125,000 3,416,256
550 482 23 15 4,565 4,002
Bought Call 408,238 — 3,386,466
754 601 — — 6,256 4,987
Put 126,827 — 1,052,075
628 427 — — 5,217 3,543
Over-the-Counter ContractsFRAs
Sold 1,544,085 454 442,051 (115) 12,808,670 3,774
Bought 1,379,771 (539) 213,007 (13) 11,445,635 (4,476)
Swaps Rec: FixPay: Flt
30,801,390 1,183,095 33,157,397 1,207,777 255,507,182 9,814,150
Rec: FltPay: Fix
30,678,052 (1,133,162) 31,409,699 (1,179,401) 254,484,056 (9,399,937)
Rec: FltPay: Flt
1,627,481 (418) 1,242,206 (970) 13,500,471 (3,470)
Rec: FixPay: Fix
211,748 (5,054) 339,742 530 1,756,518 (41,925)
SwaptionsSold Call 775,220 740,687 6,430,701
9,704 6,136 10,646 3,365 80,504 50,905
Put 640,603 579,059 5,314,009
6,466 10,576 6,297 13,056 53,641 87,737
Bought Call 678,451 561,082 5,627,964
8,255 16,694 8,651 19,066 68,480 138,484
Put 912,399 772,726 7,568,639
12,224 5,869 12,223 3,700 101,407 48,686
CapsSold 2,510,271 2,955,205 20,823,489
19,020 8,779 28,035 9,971 157,780 72,827
Bought 1,783,447 2,200,188 14,794,252
13,471 10,164 21,714 12,788 111,748 84,315
FloorsSold 832,835 817,240 6,908,635
6,656 13,026 8,678 11,174 55,220 108,057
Bought 942,335 1,127,603 7,816,964
5,537 11,236 6,845 10,016 45,935 93,212
Notes to Consolidated Financial Statements

Fin
anci
al S
ecti
on
90
(b) Currency-Related Transactions(in millions of yen)
March 31, 1999 March 31, 1998
Contract Value Market Value Unrealized Contract Value Market Value UnrealizedCurrency Over 1 Year Gain (Loss) Over 1 Year Gain (Loss)
Over-the-Counter ContractsCurrency Swaps
USD ¥4,392,925 ¥3,521,601 ¥(109,843) ¥25,055 ¥5,230,761 ¥4,463,793 ¥(196,489) ¥41,828GBP 101,393 89,564 (2,439) (3,308) 111,447 108,295 (3,445) (1,768)DEM 223,144 193,168 3,933 (4,491) 276,829 245,431 3,858 (3,609)CHF 200,902 160,758 3,086 (2,286) 367,991 224,076 (512) (2,751)FRF 62,048 62,048 2,894 (260) 220,710 67,202 6,572 (383)AUD 160,836 142,614 (181) (859) 205,614 185,778 (2,281) (3,186)Others 149,776 103,097 4,114 3,769 119,708 97,055 5,925 (1,449)
Total ¥5,291,028 ¥4,272,854 ¥ (98,434) ¥17,617 ¥6,533,063 ¥5,391,634 ¥(186,372) ¥28,679
(in thousands of U.S. dollars)
March 31, 1999
Contract Value Market Value UnrealizedCurrency Over 1 Year Gain (Loss)
Over-the-Counter ContractsCurrency Swaps
USD $36,440,695 $29,212,791 $(911,186) $207,842
GBP 841,094 742,967 (20,236) (27,444)
DEM 1,851,055 1,602,394 32,633 (37,261)
CHF 1,666,552 1,333,545 25,607 (18,966)
FRF 514,714 514,714 24,010 (2,165)
AUD 1,334,188 1,183,030 (1,505) (7,130)
Others 1,242,442 855,226 34,129 31,269
Total $43,890,740 $35,444,667 $(816,548) $146,145
(1) The difference between market value and unrealized gains or losses is a sum of (i) difference in rates
between contract date and year-end for the currency swaps recorded on the balance sheets and (ii) accrued
interest.
(2) Derivatives held by IBJ included in Trading Transactions at March 31, 1999 and 1998 are excluded from
above tables, as they are marked to market and the valuation gains or losses are recognized in the Consolidated
Statements of Income. The contract value and market value of derivatives held by IBJ included in Trading
Transactions at March 31, 1999 and 1998 were as follows:(in millions of yen) (in thousands of U.S. dollars)
March 31, 1999 March 31, 1998 March 31, 1999
Currency Contract Value Market Value Contract Value Market Value Contract Value Market Value
Over-the-Counter ContractsCurrency Swaps
USD ¥7,678,807 ¥1,428 ¥ 8,732,055 ¥ 8,130 $63,698,115 $11,852
GBP 186,245 (2,521) 322,171 (16,464) 1,544,961 (20,918)
DEM 471,795 (1,715) 564,850 (6,037) 3,913,689 (14,232)
CAD 146,787 224 235,699 (1,523) 1,217,649 1,865
CHF 587,645 4,992 800,178 3,557 4,874,700 41,413
FRF 87,354 (3,223) 253,457 (7,351) 724,630 (26,744)
AUD 151,951 153 168,726 1,377 1,260,483 1,274
Others 277,401 1,666 186,392 7,985 2,301,136 13,826
Total ¥9,587,988 ¥1,004 ¥11,263,532 ¥(10,326) $79,535,363 $ 8,336
Notes to Consolidated Financial Statements

(3) The contract value of foreign exchange forward contracts and currency options at March 31, 1999 and 1998
was as follows:(in millions of yen) (in thousand of U.S. dollars)
March 31, 1999 March 31, 1998 March 31, 1999
Contract Value Contract Value Contract Value
Standardized ContractsFutures
Sold ¥ — ¥ — $ —
Bought — — —
OptionsSold Call — — —
— — —
Put — — —
— — —
Bought Call — — —
— — —
Put — — —
— — —
Over-the-Counter ContractsForwards
Sold 9,198,980 23,776,709 76,308,423
Bought 6,694,354 12,290,454 55,531,768
OptionsSold Call 496,561 497,189 4,119,132
13,625 16,506 113,029
Put 402,778 389,896 3,341,175
10,130 2,861 84,036
Bought Call 419,147 556,985 3,476,961
10,702 17,579 88,781
Put 379,979 240,903 3,152,046
10,202 1,683 84,634
The forward contracts to exchange foreign currencies for other foreign currencies are included in the “Sold” column only in the above table.
Finan
cial Section
91
Notes to Consolidated Financial Statements

(c) Stock-Related Transactions(in millions of yen)
March 31, 1999 March 31, 1998
Contract Value Market Value Unrealized Contract Value Market Value Unrealized
Over 1 Year Gain (Loss) Over 1 Year Gain (Loss)
Standardized ContractsIndex Futures
Sold ¥45,011 ¥ — ¥46,618 ¥(1,606) ¥111,074 ¥ — ¥107,255 ¥3,818
Bought 40,534 — 40,950 415 56,481 — 54,605 (1,876)
Index OptionsSold Call — — — —
— — — — — —
Put — — — —
— — — — — —
Bought Call — — — —
— — — — — —
Put — — — —
— — — — — —
Over-the-Counter ContractsOptions
Sold Call — — — —
— — — — — —
Put — — — —
— — — — — —
Bought Call — — — —
— — — — — —
Put — — — —
— — — — — —
Index SwapRec: Index
— — — —— —
Pay: Flt
Rec: Flt— — — —
Pay: Index —
OthersSold — — —
— — —
Bought — — — —
— — —
Total ¥(1,191) ¥1,941
Fin
anci
al S
ecti
on
92
Notes to Consolidated Financial Statements

(in thousands of U.S. dollars)
March 31, 1999
Contract Value Market Value Unrealized
Over 1 Year Gain (Loss)
Standardized ContractsIndex Futures
Sold $373,383 $— $386,712 $(13,329)
Bought 336,245 — 339,693 3,448
Index OptionsSold Call — —
— — —
Put — —
— — —
Bought Call — —
— — —
Put — —
— — —
Over-the-Counter ContractsOptions
Sold Call — —
— — —
Put — —
— — —
Bought Call — —
— — —
Put — —
— — —
Index SwapRec: Index
— — — —Pay: Flt —
Rec: Flt— — — —
Pay: Index —
OthersSold — —
— — —
Bought — —— — —
Total $ (9,881)
Finan
cial Section
93
Notes to Consolidated Financial Statements
Fin
anci
al S
ecti
on
94
(d) Bond-Related Transactions(in millions of yen)
March 31, 1999 March 31, 1998
Contract Value Market Value Unrealized Contract Value Market Value Unrealized
Over 1 Year Gain (Loss) Over 1 Year Gain (Loss)
Standardized ContractsFutures
Sold ¥8,714,400 ¥— ¥8,846,753 ¥(132,353) ¥5,790,664 ¥— ¥5,825,521 ¥(34,857)
Bought 7,822,534 — 7,853,570 31,035 3,952,109 — 3,944,707 (7,402)
Futures OptionsSold Call 218,667 — 211,055 —
1,720 988 732 825 661 163
Put 423,582 — 45,564 —
4,093 3,798 295 159 178 (19)
Bought Call 137,926 — 66,345 —
1,048 641 (406) 244 148 (95)
Put 291,974 — 101,709 —
3,185 2,763 (422) 490 213 (276)
Over-the-Counter ContractsOptions
Sold Call 90,000 — — —
1,297 770 526 — — —
Put — — — —
— — — — — —
Bought Call — — — —
— — — — — —
Put 90,000 — — —
1,546 1,803 256 — — —
Total ¥(100,334) ¥(42,488)
Notes to Consolidated Financial Statements

Finan
cial Section
95
(in thousands of U.S. dollars)
March 31, 1999
Contract Value Market Value Unrealized
Over 1 Year Gain (Loss)
Standardized ContractsFutures
Sold $72,288,680 $— $73,386,590 $(1,097,910)
Bought 64,890,374 — 65,147,826 257,452
Futures OptionsSold Call 1,813,911 —
14,275 8,200 6,075
Put 3,513,749 —
33,958 31,510 2,448
Bought Call 1,144,146 —
8,694 5,324 (3,370)
Put 2,422,017 —
26,423 22,922 (3,501)
Over-the-Counter ContractsOptions
Sold Call 746,578 —
10,759 6,393 4,366
Put — —
— — —
Bought Call — —
— — —
Put 746,578 —
12,831 14,962 2,131
Total $(832,309)
Notes to Consolidated Financial Statements
Derivatives held by IBJ included in Trading Transactions at March 31, 1999 and 1998 are excluded from the
previously mentioned tables, as they are marked to market and the valuation gains or losses are recognized in
the Consolidated Statements of Income. The contract values and market values of derivatives held by IBJ includ-
ed in Trading Transactions at March 31, 1999 and 1998 were as follows:(im millions of yen) (in thousands of U.S. dollars)
March 31, 1999
Contract Value Market Value Contract Value Market Value
Standardized ContractsFutures
Sold ¥109,095 ¥109,696 $ 904,985 $ 909,965
Bought 143,611 144,345 1,191,302 1,197,388
Futures OptionsSold Call 21,437 177,828
25 18 212 153
Put 12,878 106,829
72 78 599 653
Bought Call 26,734 221,773
108 101 902 843
Put 9,744 80,830
33 42 281 349
Over-the-Counter ContractsOptions
Sold Call — —
— — — —
Put — —
— — — —
Bought Call — —
— — — —
Put — —
— — — —
(e) Commodity-Related Transactions
IBJ did not have any commodity-related transactions for fiscal 1998.Fin
anci
al S
ecti
on
96
Notes to Consolidated Financial Statements

Finan
cial Section
97
To the Board of Directors,
The Industrial Bank of Japan, Limited:
We have audited the accompanying consolidated balance sheets of The Industrial Bank of Japan, Limited (“IBJ”) and its consoli-
dated subsidiaries as of March 31, 1999, and 1998, and the related consolidated statements of income, shareholders’ equity and
cash flows for each of the three years in the period ended March 31, 1999, all expressed in Japanese Yen. Our audits were made in
accordance with auditing standards, procedures and practices generally accepted and applied in Japan and, accordingly, includ-
ed such tests of the accounting records and such other auditing procedures as we considered necessary in the circumstances.
In our opinion, the consolidated financial statements referred to above present fairly the consolidated financial position of IBJ
and its consolidated subsidiaries at March 31, 1999 and 1998, and the consolidated results of their operations and their cash flows
for each of the three years in the period ended March 31, 1999, in conformity with accounting principles and practices generally
accepted in Japan (See Note 1 (a)) consistently applied during the periods, except for the change with which we concur, in the
accounting for Investment Securities as described in Note 1 (e) to the accompanying consolidated financial statements.
The amounts expressed in U.S. dollars, provided solely for the convenience of the reader, have been translated on the basis set
forth in Note 1 (a) to the accompanying consolidated financial statements.
Tokyo, Japan
June 29, 1999
Chuo Audit Corporation
Independent Certified Public Accountants
Report of Independent Certified Public Accountants
Chuo Audit Corporation is a member of Coopers & Lybrand International, a limited liability association incorporated in Switzerland.
certified public accountants
Head office:Kasumigaseki Building32nd Floor3-2-5 KasumigasekiChiyoda-kuTokyo 100-6088
telephone: (03) 3581-6281

Fin
anci
al S
ecti
on
98
(in thousands of(in millions of yen) U.S. dollars)
March 31, 1999 March 31, 1998 March 31, 1999
AssetsCash and Due from Banks ¥ 1,167,336 ¥ 1,367,328 $ 9,683,418Call Loans and Bills Purchased 1,345,925 1,860,262 11,164,872Commercial Paper and Other Debt Purchased 128,064 8,895 1,062,335Trading Assets 2,197,033 2,119,627 18,225,085Money Held in Trust 59,806 172,502 496,116Investment Securities 9,024,595 8,699,667 74,861,843Loans and Bills Discounted 22,872,065 23,241,545 189,730,947Foreign Exchanges 277,821 310,724 2,304,613Other Assets 2,377,508 4,673,773 19,722,177Premises and Equipment 278,285 283,748 2,308,470Deferred Debenture Charges 15,396 16,729 127,722Deferred Tax Assets 406,253 — 3,369,998Customers’ Liabilities for Acceptances and Guarantees 1,939,210 2,386,058 16,086,359
Total Assets ¥42,089,303 ¥45,140,863 $349,143,955
(in thousands of(in millions of yen) U.S. dollars)
March 31, 1999 March 31, 1998 March 31, 1999
Liabilities and Shareholders’ EquityLiabilitiesDebentures ¥19,866,858 ¥20,239,792 $164,801,817Deposits 8,175,082 10,139,950 67,814,871Call Money and Bills Sold 3,261,224 2,322,905 27,052,876Commercial Paper 30,000 — 248,859Borrowed Money 1,585,575 1,917,824 13,152,841Trading Liabilities 1,465,170 1,738,742 12,154,047Foreign Exchanges 20,390 11,298 169,145Other Liabilities 2,833,002 4,166,228 23,500,647Reserve for Possible Loan Losses 1,116,278 899,892 9,259,876Reserve for Retirement Allowances 51,888 50,794 430,436Reserve for Contingent Losses relating to Loans Sold 48,144 19,776 399,371Other Reserves 5 7 45Deferred Tax Liabilities related to Land Revaluation 72,518 — 601,564Acceptances and Guarantees 1,939,210 2,386,058 16,086,359Surplus from Land Revaluation — 180,648 —
Total Liabilities 40,465,350 44,073,919 335,672,754
Shareholders’ EquityPreferred Stock 175,000 — 1,451,680Common Stock 498,605 465,105 4,136,087Capital Surplus 570,132 361,632 4,729,425Legal Reserve 80,369 76,431 666,687Surplus from Land Revaluation 98,920 — 820,574Retained Earnings 200,926 163,775 1,666,749
Total Shareholders’ Equity 1,623,953 1,066,944 13,471,201
Total Liabilities and Shareholders’ Equity ¥42,089,303 ¥45,140,863 $349,143,955
See accompanying "Notes to Non-Consolidated Financial Statements" which are an integral part of these statements.
Non-Consolidated Balance Sheets

(in thousands of(in millions of yen) U.S. dollars)
Fiscal 1998* Fiscal 1997* Fiscal 1996* Fiscal 1998*
IncomeInterest Income on:
Loans and Discounts ¥ 656,425 ¥ 800,004 ¥ 847,471 $ 5,445,256Securities 239,541 212,073 187,303 1,987,075Others 795,316 1,069,039 1,276,246 6,597,396
Fees and Commissions 67,300 94,774 52,599 558,278Trading Income 25,334 2,788 — 210,158Other Operating Income 843,416 470,977 532,904 6,996,403Other Income 398,819 390,874 244,248 3,308,333Transfer from Other Reserves 2 12,467 3 19
Total Income 3,026,156 3,053,000 3,140,778 25,102,918
ExpenseInterest Expense on:
Debentures 293,581 350,756 422,415 2,435,346Deposits 231,601 356,871 358,204 1,921,211Borrowings and Rediscounts 54,839 162,210 110,431 454,914Others 799,432 899,028 1,064,091 6,631,541
Amortization of Debenture Discounts 27,117 34,952 52,399 224,948Fees and Commissions 17,624 18,744 16,656 146,202Trading Expense 3,206 9,077 — 26,599Other Operating Expense 778,830 428,075 521,914 6,460,642General and Administrative Expenses 156,809 166,498 157,991 1,300,780Other Expense 1,008,522 968,564 394,544 8,366,009Transfer to Other Reserves 0 — 833 —
Total Expense 3,371,565 3,394,779 3,099,482 27,968,192
Income (Loss) before Income Taxes (345,408) (341,778) 41,295 (2,865,273)Income Taxes Expense (Benefit):
Current 74 190 123 614Deferred (149,754) — — (1,242,265)
Net Income (Loss) ¥ (195,727) ¥ (341,969) ¥ 41,172 $ (1,623,622)
Per Common Stock (in yen) (in U.S. dollars)
Net Income (Loss) ¥ (76.27) ¥ (134.65) ¥ 16.94 $ (0.633)Cash Dividends 7.00 8.50 8.50 0.058
See accompanying “Notes to Non-Consolidated Financial Statements” which are an integral part of these statements.*Fiscal 1998, 1997 and 1996 represent the fiscal years ended March 31, 1999, 1998 and 1997, respectively.
Finan
cial Section
99
Non-Consolidated Statements of Income

(in millions of yen)
TotalPreferred Common Capital Legal Surplus from Retained Shareholders’
Stock Stock Surplus Reserve Land Revaluation Earnings Equity
Balance at March 31, 1996 ¥ — ¥352,045 ¥248,572 ¥68,113 ¥ — ¥514,463 ¥1,183,195Issuance of Common Stock — 113,060 113,060 — — — 226,120Transfer from Retained Earningsto Legal Reserve — — — 3,998 — (3,998) —
Cash Dividends — — — — — (19,987) (19,987)Net Income for Fiscal 1996 — — — — — 41,172 41,172
Balance at March 31, 1997 — 465,105 361,632 72,112 — 531,649 1,430,500
Transfer from Retained Earningsto Legal Reserve — — — 4,318 — (4,318) —
Cash Dividends — — — — — (21,586) (21,586)Net Loss for Fiscal 1997 — — — — — (341,969) (341,969)
Balance at March 31, 1998 — 465,105 361,632 76,431 — 163,775 1,066,944
Adoption of Accounting for Deferred Tax — — — — — 256,498 256,498
Issuance of Preferred Stock 175,000 — 175,000 — — — 350,000Issuance of Common Stock — 33,500 33,500 — — — 67,000Transfer from Retained Earnings to Legal Reserve — — — 3,937 — (3,937) —
Transfer from Liabilities — — — — 98,920 — 98,920Cash Dividends — — — — — (19,681) (19,681)Net Loss for Fiscal 1998 — — — — — (195,727) (195,727)
Balance at March 31, 1999 ¥175,000 ¥498,605 ¥570,132 ¥80,369 ¥98,920 ¥200,926 ¥1,623,953
(in thousands of U.S. dollars)
TotalPreferred Common Capital Legal Surplus from Retained Shareholders’
Stock Stock Surplus Reserve Land Revaluation Earnings Equity
Balance at March 31, 1998 $ — $3,858,194 $2,999,852 $634,022 $ — $1,358,568 $ 8,850,636Adoption of Accounting for Deferred Tax — — — — — 2,127,734 2,127,734
Issuance of Preferred Stock 1,451,680 — 1,451,680 — — — 2,903,360Issuance of Common Stock — 277,893 277,893 — — — 555,786Transfer from Retained Earnings to Legal Reserve — — — 32,664 — (32,664) —
Transfer from Liabilities — — — — 820,574 — 820,574Cash Dividends — — — — — (163,266) (163,266)Net Loss for Fiscal 1998 — — — — — (1,623,622) (1,623,622)
Balance at March 31, 1999 $1,451,680 $4,136,087 $4,729,425 $666,687 $820,574 $1,666,749 $13,471,201
See accompanying “Notes to Consolidated Financial Statements" which are an integral part of these statements.* Fiscal 1998, 1997 and 1996 represent the fiscal years ended March 31, 1999, 1998 and 1997, respectively.
Fin
anci
al S
ecti
on
100
Non-Consolidated Statements of Shareholders’ Equity

1. Basis of PresentationThe accompanying non-consolidated financial statements have been prepared from the accounts maintained
by The Industrial Bank of Japan, Ltd. (“IBJ”) in accordance with the provisions set forth in the Japanese
Commercial Code and in conformity with accounting principles and practices generally accepted in Japan, such
as the Accounting Standards for Banks as prescribed by the Japanese Bankers Association which are different in
certain respects as to application and disclosure requirements of International Accounting Standards.
Certain items presented in the non-consolidated financial statements filed with the Ministry of Finance (the
“MOF”) in Japan are reclassified for the convenience of readers outside Japan. In addition, the Non-Consolidated
Statements of Shareholders’ Equity is prepared and included in non-consolidated financial statements, though
they are not required to be filed with the MOF.
The amounts indicated in millions of yen are rounded down by truncating the figures below one million.
Totals may not add up exactly because of such truncation.
The non-consolidated financial statements are not intended to present the non-consolidated financial position
and results of operations in accordance with accounting principles and practices generally accepted in countries
and jurisdictions other than Japan.
Amounts in U.S. dollars are included solely for the convenience of readers outside Japan. The rate of ¥120.55
=US$1.00, the rate of exchange on March 31, 1999, has been used in translation. The inclusion of such amounts
is not intended to imply that Japanese yen has been or could be readily converted, realized or settled into U.S.
dollars at that rate or any other rate.
2. Significant Accounting PoliciesRefer to Notes to Consolidated Financial Statements.
3. Subsequent EventsRefer to Notes to Consolidated Financial Statements.
Finan
cial Section
101
Notes to Non-Consolidated Financial Statements

To the Board of Directors,
The Industrial Bank of Japan, Limited:
We have audited the accompanying non-consolidated balance sheets of The Industrial Bank of Japan, Limited (“IBJ”) as of March
31, 1999 and 1998, and the related non-consolidated statements of income and shareholders’ equity for each of the three years in
the period ended March 31, 1999, all expressed in Japanese Yen. Our audits were made in accordance with auditing standards,
procedures and practices generally accepted and applied in Japan and, accordingly, included such tests of the accounting records
and such other auditing procedures as we considered necessary in the circumstances.
In our opinion, the non-consolidated financial statements referred to above present fairly the non-consolidated financial position
of IBJ at March 31, 1999, and 1998, and the non-consolidated results of its operations for each of the three years in the period ended
March 31, 1999, in conformity with accounting principles and practices generally accepted in Japan (See Note 1) consistently
applied during the periods, except for the change with which we concur, in the accounting for Investment Securities as described
in Note 2 to the accompanying non-consolidated financial statements.
The amounts expressed in U.S. dollars, provided solely for the convenience of the reader, have been translated on the basis set
forth in Note 1 to the accompanying non-consolidated financial statements.
Tokyo, Japan
June 29, 1999
Chuo Audit Corporation
Independent Certified Public Accountants
Fin
anci
al S
ecti
on
102
Report of Independent Certified Public Accountants
Chuo Audit Corporation is a member of Coopers & Lybrand International, a limited liability association incorporated in Switzerland.
Head office:Kasumigaseki Building32nd Floor3-2-5 KasumigasekiChiyoda-kuTokyo 100-6088
telephone: (03) 3581-6281

Directors and Auditors
Co
rpo
rate Data
103
� Managing DirectorsMembers of the Board of Directors
Yuji IgarashiYuji SuzukiHiroshi SaitoKisaburo IkedaMitsunori KanesakaShinji KuboHiroshi SuzukiShoji NoguchiYuji WatanabeTakashi OkamotoMasayuki YasuokaToshiaki OhuchiIkuo KaminishiTakao Suzuki
� Managing Directors
Masatake YashiroTsutomu Abe
� Directors
Takeo SekiharaHiroki YamadaShizuhiro YamauchiRyuju FunayamaNorio NakajimaTsunehiro NakayamaMikio NakuraTakeo OtsuboTakashi KusamaMakoto FukudaToyohiro Ozaki
� Auditors
Standing AuditorsNaoyuki HoriYoshitada ShiratoriShusai Nagai
AuditorsSetsuo UmezawaKunihisa Hama
� Chairman � President of the Board of Directors and Chief Executive Officer
Yoh Kurosawa Masao Nishimura
� Deputy President
Yoshiyuki Fujisawa
� Deputy President
Yozo Okumoto

104
Co
rpo
rate
Dat
a
IBJ Organization Chart
Financial Control & Tax Div.
Public Relations Dept.
Administration Dept.
Personnel Dept.
Secretariat
Information Technology Dept.
Information Technology Promotion Dept.
Operations Supervisory Dept.
Securities Processing Dept.
Bond-Recording Dept.
Market Business Operations Dept.
International Treasury Operations Dept.
Research Headquarters
Research Dept.
Industrial Research Dept.
Credit Risk Management Dept.
Risk Management Dept.
Compliance Dept.
Legal Dept.
Credit Examination Dept.
Auditing Dept.
GeneralMeeting of
Shareholders
Board ofDirectors
ExecutiveCommittee
ManagementCommittee
ManagingDirectors
Council forBusiness
Coordination
Auditors
Board ofAuditors
CorporateAuditors Office
Business Supporting Dept.
Business Operations Dept.
Corporate Planning Dept.

105
Co
rpo
rate Data
Organization Chart
Private Banking Promotion Dept.
Syndication Div.Business Co-ordination Dept.
Employee Benefit Plan Business Promotion Dept.
Bank Debentures Dept.
Financial Institutions Dept. No. 1~2
Corporate Banking Dept. No. 1~11
Corporate Banking Dept. (Media & Telecommunication)
Loan Dept.
Securities Dept.
Securities Business Dept.
Network Business Promotion Dept.
International Headquarters
America Committee
Europe Committee
Southeast Asia Committee
Industrial Finance Seminar Div.
Americas Div.
China Dept.
International Business Dept.
Tokyo Corporate Banking Dept.
Tokyo Corporate Banking Dept. No. 1~4
Tokyo Finance Dept.
Osaka Branch
Osaka Corporate Banking Dept. No. 1~3
Osaka Finance Dept.
Kansai Loan Dept.
New York Branch
Business Administration and Control Div. (Americas)
New York Corporate Finance Div. No. 1~2 Loan Production Office
Overseas Branches
Domestic Branches
Loan Production Office
Representative Offices
Treasury Dept.
Derivatives and Fixed Income Dept.
Treasury Div.
Forex Div.
London Div.
New York Div.
Singapore Div.
Investment Banking Headquarters
Structured Finance Dept.Structured Finance Dept.(Americas Div.)
Asian Business Development Div.
International Finance Div.
Americas Div.
Hong Kong Div.
Investment Banking Dept. (M&A, F.D.I.)
Project Finance Dept.
Business Planning Dept. (IBJ Group)
Securities Services Dept.
Investment Research Dept.
Financial Engineering Dept.
CorporateBanking Unit
InvestmentBanking Unit
Securities & Asset
ManagementUnit
Treasury Unit
Loan Production Office
Marketing Office
International Dept.
International Treasury Dept.
(As of August 2, 1999)
International Loan Dept.
Corporate Banking Dept. (International)

IBJ’s Presence Worldwide
Co
rpo
rate
Dat
a
106
THE AMERICAS
� New York Branch
Shoji NoguchiManaging Director and General Manager
1251 Avenue of The Americas, New York, NY 10020, U.S.A.Phone: 1-(212) 282-3000Telex: 420802 (420802 KOGI UI),
170998 (170998 IBJBR UT)Cable: KOGYOGINKO NEWYORKFax: 1-(212) 282-4250
� Chicago Branch
Masashi SakaiGeneral Manager
227 West Monroe Street, Suite 2600,Chicago, IL 60606, U.S.A.Phone: 1-(312) 855-1111Fax: 1-(312) 855-8200e-mail: [email protected]
� Atlanta Office
Minami MiuraVice President
One Ninety One Peachtree Tower,Suite 3600,191 Peachtree Street, N.E.,Atlanta, GA 30303, U.S.A.Phone: 1-(404) 524-8770Fax: 1-(404) 524-8509
� Houston Office
Michael N. OakesSenior Vice President
Three Allen Center, Suite 4850, 333 Clay Street,Houston, TX 77002, U.S.A.Phone: 1-(713) 651-9444Fax: 1-(713) 651-9209
� Los Angeles Agency
Kazutoshi KuwaharaGeneral Manager
350 South Grand Avenue, Suite 1500,Los Angeles, CA 90071, U.S.A.Phone: 1-(213) 628-7241Telex: 6831123 (KOGIN LSA)Fax: 1-(213) 488-9840URL: http://www.ibjla.come-mail: [email protected]
�San Francisco Office
Kensaku IwataSenior Vice President
555 California Street, Suite 3110,San Francisco, CA 94104, U.S.A.Phone: 1-(415) 981-3131Fax: 1-(415) 982-1917
� Grand Cayman Branch
Shoji NoguchiManaging Directorand General Manager
P.O. Box 1040, West Wind Building,George Town, Grand Cayman,Cayman Islands, B.W.I.
� Nassau Branch
Shoji NoguchiManaging Directorand General Manager
NatWest Building, West Bay Street,Nassau, Bahamas
� Mexico Representative Office
Masaki OishiChief Representative
Edificio Omega, Campos Eliseos No. 345-11,Col. Chapultepec Polanco,Deleg. Miguel Hidalgo,11560 México, D.F., MéxicoPhone: 52-(5) 281-5037,
52-(5) 281-3206,52-(5) 281-5291, 52-(5) 281-5162
Fax: 52-(5) 281-5374e-mail: [email protected]
� São Paulo Representative Office
Hideo YamauraChief Representative
Avenida Paulista, 1842-22 Andar Conjunto 228, Edificio, Cetenco Plaza-Torre Norte, 01310-200 São Paulo-SP, BrazilPhone: 55-(11) 289-2666Fax: 55-(11) 251-4241e-mail: [email protected]
� The Industrial Bank of JapanTrust Company
Hajime NakaiPresident and Chief Executive Officer
Head Office:1251 Avenue of The Americas, New York, NY 10020, U.S.A.Phone: 1-(212) 282-3030Telex: 425754 (425754 IBTC UI),
175598 (175598 IBJTC UT)Cable: KOGINTRUST NEWYORKFax: 1-(212) 282-4252Branch: Nassau, BahamasRepresentative Office: Atlanta, GA,
U.S.A.
� The Industrial Bank of Japan(Canada)
Mitsuo IwamotoPresident and Chief Executive Officer
Head Office:Box 29, Suite 1102, 100 Yonge Street,Toronto, Ontario, Canada M5C 2W1Phone: 1-(416) 365-9550Telex: 06-219881 (IBJCDA TOR)Fax: 1-(416) 367-3452
Vancouver Branch
Shunichiro MiyanagaExecutive Vice President and General Manager
Suite 1220, 666 Burrard Street,Vancouver, B.C., Canada V6C 2X8Phone: 1-(604) 682-4511Fax: 1-(604) 688-7079e-mail: [email protected]
� IBJ Whitehall Bank & Trust Company
Dennis G. BuchertPresident and Chief Executive Officer
Head Office:One State Street, New York, NY 10004, U.S.A.Phone: 1-(212) 858-2000Telex: 62820, 177754Fax: 1-(212) 425-0542Branch: Grand Cayman,
Cayman Islands, B.W.I.

� The Bridgeford Group
Haruhiko MasudaPresident and Chief Executive Officer
399 Park Avenue, 18th Floor, New York, NY 10022, U.S.A.Phone: 1-(212) 705-0880Fax: 1-(212) 755-8900
� Aubrey G. Lanston & Co. Inc.
Ralph A. HallenborgPresident and Chief Executive Officer
One Chase Manhattan Plaza,Fifty-Third Floor, New York, NY 10005, U.S.A.Phone: 1-(212) 612-1600,
1-(800) 221-5750Telex: 233746, 971272Fax: 1-(212) 363-3423URL: http://www.lanston.come-mail: [email protected]
� Nomura IBJ Global InvestmentAdvisors, Inc.
Toshinori KuriharaPresident
2 World Finance Center, Building B,New York, NY 10281, U.S.A.Phone: 1-(212) 667-9523Fax: 1-(212) 667-1099
EUROPE AND THE MIDDLE EAST
� London Branch
Hiroki YamadaDirector and General Manager
Bracken House, One Friday Street,London EC4M 9JA, United KingdomPhone: 44-(171) 248-1111Telex: 886939 (886939 KOGINL G)Cable: KOGYOGINKO LONDON EC4Fax: 44-(171) 248-1114
� Paris Branch
Atsushi NakajimaGeneral Manager
Washington Plaza,40, rue Washington,75408 Paris Cedex 08, FrancePhone: 33-(1) 53-83-40-00Telex: 642105 (KOGPA 642105F)Fax: 33-(1) 53-83-40-99
� Madrid Branch
Yasuo NakamuraGeneral Manager
Torre Picasso Planta 9, Plaza Pablo Ruiz Picasso, s/n. AZCA,28020 Madrid, SpainPhone: 34-91-597-2612Telex: 44066 KGN EFax: 34-91-597-4697e-mail: ibj@sarenet .es
� Milan Branch
Shunsuke ImaokaGeneral Manager
Via Senato 14/16, 20121 Milan, ItalyPhone: 39-02-760861Telex: 331541 (331541 IBJMIL)Fax: 39-02-76015311e-mail: [email protected]
� Frankfurt Branch
Kazuya YoshidaGeneral Manager
Taunustor 2, 60311 Frankfurt am Main,F.R. GermanyPhone: 49-(69) 27282-100Telex: 414939 (414939 KOGIN D)Fax: 49-(69) 27282-511e-mail: [email protected]
� Bahrain Representative Office
Toshihiro KodamaChief Representative
Manama Centre (Entrance 4, 4th Floor),P.O. Box 5759, Manama, BahrainPhone: 973-228868Telex: 9775 (9775 IBJBAH BN)Fax: 973-224828e-mail: [email protected]
� Industriebank von Japan(Deutschland) Aktiengesellschaft— The Industrial Bank of Japan(Germany) —
Tetsuo NarukawaChairman of the Boardof Managing Directors
Head Office:Taunustor 2,60311 Frankfurt am Main,F.R. GermanyPhone: 49-(69) 27282-0Telex: 414939 (414939 KOGIN D)Fax: 49-(69) 27282-512e-mail: [email protected]
Düsseldorf Branch
Toshihiro KitamuraGeneral Manager
Immermannstr. 45,40210 Düsseldorf,F.R. GermanyPhone: 49-(211) 16830Telex: 8582442Fax: 49-(211) 365602e-mail: [email protected]
� The Industrial Bank of Japan(Luxembourg) S.A.
Akira ImaiManaging Director
(Mailing Address) P.O. Box 68, L-2010 Luxembourg,GD de Luxembourg
(Address) 6, rue Jean Monnet,L-2180 Luxembourg, GD de LuxembourgPhone: 352-4216171Telex: 1289 (1289 IBJLX LU)Fax: 352-421617-489
IBJ’s Presence Worldwide
Co
rpo
rate Data
107

� IBJ International plc
Nobuo OyaChief Executive and Managing Director
Bracken House, One Friday Street,London EC4M 9JA, United KingdomPhone: 44-(171) 236-1090Telex: 925621 (925621 IBJITA G),
266582 (266582 IBJITA G)Cable: IBJINTL LONDON EC4Fax: 44-(171) 236-0484
� The Industrial Bank of Japan-NJ(Switzerland) Limited
Takehiro MikodaPresident
Bahnhofstrasse 82a, CH-8023 Zurich, SwitzerlandPhone: 41-(1) 218-9595Telex: 812298 (812298 IBJCH)Fax: 41-(1) 218-9945
� Banque IBJ (France) S.A.
Atsushi NakajimaPresident
Washington Plaza,42, rue Washington,75408 Paris Cedex 08, FrancePhone: 33-(1) 53-83-41-00Telex: 642247 (IBJFSA 642247F)Fax: 33-(1) 53-83-41-69
� IBJ Asset ManagementInternational Ltd.
Toyohide TanakaChief Executive
Bracken House, One Friday Street,London EC4M 9JA, United KingdomPhone: 44-(171) 329-3777Fax: 44-(171) 489-6932e-mail: [email protected]
� IBJ–BA ConsultingInvestitionsberatung GmbH
Yasuji TajimaManaging Director
Landhausgasse 4/7,1010 Vienna, AustriaPhone: 43-(1) 5355868Fax: 43-(1) 5355519e-mail: [email protected]
� IBJ Nomura Financial ProductsHolding plc
Shozo NurishiChairman
Bracken House, One Friday Street,London EC4M 9JA, United KingdomPhone: 44-(171) 762-3306Fax: 44-(171) 762-3338
� IBJ Nomura FinancialProducts plc
Shozo NurishiChairman
Bracken House, One Friday Street,London EC4M 9JA, United KingdomPhone: 44-(171) 762-3333Fax: 44-(171) 762-3338
ASIA AND OCEANIA
� Singapore Branch
Naoki IzawaGeneral Manager
16 Collyer Quay, #14-00, Hitachi Tower,Singapore 049318, Republic of SingaporePhone: 65-5387366Telex: RS21880 (KOGINPO RS21880)Cable: KOGYOGINKO SINGAPOREFax: 65-5387779
� Hong Kong Branch
Shinichi WatanabeGeneral Manager
17th Floor, Two Pacific Place,88 Queensway, Hong Kong,S.A.R., The People’s Republic of ChinaPhone: 852-21033000Telex: 63035 IBJBR HXCable: KOGYOGINKO HONG KONGFax: 852-28459187
� Shanghai Branch
Kiyoshige AkamatsuGeneral Manager
6th Floor, Shanghai SenmaoInternational Building, 101 Yin Cheng East Road,Pudong New Area,Shanghai 200120,The People’s Republic of ChinaPhone: 86-(21) 6841-0000Telex: 33144 (33144 IBJSH CN)Fax: 86-(21) 6841-0399
� Dalian Branch
Taizo WatanabeGeneral Manager
8th Floor, Senmao Building,147 Zhong Shan Lu, Xi Gang Qu, Dalian 116011,The People’s Republic of ChinaPhone: 86-(411) 3692712Telex: 86212 (86212 IBJDL CN)Fax: 86-(411) 3603581
� Beijing Branch
Kotaro NakazawaGeneral Manager
8th Floor, Chang-Fu-Gong Office Building,Jia 26, Jianguomenwai Street,Chaoyang District, Beijing 100022,The People’s Republic of ChinaPhone: 86-(10) 6513-9026Telex: 22457 (22457 IBJPK CN)Fax: 86-(10) 6512-7126
� Bangkok Branch
Masatsugu NagatoGeneral Manager
15th Floor, Thai Obayashi Building, 161 Rajdamri Road,Lumpini, Pathumwan,Bangkok 10330, ThailandPhone: 66-(2) 255-5991Telex: 20544 (20544 IBJBKK TH)Fax: 66-(2) 255-5990
� Labuan Branch
Yasuo SatoGeneral Manager
Level 11 (A), Main Office Tower,Financial Park Labuan,Jalan Merdeka, 87000Federal Territory of Labuan, MalaysiaPhone: 60-(87) 419115Telex: 85061 (IBJLB MA85061)Fax: 60-(87) 419121
Labuan Branch, Kuala LumpurMarketing OfficeSuite No. 1403, 14th Floor,Pernas International, Jalan Sultan Ismail,50250 Kuala Lumpur, MalaysiaPhone: 60-(3) 2636970Fax: 60-(3) 2636837
IBJ’s Presence Worldwide
Co
rpo
rate
Dat
a
108

� Jakarta Representative Office
Toru SumiyoshiChief Representative
BNI Building, 23rd Floor,Jl. Jenderal Sudirman Kav. 1,Jakarta 10220, IndonesiaPhone: 62-(21) 251-2024~5,
62-(21) 570-1010Telex: 65263 (65263 IBJIND IA),
65495 (65495 IBJIND IA)Fax: 62-(21) 570-1225~6,
62-(21) 574-3581 (direct)
� Kuala Lumpur RepresentativeOffice
Takahiko MatsushitaRepresentative
Suite No. 1403, 14th Floor,Pernas International, Jalan Sultan Ismail,50250 Kuala Lumpur, MalaysiaPhone: 60-(3) 2615111Telex: 32298 (IBJKL MA32298)Fax: 60-(3) 2615620
� Guangzhou Representative Office
Kiyofumi OtaChief Representative
Room 1252, Garden Tower,368 Huanshi Dong Lu, Guangzhou 510064,The People’s Republic of ChinaPhone: 86-(20) 83342017Telex: 44263 (44263 IBJGZ CN)Fax: 86-(20) 83355847
� Wuhan Representative Office
Chen JianguoChief Representative
Room 305, Holiday Inn Tian-an Wuhan, 868 Jiefang Dadao,Wuhan 430022,The People’s Republic of ChinaPhone: 86-(27) 8582-1155Fax: 86-(27) 8582-1177e-mail: [email protected]
� Seoul Representative Office
Takafumi YoshidaChief Representative
Press Center Building, 10th Floor, 25,Taepyung-Ro 1-Ga, Chung-Ku,Seoul 100-101, KoreaPhone: 82-(2) 736-2684~5Fax: 82-(2) 736-2686e-mail: [email protected]
� P.T. Bumi Daya—IBJ Leasing
Hiyoshi KozakiPresident Director
BNI Building, 21st Floor,Jl. Jenderal Sudirman Kav. 1, Jakarta 10220, IndonesiaPhone: 62-(21) 570-2588Telex: 65191 (65191 BDIBJL IA)Cable: BDIBJL IAFax: 62-(21) 570-1218
� IBJ Lanston Futures Pte. Ltd.(A subsidiary of Aubrey G. Lanston)
John C. GavinChief Executive Officer
16 Collyer Quay,#14-00, Hitachi Tower,Singapore 049318,Republic of SingaporePhone: 65-5383400Fax: 65-5384100
� IBJ Australia Bank Limited
Tomoo InoseManaging Director and Chief Executive
Level 21, Colonial Centre, 52 Martin Place,Sydney, N.S.W. 2000, AustraliaPhone: 61-(2) 9377-8888Fax: 61-(2) 9377-8884e-mail: [email protected]
� PT. Bank IBJ Indonesia
Hiroo HaradaPresident Director
BNI Building, 23rd Floor, Jl. Jenderal Sudirman Kav. 1, Jakarta 10220, IndonesiaPhone: 62-(21) 570-1010Telex: 65263 (65263 IBJIND IA),
65495 (65495 IBJIND IA)Fax: 62-(21) 570-1225~6e-mail: [email protected]
� IBJ Asia Securities Limited
Akinori HanActing Managing Director
17th Floor, Two Pacific Place, 88Queensway, Hong Kong, S.A.R.,The People’s Republic of ChinaPhone: 852-2103-3883Fax: 852-2103-3702
� CCIC Finance Limited
Paul S. MutherManaging Director
38th Floor A, Bank of China Tower,1 Garden Road, Central, Hong Kong,S.A.R., The People’s Republic of ChinaPhone: 852-28200888Fax: 852-28772105
� Krung Thai IBJ Leasing Co., Ltd.
Phinyavat ChantrakantanondPresident
18th Floor, Thai Obayashi Building,161 Rajdamri Road, Lumpini, Pathumwan, Bangkok 10330, ThailandPhone: 66-(2) 651-8120Fax: 66-(2) 254-6119
IBJ’s Presence Worldwide
Co
rpo
rate Data
109
Branches and Agencies �Loan Production Offices �
Representative Offices �Overseas Subsidiaries �
Overseas Affiliates �
All telephone numbers given are fortelephone calls placed from outside the country.
(As of June 29, 1999)

� Head Office3-3, Marunouchi 1-chome, Chiyoda-ku,Tokyo 100-8210, JapanPhone: 81-(3) 3214-1111Telex: J22325 (KOGIN J22325),
J23215 (KOGIN J23215)Cable: KOGIN TOKYOFax: 81-(3) 3201-7643SWIFT: IBJT JP JT
� Sapporo Branch2, Kita 1-joh Nishi 5-chome,Chuo-ku, Sapporo 060-0001Phone: 81-(11) 231-0101
� Sendai Branch4-1, Ichibancho 2-chome,Aoba-ku, Sendai 980-0811Phone: 81-(22) 266-3111
� Fukushima Branch6-5, Motomachi, Fukushima 960-8035Phone: 81-(24) 523-1111
� Chiba Branch1000 Shinmachi, Chuo-ku, Chiba 260-0028Phone: 81-(43) 238-6111
� Tokyo Corporate BankingDepartment
2-16, Yaesu 1-chome, Chuo-ku, Tokyo 103-8677Phone: 81-(3) 3272-1311
� Kanda Branch3-1, Kanda-Ogawamachi 1-chome,Chiyoda-ku, Tokyo 101-0052Phone: 81-(3) 3296-0111
� Hibiya Branch2-9, Nishi-Shinbashi 1-chome,Minato-ku, Tokyo 105-0003Phone: 81-(3) 3507-0888
� Shinjuku Branch17-1, Nishi-Shinjuku 1-chome,Shinjuku-ku, Tokyo 160-0023Phone: 81-(3) 3344-6111
� Shibuya Branch24-10, Shibuya 1-chome,Shibuya-ku, Tokyo 150-0002Phone: 81-(3) 3498-3111
� Ikebukuro Branch12-1, Higashi-Ikebukuro 1-chome,Toshima-ku, Tokyo 170-0013Phone: 81-(3) 3982-0111
� Kichijoji Branch14-5, Kichijoji-Honcho 1-chome,Musashino, Tokyo 180-0004Phone: 81-(422) 21-0211
� Machida Branch13-15, Morino 1-chome,Machida, Tokyo 194-0022Phone: 81-(42) 723-2111
� Yokohama Branch4-1, Kitasaiwai 1-chome,Nishi-ku, Yokohama 220-0004Phone: 81-(45) 319-3320
� Fujisawa Branch20-10-101, Minami-Fujisawa,Fujisawa 251-0055Phone: 81-(466) 22-7111
� Niigata Branch5942 Rokubancho, Nishibori-dori,Niigata 951-8061Phone: 81-(25) 229-2331
� Toyama Branch5-13, Sakurabashi-dori, Toyama 930-0004Phone: 81-(764) 41-1111
� Shizuoka Branch5-6, Miyukicho, Shizuoka 420-8715Phone: 81-(54) 251-2111
� Nagoya Branch11-18, Nishiki 1-chome,Naka-ku, Nagoya 460-0003Phone: 81-(52) 201-7151
� Kyoto Branch630 Shichikannon-cho, Rokkaku-sagaru,Karasuma-dori, Nakagyo-ku, Kyoto 604-8162Phone: 81-(75) 223-1123
� Osaka Branch1-1, Koraibashi 4-chome,Chuo-ku, Osaka 541-0043Phone: 81-(6) 6202-2351
� Umeda Branch8-17, Umeda 1-chome, Kita-ku, Osaka 530-0001Phone: 81-(6) 6341-2111
� Nanba Branch4-14, Nanba 3-chome, Chuo-ku, Osaka 542-0076Phone: 81-(6) 6644-1123
� Kobe Branch1-1, Onoe-dori 7-chome,Chuo-ku, Kobe 651-0088Phone: 81-(78) 222-1101
� Hiroshima Branch1-1, Kamiyacho 2-chome,Naka-ku, Hiroshima 730-8710Phone: 81-(82) 247-7111
� Takamatsu Branch6-8, Bancho 1-chome, Takamatsu 760-8677Phone: 81-(878) 21-5051
� Fukuoka Branch13-1, Tenjin 1-chome, Chuo-ku, Fukuoka 810-0001Phone: 81-(92) 711-1234
Co
rpo
rate
Dat
a
110
IBJ’s Presence in Japan

� Japan Management Systems Inc.4-1, Yaesu 2-chome, Chuo-ku, Tokyo 104-0028, JapanTel: 81-(3) 3274-1391Fax: 81-(3) 3275-0514e-mail: [email protected]
� IBJ Systems, Ltd.15-1, Konan 2-chome, Minato-ku, Tokyo 108-6008, JapanTel: 81-(3) 5783-7800Fax: 81-(3) 5463-0163
� IBJ Card Service Co., Ltd.4-1, Yaesu 2-chome, Chuo-ku, Tokyo 104-0028, JapanTel: 81-(3) 3275-3051Fax: 81-(3) 3275-3223
� Kogin Investment, Ltd.12-2, Gobancho, Chiyoda-ku, Tokyo 102-0076, JapanTel: 81-(3) 3239-5670Fax: 81-(3) 3239-6828e-mail: [email protected]
� IBJ Securities Co., Ltd.5-1, Otemachi 1-chome, Chiyoda-ku,Tokyo 100-0004, JapanTel: 81-(3) 5252-3111URL: http://www.ibjs.co.jpe-mail: [email protected]
�IBJ Trust and Banking Co., Ltd.11-19, Nibancho, Chiyoda-ku,Tokyo 102-0084, JapanTel: 81-(3) 3262-2011Fax: 81-(3) 3262-9550
� IBJ-DL Financial Technology Co., Ltd.
5-1, Otemachi 1-chome, Chiyoda-ku, Tokyo 100-0004, JapanTel: 81-(3) 5200-7611Fax: 81-(3) 3201-0698
� IBJ NW Asset Management Co., Ltd.* Scheduled to change the name toDLIBJ Asset Management Co., Ltd. on October 1, 1999
6-1, Marunouchi 1-chome,Chiyoda-ku, Tokyo 100-0005, JapanTel: 81-(3) 5221-7700Fax: 81-(3) 3215-3736Telex: J33125
� IBJ Investment TrustManagement Co., Ltd.
6-1, Marunouchi 1-chome,Chiyoda-ku, Tokyo 100-0005, JapanTel: 81-(3) 3287-3111Fax: 81-(3) 3287-1601e-mail: [email protected]
� Nomura-IBJ Investment ServicesCo., Ltd.
2-1, Marunouchi 2-chome, Chiyoda-ku, Tokyo 100-0005, JapanTel: 81-(3) 5223-2101Fax: 81-(3) 5223-2105
� 3i-Kogin Buyouts Ltd.8-1, Otemachi 1-chome, Chiyoda-ku, Tokyo 100-0004, JapanTel: 81-(3) 3243-1261Fax: 81-(3) 3243-1262
Co
rpo
rate Data
111
IBJ’s Presence in Japan
Head Office �Branches �
Subsidiaries �Affiliates �
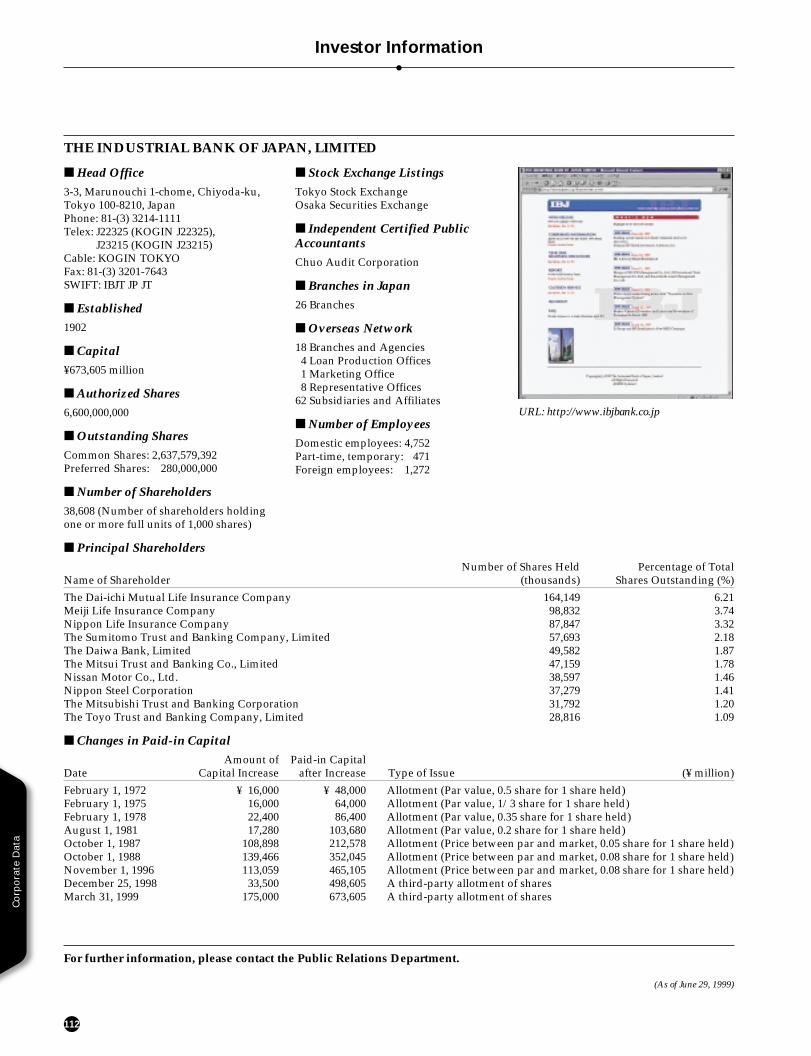
Investor Information
Co
rpo
rate
Dat
a
112
■ Head Office3-3, Marunouchi 1-chome, Chiyoda-ku,Tokyo 100-8210, JapanPhone: 81-(3) 3214-1111Telex: J22325 (KOGIN J22325),
J23215 (KOGIN J23215)Cable: KOGIN TOKYOFax: 81-(3) 3201-7643SWIFT: IBJT JP JT
■ Established1902
■ Capital¥673,605 million
■ Authorized Shares6,600,000,000
■ Outstanding SharesCommon Shares: 2,637,579,392Preferred Shares: 280,000,000
■ Number of Shareholders38,608 (Number of shareholders holdingone or more full units of 1,000 shares)
■ Stock Exchange ListingsTokyo Stock ExchangeOsaka Securities Exchange
■ Independent Certified PublicAccountantsChuo Audit Corporation
■ Branches in Japan26 Branches
■ Overseas Network18 Branches and Agencies4 Loan Production Offices1 Marketing Office8 Representative Offices
62 Subsidiaries and Affiliates
■ Number of EmployeesDomestic employees: 4,752Part-time, temporary: 471Foreign employees: 1,272
■ Principal ShareholdersNumber of Shares Held Percentage of Total
Name of Shareholder (thousands) Shares Outstanding (%)
The Dai-ichi Mutual Life Insurance Company 164,149 6.21Meiji Life Insurance Company 98,832 3.74Nippon Life Insurance Company 87,847 3.32The Sumitomo Trust and Banking Company, Limited 57,693 2.18The Daiwa Bank, Limited 49,582 1.87The Mitsui Trust and Banking Co., Limited 47,159 1.78Nissan Motor Co., Ltd. 38,597 1.46Nippon Steel Corporation 37,279 1.41The Mitsubishi Trust and Banking Corporation 31,792 1.20The Toyo Trust and Banking Company, Limited 28,816 1.09
■ Changes in Paid-in CapitalAmount of Paid-in Capital
Date Capital Increase after Increase Type of Issue (¥ million)
February 1, 1972 ¥ 16,000 ¥ 48,000 Allotment (Par value, 0.5 share for 1 share held)February 1, 1975 16,000 64,000 Allotment (Par value, 1/3 share for 1 share held)February 1, 1978 22,400 86,400 Allotment (Par value, 0.35 share for 1 share held)August 1, 1981 17,280 103,680 Allotment (Par value, 0.2 share for 1 share held)October 1, 1987 108,898 212,578 Allotment (Price between par and market, 0.05 share for 1 share held)October 1, 1988 139,466 352,045 Allotment (Price between par and market, 0.08 share for 1 share held)November 1, 1996 113,059 465,105 Allotment (Price between par and market, 0.08 share for 1 share held)December 25, 1998 33,500 498,605 A third-party allotment of sharesMarch 31, 1999 175,000 673,605 A third-party allotment of shares
For further information, please contact the Public Relations Department.
(As of June 29, 1999)
URL: http://www.ibjbank.co.jp
THE INDUSTRIAL BANK OF JAPAN, LIMITED

50p10/66p2 50p10/66p2
C2 C3
Introduction
IBJ was originally founded as a public-sector bank under the Industrial Bankof Japan Act of 1902. At that time, Japanwas in the throes of its industrial revolu-tion, and there was a strong demand forlong-term investment capital. IBJ raisedfunds by issuing bank debentures.
The Bank also acted as the trustee incorporate debenture issues—notably, themajor Japanese railway company issueof 1906 in London, amounting to thethen-enormous sum of £1 million. Theseactivities contributed to the building ofthe domestic securities market and to thegenerating of a higher profile for Japan-ese borrowers in the international market.
This early experience of a sophisticatedmix of corporate and investment bank-ing with exposure to trust work is uniqueto the Bank among Japanese banks. Inthe original Act, there was the wording,“trust business related to local govern-ment bonds, corporate bonds, and equi-ties”. This was the first time for the term“trust”, or “shintaku”, to appear in theJapanese statute book.
The 1918 amendment to the IBJ Actpermitted the underwriting and offeringof equities. At that point, the Bank hadthe full capabilities for what is nowtermed investment banking. However,that was at what proved to be the peakof the demand created for Japaneseproducts by the First World War and theconsequent economic boom.
Thereafter, the next 30 years of Japan-ese history encompassed many adversi-ties for society in general and for financialinstitutions in particular: the Great KantoEarthquake, the Showa Financial Panic,and, finally, the Second World War andthe postwar recovery.
The Bank became a private-sector bankin 1950 and took on its current legal formunder the Long-Term Bank Act of 1952.However, the Act was framed within theterms of the U.S.-led Occupation policyof compartmentalizing financial services.IBJ was forced to retreat from much of itsformer investment banking activities andreturn principally to long-term lendingfunded by issuing bank debentures.
During the high-growth period of theJapanese economy in the 1960s, the Bankwas particularly active in financing steelproduction, shipping, shipbuilding, andvehicle manufacturing. Following thefirst oil crisis, Japan moved to a pattern oflower growth as a mature economy, andthe Bank expanded its customer base athome and started the process of expan-sion overseas.
Domestically, the wholesaling of bankdebentures to major financial institutionsand the regional banks led to a networkof strong relationships. This was all sup-ported by the fact that, originally a pub-lic-sector bank, the Bank had no keiretsuaffiliations: the Bank has always been in-dependent of the large corporate group-ings characteristic of Japan. Internationally,the Bank was free to pursue its invest-ment banking ambitions.
The current round of liberalization,Japan’s Big Bang, is enabling the Bankto return to its domestic investmentbanking roots and more fully explorethe benefits of its independence andrelationship networks.
Financial Highlights 1
Message from the President2
Management Rationale and Strategy at IBJFrequently Asked Questions
Rationale6
Steps to “First Call Bank” Status7
Corporate Governance8
Transparency in the Management Strategy9
IBJ’s Future-Oriented Business Strategy10
Differentiation with Other Leading Domestic Banks
11
Competition with Leading Foreign Banks11
Specialist Subsidiaries and Affiliates12
Funding Reliance on Bank Debentures13
Non-Performing Loans14
Emerging Market Exposure15
Year 2000 Problem16
Restructuring and Re-orientation Preparing for Heightened Competition
in the Post-Big Bang Era
Revenue Plan17
Rationalization18
Personnel Policy20
Strategic Alliances22
Risk Control and Compliance Issues Controlling Risk and Ensuring Compliance
Risk24
Credit Risk25
Market Risk27
Liquidity Risk31
Operational Risk32
Systems Risk32
Legal Risk32
Internal Control33
Compliance33
Operations in OutlineBalancing the Center and the Periphery
35
Financial Section49
Corporate Data103
Contents

C4
50p10/66p2 50p10/66p2
C1
’99The Industrial Bank of Japan, LimitedAnnual Report 1999Year ended March 31, 1999
AN
NU
AL
RE
PO
RT
1999T
HE
IND
US
TR
IAL
BA
NK
OF JA
PA
N, L
IMIT
ED
Printed in Japan