Embed Size (px)
Citation preview
41-A24 991 CONCEPTS EVALUATION MODEL V INPUT-DRTR SYSTEM(U) AIR 1/2FORCE INST OF TECH WRIGHT-PATTERSON AFB OH SCHOOL OFENGINEERING J D HIGHTOWER DEC 92 AFXT/GCS/EE/82D-18
UNCLASSIFIED .F/G 9/2 N
EhhhhhhhhhhiIsmhhhhhhhhhhh

• . -
1...
Wi k1.8*
1.2 1 ,11 . 11111.
"'MICROCOPY RESOLUTION TEST CHART
.
NATIONAL BUREAU OF STANDARDS- 1963-A
''
ItO - -X-f.
11111* 1"
4 MICOCOP RESOUTIO TESTCHAR
NAINl UEUO TNAD-93r
'. " " " 'i ,-. -m-. - -. ,= '. i ,i,= :- ,' . -. . . - • . . _ :

CC)
cOF
im ..
CD-
DTT
DEPARTMENT OF THE AIR E4kfAIR UNIVERSITY (ATC)
AIR FORCE INSTITUTE OF TECHNOLOGY
Wright-Patterson Air Force Base, Ohio
This docwmaut ha8o3apv 02 023 11fo u ncrlrad sede;

AFIT/GCS/EE/82D-18
CONCEPTS EVALUATION MODEL V
INPUT-DATA SYSTEM
THESIS
AFIT/GCS/EE/82D-18 John D. HightowerCaptain USA
Approved for public release; distribution unlimited

AFIT/GCS/EE/82D-18
CONCEPTS EVALUATION MODEL V
INPUT-DATA SYSTEM
THESIS
Presented to the Faculty of the School of Engineering
of the Air Force Institute of Technology
Air University
In Partial Fulfillment of the
Requirements of the Degree of
Master of Science
Accesion For
Of DTT, T' El
D t r' -. . .
by A :'Y.I I ,John D. Hightower, B.S. DistCaptain USA
Graduate Computer Science ADecember 1982
Approved for public release; distribution unlimited

Preface
The purpose of this thesis investigation was to analyze
the processes and operations involved in the development of
the Threat Force File and to design a series of subject
databases to support the simulation model used by the United
States Army Concepts Analysis Agency. A structured methodology
provided the frame work for realization of results from each
activity.
The systems analysis of the Threat Force File development
process was done with the intent of identifying areas where
information management techniques could be applied to improve
system efficiency. The logical database designs were based
upon the needs of the major USACAA study teams for the timely
retrieval of specific information items from the model's
output.
I extend my deepest thanks to the members of the Data
Systems Team: Mr. F. Womack, Ms. B. Knox, and Ms. M. McPadden
for their professional assistance and technical expertise
during the on-site research portion of this thesis effort.
Highest commendations and sincerest appreciation goes to
LTC John M. Deems, Chief, Data Systems Team, and thesis
sponsor. LTC Deems's limitless enthusiasm and extensive
knowledge in the field of data processing was the cornerstone
for this aspect of my graduate education. Finally, I would
like to thank my thesis committee: MAJ M. R. Varrieur
(Thesis Advisor), Dr. H. Potoczny, and Maj C. Lillie for their
support and guidance during this time.
-- ii
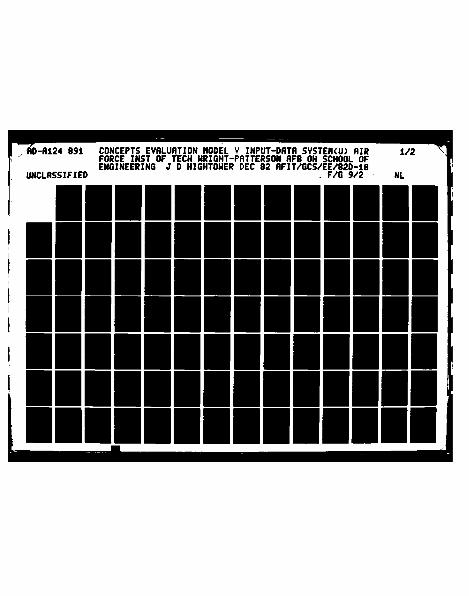
Contents
Page
Preface............................................... ii
List of Figures....................................... v
Abstract.............................................. vi
I. Introduction................................... 1
Background...................................... 1Problem Statement............................... 2Scope....................................... .. 3Approach...................................... 4Thesis Organization............................. 6
Ii. Systems Analysis and the Threat Force FileDevelopment.............................. 7
Introduction.................................... 7Concepts of Structured Methodology..... 9Threat Force File Development ................... 12
III. Logical Database Design.......................... 18
Concepts ..................................... 18Methodology Review......................... 27
iv. Logical Database Design Application - CEM V .... 36
Introduction ................................. 36Data Collection/Analysis ........................ 37Data Processing Requirements ................ 39Logical Schema Design........................ 40Data-Model Specific Logical Schema Design . 43Logical Schema Analysis ......................... 44
V. Recommendations and Conclusions................. 45
Conclusions..................................... 45Recommendations................................ 47
14Bibliography............................................ 49

.. . .. .- .- . . -. - ..-- --- .. .
Contents
(Continued)
Page
Appendix A : Physical DFD's - OMNIBUS Study Team ...... 51
Appendix B ,Physical DFDs TAA Study Team ........... 56
Appendix C : Physical DFD's - RQ Study Team ........... 61
Appendix D : Physical DFD's - IDOFOR Study Team ....... 66
Appendix E : Logical DFD - All Study Teams ............ 72
Appendix F : Proposed Logical DFD All Study Teams... 74
Appendix G Entities and Attributes .................. 76
Appendix H : Relationships Between Entities ........... 78
Appendix I : Data Processing Requirements ............. 79
Appendix J : Entity - Relationship Diagrams ........... 81
0. Appendix K : Logical Schema - Global Structure ........ 91
Appendix L Model-Specific (Network) LogicalSchemas .................................. 96
Appendix M :Records and Sets ......................... 106
Appendix N : Database Size Estimations ................ 111
Appendix 0 Transport Volume ........................... 113
Appendix P : Glossary of Acronyms and Abbreviations... 117
Vita ..................................................... 119
ia
:- iv

List of Figures
Figure Page
1 Systems Analyst Role ............................. 8
2 Entity and Attributes Example ................. 21
3 Key Attribute Example......................... 21
4 Hierarchial Data-Model ........................ 34
5 Relational Data-.Model ............................ 34
6 Network Data-Model ............................ 35
7 Logical DFD - All Study Teams ................. .. 73
8 Proposed Logical DFD Study Teams .............. 75
A-i Physical Overview DFD - OMNIBUS Study Team 52
A-2 Process 1, Physical DFD - OMNIBUS Study Team 53
A-3 Process 2, Physical DFD .OMNIBUS Study Team. 54
A-4 Process 3, Physical DFD - OMNIBUS Study Team.. 55
B-1 Physical Overview DFD - TAA Study Team ........ 57
B-2 Process 1, Physical DFD - TAA Study Team ...... 58
B-3 Process 2, Physical DFD - TAA Study Team ...... 59
B-4 Process 3, Physical DFD - TAA Study Team ...... 60
C-1 Physical Overview DFD - RQ Study Team ......... 62
C-2 Process 1, Physical DFD - RQ Study Team ....... 63
C-3 Process 2, Physical DFD - RQ Study Team ....... 64
C-4 Process 3, Physical DFD - RQ Study Team ....... 65
D-1 Physical Overview DFD - IDOFOR Study Team ..... 67
D-2 Process 1, Physical DFD - IDOFOR Study Team... 68D-3 Process 2, Physical DFD - IDOFOR Study Team... 69
* D-4 Process 3, Physical DFD - IDOFOR Study Team... 70
D-5 Process 4, Physical DFD - IDOFOR Study Team... 71
v
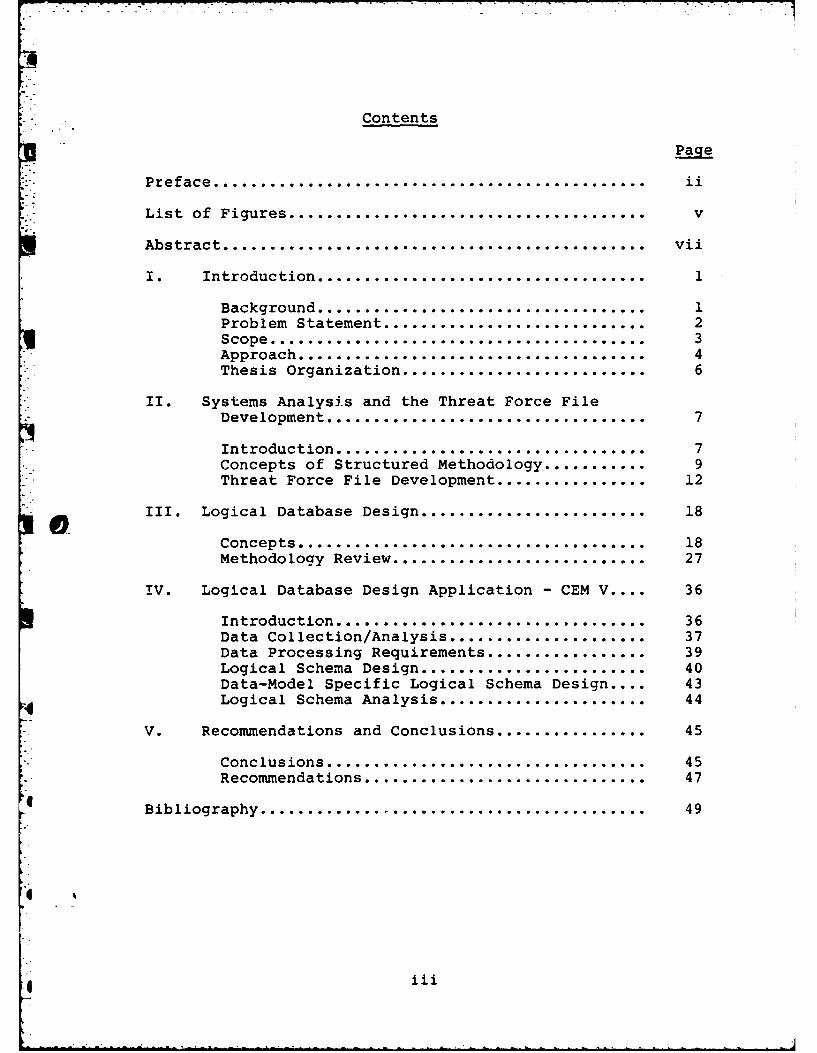
List of Figures
(Continued)
Figure Page
J-1 Entity - Relationship Diagram : Casualties ....... 82
J-2 Entity - Relationship Diagram : Tactical Air ..... 84
J-3 Entity - Relationship Diagram : TacticalDecisions ..................................... 84
J-4 Entity - Relationship Diagram : War Summary ...... 85
J-5 Entity - Relationship Diagram : Mission .......... 86
J-6 Entity - Relationship Diagram : LogisticsLost/Cause .................................... 87
J-7 Entity - Relationship Diagram : LogisticsExperience ..................................... 88
J-8 Entity - Relationship Diagram : FEBA Date ........ 89
J-9 Entity - Relationship Diagram : Unit Data ........ 90
K-i Logical Schema (Network) - Global Structure ...... 92
K-2 Logical Schema (Network) - Global Structure Cont. 93
K-3 Logical Schema (Network) - Global Structure Cont. 94
K-4 Logical Schema (Network) - Global Structure Cont. 95
L-1 Logical Schema (Network) - Casualties ............ 97
L-2 Lcaical Schema (Network) - Tactical Air .......... 98
L-3 Logical Schema (Network) - Tactical Decisions .... 99
L-4 Logical Schema (Network) - War Summary .......... 100
L-5 Logical Schema (Network) - Mission. .............. 101L-6 Logical Schema (Network) - Logistics
Lost/Cause ................................... 102
L-7 Logical Schema (Network) - Logistics Experience. 103
L-8 Logical Schema (Network) - FEBA Data ............ 104
L-9 Logical Schema (Network) - Unit fata ............ 105
vi

AFIT/GCS/EE/82D-18
Abstract
A systems analysis was performed on the Threat Force File
development process used in conjunction with the Concepts
Evaluation Model (CEM V) at the United States Army Concepts
Analysis Agency. Additionally, logical subject databases were
designed to facilitate the retrieval of specific information
from the output generated by the CEM V. A systematic approach
provided the focus for resolution of each activity.
The resulting systems analysis documents the activities
and processes that the agency's four major study teams go
through in preparing the Threat Force File for input to the
CEM V. Areas were identified for application of data manage-
ment techniques to improve system efficiency.
The database designs resulted from the application of
r techniques selected from existing design methodologies. The
logical schemas were transformed into network structures
consistent with the database management system (DMS-1100) used
by USACAA.
I
vii
I. Introduction
Background
The United States Army Concepts Analysis Agency (USACAA),
located in Bethesda, Maryland, is responsible to the director
of the Army Staff (ARSTAFF) for analytical studies that illum-
inate and surface major issues affecting the size and composi-
tion of future Army forces. Some of the larger analytical
efforts under the direction of USACAA make use of a computer
simulation model known as the CONCEPTS EVALUATION MODEL (CEM
V). This study tool provides information on the various as-
pects of war fighting in a simulated environment. The model
is provided data from numerous sources, both internal and ex-
ternal to USACAA.
Each individual study team at USACAA creates its own study
files using whatever collection of manual and/or automated
processes that the particular team has developed over the
recent years. The current policy of USACAA allows the study
teams access to any available and authorized sources in obtain-
ing the necessary data to support the specific study effort.
Analysts involved may consult established USACAA subject data-
bases for all or part of the needed data. There does not
exist a consolidated system which incorporates all these di-
verse informational elements. Normally, the teams do not
share their data, ror is there any centralized control over
the input -t' is used. Additionally, there has been no
* effoct to statistically analyze the data being put into the
Concepts Evaluation Model by the different study teams.
I.A

As the complexity and cost for undertaking major long
term study efforts increase, the need for a more responsive
and efficient information processing system is of extreme
importance. An area of primary interest to USACAA is the
feasibility of applying database/information management
technology and concepts in a manner that would incorporate
all of the individual study teams' data processing require-
ments into one centralized processing environment. Careful
analysis of the existing information management process
followed by systematic application of applicable data manage-
ment techniques can lessen the usars data acquisition time,
decrease redundancy, improve data integrity, and upgrade the
overall data processing efficiency.
ID Problem Statement
The purpose of this thesis investigation was twofold; the
first portion of the effort was directed towards a precise
definition and documentation of the data gathering/processing
phases that the individual study teams followed in develop-
ment of the THREAT FORCE FILE. This file, when integrated
with other required files, constituted the CEM V input deck.
Because these teams were allowed access to data from whatever
source was deemed applicable, a large amount of data redundancy
was encountered. Additionally, problems in the area of data
consistency and integrity were prevalent due to the lack of
control and management of the vast amount of information
required to support the model.
2

The second portion of this research effort was devoted
'- towards an investigation of the output file generated by the
CEM V simulation model. The objective here was to ascertain
users' comments about the output and include it with the
information gained from the Threat Force File analysis to
provide useful changes to a future version of the Concepts
Evaluation Model. Particular interest in this area was the
possibility of downloading the output file from a particular
model run into a series of subject databases whereby DML
commands could be used to retrieve specific data information.
Previous problems had been encountered with the voluminous
amount of information in the reports generated from a CEM V
run. It was not uncommon to see thousands of pages of
0 computer printouts ihich the study analysts had to sift
through in order to arrive at their conclusions and recommenda-
tions. The proposed designs become the foundation for support
of user processing applications as well as on-line trans-
actions utilizing the DMS-I00 database management system and
its associated Query Language Processor. An additional
requirement existed: for any logical database designs
developed, they had to be further defined for compatibility
with the specific DBMS in use at USACAA.
Scope
This thesis investigation focused on the data processing
activities of four major individual study teams within USACAA:
1) TAA (TOTAL ARMY ANALYSIS), 2) OMNIBUS (US ARMY OPERATIONAL
READINESS ANALYSIS, 3) IDOFOR (IMPROVING THE DEFINITION OF
3
3
THE OBJECTIVE FORCE), and 4) RO (REQUIREMENTS). Areas which
were examined during the course of this work included the
existing physical and logical data processing system in
current use by these study teams, the types of data involved
along with the complexity of their corresponding relationships,
K "data structures, determination and specification of the
individual study team's views of the data, the data processing
requirements (both present and future), and lastly, the generic
representation of the data as viewed by the study teams. As
this investigation was concerned with analysis and applica-
tion of a wide diversity of information management concepts,
the physical implementation of designs was not addressed.
Approach
The initial phase of this research effort consisted of a
literature search for information on logical database design
and the definition of systems requirements through the use of
structured analysis. In addition, time was devoted towards
familiarization with the DMS-1100 (DBMS used at USACAA).
In defining the existing data processing environment for
development of the Threat Force File, the concepts of systems
analysis were rigorously followed. Through the use of data
flow diagrams, the current physical and logical data processing
system of each study team was modeled. Once these procedures
had been obtained and verified for accuracy with the respec-
tive users, it was necessary to determine the existing
logical data flow. This aspect attempted to incorporate all
the individual processes and abstract the results so that
4
--------------------------- ~~~~~-----. .-----~---------.---.-.-. --.- . .-..-..-...

understanding of the specific physical activities was not
necessary. Once this was accomplished, it became necessary
to specify the proposed logical system. This document
provided the agency with a view from which the data collection/
development process could be brought under control and managed
so as to minimize the problems of redundancy and improve data
integrity. Additionally, the system description identified
those areas that could be considered for consolidation so as
to reduce excessive duplication of effort when needed informa-
tion was obtained.
Approaching the second portion of this thesis investiga-
tion required careful adherence to a systematic database
design strategy. The goal was to select several logical
database design strategies, to discuss the relative merits of
each, and to select those techniques which seemed most
applicable to the problem in question. Emphasis was placed
upon the collection of data information and the associated
analysis. Data entities and attributes were obtained,
relationships between entities were established, and pre-
liminary schema designs were undertaken. Due to the presence
of a current DBMS (DMS-1100), it was required to define schema
designs in terms of the network model so as to provide
timely availability of research information. An analysis of
the resulting designs was done to determine database size and
transport volume. This analysis provided an aid for decisions'4
regarding future refinements or alterations of the logical
designs to more effectively meet the information needs of
USACAA.

Thesis Organization
The second chapter discusses the aspects of systems
analysis and how these techniques were applied to the descrip-
tion of the development/preparation of the Threat Force File.
Chapter Three addresses and defines those aspects and
concepts of logical database design that are relevant to the
- understanding of this work. Attention is directed towards
data collection/analysis, determination of the data processing
requirements, specification of the logical databases without
regard to data-model requirements, and lastly, determination
of data-model specific logical databases. Additionally, an
evaluation of several existing logical database design
' . strategies is provided.
The fourth chapter concentrates on the use of the system-
atic design strategy in the structuring of the CEM V output
file into logical database designs and development of the
network specific schemas.
The concluding chapter presents recommendations and
conclusions steming from this thesis investigation. Areas
and problems worthy of future study are also noted.
6

II. Systems Analysis and theThreat Force File Development
Introduction
V Preparation of the input deck to the Concepts Evaluation
Model requires a number of individual files to be generated,
updated, and integrated to meet the model's operating require-
ments.. The Threat Force File was one specific file that
was identified by USACAA's Data System Team as a worthy can-
didate for a systems analysis.
Under the current policy at USACAA, each study team is
allowed to prepare its own input deck; hence, individual
Threat Force Files, are developed for each different study.
A large effort is undertaken at the beginning of each study
to gather information and data necessary to produce this file.
By multiplying this collection effort by the number of the
study teams involved, one can conceive of problems in the area
of data redundancy, integrity, and duplication of effort. In
addition, a problem of documentation exists with the multiple
sources for the file information, compounding the problems of
-4 redundancy and integrity. In order to fully understand the
process that went into preparation of the Threat Force File,
the first portion of this investigation concentrated on the
definition and documentation of the data collection/file
development process followed by USACAA's four major study
teams: OMNIBUS (US Army Operational Readiness Analysis),
6 - RQ (Requirements), TAA (Total Army Analysis), and IDOFOR
(Improving the Definition of the Objective Force).
7

Following from this work, areas were identified where overlap
existed for possible consolidation or application of data
management techniques to relieve or reduce those previously
discussed problems.
For the purposes of this portion of the thesis investiga-
tion; the definition of systems analysis is defined as:
,... the examination of problems, objectives,requirements, priorities, and constraints inan environment, plus identification of costestimates, benefits and time requirements fortentative solutions. " (Ref 18:13)
Figure 1 describes the interaction between the systems
analysts and the users in defining requirements and developing
sys em specifications.
USERS IWLEMNTORS
RequAirements
Specifications
S Analyst
Defines problem,~determines
feasibility andcreates
ecificatione
Figure 1. Systems Analyst Role (Ref 18:13)
8

In order to proceed with a systems analysis of the Threat
Force File development process, the need for a systematic
approach to the work was a necessity. The careful application
of the structured methodology, as proposed by Weinberg
(Ref 18:279-303), helped to maintain the focus of the
analysis and to direct the effort towards an accurate repre-
sentation of the processes involved. This methodology was
selected over the Structured Analysis Design Technique (SADT)
because of the holistic view towards systems description and
modeling embodied in the structured methodology. The
emphasis placed on data flow diagrams as a graphical communica-
tions medium provided a simple and direct method for inter-
acting with interested parties.
Concepts of Structured Methodology
Structured methodology is a systematic approach to the
development and maintenance of systems (Ref 18:279). It
provides a blueprint for keeping the analysis activity on
course and free of tempting distractions which pay little
benefit yet require the expenditure of precious time
resources. Structured methodology encompasses several
techniques to focus the development effort. As their names
imply, structured analysis, structured design and structured
programming, take a pragmatic view of the system under study.
Weinberg provides the potential systems analyst with nine
phases to cover all the aspects of system analysis from the
conceptual formulation to the maintenance of the finished
product. These phases are: 1) Request Evaluation,
9

2) Systems Survey/Feasibility, 3) Objectives and Priorities
Definitions, 4) Physical Alternatives Definition,
5) Detailed Logical Design, 6) Top-Down Implementation Plan,
7) Detailed Physical Design, 8) Top-Down Implementation and
9) Post Evaluation. The scope of this portion of the thesis
will be limited to a discussion of the first three phases
as they are the key to understanding the following section.
The "Request Evaluation" phase is the initial attempt to
identify and document a current or potential problem of
interest to some organization or set of users. The principle
item, which the analyst focuses on during this time, is the
problem definition. Key questions are: What is the problem
and what is the history behind the problem? An analyst must
look at the problem's environment to ascertain internal/
external sources which affect the problem, the organizational
involvment, and any limiting constraints. Lastly, the analyst
must attempt to determine the effects of the problem on the
organization itself.
Phase 2, the "Systems Survey/Feasibility" portion of the
4 methodology, attempts to take the information gathered
previously and make an initial assessment as to the feasi-
bility of solving the problem. During this time an effort
is made to model the existing system. Through the use of
graphical tools, such as data flow diagrams, the analyst
attempts to capture an accurate description of the way the
systems works. This piece of documentation allows the analyst
to convey initial impressions of the problem, its environment,
10
7
personnel involvement, and problem impact to the users for
verification of accuracy. This is the point at which the
analyst discovers "how business is done." If the situation
and its corresponding description are not totally accurate,
the analyst merely repeats the cycle until there is agreement
among users that the modeled system is correct.
The last phase for discussion in the concepts area is the
"Objectives and Priorities Definition". Following from the
previous phase, this activity takes that information and
attempts to synthesize it into a logical representation of
the situation. The goal here Is to remove physical references
to the system and problem so as to minimize the need for
technical expertise in grasping the complexities of the
,I Q system's logical requirements. This is extremely important
to the user who is not versed in the technical jargon of the
problem but is involved in the decision process. Once the
logical portrayal of the system has been established, the
analyst can direct the focus of attention from the current
to the proposed system environment. While an actual physical
solution is not derived at this point, the groundwork is
prepared for its future creation. As before, data flow
diagrams serve as important communication devices in relating
the analyst's views to those of the users. Less ambiguity is
encountered with the use of diagrams and pictures than through
the use of narrative prose.I
The remaining phases of Weinberg's methodology are
important to overall system development. Because they are not
* 11

addressed in regard to this work, it should not be construed
that these phases are unimportant or optional. Due to the
limited scope of this portion of the thesis investigation,
only the first three phases are applicable to the obtained
results. The following section takes those pertinent phases
and demonstrates their application to the analysis of the
Threat Force File development process.
Threat Force File Development
Request Evaluation. Information needed to develop
Weinberg's Phase 1 was obtained, for the most part, prior to
on-site research at USACAA. The Chief of the Data Systems
Team articulated the perceived problems with the data collec-
tion process across the entire spectrum of the CEM V input
file preparation. It was not until after arrival at USACAA
that the analysis portion of this part of the thesis investi-
gation was narrowed to the specific development of the Threat
Force File.
The initial problem statement that was generated during
this phase was to precisely define and document the data
gathering/processing activities undertaken by the four major
study teams in preparing the Threat Force File. Historically,
the teams had collected needed information as independent
organizational groups. There was very little sharing of
information or means for processing that information such as
common file utilities. Additionally, each team had its own
developed sources from which to obtain the desired data.
12

With this background, the process of quantifying the
impact of the problem was straightforward. Much of the data
collected was redundant, thereby introducing integrity
problems and "staleness" (not the most current information).
Also, a large amount of time and effort was being devoted by
the agency's analysts to gather this data, sometimes at the
expense of its own output analysis activity. Hence, duplica-
tion of effort consumed many unnecessary work hours.
Constraints involved with the problem centered mainly on
the distributed approach to data collection. The policy in
effect during this time allowed the study analysts access to
whatever data sources were applicable to retrieve the required
information. There was no evidence of any agency standards
or established procedures for this type of activity except
for those implied guidelines developed witin the respective
teams.
The beginning days of the on-site research time centered
on unstructured interviews of the various study team members
and other interested parties to confirm the intitial problem
specification. The information gained helped to build the
framework for the following two phases. The approach of
unstructured interviews in the beginning aided in establishing
0Q rapport and understanding between the involved parties. It
also allowed for the free exchange of views without restrict-
ing comments to specific details. This approach provided a
basis for the formulation of structured interviews which
characterized the "Systems Survey/Feasibility" phase of the
analysis.
13
Systems Survey/Feasibility. Phase 2 of Weinberg's
structured methodology proved to be one of the most time
consuming aspects of the on-site research activity conducted
at USACAA. This phase can best be portrayed as an interative
process of system description followed by user verification.
In this case, the system to be described was the Threat
Force File preparation process. The problem inherent to the
system, centered on the data collection activity previously
discussed. The objective of this phase was to develop a set
of physical data flow diagrams for each major study team which
expressed the existing way the Threat Force File was developed.
Prior to diagramming each study team's system, structured
interviews were conducted with the intent of focusing the
thoughts strictly on the process followed to complete the
file's preparation. It was established from the onset of
each exchange that a structured interview should maintain the
focus of the interaction, serve to isolate the needed data,
and preclude the loss of valuable time due to tangents and
"nice-to-know" information. This approach worked well and
was received enthusiastically as the majority of personnel
involved had many things of much higher priority to accomplish.
The initial organization of the interview and follow-on
interviews dealt with questions that had definitive Lesponses.
For example, one question that began the interview was, "What
document(s) initiates the formal study?" Avoidance of
questions that probed opinions, conjecture and beliefs
reduced obstacles to the interview's completion. From this
14

74
organized approach, it became possible to piece together in
data flow diagrams the process that each study team followed
in the development of its Threat Force File.
While obtaining the initial workings of the file's
development was important, it was also critical to verify the
accuracy of the diagrams with the users. This activity
required repetitive application as it was necessary to insure
the physical data flow diagrams accurately portrayed the
system as the users perceived it. Appendices A through D were
the diagrams generated from this phase of the analysis effort.
Objectives and Priorities Definition. This phase of the
methodology served as a transition point from describing the
existing system to postulating possible solutions for the
proposed system (those which attempt to correct the problems).
The goal of this phase was to abstract the physical repre-
sentation of each study team's Threat Force File development
process into an all encompassing logical description of the
system. By abstracting and aggregating (Ref 12), it was
possible to focus attention on the system's logical require-
ments rather than becoming immersed in the physical aspects
under study. The resulting logical data flow diagram had two
benefits: 1) it minimized the requirement for technical
expertise to understand what was being portrayed and 2) it
allowed for the development of proposed alterations, additions
or deletions to the systems requirements.
With regard to the Threat Force File development process,
the individual study team's physical diagrams were consolidated
15

and abstracted to represent the existing logical situation
across all four teams. This activity resulted in the logical
data flow diagram found in Appendix E. This diagram, as with
the others, was reviewed with the users for accuracy and
possible corrections. This document became the starting point
from which changes to the system could be addressed.
The proposed logical data flow diagram (Appendix F),
expresses the consolidation of the data collection activity
and data sources through one centralized process. This would
allow for control and management of the information and also
reduce the problems of data redundancy and inconsistency due
to duplicated collection. Lastly, the hours expended in the
mechanical retrieval of data may be greatly reduced as the
0 needed data is collected only once. Solutions that were
presented as possible alternatives for this process were:
1) the centralization of the data collection activity with
the Data Systems Team, 2) incorporation of a threat-unit
database under the control of the Data Systems Team,
3) automation/control of the preparation and input to the
4 Armed Forces Planning Document and Assumptions (AFPDA),
4) development and standardization of system utilities for use
by the file developers, and 5) centralized authority over
computer resource management. It was understood that these
recommendations were made based upon analysis of the existing
Threat Force File development process and the desire to
alleviate well articulated problems. The final decision for
implementation rests within USACAA and must be weighted against
other competing interests.
16

74
As stated earlier, the remaining phases of Weinberg's
methodology were not addressed as the initial three served
to satisfy the requested evaluation. If the analysis
activity were to continue, preparation of a data dictionary
would begin at this junction. Creation of the data dictionary
for the entire model is under progress as of the time of this
work. Should a desire to continue the analysis exist, the
completion of the data dictionary and inclusion of this
study effort will provide a resource for further refinement
and revision of potential solutions.
17

III. Logical Database Design
V- . "Designing a database is a difficult, complex,and unstructured process. The resulting logicaldatabase structure becomes inadequate when itis unable to satisfy the present and futurerequirements of the organization and its com-munity of users" (Ref 10:1).
Concepts
A database management system (DBMS) can be an effective
tool for the management of data. It can render assistance
in dealing with an organization's informational problems and
improve the decision making capability by providing timely
and accurate information. Conversely, a DBMS can be an ex-
pensive, inflexible, and cumbersome addition of data process-
ing capability which successful organizations can . affprd.
The category into which a DBMS falls is normally cetermined
by the design of the logical database (Ref 14:147).
A database is a total collection of stored operational
data (Ref 4:4, 16:1). The logical database is incorporated
into this definition by providing an abstract representation
of the community user's view of the stored data. This view
is not constrained by the way in which the data is physical-
ly ordered on the storage medium.
Design of a logical database is not a simplistic process.
In order to provide valuable design products, it is necessary
to observe the guidelines of a pragmatic design strategy. A
structured approach maintains the focus of the design effort
on those areas which demand critical attention so as to avoid
development of an unresponsive and ineffective database.
18

There are numerous logical database design strategies
available for use in guiding the design effort (Ref 1,2,5,6,
7,10,11,12,13,14,15). While each strategy has its own unique
characteristics and intricacies, the majority fit well into
four broad areas of design activity. These areas are: 1)
collection/analysis of data, 2) determination of the ques-
tions, decisions and informational needs the data must sup-
port (data processing requirements), 3) the actual devel-
opment of the logical schema design, and 4) description
of the data-model specific logical schema.
The remainder of this chapter will concentrate on under-
standing these design activities and how they integrate to
provide a viable logical database design. Additionally, the
concluding'portion of this chapter will be devoted to a re-
view of current design methodologies.
Data Collection/Analysis. Data collection serves as the
fundamental building block for logical database design. It
is during this phase that potential users of the proposed
database are surveyed for the information that will determine
the composition of the logical database. Information to be
collected consists of data that an organization records and
uses on a routine basis. Additionally, data is collected on
* the informational needs that are not being met or are being
met with difficulty by the existing informational management
system (Ref 13:183).
Survey techniques which dominate the data collection pro-
cess are the oral interview and the written questionaire.
* 19

These two forms of information gathering are widely recogniz-
ed as the most effective methods for obtaining the desired
data (Ref 2:139, 5:141, 7:24, 13:183, 14:147). The logical
- database design, being formulated from "user's views", re-
lies upon the feedback and negotiation exchanged during this
process to insure an accurate representation of the database
specification.
The data analysis portion of the design activity consists
of synthesizing the gathered information into recognizable
structures that reflect an organization's understanding of its
data. Several methodologies share common points in the con-
duct of this activity (Ref 2,5,6,7,10,11,1,14,15). The first
area of commonality is the selection of entities. Entities
are the concepts or objects of interest to an organization
about which facts are kept or recorded (Ref 10;49, 4:8).
Secondly, focusing on those recorded facts determines a par-
ticular set of attributes for each entity. A third area,
which analysis activities share, is the identification of
key attributes. This specific attribute is a unique item of
* information which is used to determine other attributes in
the same entity. Figure 2 provides an example of these re-
cognizable structures. Employee is the entity of interest.
4 Name, Address and Social Security Number are the facts (at-
tributes) and Social Security Number is the key attribute
(unique) which is used to identify the entity facts (Fig. 3).
The last area of common interest is the determination and
definition of relationships between entities. This area
20

e. specifies the known correspondence (mapping property) that
exists between separate entities (Ref 13:142). These mapping
properties fall into three categories: 1 : 1 (one-to-one),
1 : N (one-to-many), and M : N (many-to-many).
The data collection/analysis process is a time consuming
activity which requires a great deal of repetitive applica-
tion between users and database designer. It is most
important that the designer be meticulous in this portion of
the design effort and continually validate the accuracy of
the obtained data. Careful planning and effort invested in
the initial phase of logical database design can build in
flexibility at the earliest stage.
EMPLO'YEE
SOCIAL SECURITY ADDRESS
Figure 2. Entity and Attributes Example
.4
SOCIAL SECURITY # IWIE ADDRESS
4i
Figure 3. Key Attribute Example
21

Data Processing Requirements. This design activity
.TA concentrates on defining current and future data processing
requirements that an organization demands of its data manage-
ment system. The goal is to identify those questions,
decisions, transactions, and applications that the designed
logical database must be able to support in an efficient
manner. The reason for obtaining future requirements is to
introduce flexibility into the design and preclude radical
alteration or restructuring of the database as an organiza-
tion's information demands change.
Many logical database design strategies gather information
on this aspect in much the same manner as expressed in data
collection/analysis. Structured interviews and questionaires
focus attention on specification of the processing require-
ments. This effort helps to involve the users in the design
process and insure the resulting design is not obsolete
prior to implementation.
Other areas which serve as sources for processing'K requirements are an organization's reports and memorandums.
This information highlights those data requirements that an
organization feels are significant. It is also quite possible
during the collection of this information that new and never
before discovered relationships among entities will be
uncovered. This activity provides an additional feedback
mechanism for the data collection/analysis process. These
new, surfaced relationships can be included with the existing
information to enhance the logical database flexibility.
22

Information garnered from determination of the data
processing requirements can be consolidated with the data
previously collected and analyzed. The resulting product
provides the starting point for development of the logical
schema.
Logical Schema Design. The logical schema is a defini-
tion of the proposed database at a high level of abstraction.
The purpose of the abstracted definition is to avoid the
details of specific (hierarchial, network, relational) data-
models. This allows one to view the database's logical
requirements and composition without becoming immersed in the
implementation details.
Current design strategies recognize two principal
components of this phase: first, modeling of individual user
views of the data and secondly integration of individual views
into a single global structure. Modeling of individual views
concentrates on the representation of entities and relation-
ships as perceived by individual parties involved in the
organization. Many techniques are available for this work with
the majority concentrating on a form of graphical representa-
tion (Ref 2,5,6,7,10,11,12,13,14,15).
The development of these individual views further refines4
the requirements of the logical database. The graphical
diagrams generated from this effort must be verified with the
user to insure that the captured representation is accurate.. %
If there are inadequacies with the diagrams, this is the point
at which alterations can and should be made.
23

Finding inconsistencies after physical implementation results
in expensive and time consuming database restructuring.
. -Integration of the individual views into a single global
structure provides a "generic" or abstract view of the entire
logical database specification (community user's view). This
is the logical schema which defines the structure and
* -i composition of the database and which attempts to fulfill the
organization's information requirements. In the majority of
methodologies, the individual views are incorporated, one at
a time, until all have been integrated into a single structure.
Normalization checks (Ref 11,12,13,14,15) are made to reduce
redundancy and remove unwanted relationships and dependencies
between the data entities. The resulting product is a draft
0logical schema design. As with the other intermediate
products, review and verification must be undertaken to elimi-
nate inaccuracies prior to commitment to a data-model specific
logical schema description.
Data-Model Specific Logical Schema Description. This
concluding phase of the design concepts introduce those data-
4model specific details of logical database design. While these
details were purposely omitted from previous discussion, they
now play an important role in translating the logical schema
design into a data-model specific logical schema. The ability
to specify the logical schema, without regard for its
implementation requirements, was valuable for preparation of
" the theoretical portions of the design. In order to provide
a more refined and useable product, however, the logical
schema must be made accessible to commercially available
24

database management systems. These systems fall into threedata-model categories: hierarchial, network and relational
(Ref 4:63, 16:72). The objective of this last design phase
is to transform the logical schema design into a schema design
that conforms to the specifications of the chosen data-model.
Selection of the data-model to be used in the design work may
or may not be within the database designer's span of control.
In most cases, the designer will have to address transformation
of the design based upon the current data-model followed by
the DBMS in use. An overview of this transformation process
is discussed for each type of data-model.
A DBMS that is based upon the hierarchial data-model has
its foundations in the form of a tree structure (Fig. 4).
In this case, the children nodes can have only one parent,
but a parent node may have multiple children. Access to the
information is gained by following pre-defined paths from
parent to child until the appropriate level, containing the
desired information, is found.
Transformation of a logical schema into a hierarchial
4 data-model lies in the ability of the designer to specify the
logical schema's relationships into parent-child relation-
ships. Entities involved become parents or children depending
upon how the relationship is portrayed. Entity information,
that is frequently required, can be located towards the top
of the hierarchy allowing for faster retrieval.
A commercial DBMS founded on the principles of the
network data-model can also be viewed in the parent-child
context (Fig. 6). In this model, however, a child node may have
2": 25
multiple parents. Access to information follows pre-defined
paths as was the case for the hierarchial data-model. The
network data-model though, allows for multiple paths to the
same child. It is not necessary to follow the same path
every time.
Transformation of a logical schema into a network data-
model description is a more much difficult task than the
hierarchial structure. Entities are owners and members with
relationships being portrayed as sets between the two. In
some instances, a connector record must be used to maintain
the functionality of the relationship (Ref 14:150, 15:126).
This data-model is more flexible in terms of information
access than the hierarchial model, but there is an associated
increase in complexity accompanying implementation.
A relational DBMS uses tables as its cornerstone for
information manipulation (Fig 5.). There are no pre-defined
access paths to follow for the data retrieval, as was the
case for the network and hierarchial data-models. Useable
information is obtained through various table operations and
the combining (joining) of tables to specify certain
relationships.
Transformation of a logical schema into a relational
data-model lies in the specification of the entities and
associated attributes into base tables (tables that are
permanently stored in the database). Relationships between
entities are defined through the combination of proper base
tables. While this data-model is the most flexible of the
26
three models discussed, its current commercial availability
is limited. Research is still underway to discover the
ramifications associated with the model's use.
This completes discussion of the functional aspects
required for logical database design. Attention can now be
focused on the review of certain design methodologies and
how they address these principal design activities.
Methodology Review
Having completed an analysis of the pertinent areas
involved in the design of a logical database, attention can
be directed towards specific strategies that attempt to focus
the design activity. Three pragmatic approaches have been
identified for discussion. These strategies are proposed by:
0 1) Teorey and Fry (Ref 13), 2) Holland (Ref 5), and
3) Tsichritzis and Lochovsky (Ref 14,15). The criteria for
selecting these methodologies was based upon the need to
design a real-time database to support model analysis activity
conducted at USACAA. These strategies took an applications
approach to design rather than the academic or theoretical
approach found in most of the research literature.
The remainder of this chapter discusses how each
methodology appears to perform in the functional design areas.
It is from this review that justification for selection and
use of all, or part of a design approach, is based. These
selections will be applied to the development of logical
database designs for the CEM V output (Chapter 4).
27

4
Teorey and Fry MethodoloU. The database design
methodology presented by Teorey and Fry provides a step-by-
step approach to the development of a data-model specific
logical database. While this strategy covers the entire
spectrum of database design, the authors devote the majority
of their work to a discussion of the logical schema design
concepts. The methodology consists of three principal phases:
1) requirements formulation and analysis, 2) logical design,
and 3) physical design. These majcr phases favorably corre-
spond to the general logical database design concepts and can
be reviewed accordingly.
Teorey and Fry accomplish the data collection/analysis
and data processing requirements under their requirements
0. formulation and analysis phase. They recommend the use of
* personal interviews with various levels of management and
key personnel as the means of obtaining an understanding of
the informational requirements of the organization. The data
processing requirements are gathered from the same interview
techniques. The methodology also stresses the use of a data
requirements language as a vehicle for documenting the
information gained during these phases. Identification of
data elements and relationships is postponed until the
logical design phase.
During the logical design phase, Teorey and Fry present
more refined guidelines for the preparation of the logical
schema design. It is during this phase that entities,
attributes and relationships are identified to satisfy the
28
users' needs. The authors recognize the need to incorporate
those data elements into individual models and to integrate
those models into a single global structure. The strategy
emphasizes maximum use of graphical diagrams and encourages
user verification of intermediate design products. This
aspect of the design methodology is extremely detailed and
provides the core of Teorey and Fry's work.
To conclude the logical design portion of their pragmatic
strategy, Teorey and Fry address the transformation of the
logical schema into a data-model specific logical schema.
The authors do not attempt to provide any details regarding
the transformation process but merely to draw attention to
the completion of this activity prior to moving into the
physical design phase.
Taken in total, this methodology does a credible job at
presenting a complete strategy for logical database design.
The phase of logical design was extremely detailed and precise.
Its applications approach left little to chance in the
preparation of the logical schema design. The other design
concepts were treated well, but none approached the depth
accorded to logical schema design.
A feature of interest, covered by Teorey and Fry's
methodology, dealt with the determination of the transport
volume associated with a logical schema design. This tool
provides insight into the amount of information (bytes)
expected to be retrieved under control of a specific data-
base application or transaction. This feature has potential
0 29

application for systems analysis activity and can lead to
*refinement of the logical schema for more efficient data
processing.
In summary, this methodology has good techniques for
development of the logical schema design. Additionally, the
calculation of transport volume is a valuable mechanism for
estimating the efficiency of a logical database design.
Holland Methodology. The Holland design strategy is
limited to the specification of the individual user's views
(one component of logical schema design), rather than treatment
of the entire design process. Holland presents a series of
rules for developing the intermediate products of this design
activity.
0While Holland does not address the data collection/analysis concept formally, he does recommend that certain
information sources be reviewed for determination of the user
views. These areas are: personal interviews of an organiza-
tion's key personnel, review of special demand and routine
reports, informational requirements expressed by preformatted
CRT screens, and potential on-line data demands.
Based upon the information gained from these recommended
sources, Holland concentrates his strategy on the accurate
representation of the data as viewed by the individual users.
The rules he postulates deal with the functional dependencies
of attributes and the selection of appropriate keys to
satisfy those dependencies. Holland does not attempt to
integrate the individual views into one structure, nor does
30

he address normalization checks. Data-model descriptions
are also omitted from the strategy.
This approach is oriented towards a specific utility for
use in logical database design rather than a stepwise
methodology. The rules Holland presents are clear and
instructional. This approach is directed towards real-world
application and less on the details of theoretical concepts.
* The limited scope of the author's work is a good view of one
aspect of the logical schema design concept.
Tsichritzis and Lochovsky Methodology. Similar to the
design strategy of Teorey and Fry, these authors provide a
stepwise approach that closely parallels those recognized
concepts of logical database design. Unlike Teorey and Fry,
0however, an attempt is made to discuss all the design concepts
in the same amount of detail. The methodology presented by
Tsichritzis and Lochovsky is composed of three steps:
1) requirements analysis, 2) enterprise description, and
3) database descrip*ion. The objective of Tsichritzis and
Lochovsky's methodology is the specification of a data-model
specific logical schema that satisfies the user's informa-
tional requirements.
The information found in the data collection/analysis
design concept is obtained through the first two steps of
this methodology. Requirements analysis focuses on gaining
an understanding of the organization and its goals. Informa-
tion collected during this activity concentrates on the data
and processes used by the organization. In addition,
4 31

interviews are conducted and documents studied to further
define and clarify the organization's informational
requirements.
The second step, enterprise description, takes the
information gained from the requirements analysis and
determines the entities, attributes and relationships that will
be involved in the logical schema specification. Tsichritzis
and Lochovsky recommend the use of the entity-relationship
diagram (Ref 3) for graphically portraying the information
under study. These diagrams provide the individual views
of the data.
Tsichritzis and Lochovsky take their developed diagrams
and construct a single abstract structure that is representa-
tive of the global data perspective. Preparation of the
global view is accomplished through the systematic integration
of each individual view. At this point the logical schema
has been specified and is known as the enterprise description.
As a concluding step, Tsichritzis and Lochovsky discuss the
organizaticns specific data processing requirements. The
objective is to obtain all the current and proposed trans-
actions, applications or on-line queries that will be levied
against a database. The logical schema is reviewed against
those requirements and alterations are made as necessary.
The third step of Tsichritzis and Lochovsky's strategy
takes the logical schema (enterprise description) and
translates it into a data-model specific logical schema
(database description). The goal is to conform the logical
32
schema design to the requirements of the data-model used
by the targeted DBMS. The transformation process for each
type of data-model (hierarchial, network and relational) is
discussed in general terms.
The methodology presented by Tsichritzis and Lochovsky
is most complete in its treatment of the concepts of logical
database design. Each activity is discussed with equal regard
and importance. Overall, the methodology provides a sound
approach to the development of a logical database. The
strategy is clear, easy to follow, and takes an applications
approach to solving design problems. Incorporation of better
defined design techniques may further enhance the strategy,
but the framework is more than sufficient to direct the design
effort.
a-3
" 33

on I mm Red 1 121 [snI P21 If Om 1171 Paris I
II I ['A61a0 Paris IL300 335 Utat 1301 Pars 0I3t1 Sift 201Lndon I0 r= Jmes 110 1Paris 400
1511 Ssvim 1201 Lmndon 200
P31 &raw Ik 81 171 Rom I P0 Igrw IRod 1141Ln
St Soft [201 LnnmJ 400
Figure 4. Hierarchial Data-Model (Ref 4:68)
3 SO $NAMl STATUS CITY W so p0 To
20Jme, I Landau St Pr
BMW 30 Pori 51 PT? 400
56 aue 20 IF~m ST Pt 2003* Adis 30 AM..s 31 ps 100
P, PO PNAUG COLOR~W M StT P'? 3004P1 ma Re 12 Lo$52 P2 400
P2 Sk Gro t7 Poum 32 P2 200P3 Swom ISS t7 ft.. S4 P2 200P4 SU" Ped 14 Lado 3 P 3Ps. em ohm 12 Paris P 400
-f ca -os Lno
Figure 5. Relational Data-Model (Ref 4:64)
34

46
46
All 4Jz
d6C
353

IV. Logical Database Design Application - CEM V
Introduction
The Concepts Evaluation Model (CEM V), used by USACAA as
its primary simulation tool, generates a substantial amount
of data output each time the model is run. The output is
checked to be certain that the model is producing an intui-
tively correct response for the given input information.
This process may be repeated several times. When the study
team is satisfied that the model is "calibrated", a baseline
case is established. Model runs generated in response to
changes in the input information are called "excursions".
Multiple excursions may be required to fulfill one study.
V .It is the output produced from these excursions which the
analysts must use in their presentations and briefings. As
these studies relate to problems deemed significant by the
Army Staff, the need for accurate and responsive retrieval
of information is paramount to the success of each study
team. Currently, the study analysts must sift through
.thousands of pages of model printouts to obtain the detailed
information that is requested in these study briefings. It
is this need for precise information that sparked interest in14
the application of database technology to the output pcoduced
by the CEM V.
The scope of this portion of the thesis will be limitedI|- • to the design of logical subject databases to support a more
efficient and responsive use of the CEM V output. The use
of selected design techniques, in accordance with the concepts
36

I
of logical database design, provided the necessary focus for
the development of the desired model databases.
Data Collection/Analysis
Prior to any design work it was necessary to understand
the informational desires and requirements that the specific
designs had to satisfy. The adequacy of the designs is
predicated upon the information gained from this understanding.
This is why the concept of data collection/analysis is so
important to the successful development of any logical data-
base design. While time consuming and frustrating, the
knowledge achieved from this activity can measureably increase
the flexibility of the database and improve the information
management effectiveness.
In the case of the Concepts Evaluation Model (CEM V)
output, structured interviews were conducted with various
members of.the individual study teams. This tool, structured
interviews, was chosen as it allowed for an encouraged maximum
interaction between the designer and the study analysts.
While this technique is not specific to any one design
methodology, it is readily recognized by the majority as a
useful means of gathering information (Ref 2,5,7,13,14,15).
4l Specific questions addressed during the interviews
attempted to concentrate attention on the information that
each study team needed (or desired) for completion of a study
4 requirement. The questions that were asked included:
1. What are the objects (entities) of CEM V output thatare of interest to the study team?
37
2. What is the appropriate name for each entity?
3. What are the facts (attributes) of interest foreach entity?
4. What are the appropriate names for each attribute?
5. What is the domain of values for each entity?
6. What are the known dependencies (relationships)between entities and attributes?
7. What are the unique identifiers (keys) for eachentity?
These questions were taken directly from the Tsichritzis and
Lochovsky methodology (Ref 14:147). The reason for selecting
Nthese questions was due to the detail in which the data
collection/analysis process was covered by these authors. It
was the only methodology that addressed the specifics of this
0 design concept. The other strategies mentioned the need for
the activity but did not present specific recommendations for
approaching the task.
An additional azea that was explored for information was
the reports produced by the CEM V's post processors. Holland,
in his methodology (Ref 5:141), suggested a review of these
documents as a further aid to understanding the informational
needs of the organization. The reports that were analyzed
from the CEM V output were: theater summary, casualty report,
Klogistics summary, item-specific logistics report, tactical
air summary, unit status, and a forward edge of the battle
area (FEBA) trace report. The data gained from these reports
served to confirm the information uncovered during respective
interviews. Additionally, it helped in the further
identification of relationships between data objects.
38

Appendix G provides a list of entities and attributes for the
CEM V output. Appendix H lists the relationships found to
exist among the entities and their associated mapping
properties.
Data Processing Requirements
The second concept to be applied to the design of logical
databases 'or the CEM V was the determination of the data
processing requirements for the individual study teams.
The objective was to identify and document questions, trans-
actions, decisions, and applications that would require
- information contained in the designed, logical databases.
This effort was aimed at capturing the current needs as well
as the projected requirements anticipated by the respective
study teams.
Structured interviews were used as the principal means
for collecting the desired information. As before, this tool
was selected because it facilitated communication of informa-
tion between the parties involved. Additionally, this approach
4emphasized user verification of the information while it was
still fresh in everyone's mind. Questions for this pcrtion
of the design were again extracted from the Tsichritzis and
Lochovsky methodology. These questions served as a
fundamental starting point and were applicable to the goal
of the design activity. The other methodologies, as was
the case in data collection/analysis, failed to adequately
address the aspects of this design concept.
39
Questions that were included in each of the interviews
were:
1. What are the transactions, questions, decisionsthat the study teams need to answer from the CEMV output?
2. What kind of access (retrieval, update) is requiredby each transaction?
3. Which entities, attributes, relationships areinvolved in each transaction?
Appendix I identifies those questions which the individual
study teams found important to their analysis activity.
Logical Schema Design
Design of the logical schema is the first step in actually
specifying the structure of the proposed database. This
concept of logical database design concentrated on the
accurate modeling of the information gained in the data
collection/analysis and processing requirements determination
phases. The two components which comprise this activity were:
1) the specification of individual user views, and
2) incorporation of the individual views into a single global
structure. The result of this activity was a representation
of the logical schema which included the entities and
functional relationships necessary to satisfy the informa-
tional requirements of the organization.
The approach selected for application of this concept to
the CEM V output was provided by the methodology of Teorey
and Fry. These authors devoted a majority of their strategy
to this phase. While maintaining the theoretical correctness
of their work, Teorey and Fry made a great effort to insure
40
R 5 dml d B d 15d 5 m __K 40

the viability of its real-world application.
The authors recommended the use of the entity-relationship
diagram (Ref 3) as did Tsichritzis and Lochovsky for modeling
the various views of the data. This technique was chosen to
describe the various data views of the CEM V output because
of the technique's similarity to the structure of network
data-models. Knowing that the DMS-1100, used by USACAA, was
based upon a network data-model, it seemed a matter of
convenience to use a descriptive tool that would simplify the
future transformation of the logical schema into a data-model
specific logical schema. This idea may seem contradictory,
but the use of entity-relationship diagrams is totally
consistent with the goal of preparing a data-model independent
0 logical schema. These diagrams, while facilitating trans-
formation to a network structure, could be used to transform
a logical schema into a relational or hierarchial data-model.
The entity-relationship diagram provided a convenient way to
describe the logical schema with a view towards the final
design activity.
The first aspect of Teorey and Fry's approach to logical
schema design was to identify the individual views and model
them according to the entity-relationship diagram. In the
case of the CEM V output, each of the four study teams was
questioned as to how it saw the relationships between entities
and attributes. Not surprisingly, the individual views
provided by each study team, were consistent with one another
in the way the data was viewed. This observation was due to
4~41

the precise structure of the CEM V output and the ovt-rlapping
- study requirements between teams. In several cases, however,
one team had a view of the data that another team had not
even considered. As these veiws were obtained and modeled,
they were reviewed and verified with the study teams to insure
an accurate representation. The resulting entity-relationship
diagrams are provided in Appendix J.
Once the individual views were obtained and consolidated,
it was possible to move into the second component of the design
phase, integration of the individual views into a single
global structure. It was during this time that normalization
checks were made to reduce redundancy, insure functional
dependence and remove transitive dependencies.
i Integrating the individual views of the CEM V output
produced a complex global structure. Appendix K demonstrates
the structure resulting from this process. At this junction
the real-world constraints became important to the design.
Members of the Data System Team, upon seeing the complexity
of the logical schema, proposed the use of the individual
team views as subject databases. The idea, in this situation,
was to specify a separate logical schema for each individual
F view. The trade-offs associated with this approach came in
the form of increased redundancy for a more simplified design.
VUSACAA was willing to trade memory useage for logical schemas
that could be used by the untrained study analysts with a
-- minimum of database familiarity. Additionally, the Data
p.4
r42

-' Systems Team felt that it was beyond "in-house" capability to
develop a coded conceptual schema and loader routine to
implement the more complex design. Ultimately, it was
decided to accept the imposition of redundancy into the design
and to use multiple, simple logical database designs to
satisfy the informational demands of the study teams. As a
result, each of the individual views in Appendix J became a
logical schema specification.
Data-Model Specific Logical Schema Design
Transforming the logical schema designs into a form that
is responsive to a data-model specific DBMS is the goal of
this last design concept. Completion of this activity
0 provided the documentation necessary for the database
administrator to generate the conceptual schemas (programming
language specific database definition).
None of the methodologies reviewed provided the indepth
details needed to accomplish this phase of the design effort.
Tsichritzis and Lochovsky, however, did present a more
specified approach regarding the transformation process than
did the others. The authors focused on a high level perspec-
tive of mapping the entities into records (hierarchial and
network) and base tables (relational). Additionally, they
[.i discussed the representation of entity relationships into
DBTG sets (network) and table joins (relational).
_ .' Appendix L provides the data-model specific logical schemaK.
specifications targeted for use on the network orientedDMS-i100 database management system. The entities are
43

expressed as records and the relationships as sets between
the records. Certain records are structured to insure the
functionality of several relationships. These records, known
as "connector records" in the network structure, are inserted
as a result of the structure's inability to represent many-
to-many (M : N) relationships. The record and set specifica-
tions for the subject databases of the CEM V output are
presented in Appendix M.
Logical Schema Analysis
Conclusion of the logical database design effort does not
end with the specification of the data-model specific logical
schema. Analysis and testing of the logical schema should be
undertaken prior to commitment to physical implementation or
generation of a coded conceptual schema. Computation of the
transport volume and estimated database storage requirements
serve as two measures for the "fine tuning" of the logical
design.
Appendix N provides an estimation as to the size of the
CEM V subject databases. Appendix 0 gives example computa-
tions of the transport volume (as described by Teorey and
Fry) for the logical schemas and the data processing
4requirements of USACAA's four study teams.
~44

V. Recommendations and Conclusions
Conclusions
The purpose of this thesis investigation focused on two
aspects of the data processing activity at the United States
Army Concepts Analysis Agency. The first area studied
concentrated on a systems analysis of the processes used in
the development and preparation of the Threat Force File by
the four major study teams at USACAA. The second area was
concerned with the design of logical databases to support the
information retrieval requirements associated with the
Agency's use of the Concepts Evaluation Model (CEM V).
The systems analysis performed on the Threat Force File
graphically portrayed the activities and interactions which
took place during the prepartaion of this file for use with
the CEM V. The documentation obtained from this analysis
aided in the identification of those areas of overlap,
redundancy and commonality that existed among the four study
teams. The principal result was verification of the impact
that the individual data collection processes had on the
development of the file. It can be concluded that a restruc-
turing of this one process (data collection) could achieve
improved system performance and effectiveness by minimizing
redundancy and eliminating excessive duplication of effort.
Additionally, restructuring this process would enhance the
integrity of the data by controlling the collection and
distribution of information through documentation of the
data sources.
45

Turning to the second area of this thesis investigation,
a series of logical subject databases were designed for use
* - with the output generated from the CEM V. The resulting
data-model specific schemas were derived from a generic,
logical database design approach discussed in chapter three.
This strategy was achieved through research of existing design
strategies and abstracted into concepts which categorized
the required design activities. Specific techniques, used to
realize the design concepts, were selected from applications
oriented methodologies. These strategies aided in relating
the theoretical aspects of logical database design to the
real-world requirements of information management. The
designs that resulted are a compromise between the theoretical
S "what should be" and the actual "what can be". An all
inclusive database did not serve the purposes of USACAA at
this point; however, these designs took an initial step to
1) provide intermediate products (logical database designs)
which can be implemented by USACAA, and 2) documentation
that serves as an initial foundation for a single database
when (and if) the agency decides to embrace the idea.
Though the effort directed towards achieving a series of
logical databases was realized, the resulting analysis
surfaced a major area of concern regarding the storage
requirements of these designs. The estimated size of a
majority of the database designs, without taking into account
the space that will be devoted to pointers, is immense. So
much so that it appears the capacity of the DBMS and available
46

memory may be taxed beyond limits. In this case, even though
a structured approach was followed meticulously, the importance
of analysis becomes evident. Commitment to physical imple-
mentation, while possible, should be held in abeyance until
further study clarifies the exact nature of the storage
V requirements.
K Lastly, using information and observations gained from
file preparation analysis, development of a single database
and appropriate applications programs can eliminate the need
for complete input file regeneration. An update, under
database control, of only those data elements where a change
is necessitated would reduce the time spent in manual input
and aid in the development of an automated model-ready file.
0 Recommendations
The systems analysis undertaken with regard to the Threat
Force File should be applied to all individual files which
constitute the CEM V input deck. This would provide indepth
documentation on all the processes and activities which go
into a model-ready file. This information would benefit the
developers of the next generation of CEM V by defining the
manner in which the study teams go about their business.
Further efforts in documenting the system would provide the
management of USACAA with a mechanism for basing decisions
on which administrative techniques could be used to improve
4 system effectiveness.
Analysis of the designed logical databases needs to
continue, especially where physical storage requirements are
47

concerned. Though it was not within the scope of this thesis
investigation to address those physical aspects of design
implementation, it is clear that further effort is necessary
to reduce these massive databases. Follow-on study is
recommended to review, and perhaps redefine, the informational
needs of USACAA's study teams based upon this work.
It is also recommended that additional research effort
be directed towards the development of a single database
through the incorporation of this work and future efforts.
This would encourage increased involvement of students with
USACAA and provide research products that would be valuable
to the Agency's personnel. It appears that budgetary
constraints, normally associated with contract research, could
Pbe lessened with a continued infusion of thesis related
topics into the Air Force Institute of Technology (AFIT).
48
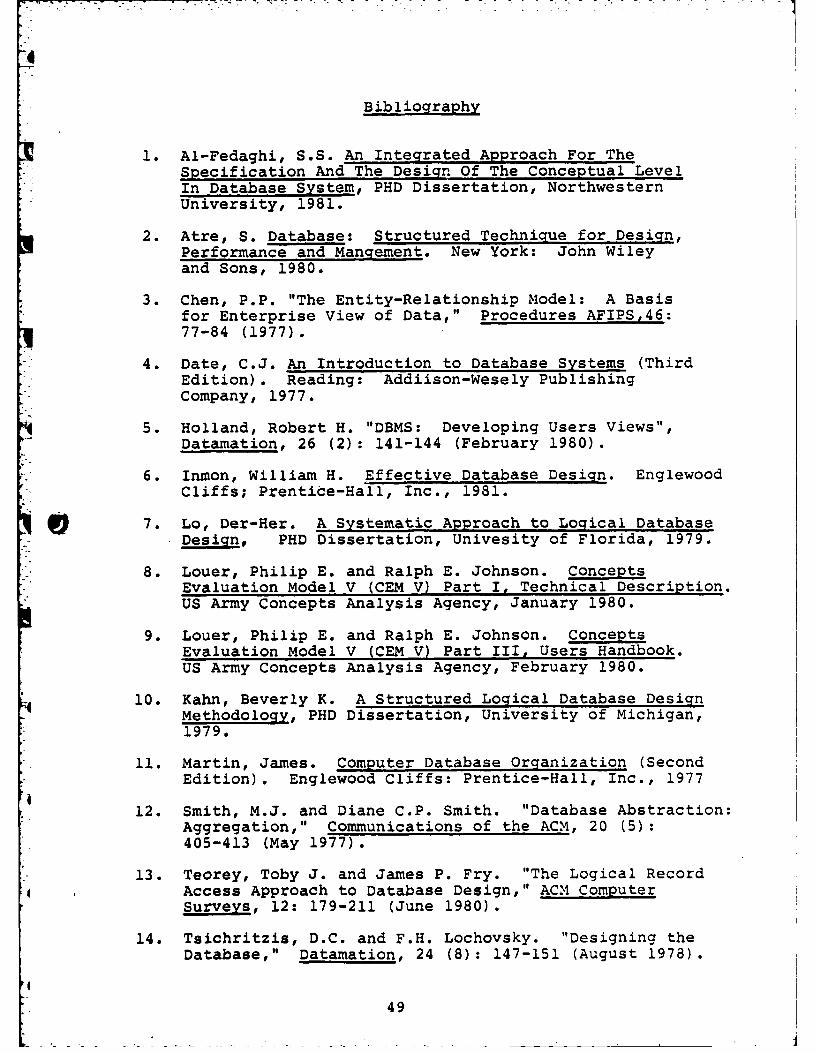
- 7-4
Bibliography
1. Al-Fedaghi, S.S. An Integrated Approach For TheSpecification And The Design Of The Conceptual LevelIn Database System, PHD Dissertation, NorthwesternUniversity, 1981.
2. Atre, S. Database: Structured Technique for Design,Performance and Mangement. New York: John Wileyand Sons, 1980.
3. Chen, P.P. "The Entity-Relationship Model: A Basisfor Enterprise View of Data," Procedures AFIPS,46:77-84 (1977).
4. Date, C.J. An Introduction to Database Systems (ThirdEdition). Reading: Addiison-Wesely PublishingCompany, 1977.
5. Holland, Robert H. "DBMS: Developing Users Views",Datamation, 26 (2): 141-144 (February 1980).
6. Inmon, William H. Effective Database Design. EnglewoodCliffs; Prentice-Hall, Inc., 1981.
0 7. Lo, Der-Her. A Systematic Approach to Logical DatabaseDesign, PHD Dissertation, Univesity of Florida, 1979.
8. Louer, Philip E. and Ralph E. Johnson. ConceptsEvaluation Model V (CEM V) Part I, Technical Description.US Army Concepts Analysis Agency, January 1980.
9. Louer, Philip E. and Ralph E. Johnson. ConceptsEvaluation Model V (CEM V) Part III, Users Handbook.US Army Concepts Analysis Agency, February 1980.
10. Kahn, Beverly K. A Structured Logical Database DesignMethodology, PHD Dissertation, University of Michigan,1979.
11. Martin, James. Computer Database Organization (SecondEdition). Englewood Cliffs: Prentice-Hall, Inc., 1977
12. Smith, M.J. and Diane C.P. Smith. "Database Abstraction:Aggregation," Communications of the ACM, 20 (5):405-413 (May 1977).
13. Teorey, Toby J. and James P. Fry. "The Logical RecordAccess Approach to Database Design," ACM ComputerSurveys, 12: 179-211 (June 1980).
14. Tsichritzis, D.C. and F.H. Lochovsky. "Designing theDatabase," Datamation, 24 (8): 147-151 (August 1978).
49
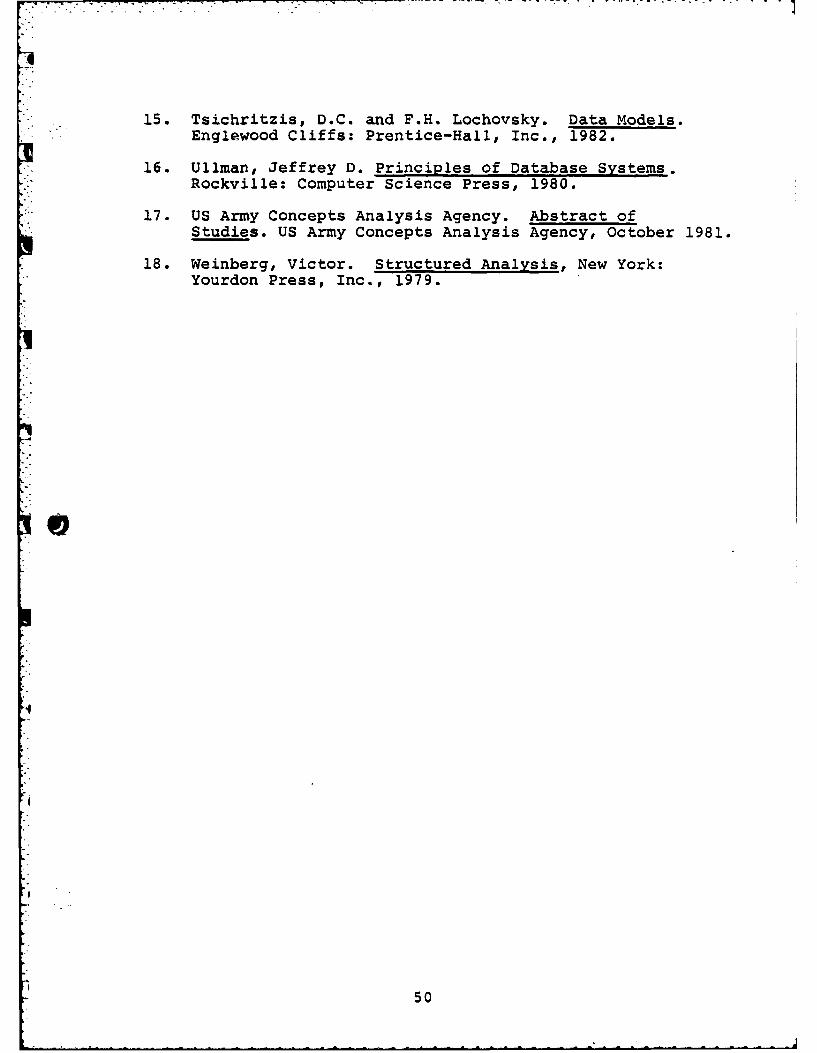
15. Tsichritzis, D.C. and F.H. Lochovsky. Data Models.Englewood Cliffs: Prentice-Hall, Inc., 1982.
16. Ullman, Jeffrey D. Principles of Database Systems.Rockville: Computer Science Press, 1980.
17. US Army Concepts Analysis Agency. Abstract ofStudies. US Army Concepts Analysis Agency, October 1981.
18. Weinberg, Victor. Structured Analysis, New York:Yourdon Press, Inc., 1979.
50

Appendix A
Physical DFD's -OMNIBUS Study Team

411-
iL
/-
k"C
L0
0.0
52c

V.-
2
10.
gas.
00
-4
53A
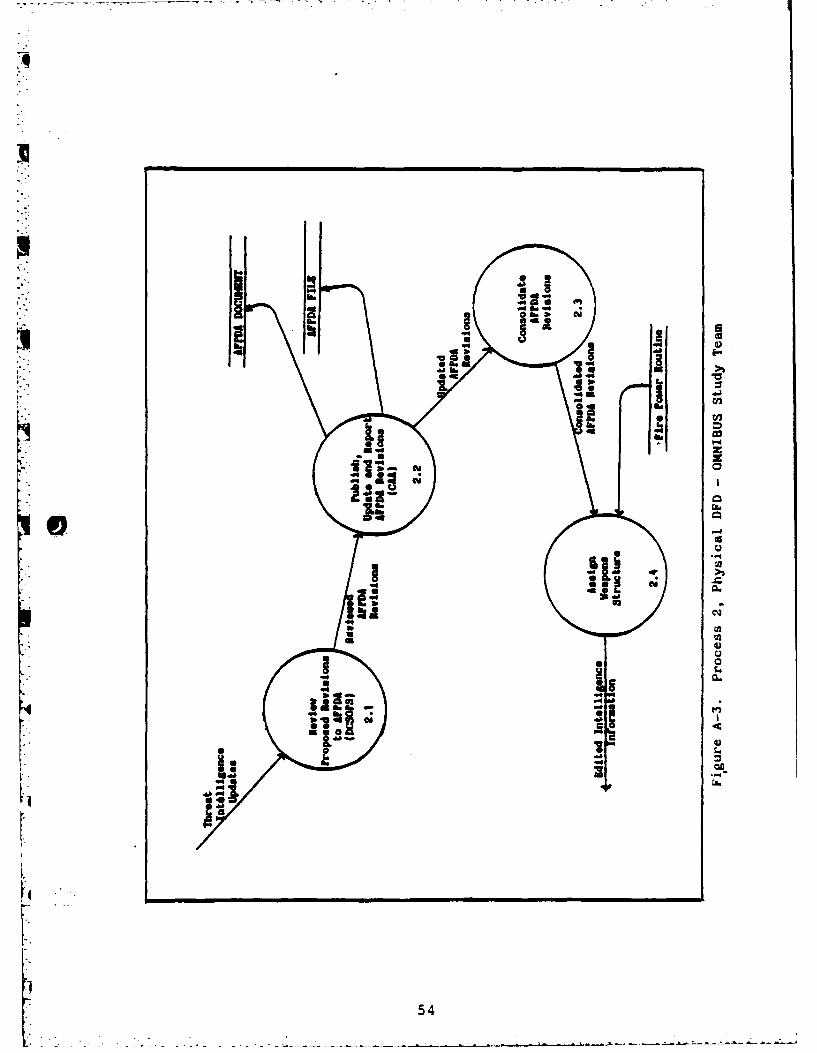
jigV
W
IO
ab.
54~
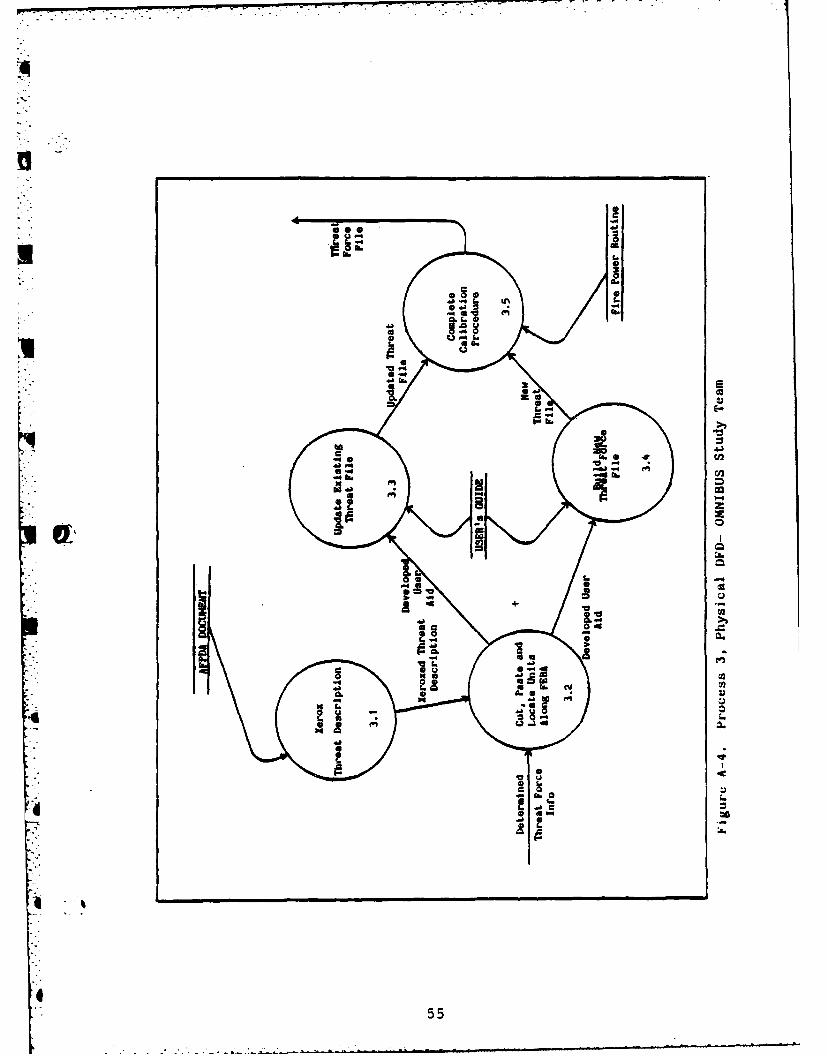
4L,
AA964
3 L.
dCu
C6u
do
aU
CL 0 16
550
Appendix B
Physical DFD's -TAA Study Team
56

IDU
-0 c-
04 a (
-4 41 0
S 0
44.-
a e
57

00
LOE
10
00
L. c.
00L.4
.bc.
11 co
vU
580

00
x C -0 nen L
E 0
a0
060
I0159

411
46.
0 i
.0.0
06

Appendix C
Physical DFD's -RO Study Team
61
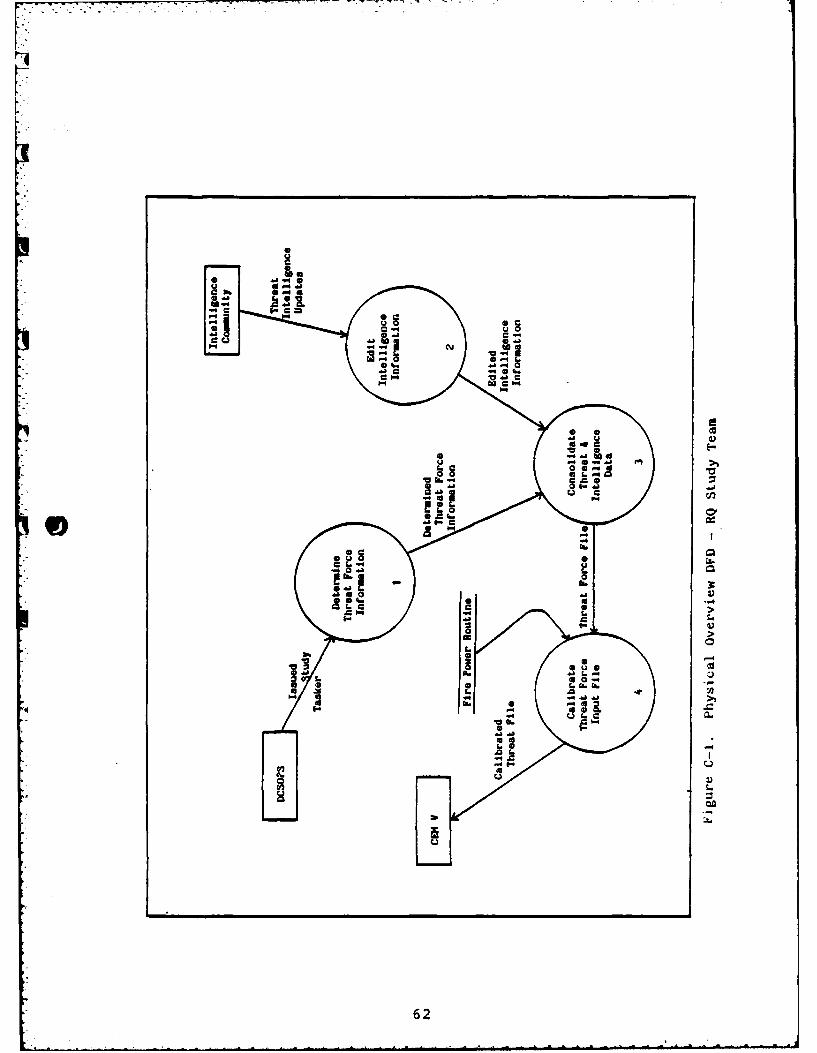
IeI
00
V
41 00
C..
r:n
62

ci
II
1
~~E,-
b.~ ".
4A-63
b :. ":.
- 0
U -°
43

4 ~ . -'.i C
16 *a
b.b
At C
0'
- 00
amld&u
46

rrl
L C
2U
0 4
cc0
Caj
65C

Appendix D
0' Physical DFD's -IDOFOR Study Team
66

4J
-0.0
0 ".bt
a 0~
IA
Q0
67

02
.......
000
0 06060
m 0)
siE-
68

-7-
034))
0 L
00
69S
Q -J

13
C66
UU
6~ :0
asU
400
700

040
A& A&
71u

Appendix E
Logical DFD -All Study Teams
72
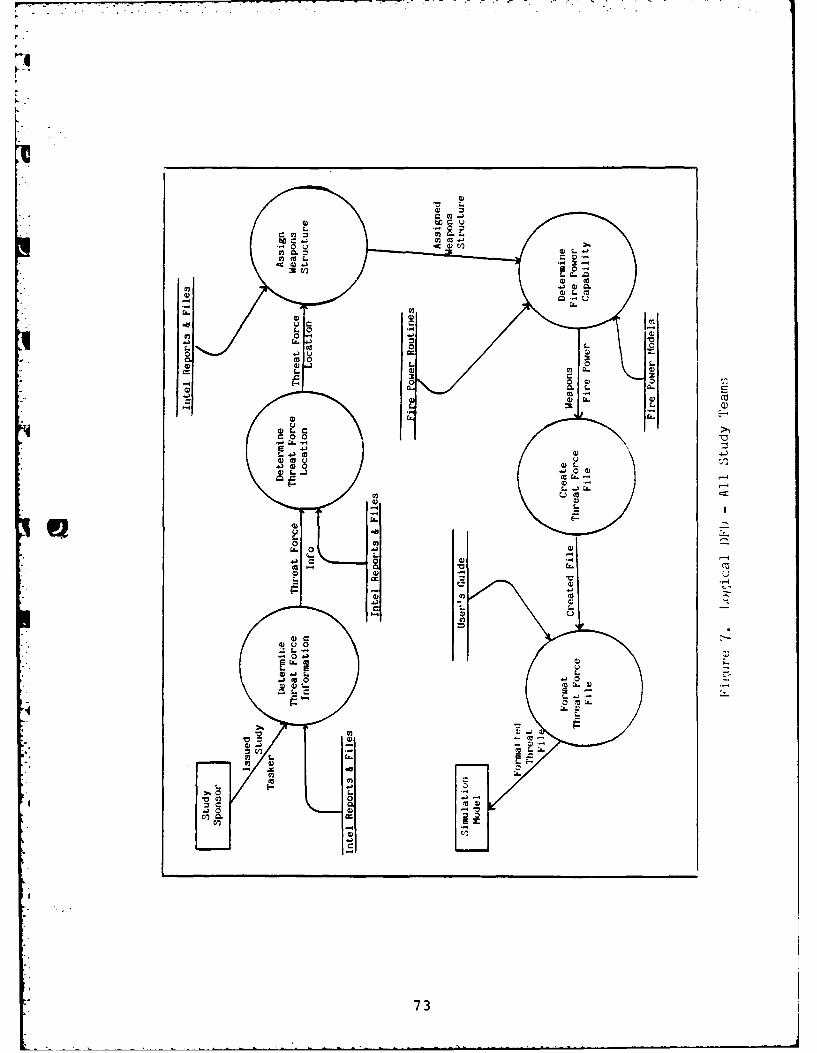
L. 0
4)
L7

Appendix F
V Proposed Logical DFD -All Study Teamts
47

L.
020
NJ 41
00-4
-4
100
a 0
41 6
* 0.
6 0.
2% 0
ca41C
75

Appendix G
Entities and Attributes
Keys are indicated by the underlined attributes.
UNIT INFO unit name, unit type, echelon, authorizedstrength
MISSION DATA mission type
MISSION INFO unit name, theater cycle, mission type
TIME theater cycle
SUMMARY INFO theater cycle, nationality, side
FEBA change, # in-theater divisions,# in-theater GS Arty, # in-theater CAS,# in-theater aircraft, # tons Arty Ammoexpended, # decimated divisions
NATIONALITY nationality type
SIDE side type
DECISION theater cycle, unit name, friendly FP #,ESTIMATE enemy FP #, force ratio, current posture,
decision
FEBA TRACE unit name, theater cycle, side, nationality,
low minisector value, high minisector value
FEBA INFO minisector value
CONSUMABLE LOG resource item, resource categoryINFO
LOGISTICS theater cycle, side, nationality, resourceEXPERIENCE INFO item, unit name, # authorized, # on-hand,
# gains to theater stocks from resupply,# gains to theater stocks from repair,# items in repair, # items lost to combat,# items temporary lost to non-combat,# items permanently lost to non-combat,# items temp lost to maintenance,
LOST/CAUSE theater cycle, side, nationality, resource,item, unit name, # items engaged,# hit by tank, # hit by APC, # hit by AT/M,
* hit by HELOS, # hit by ARTY, # hit by CAS
6 76

AIR INFO theater cycle, side, nationality, unit name,# primary TAC fighters, # sancturary TACfighters, # A/D fighers, fighters, % TACfighters, AR/4 % TAC fighters CA, % TACfighters CAS, # primary aircraft destroyedon ground, # aircraft destroyed
CASUALTY INFO theater cycle, side, nationality, unit name,# infantry engaged, # infantry KIA,# infantry CMIA, # crews engaged, # crewsKIA, # crews WIA, # casualties DNBI,# casualties DNBIK, # casualties hospital,# casualties evacuated
7
77

Appendix H
Relationships Between Entities
RELATIONSHIP MAPPING PROPERTY
Casualties by Time 1 N between Time and Casualty InfoCasualties by Side 1 : N between Side and Casualty InfoCasualties by 1 : N between Nationality andNationality Casualty Info
Unit Casualties 1 : N between Unit Info and CasultyInfo
Theater Units 1 : N between Time and Unit InfoForce Units 1 : N between Side and Unit InfoUnit Nationality 1 : N between Nationality and Unit
InfoTheater Air Force 1 : N between Time and Air InfoOpposing Air Forces 1 : N between Side and Air InfoNationality Air Forces 1 : N between Nationality and Air
InfoUnit Air Forces 1 : N between Unit Info and Air InfoTheater Log Lost/Cause M : N between Time and Consumable
Resource InfoOpp Forces Log M : N between Side and Consumable
- Lost/Cause Resource InfoNation Log Lost/Cause M : N between Nationality and
Consumable Resource InfoUnit Log Lost/Cause M : N between Unit Info and Consumable
Resource InfoTheater Log Experience M : N between Time and Consumable
Resource InfoNation Log Experience M : N between Nationality and
Consumable Resource InfoOpp Forces Log M : N between Side and Consumable
Experience Resource Info4 Unit Log Experience M : N between Unit Info and
Consumable resource InfoFEBA Trace by Time M : N between Time and FEBA InfoFEBA Trace by Side M : N between Side and FEBA InfoFEBA Trace by M : N between Nationality and FEBA
Nationality InfoFEBA Trace by Unit M : N between Unit Info and FEBA InfoUnit Decision Estimate 1 : N between Unit Info and
Decision EstimateTheater Decision 1 : N between Time and DecisionEstimate Estimate
r "4 Theater Summary 1 : N between Time and Summary InfoTheater Forces Summary 1 : N between Side and Summary InfoTheater Nationality 1 : N between Nationality and Summary
Summary InfoTheater Missions M : 11 between Time and Mission DataUnit Missions M : N between Unit Info and Mission
Data
78rKi.

Appendix I
I - Data Processing Requirements
The following questions are data processing requirementsdeveloped from interviews with the four major study teamsat USACAA.
CURRENT PROCESSING REQUIREMENTS
1. What is the cummulative FEBA lost?
2. What are the casualties? per day? total?
3. What are the equipment losses? by weapon system?by time? by totals?
4. What is the resource consumption? equipment? personnel?ammo? by day? by equipment item? by time?
5. When are command decisions made? type of decision?
6. What is the FEBA trace? by day?
7. What are the amounts of consumables available vs alreadyconsumed? equipment type? ammo? POL? personnel?by time?
8. What are the permanent/temporary losses for specificresource items? equipment type? POL? ammo? personnel?total? by time?
9. What is the logistic summary? by day? total?
10. What is the daily combat loss/consumption? by majorequipment item? by day? total?
11. What are the minor, major, severe, and chronic resourceitems? by weapons sytem type? by personnel? by time?total?
12. What is the total resupply vs losses? by equipment
item? by weapons system?
13. How many crew KIA/WIA vs specific weapons sytem?
14. How many repairable tanks/light armor? by cycle? total?
15. How many non-crew KIA/WIA? by cycle? cause? total?
16. What is the specific movement of the FEBA? by minisector?
-779
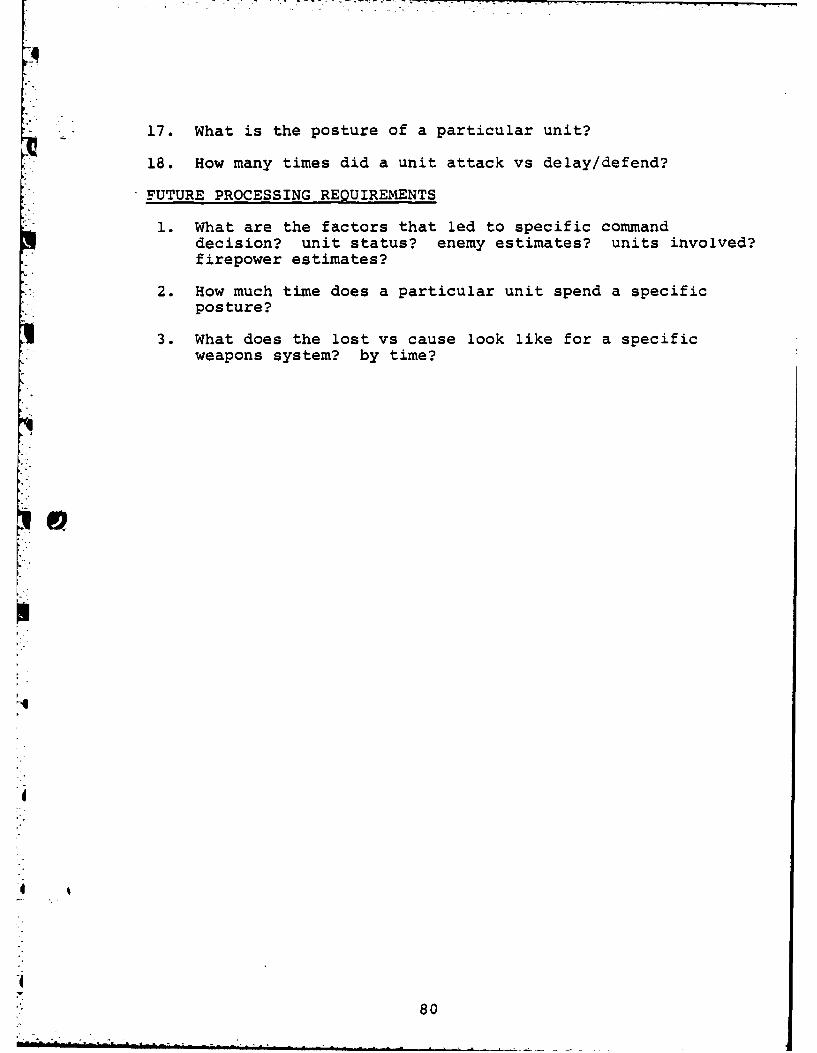
-17. What is the posture of a particular unit?
18. How many times did a unit attack vs delay/defend?
* FUTURE PROCESSING REQUIREMENTS
1. What are the factors that led to specific commanddecision? unit status? enemy estimates? units involved?firepower estimates?
2. How much time does a particular unit spend a specificposture?
3. What does the lost vs cause look like for a specificweapons system? by time?
s
4
'" 80

Appendix J
Entity -Relationship Diagrams
81

L.
0 6
co v0) 1-
q4.
KV
cIo
82
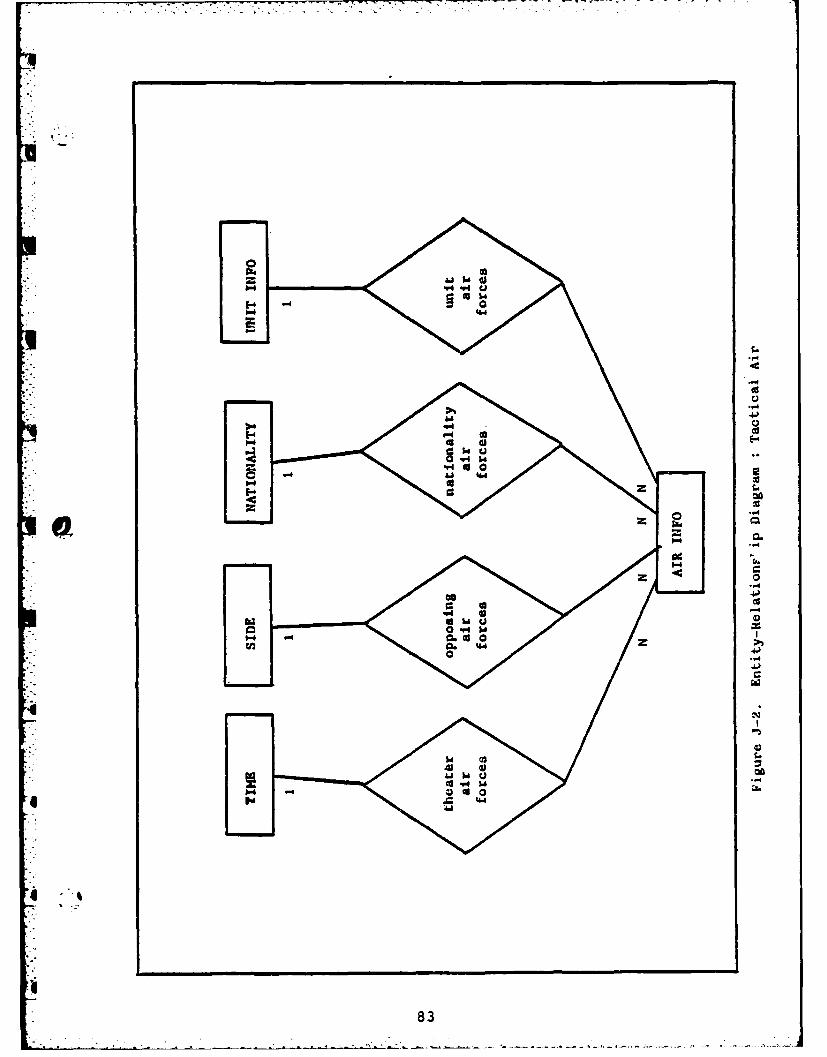
V440-44
0 w
"4 0aj 164a c-
ro L.
Do
ada
V4V
as 0.
83

AjA
E- V 0
1--J
0-4
44u
V4 to 4.
84u

w -- 7
3
0.
41
4-
85

0) 0
M-4
86z
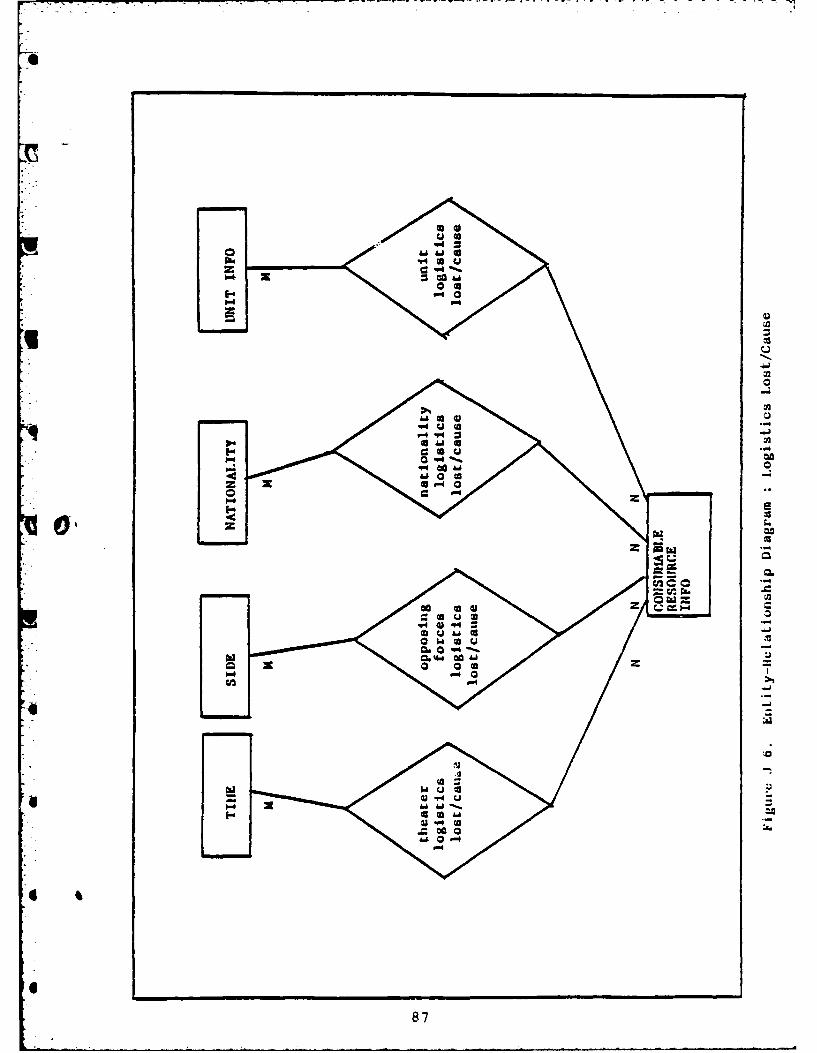
00
00z0
0 u
X 0
87,

AD-A124 891 CONCEPTS EVALUATION MODEL V INPUT-DRTR SYSTEM() AIR 2/2FORCE INST OF TECH WRIGHT-PRTTERSON RFD OH SCHOOL OFENGINEERING J D HIGHTOWER DEC 82 RFIT/GCS/EE/82D-1S
UNCLASSIFIED F/G 9/2 N
mhhhhENDhhimonsoonshhhhI

Vi ...- r
"W5
1.0.
___o f12.
U- -
1.25.
' MATROCOPY RESOLUTION TEST CHART "
NATIONAL BUREAU Of STANDARDS-1963-A
f:
:i"- 'i 1 .- 7 i . .i _. '" ' "

10 l0
14 0 w
CL
X
aa
104 cU10 00 r
-1U141
tom"m4i.8800

09fapa
I4.)
:P-.- 2 V4
to 0
89U

I-..-
r..a
g cc
cc
b0 0
4-4 41
90

Appendix K
0 Logical Schema (Network) -Global Structure
° 91
FV

qME
oo
ta. a=X
4334329
ki$
m0
92I

:44
P1a
0
P.U
goo
44U
93U

U-.
Ic;I
020
adE
goo0
94-C

ft. Q.
ata
-Jim.
ata
95

Appendix L
Model-Specific (Network) Logical Schemas
96

. . . . .1
P-
zO
I.41
P-4~c
97C.

E5.4
98-

cn
1-4 41
E-0
1-4
IS
0
99U

Ir
Icu-ia
o-
I.2.
10

K
0C U,2- zI..
CoCu
04)z
Cu
U
.0
Cj~
Cu
Co0
LL,
Co
101

I4!
0.0
102
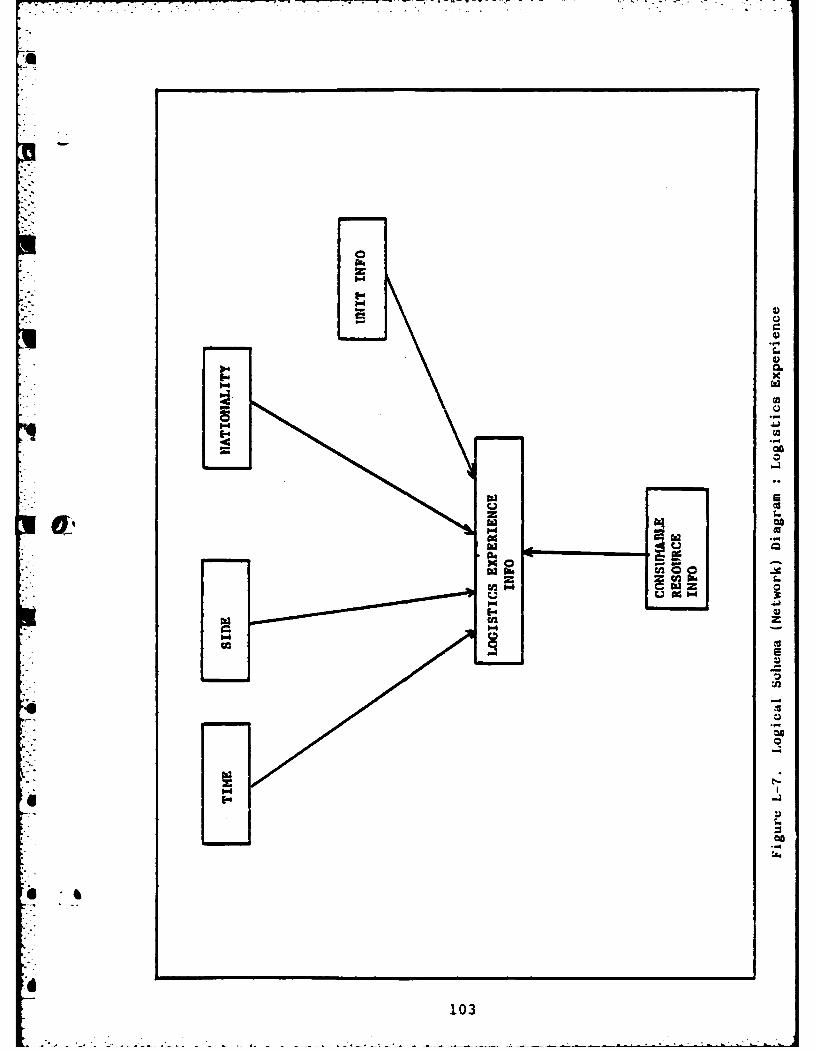
00
0apqDad ca
-e4
cr..
103

77a
00
9.'04
10

0.40
lw44
4P
105

Appendix M
Records and Sets
Records annotated with a "N" indicates a connector record.A connector record, with no data fields, equates the numberof pointers to "# of characters/record". This is to precludethe impression that a connector record has no storagerequirements associated with it. In the records containingdata fields, the pointers are not included in the charactercount.
RECORDS # OF CHARACTERS/RECORDS
RECORD NAME IS UNIT INFOUnit Name 50Unit Type 10Echelon 10Authorized Strength 6
RECORD NAME IS MISSION DATAMission Type 10
RECORD NAME IS MISSION INFOAll Pointers 3
0 RECORD NAME IS TIMETheater Cycle 3
RECORD NAME IS SUMMARY INFOFEBA Change 6# In-Theater Divisions 4# In-Theater Aircraft 4# In-Theater GS Arty 4# In-Theater CAS 4# Tons Arty Ammo Expended 8# Decimated Divisions 4
RECORD NAME IS NATIONALITYNationality Type 25
RECORD NAME IS SIDESide Type 4
RECORD NAME IS DECISION ESTIMATEFriendly FP # 5Enemy FP # 5Force Ratio 5Current Posture 6
" ~Decision 10
RECORD NAME IS FEBA TRACEAll Pointers 4
106
V
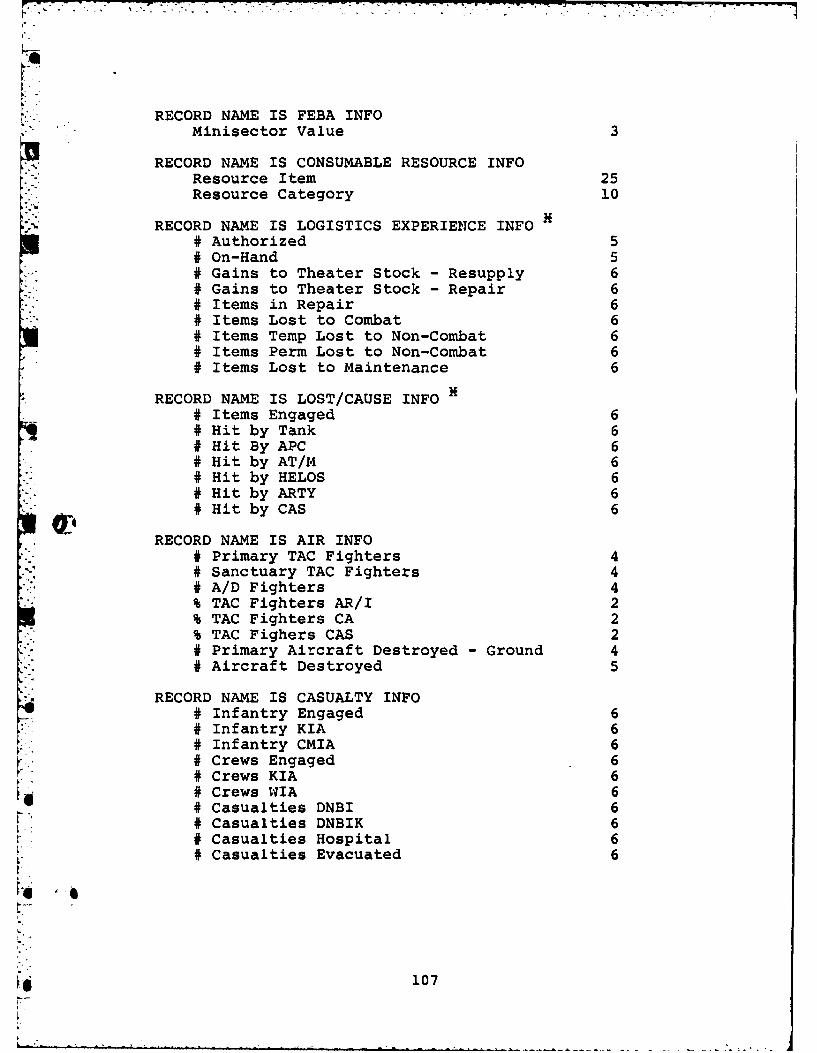
RECORD NAME IS FEBA INFOMinisector Value 3
RECORD NAME IS CONSUMABLE RESOURCE INFO* Resource Item 25
Resource Category 10
RECORD NAME IS LOGISTICS EXPERIENCE INFO# Authorized 5# On-Hand 5# Gains to Theater Stock - Resupply 6# Gains to Theater Stock - Repair 6# Items in Repair 6# Items Lost to Combat 6# Items Temp Lost to Non-Combat 6# Items Perm Lost to Non-Combat 6# Items Lost to Maintenance 6
RECORD NAME IS LOST/CAUSE INFO N# Items Engaged 6# Hit by Tank 6# Hit By APC 6# Hit by AT/M 6# Hit by HELOS 6# Hit by ARTY 6# Hit by CAS 6
RECORD NAME IS AIR INFO# Primary TAC Fighters 4# Sanctuary TAC Fighters 4, A/D Fighters 4% TAC Fighters AR/I 2% TAC Fighters CA 2% TAC Fighers CAS 2# Primary Aircraft Destroyed - Ground 4# Aircraft Destroyed 5
-j. RECORD NAME IS CASUALTY INFO# Infantry Engaged 6# Infantry KIA 6# Infantry CMIA 6# Crews Engaged 6# Crews KIA 6# Crews WIA 6# Casualties DNBI 6# Casualties DNBIK 6# Casualties Hospital 6- Casualties Evacuated 6
107r-

'. ..
SETS
SET NAME IS CASUALTIES BY TIMEOWNER IS TIMEMEMBER IS CASUALTY INFO
SET NAME IS CASUALTIES BY SIDEOWNER IS SIDEMEMBER IS CASUALTY INFO
SET NAME IS CASUALTIES BY NATIONALITYOWNER IS NATIONALITYMEMBER IS CASUALTY INFO
SET NAME IS UNIT CASUALTIESOWNER IS UNIT INFOMEMBER IS CASUALTY INFO
SET NAME IS THEATER AIR FORCEOVDTER IS TIMEMEMBER IS AIR INFO
SET NAME IS OPPOSING AIR FORCESOWNER IS SIDEMEMBER IS AIR INFO
SET NAME IS NATIONALITY AIR FORCESOWNER IS NATIONALITYMEMBER IS AIR INFO
SET NAME IS UNIT AIR FORCESOWNER IS UNITMEMBER IS AIR INFO
SET NAME IS THEATER LOG-TICS LOST/CAUSEOWNER IS TIMEMEMBER IS LOST/CAUSE INFO
SET NAME IS OPPOSING FORCES LOGISTICS LOST/CAUSEOWNER IS SIDEMEMBER IS LOST/CAUSE INFO
SET NAME IS NATIONALITY LOGISTICS LOST/CAUSEOWNER IS NATIONALITYMEMBER IS LOST/CAUSE INFO
SET NAME IS UNIT LOGISTICS LOST/CAUSEOWNER IS UNIT INFOMEMBER IS LOST/CAUSE INFO
SET NAME IS RESOURCE LOST/CAUSEOWNER IS CONSUMABLE RESOURCE INFOMEMBER IS LOST/CAUSE INFO
So108

SET NAME IS THEATER LOGISTICS EXPERIENCEOWNER IS TIMEMEMBER IS LOGISTICS EXPERIENCE INFO
SET NAME IS OPPOSING FORCES LOGISTICS EXPERIENCEOWNER IS SIDEMEMBER IS LOGISTICS EXPERIENCE INFO
SET NAME IS NATIONALITY LOGISTICS EXPERIENCEOWNER IS NATIONALITYMEMBER IS LOGISTICS EXPERIENCE INFO
SET NAME IS UNIT LOGISTICS EXPERIENCEOWNER IS UNIT INFOMEMBER IS LOGISTICS EXPERIENCE INFO
SET NAME IS RESOURCE LOGISTICS EXPERIENCEOWNER IS CONSUMABLE RESOURCE INFOMEMBER IS LOGISTICS EXPERIENCE INFO
SET NAME IS FEBA TRACE BY TIMEOWNER IS TIMEMEMBER IS FEBA TRACE
SET NAME IS FEBA TRACE BY OPPOSING FORCESOWNER IS SIDE
* - MEMBER IS FEBA TRACE
SET NAME IS FEBA TRACE BY NATIONALITYOWNER IS NATIONALITYMEMBER IS FEBA TRACE
SET NAME IS FEBA TRACE BY UNITOWNER IS UNIT INFOMEMBER IS FEBA TRACE
SET NAME IS FEBA VALUESOWNER IS FEBA INFOMEMBER IS FEBA TRACE
SET NAME IS THEATER UNITSOWNER IS TIMEMEMBER IS UNIT INFO
SET NAME IS FORCE UNITSOWNER IS SIDEMEMBER IS UNIT INFO
SET NAME IS UNITS NATIONALITY' OWNER IS NATIONALITY
MEMBER IS UNIT INFO
109

SET NAME IS UNIT DECISION INFOOWNER IS UNIT INFOMEMBER IS DECISION ESTIMATED
SET NAME IS THEATER DECISION ESTIMATEOWNER IS TIMEMEMBER IS DECISION ESTIMATE
SET NAME IS THEATER SUMMARYOWNER IS TIME
MEMBER IS SUMMARY INFO
SET NAME IS THEATER FORCES SUMMARYOWNER IS SIDEMEMBER IS SUMMARY INFO
SET NAME IS NATIONALITY THEATER SUMMARYOWNER IS NATIONALITYMEMBER IS SUMMARY INFO
SET NAME IS THEATER MISSIONSOWNER IS TIMEMEMBER IS MISSION INFO
SET NAME IS UNIT MISSIONSOWNER IS UNIT INFOMEMBER IS MISSION INFO
SET NAME IS MISSION DECISIONSOWNER IS MISSION INFOMEMBER IS MISSTION DATA
.11
~110

Appendix N
Database Size Estimations
This appendix attempts to estimate the storage requirementsfor each of the logical databases designed in this thesis
V investigation. Size estimates are based upon the number* of occurrences of each record type and the size (# of
characters per record occurrence). Storage requirements forpointers are not included in the estimate, except for thoseconnector records that contain only pointers (referenceAppendix M).
CASUALTIES
(360 Time Recs H 3 chars/rec) + (2 Side Recs H 4 chars/rec)+ (4 Nationality Recs H 25 chars/rec) +
(1350 Unit Info Recs H 76 chars/rec) +(3888 K Casualty Info recs K 60 chars/rec)
= 233,383,000 characters
FEBA DATA(360 Time Recs H 3 chars/rec) + (2 Side Recs H 4 chars/rec)+ (4 Nationality Recs H 25 chars/rec) +
* (1350 Unit Info Recs X 76 chars/rec) +(600 FEBA Info Recs H 3 chars/rec) +(3888 K FEBA Trace Recs H 4 chars/rec)
= 15,657,588 characters
TACTICAL AIR(360 Time Recs H 3 chars/rec) + (2 Side Recs H 4 chars/rec)+ (4 Nationality Recs N 25 chars/rec) +
(1350 Unit Info Recs H 76 chars/rec) +(3888 K Air Info Recs H 31 chars/rec)
= 120,634,000 characters
TACTICAL DECISIONS(360 Time Recs H 3 chars/rec) +
(1350 Unit Info Recs H 76 chars/rec) +(486,000 Decision Estimate Recs H 31 chars/rec)
= 15,169,700 characters
* -WAR SUMMARY(360 Time Recs H 3 chars/rec) + (2 Zide Recs H 4 chars/rec)+ (4 Nationality Recs H 2b chars/rec) +
* ' (2880 Theater Summary Info Recs H 34 chars/rec)
- 99,108 characters
b111
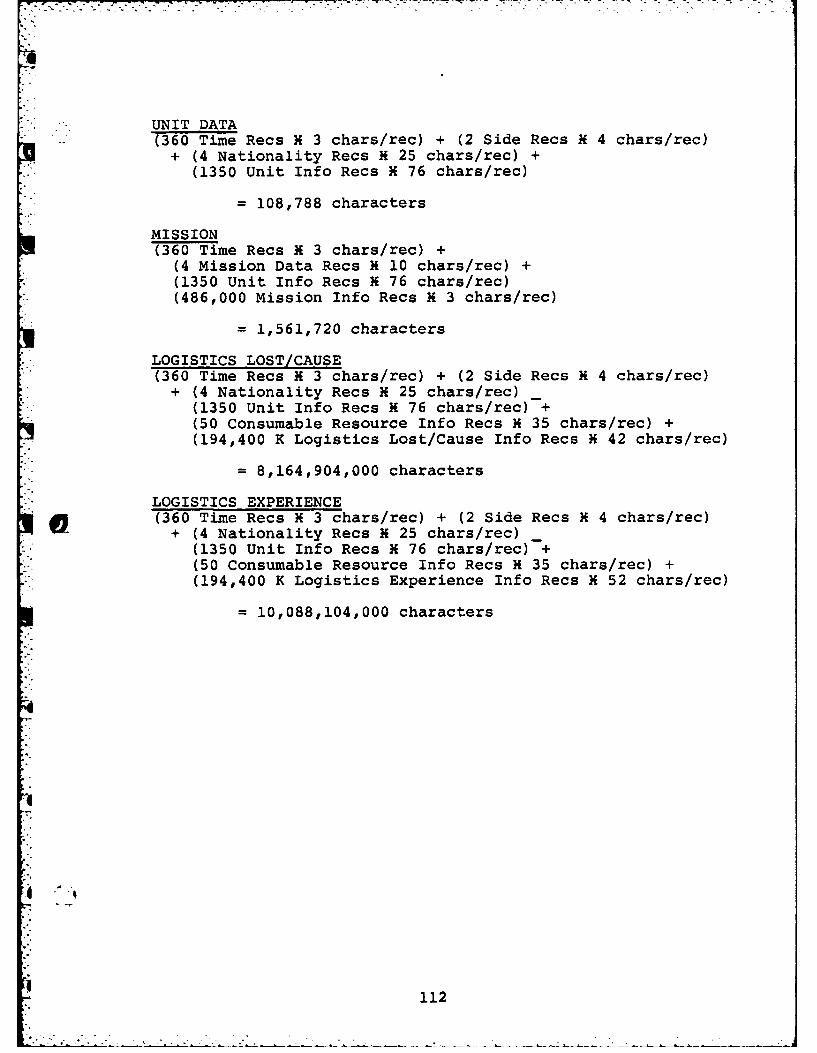
UNIT DATA- (360 Time Recs H 3 chars/rec) + (2 Side Recs X 4 chars/rec)
+ (4 Nationality Recs H 25 chars/rec) +(1350 Unit Info Recs H 76 chars/rec)
= 108,788 characters
MISSION(360 Time Recs H 3 chars/rec) +(4 Mission Data Recs H 10 chars/rec) +(1350 Unit Info Recs X 76 chars/rec)(486,000 Mission Info Recs H 3 chars/rec)
= 1,561,720 characters
LOGISTICS LOST/CAUSE(360 Time Recs H 3 chars/rec) + (2 Side Recs H 4 chars/rec)+ (4 Nationality Recs H 25 chars/rec)
(1350 Unit Info Recs H 76 chars/rec) +(50 Consumable Resource Info Recs H 35 chars/rec) +(194,400 K Logistics Lost/Cause Info Recs H 42 chars/rec)
- 8,164,904,000 characters
LOGISTICS EXPERIENCE(360 Time Recs H 3 chars/rec) + (2 Side Recs H 4 chars/rec)+ (4 Nationality Recs H 25 chars/rec)
(1350 Unit Info Recs H 76 chars/rec) +(50 Consumable Resource Info Recs H 35 chars/rec) +(194,400 K Logistics Experience Info Recs H 52 chars/rec)
= 10,088,104,000 characters
112
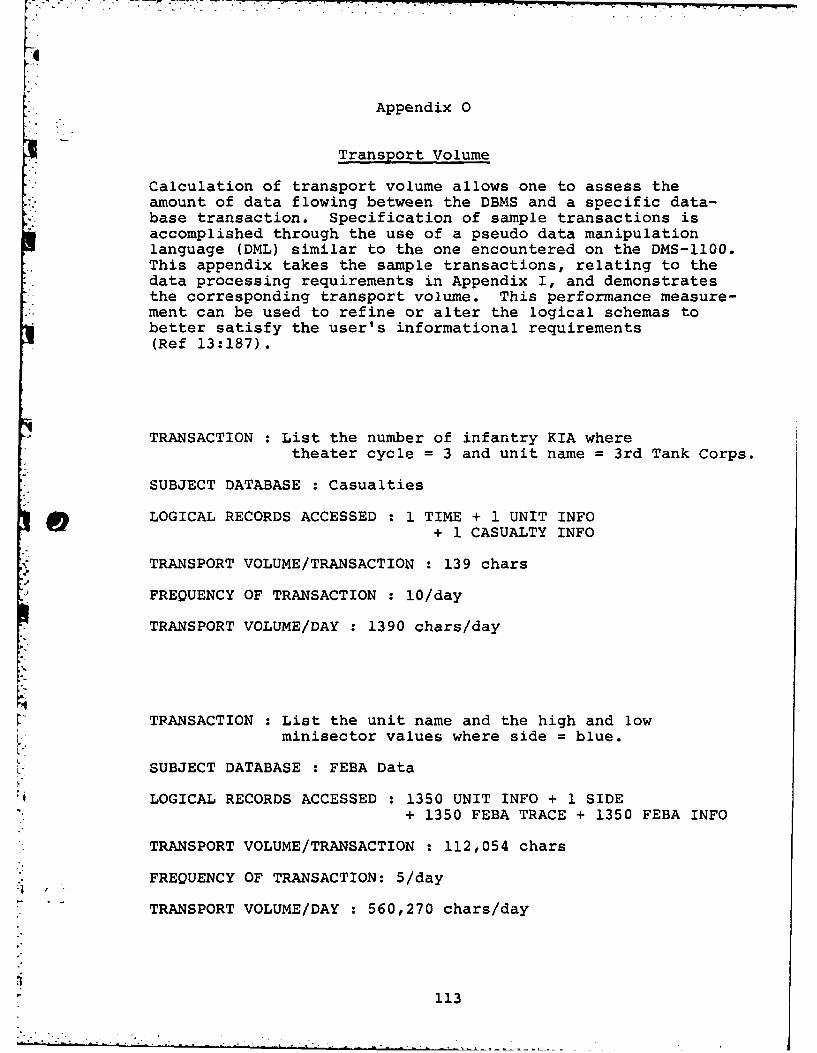
K- .
Appendix 0
Transport Volume
Calculation of transport volume allows one to assess theamount of data flowing between the DBMS and a specific data-base transaction. Specification of sample transactions isaccomplished through the use of a pseudo data manipulationlanguage (DML) similar to the one encountered on the DMS-1100.This appendix takes the sample transactions, relating to thedata processing requirements in Appendix I, and demonstratesthe corresponding transport volume. This performance measure-ment can be used to refine or alter the logical schemas tobetter satisfy the user's informational requirements(Ref 13:187).
TRANSACTION : List the number of infantry KIA where
theater cycle = 3 and unit name = 3rd Tank Corps.
SUBJECT DATABASE : Casualties
0 LOGICAL RECORDS ACCESSED : 1 TIME + 1 UNIT INFO+ 1 CASUALTY INFO
TRANSPORT VOLUME/TRANSACTION : 139 chars
FREQUENCY OF TRANSACTION : 10/day
TRANSPORT VOLUME/DAY : 1390 chars/day
TRANSACTION : List the unit name and the high and lowminisector values where side = blue.
SUBJECT DATABASE : FEBA Data
LOGICAL RECORDS ACCESSED : 1350 UNIT INFO + 1 SIDE+ 1350 FEBA TRACE + 1350 FEBA INFO
TRANSPORT VOLUME/TRANSACTION : 112,054 chars
FREQUENCY OF TRANSACTION: 5/day
TRANSPORT VOLUME/DAY : 560,270 chars/day
113

TRANSACTION : List the number of aircraft destroyed wheretheater cycle = 1 and side = blue andnationality = French and unit name = 3rd AirForce.
SUBJECT DATABASE : Tactical Air
LOGICAL RECORDS ACCESSED : 1 TIME + 1 SIDE + 1 NATIONALITY+ 1 UNIT INFO
TRANSPORT VOLUME/TRANSACTION : 108 chars
FREQUENCY OF TRANSACTION : 1500/day
TRANSPORT VOLUME/DAY : 162,000 chars/day
TRANSACTION : List the decision where theater cycle = 1 - 100
and unit name = 11th Infantry Division.
SUBJECT DATABASE : Tactical Decisions
LOGICAL RECORDS ACCESSED : 1 UNIT INFO + 100 TIME+ 100 DECISION ESTIMATE
TRANSPORT VOLUME/TRANSACTION : 3476 chars
FREQUENCY OF TRANSACTION : 2/day
TRANSPORT VOLUME/DAY : 6952 chars/day
TRANSACTION : List the unit type where side = blue and
unit name 24th Army.
SUBJECT DATABASE : Unit Data
LOGICAL RECORDS ACCESSED : 1 SIDE + 1 UNIT INFO
TRANSPORT VOLUME/TRANSACTION : 80 chars
FREQUENCY OF TRANSACTION : 100/day
* .TRANSPORT VOLUME/DAY : 8000 chars/day
i| 114

K. TRANSACTION : List the number of in-theater divisions
where nationality = Non-US NATO.
SUBJECT DATABASE : War Summary
LOGICAL RECORDS ACCESSED : 1 NATIONALITY + 10 THEATER SUMMARY
TRANSPORT VOLUME/TRANSACTION : 365 chars
FREQUENCY OF TRANSACTION : 350/day
TRANSPORT VOLUME/DAY : 127,750 chars/day
TRANSACTION : List the mission where unit name = 11th Armorand theater cycle = 360.
SUBJECT DATABASE : Mission
LOGICAL RECORDS ACCESSED : 1 UNIT INFO + 1 TIME+ MISSION INFO
TRANSPORT VOLUME/TRANSACTION : 82 chars
* FREQUENCY OF TRANSACTION : 3000/day
TRANSPORT VOLUME/DAY : 246,000 chars/day
TRANSACTION : List the number of XM-1 tanks hit by APC'swhere resource item = XM-1 and side = blueand theater cycle = 2 and nationality = US.
SUBJECT DATABASE : Logistics Lost/CAuse
LOGICAL RECORDS ACCESSED : 1 TIME + 1 SIDE + 1 NATIONALITY+ 1 CONSUMABLE RESOURCE INFO
TRANSPORT VOLUME/TRANSACTION : 67 chars
FREQUENCY OF TRANSACTION : 50/day
TRANSPORT VOLUME/DAY : 3350 chars/day
l115

TRANSACTION : List the number of items in repairwhere resource item = XM-I andtheater cycle = 1 - 600.
SUBJECT DATABASE : Logistics Experience
LOGICAL RECORDS ACCESSED : 600 TIME + 1 CONSUMABLE RESOURCE INFO+ 600 Logistics Experience Info
TRANSPORT VOLUME/TRANSACTION : 33,035 chars
FREQUENCY OF TRANSACTION ; 3/day
TRANSPORT VOLUME/DAY : 99,105 chars/day
116
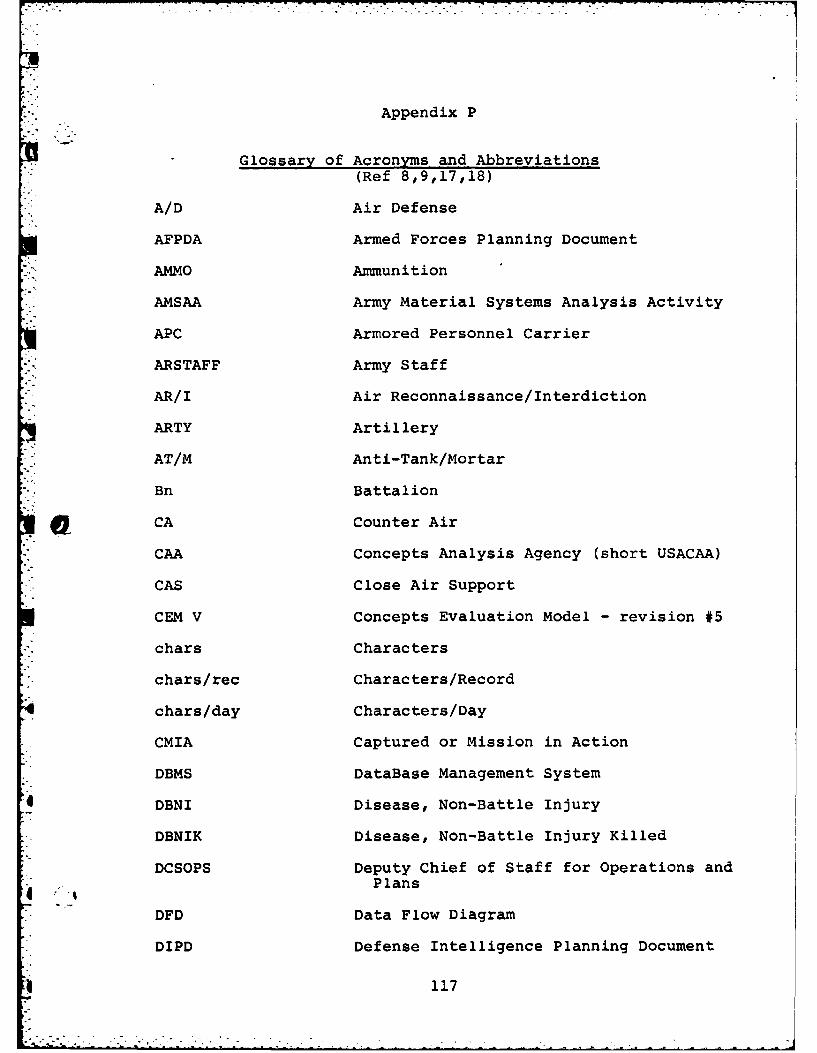
Appendix P
Glossary of Acronyms and Abbreviations(Ref 8,9,17,18)
A/D Air Defense
AFPDA Armed Forces Planning Document
AMMO Ammunition
AMSAA Army Material Systems Analysis Activity
APC Armored Personnel Carrier
ARSTAFF Army Staff
AR/I Air Reconnaissance/Interdiction
ARTY Artillery
AT/M Anti-Tank/Mortar
Bn Battalion
CA Counter Air
CAA Concepts Analysis Agency (short USACAA)
CAS Close Air Support
CEM V Concepts Evaluation Model - revision #5
chars Characters
chars/rec Characters/Record
chars/day Characters/Day
CMIA Captured or Mission in Action
DBMS DataBase Management System
4 DBNI Disease, Non-Battle Injury
DBNIK Disease, Non-Battle Injury Killed
DCSOPS Deputy Chief of Staff for Operations and" Plans
DFD Data Flow Diagram
DIPD Defense Intelligence Planning Document
117

DML Data Manipulation Language
DMS-1100 DBMS used AT USACAA
FEBA Forward Edge of the Battle Area
FP Fire Power
HELOS Helicopters
. IDOFOR Improving the Definition of theObjective Force Study Team
JSPD Joint Strategic Planning Document
Log Logistics
KIA Killed In Action
Nation Nationality
NATO North Atlantic Treaty Organization
OMNIBUS US Army Operational Readiness AnalysisStudy Team
Opp Opposing
recs Records
RQ Requirements Study Team
TAA Total Army Analysis Study Team
TAC Tactical Air Command
tech Technical
TOE Table of Organization and Equipment
USACAA United States Army Concepts Analysis Agency
SADT Structured Analysis Design Technique
* WIA Wounded In Action
1
~118

Vita
- John D. Hightower was born on 06 February 1955 in Denver,
Colorado. He graduated from high school in Golden, Colorado
* in 1973 and attended the United States Military Academy from
which he received the degree of Bachelor of Science in June
1977. Upon graduation he was commissioned in the United States
Army and was stationed at Fort Huachuca, Arizona. Prior to
entering the School of Engineering, Air Force Institute of
Technology in September of 1981, he served as Commander of
the 505th Signal Company, 86th Signal Battalion, lth Signal
Brigade (United States Army Communications Command).
* 119

UNCLASSIFIEDSECURITY CLASSIFICATION OF THIS DA'SE (Whaui flats Mntored)
-~ RPORTDOCUENTAION AGEREAD INSTRUCTIONS____ REPORT__DOCUMENTATION__PAGE BEFORE COMPLETING FORM
1. REPORT NUbIDER CCT~SSION NO. 3. PEf'IOFNr ' CATALOG NUMBER
AFIT/GCS/EE/82D-1 8 ~
4. TITLE (and Subtitle) 5. T'FE OF R.EPORFT &PERIOD COVEREDO
CONCEPTS EVALUATION MODEL V MS THESISINPUT-DATA SYSTEM[
[6. PERF'ORMING ORG. REPORT NUMBER
7. AUTHOR(s) 8. CON RACT OR GRANT NUMBER(s)
John D. HightowerCaptain, US Army
9. PERF~ORMING ORGANIZATION NAME AND ADDRESS 10 =PCG?"AM .LFMENT. PROJECT, TASK~
Air Force Institute of Technology (AFIT-EN) i~ C<UI UBR
Wright-Patterson AFB, Ohio 45433
11. CONTROLLING OFFICE NAME AND ADDRESS 12. REPORT DATE
US Army Concepts Analysis Agency December 1982CSCA-MC 13. NumBER nc PAGES
8120 Woodmont Ave., Bethesda, MD 20814 12814. MONITORING AGENCY NIAME & ADORESS(lI different from Controlling Office) IS. SECURITY CLASS. (of this report)
UNCLASSIFIED
15a. DECLASSIFICATIONWDOWNGRADINGSCH EDULE
III. DISTRIBUTION STATEMENT (of this Report)
Approved for public release; Distribution unlimi.red
17. DISTRIBUTION STATEMENT (of the abstract entered in Block 20, it different from Report)
* III. SUPPLEMENTARY NOTES
Approved rPubh rt-s: 1AW AF7 IIi 91.
20. ABSTWRCT (Continue on rovers@ side if necessary and identiy by block number)
- -A systems analysis was performed on the Threat Force File development processused in conjunction with the Concepts Evaluation Model (CEM V) at the U~nitedStates Army Concepts Analysis Agency. Additionally, logical subject databaseswere designed to facilitate the retrieval of specific information from theoutput generated by the CEM V. A systematic approach provided the focus forresolution of each activity.
* ~DD 1jN21473 EDITION OF' 1 NOV453 13 OBSOLET LCASFE
SECURITY CLASSIFICA.TION *)F THIS PAGE ("oen Dore Entered)
UUNCLASSIFIEDp SECURITY CLASSIFICATION OF THIS PAGE(Whn Dote Entered)
20.
-The resulting systems analysis documents the activities and processesthat the agency's four major study teams go through in preparing the
3Threat Force File for input to the CEM V. Areas were identified forapplication of data management techniques to improve system efficiency.
The database desigr.s resulted from the application of techniquesselected from existing design methodologies. The logical schemaswere transformed into network structures consistent with thedatabase management system (DMS-1100) used by USACAA.
4
UNCLASSIFIED
SECURITY CLASSIFICATION OF THIS PAGEtWhen Date Entered)
- - - --

(
LI