Embed Size (px)
Citation preview
Y9 Summer Homework: Geographical Skills
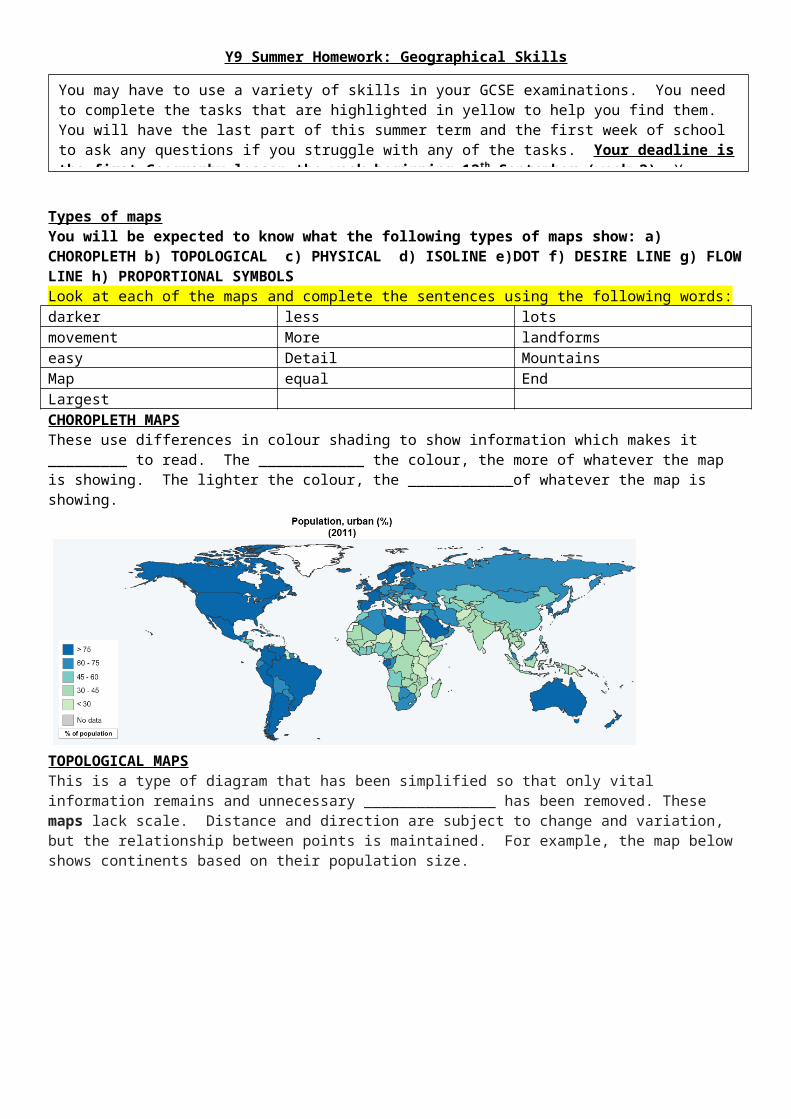
Types of mapsYou will be expected to know what the following types of maps show: a) CHOROPLETH b) TOPOLOGICAL c) PHYSICAL d) ISOLINE e)DOT f) DESIRE LINE g) FLOW LINE h) PROPORTIONAL SYMBOLSLook at each of the maps and complete the sentences using the following words:darker less lotsmovement More landformseasy Detail MountainsMap equal EndLargestCHOROPLETH MAPS These use differences in colour shading to show information which makes it _________ to read. The ____________ the colour, the more of whatever the map is showing. The lighter the colour, the ____________of whatever the map is showing.
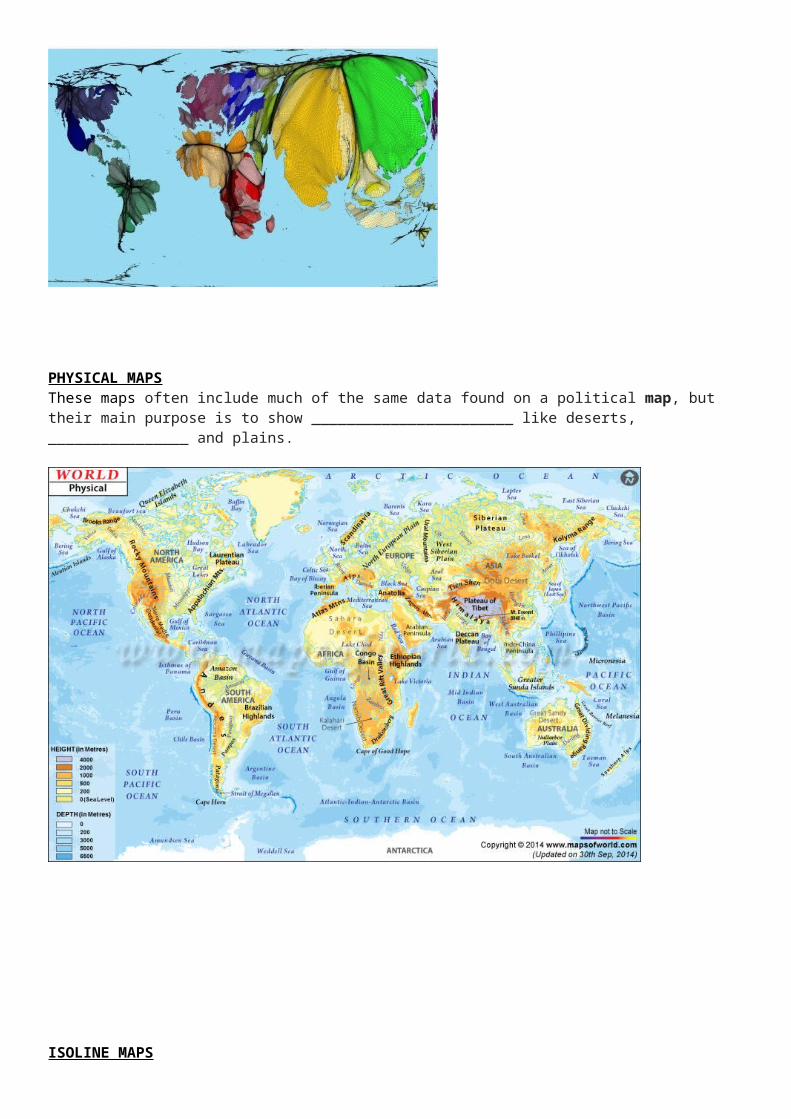
TOPOLOGICAL MAPS This is a type of diagram that has been simplified so that only vital information remains and unnecessary _______________ has been removed. These maps lack scale. Distance and direction are subject to change and variation, but the relationship between points is maintained. For example, the map below shows continents based on their population size.
You may have to use a variety of skills in your GCSE examinations. You need to complete the tasks that are highlighted in yellow to help you find them. You will have the last part of this summer term and the first week of school to ask any questions if you struggle with any of the tasks. Your deadline is the first Geography lesson the week beginning 12 th September (week 2). You will need to use a computer to see the colour.
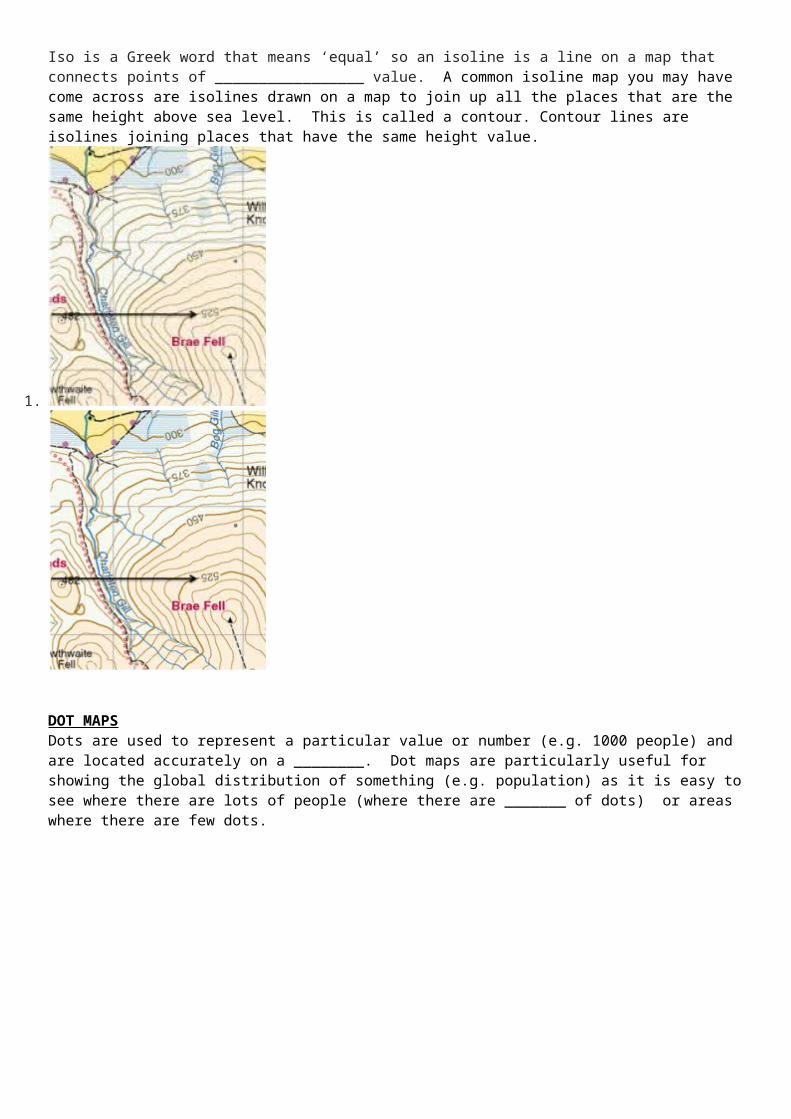
PHYSICAL MAPSThese maps often include much of the same data found on a political map, but their main purpose is to show _______________________ like deserts, ________________ and plains.
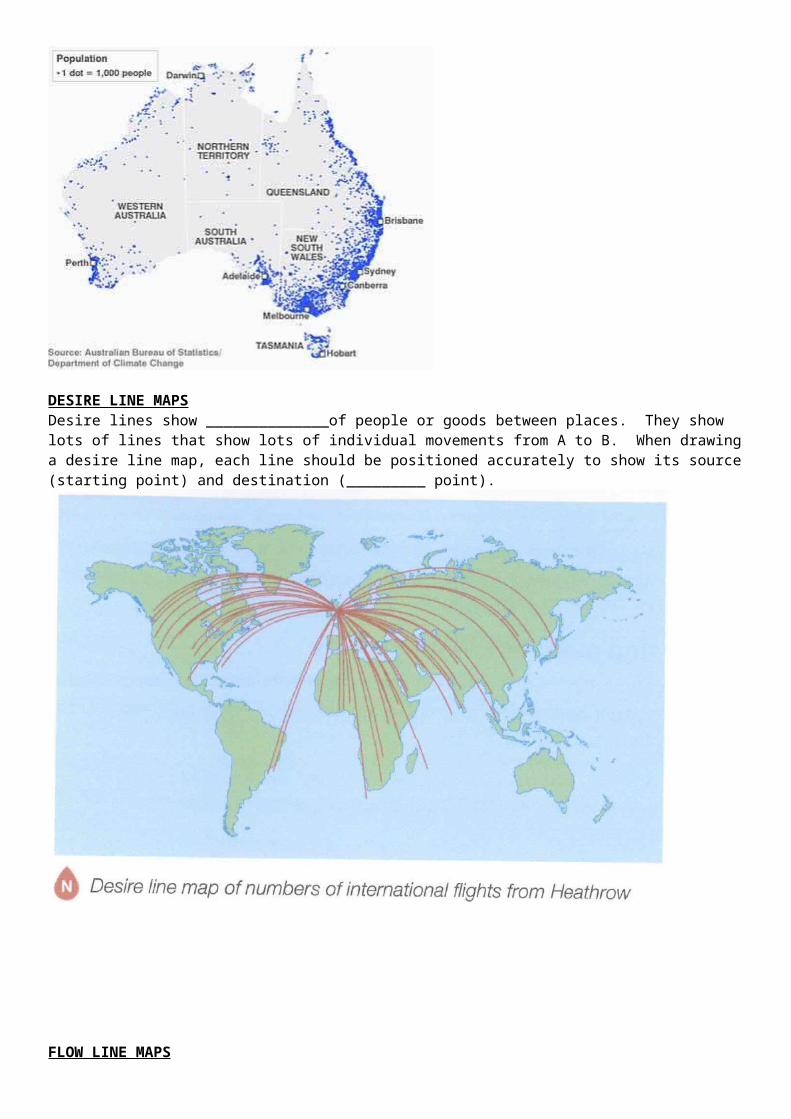
ISOLINE MAPSIso is a Greek word that means ‘equal’ so an isoline is a line on a map that connects points of _________________ value. A common isoline map you may have come across are isolines drawn on a map to join up all the places that are the same height above sea level. This is called a contour. Contour lines are isolines joining places that have the same height value.
1.
DOT MAPSDots are used to represent a particular value or number (e.g. 1000 people) and are located accurately on a ________. Dot maps are particularly useful for showing the global distribution of something (e.g. population) as it is easy to see where there are lots of people (where there are _______ of dots) or areas where there are few dots.
DESIRE LINE MAPSDesire lines show ______________of people or goods between places. They show lots of lines that show lots of individual movements from A to B. When drawing a desire line map, each line should be positioned accurately to show its source (starting point) and destination (_________ point).
FLOW LINE MAPSFlow lines shows movement of people between places like a desire line but also shows the volume (amount) of movement. The thickness of the line represents the volume (amount). The width of each line is in proportion to the percentage of people/goods that have moved. The thicker the line, the _____________ people/goods have moved.
PROPORTIONAL SYMBOLS
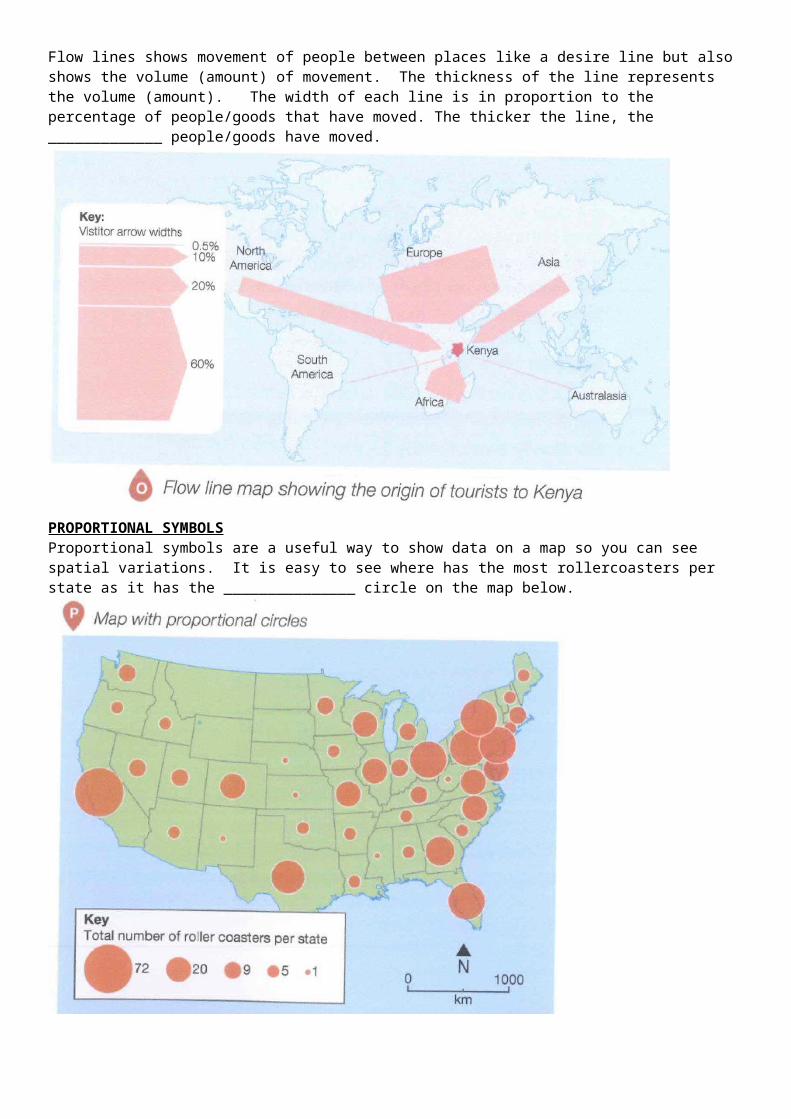
Proportional symbols are a useful way to show data on a map so you can see spatial variations. It is easy to see where has the most rollercoasters per state as it has the _______________ circle on the map below.
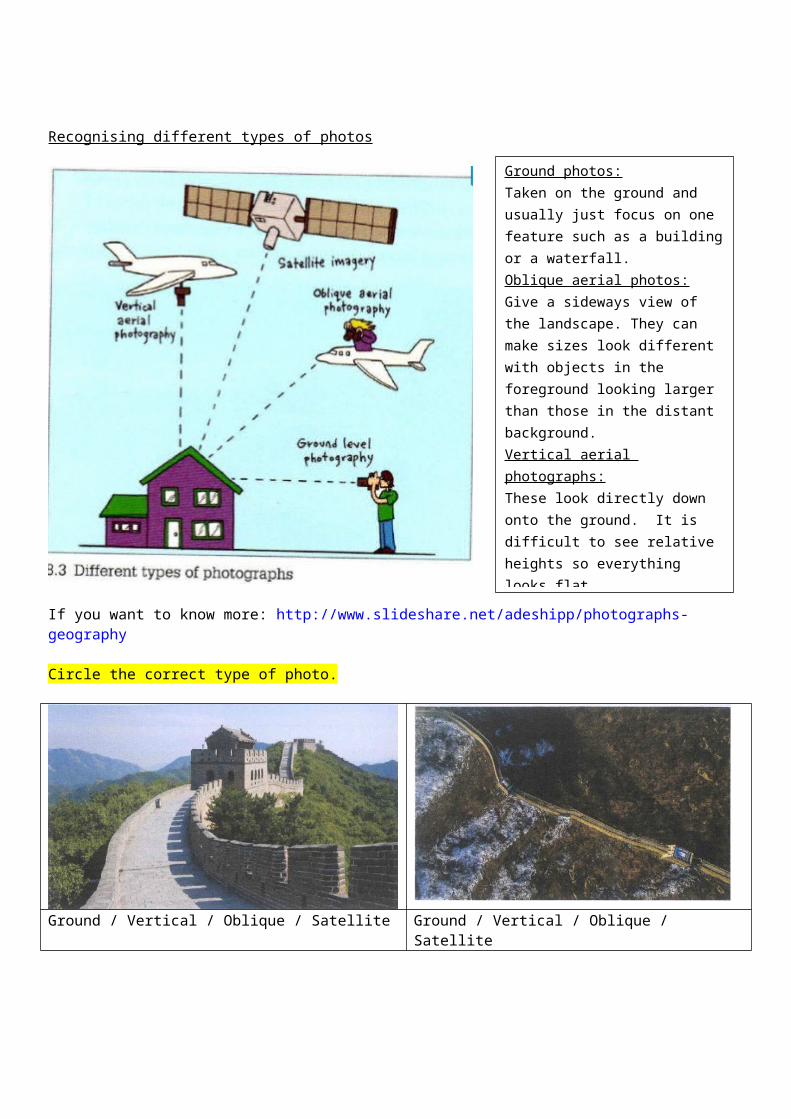
Recognising different types of photos
Ground photos:Taken on the ground and usually just focus on one feature such as a building or a waterfall.Oblique aerial photos:Give a sideways view of the landscape. They can make sizes look different with objects in the foreground looking larger than those in the distant background.Vertical aerial photographs:These look directly down onto the ground. It is difficult to see relative heights so everything looks flat.Satellite photosLike a vertical photo these look directly down on Earth. They show a larger area but have less detail. Satellite photos may be digitally enhanced to make certain land uses show up more clearly (e.g. to show air pollution)
If you want to know more: http://www.slideshare.net/adeshipp/photographs-geography
Circle the correct type of photo.
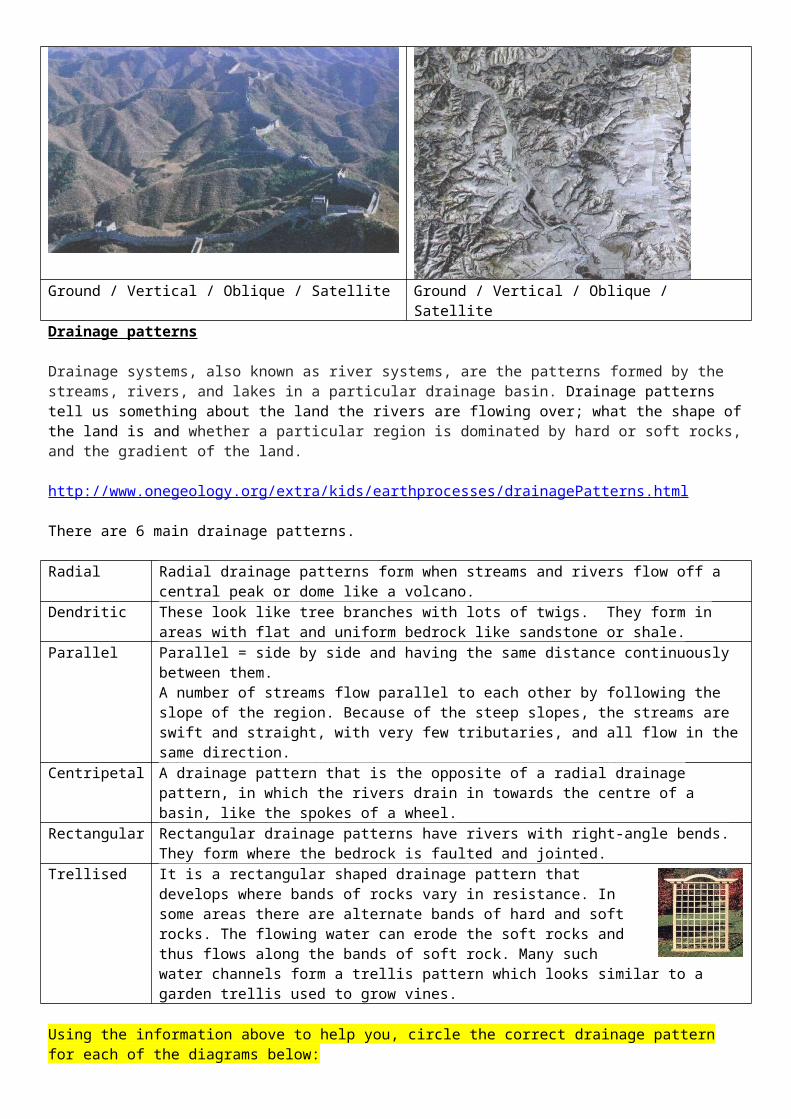
Ground / Vertical / Oblique / Satellite Ground / Vertical / Oblique / Satellite
Ground / Vertical / Oblique / Satellite Ground / Vertical / Oblique / SatelliteDrainage patterns
Drainage systems, also known as river systems, are the patterns formed by the streams, rivers, and lakes in a particular drainage basin. Drainage patterns tell us something about the land the rivers are flowing over; what the shape of the land is and whether a particular region is dominated by hard or soft rocks, and the gradient of the land.
http://www.onegeology.org/extra/kids/earthprocesses/drainagePatterns.html
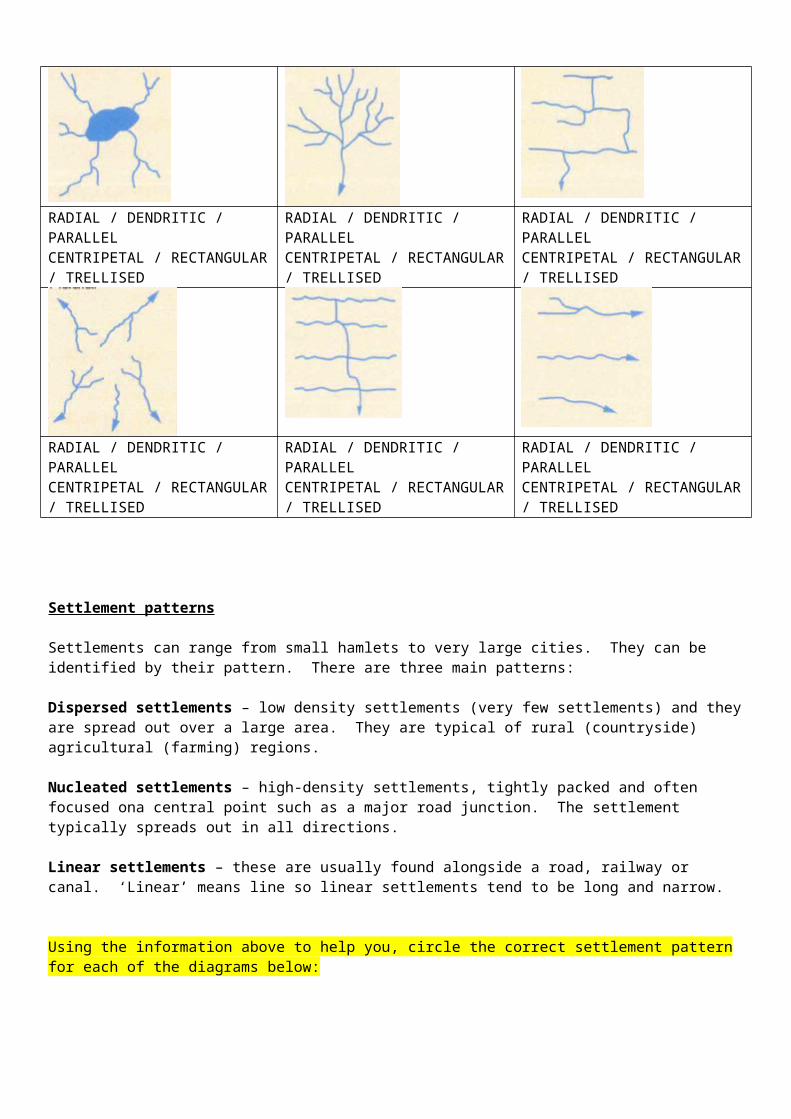
There are 6 main drainage patterns.
Radial Radial drainage patterns form when streams and rivers flow off a central peak or dome like a volcano.
Dendritic These look like tree branches with lots of twigs. They form in areas with flat and uniform bedrock like sandstone or shale.
Parallel Parallel = side by side and having the same distance continuously between them.A number of streams flow parallel to each other by following the slope of the region. Because of the steep slopes, the streams are swift and straight, with very few tributaries, and all flow in the same direction.
Centripetal A drainage pattern that is the opposite of a radial drainage pattern, in which the rivers drain in towards the centre of a basin, like the spokes of a wheel.
Rectangular Rectangular drainage patterns have rivers with right-angle bends. They form where the bedrock is faulted and jointed.
Trellised It is a rectangular shaped drainage pattern that develops where bands of rocks vary in resistance. In some areas there are alternate bands of hard and soft rocks. The flowing water can erode the soft rocks and thus flows along the bands of soft rock. Many such water channels form a trellis pattern which looks similar to a garden trellis used to grow vines.
Using the information above to help you, circle the correct drainage pattern for each of the diagrams below:
RADIAL / DENDRITIC / PARALLELCENTRIPETAL / RECTANGULAR / TRELLISED
RADIAL / DENDRITIC / PARALLELCENTRIPETAL / RECTANGULAR / TRELLISED
RADIAL / DENDRITIC / PARALLELCENTRIPETAL / RECTANGULAR / TRELLISED
RADIAL / DENDRITIC / PARALLELCENTRIPETAL / RECTANGULAR / TRELLISED
RADIAL / DENDRITIC / PARALLELCENTRIPETAL / RECTANGULAR / TRELLISED
RADIAL / DENDRITIC / PARALLELCENTRIPETAL / RECTANGULAR / TRELLISED
Settlement patterns
Settlements can range from small hamlets to very large cities. They can be identified by their pattern. There are three main patterns:
Dispersed settlements – low density settlements (very few settlements) and they are spread out over a large area. They are typical of rural (countryside) agricultural (farming) regions.
Nucleated settlements – high-density settlements, tightly packed and often focused ona central point such as a major road junction. The settlement typically spreads out in all directions.
Linear settlements – these are usually found alongside a road, railway or canal. ‘Linear’ means line so linear settlements tend to be long and narrow.
Using the information above to help you, circle the correct settlement pattern for each of the diagrams below:
DISPERSED / NUCLEATED / LINEAR DISPERSED / NUCLEATED / LINEAR DISPERSED / NUCLEATED / LINEAR
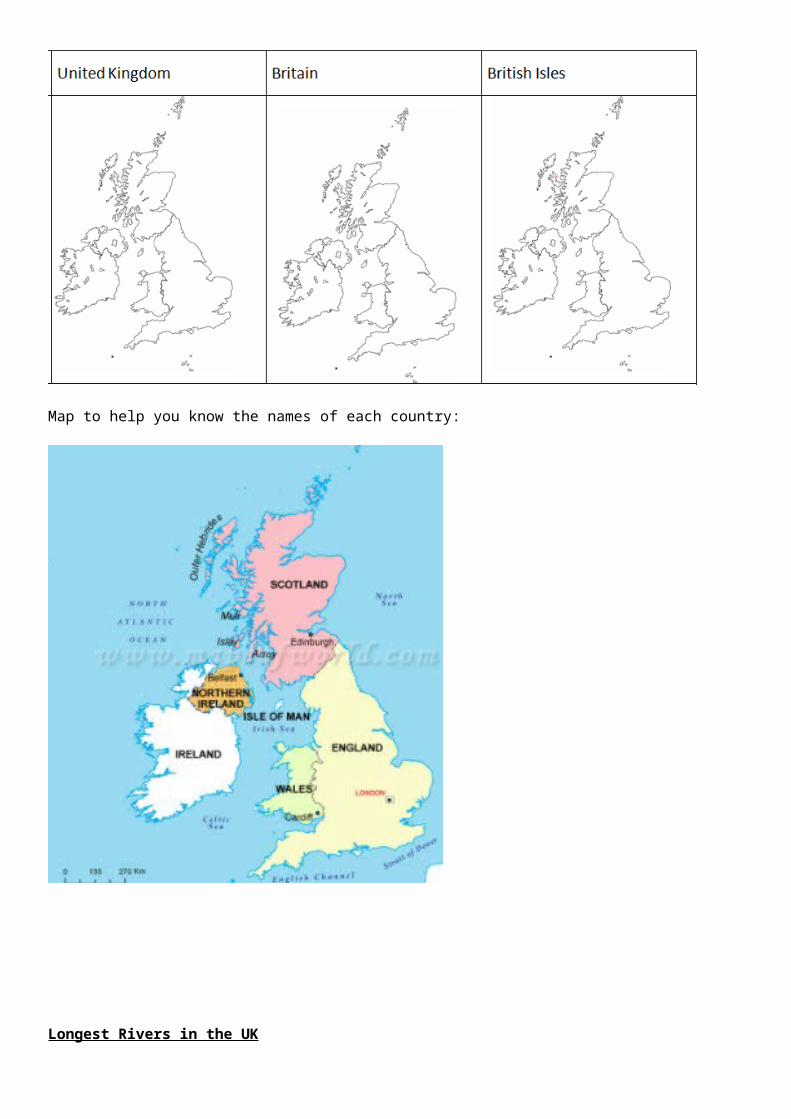
UK PHYSICAL AND HUMAN FEATURESOn the three maps below, colour in the countries that make up: a) the United Kingdom b) Britain c) British Isles. You did this in Year 7 so use your old exercise book or use the internet to help you.

Map to help you know the names of each country:
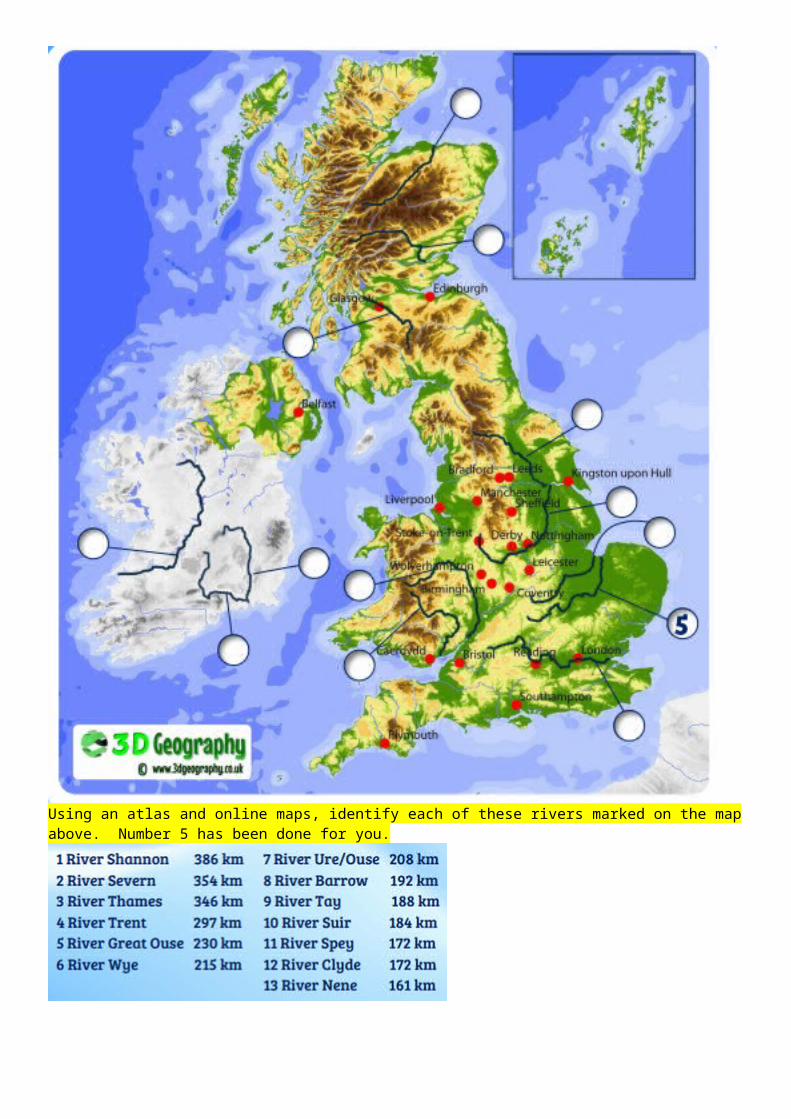
Longest Rivers in the UK
Using an atlas and online maps, identify each of these rivers marked on the map above. Number 5 has been done for you.
On the UK map below, draw an outline of the following mountain ranges and label.
Mountain Ranges: North West Highlands (sometimes called Scottish Highlands)
Grampian Mountains
Southern Uplands
Pennines Cambrian Mountains
Peak District
Cotswold Hills North Downs South Downs Dartmoor Sperrin Mountains
Wicklow Mountains.
Lake District Chiltern Hills
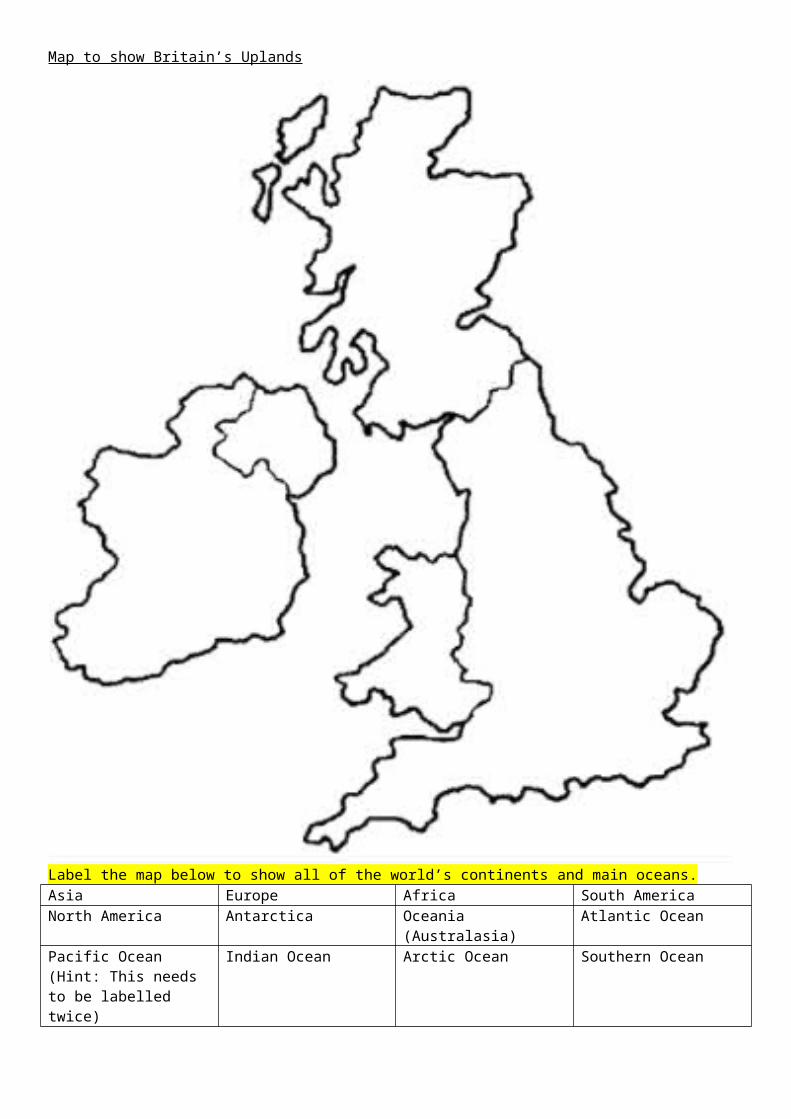
Map to show Britain’s Uplands
Label the map below to show all of the world’s continents and main oceans.
Asia Europe Africa South AmericaNorth America Antarctica Oceania (Australasia) Atlantic OceanPacific Ocean (Hint: This needs to be labelled twice)
Indian Ocean Arctic Ocean Southern Ocean
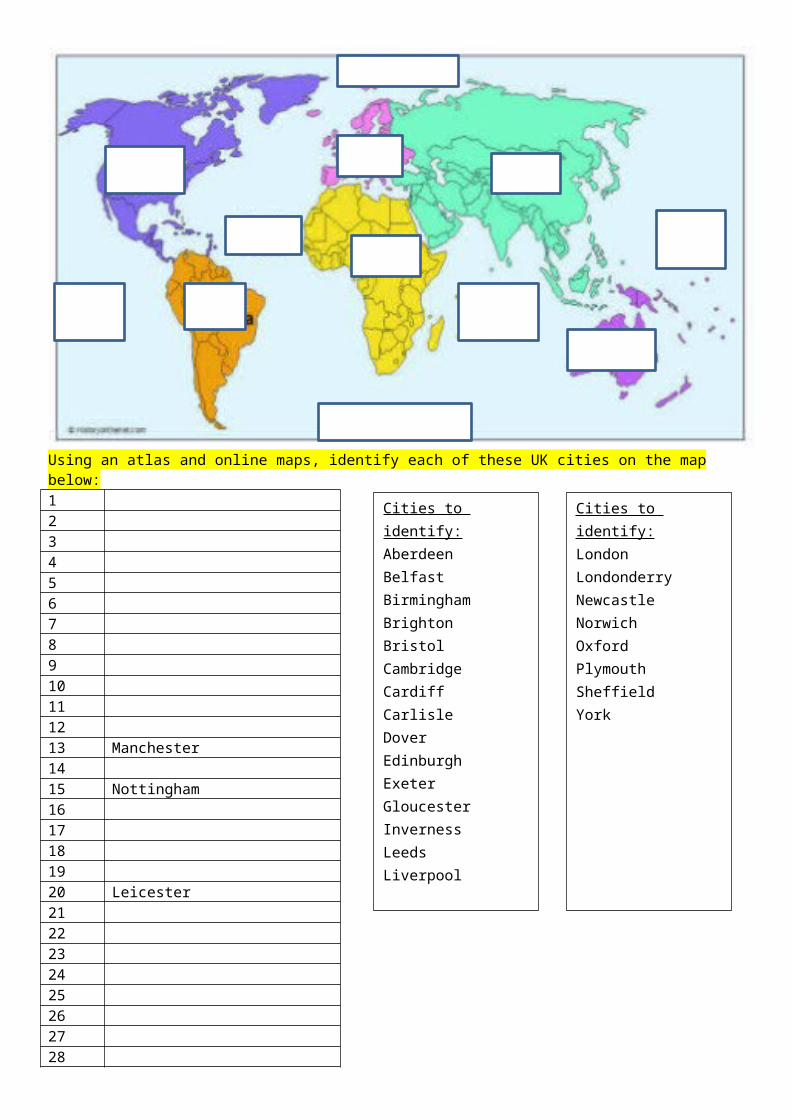
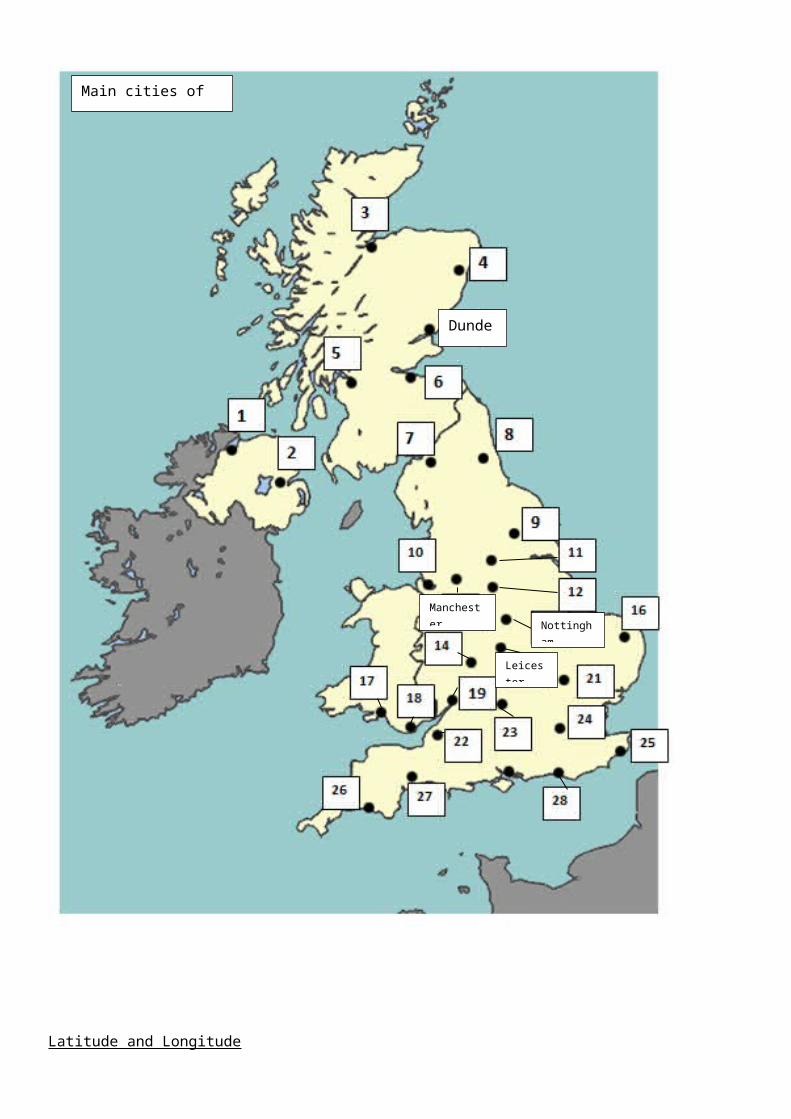
Using an atlas and online maps, identify each of these UK cities on the map below:12345678910111213 Manchester1415 Nottingham1617181920 Leicester21222324252627
Cities to identify:AberdeenBelfastBirminghamBrightonBristolCambridgeCardiffCarlisleDoverEdinburghExeterGloucesterInvernessLeedsLiverpool
Cities to identify:LondonLondonderryNewcastleNorwichOxfordPlymouthSheffieldYork
28
Latitude and Longitude
Main cities of the UK
Dundee
Nottingham
Manchester
Leicester
You did this in Year 7 so you can use your book and this website to help you with the task:
http://www.bbc.co.uk/bitesize/ks3/geography/geographical_enquiry/geographical_skills/revision/6/
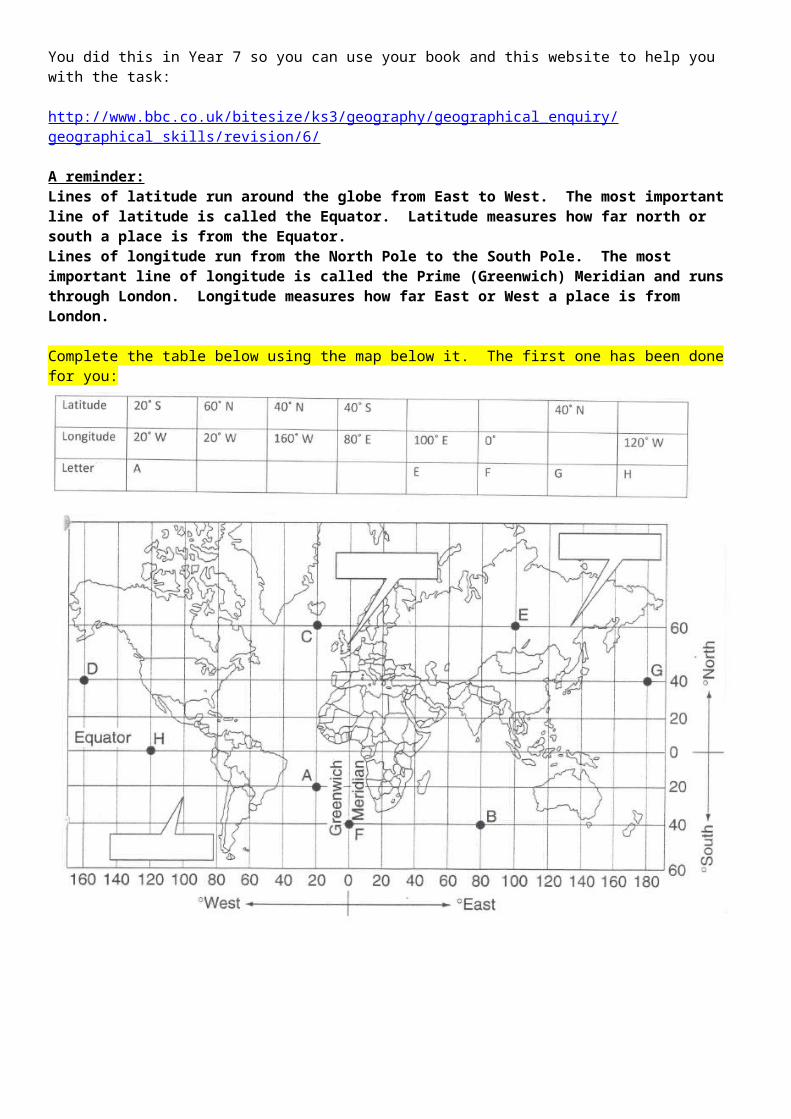
A reminder:Lines of latitude run around the globe from East to West. The most important line of latitude is called the Equator. Latitude measures how far north or south a place is from the Equator.Lines of longitude run from the North Pole to the South Pole. The most important line of longitude is called the Prime (Greenwich) Meridian and runs through London. Longitude measures how far East or West a place is from London.
Complete the table below using the map below it. The first one has been done for you:
Four and Six Figure Grid References
You did this in Year 7 so use your book or this website to help remind you how to give and use 4 figure grid references:
http://www.bbc.co.uk/bitesize/ks3/geography/geographical_enquiry/geographical_skills/revision/5/https://www.ordnancesurvey.co.uk/mapzone/map-skills/grid-references/page-one
If you don’t know the map symbols you can download the key from here:https://www.ordnancesurvey.co.uk/mapzone/map-skills/map-symbols/page-two
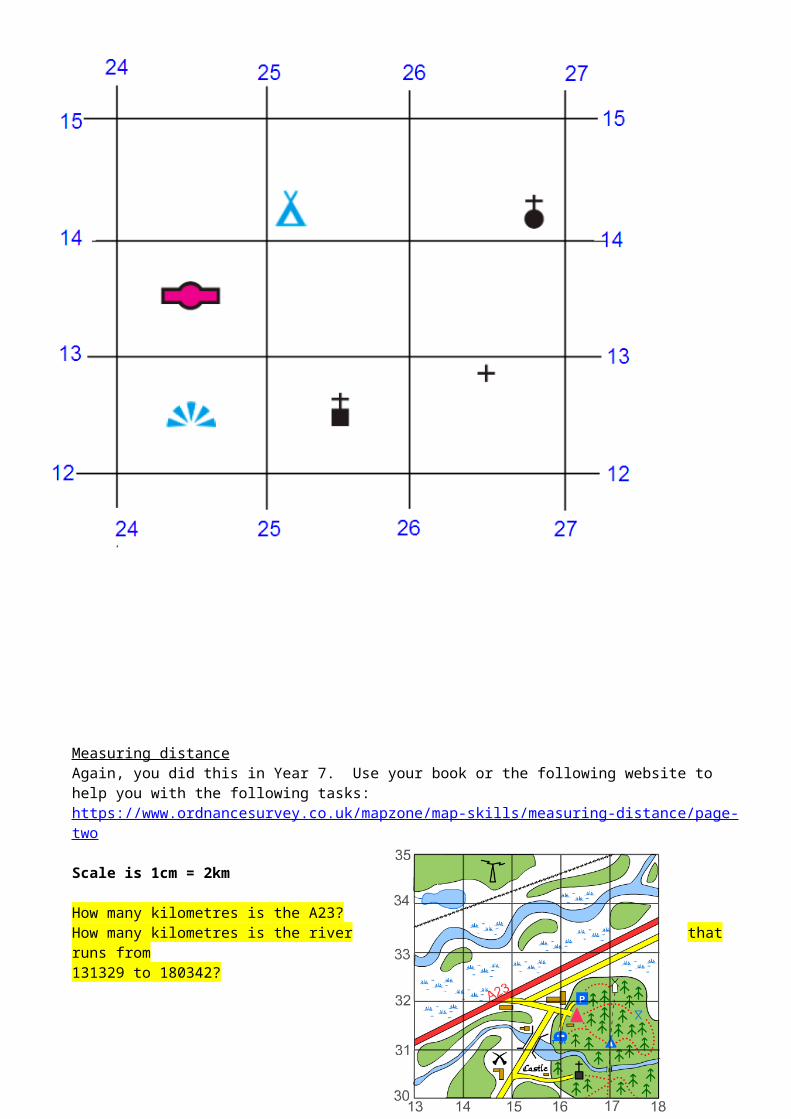
Answer these questions using the map below:a) What is in grid square 2413?b) What is in grid square 2612?c) Give the 4 figure grid reference for the campsite.d) Give the 4 figure grid reference for the church with a tower.e) What is at the 6 figure grid reference 252141?f) What is at the 6 figure grid reference 268142?g) Give the 6 figure grid reference for the viewpoint.h) Give the 6 figure grid reference for the church with a tower.
Measuring distance
Again, you did this in Year 7. Use your book or the following website to help you with the following tasks:https://www.ordnancesurvey.co.uk/mapzone/map-skills/measuring-distance/page-two
Scale is 1cm = 2km
How many kilometres is the A23?How many kilometres is the river that runs from131329 to 180342?
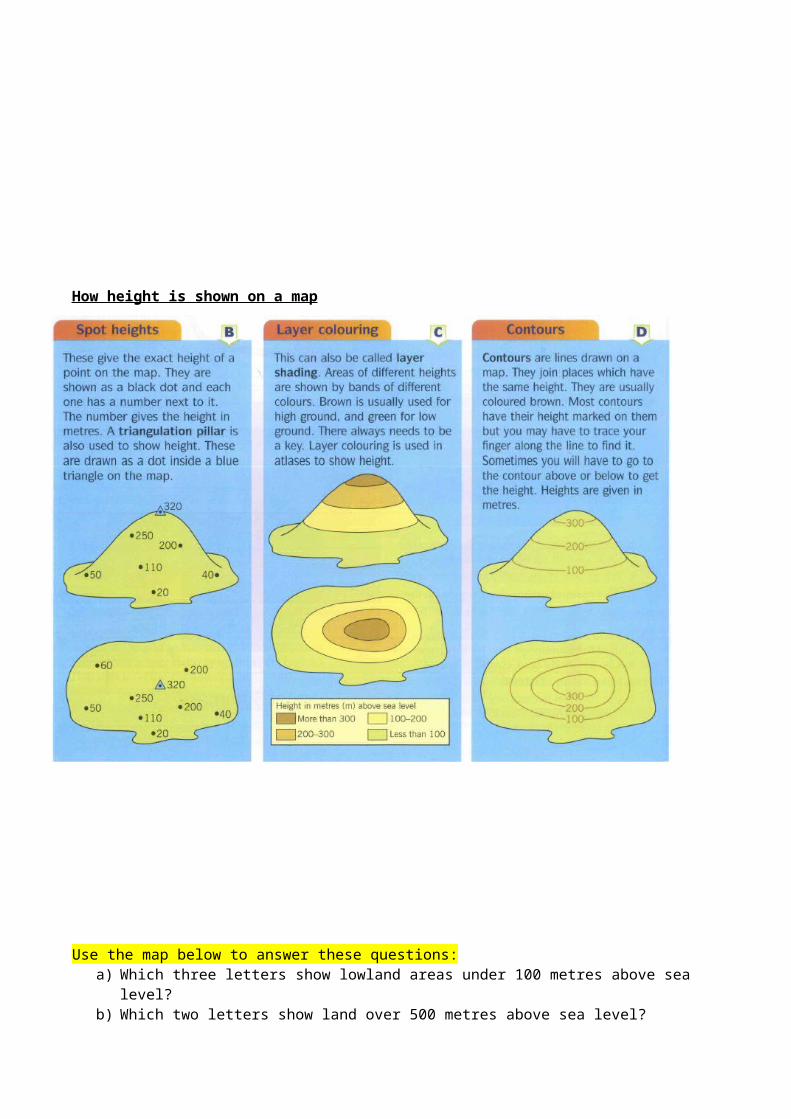
How height is shown on a map
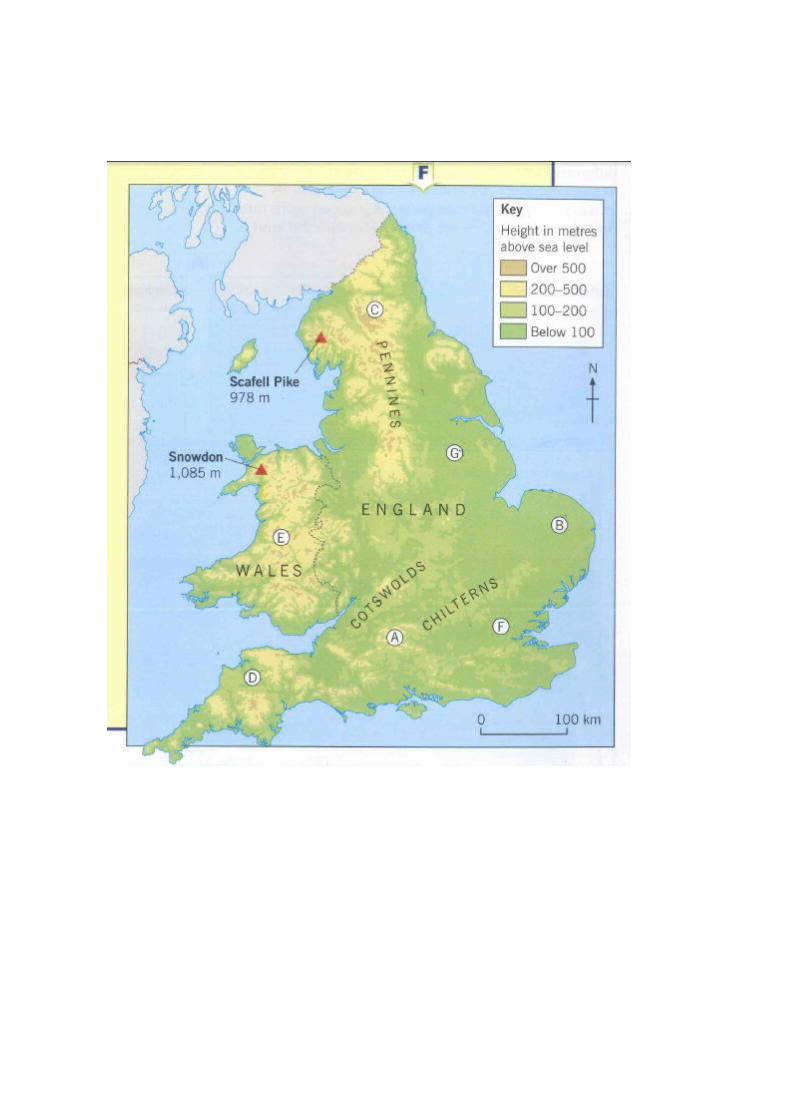
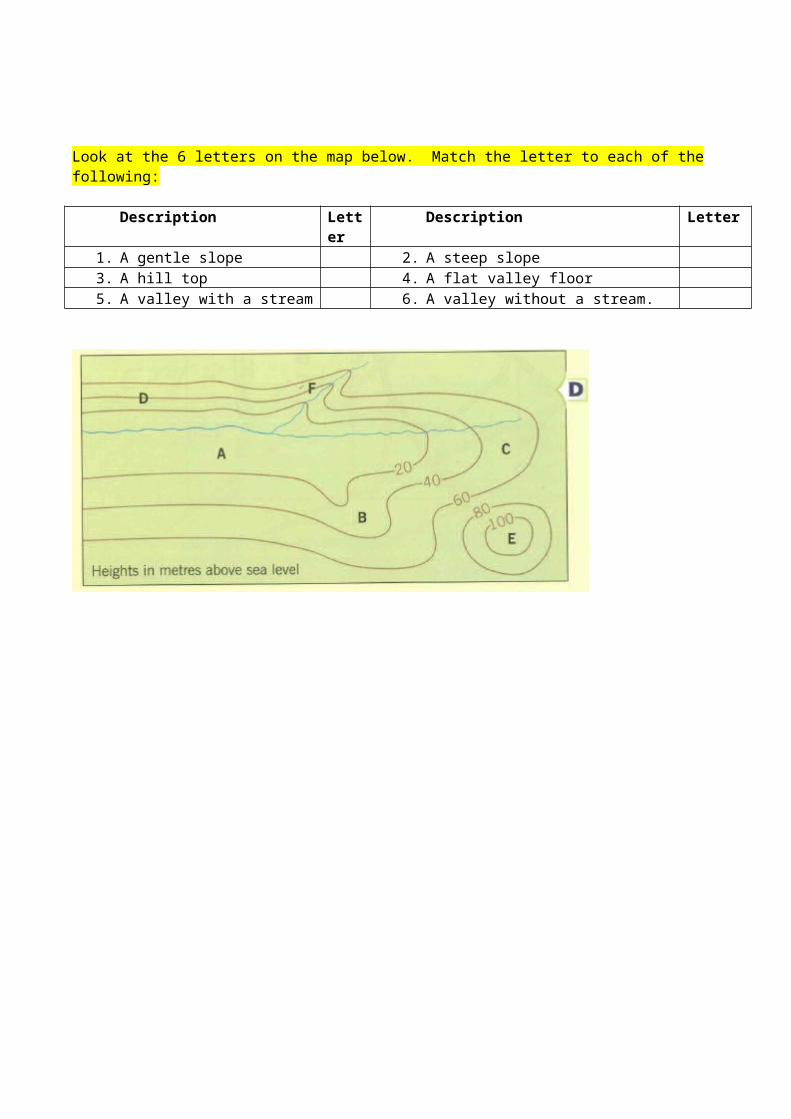
Use the map below to answer these questions:a) Which three letters show lowland areas under 100 metres above sea level? b) Which two letters show land over 500 metres above sea level?
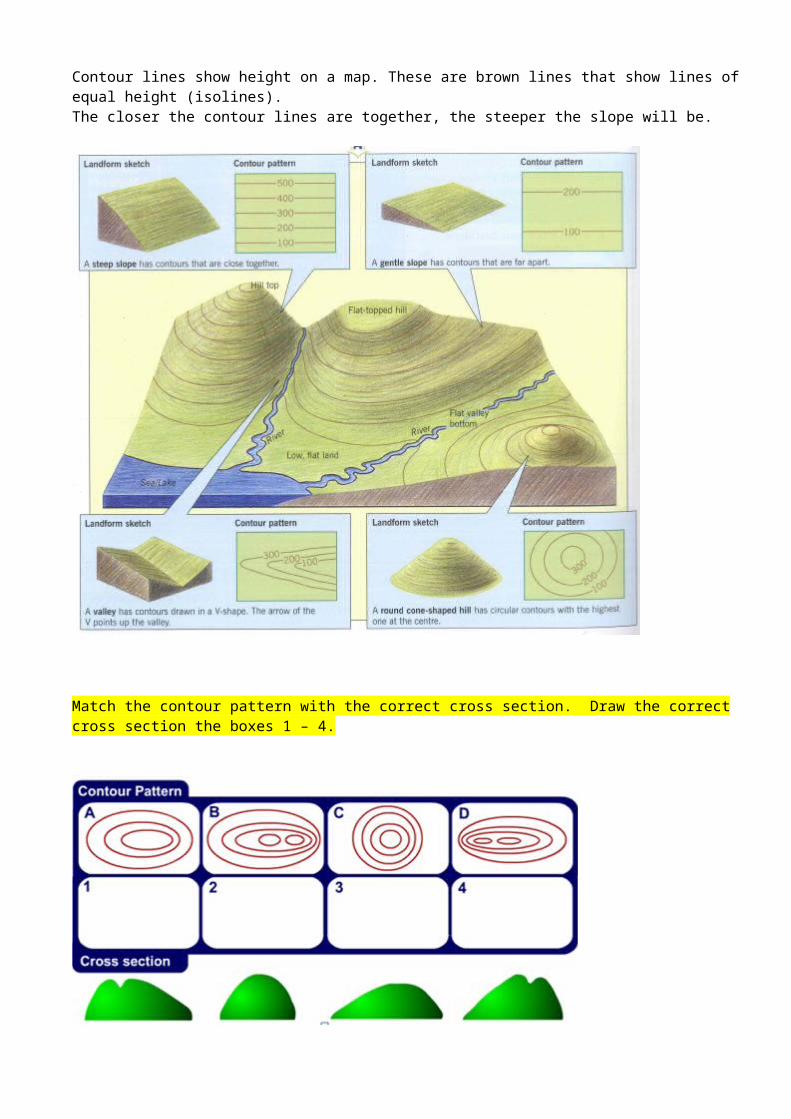
Contour lines show height on a map. These are brown lines that show lines of equal height (isolines). The closer the contour lines are together, the steeper the slope will be.
Match the contour pattern with the correct cross section. Draw the correct cross section the boxes 1 – 4.
Look at the 6 letters on the map below. Match the letter to each of the following:
Description Letter Description Letter1. A gentle slope 2. A steep slope3. A hill top 4. A flat valley floor5. A valley with a stream 6. A valley without a stream.
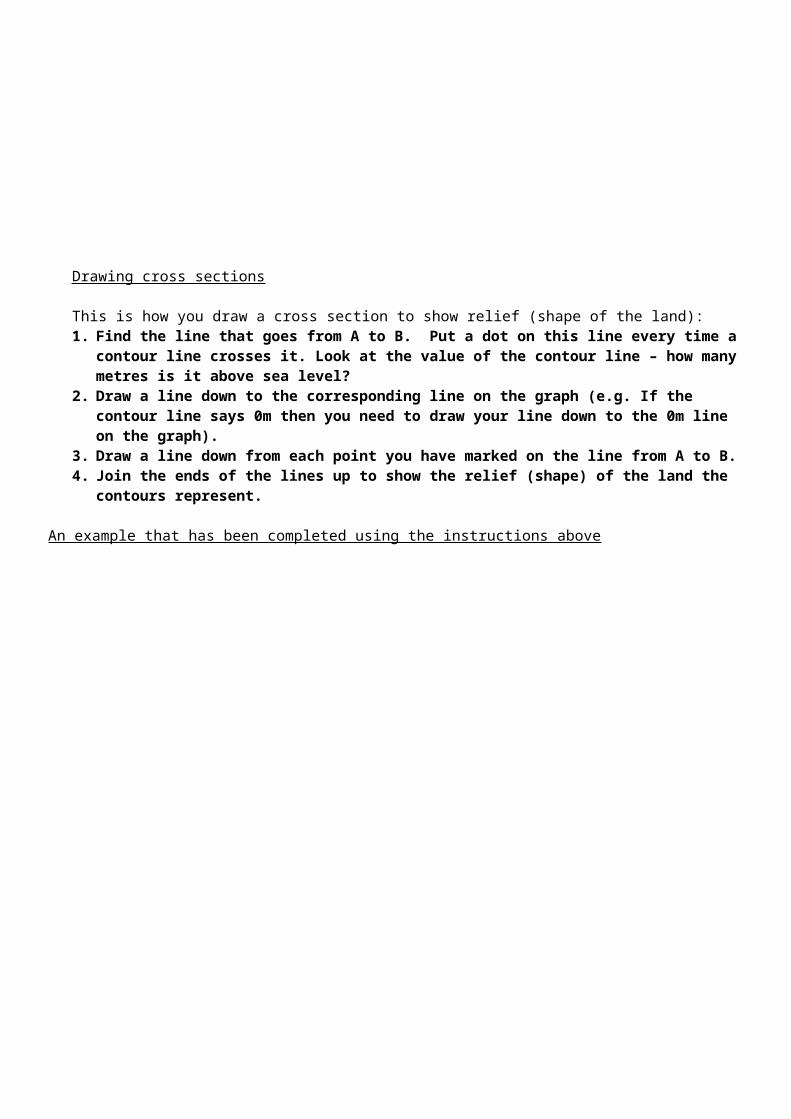
Drawing cross sections
This is how you draw a cross section to show relief (shape of the land):1. Find the line that goes from A to B. Put a dot on this line every time a contour line crosses it. Look at the
value of the contour line – how many metres is it above sea level?2. Draw a line down to the corresponding line on the graph (e.g. If the contour line says 0m then you need to
draw your line down to the 0m line on the graph).3. Draw a line down from each point you have marked on the line from A to B.4. Join the ends of the lines up to show the relief (shape) of the land the contours represent.
An example that has been completed using the instructions above
A dot on each contour line that crosses the A to B line
0 metre contour line drawn down to 0 metres on the graph
Join up the dots either freehand or with a ruler.
Complete the following two cross sections using the instructions above.
Drawing a sketch of an OS mapLook at the Ordnance Survey map below. You need to draw out the main features in the blank box below it.Hint: Draw and label the following:
- The sea - The beach - The main A roads- The rail lines - The minor roads
(orange/yellow lines)- The main woods
Study Figure 15, a 1:25 000 Ordnance Survey map extract of Cromer, a coastal resort in Norfolk.
My sketch map:


![facility.waseley.networcs.net · Web viewNH3 C. CH. 3 COOH D. CHF3 ... the complex rhodium ion [RhCl 4]2−. Shape ... Co-ordinate. D. Van der Waals.](https://img.pdfslide.net/doc/110x75/5ae7eac17f8b9a29048f6379/viewnh3-c-ch-3-cooh-d-chf3-the-complex-rhodium-ion-rhcl-42-shape-.jpg)