Embed Size (px)
Citation preview
REF
RA
CTI
VE
SUR
GER
Y
28 CATARACT & REFRACTIVE SURGERY TODAY EUROPE | MARCH 2017
Since refractive surgery entered our daily practice, the ability to read corneal tomography has become a necessity. It is important not only for selecting proper candidates for refractive surgery, but also for identifying those patients at risk for developing keratoconus even without undergoing refractive surgery. During the
past decade, we have witnessed tremendous developments in corneal topography, a tool that provides information on the anterior corneal surface, and we have also seen the
emergence of corneal tomography,1 which provides infor-mation on the whole cornea.
A number of topographers and tomographers are now available, each competing with the others in developing objective indexes to reveal hidden risks in the cornea.2 However, the objective evaluations of these devices, in my opinion, can be misleading. Relying on these objective mea-sures when making decisions for surgery would be like writ-ing a prescription for spectacles based solely on the print-out from the autorefractometer. Such objective evaluation is prone to false positives and negatives in both sensitivity and specificity.
ART, SCIENCE, AND AN ALGORITHMSkillful reading of corneal tomography is an art as much as is
a science. For a long time, I have been trying to merge both art and science into one scheme—a quest that led me to develop-ing a 12-point algorithm. The algorithm is based mainly on the Pentacam (Oculus) system, and it consists of the evaluation of 12 points, which are described on page 30, in 12-Point Algorithm.
In order to standardize the examination of the main four maps (points 6 through 9), the 9-mm display should be used, and the color scale should be adjusted to absolute 1.00 D steps for the curvature map, 5-µm steps for the elevation maps, and 10-µm steps for the pachymetry map. There are several patterns that can be seen on the anterior
Relying on objective evaluation alone tells only part of the story.
BY MAZEN M. SINJAB, MD, MSc, ABOphth, PhD, FRCOphth (LONDON)
A 12-POINT ALGORITHM TO MASTER CORNEAL TOMOGRAPHY
• Subjective evaluation of corneal tomography is important during the workup of refractive surgery patients and in screening for keratoconus.
• The 12-point algorithm described here is a comprehensive and easy-to-follow method.
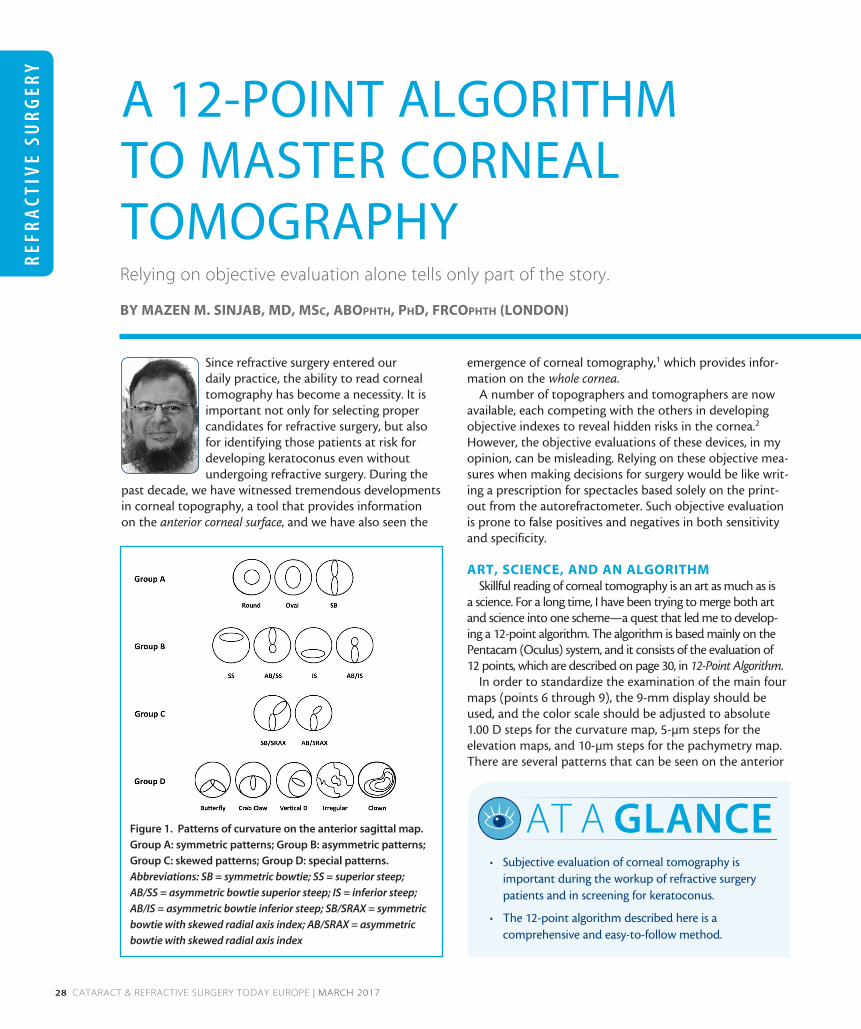
AT A GLANCEFigure 1. Patterns of curvature on the anterior sagittal map.
Group A: symmetric patterns; Group B: asymmetric patterns;
Group C: skewed patterns; Group D: special patterns.
Abbreviations: SB = symmetric bowtie; SS = superior steep;
AB/SS = asymmetric bowtie superior steep; IS = inferior steep;
AB/IS = asymmetric bowtie inferior steep; SB/SRAX = symmetric
bowtie with skewed radial axis index; AB/SRAX = asymmetric
bowtie with skewed radial axis index
REFR
AC
TIVE SU
RG
ERY
MARCH 2017 | CATARACT & REFRACTIVE SURGERY TODAY EUROPE 29
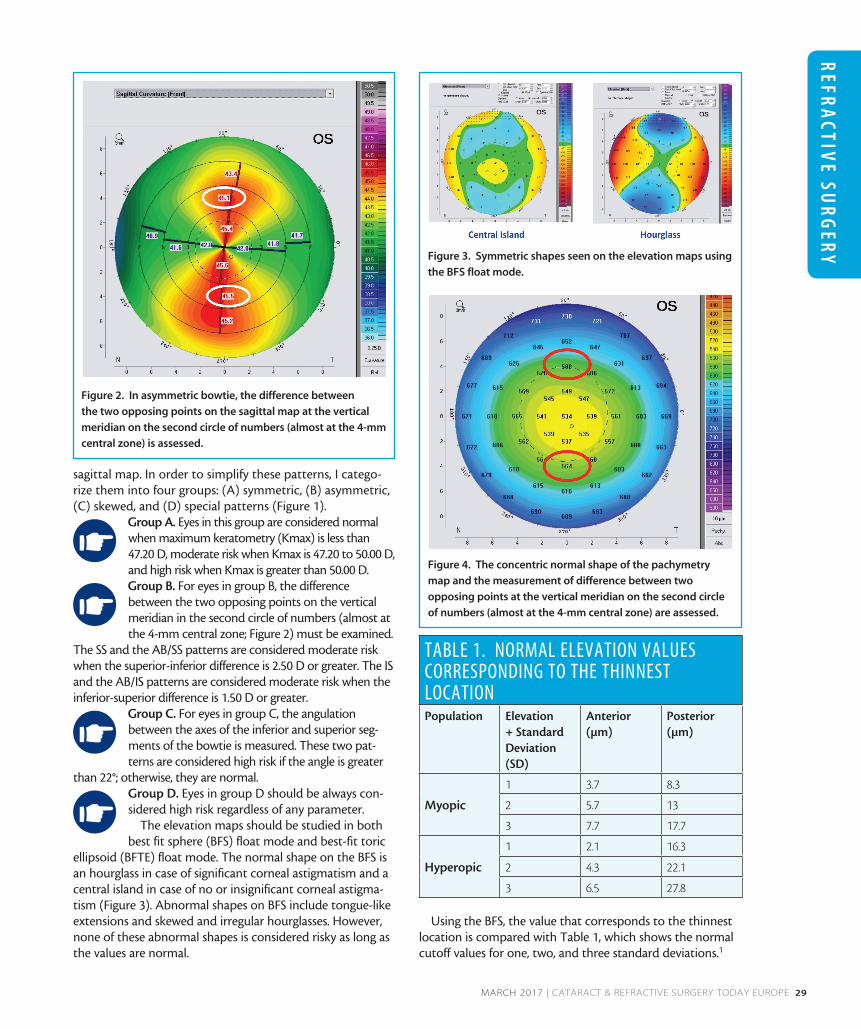
sagittal map. In order to simplify these patterns, I catego-rize them into four groups: (A) symmetric, (B) asymmetric, (C) skewed, and (D) special patterns (Figure 1).
Group A. Eyes in this group are considered normal when maximum keratometry (Kmax) is less than 47.20 D, moderate risk when Kmax is 47.20 to 50.00 D, and high risk when Kmax is greater than 50.00 D. Group B. For eyes in group B, the difference between the two opposing points on the vertical meridian in the second circle of numbers (almost at the 4-mm central zone; Figure 2) must be examined.
The SS and the AB/SS patterns are considered moderate risk when the superior-inferior difference is 2.50 D or greater. The IS and the AB/IS patterns are considered moderate risk when the inferior-superior difference is 1.50 D or greater.
Group C. For eyes in group C, the angulation between the axes of the inferior and superior seg-ments of the bowtie is measured. These two pat-terns are considered high risk if the angle is greater
than 22°; otherwise, they are normal. Group D. Eyes in group D should be always con-sidered high risk regardless of any parameter.
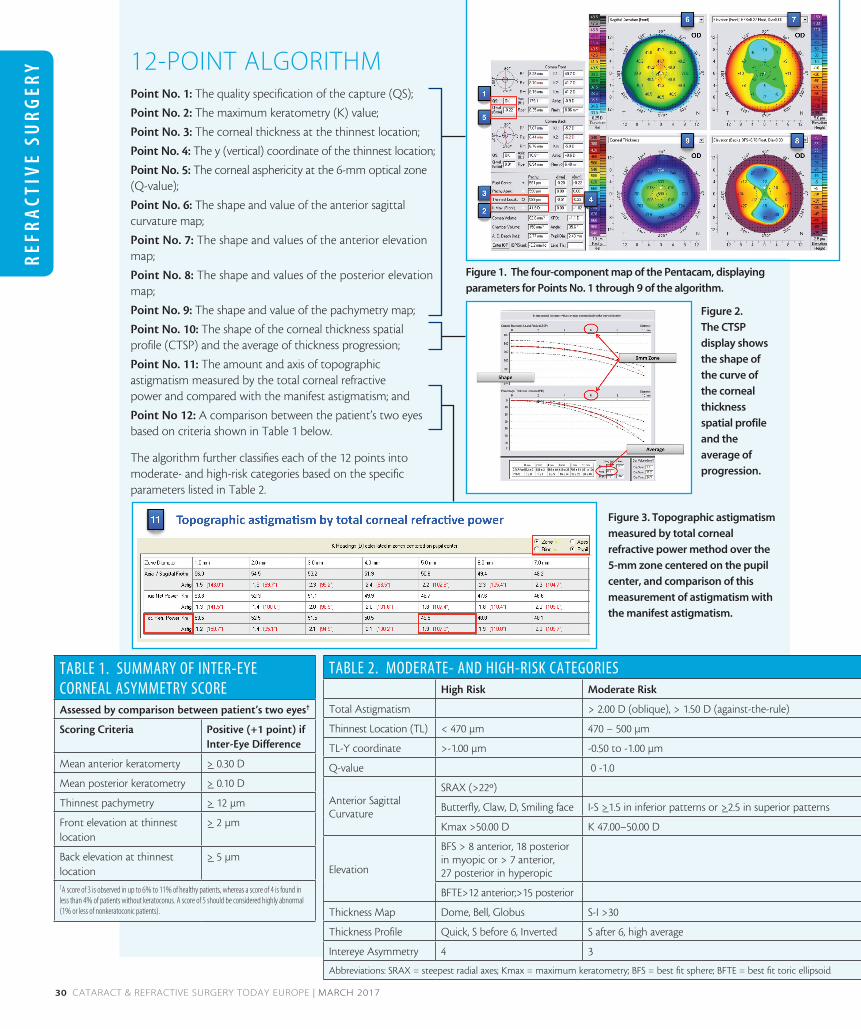
The elevation maps should be studied in both best fit sphere (BFS) float mode and best-fit toric
ellipsoid (BFTE) float mode. The normal shape on the BFS is an hourglass in case of significant corneal astigmatism and a central island in case of no or insignificant corneal astigma-tism (Figure 3). Abnormal shapes on BFS include tongue-like extensions and skewed and irregular hourglasses. However, none of these abnormal shapes is considered risky as long as the values are normal.
Using the BFS, the value that corresponds to the thinnest location is compared with Table 1, which shows the normal cutoff values for one, two, and three standard deviations.1
Figure 2. In asymmetric bowtie, the difference between
the two opposing points on the sagittal map at the vertical
meridian on the second circle of numbers (almost at the 4-mm
central zone) is assessed.
Figure 3. Symmetric shapes seen on the elevation maps using
the BFS float mode.
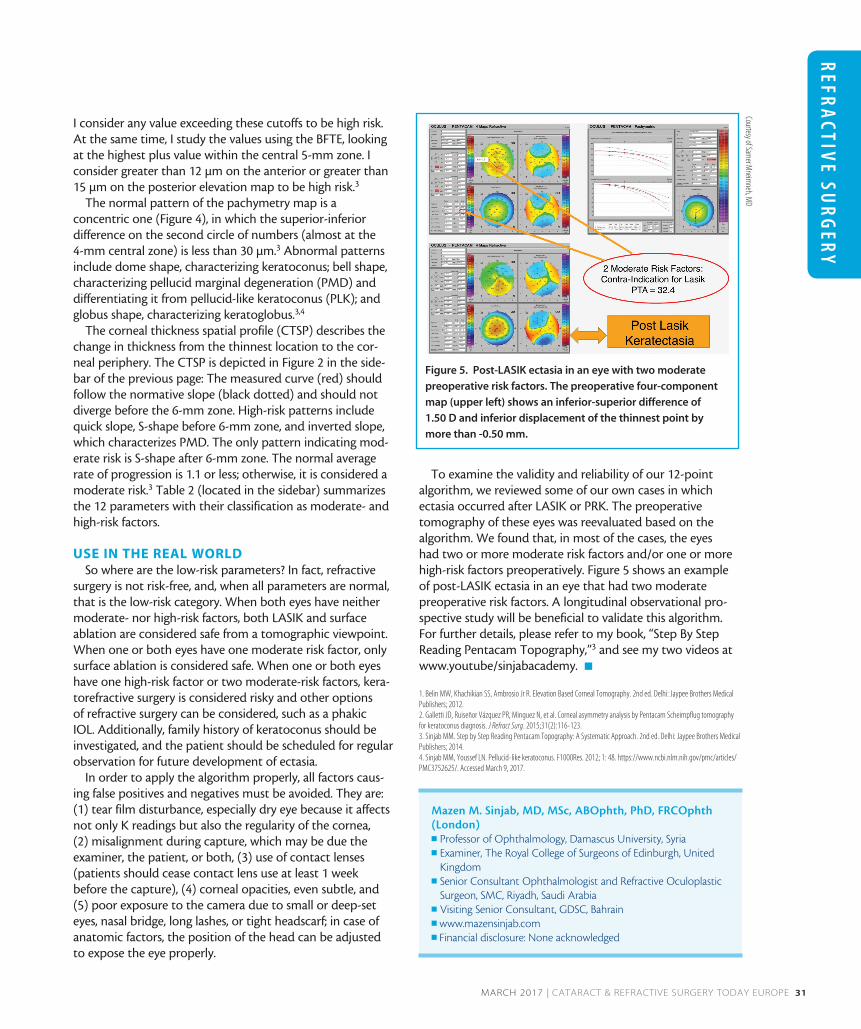
Figure 4. The concentric normal shape of the pachymetry
map and the measurement of difference between two
opposing points at the vertical meridian on the second circle
of numbers (almost at the 4-mm central zone) are assessed.
TABLE 1. NORMAL ELEVATION VALUES CORRESPONDING TO THE THINNEST LOCATIONPopulation Elevation
+ Standard Deviation (SD)
Anterior (µm)
Posterior (µm)
Myopic
1 3.7 8.3
2 5.7 13
3 7.7 17.7
Hyperopic
1 2.1 16.3
2 4.3 22.1
3 6.5 27.8
REF
RA
CTI
VE
SUR
GER
Y
30 CATARACT & REFRACTIVE SURGERY TODAY EUROPE | MARCH 2017
12-POINT ALGORITHMPoint No. 1: The quality specification of the capture (QS);
Point No. 2: The maximum keratometry (K) value;
Point No. 3: The corneal thickness at the thinnest location;
Point No. 4: The y (vertical) coordinate of the thinnest location;
Point No. 5: The corneal asphericity at the 6-mm optical zone (Q-value);
Point No. 6: The shape and value of the anterior sagittal curvature map;
Point No. 7: The shape and values of the anterior elevation map;
Point No. 8: The shape and values of the posterior elevation map;
Point No. 9: The shape and value of the pachymetry map;
Point No. 10: The shape of the corneal thickness spatial profile (CTSP) and the average of thickness progression;
Point No. 11: The amount and axis of topographic astigmatism measured by the total corneal refractive power and compared with the manifest astigmatism; and
Point No 12: A comparison between the patient’s two eyes based on criteria shown in Table 1 below.
The algorithm further classifies each of the 12 points into moderate- and high-risk categories based on the specific parameters listed in Table 2.
Figure 1. The four-component map of the Pentacam, displaying
parameters for Points No. 1 through 9 of the algorithm.
Figure 2.
The CTSP
display shows
the shape of
the curve of
the corneal
thickness
spatial profile
and the
average of
progression.
Figure 3. Topographic astigmatism
measured by total corneal
refractive power method over the
5-mm zone centered on the pupil
center, and comparison of this
measurement of astigmatism with
the manifest astigmatism.
TABLE 1. SUMMARY OF INTER-EYE CORNEAL ASYMMETRY SCOREAssessed by comparison between patient’s two eyes†
Scoring Criteria Positive (+1 point) if Inter-Eye Difference
Mean anterior keratomerty >_ 0.30 D
Mean posterior keratometry >_ 0.10 D
Thinnest pachymetry >_ 12 µm
Front elevation at thinnest location
>_ 2 µm
Back elevation at thinnest location
>_ 5 µm
TA score of 3 is observed in up to 6% to 11% of healthy patients, whereas a score of 4 is found in less than 4% of patients without keratoconus. A score of 5 should be considered highly abnormal (1% or less of nonkeratoconic patients).
TABLE 2. MODERATE- AND HIGH-RISK CATEGORIESHigh Risk Moderate Risk
Total Astigmatism > 2.00 D (oblique), > 1.50 D (against-the-rule)
Thinnest Location (TL) < 470 µm 470 – 500 µm
TL-Y coordinate >-1.00 µm -0.50 to -1.00 µm
Q-value 0 -1.0
Anterior Sagittal Curvature
SRAX (>22º)
Butterfly, Claw, D, Smiling face I-S >_1.5 in inferior patterns or >_2.5 in superior patterns
Kmax >50.00 D K 47.00–50.00 D
Elevation
BFS > 8 anterior, 18 posterior in myopic or > 7 anterior, 27 posterior in hyperopic
BFTE>12 anterior;>15 posterior
Thickness Map Dome, Bell, Globus S-I >30
Thickness Profile Quick, S before 6, Inverted S after 6, high average
Intereye Asymmetry 4 3
Abbreviations: SRAX = steepest radial axes; Kmax = maximum keratometry; BFS = best fit sphere; BFTE = best fit toric ellipsoid
REFR
AC
TIVE SU
RG
ERY
MARCH 2017 | CATARACT & REFRACTIVE SURGERY TODAY EUROPE 31
I consider any value exceeding these cutoffs to be high risk. At the same time, I study the values using the BFTE, looking at the highest plus value within the central 5-mm zone. I consider greater than 12 µm on the anterior or greater than 15 µm on the posterior elevation map to be high risk.3
The normal pattern of the pachymetry map is a concentric one (Figure 4), in which the superior-inferior difference on the second circle of numbers (almost at the 4-mm central zone) is less than 30 µm.3 Abnormal patterns include dome shape, characterizing keratoconus; bell shape, characterizing pellucid marginal degeneration (PMD) and differentiating it from pellucid-like keratoconus (PLK); and globus shape, characterizing keratoglobus.3,4
The corneal thickness spatial profile (CTSP) describes the change in thickness from the thinnest location to the cor-neal periphery. The CTSP is depicted in Figure 2 in the side-bar of the previous page: The measured curve (red) should follow the normative slope (black dotted) and should not diverge before the 6-mm zone. High-risk patterns include quick slope, S-shape before 6-mm zone, and inverted slope, which characterizes PMD. The only pattern indicating mod-erate risk is S-shape after 6-mm zone. The normal average rate of progression is 1.1 or less; otherwise, it is considered a moderate risk.3 Table 2 (located in the sidebar) summarizes the 12 parameters with their classification as moderate- and high-risk factors.
USE IN THE REAL WORLDSo where are the low-risk parameters? In fact, refractive
surgery is not risk-free, and, when all parameters are normal, that is the low-risk category. When both eyes have neither moderate- nor high-risk factors, both LASIK and surface ablation are considered safe from a tomographic viewpoint. When one or both eyes have one moderate risk factor, only surface ablation is considered safe. When one or both eyes have one high-risk factor or two moderate-risk factors, kera-torefractive surgery is considered risky and other options of refractive surgery can be considered, such as a phakic IOL. Additionally, family history of keratoconus should be investigated, and the patient should be scheduled for regular observation for future development of ectasia.
In order to apply the algorithm properly, all factors caus-ing false positives and negatives must be avoided. They are: (1) tear film disturbance, especially dry eye because it affects not only K readings but also the regularity of the cornea, (2) misalignment during capture, which may be due the examiner, the patient, or both, (3) use of contact lenses (patients should cease contact lens use at least 1 week before the capture), (4) corneal opacities, even subtle, and (5) poor exposure to the camera due to small or deep-set eyes, nasal bridge, long lashes, or tight headscarf; in case of anatomic factors, the position of the head can be adjusted to expose the eye properly.
To examine the validity and reliability of our 12-point algorithm, we reviewed some of our own cases in which ectasia occurred after LASIK or PRK. The preoperative tomography of these eyes was reevaluated based on the algorithm. We found that, in most of the cases, the eyes had two or more moderate risk factors and/or one or more high-risk factors preoperatively. Figure 5 shows an example of post-LASIK ectasia in an eye that had two moderate preoperative risk factors. A longitudinal observational pro-spective study will be beneficial to validate this algorithm. For further details, please refer to my book, “Step By Step Reading Pentacam Topography,”3 and see my two videos at www.youtube/sinjabacademy. n
1. Belin MW, Khachikian SS, Ambrosio Jr R. Elevation Based Corneal Tomography. 2nd ed. Delhi: Jaypee Brothers Medical Publishers; 2012.2. Galletti JD, Ruiseñor Vázquez PR, Minguez N, et al. Corneal asymmetry analysis by Pentacam Scheimpflug tomography for keratoconus diagnosis. J Refract Surg. 2015;31(2):116-123.3. Sinjab MM. Step by Step Reading Pentacam Topography: A Systematic Approach. 2nd ed. Delhi: Jaypee Brothers Medical Publishers; 2014.4. Sinjab MM, Youssef LN. Pellucid-like keratoconus. F1000Res. 2012; 1: 48. https://www.ncbi.nlm.nih.gov/pmc/articles/PMC3752625/. Accessed March 9, 2017.
Mazen M. Sinjab, MD, MSc, ABOphth, PhD, FRCOphth (London)n Professor of Ophthalmology, Damascus University, Syrian Examiner, The Royal College of Surgeons of Edinburgh, United
Kingdomn Senior Consultant Ophthalmologist and Refractive Oculoplastic
Surgeon, SMC, Riyadh, Saudi Arabian Visiting Senior Consultant, GDSC, Bahrainn www.mazensinjab.comn Financial disclosure: None acknowledged
Figure 5. Post-LASIK ectasia in an eye with two moderate
preoperative risk factors. The preoperative four-component
map (upper left) shows an inferior-superior difference of
1.50 D and inferior displacement of the thinnest point by
more than -0.50 mm.
Courtesy of Samer M
neimneh, M
D