Embed Size (px)
Citation preview
ARTICLE
A 2 year physical activity and dietary intervention attenuatesthe increase in insulin resistance in a general populationof children: the PANIC study
Timo A. Lakka1,2,3 & Niina Lintu1& Juuso Väistö1
& Anna Viitasalo1,4& Taisa Sallinen1,5
&
Eero A. Haapala1,6 & Tuomo T. Tompuri1,2 & Sonja Soininen1,7& Panu Karjalainen1
& Theresia M. Schnurr8 &
Santtu Mikkonen9& Mustafa Atalay1 & Tuomas O. Kilpeläinen8
& Tomi Laitinen2& David E. Laaksonen10
&
Kai Savonen2,3& Soren Brage11
& Ursula Schwab5,10& Jarmo Jääskeläinen12
& Virpi Lindi13 & Aino-Maija Eloranta1,5
Received: 31 March 2020 /Accepted: 2 July 2020# The Author(s) 2020
AbstractAims/hypothesis We studied for the first time the long-term effects of a combined physical activity and dietary intervention oninsulin resistance and fasting plasma glucose in a general population of predominantly normal-weight children.Methods We carried out a 2 year non-randomised controlled trial in a population sample of 504 children aged 6–9 years atbaseline. The children were allocated to a combined physical activity and dietary intervention group (306 children at baseline,261 children at 2-year follow-up) or a control group (198 children, 177 children) without blinding. We measured fasting insulinand fasting glucose, calculated HOMA-IR, assessed physical activity and sedentary time by combined heart rate and bodymovement monitoring, assessed dietary factors by a 4 day food record, used the Finnish Children Healthy Eating Index(FCHEI) as a measure of overall diet quality, and measured body fat percentage (BF%) and lean body mass by dual-energy x-ray absorptiometry. The intervention effects on insulin, glucose and HOMA-IR were analysed using the intention-to-treatprinciple and linear mixed-effects models after adjustment for sex, age at baseline, and pubertal status at baseline and 2 yearfollow-up. The measures of physical activity, sedentary time, diet and body composition at baseline and 2 year follow-up wereentered one-by-one as covariates into the models to study whether changes in these variables might partly explain the observedintervention effects.
Dr V. Lindi, who significantly contributed to the contents of this paper,died on 6 December 2019 before publication of this work.
Electronic supplementary material The online version of this article(https://doi.org/10.1007/s00125-020-05250-0) contains supplementarymaterial, which is available to authorized users.
* Timo A. [email protected]
1 Institute of Biomedicine, School of Medicine, University of EasternFinland, Kuopio Campus, P.O. Box 1627, FI-70211 Kuopio, Finland
2 Department of Clinical Physiology and Nuclear Medicine, KuopioUniversity Hospital, University of Eastern Finland, Kuopio, Finland
3 Foundation for Research in Health Exercise and Nutrition, KuopioResearch Institute of Exercise Medicine, Kuopio, Finland
4 Institute of Dentistry, University of Eastern Finland, Kuopio, Finland5 Institute of Public Health and Clinical Nutrition, University of
Eastern Finland, Kuopio, Finland6 Faculty of Sport and Health Sciences, University of Jyväskylä,
Jyväskylä, Finland
7 Social and Health Center, City of Varkaus, Finland
8 Novo Nordisk Foundation Center for Basic Metabolic Research,Faculty of Health and Medical Sciences, University of Copenhagen,Copenhagen, Denmark
9 Department of Applied Physics, University of Eastern Finland,Kuopio, Finland
10 Department of Medicine, Endocrinology and Clinical Nutrition,Kuopio University Hospital, Kuopio, Finland
11 MRC Epidemiology Unit, University of Cambridge, Cambridge, UK
12 Department of Pediatrics, Institute of Clinical Medicine, KuopioUniversity Hospital and University of Eastern Finland,Kuopio, Finland
13 University of Eastern Finland Library Kuopio, Kuopio, Finland
https://doi.org/10.1007/s00125-020-05250-0
/ Published online: 20 August 2020
Diabetologia (2020) 63:2270–2281

Results Compared with the control group, fasting insulin increased 4.65 pmol/l less (absolute change +8.96 vs +13.61 pmol/l)and HOMA-IR increased 0.18 units less (+0.31 vs +0.49 units) over 2 years in the combined physical activity and dietaryintervention group. The intervention effects on fasting insulin (regression coefficient β for intervention effect −0.33 [95% CI−0.62, −0.04], p = 0.026) and HOMA-IR (β for intervention effect −0.084 [95%CI −0.156, −0.012], p = 0.023) were statisticallysignificant after adjustment for sex, age at baseline, and pubertal status at baseline and 2 year follow-up. The intervention had noeffect on fasting glucose, BF% or lean body mass. Changes in total physical activity energy expenditure, light physical activity,moderate-to-vigorous physical activity, total sedentary time, the reported consumption of high-fat (≥60%) vegetable oil-basedspreads, and FCHEI, but not a change in BF% or lean body mass, partly explained the intervention effects on fasting insulin andHOMA-IR.Conclusions/interpretation The combined physical activity and dietary intervention attenuated the increase in insulin resistanceover 2 years in a general population of predominantly normal-weight children. This beneficial effect was partly mediated bychanges in physical activity, sedentary time and diet but not changes in body composition.Trial registration ClinicalTrials.gov NCT01803776
Keywords Body fat . Children . Diet . Glucose . HOMA-IR . Insulin . Intervention . Lean body mass . Physical activity .
Sedentary time
AbbreviationsBF% Body fat percentageFCHEI Finnish Children Healthy Eating IndexMET Metabolic equivalentPANIC Physical Activity and Nutrition in ChildrenSDS SD scoreSTRIP Special Turku Coronary Risk Factor Intervention
Project for Children
Introduction
The number of people with type 2 diabetes and prediabeteshas increased dramatically worldwide over the past decades[1]. Their prevalence has increased in many countries amongchildren and adolescents [2]. This alarming trend is likely dueto decreased physical activity, increased sedentary time,unhealthy diet and consequently increased body fat content
2271Diabetologia (2020) 63:2270–2281
[1–3]. Insulin resistance, which is crucial in the pathogenesisof type 2 diabetes, is usually evident long beforehyperglycaemia, is strongly associated with adiposity, andstrongly predicts future risk of type 2 diabetes and cardiovas-cular disease [4]. Pathophysiological processes underlyingtype 2 diabetes, such as insulin resistance, may begin duringthe fetal period [2]. There is a marked increase in insulinresistance during pubertal development [5] but it has beenfound to rise progressively already some years before puberty[6]. All this evidence emphasises the need for the preventionof type 2 diabetes since childhood.
Several physical activity [7–12] and dietary [13]interventions, particularly in combinations [13–19] andmainly short-term, have been shown to decrease insulinresistance among overweight and obese children.Moreover, a few combined physical activity and dietaryinterventions have been found to decrease fasting bloodglucose [13] and improve glucose tolerance [15–17] inoverweight and obese children. Some of these lifestyleinterventions have also been observed to decreaseadiposity [13, 15, 16], suggesting that their beneficialeffects on insulin resistance, fasting blood glucose andglucose tolerance in overweight and obese children areat least partly mediated by reductions in body fatpercentage (BF%). However, the results of some studiessuggest that physical activity interventions decreaseinsulin resistance among children even without a changein BF% or lean body mass [9, 12].
Evidence on the long-term effects of physical activity anddietary interventions on insulin resistance and blood glucosein general populations of children, most of whom have anormal body weight, is needed to provide insight into the roleof lifestyle changes in the early prevention of type 2 diabetes.It is also important to determine whether changes in physicalactivity, sedentary time, diet and body composition mightmediate the beneficial effects of the long-term lifestyle inter-ventions on insulin resistance and blood glucose to plan effec-tive strategies for the early prevention of type 2 diabetes. Toour knowledge, only one long-term dietary intervention hasbeen found to attenuate the increase in insulin resistance [20]and only one short-term physical activity intervention hasbeen observed to prevent the increase in fasting blood glucose[21] in general populations of predominantly normal-weightchildren.
We therefore carried out a 2 year controlled trial toinvestigate the long-term effects of a combined physicalactivity and dietary intervention on fasting serum insu-lin, fasting plasma glucose and HOMA-IR in a generalpopulation of children, most of whom had a normalbody weight. We also examined whether 2 year changesin physical activity, sedentary time, diet, BF% and leanbody mass might partly mediate the observed interven-tion effects.
Methods
Study design and participants The Physical Activity andNutrition in Children (PANIC) study is a non-randomisedcontrolled trial on the effects of a combined physical activityand dietary intervention on cardiometabolic risk factors andother health outcomes in a population sample of children fromthe city of Kuopio, Finland [22, 23]. The Research EthicsCommittee of the Hospital District of Northern Savo approvedthe study protocol in 2006 (Statement 69/2006). The parentsor caregivers of the children gave their written informedconsent, and the children provided their assent to participa-tion. The PANIC study has been carried out in accordancewith the principles of the Declaration of Helsinki as revisedin 2008.
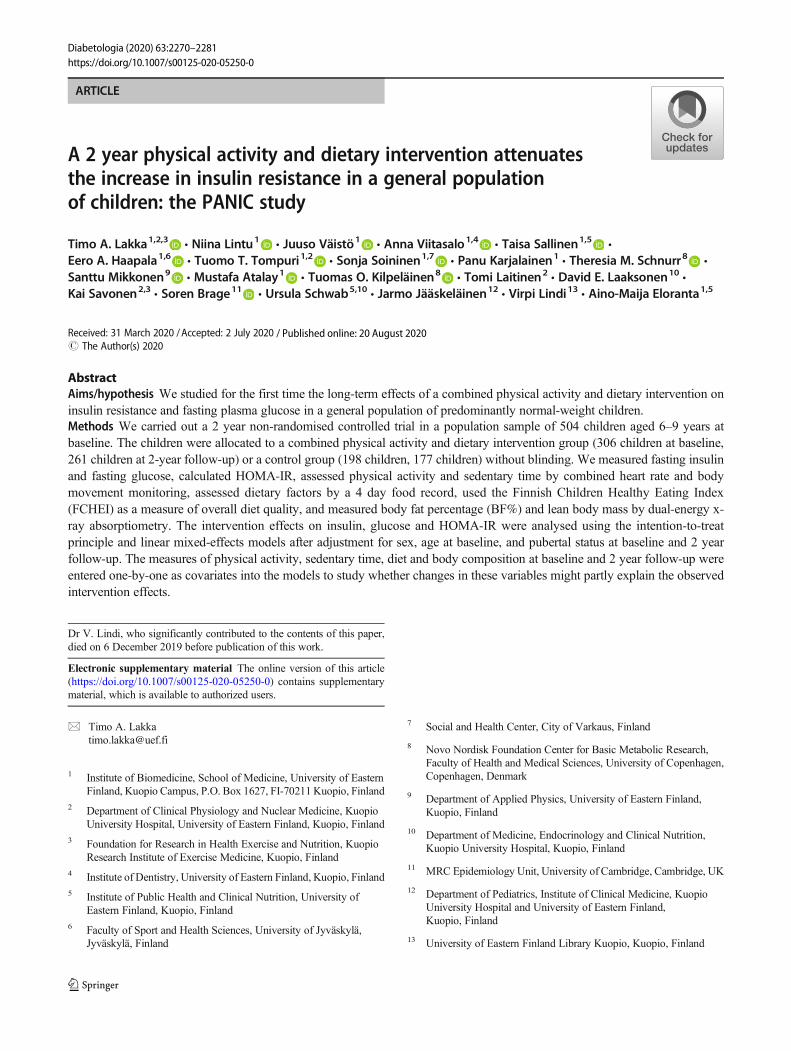
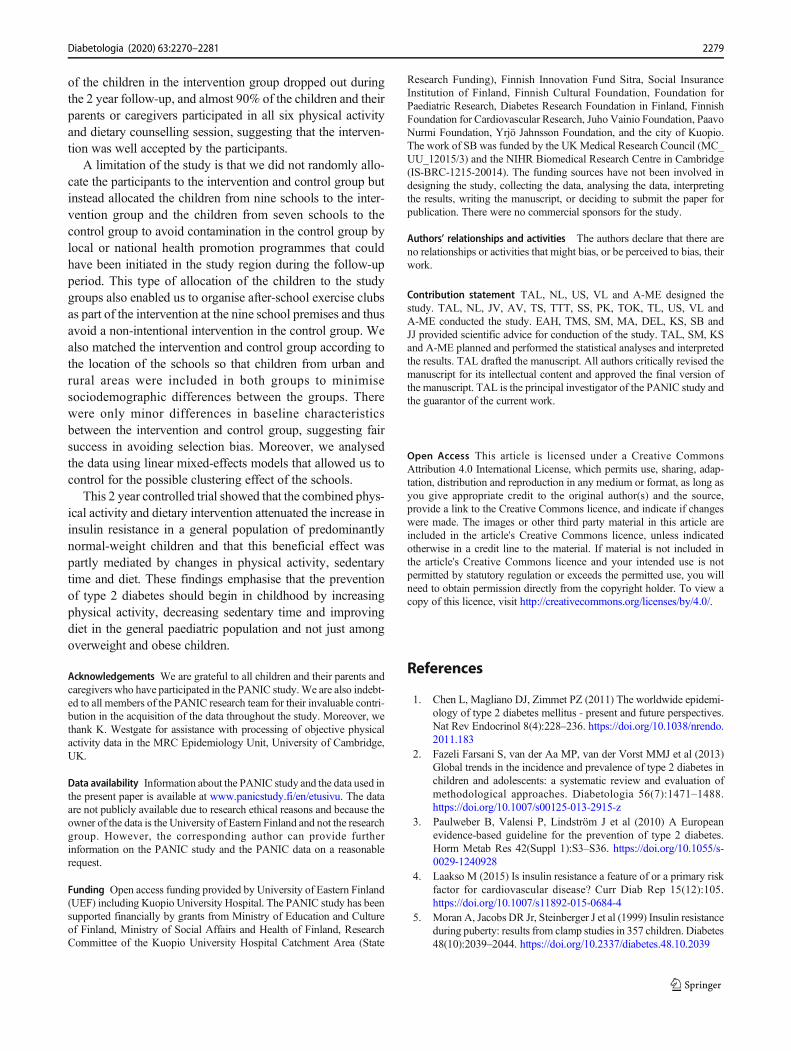
We invited 736 children aged 6–9 years who started thefirst grade in 16 primary schools of the city of Kuopio in2007–2009 to participate in the study (Fig. 1). Altogether,512 (70%) children (248 girls, 264 boys) accepted the invita-tion and participated in the baseline examinations betweenOctober 2007 and December 2009. The participants did notdiffer in sex, age, height-SD score (SDS) or BMI-SDS fromall children who started the first grade in the city of Kuopio in2007–2009. We excluded six children from the study at base-line either owing to their physical disabilities that couldhamper participation in the intervention or withdrawal of thefamilies because they had no time or motivation to attend thestudy.We also excluded data from two childrenwhose parentsor caregivers later withdrew their permission to use these datain the study. The final study sample thus included 504 chil-dren at baseline.
We allocated the children from nine schools to a combinedphysical activity and dietary intervention group (306 children,60%) and the children from seven schools to a control group(198 children, 40%) to avoid contamination in the controlgroup by any local or national health promotion programmesthat could have been initiated in the study region during thefollow-up period. We also proportionally matched the inter-vention and control group according to the location of theschools (urban vs rural) to minimise sociodemographic differ-ences between the groups. We included more children in theintervention group than in the control group because of alarger number of dropouts expected in the intervention groupand to retain a sufficient statistical power for comparisonbetween the groups. The children, their parents or caregivers,or people carrying out the examination visits or doing themeasurements were not blinded to the group assignment. Atotal of 261 children (85% of those invited) from the interven-tion group and 177 (89%) children from the control groupparticipated in the 2 year follow-up examinations betweenNovember 2009 and January 2012. The median (interquartilerange) of follow-up time was 2.1 (2.1–2.2) years in the inter-vention and control group.
2272 Diabetologia (2020) 63:2270–2281
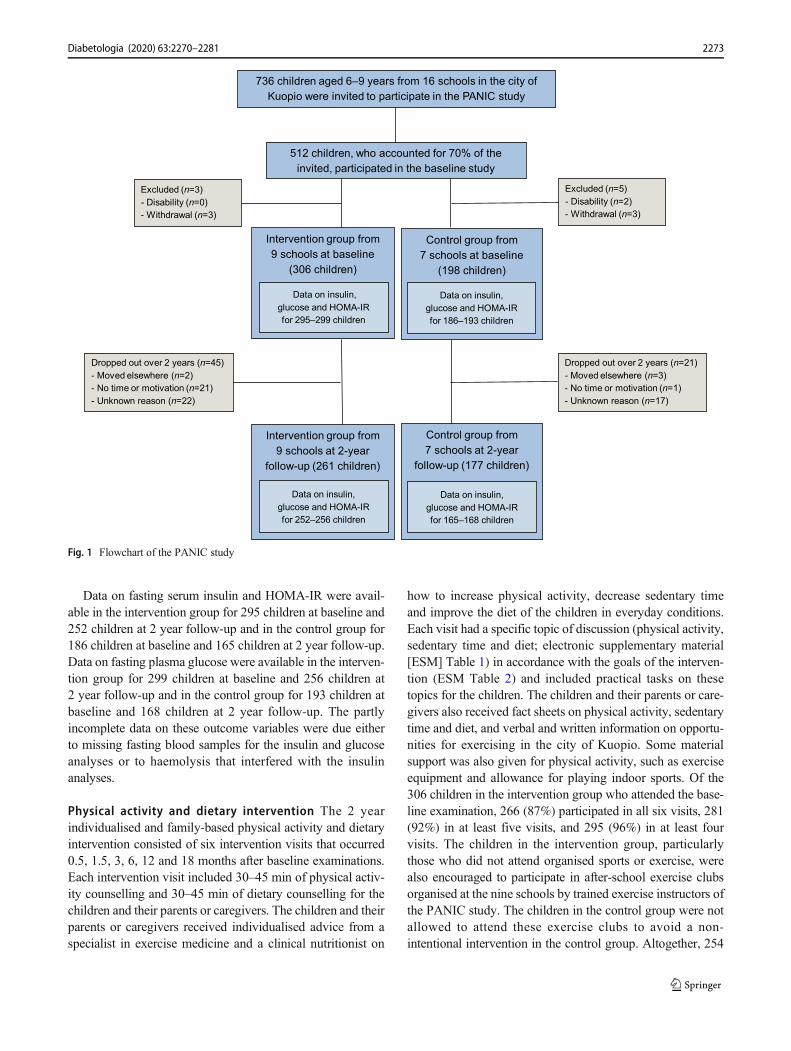
Data on fasting serum insulin and HOMA-IR were avail-able in the intervention group for 295 children at baseline and252 children at 2 year follow-up and in the control group for186 children at baseline and 165 children at 2 year follow-up.Data on fasting plasma glucose were available in the interven-tion group for 299 children at baseline and 256 children at2 year follow-up and in the control group for 193 children atbaseline and 168 children at 2 year follow-up. The partlyincomplete data on these outcome variables were due eitherto missing fasting blood samples for the insulin and glucoseanalyses or to haemolysis that interfered with the insulinanalyses.
Physical activity and dietary intervention The 2 yearindividualised and family-based physical activity and dietaryintervention consisted of six intervention visits that occurred0.5, 1.5, 3, 6, 12 and 18 months after baseline examinations.Each intervention visit included 30–45 min of physical activ-ity counselling and 30–45 min of dietary counselling for thechildren and their parents or caregivers. The children and theirparents or caregivers received individualised advice from aspecialist in exercise medicine and a clinical nutritionist on
how to increase physical activity, decrease sedentary timeand improve the diet of the children in everyday conditions.Each visit had a specific topic of discussion (physical activity,sedentary time and diet; electronic supplementary material[ESM] Table 1) in accordance with the goals of the interven-tion (ESM Table 2) and included practical tasks on thesetopics for the children. The children and their parents or care-givers also received fact sheets on physical activity, sedentarytime and diet, and verbal and written information on opportu-nities for exercising in the city of Kuopio. Some materialsupport was also given for physical activity, such as exerciseequipment and allowance for playing indoor sports. Of the306 children in the intervention group who attended the base-line examination, 266 (87%) participated in all six visits, 281(92%) in at least five visits, and 295 (96%) in at least fourvisits. The children in the intervention group, particularlythose who did not attend organised sports or exercise, werealso encouraged to participate in after-school exercise clubsorganised at the nine schools by trained exercise instructors ofthe PANIC study. The children in the control group were notallowed to attend these exercise clubs to avoid a non-intentional intervention in the control group. Altogether, 254
736 children aged 6–9 years from 16 schools in the city of
Kuopio were invited to participate in the PANIC study
512 children, who accounted for 70% of the
invited, participated in the baseline study
Dropped out over 2 years (n=21)
- Moved elsewhere (n=3)
- No time or motivation (n=1)
- Unknown reason (n=17)
Dropped out over 2 years (n=45)
- Moved elsewhere (n=2)
- No time or motivation (n=21)
- Unknown reason (n=22)
Intervention group from
9 schools at 2-year
follow-up (261 children)
Control group from
7 schools at 2-year
follow-up (177 children)
Intervention group from
9 schools at baseline
(306 children)
Control group from
7 schools at baseline
(198 children)
Excluded (n=3)
- Disability (n=0)
- Withdrawal (n=3)
Data on insulin,
glucose and HOMA-IR
for 252–256 children
Data on insulin,
glucose and HOMA-IR
for 165–168 children
Data on insulin,
glucose and HOMA-IR
for 295–299 children
Data on insulin,
glucose and HOMA-IR
for 186–193 children
Excluded (n=5)
- Disability (n=2)
- Withdrawal (n=3)
Fig. 1 Flowchart of the PANIC study
2273Diabetologia (2020) 63:2270–2281
(83%) of the 306 children in the intervention group participat-ed in at least one of the after-school exercise clubs, and 124(41%) participated at least once a month. In the control group,the children and their parents or caregivers received generalverbal and written advice on health-improving physical activ-ity and diet only at baseline with no further lifestylecounselling.
Measurement of insulin, glucose and HOMA-IR A researchnurse took blood samples in the morning, after children hadfasted overnight for at least 12 h. Serum insulin was analysedusing an electrochemiluminescence immunoassay with thesandwich principle (Roche Diagnostics, Mannheim,Germany). The within-day and between-day coefficients ofvariation for the insulin analyses were 1.3–3.5% (76–1104 pmol/l) and 1.6–4.4% (132–681 pmol/l), respectively.A hexokinase method was used to analyse plasma glucose(Roche Diagnostics). The within-day and between-day coef-ficients of variation for the glucose analyses were 0.7–0.9%(5.1–11.9 mmol/l) and 1.5–1.8% (3.4–14.1 mmol/l), respec-tively. HOMA-IR was calculated as explained elsewhere [24].
Assessment of physical activity and sedentary time Themeasures of physical activity and sedentary time, reflectingthe goals of the intervention, including average daily totalphysical activity energy expenditure, light, moderate andvigorous physical activity and total sedentary time, wereassessed using individually calibrated combined heart rateand body movement monitoring [25]. The methods used forthe assessment of physical activity and sedentary time [26–29]are explained in detail in ESM Methods. Average total phys-ical activity energy expenditure was calculated in kJ/kg daily.Light, moderate and vigorous physical activity were definedas time spent at intensity >1.5 and ≤4.0 metabolic equivalents(METs), >4.0 and ≤7.0 METs and >7.0 METs, respectively,where one MET is defined as an energy expenditure of71 J kg−1 min−1 or oxygen uptake of 3.5 ml kg−1 min−1.Moderate-to-vigorous physical activity was calculated bysumming moderate and vigorous physical activity. Totalsedentary time was defined as the time spent at intensity≤1.5 METs, excluding sleep.
Assessment of dietary factors Dietary factors reflecting thegoals of the intervention, including the consumption of vege-tables, fruit and berries, high-fibre (≥5%) grain products, low-fibre (<5%) grain products, high-fat (≥60%) vegetable oil-based spreads, vegetable oils, butter-based spreads, high-fat(≥1%) milk, low-fat (<1%) milk, red meat, fish and foods withhigh sugar content, were assessed using 4 day food records[30]. (See ESM Methods for details.) We used the FinnishChildren Healthy Eating Index (FCHEI) as an indicator ofoverall diet quality [31]. The index was calculated bysumming the reported consumption of the following foods
based on their quantiles in the present study population [30]:vegetables, fruit and berries (scored 1–10); high-fat (≥60%)vegetable oil-based spreads and vegetable oils (0–10); low-fat(<1%) milk (0–9); fish (0–6); and foods with high sugarcontent (10–1). The index thus ranged between 2 and 45, ahigher score indicating higher overall diet quality.
Assessment of body size and composition Body height andweight were assessed, BMI was calculated, age- and sex-standardised height-SDS and BMI-SDS were calculated,overweight and obesity were defined, and BF% and lean bodymass were measured [25, 30]. (See ESMMethods for details.)
Assessment of pubertal status A research physician assessedpubertal status according to breast development for girls(scored M 1–5) and according to testicular volume measuredby an orchidometer for boys (scored G 1–5) using the Tannerstaging method [32, 33].
Statistical methodsWeperformed all statistical analyses usingthe IBM SPSS Statistics software, version 25.0 (IBM Corp.,Armonk, NY, USA). A p value of <0.05 for a two-tailed testwas used to indicate statistical significance. The outcome vari-ables were normally distributed based on visual observation ofthe histograms.We compared baseline characteristics betweenthe intervention and control group by linear mixed-effectsmodels with cluster-robust SEs, except body weight statusfor which comparison was performed by generalised linearmixed-effects models with ordered structure, to account forthe clustering effect of schools. Sample size calculations [22,23] are explained in ESMMethods. We studied the effects ofthe combined physical activity and dietary intervention oninsulin, glucose and HOMA-IR using the intention-to-treatprinciple by including all 504 children in the statistical analy-ses. We analysed the data using linear mixed-effects modelsaccording to a three-level data structure by clustering therepeated outcome variables at baseline and 2 year follow-upwithin children who were considered as being included in themixed model structure and were clustered within schools.However, we did not use the three-level data structure in thefinal models because allowing for school-level clustering didnot improve model fit based on the Bayesian informationcriterion, as presented in ESMMethods. We adjusted the datafor sex, age at baseline, and pubertal status at baseline and2 year follow-up and included main effects for time and forstudy group × time interaction in the models. The mixed-effects models assume that the data are missing at random.We found that this assumption was reasonable because therewere only minor differences in the characteristics betweenchildren with the outcome data and childrenwithout these dataat 2 year follow-up. We did not include study group as aseparate variable in the models because there were no statisti-cally significant differences in insulin, glucose and HOMA-IR
2274 Diabetologia (2020) 63:2270–2281
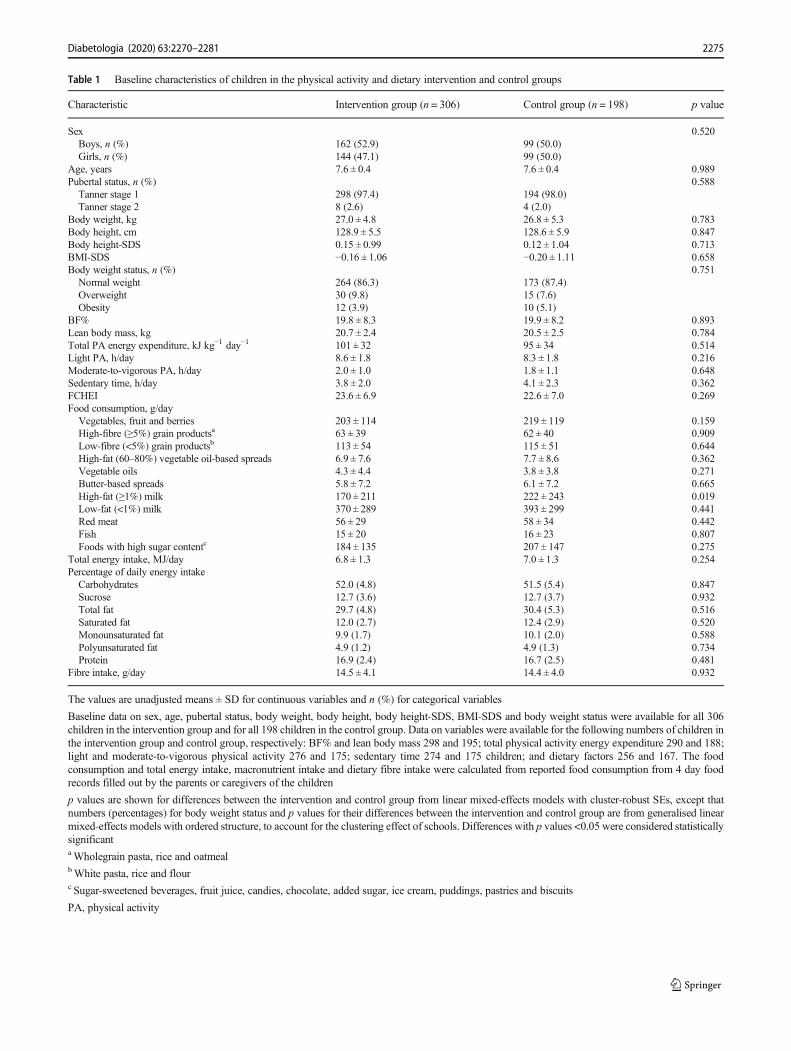
Table 1 Baseline characteristics of children in the physical activity and dietary intervention and control groups
Characteristic Intervention group (n = 306) Control group (n = 198) p value
Sex 0.520Boys, n (%) 162 (52.9) 99 (50.0)Girls, n (%) 144 (47.1) 99 (50.0)
Age, years 7.6 ± 0.4 7.6 ± 0.4 0.989Pubertal status, n (%) 0.588Tanner stage 1 298 (97.4) 194 (98.0)Tanner stage 2 8 (2.6) 4 (2.0)
Body weight, kg 27.0 ± 4.8 26.8 ± 5.3 0.783Body height, cm 128.9 ± 5.5 128.6 ± 5.9 0.847Body height-SDS 0.15 ± 0.99 0.12 ± 1.04 0.713BMI-SDS −0.16 ± 1.06 −0.20 ± 1.11 0.658Body weight status, n (%) 0.751Normal weight 264 (86.3) 173 (87.4)Overweight 30 (9.8) 15 (7.6)Obesity 12 (3.9) 10 (5.1)
BF% 19.8 ± 8.3 19.9 ± 8.2 0.893Lean body mass, kg 20.7 ± 2.4 20.5 ± 2.5 0.784Total PA energy expenditure, kJ kg−1 day−1 101 ± 32 95 ± 34 0.514Light PA, h/day 8.6 ± 1.8 8.3 ± 1.8 0.216Moderate-to-vigorous PA, h/day 2.0 ± 1.0 1.8 ± 1.1 0.648Sedentary time, h/day 3.8 ± 2.0 4.1 ± 2.3 0.362FCHEI 23.6 ± 6.9 22.6 ± 7.0 0.269Food consumption, g/dayVegetables, fruit and berries 203 ± 114 219 ± 119 0.159High-fibre (≥5%) grain productsa 63 ± 39 62 ± 40 0.909Low-fibre (<5%) grain productsb 113 ± 54 115 ± 51 0.644High-fat (60–80%) vegetable oil-based spreads 6.9 ± 7.6 7.7 ± 8.6 0.362Vegetable oils 4.3 ± 4.4 3.8 ± 3.8 0.271Butter-based spreads 5.8 ± 7.2 6.1 ± 7.2 0.665High-fat (≥1%) milk 170 ± 211 222 ± 243 0.019Low-fat (<1%) milk 370 ± 289 393 ± 299 0.441Red meat 56 ± 29 58 ± 34 0.442Fish 15 ± 20 16 ± 23 0.807Foods with high sugar contentc 184 ± 135 207 ± 147 0.275
Total energy intake, MJ/day 6.8 ± 1.3 7.0 ± 1.3 0.254Percentage of daily energy intakeCarbohydrates 52.0 (4.8) 51.5 (5.4) 0.847Sucrose 12.7 (3.6) 12.7 (3.7) 0.932Total fat 29.7 (4.8) 30.4 (5.3) 0.516Saturated fat 12.0 (2.7) 12.4 (2.9) 0.520Monounsaturated fat 9.9 (1.7) 10.1 (2.0) 0.588Polyunsaturated fat 4.9 (1.2) 4.9 (1.3) 0.734Protein 16.9 (2.4) 16.7 (2.5) 0.481
Fibre intake, g/day 14.5 ± 4.1 14.4 ± 4.0 0.932
The values are unadjusted means ± SD for continuous variables and n (%) for categorical variables
Baseline data on sex, age, pubertal status, body weight, body height, body height-SDS, BMI-SDS and body weight status were available for all 306children in the intervention group and for all 198 children in the control group. Data on variables were available for the following numbers of children inthe intervention group and control group, respectively: BF% and lean body mass 298 and 195; total physical activity energy expenditure 290 and 188;light and moderate-to-vigorous physical activity 276 and 175; sedentary time 274 and 175 children; and dietary factors 256 and 167. The foodconsumption and total energy intake, macronutrient intake and dietary fibre intake were calculated from reported food consumption from 4 day foodrecords filled out by the parents or caregivers of the children
p values are shown for differences between the intervention and control group from linear mixed-effects models with cluster-robust SEs, except thatnumbers (percentages) for body weight status and p values for their differences between the intervention and control group are from generalised linearmixed-effects models with ordered structure, to account for the clustering effect of schools. Differences with p values <0.05 were considered statisticallysignificantaWholegrain pasta, rice and oatmealbWhite pasta, rice and flourc Sugar-sweetened beverages, fruit juice, candies, chocolate, added sugar, ice cream, puddings, pastries and biscuits
PA, physical activity
2275Diabetologia (2020) 63:2270–2281
between the intervention and control group at baseline. Theformula for the linear mixed-effects model is presented inESM Methods. We also examined whether 2 year changesin physical activity, sedentary time, diet, BF% and lean bodymass might partly explain the observed intervention effects oninsulin, glucose and HOMA-IR by calculating percentagechanges in regression coefficients for differences in estimatedchanges in insulin, glucose and HOMA-IR between the inter-vention and control group after adding physical activity,sedentary time, diet, BF% and lean body mass at baselineand 2 year follow-up one-by-one as covariates into the linearmixed-effects models.
Results
Characteristics of children There were no differences in base-line characteristics between the groups, except that children inthe combined physical activity and dietary intervention groupconsumed less high-fat milk than children in the control group(Table 1). Only 2–3% of the children at baseline (Table 1) and23–24% of the children at 2 year follow-up (ESM Table 3)had entered puberty (Tanner stage ≥2). Altogether, 13% of thechildren in both groups were overweight or obese at baseline(Table 1), whereas 17% of the children in the interventiongroup and 18% of the children in the control group wereoverweight or obese at 2 year follow-up (ESM Table 3).
Intervention effects on insulin, glucose, HOMA-IR, BF% andlean body mass Fasting insulin increased 4.65 pmol/l less(absolute change +8.96 vs +13.61 pmol/l) and HOMA-IRincreased 0.18 units less (+0.31 vs +0.49 units) over 2 yearsin the combined physical activity and dietary interventiongroup than in the control group (Table 2). These interventioneffects on fasting insulin and HOMA-IR were statisticallysignificant after adjustment for sex, age at baseline, and
pubertal status at baseline and 2 year follow-up (Table 2).However, the intervention had no effect on fasting glucose(Table 2), BF% (regression coefficient β for interventioneffect −0.02 [95% CI −0.39, 0.36], p = 0.926) or lean bodymass (β for intervention effect 0.03 [95%CI −0.07, 0.13], p =0.567) over 2 years.
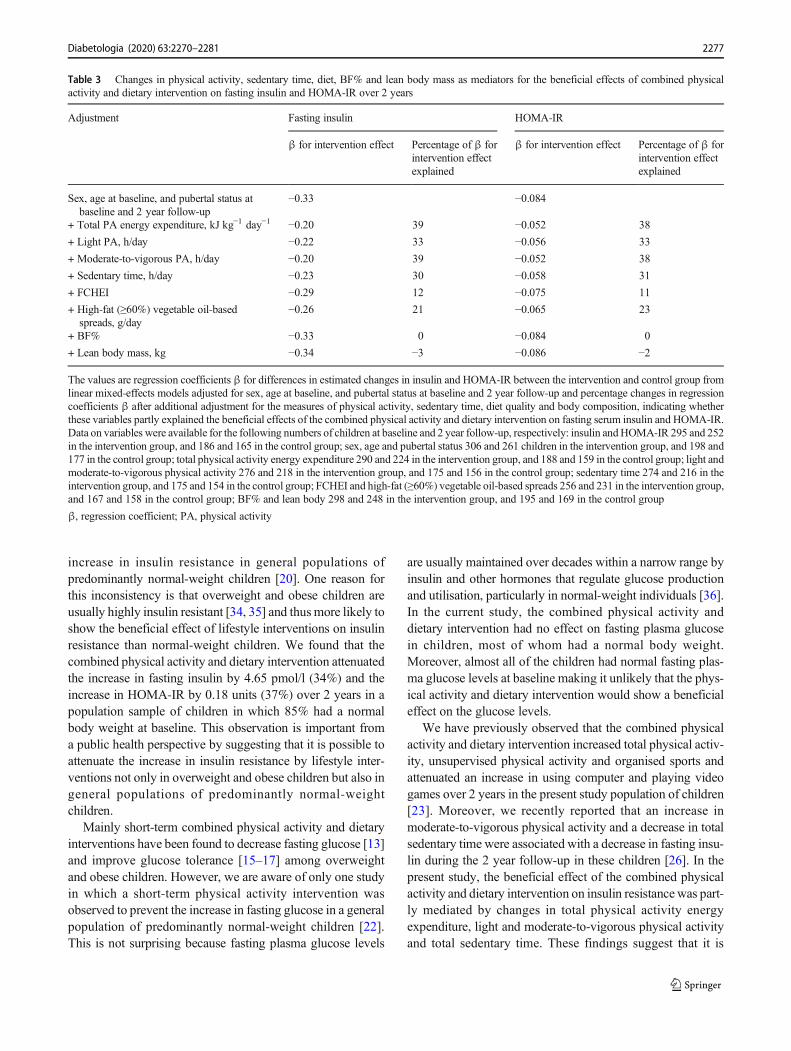
Mediators for intervention effects on insulin and HOMA-IRThe intervention effects over 2 years on fasting insulin andHOMA-IR, respectively, were explained by the followingchanges (β for intervention effect was changed by the %shown): total physical activity energy expenditure andmoderate-to-vigorous physical activity 39% and 38%; lightphysical activity 33% and 33%; total sedentary time 30%and 31%; the reported consumption of high-fat (≥60%) vege-table oil-based spreads 21% and 23%; and FCHEI 12% and11% (Table 3). However, 2 year changes in other dietaryfactors, BF% or lean body mass did not explain any of theintervention effects (Table 3).
Discussion
This controlled trial showed that the combined physical activ-ity and dietary intervention attenuated the increase in insulinresistance, assessed by fasting serum insulin and HOMA-IR,but had no effect on fasting plasma glucose over 2 years in ageneral population of children. The intervention effects oninsulin resistance were partly mediated by changes in physicalactivity, sedentary time and diet but not by changes in BF% orlean body mass.
Several mainly short-term physical activity and dietaryinterventions, particularly in combinations, have been shownto decrease insulin resistance among overweight and obesechildren [7–19]. To our knowledge, however, only one long-term dietary intervention has been observed to attenuate the
Table 2 Effects of combined physical activity and dietary intervention on fasting insulin, fasting glucose and HOMA-IR over 2 years
Variable Intervention group Control group Difference in estimated change between groups
Baseline 2 year follow-up Baseline 2 year follow-up β (95% CI) p value
Fasting insulin, pmol/l 30.70 (16.25) 39.66 (21.46) 31.95 (16.74) 45.56 (26.95) −0.33 (−0.62, −0.04) 0.026
Fasting glucose, mmol/l 4.81 (0.37) 5.00 (0.50) 4.84 (0.43) 5.05 (0.49) −0.03 (−0.07, 0.02) 0.263
HOMA-IR 0.97 (0.55) 1.28 (0.74) 1.00 (0.57) 1.49 (0.97) −0.084 (−0.156, −0.012) 0.023
The measured values are presented as means±SD; regression coefficient β (95% CI) values are shown for differences in estimated changes in insulin,glucose and HOMA-IR between the intervention and control group and p values for intervention effects are received from linear mixed-effects modelsadjusted for sex, age at baseline, and pubertal status at baseline and 2 year follow-up
Data on insulin and HOMA-IR were available in the intervention group for 295 children at baseline and 252 children at 2 year follow-up and in thecontrol group for 186 children at baseline and 165 children at 2-year follow-up. Data on glucose were available in the intervention group for 299 childrenat baseline and 256 children at 2 year follow-up and in the control group for 193 children at baseline and 168 children at 2 year follow-up. The partlyincomplete data on these outcome variables were either due to missing fasting blood samples for the insulin and glucose analyses or to haemolysis thatinterfered with the insulin analyses
2276 Diabetologia (2020) 63:2270–2281
increase in insulin resistance in general populations ofpredominantly normal-weight children [20]. One reason forthis inconsistency is that overweight and obese children areusually highly insulin resistant [34, 35] and thusmore likely toshow the beneficial effect of lifestyle interventions on insulinresistance than normal-weight children. We found that thecombined physical activity and dietary intervention attenuatedthe increase in fasting insulin by 4.65 pmol/l (34%) and theincrease in HOMA-IR by 0.18 units (37%) over 2 years in apopulation sample of children in which 85% had a normalbody weight at baseline. This observation is important froma public health perspective by suggesting that it is possible toattenuate the increase in insulin resistance by lifestyle inter-ventions not only in overweight and obese children but also ingeneral populations of predominantly normal-weightchildren.
Mainly short-term combined physical activity and dietaryinterventions have been found to decrease fasting glucose [13]and improve glucose tolerance [15–17] among overweightand obese children. However, we are aware of only one studyin which a short-term physical activity intervention wasobserved to prevent the increase in fasting glucose in a generalpopulation of predominantly normal-weight children [22].This is not surprising because fasting plasma glucose levels
are usually maintained over decades within a narrow range byinsulin and other hormones that regulate glucose productionand utilisation, particularly in normal-weight individuals [36].In the current study, the combined physical activity anddietary intervention had no effect on fasting plasma glucosein children, most of whom had a normal body weight.Moreover, almost all of the children had normal fasting plas-ma glucose levels at baseline making it unlikely that the phys-ical activity and dietary intervention would show a beneficialeffect on the glucose levels.
We have previously observed that the combined physicalactivity and dietary intervention increased total physical activ-ity, unsupervised physical activity and organised sports andattenuated an increase in using computer and playing videogames over 2 years in the present study population of children[23]. Moreover, we recently reported that an increase inmoderate-to-vigorous physical activity and a decrease in totalsedentary time were associated with a decrease in fasting insu-lin during the 2 year follow-up in these children [26]. In thepresent study, the beneficial effect of the combined physicalactivity and dietary intervention on insulin resistancewas part-ly mediated by changes in total physical activity energyexpenditure, light and moderate-to-vigorous physical activityand total sedentary time. These findings suggest that it is
Table 3 Changes in physical activity, sedentary time, diet, BF% and lean body mass as mediators for the beneficial effects of combined physicalactivity and dietary intervention on fasting insulin and HOMA-IR over 2 years
Adjustment Fasting insulin HOMA-IR
β for intervention effect Percentage of β forintervention effectexplained
β for intervention effect Percentage of β forintervention effectexplained
Sex, age at baseline, and pubertal status atbaseline and 2 year follow-up
−0.33 −0.084
+ Total PA energy expenditure, kJ kg−1 day−1 −0.20 39 −0.052 38
+ Light PA, h/day −0.22 33 −0.056 33
+ Moderate-to-vigorous PA, h/day −0.20 39 −0.052 38
+ Sedentary time, h/day −0.23 30 −0.058 31
+ FCHEI −0.29 12 −0.075 11
+ High-fat (≥60%) vegetable oil-basedspreads, g/day
−0.26 21 −0.065 23
+ BF% −0.33 0 −0.084 0
+ Lean body mass, kg −0.34 −3 −0.086 −2
The values are regression coefficients β for differences in estimated changes in insulin and HOMA-IR between the intervention and control group fromlinear mixed-effects models adjusted for sex, age at baseline, and pubertal status at baseline and 2 year follow-up and percentage changes in regressioncoefficients β after additional adjustment for the measures of physical activity, sedentary time, diet quality and body composition, indicating whetherthese variables partly explained the beneficial effects of the combined physical activity and dietary intervention on fasting serum insulin and HOMA-IR.Data on variables were available for the following numbers of children at baseline and 2 year follow-up, respectively: insulin andHOMA-IR 295 and 252in the intervention group, and 186 and 165 in the control group; sex, age and pubertal status 306 and 261 children in the intervention group, and 198 and177 in the control group; total physical activity energy expenditure 290 and 224 in the intervention group, and 188 and 159 in the control group; light andmoderate-to-vigorous physical activity 276 and 218 in the intervention group, and 175 and 156 in the control group; sedentary time 274 and 216 in theintervention group, and 175 and 154 in the control group; FCHEI and high-fat (≥60%) vegetable oil-based spreads 256 and 231 in the intervention group,and 167 and 158 in the control group; BF% and lean body 298 and 248 in the intervention group, and 195 and 169 in the control group
β, regression coefficient; PA, physical activity
2277Diabetologia (2020) 63:2270–2281
possible to attenuate the increase in insulin resistance in gener-al populations of predominantly normal-weight children byincreasing physical activity and decreasing sedentary time.Increased physical activity may have a beneficial effect oninsulin resistance through the following mechanisms: increas-ing capillary density in skeletal muscles and improving thedelivery of glucose, insulin and oxygen into the muscle cells[37]; increasing the number of type IIa fibres and improvingoxidative metabolism in skeletal muscles [38]; increasing theexpression of GLUT 4 in skeletal muscles and enhancinginsulin- and muscle contraction-stimulated glucose uptakeinto the muscle cells [39]; and activating a number of signal-ling proteins and key enzymes of glucose metabolism, partic-ularly glycogen synthase and hexokinase, in skeletal musclecells [39, 40]. Physical activity may also increase the uptakeand oxidation of NEFA [41], reduce the concentrations ofdeleterious lipid metabolites, such as diacylglycerols andceramides [42], decrease inflammation [43], and reduce lipidperoxidation [44] in skeletal muscles.
Previously, we observed that the combined physical activ-ity and dietary intervention increased the reported consump-tion of vegetables, high-fat vegetable oil-based spreads andlow-fat milk and prevented the increase in the reportedconsumption of butter-based spreads over 2 years in thecurrent study population of children [22]. In the present study,the beneficial effect of the intervention on insulin resistancewas slightly mediated by changes in the reported consumptionof high-fat (≥60%) vegetable oil-based spreads and the overalldiet quality. Consistent with our findings, the beneficial effectof dietary intervention on insulin resistance among predomi-nantly normal-weight children participating in the SpecialTurku Coronary Risk Factor Intervention Project forChildren (STRIP) was partly mediated by the lower intakeof saturated fat and the higher intake of polyunsaturated fatand carbohydrates in the dietary intervention group [20].Taken together, the results of the STRIP and our study suggestthat it is to some extent possible to attenuate the increase ininsulin resistance among children, most of whom have anormal body weight, by replacing some of the saturated fatwith unsaturated fat in the diet. This dietary change may exerta beneficial effect on insulin resistance by improving thecomposition of fatty acids, decreasing the accumulation ofharmful lipid metabolites, such as diacylglycerols andceramides, increasing GLUT 4 expression, activating signal-ling proteins, increasing lipid oxidation [45], and improvingmitochondrial function [46] in skeletal muscles.
The beneficial effects of lifestyle interventions on insulinresistance among overweight and obese children appear to beat least partly due to decreased adiposity [13, 15, 16]. Theunderlying reason is that being overweight is one of the maincauses of insulin resistance in children [34, 35]. However,there is some evidence that physical activity interventionsare able to decrease insulin resistance independent of a change
in adiposity among overweight and obese children [9, 12] andthat dietary interventions can attenuate the increase in insulinresistance without a marked change in BF% in general popu-lations of predominantly normal-weight children [20].Consistent with these findings, we observed that the beneficialeffect of the combined physical activity and dietary interven-tion on insulin resistance in a general population of childrenwas not mediated by a change in BF%. Moreover, we showedthat the intervention effect was also independent of a changein lean body mass. Therefore, further intervention studies areneeded to reveal the biological mechanisms by which physicalactivity and dietary changes attenuate the increase in insulinresistance in children independent of changes in bodycomposition.
Insulin resistance increases particularly during puberty [5],but increases have been noted some years before puberty, atthe age of 7 years [6]. Increased insulin resistance during andbefore puberty is partly due to increased body fat content butalso to elevated serum levels of IGF-1, which is primarilyregulated by growth hormone [7]. There is some evidence thatphysical activity attenuates the natural peak of insulin resis-tance occurring at the age of 12–13 years independent ofpubertal status and BF% [47]. Moreover, the dietary interven-tion initiated in infancy in the STRIP attenuated the increase ininsulin resistance until childhood [20] and even late adoles-cence [48] independent of pubertal status. Consistent withthese findings, we observed that the combined physical activ-ity and dietary intervention attenuated the increase in insulinresistance independent of pubertal status, BF% and lean bodymass. However, very few children at baseline and less thanone-fourth of the children at the 2 year follow-up examinationhad entered puberty (all of them being at early puberty), withno difference between the intervention and control group.Thus, pubertal status was not a major confounder in our study.
A strength of our study is that we had for the first time theopportunity to investigate whether a long-term combinedphysical activity and dietary intervention has beneficial effectson insulin resistance and fasting plasma glucose in a generalpopulation of children, most of whom have a normal bodyweight. The thorough assessment of physical activity andsedentary time using individually calibrated heart rate andbodymovement monitoring, dietary factors using a 4 day foodrecord, and BF% and lean body mass using dual-energy x-rayabsorptiometry allowed us to examine whether these interven-tion effects were mediated by real changes in the targetedbehaviours and body composition. Body size and compositionin our study sample of children were similar to those of thelarge national reference population [49], as indicated byheight-SDS and BMI-SDS, which made it possible to gener-alise the results to other children of the same age in Finland.We emphasised the individual needs of the families and paren-tal involvement, both of which have been observed to improveadherence of families to lifestyle interventions [50]. Only 15%
2278 Diabetologia (2020) 63:2270–2281
of the children in the intervention group dropped out duringthe 2 year follow-up, and almost 90% of the children and theirparents or caregivers participated in all six physical activityand dietary counselling session, suggesting that the interven-tion was well accepted by the participants.
A limitation of the study is that we did not randomly allo-cate the participants to the intervention and control group butinstead allocated the children from nine schools to the inter-vention group and the children from seven schools to thecontrol group to avoid contamination in the control group bylocal or national health promotion programmes that couldhave been initiated in the study region during the follow-upperiod. This type of allocation of the children to the studygroups also enabled us to organise after-school exercise clubsas part of the intervention at the nine school premises and thusavoid a non-intentional intervention in the control group. Wealso matched the intervention and control group according tothe location of the schools so that children from urban andrural areas were included in both groups to minimisesociodemographic differences between the groups. Therewere only minor differences in baseline characteristicsbetween the intervention and control group, suggesting fairsuccess in avoiding selection bias. Moreover, we analysedthe data using linear mixed-effects models that allowed us tocontrol for the possible clustering effect of the schools.
This 2 year controlled trial showed that the combined phys-ical activity and dietary intervention attenuated the increase ininsulin resistance in a general population of predominantlynormal-weight children and that this beneficial effect waspartly mediated by changes in physical activity, sedentarytime and diet. These findings emphasise that the preventionof type 2 diabetes should begin in childhood by increasingphysical activity, decreasing sedentary time and improvingdiet in the general paediatric population and not just amongoverweight and obese children.
Acknowledgements We are grateful to all children and their parents andcaregivers who have participated in the PANIC study.We are also indebt-ed to all members of the PANIC research team for their invaluable contri-bution in the acquisition of the data throughout the study. Moreover, wethank K. Westgate for assistance with processing of objective physicalactivity data in the MRC Epidemiology Unit, University of Cambridge,UK.
Data availability Information about the PANIC study and the data used inthe present paper is available at www.panicstudy.fi/en/etusivu. The dataare not publicly available due to research ethical reasons and because theowner of the data is the University of Eastern Finland and not the researchgroup. However, the corresponding author can provide furtherinformation on the PANIC study and the PANIC data on a reasonablerequest.
Funding Open access funding provided by University of Eastern Finland(UEF) including Kuopio University Hospital. The PANIC study has beensupported financially by grants from Ministry of Education and Cultureof Finland, Ministry of Social Affairs and Health of Finland, ResearchCommittee of the Kuopio University Hospital Catchment Area (State
Research Funding), Finnish Innovation Fund Sitra, Social InsuranceInstitution of Finland, Finnish Cultural Foundation, Foundation forPaediatric Research, Diabetes Research Foundation in Finland, FinnishFoundation for Cardiovascular Research, Juho Vainio Foundation, PaavoNurmi Foundation, Yrjö Jahnsson Foundation, and the city of Kuopio.The work of SB was funded by the UKMedical Research Council (MC_UU_12015/3) and the NIHR Biomedical Research Centre in Cambridge(IS-BRC-1215-20014). The funding sources have not been involved indesigning the study, collecting the data, analysing the data, interpretingthe results, writing the manuscript, or deciding to submit the paper forpublication. There were no commercial sponsors for the study.
Authors’ relationships and activities The authors declare that there areno relationships or activities that might bias, or be perceived to bias, theirwork.
Contribution statement TAL, NL, US, VL and A-ME designed thestudy. TAL, NL, JV, AV, TS, TTT, SS, PK, TOK, TL, US, VL andA-ME conducted the study. EAH, TMS, SM, MA, DEL, KS, SB andJJ provided scientific advice for conduction of the study. TAL, SM, KSand A-ME planned and performed the statistical analyses and interpretedthe results. TAL drafted the manuscript. All authors critically revised themanuscript for its intellectual content and approved the final version ofthe manuscript. TAL is the principal investigator of the PANIC study andthe guarantor of the current work.
Open Access This article is licensed under a Creative CommonsAttribution 4.0 International License, which permits use, sharing, adap-tation, distribution and reproduction in any medium or format, as long asyou give appropriate credit to the original author(s) and the source,provide a link to the Creative Commons licence, and indicate if changeswere made. The images or other third party material in this article areincluded in the article's Creative Commons licence, unless indicatedotherwise in a credit line to the material. If material is not included inthe article's Creative Commons licence and your intended use is notpermitted by statutory regulation or exceeds the permitted use, you willneed to obtain permission directly from the copyright holder. To view acopy of this licence, visit http://creativecommons.org/licenses/by/4.0/.
References
1. Chen L, Magliano DJ, Zimmet PZ (2011) The worldwide epidemi-ology of type 2 diabetes mellitus - present and future perspectives.Nat Rev Endocrinol 8(4):228–236. https://doi.org/10.1038/nrendo.2011.183
2. Fazeli Farsani S, van der Aa MP, van der Vorst MMJ et al (2013)Global trends in the incidence and prevalence of type 2 diabetes inchildren and adolescents: a systematic review and evaluation ofmethodological approaches. Diabetologia 56(7):1471–1488.https://doi.org/10.1007/s00125-013-2915-z
3. Paulweber B, Valensi P, Lindström J et al (2010) A Europeanevidence-based guideline for the prevention of type 2 diabetes.Horm Metab Res 42(Suppl 1):S3–S36. https://doi.org/10.1055/s-0029-1240928
4. Laakso M (2015) Is insulin resistance a feature of or a primary riskfactor for cardiovascular disease? Curr Diab Rep 15(12):105.https://doi.org/10.1007/s11892-015-0684-4
5. Moran A, Jacobs DR Jr, Steinberger J et al (1999) Insulin resistanceduring puberty: results from clamp studies in 357 children. Diabetes48(10):2039–2044. https://doi.org/10.2337/diabetes.48.10.2039
2279Diabetologia (2020) 63:2270–2281
6. Jeffery AN, Metcalf BS, Hosking J et al (2012) Age before stage:insulin resistance rises before the onset of puberty: a 9-year longi-tudinal study (EarlyBird 26). Diabetes Care 35(3):536–541. https://doi.org/10.2337/dc11-1281
7. Ferguson MA, Gutin B, Le NA et al (1999) Effects of exercisetraining and its cessation on components of the insulin resistancesyndrome in obese children. Int J Obes Relat Metab Disord 23(8):889–895. https://doi.org/10.1038/sj.ijo.0800968
8. Carrel AL, Clark RR, Peterson SE et al (2005) Improvement offitness, body composition, and insulin sensitivity in overweightchildren in a school-based exercise program: a randomized,controlled study. Arch Pediatr Adolesc Med 159(10):963–968.https://doi.org/10.1001/archpedi.159.10.963
9. Bell LM, Watts K, Siafarikas A et al (2007) Exercise alone reducesinsulin resistance in obese children independently of changes inbody composition. J Clin Endocrinol Metab 92(11):4230–4235.https://doi.org/10.1210/jc.2007-0779
10. Davis CL, Pollock NK, Waller JL et al (2012) Exercise dose anddiabetes risk in overweight and obese children: a randomizedcontrolled trial. JAMA 308(11):1103–1112. https://doi.org/10.1001/2012.jama.10762
11. Lee S, Bacha F, Hannon T et al (2012) Effects of aerobic versusresistance exercise without caloric restriction on abdominal fat,intrahepatic lipid, and insulin sensitivity in obese adolescent boys:a randomized, controlled trial. Diabetes 61(11):2787–2795. https://doi.org/10.2337/db12-0214
12. Mendelson M, Michallet AS, Monneret D et al (2015) Impact ofexercise trainingwithout caloric restriction on inflammation, insulinresistance and visceral fat mass in obese adolescents. Pediatr Obes10(4):311–319. https://doi.org/10.1111/ijpo.255
13. Ho M, Garnett SP, Baur LA et al (2013) Impact of dietary andexercise interventions on weight change and metabolic outcomesin obese children and adolescents: a systematic review and meta-analysis of randomized trials. JAMA Pediatr 167(8):759–768.https://doi.org/10.1001/jamapediatrics.2013.1453
14. Savoye M, Shaw M, Dziura J et al (2007) Effects of a weightmanagement program on body composition and metabolic param-eters in overweight children: a randomized controlled trial. JAMA297(24):2697–2704. https://doi.org/10.1001/jama.297.24.2697
15. Shaw M, Savoye M, Cali A et al (2009) Effect of a successfulintensive lifestyle program on insulin sensitivity and glucose toler-ance in obese youth. Diabetes Care 32(1):45–47. https://doi.org/10.2337/dc08-0808
16. Davis JN, Kelly LA, Lane CJ et al (2009) Randomized control trialto improve adiposity and insulin resistance in overweight Latinoadolescents. Obesity (Silver Spring) 17(8):1542–1548. https://doi.org/10.1038/oby.2009.19
17. Savoye M, Caprio S, Dziura J et al (2014) Reversal of early abnor-malities in glucose metabolism in obese youth: results of an inten-sive lifestyle randomized controlled trial. Diabetes Care 37(2):317–324. https://doi.org/10.2337/dc13-1571
18. Harder-Lauridsen NM, Birk NM, Ried-Larsen M et al (2014) Arandomized controlled trial on a multicomponent intervention foroverweight school-aged children – Copenhagen, Denmark. BMCPediatr 14(1):273. https://doi.org/10.1186/1471-2431-14-273
19. Marson EC, Delevatti RS, Prado AK et al (2016) Effects of aerobic,resistance, and combined exercise training on insulin resistancemarkers in overweight or obese children and adolescents: a system-atic review and meta-analysis. Prev Med 93:211–218. https://doi.org/10.1016/j.ypmed.2016.10.020
20. Kaitosaari T, Rönnemaa T, Viikari J et al (2006) Low-saturated fatdietary counseling starting in infancy improves insulin sensitivity in9-year-old healthy children: the Special Turku Coronary RiskFactor Intervention Project for Children (STRIP) study. DiabetesCare 29(4):781–785. https://doi.org/10.2337/diacare.29.04.06.dc05-1523
21. Li X-H, Lin S, Guo H et al (2014) Effectiveness of a school-basedphysical activity intervention on obesity in school children: anonrandomized controlled trial. BMC Public Health 14(1):1282.https://doi.org/10.1186/1471-2458-14-1282
22. Viitasalo A, Eloranta AM, Lintu N et al (2016) The effects of a 2-year individualized and family-based lifestyle intervention on phys-ical activity, sedentary behavior and diet in children. Prev Med 87:81–88. https://doi.org/10.1016/j.ypmed.2016.02.027
23. Venäläinen TM, Viitasalo AM, Schwab US et al (2016) Effect of a2-y dietary and physical activity intervention on plasma fatty acidcomposition and estimated desaturase and elongase activities inchildren: the Physical Activity and Nutrition in Children Study.Am J Clin Nutr 104(4):964–972. https://doi.org/10.3945/ajcn.116.136580
24. Matthews DR, Hosker JP, Rudenski AS et al (1985) Homeostasismodel assessment: insulin resistance and beta-cell function fromfasting plasma glucose and insulin concentrations in man.Diabetologia 28(7):412–419. https://doi.org/10.1007/BF00280883
25. Väistö J, Haapala EA, Viitasalo A et al (2019) Longitudinal asso-ciations of physical activity and sedentary time with cardiometabol-ic risk factors in children. Scand J Med Sci Sports 29(1):113–123.https://doi.org/10.1111/sms.13315
26. Brage S, BrageN, Franks PWet al (2005) Reliability and validity ofthe combined heart rate and movement sensor Actiheart. Eur J ClinNutr 59(4):561–570. https://doi.org/10.1038/sj.ejcn.1602118
27. Brage S, Brage N, Franks PW et al (2004) Branched equationmodeling of simultaneous accelerometry and heart rate monitoringimproves estimate of directly measured physical activity energyexpenditure. J Appl Physiol 96(1):343–351. https://doi.org/10.1152/japplphysiol.00703.2003
28. Strath SJ, Brage S, Ekelund U (2005) Integration of physiologicaland accelerometer data to improve physical activity assessment.Med Sci Sports Exerc 37(Supplement):S563–S571. https://doi.org/10.1249/01.mss.0000185650.68232.3f
29. Brage S, Westgate K, Franks PW et al (2015) Estimation of free-living energy expenditure by heart rate and movement sensing: adoubly-labelled water study. PLoS One 10(9):1–19. https://doi.org/10.1371/journal.pone.0137206
30. Eloranta A-M, Schwab U, Venäläinen T et al (2016) Dietary qualityindices in relation to cardiometabolic risk among Finnish childrenaged 6–8 years – the PANIC study. Nutr Metab Cardiovasc Dis26(9):833–841. https://doi.org/10.1016/j.numecd.2016.05.005
31. Kyttälä P, Erkkola M, Lehtinen-Jacks S et al (2014) FinnishChildren Healthy Eating Index (FCHEI) and its associations withfamily and child characteristics in pre-school children. PublicHealth Nutr 17(11):2519–2527. https://doi.org/10.1017/S1368980013002772
32. Marshall WA, Tanner JM (1969) Variations in pattern of pubertalchanges in girls. Arch Dis Child 44(235):291–303. https://doi.org/10.1136/adc.44.235.291
33. Marshall WA, Tanner JM (1970) Variations in the pattern of puber-tal changes in boys. Arch Dis Child 45(239):13–23. https://doi.org/10.1136/adc.45.239.13
34. Caprio S, Bronson M, Sherwin RS et al (1996) Co-existence ofsevere insulin resistance and hyperinsulinaemia in pre-adolescentobese children. Diabetologia 39(12):1489–1497. https://doi.org/10.1007/s001250050603
35. Arslanian S, Suprasongsin C (1996) Insulin sensitivity, lipids, andbody composition in childhood: is ‘syndrome X’ present? J ClinEndocrinol Metab 81(3):1058–1062. https://doi.org/10.1210/jcem.81.3.8772576
36. Stumvoll M (2004) Control of glycaemia: from molecules to men.Minkowski Lecture 2003. Diabetologia 47(5):770–781. https://doi.org/10.1007/s00125-004-1400-0
37. Wojtaszewski JFP, Richter EA (2006) Effect of acute exercise andtraining on insulin action and sensitivity: focus on molecular
2280 Diabetologia (2020) 63:2270–2281
mechanisms in muscle. Essays Biochem 42:31–46. https://doi.org/10.1042/bse0420031
38. Holloszy JO (2005) Exercise-induced increase in muscle insulinsensitivity. J Appl Physiol 99(1):338–343. https://doi.org/10.1152/japplphysiol.00123.2005
39. Lillioja S, Young AA, Culter CL et al (1987) Skeletal muscle capil-lary density and fiber type are possible determinants of in vivoinsulin resistance in man. J Clin Invest 80(2):415–424. https://doi.org/10.1172/JCI113088
40. Hawley JA, Hargreaves M, Zierath JR (2006) Signalling mecha-nisms in skeletal muscle: role in substrate selection and muscleadaptation. Essays Biochem 42:1–12. https://doi.org/10.1042/bse0420001
41. Turcotte LP, Richter EA, Kiens B (1992) Increased plasma FFAuptake and oxidation during prolonged exercise in trained vs.untrained humans. Am J Phys 262:E791–E799
42. Bruce CR, ThrushAB,Mertz VA et al (2006) Endurance training inobese humans improves glucose tolerance and mitochondrial fattyacid oxidation and alters muscle lipid content. Am J PhysiolEndocrinol Metab 291(1):E99–E107. https://doi.org/10.1152/ajpendo.00587.2005
43. Petersen AM, Pedersen BK (2005) The anti-inflammatory effect ofexercise. J Appl Physiol 98(4):1154–1162. https://doi.org/10.1152/japplphysiol.00164.2004
44. Salminen A, Vihko V (1983) Endurance training reduces thesusceptibility of mouse skeletal muscle to lipid peroxidationin vitro. Acta Physiol Scand 117(1):109–113. https://doi.org/10.1111/j.1748-1716.1983.tb07184.x
45. Corcoran MP, Lamon-Fava S, Fielding RA (2007) Skeletal musclelipid deposition and insulin resistance: effect of dietary fatty acids
and exercise. Am J Clin Nutr 85(3):662–677. https://doi.org/10.1093/ajcn/85.3.662
46. Sergi D, Naumovski N, Heilbronn LK et al (2019) Mitochondrial(dys)function and insulin resistance: from pathophysiologicalmolecular mechanisms to the impact of diet. Front Physiol 10:532. https://doi.org/10.3389/fphys.2019.00532
47. Metcalf BS, Hosking J, Henley WE et al (2015) Physical activityattenuates the mid-adolescent peak in insulin resistance but by lateadolescence the effect is lost: a longitudinal study with annualmeasures from 9-16 years (EarlyBird 66). Diabetologia 58(12):2699–2708. https://doi.org/10.1007/s00125-015-3714-5
48. Oranta O, Pahkala K, Ruottinen S et al (2013) Infancy-onset dietarycounseling of low-saturated-fat diet improves insulin sensitivity inhealthy adolescents 15-20 years of age: the Special Turku CoronaryRisk Factor Intervention Project (STRIP) study. Diabetes Care36(10):2952–2959. https://doi.org/10.2337/dc13-0361
49. Saari A, Sankilampi U, Hannila ML et al (2011) New Finnishgrowth references for children and adolescents aged 0 to 20 years:length/height-for-age, weight-for-length/height, and body massindex-for-age. Ann Med 43(3):235–248. https://doi.org/10.3109/07853890.2010.515603
50. Showell NN, Fawole O, Segal J et al (2013) A systematic review ofhome-based childhood obesity prevention studies. Pediatrics132(1):E193–E200. https://doi.org/10.1542/peds.2013-0786
Publisher’s note Springer Nature remains neutral with regard to jurisdic-tional claims in published maps and institutional affiliations.
2281Diabetologia (2020) 63:2270–2281